Article

Asymmetry between Galaxy Apparent Magnitudes Shows a Possible Tension between Physical Properties of Galaxies and Their Rotational Velocity

Department of Computer Science, Kansas State University, Manhattan, KS 66506, USA
*
Author to whom correspondence should be addressed.
Symmetry 2023, 15(6), 1190; https://doi.org/10.3390/sym15061190
Submission received: 28 April 2023 / Revised: 24 May 2023 / Accepted: 30 May 2023 / Published: 2 June 2023
(This article belongs to the Special Issue Symmetry in Quantum Fields, Gravitation, and Cosmology)

Abstract

:
Despite over a century of research, the physics of galaxy rotation is not yet fully understood, and there is a clear discrepancy between the observed mass of galaxies and their rotational velocity. Here, we report on another observation of tension between the physical properties of galaxies and their rotational velocity. We compare the apparent magnitude of galaxies and find a statistically significant asymmetry between galaxies that rotate in the same direction relative to the Milky Way and galaxies that rotate in the opposite direction relative to the Milky Way. While asymmetry in the brightness is expected due to the Doppler shift effect, such asymmetry is expected to be subtle. The observations shown here suggest that the magnitude difference is sufficiently large to be detected by Earth-based telescopes. The asymmetry is consistent in both the northern and southern galactic poles. The difference is also consistent across several different instruments such as DECam, SDSS, Pan-STARRS, and HST as well as different annotation methods, which include automatic, manual, or crowdsourcing annotations through “Galaxy Zoo”. The observation can also explain other anomalies such as the H o tension. Analysis of Ia supernovae where the host galaxies rotate in the same direction relative to the Milky Way shows a much smaller tension with the H o value as estimated by the CMB.

1. Introduction

Despite over a century of research, the physics and nature of galaxy rotation is still unknown [1,2,3,4,5,6,7,8]. Early evidence that the galaxy rotation disagrees with the physical properties of galaxies were observed as early as the first half of the 20th century [2,9,10,11,12]. In fact, the absence of Keplerian velocity decrease in the outer parts of galaxies was observed shortly after it became clear that galaxies are rotating objects [13].
For instance, one of the most detailed early observations of the galaxy rotation curve anomaly was made by Jan Hendrik Oort, who analyzed the rotation and mass distribution of NGC 3115 and NGC 4494 [3]. That work led to the conclusion that “the distribution of mass in the system appears to bear almost no relation to that of light” and that “the strongly condensed luminous system appears embedded in a large and more or less homogeneous mass of great density”.
While that early work identified what is now considered the dark matter halo, pre-eminent astronomers of the time argued that the galaxy rotation was driven by Newtonian dynamics corresponding to the distribution of the visible light [14,15], which was based on the theory of that time. According to [13], these opinions played a substantial role in ignoring the observations of the galaxy rotation curve anomaly and led to adopting an incorrect Newtonian model as the physical model of galaxy rotation. Only several decades later, the observations that galaxy rotation does not follow any known physical model was accepted by the “mainstream” astronomy community [13].
After the tension between the galaxy rotation and its physical properties became an accepted observation, theoretical explanations were proposed. That initiated a new era in astronomy research driven by new physical concepts that can close the gaps between theory and observations.
A notable explanation to that observation is that galaxy mass is dominated by dark matter [16] that does not interact with light or other radiation [17,18]. While dark matter is a theory that is currently widely accepted by the scientific community, there is still no full proof of the existence of dark matter [19,20,21,22,23,24,25,26,27,28,29,30]. The presence of the dark matter halo in galaxies was also challenged by the profiles of their rotation curves [31,32]. The initial contention that the distribution of dark matter in the galaxy is constant [3,33] is in certain disagreement with its correlation with light and other galactic disk properties [34]. Research efforts toward understanding the existence and nature of the contention that the mass of galaxies is dominated by dark matter are still being continued.
Another widely discussed paradigm related to the puzzling physics of galaxy rotation is that galaxy rotation does not necessarily follow the known Newtonian dynamics [35,36,37,38,39,40,41,42,43,44]. While dark matter is an important part of the standard model, the Modified Newtonian Dynamics (MOND) was also reported to be in alignment with observations [23,45,46,47]. Modified gravity has also been expanded to explain other phenomena such as the acceleration of the Universe [48]. On the other hand, other studies have shown tension between MOND predictions and data [34,49]. Other explanations have also been proposed, such as [19,50,51,52,53,54,55,56]. For instance, it has been proposed that the galaxy rotation curve can be explained by models that shift from the assumption that the frame of reference of the rotational velocity is inertial [57]. However, despite substantial research in the past century, the physics of galaxy rotation is still a mystery, and currently, there is not a complete proven model that fully explains its puzzling nature.

Doppler Shift Effect on Galaxy Brightness

Due to the Doppler shift effect, it is expected that a galaxy that rotates in the same direction relative to the Milky Way would have different brightness compared to an identical galaxy that rotates in the opposite direction relative to the Milky Way. The brightness of a galaxy is determined by the brightness of its stars and other luminous objects; most of them are in a spin motion around the galaxy center. A star or any other light-emitting object in a galaxy rotating at velocity V r relative to a stationary observer is expected to have a Doppler shift of its bolometric flux. The expected observed flux F of a galaxy can be calculated by Equation (1)
F = F o ( 1 + 4 · V r c ) ,
where F o is the observed flux if the luminous object was stationary relative to the observer, and c is the speed of light [58,59]. Assuming that v c is ∼0.0007 as is approximately the case of the Sun in the Milky Way, a star rotating in the opposite direction relative to the Milky Way and observed on the galactic pole of the Milky Way will have a v c value of 0.0014 relative to an Earth-based observer. The F F 0 of that star as observed from the Solar system is therefore ≃1.0056. The maximal expected difference between the magnitude of a face-on galaxy on the galactic pole that rotates in the same direction as the Milky Way and the magnitude of an identical galaxy spinning in the opposite direction is 2.5 log 10 1.0056 0.006 .
When the galaxy spins, its F o cannot be measured directly, and therefore, F F o cannot be determined observationally for a single galaxy. However, when observing a large population of galaxies in the field centered at the galactic pole, the mean magnitude of the galaxies rotating in the same direction of the Milky Way can be compared to the mean magnitude of galaxies rotating in the opposite direction relative to the Milky Way. When a large number of galaxies is used, a statistically significant difference between the galaxy magnitude is expected. The purpose of this study is to compare the brightness of galaxies spinning in the same direction relative to the Milky Way to the brightness of galaxies that rotate in the opposite direction.
The practice of applying statistical analysis using a large number of galaxies when a measurement is not possible with a single galaxy is a practice used in other tasks such as weak lensing [60,61,62,63,64]. Here, the expected difference of 0.006 magnitude cannot be measured for a single galaxy, and therefore, it is measured as the average magnitude of a population of galaxies. To observe the maximum difference of 0.006 magnitudes, all galaxies need to be pure face-on galaxies, and all of them are expected to be exactly on the galactic pole of the Milky Way. These conditions are not practical, and therefore, the expected observed difference is expected to be of less then 0.006 magnitude.

2. DECam Data

The Dark Energy Camera (DECam) is placed on the Víctor M. Blanco 4 m telescope in Cerro Tololo [65]. Its footprint covers both the northern and southern galactic poles, allowing us to compare them using the same instrument. The DECam data used in this study are the result of nine months of continuous retrieving of the data [66], they include the two 60 × 60 fields centered around the northern and southern galactic poles. Additionally, two fields at 90 from the galactic pole were used as control fields. The images were retrieved from the DESI Legacy Survey [67] server using the Cutout API. The images that were retrieved were images of objects identified as galaxies by the DESI Legacy Survey DR8 pipeline, and they had a magnitude lower than 19.5 in the g, r, or z filter. Each image is a 256 × 256 JPEG image, and the images were scaled by the Petrosian radius so that the entire galaxy fits inside the image. Because the objects are identified by the DESI Legacy Survey pipeline as extended objects, in some cases, multiple objects can be part of the same galaxy. To ensure that each galaxy is represented once in the dataset, objects that have another object in the dataset within 0.01 are excluded from the dataset. The fields and the number of galaxies imaged by DECam in each field are specified in Table 1.
The galaxies were separated by their spin directions using the Ganalyzer algorithm [68] as described in [69,70,71,72,73]. Ganalyzer is a model-based method driven by defined symmetric rules. It does not make use of machine learning or other complex data-driven rules that lead to non-intuitive classification schemes, and therefore, its symmetric nature can be defined. The symmetricity of the algorithm ensures that the algorithm is not systematically biased, which is far more difficult to verify when using algorithms based on complex non-intuitive rules as typical in approaches such as deep neural networks.
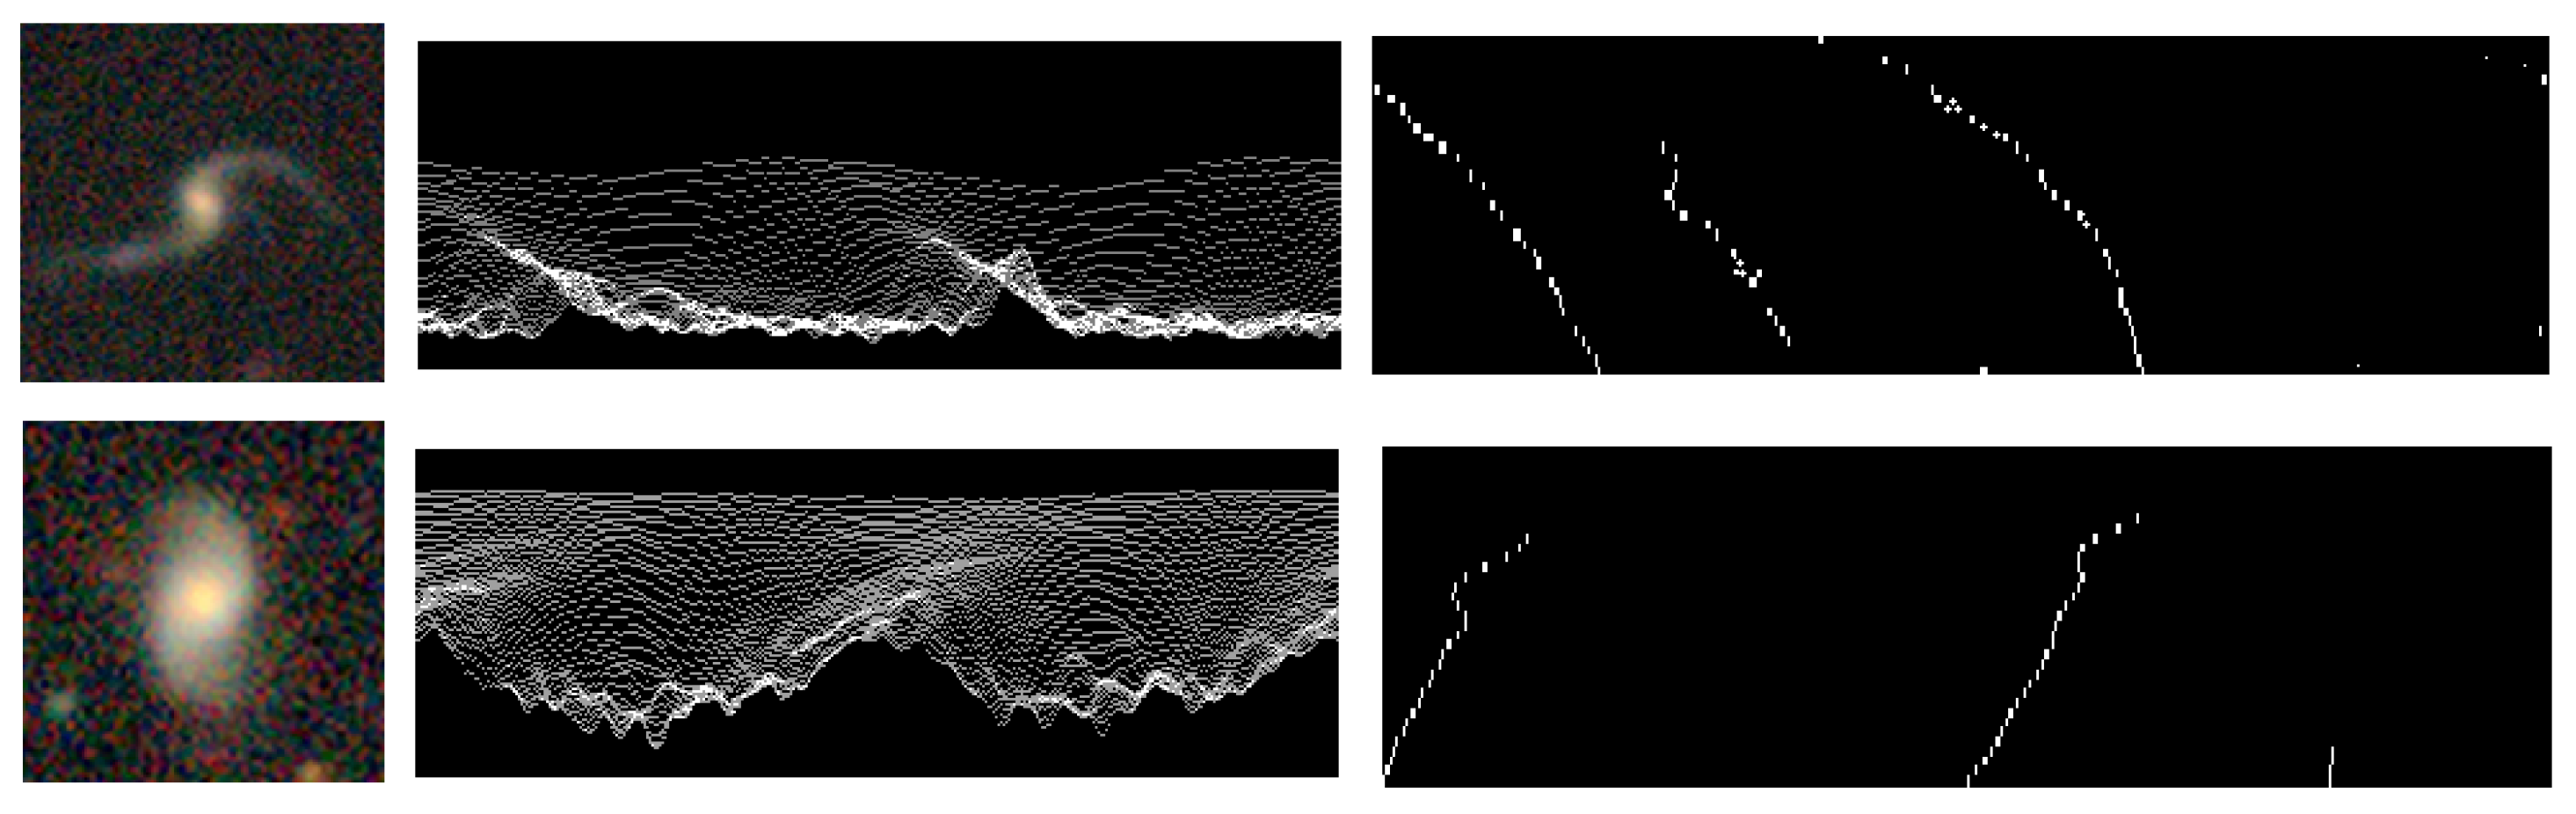
In summary, the algorithm works by first converting each galaxy image into its radial intensity plot. The radial intensity plot of a galaxy image is a 35 × 360 image, in which the value of the pixel at image coordinates ( x , y ) is the median of the values of the 5 × 5 pixels around pixel coordinates ( O x + sin ( θ ) · r , O y cos ( θ ) · r ) in the galaxy image, where r is the radial distance in percentage of the galaxy radius, ( O x , O y ) is the center of the galaxy, and θ is the polar angle measured in degrees from the galaxy center.
In spiral galaxies, the arms are brighter than the background, and therefore, pixels on the galaxy arms are expected to be brighter than the pixels at the same radial distance that are not on the arm. Therefore, the peaks in the radial intensity plot are expected to correspond to pixels on the galaxy arms. The arms can therefore be identified by applying a peak detection algorithm [74] to the different lines in the radial intensity plot. After the peaks are identified, a linear regression is applied to the peaks in neighboring lines. The sign of the slope of the lines formed by the peaks reflects the direction of the curves of the arms and consequently the spin direction of the galaxy [69,70,71,72,73]. Figure 1 shows an example of galaxy images, the radial intensity plots rendered from each galaxy image, and the peaks identified in the radial intensity plots.
Many galaxies are elliptical, and their spin directions cannot be determined. Other galaxies might not be elliptical, but they still do not have an identifiable direction of their spin. Since the spin directions of some galaxies cannot be determined, it is required to remove such galaxies from the analysis. That was completed by selecting only galaxies in which the number of peaks in their radial intensity plot (as shown in Figure 1) that shift in one direction is at least three times larger than the number of peaks that shift toward the opposite direction. In addition, galaxies that had less than 30 peaks in their radial intensity plot were also not used in the analysis, as was completed in [69,70,71,72,73,75]. The full description of the Ganalyzer algorithm is available in [68,69,70,71,72,73,76].
The simple “mechanical” nature of Ganalyzer ensures that it is symmetric, as was also tested empirically in several previous studies. For instance, Figures 5 and 9 in [77] show the results of the annotation after mirroring the galaxy images. A certain downside of using such an analysis is that the annotation is not complete in the sense that all galaxies that have an identifiable spin direction are indeed annotated. 
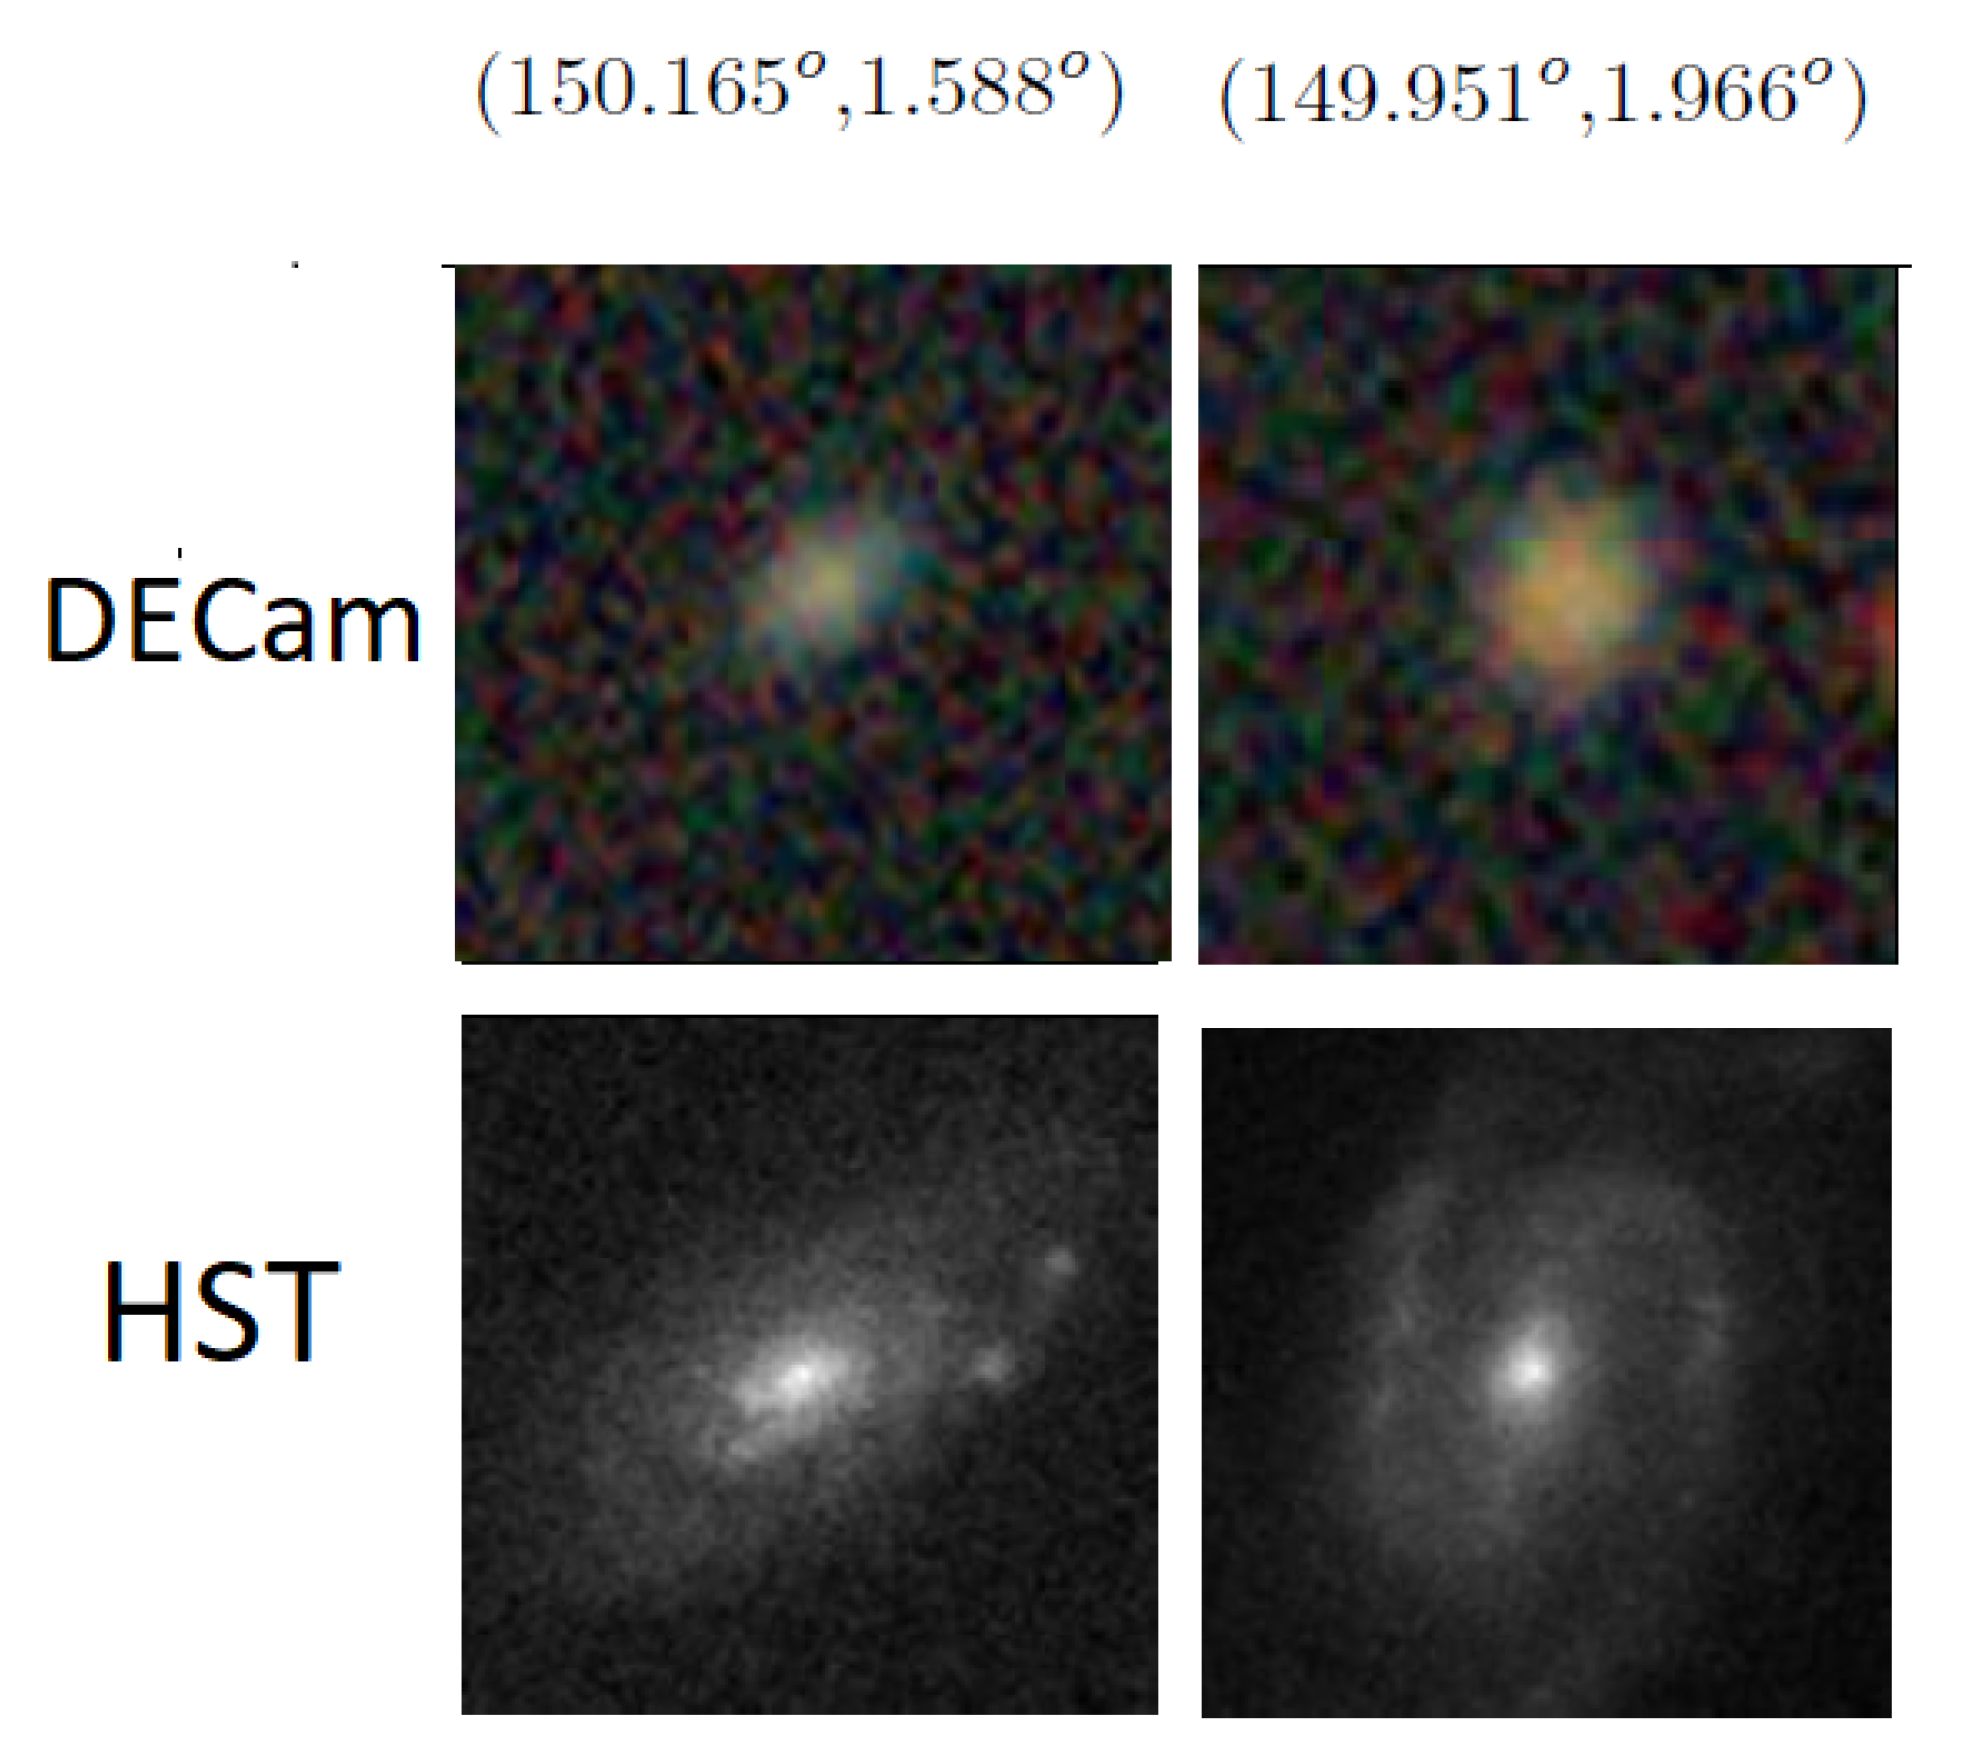
Figure 2 shows an example of galaxies imaged by DECam and the same galaxies imaged by Hubble Space Telescope (HST). As the figure shows, galaxies that have clear spin direction would be annotated as galaxies that do not have an identifiable spin direction, and therefore, they would be rejected from the analysis. Clearly, using HST images will also be subjected to incompleteness, as HST has its own limits on its imaging power. Since no telescope can provide a complete dataset in which the spin directions of all galaxies can be identified, the importance of the algorithm is its symmetric nature.
After separating the galaxy images by their spin directions, 400 random galaxies were observed, and none of these galaxies had a spin direction opposite to the spin direction that was annotated by the algorithm. While that does not ensure that the entire dataset does not have any wrongly annotated galaxies, it can be safely assumed that the dataset was into two subsets such that the first subset has a much higher frequency of galaxies that spin clockwise, and the second subset has a much higher frequency of galaxies that rotate counterclockwise. Another subset includes galaxies in which their spin direction could not be determined, but due to the symmetric nature of the algorithm, that subset is not expected to affect the ratio between the other two subsets. As will be shown in Section 3, the inverse results in the opposite sides of the galactic pole show no consistent bias of the algorithm.

3. Results of DECam Data

Table 2 and Table 3 show the difference between the mean magnitude of galaxies spinning in opposite ways in the fields around the north and the south galactic pole, respectively. To avoid potential erroneous magnitude values that can skew the mean magnitude, all magnitude values lower than 10 or greater than 25 were rejected from the analysis. The bands that were used in this study are the three optical bands of the DESI Legacy Survey, which are the g, r, and z bands. Some galaxies do not have values for the flux in all bands, and that leads to a slightly different number of galaxies used in each band.
The tables show the differences in the mean brightness between galaxies that spin in opposite directions at the field around the galactic poles. The tables show that the differences are statistically significant, as determined by the one-tailed p values of Student’s t-test [78]. While the differences in magnitude are observed in both hemispheres, the direction of the difference is inverse, such that clockwise galaxies are brighter in one hemisphere but dimmer in the opposite hemisphere.
The inverse difference in magnitude agrees with the expected difference caused by relativistic beaming in the two opposite sides of the galactic pole. It also shows that it is not caused by a bias of the annotation algorithm of photometric pipeline, as such bias is expected to be consistent across different fields, and it is not expected to flip between the north and south galactic poles. When dividing the galaxies into two random groups, regardless of their spin direction, the asymmetry becomes statistically insignificant. For instance, the G magnitude becomes 20.08321 ± 0.010 and 20.08318 ± 0.010.
Table 2 and Table 3 also show differences in the number of galaxies that rotate clockwise compared to the number of galaxies that rotate counterclockwise. These differences agree with the magnitude difference, as it is expected that if one type of galaxy is brighter to an Earth-based observer than the other type, more galaxies of that type will be identified. Previous reports on the large-scale differences between the number of galaxies spinning in opposite directions can be found in [66,71,77,79], and their link to brightness differences is discussed in [70,80,81]. The brightness of galaxies also correlates with their shape [82], and the correlation was also observed [83]. In summary, if one type of galaxy is indeed brighter to an Earth-based observer, the observed difference in the number of galaxies spinning in opposite directions can be the result of the difference in magnitude rather than the real population of spiral galaxies in the Universe.
The difference between the mean magnitude of galaxies spinning in opposite directions around the fields of the northern and southern galactic poles was compared to the two control fields that were selected as fields that are 90 away from the galactic pole. Table 4 and Table 5 show the difference in magnitude around these fields. The tables use 47,017 and 41,244 galaxies, respectively. As both tables show, there is no statistically significant magnitude difference between the galaxies in these two fields. That shows that in 90 from the galactic pole, there is no observed difference between the brightness of galaxies spinning in opposite ways, as is the case for galaxies around the galactic pole. That can be viewed as a link between the galactic pole and the differences in the brightness of galaxies spinning in opposite directions.

4. Experiment with SDSS Galaxies

DECam provides images of a large number of galaxies, but until the Dark Energy Spectroscopic Instrument (DESI) sees first light, most of these galaxies do not have spectra. To test a set of galaxies with spectra, we used SDSS data. SDSS is inferior to DECam in its imaging capabilities, but as a mature redshift survey, it collected spectra for a relatively high number of galaxies.
Images of 666,416 galaxies were downloaded by using the SDSS cutout API. The initial file format was 128 × 128 JPEG, and each file was converted to the PNG format. These images were annotated by the SpArcFiRe (Scalable Automated Detection of Spiral Galaxy Arm) algorithm [84,85]. To test for consistency, the galaxy images were also mirrored by using the “flip” command of ImageMagick. That led to two annotated datasets: the first is the annotations of the original images, and the other is the annotations of the mirrored images. SpArcFiRe is an open source software with available source code (https://github.com/waynebhayes/SpArcFiRe, accessed on 1 April 2023). SpArcFiRe is described in detail in [84]. The method works by identifying arm segments, and it can then fit these segments to a logarithmic spiral arc. That allows SpArcFiRe to determine the spin direction of the galaxy. SpArcFiRe is a model-driven method, and it is not based on machine learning that can lead to biases that are very difficult to detect [86].
The disadvantage of SpArcFiRe is that it has a certain error in the annotation, as also noted in Appendix A in [85]. The Ganalyzer algorithm described in Section 2 allows us to adjust the accuracy of the annotation by setting the minimum number of peaks required to make an annotation. If the number of peaks identified in the radial intensity plot is lower than the threshold, the galaxy is not used in the analysis. That leads to the rejection of a large number of galaxies. In the case of DECam, the initial number of galaxies is very high, and therefore, even after rejecting a large number of galaxies, the remaining galaxies make it a sufficiently large dataset to allow statistical analysis. SpArcFiRe, on the other hand, is far slower and has a certain error, but it also rejects a smaller number of galaxies. The use of SpArcFiRe also allows the use of two different analysis methods.
The classification of a single 128 × 128 galaxy image requires ∼30 s when using a single core of a recent Intel Core-i7 processor. To reduce the response time, 100 cores were used to annotate the image data using SpArcFiRe. 
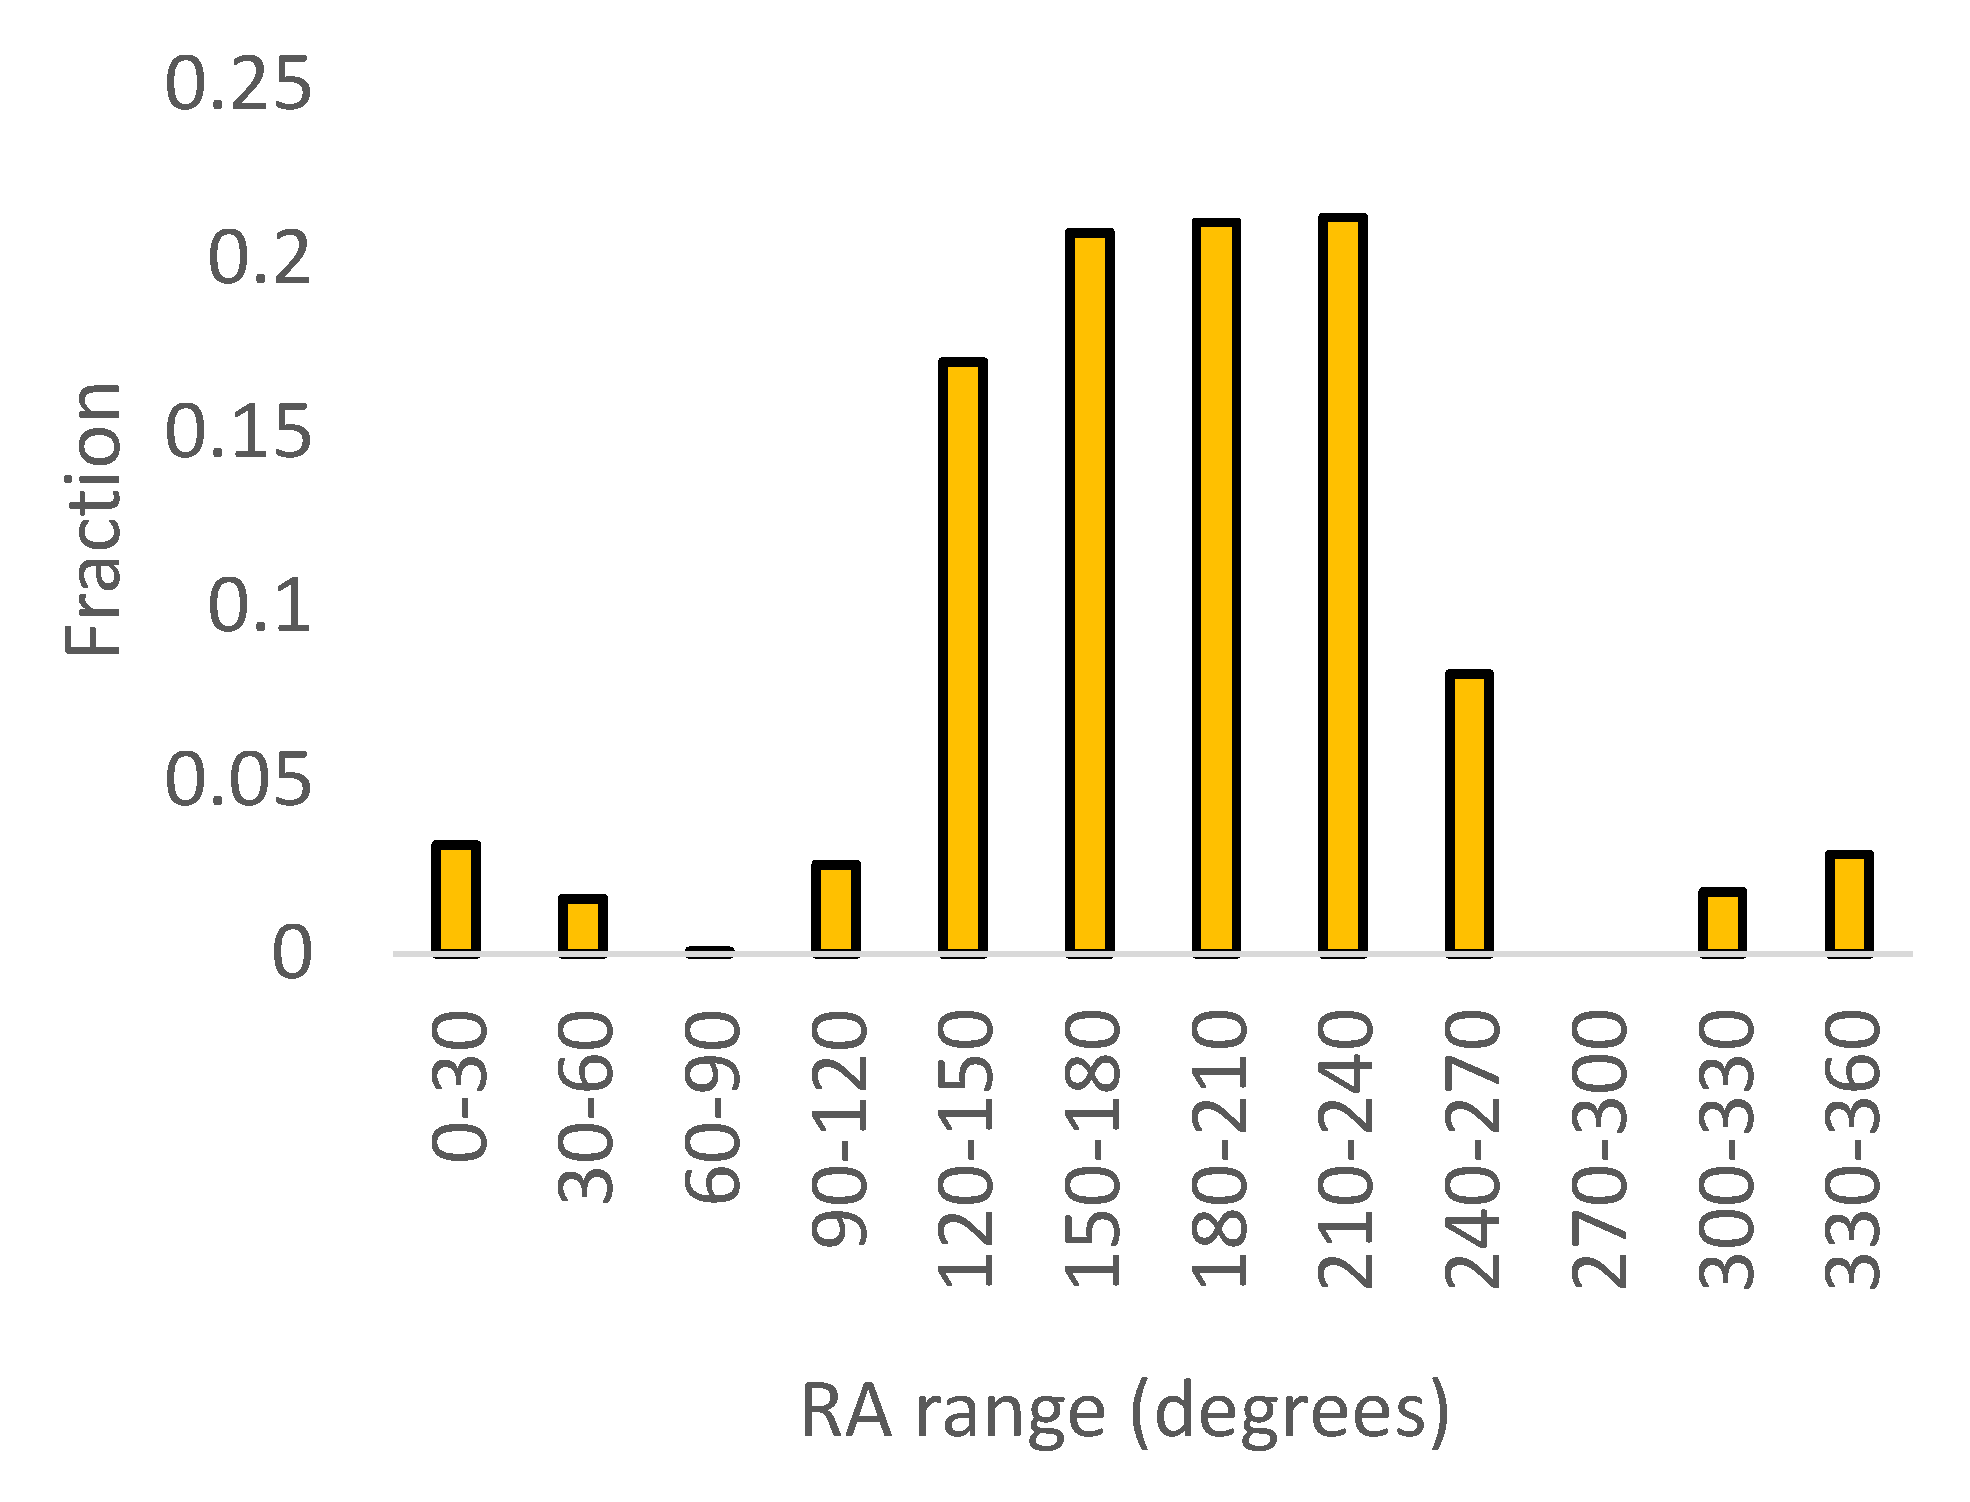
Figure 3 displays the RA distribution of the galaxies. As the figure shows, the galaxy population is not distributed uniformly in the sky.
As the figure shows, the distribution of SDSS galaxies in the sky is not uniform. Fortunately for this specific study, the population of SDSS galaxies is relatively dense around the northern galactic pole. That allows studying the difference in brightness of galaxies that spin with or against the spin direction of the Milky Way.
The annotation provided 271,063 galaxies annotated by their spin directions. SpArcFiRe was then applied again to the mirrored images, providing a set of 271,308 annotated galaxies. The slight difference between the results of the original images and the mirrored images is discussed in [85], and it will also be discussed later in this paper.
A first experiment involved just applying SpArcFiRe without any first step of selecting spiral galaxies. While the annotation of galaxies that are not spiral can add noise, it might be expected that the error in the annotation will be distributed evenly between galaxies that spin clockwise and galaxies that spin counterclockwise. The SpArcFiRe method does not force a certain spin direction for every galaxy, and it can annotate galaxies as not rotating in any identifiable direction. When SpArcFiRe is not able to identify the spin direction of the galaxy, that galaxy is ignored, and it is not used in the analysis. Table 6 shows the magnitude differences in the field of 60 × 60 around the northern galactic pole. The annotation process provided 55,223 galaxies spinning counterclockwise and 55,051 spinning clockwise in that field. Because SpArcFiRe is not fully symmetric, the experiment was repeated after mirroring all galaxy images, and the results are shown in Table 7. The annotation of the mirrored images provided a dataset of 55,874 mirrored galaxies spinning clockwise and 54,488 mirrored galaxies spinning counterclockwise. The coordinates of the galaxies and their SpArcFiRe annotations are at https://people.cs.ksu.edu/~lshamir/data/sparcfire, accessed on 1 April 2023.
As the tables show, despite the certain inaccuracy of SpArcFiRe, the analysis still shows differences in the brightness of galaxies that rotate clockwise and galaxies that rotate counterclockwise in the field centered at the galactic pole. As expected, mirroring the galaxy images showed inverse results.
SpArcFiRe is designed to analyze spiral galaxies [85]. To apply SpArcFiRe to spiral galaxies, a set of spiral galaxies was separated from the other galaxies by using the Ganalyzer method [68]. In addition to its ability to identify the spin direction of galaxies, Ganalyzer can also separate spiral galaxies from elliptical galaxies. As a model-based method, the analysis does not involve any kind of machine learning, deep learning, or any other form of pattern recognition, and therefore, it is not subjected to possible biases in the training data or the learning process [86]. The simple “mechanical” nature of Ganalyzer allows it to be fully symmetric [73,77].
Table 8 shows the number of clockwise and counterclockwise galaxies in the SDSS data after selecting the spiral galaxies, which is limited to the 60 × 60 part of the sky centered at the northern galactic pole. That dataset contained 27,196 galaxies spinning clockwise and 27,671 galaxies spinning counterclockwise. Since the SDSS footprint covers mostly the northern hemisphere, the southern galactic pole is outside of its footprint. According to Table 8, the results show statistically significant differences between the brightness of galaxies that spin in opposite directions.
The SDSS galaxies used in this study have redshift, which allows us to separate them to redshift ranges. Table 9 shows the same analysis but when limiting the galaxies to z < 0.07 . When limiting the redshift to 0.07, the dataset included 8409 clockwise galaxies and 8748 counterclockwise galaxies. The results show a larger difference in magnitude in that redshift range. That, however, is not necessarily of an astronomical meaning, and it could be linked to the better ability of SpArcFiRe to annotate galaxies at lower redshift ranges. As with the other experiments with SDSS galaxies, the results are in agreement with the results of the DECam galaxies shown in Section 3.

4.1. Experiment with SDSS Data Annotated by Ganalyzer

Since SpArcFiRe has a small asymmetry [85], another experiment was performed by applying the Ganalyzer algorithm described in Section 2 to SDSS DR7 galaxies with spectra. As explained in Section 2, Ganalyzer rejects galaxies if it cannot determine their spin direction, resulting in a smaller dataset compared to SpArcFiRe. On the other hand, it provides a symmetric and consistent dataset that is not expected to be biased. The dataset is available at https://people.cs.ksu.edu/~lshamir/data/sdss_phot/, accessed on 1 April 2023. The dataset contains 6103 galaxies among which 3058 galaxies spin clockwise, and 3045 galaxies spin counterclockwise.
Table 10 shows the g, r, and z exponential magnitudes for galaxies that spin clockwise and counterclockwise in the 60 × 60 degree field centered at the northern galactic pole. As in the other experiments, the table shows statistically significant magnitude differences between the average brightness of the galaxies.

4.2. Analysis with Crowdsourcing Data from Galaxy Zoo 1

One of the previous attempts to annotate galaxies by their spin direction was completed by crowdsourcing through the Galaxy Zoo 1 project [87]. According to Galaxy Zoo 1, anonymous volunteers used a web-based user interface to manually annotate galaxies by their shape. Among other features, the users were asked to annotate the spin direction of the galaxies. While not all annotations are expected to be correct, the majority of the votes is expected to provide a certain indication regarding the spin direction.
The Galaxy Zoo annotations can be used to perform an experiment similar to the experiments described above but with galaxies annotated manually by a large number of volunteers. Fortunately, the 60 × 60 part of the sky centered around the northern galactic pole is fairly populated by galaxies that were annotated through Galaxy Zoo 1, and the majority of Galaxy Zoo annotated galaxies are concentrated around that part of the sky. That allows us to obtain the profile of brightness differences between galaxies that were annotated by Galaxy Zoo to spin clockwise compared to the brightness of Galaxy Zoo galaxies that were annotated as spinning counterclockwise.
The Galaxy Zoo 1 annotations were taken from the “zooVotes” table of SDSS DR8. The galaxies include only galaxies of which 60% or more of the voters agreed on their spiral nature and spin direction: that is, the field “p_cw” was greater or equal to 0.6 for galaxies that spin clockwise, and the field “p_acw” was greater or equal to 0.6 for galaxies that spin counterclockwise. As before, missing values or flag values were removed. That provided a dataset of 11,150 galaxies spinning clockwise and 11,907 galaxies spinning counterclockwise. All galaxies are inside the 60 × 60 region centered at the northern galactic pole. Table 11 shows the brightness differences in the g, r, and z bands for the Galaxy Zoo galaxies. As the table shows, the differences between the brightness of galaxies spinning in opposite directions in the northern galactic pole are noticeable also in the galaxies annotated by Galaxy Zoo. The corresponding part of the sky in the southern galactic pole has merely a total of 2005 annotated galaxies, and therefore, analysis of the southern galactic pole is not possible in the same manner as conducted with the DECam data.
The Galaxy Zoo 1 defines a “superclean” annotation as an annotation for which 95% of the annotators provided the same annotation. Table 12 shows the differences in brightness of galaxies in the 60 × 60 region around the northern galactic pole such that all annotations of the galaxies meet the “superclean” criterion. The requirement for higher agreement of the annotators can lead to cleaner annotations, but that comes at the expense of the size of the dataset. When using only the galaxies on which 95% of the annotators agree, the total number of annotated galaxies is merely 4065. The number of clockwise galaxies is 1875, and the number of galaxies annotated as spinning counterclockwise is 2190. The results also show that galaxies spinning counterclockwise around the north galactic pole are brighter. The results are not statistically significant, which can be attributed to the smaller number of galaxies that satisfy the higher annotation agreement threshold. However, the difference observed in the “superclean” galaxies also does not conflict with the difference observed with the larger datasets.
The Galaxy Zoo annotations are known to be subjected to certain biases that are often difficult to fully profile [85]. The brightness differences observed with galaxies annotated by Galaxy Zoo can therefore be the result of some unknown bias where the volunteers tend to annotate brighter galaxies as galaxies rotating counterclockwise. These biases can be difficult to quantify and fully profile, and therefore, the results when using the Galaxy Zoo annotations might not be sufficient to provide strong evidence of brightness differences. The agreement between the results of Galaxy Zoo and the results of DECam and SDSS can also be considered a coincidence. However, the results of Galaxy Zoo also do not conflict with the results shown with the automatically annotated galaxies, and in fact, they are in good agreement with the other experiments. Whether the agreement is the result of an astronomical reason or a certain unidentified human bias is still a matter that is difficult to fully determine due to the complex nature of the possible human biases of the crowdsourcing-based annotations.

5. Analysis with Pan-STARRS Data

A sky survey that covers more of the southern sky than SDSS is Pan-STARRS. Like SDSS, Pan-STARRS covers mostly the northern sky, but its footprint covers more of the southern hemisphere compared to SDSS. Using a dataset of Pan-STARRS DR1 galaxies used in a previous study [70] provided the magnitude difference of 3587 galaxies in the 60 × 60 around the southern galactic pole. The galaxies can be accessed at https://people.cs.ksu.edu/~lshamir/data/assym3/, accessed on 1 April 2023. The results show that in the part of the sky around the southern galactic pole, galaxies that spin clockwise are brighter than galaxies that spin counterclockwise. That difference is in agreement with the results of DECam for the southern galactic pole. The results are shown in Table 13.

6. HST Data

As ground-based instruments, DECam, SDSS, and Pan-STARRS are subjected to the effect of the atmosphere. There is no known atmospheric effect that can affect galaxies differently based on their spin direction, and therefore, the atmosphere is not expected to lead to such a difference. To test empirically whether the difference is consistent also when imaging the galaxies without the effect of the atmosphere, we used galaxies imaged by the Hubble Space Telescope (HST). These results were shown initially in [80].
The galaxies used in this experiment were imaged by the Cosmic Evolution Survey (COSMOS) of HST. As the largest HST field, COSMOS [88,89,90] covers ∼2 square degrees centered at ( α = 150.119 , δ = 2.2058 ). The initial list of objects included 114,630 COSMOS objects that are at least 5 σ brighter than their background. Each galaxy image was separated from the F814W image by using the Montage [91] tool. The images were annotated by the Ganalyzer algorithm [68] and then inspected manually. That led to a dataset of 2607 galaxies that rotate clockwise and 2515 galaxies that rotate counterclockwise. Full details of the annotation process are provided in [80], and the data are available at http://people.cs.ksu.edu/~lshamir/data/assym_COSMOS/, accessed on 1 April 2023.
Table 14 shows the brightness in the g, r, and z filters of galaxies spinning in opposite directions. The magnitudes are the Subaru AB magnitudes [90]. The comparison provides certain evidence that in the COSMOS field, galaxies that spin counterclockwise are brighter than galaxies that spin clockwise. The COSMOS field is not aligned with neither the northern nor the southern galactic pole, but it is far closer to the northern galactic pole. According to the other experiments described earlier in this paper, in the northern galactic pole, galaxies that spin counterclockwise are expected to be brighter. That observation is aligned with the results observed with the HST galaxies, which are reported in [80]. The difference in the z band is not necessarily statistically significant, but the findings are aligned with the results shown by the other telescopes, and they definitely do not conflict with DECam, SDSS and Pan-STARRS.

7. Non-Astronomical Reasons That Can Lead to Differences in Brightness

The differences in brightness between galaxies spinning in opposite directions cannot be determined by direct observation, but it can be determined by analysis of a large number of galaxies. The large-scale analysis of a high number of galaxies to determine properties that are difficult to obtain with direct measurements is not a new practice, and it is used in tasks such as weak gravitational lensing [60,61,62,63,92]. The purpose of this section is to review the analysis and possible errors that can lead to the observation.

7.1. Incorrectly Annotated Galaxies

One of the key aspects of the analysis shown here is the annotation of the galaxies by their spin direction. Two different algorithms were used in this study as well as manually annotated galaxies using crowdsourcing; all show similar results. For the computer-based annotations, the experiments were repeated after mirroring the galaxy images, leading to inverse results. In addition, the brightness difference is inverse in the northern galactic pole compared to the southern galactic pole. A bias in the algorithm is expected to be consistent in both ends of the galactic pole rather than flip.
In addition, if an algorithm that annotates the galaxies by their spin directions annotates some of the galaxies with wrong spin direction, the real brightness difference Δ M at a certain part of the sky is determined by Equation (2)
Δ M = ( ( 1 e ) M c w ¯ + e E c w ¯ ) ( ( 1 e ) M c c w ¯ + e E c c w ¯ ) ,
where M c w ¯ is the mean magnitude of galaxies spinning clockwise that are also annotated correctly by the classifier as galaxies spinning clockwise, M c c w ¯ is the mean magnitude of galaxies spinning counterclockwise that are also annotated correctly as spinning counterclockwise, and E c w ¯ is the mean magnitude of galaxies spinning counterclockwise but annotated incorrectly as spinning clockwise. E c c w ¯ is the mean magnitude of galaxies spinning clockwise but were annotated incorrectly as spinning counterclockwise, and e is the error rate of the annotation algorithm. The equation can be re-written as
Δ M = M c w ¯ M c c w ¯ + e ( E c w ¯ E c c w ¯ + M c c w ¯ M c w ¯ ) .
Let ϑ = M c w ¯ M c c w ¯ and φ = E c w ¯ E c c w ¯ . Δ M can be now expressed as Δ M = ϑ + e ( ϑ φ ) . If the magnitude between clockwise and counterclockwise galaxies is different, it should be consistent for all galaxies, including galaxies that are annotated incorrectly. In that case, φ = ϑ , and Δ M = ϑ + e ( 2 ϑ ) . Because e 0 , the real magnitude difference Δ M can only be larger than ϑ , and it can only become larger when the error of the annotation algorithm e grows. That shows that if there is a certain error in the annotation algorithm, the real magnitude difference will be larger than the observed magnitude difference.

7.2. Cosmic Variance

Galaxies as observed from Earth are not distributed in the sky in a fully uniform manner, leading to subtle fluctuations in galaxy density known as “cosmic variance” [93,94]. These small fluctuations in galaxy population density can affect measurements at different parts of the sky and different directions of observation [95,96,97].
The probe used in this study is the brightness difference between galaxies imaged in the same part of the sky, by the same telescope, in the same exposure, and the same analysis methods. That is, anything that might affect the brightness of galaxies that spin with the Milky Way is also expected to affect galaxies spinning in the opposite direction. There is no attempt to compare magnitudes measured in two different parts of the sky, two different instruments, or even two different exposures. In all experiments, the mean brightness of galaxies spinning in one direction is compared to the mean brightness of galaxies spinning in the opposite way such that all galaxies are in the exact same part of the sky. Any cosmic variance that might affect galaxies spinning with the Milky Way is expected to affect the mean magnitude of galaxies spinning in the opposite direction.

7.3. Bias in the Hardware or Photometric Pipelines of Digital Sky Surveys

Digital sky surveys are some of the more complex research instruments of our time. That complexity makes it very difficult to inspect every single part of these systems and ensure that no bias exists. At the same time, it is also difficult to propose a certain possible flaw that can lead to differences in the brightness of galaxies that spin in the same direction as the Milky Way and galaxies that spin in the opposite direction. Moreover, the difference in brightness flips between the northern and southern galactic poles, making it more difficult to propose an explanation based on a possible hardware or software flaw.
In this study, several different digital sky surveys were used, and the results are consistent across the different telescopes. While it is challenging to propose a specific flaw in a digital sky survey that exhibits itself in such form in a single telescope, it is more difficult to think of such a flaw in several unrelated sky surveys.

7.4. Atmospheric Effect

Atmospheric effect might change the brightness of galaxies as observed from Earth, and it can lead to differences in brightness observed in different parts of the sky. As also discussed in Section 7.2, the comparison between the magnitudes is made within the same part of the sky, and all galaxies were taken from the exact same frames and exposures. Therefore, all atmospheric effects that can change the magnitude of galaxies that spin in one direction are expected to change the magnitude of galaxies that spin in the opposite direction.
To completely eliminate the atmospheric effect, an experiment was conducted with data from the Hubble Space Telescope. That experiment is described in Section 6. The results of that experiment are consistent with the results from the ground-based telescopes, providing another indication that the difference in brightness is not the result of the effect of the Earth’s atmosphere.

7.5. Spiral Galaxies with Leading Arms

Although the vast majority of spiral galaxies have trailing arms, in some less common cases, a spiral galaxy can have leading arms. For instance, a notable example of a galaxy with leading spirals arms is NGC 4622 [98,99,100]. Assuming that the spin direction of a galaxy is driven by the perspective of the observer, the frequency of galaxies with leading arms among galaxies that spin in the same direction as the Milky Way is similar to the frequency of galaxies spinning in the opposite direction. In that case, galaxies with leading arms can be considered as galaxies that were annotated incorrectly, and they are subjected to the same analysis shown in Section 7.1.

8. Possible Link to H o Tension

The purpose of this section is to show a link between the observation reported in the previous sections and the H o tension as well as provide a possible solution to the tension that does not require changing the standardcosmological model [101]. The Hubble–Lemaitre constant ( H o ) tension [102,103,104,105,106,107,108,109] is one of the most puzzling cosmological observations, and currently, it has no proven explanation. The observation is difficult to explain by modification of gravity [110], and it challenges the validity of the standard cosmological model [111,112]. In summary, the Hubble–Lemaitre constant H o determined by using Ia supernovae or Cepheids to measure the distance of galaxies is different from the constant measured with other probes such as the CMB radiation. Since the different probes measure the same Universe, one of the explanations of the tension is that one or more of these probes have slight inaccuracies that lead to the different H o values. For instance, it has been suggested that the Lorentz Relativistic Mass can affect the measurements using Ia supernovae [113]. The effect of dust on Ia supernovae distant measurement has also been proposed [114].
The Hubble–Lemaitre constant can be determined by using probes such as Cepheids or Ia supernovae to measure distances at cosmological scales, and these distances are compared to the velocity of galaxies by using their redshift. Ia supernovae and Cepheids have expected absolute magnitudes, and therefore, their apparent magnitude as observed from Earth can be used to determine the distance of their host galaxy from Earth.
Supernovae are explosions of stars, and therefore, their rotational velocity is inherited from the star they were created from. Cepheids are also stars, and therefore, they also have the rotational velocities of their host galaxies. The magnitude of the Ia supernova is measured from Earth, which has the rotational velocity of the Milky Way galaxy at around 220 km·s−1. If the rotation of the galaxies that host Ia supernovae compared to the rotation of the Milky Way can affect the apparent magnitude of the supernova, that can lead to different distance metrics that depend on the rotation of the host galaxy of the Ia supernova compared to the rotation of the Milky Way. That is, because not all supernovae used in the measurements are located around the galactic pole and spin in the same direction as the Milky Way, their apparent magnitude might seem slightly different to an Earth-based observer, leading to a slight change in their estimated distance and consequently to the measured Hubble–Lemaitre constant. Because the rotational velocity of a galaxy correlates with the galaxy type, the link between rotational velocity and H o can be related to previous reports on the correlation between H o and the type of the Ia supernova host galaxy [115]. Other studies also suggested a link between the Ia supernova and the properties of its host galaxies [116,117].
An experiment that would test that assumption can be made by computing the Hubble–Lemaitre constant by using only host galaxies that rotate in the same direction as the Milky Way. Such galaxies can be from both the northern and southern hemispheres. If the measurement of the Hubble–Lemaitre constant when using host galaxies that rotate with the Milky Way provides a different result than when using all galaxies, that can provide an indication that the spin direction affects the determined Hubble–Lemaitre constant. If the result is also close to the Hubble–Lemaitre constant as determined by the CMB radiation, that can also explain the H o tension, and it might also explain the other observation made with Ia supernovae as distance candles.
To perform a simple test, we used the code and data provided by [115] for determining the H o constant. Ref. [115] uses a set of 140 Ia supernovae and two calibration sets. The SH0ES calibration uses 19 Cepheids. The full description of the data and calibration is provided in [115].
In addition to using the 140 supernovae as in [115], we also separated a subset of the 140 supernovae into supernovae within 60 from the northern galactic pole whose host galaxies spin clockwise and those within 60 from the southern galactic pole whose host galaxies spin counterclockwise. That provided a set of 34 supernovae that rotate at the same direction as the Milky Way and 48 supernovae that rotate in the opposite direction. As in [115], galaxies with redshift lower than 0.02 were removed, reducing the sets to 22 and 36 supernovae, respectively. Similarly, the host galaxies of the calibration set were also separated into host galaxies that rotate with and against the rotation direction of the Milky Way, providing nine galaxies of each. The analysis was conducted using the code in https://github.com/nanditakhetan/SBF_SNeIa_H0, accessed on 1 April 2023. Table 15 and Figure 4 show the H o computed when using the full set of galaxies, just galaxies that rotate in the same direction relative to the Milky Way, and just galaxies spinning in the opposite direction relative to the Milky Way.
As the table shows, the H o computed with the entire set showed a H o value of 73.758 ± 1.943. That value is in tension with the H o determined by the CMB. However, when using just host galaxies that rotate in the same direction as the Milky Way, the H o is reduced to 69.049 ± 3.42. That does not fully solve the tension with the H o determined by the CMB of 67.7 km/s Mpc−1, but it reduces the tension. However, even if the Doppler shift is indeed related to the H o tension, the H o is still expected to be higher, since the host galaxies are not exactly on the galactic pole, do not rotate in the exact same rotational velocity as the Milky Way, and their inclinations vary. When using just host galaxies that rotate in the opposite direction relative to the Milky Way, the H o tension increases to 74.182 ± 3.2, providing another piece of evidence of a link between the H o tension and the rotational velocity of the host galaxies.
When using just Ia supernovae in galaxies that rotate in the same direction relative to the Milky Way, the tension with the H o determined by the CMB is reduced, and it is within the statistical error. On the other hand, the lower number of data points increases the error, and due to the larger error of the original data, the difference is still within the 3% error range. Therefore, these simple experiments may not be considered as a proof, and further analysis with more data will be needed. However, the results agree with the observation that rotational velocity can affect the apparent brightness of objects. A link between the rotation directions of the host galaxies of Ia supernovae relative to the Milky Way can also provide a possible explanation to the anisotropy observed in the acceleration of the Universe, which is observed through Ia supernovae [118].

9. Conclusions

The results show that in the fields around the galactic pole, galaxies that spin clockwise have a different brightness than galaxies that spin counterclockwise. The inverse difference in the opposite ends of the galactic pole shows that the observations at both ends are in agreement with the spin direction of the Milky Way. Clearly, a galaxy that seems to spin clockwise in the northern galactic pole spins in the same direction as galaxies that seem to spin counterclockwise in the southern galactic pole and vice versa. The control fields that are 90 from the galactic pole show no significant difference between galaxies spinning in opposite directions, which provides a certain indication of a correlation between the galactic pole and the magnitude difference. The contention that relativistic beaming can lead to a certain statistical asymmetry when observing a population of galaxies is not unexpected [119].
Future and more powerful telescopes such as the Vera C. Rubin Observatory will allow better profiling of such differences. In case the maximum magnitude difference is greater than the maximum expected difference under optimal conditions, that observation can be related to modified Newtonian dynamics or to relativistic beaming of gravity as an explanation to the galaxy rotation curve anomaly [55]. It can also be related to the observation of disagreement between the observed and expected velocity of halo spin [120].
The observed difference between the magnitude of galaxies that spin in opposite directions had also been observed in previous studies [69,70,72,80], showing differences between galaxies that spin in opposite directions in the same field. These studies were based on far smaller datasets collected by sky surveys that did not cover the fields around both galactic poles. The data collected by DECam and available through the DESI Legacy Survey allow a direct comparison of the differences in brightness between the two ends of the galactic pole. These differences can be related to the effect of relativistic beaming, but further research will be required with more powerful instruments to quantify and profile the magnitude difference.

Large-Scale Structure Explanation

Another possible explanation to the observation can be an anomaly in the large-scale structure of the Universe. According to that explanation, the axis observed around the galactic pole as shown here is not necessarily the result of differences between the brightness of galaxies as observed from Earth but rather a large-scale alignment in the spin directions of galaxies in the Universe. That explanation requires modification to the standard cosmological model, which relies on the assumption that the Universe is isotropic and homogeneous. That assumption is part of the cosmological principle.
While the cosmological principle is a common working assumption for most cosmological models, it has not been fully proven. In fact, multiple probes have shown evidence of violation of the cosmological principle [121]. Perhaps the most notable probe is the cosmic microwave background radiation, which also exhibits a cosmological-scale axis [122,123,124,125,126,127,128]. It has been suggested that the axis exhibited by the cosmic microwave background radiation agrees with other axes formed by probes such as dark energy and dark flow [123]. Other anomalies related to the cosmic microwave background radiation are the quandrupole–octopole alignment [129,130,131,132,133], the asymmetry between hemispheres [124,134,135], and the point-parity asymmetry [136,137]. Another related observation is the CMB cold spot [138,139,140,141,142]. It has also been suggested that the isotropy observed with the CMB radiation is not statistically significant [143].
In addition to the CMB, probes that show anisotropy include radio sources [144,145,146,147,148], LX-T scaling [149], short gamma ray bursts [150], acceleration rates [151,152,153], Ia supernova [118,154], distribution of galaxy morphology types [155], dark energy [151,156,157,158], fine structure constant [159], galaxy motion [160], H o [161], polarization of quasars [162,163,164,165,166], and cosmic rays [167,168,169,170]. It has also been shown that the large-scale distribution of galaxies in the Universe is not random [171], and it could have a preferred direction [66,71,73,77,172,173,174,175,176,177]. These probes might not agree with the standard models [151,153,161,178,179,180,181,182,183].
The contention of a cosmological-scale axis agrees with cosmological theories that shift from the standard models. For instance, black hole cosmology [184,185,186,187,188,189,190,191,192,193,194,195] is a cosmological theory aligned with the contention of the existence of a large-scale axis. Black holes are born from the collapse of a star, and since stars spin, black holes also spin [196,197,198,199,200,201]. Supermassive black holes are also expected to spin [202], and observations of supermassive black holes showed that supermassive black holes spin [203]. An early example of such observation is the spin of the supermassive black hole of NGC 1365 [204]. Since black holes spin, if the Universe is the interior of a black hole, it is expected to spin around a major axis inherited from the black hole. That observation is aligned with the agreement between the Hubble radius of the Universe and the Schwarzschild radius of a black hole such that the mass of the black hole is the mass of the Universe [189]. Black hole cosmology is a theory under the category of multiverse [205,206,207,208], which is one of the first cosmological paradigms [209,210].
In addition to black hole cosmology, other models that rely on the presence of a Hubble-scale axis have been proposed. Some of these theories are based on alternative geometrical models such as ellipsoidal universe [211,212,213,214,215], flat space cosmology [216,217,218,219], geometric inflation [220,221,222,223], supersymmetric flows [224], and rotating Universe [225,226,227,228,229,230,231,232,233]. Other theories are double inflation [234], f( R , L m ) gravity [235], contraction prior to inflation [236], primordial anisotropic vacuum pressure [237], moving dark energy [238], multiple vacua [239], and spinor-driven inflation [240]. While these theories can be considered alternative to the standard cosmological model, they provide explanations to the presence of a Hubble-scale axis. Since the standard model has not been fully proven, alternative theories to the standard cosmology should also be considered.

10. Discussion

Despite decades of intensive research efforts, the physical nature of galaxy rotation is still an unsolved question. The common possible explanations are that the distribution and quantity of the mass of galaxies does not fit its physical properties (dark matter) or that the laws of physics are different when applied to galaxies. This paper proposes the contention that the rotational velocity of the galaxy does not fit its physical properties, and it corresponds to a much higher rotational velocity. The explanation is driven by the observation that galaxies that spin in the same direction as the Milky Way have different brightness compared to galaxies that spin in the opposite direction. While the observation does not explain directly the galaxy rotation curve anomaly, it shows another tension between the expected and observed physical properties of galaxy rotation.
While such a difference in magnitude can be explained by Doppler shift, the difference is expected to be small. The observed difference is far greater than the expected difference, and it is observable with Earth-based telescopes. A possible explanation is that the physics of galaxy rotation corresponds to a far higher rotational velocity than the observed velocity. While that explanation is physically provocative, the physics of galaxy rotation is still unexplained, and it does not follow known or proven physical theories. For instance, the absence of a Keplerian velocity decrease in the galaxy rotation curve was ignored for several decades as well because it did not agree with the physical theories [13].
The tension between galaxy rotational velocity and its physical properties is one of many other possible explanations for the observation of different brightness for galaxies spinning in opposite directions. Another possible explanation discussed here is a possible anomaly in the large-scale structure. In that case, the difference in brightness is not driven by the perspective of an Earth-based observer, but it reflects the real structure of the Universe. Other explanations not considered in this paper can also be possible and might be related to astronomical reasons as well as certain unknown instrumentation or atmospheric effects.
The link between the rotational velocity of a galaxy and the apparent brightness of its objects can also be related to measurements made with Ia supernovae. Measurements with Ia supernovae have provided unexpected results, and they have been shown to be in disagreement with other measurements. For instance, the H o tension suggests that the CMB or Ia supernovae do not match, and since both are applied to the same Universe, it can be assumed that one of these measurements is inaccurate. If the brightness of an Ia supernovae depends on the rotational velocity of the galaxy that hosts it, and the galaxy may not necessarily spin in the same direction as the Milky Way, that can lead to slight changes in the apparent magnitude of the supernovae. Because the distance of an Ia supernovae is determined from its brightness, unexpected changes in the apparent magnitude can lead to a slightly different distance and consequently to a slightly different H o . The initial observation of the accelerated expansion of the Universe was also made with Ia supernovae, and such changes in brightness can also have a certain impact on these results.

Author Contributions

L.S. desgined the experiments, D.M. and L.S. performed the experiments. L.S. prepared the manuscript. All authors have read and agreed to the published version of the manuscript.

Funding

The study was supported in part by NSF grants AST-1903823 and IIS-1546079.

Data Availability Statement

URLs to access the data are provided in the paper where these datasets are discussed. The list of annotated SDSS galaxies and their spin direction annotations used in this study is available at https://people.cs.ksu.edu/~lshamir/data/sparcfire/, accessed on 1 April 2023. Pan-STARRS data used in Section 5 is available at https://people.cs.ksu.edu/~lshamir/data/assym3/, accessed on 1 April 2023. Data from Hubble Space Telescope used in Section 6 is available at http://people.cs.ksu.edu/~lshamir/data/assym_COSMOS/, accessed on 1 April 2023. Data used in Section 4.1 are available at https://people.cs.ksu.edu/~lshamir/data/sdss_phot/, accessed on 1 April 2023. Galaxy Zoo data is taken directly from the “zooVotes” table of SDSS DR8.

Conflicts of Interest

The authors declare no conflict of interest.

References

  1. Opik, E. An estimate of the distance of the Andromeda Nebula. Astrophys. J. 1922, 55, 406–410. [Google Scholar] [CrossRef]
  2. Babcock, H.W. The rotation of the Andromeda Nebula. Lick Obs. Bull. 1939, 19, 41–51. [Google Scholar] [CrossRef]
  3. Oort, J.H. Some Problems Concerning the Structure and Dynamics of the Galactic System and the Elliptical Nebulae NGC 3115 and 4494. Astrophys. J. 1940, 91, 273. [Google Scholar] [CrossRef] [Green Version]
  4. Rubin, V.C.; Ford, W.K., Jr. Rotation of the Andromeda nebula from a spectroscopic survey of emission regions. Astrophys. J. 1970, 159, 379. [Google Scholar] [CrossRef]
  5. Rubin, V.C.; Ford, W.K., Jr.; Thonnard, N. Extended rotation curves of high-luminosity spiral galaxies. IV-Systematic dynamical properties, SA through SC. Astrophys. J. 1978, 225, L107–L111. [Google Scholar] [CrossRef]
  6. Rubin, V.C.; Ford, W.K., Jr.; Thonnard, N. Rotational properties of 21 SC galaxies with a large range of luminosities and radii, from NGC 4605/R = 4 kpc/to UGC 2885/R = 122 kpc. Astrophys. J. 1980, 238, 471–487. [Google Scholar] [CrossRef]
  7. Rubin, V.C.; Burstein, D.; Ford, W.K., Jr.; Thonnard, N. Rotation velocities of 16 Sa galaxies and a comparison of Sa, Sb, and Sc rotation properties. Astrophys. J. 1985, 289, 81–98. [Google Scholar] [CrossRef]
  8. Sofue, Y.; Rubin, V. Rotation curves of spiral galaxies. Annu. Rev. Astron. Astrophys. 2001, 39, 137–174. [Google Scholar] [CrossRef] [Green Version]
  9. Slipher, V.M. The detection of nebular rotation. Lowell Obs. Bull. 1914, 2, 66. [Google Scholar]
  10. Wolf, M. Vierteljahresschr Astron. Ges 1914, 49, 162. [Google Scholar]
  11. Pease, F. The rotation and radial velocity of the central part of the Andromeda nebula. Proc. Natl. Acad. Sci. USA 1918, 4, 21. [Google Scholar] [CrossRef] [Green Version]
  12. Mayall, N. In the Structure of the Galaxy; The University of Michigan Press: Ann Arbor, MI, USA, 1951. [Google Scholar]
  13. Rubin, V.C. One hundred years of rotating galaxies. Publ. Astron. Soc. Pac. 2000, 112, 747. [Google Scholar] [CrossRef]
  14. De Vaucouleurs, G. General physical properties of external galaxies. In Astrophysik IV: Sternsysteme/Astrophysics IV: Stellar Systems; Springer: New York, NY, USA, 1959; pp. 311–372. [Google Scholar]
  15. Schwarzschild, M. Mass distribution and mass-luminosity ratio in galaxies. Astron. J. 1954, 59, 273. [Google Scholar] [CrossRef]
  16. Zwicky, F. On the Masses of Nebulae and of Clusters of Nebulae. Astrophys. J. 1937, 86, 217. [Google Scholar] [CrossRef]
  17. Rubin, V.C. The rotation of spiral galaxies. Science 1983, 220, 1339–1344. [Google Scholar] [CrossRef] [PubMed]
  18. Bertone, G.; Hooper, D. History of dark matter. Rev. Mod. Phys. 2018, 90, 045002. [Google Scholar] [CrossRef] [Green Version]
  19. Sanders, R. Mass discrepancies in galaxies: Dark matter and alternatives. Astron. Astrophys. Rev. 1990, 2, 1–28. [Google Scholar] [CrossRef]
  20. Mannheim, P.D. Alternatives to dark matter and dark energy. Prog. Part. Nucl. Phys. 2006, 56, 340–445. [Google Scholar] [CrossRef] [Green Version]
  21. Kroupa, P. The dark matter crisis: Falsification of the current standard model of cosmology. Publ. Astron. Soc. Aust. 2012, 29, 395–433. [Google Scholar] [CrossRef] [Green Version]
  22. Kroupa, P.; Pawlowski, M.; Milgrom, M. The failures of the standard model of cosmology require a new paradigm. Int. J. Mod. Phys. D 2012, 21, 1230003. [Google Scholar] [CrossRef] [Green Version]
  23. Kroupa, P. Galaxies as simple dynamical systems: Observational data disfavor dark matter and stochastic star formation. Can. J. Phys. 2015, 93, 169–202. [Google Scholar] [CrossRef]
  24. Arun, K.; Gudennavar, S.; Sivaram, C. Dark matter, dark energy, and alternate models: A review. Adv. Space Res. 2017, 60, 166–186. [Google Scholar] [CrossRef] [Green Version]
  25. Akerib, D.S.; Alsum, S.; Araújo, H.M.; Bai, X.; Bailey, A.J.; Balajthy, J.; Beltrame, P.; Bernard, E.P.; Bernstein, A.; Biesiadzinski, T.P.; et al. Results from a Search for Dark Matter in the Complete LUX Exposure. Phys. Rev. Lett. 2017, 118, 021303. [Google Scholar] [CrossRef] [Green Version]
  26. Bertone, G.; Tait, T.M. A new era in the search for dark matter. Nature 2018, 562, 51–56. [Google Scholar] [CrossRef] [Green Version]
  27. Aprile, E.; Aalbers, J.; Agostini, F.; Alfonsi, M.; Althueser, L.; Amaro, F.D.; Anthony, M.; Arneodo, F.; Baudis, L.; Bauermeister, B.; et al. Dark Matter Search Results from a One Ton-Year Exposure of XENON1T. Phys. Rev. Lett. 2018, 121, 111302. [Google Scholar] [CrossRef] [Green Version]
  28. Skordis, C.; Złośnik, T. Gravitational alternatives to dark matter with tensor mode speed equaling the speed of light. Phys. Rev. D 2019, 100, 104013. [Google Scholar] [CrossRef]
  29. Sivaram, C.; Arun, K.; Rebecca, L. MOND, MONG, MORG as alternatives to dark matter and dark energy, and consequences for cosmic structures. J. Astrophys. Astron. 2020, 41, 4. [Google Scholar] [CrossRef]
  30. Hofmeister, A.M.; Criss, R.E. Debate on the Physics of Galactic Rotation and the Existence of Dark Matter. Galaxies 2020, 8, 54. [Google Scholar] [CrossRef]
  31. Byrd, G.; Howard, S. NGC 4622: Unusual spiral density waves and calculated disk surface density. J. Wash. Acad. Sci. 2019, 105, 1–12. [Google Scholar]
  32. Byrd, G.; Howard, S. Spiral galaxies when disks dominate their halos (using arm pitches and rotation curves). J. Wash. Acad. Sci. 2021, 107, 1. [Google Scholar]
  33. Donato, F.; Gentile, G.; Salucci, P.; Frigerio Martins, C.; Wilkinson, M.; Gilmore, G.; Grebel, E.; Koch, A.; Wyse, R. A constant dark matter halo surface density in galaxies. Mon. Not. R. Astron. Soc. 2009, 397, 1169–1176. [Google Scholar] [CrossRef] [Green Version]
  34. Zhou, Y.; Del Popolo, A.; Chang, Z. On the absence of a universal surface density, and a maximum Newtonian acceleration in dark matter haloes: Consequences for MOND. Phys. Dark Universe 2020, 28, 100468. [Google Scholar] [CrossRef]
  35. Milgrom, M. A modification of the Newtonian dynamics as a possible alternative to the hidden mass hypothesis. Astrophys. J. 1983, 270, 365–370. [Google Scholar] [CrossRef]
  36. Milgrom, M. MOND and the mass discrepancies in tidal dwarf galaxies. Astrophys. J. Lett. 2007, 667, L45. [Google Scholar] [CrossRef] [Green Version]
  37. De Blok, W.; McGaugh, S. Testing modified newtonian dynamics with low surface brightness galaxies: Rotation curve fits. Astrophys. J. 1998, 508, 132. [Google Scholar] [CrossRef] [Green Version]
  38. Sanders, R. The virial discrepancy in clusters of galaxies in the context of modified Newtonian dynamics. Astrophys. J. Lett. 1998, 512, L23. [Google Scholar] [CrossRef] [Green Version]
  39. Sanders, R.H.; McGaugh, S.S. Modified Newtonian dynamics as an alternative to dark matter. Annu. Rev. Astron. Astrophys. 2002, 40, 263–317. [Google Scholar] [CrossRef] [Green Version]
  40. Swaters, R.; Sanders, R.; McGaugh, S. Testing modified Newtonian dynamics with rotation curves of dwarf and low surface brightness galaxies. Astrophys. J. 2010, 718, 380. [Google Scholar] [CrossRef] [Green Version]
  41. Sanders, R. NGC 2419 does not challenge modified Newtonian dynamics. Mon. Not. R. Astron. Soc. 2012, 419, L6–L8. [Google Scholar] [CrossRef] [Green Version]
  42. Iocco, F.; Pato, M.; Bertone, G. Testing modified Newtonian dynamics in the Milky Way. Phys. Rev. D 2015, 92, 084046. [Google Scholar] [CrossRef] [Green Version]
  43. Díaz-Saldaña, I.; López-Domínguez, J.; Sabido, M. On emergent gravity, black hole entropy and galactic rotation curves. Phys. Dark Universe 2018, 22, 147–151. [Google Scholar] [CrossRef] [Green Version]
  44. Falcon, N. A large-scale heuristic modification of Newtonian gravity as an alternative approach to dark energy and dark matter. J. Astrophys. Astron. 2021, 42, 102. [Google Scholar] [CrossRef]
  45. O’Brien, J.G.; Chiarelli, T.L.; Dentico, J.; Stulge, M.; Stefanski, B.; Moss, R.; Chaykov, S. Alternative Gravity Rotation Curves for the LITTLE THINGS Survey. Astrophys. J. 2017, 852, 6. [Google Scholar] [CrossRef] [Green Version]
  46. Wojnar, A.; Sporea, C.; Borowiec, A. A simple model for explaining Galaxy Rotation Curves. Galaxies 2018, 6, 70. [Google Scholar] [CrossRef] [Green Version]
  47. Milgrom, M. MOND in galaxy groups: A superior sample. Phys. Rev. D 2019, 99, 044041. [Google Scholar] [CrossRef] [Green Version]
  48. Carroll, S.M.; Sawicki, I.; Silvestri, A.; Trodden, M. Modified-source gravity and cosmological structure formation. New J. Phys. 2006, 8, 323. [Google Scholar] [CrossRef] [Green Version]
  49. Dodelson, S. The real problem with MOND. Int. J. Mod. Phys. D 2011, 20, 2749–2753. [Google Scholar] [CrossRef] [Green Version]
  50. Capozziello, S.; De Laurentis, M. The dark matter problem from f (R) gravity viewpoint. Ann. Phys. 2012, 524, 545–578. [Google Scholar] [CrossRef]
  51. Chadwick, E.A.; Hodgkinson, T.F.; McDonald, G.S. Gravitational theoretical development supporting MOND. Phys. Rev. D 2013, 88, 024036. [Google Scholar] [CrossRef] [Green Version]
  52. Farnes, J.S. A unifying theory of dark energy and dark matter: Negative masses and matter creation within a modified ΛCDM framework. Astron. Astrophys. 2018, 620, A92. [Google Scholar] [CrossRef] [Green Version]
  53. Rivera, P.C. An Alternative Model of Rotation Curve that Explains Anomalous Orbital Velocity, Mass Discrepancy and Structure of Some Galaxies. Am. J. Astron. Astrophys. 2020, 7, 73–79. [Google Scholar] [CrossRef]
  54. Nagao, S. Galactic Evolution Showing a Constant Circulating Speed of Stars in a Galactic Disc without Requiring Dark Matter. Rep. Adv. Phys. Sci. 2020, 4, 2050004. [Google Scholar] [CrossRef]
  55. Blake, B.C. Relativistic Beaming of Gravity and the Missing Mass Problem. Bull. Am. Phys. Soc. 2021, 2021, B17.00002. [Google Scholar]
  56. Larin, S.A. Towards the Explanation of Flatness of Galaxies Rotation Curves. Universe 2022, 8, 632. [Google Scholar] [CrossRef]
  57. Gomel, R.; Zimmerman, T. The Effects of Inertial Forces on the Dynamics of Disk Galaxies. Galaxies 2021, 9, 34. [Google Scholar] [CrossRef]
  58. Loeb, A.; Gaudi, B.S. Periodic flux variability of stars due to the reflex Doppler effect induced by planetary companions. Astrophys. J. Lett. 2003, 588, L117. [Google Scholar] [CrossRef]
  59. Rybicki, G.B.; Lightman, A.P. Radiative Processes in Astrophysics; John Wiley & Sons: New York, NY, USA, 2008. [Google Scholar]
  60. Van Waerbeke, L.; Mellier, Y.; Erben, T.; Cuillandre, J.; Bernardeau, F.; Maoli, R.; Bertin, E.; Mc Cracken, H.; Fevre, O.L.; Fort, B.; et al. Detection of correlated galaxy ellipticities on CFHT data: First evidence for gravitational lensing by large-scale structures. Astron. Astrophys. 2000, 358, 30–44. [Google Scholar]
  61. Wittman, D.M.; Tyson, J.A.; Kirkman, D.; Dell’Antonio, I.; Bernstein, G. Detection of weak gravitational lensing distortions of distant galaxies by cosmic dark matter at large scales. Nature 2000, 405, 143–148. [Google Scholar] [CrossRef] [Green Version]
  62. Mandelbaum, R.; Seljak, U.; Kauffmann, G.; Hirata, C.M.; Brinkmann, J. Galaxy halo masses and satellite fractions from galaxy–galaxy lensing in the Sloan Digital Sky Survey: Stellar mass, luminosity, morphology and environment dependencies. Mon. Not. R. Astron. Soc. 2006, 368, 715–731. [Google Scholar] [CrossRef] [Green Version]
  63. Hirata, C.M.; Mandelbaum, R.; Ishak, M.; Seljak, U.; Nichol, R.; Pimbblet, K.A.; Ross, N.P.; Wake, D. Intrinsic galaxy alignments from the 2SLAQ and SDSS surveys: Luminosity and redshift scalings and implications for weak lensing surveys. Mon. Not. R. Astron. Soc. 2007, 381, 1197–1218. [Google Scholar] [CrossRef] [Green Version]
  64. Pogosian, L.; Silvestri, A.; Koyama, K.; Zhao, G.B. How to optimally parametrize deviations from general relativity in the evolution of cosmological perturbations. Phys. Rev. D 2010, 81, 104023. [Google Scholar] [CrossRef] [Green Version]
  65. Flaugher, B.L.; Abbott, T.M.; Angstadt, R.; Annis, J.; Antonik, M.L.; Bailey, J.; Ballester, O.; Bernstein, J.P.; Bernstein, R.A.; Bonati, M.; et al. Status of the dark energy survey camera (DECam) project. In Proceedings of the Ground-Based and Airborne Instrumentation for Astronomy IV; SPIE: Anderlecht, Belgium, 2012; Volume 8446, pp. 343–357. [Google Scholar]
  66. Shamir, L. Analysis of spin directions of galaxies in the DESI Legacy Survey. Mon. Not. R. Astron. Soc. 2022, 516, 2281–2291. [Google Scholar] [CrossRef]
  67. Dey, A.; Schlegel, D.J.; Lang, D.; Blum, R.; Burleigh, K.; Fan, X.; Findlay, J.R.; Finkbeiner, D.; Herrera, D.; Juneau, S.; et al. Overview of the DESI legacy imaging surveys. Astron. J. 2019, 157, 168. [Google Scholar] [CrossRef] [Green Version]
  68. Shamir, L. Ganalyzer: A tool for automatic galaxy image analysis. Astrophys. J. 2011, 736, 141. [Google Scholar] [CrossRef]
  69. Shamir, L. Asymmetry between galaxies with clockwise handedness and counterclockwise handedness. Astrophys. J. 2016, 823, 32. [Google Scholar] [CrossRef] [Green Version]
  70. Shamir, L. Large-scale photometric asymmetry in galaxy spin patterns. Publ. Astron. Soc. Aust. 2017, 34, e44. [Google Scholar] [CrossRef]
  71. Shamir, L. Patterns of galaxy spin directions in SDSS and Pan-STARRS show parity violation and multipoles. Astrophys. Space Sci. 2020, 365, 136. [Google Scholar] [CrossRef]
  72. Shamir, L. Photometric asymmetry between clockwise and counterclockwise spiral galaxies in SDSS. Publ. Astron. Soc. Aust. 2017, 34, e011. [Google Scholar] [CrossRef] [Green Version]
  73. Shamir, L. Large-scale asymmetry in galaxy spin directions: Evidence from the Southern hemisphere. Publ. Astron. Soc. Aust. 2021, 38, e037. [Google Scholar] [CrossRef]
  74. Morháč, M.; Kliman, J.; Matoušek, V.; Veselskỳ, M.; Turzo, I. Identification of peaks in multidimensional coincidence γ-ray spectra. Nucl. Instrum. Methods Phys. Res. Sect. A Accel. Spectrometers Detect. Assoc. Equip. 2000, 443, 108–125. [Google Scholar] [CrossRef]
  75. Shamir, L. Analysis of the alignment of non-random patterns of spin directions in populations of spiral galaxies. Particles 2021, 4, 11–28. [Google Scholar] [CrossRef]
  76. Dojcsak, L.; Shamir, L. Quantitative analysis of spirality in elliptical galaxies. New Astron. 2014, 28, 1–8. [Google Scholar] [CrossRef] [Green Version]
  77. Shamir, L. Asymmetry in galaxy spin directions-analysis of data from DES and comparison to four other sky surveys. Universe 2022, 8, 397. [Google Scholar] [CrossRef]
  78. Helmert, F. Die Genauigkeit der Formel von Peters zur Berechnung des wahrscheinlichen Beobachtungsfehlers director Beobachtungen gleicher Genauigkeit. Astron. Notes 1876, 88, 113. [Google Scholar]
  79. Shamir, L. Large-scale asymmetry in galaxy spin directions: Analysis of galaxies with spectra in DES, SDSS, and DESI Legacy Survey. Astron. Notes 2022, 343, e20220010. [Google Scholar] [CrossRef]
  80. Shamir, L. Asymmetry between galaxies with different spin patterns: A comparison between COSMOS, SDSS, and Pan-STARRS. Open Astron. 2020, 29, 15–27. [Google Scholar] [CrossRef]
  81. Shamir, L. Analysis of ∼106 spiral galaxies from four telescopes shows large-scale patterns of asymmetry in galaxy spin directions. Adv. Astron. 2022, 2022, 8462363. [Google Scholar] [CrossRef]
  82. Kormendy, J. Brightness distributions in compact and normal galaxies. II-Structure parameters of the spheroidal component. Astrophys. J. 1977, 218, 333–346. [Google Scholar] [CrossRef]
  83. Shamir, L. Using Machine Learning to Profile Asymmetry between Spiral Galaxies with Opposite Spin Directions. Symmetry 2022, 14, 934. [Google Scholar] [CrossRef]
  84. Davis, D.R.; Hayes, W.B. SpArcFiRe: Scalable Automated Detection of Spiral Galaxy Arm Segments. Astrophys. J. 2014, 790, 87. [Google Scholar] [CrossRef]
  85. Hayes, W.B.; Davis, D.; Silva, P. On the nature and correction of the spurious S-wise spiral galaxy winding bias in Galaxy Zoo 1. Mon. Not. R. Astron. Soc. 2017, 466, 3928–3936. [Google Scholar] [CrossRef] [Green Version]
  86. Dhar, S.; Shamir, L. Systematic biases when using deep neural networks for annotating large catalogs of astronomical images. Astron. Comput. 2022, 38, 100545. [Google Scholar] [CrossRef]
  87. Lintott, C.J.; Schawinski, K.; Slosar, A.; Land, K.; Bamford, S.; Thomas, D.; Raddick, M.J.; Nichol, R.C.; Szalay, A.; Andreescu, D.; et al. Galaxy Zoo: Morphologies derived from visual inspection of galaxies from the Sloan Digital Sky Survey. Mon. Not. R. Astron. Soc. 2008, 389, 1179–1189. [Google Scholar] [CrossRef] [Green Version]
  88. Scoville, N.; Abraham, R.; Aussel, H.; Barnes, J.; Benson, A.; Blain, A.; Calzetti, D.; Comastri, A.; Capak, P.; Carilli, C.; et al. COSMOS: Hubble space telescope observations. Astrophys. J. Suppl. Ser. 2007, 172, 38. [Google Scholar] [CrossRef] [Green Version]
  89. Koekemoer, A.M.; Aussel, H.; Calzetti, D.; Capak, P.; Giavalisco, M.; Kneib, J.P.; Leauthaud, A.; Le Fevre, O.; McCracken, H.; Massey, R.; et al. The COSMOS survey: Hubble space telescope advanced camera for surveys observations and data processing. Astrophys. J. Suppl. Ser. 2007, 172, 196. [Google Scholar] [CrossRef] [Green Version]
  90. Capak, P.; Aussel, H.; Ajiki, M.; McCracken, H.; Mobasher, B.; Scoville, N.; Shopbell, P.; Taniguchi, Y.; Thompson, D.; Tribiano, S.; et al. The first release COSMOS optical and near-IR data and catalog. Astrophys. J. Suppl. Ser. 2007, 172, 99. [Google Scholar] [CrossRef] [Green Version]
  91. Berriman, G.; Good, J.; Laity, A.; Bergou, A.; Jacob, J.; Katz, D.; Deelman, E.; Kesselman, C.; Singh, G.; Su, M.H.; et al. Montage: A grid enabled image mosaic service for the national virtual observatory. In Proceedings of the Astronomical Data Analysis Software and Systems (ADASS) XIII, Strasbourg, France, 12–15 October 2004; Volume 314, p. 593. [Google Scholar]
  92. Abbott, T.; Abdalla, F.; Allam, S.; Amara, A.; Annis, J.; Armstrong, R.; Bacon, D.; Banerji, M.; Bauer, A.; Baxter, E.; et al. Cosmology from cosmic shear with dark energy survey science verification data. Phys. Rev. D 2016, 94, 022001. [Google Scholar] [CrossRef] [Green Version]
  93. Driver, S.P.; Robotham, A.S. Quantifying cosmic variance. Mon. Not. R. Astron. Soc. 2010, 407, 2131–2140. [Google Scholar] [CrossRef] [Green Version]
  94. Moster, B.P.; Somerville, R.S.; Newman, J.A.; Rix, H.W. A cosmic variance cookbook. Astrophys. J. 2011, 731, 113. [Google Scholar] [CrossRef] [Green Version]
  95. Kamionkowski, M.; Loeb, A. Getting around cosmic variance. Phys. Rev. D 1997, 56, 4511. [Google Scholar] [CrossRef] [Green Version]
  96. Camarena, D.; Marra, V. Impact of the cosmic variance on H 0 on cosmological analyses. Phys. Rev. D 2018, 98, 023537. [Google Scholar] [CrossRef] [Green Version]
  97. Keenan, R.P.; Marrone, D.P.; Keating, G.K. Biases and Cosmic Variance in Molecular Gas Abundance Measurements at High Redshift. Astrophys. J. 2020, 904, 127. [Google Scholar] [CrossRef]
  98. Freeman, T.; Byrd, G.; Howard, S. Simulating NGC 4622: A Leading-Arm Spiral Galaxy. Bull. Am. Astron. Soc. 1991, 23, 1460. [Google Scholar]
  99. Buta, R.J.; Byrd, G.G.; Freeman, T. The ringed spiral galaxy NGC 4622. I. Photometry, kinematics, and the case for two strong leading outer spiral arms. Astron. J. 2003, 125, 634. [Google Scholar] [CrossRef]
  100. Byrd, G.G.; Freeman, T.; Howard, S.; Buta, R.J. The ringed spiral galaxy NGC4622. II. An independent determination that the two outer arms lead. Astron. J. 2007, 135, 408. [Google Scholar] [CrossRef]
  101. Shamir, L. Doppler Shift Effect as a Possible Explanation to the Hubble-Lemaitre Constant Tension. Preprints 2023, 2023010390. [Google Scholar] [CrossRef]
  102. Wu, H.Y.; Huterer, D. Sample variance in the local measurements of the Hubble constant. Mon. Not. R. Astron. Soc. 2017, 471, 4946–4955. [Google Scholar] [CrossRef] [Green Version]
  103. Mörtsell, E.; Dhawan, S. Does the Hubble constant tension call for new physics? J. Cosmol. Astropart. Phys. 2018, 2018, 025. [Google Scholar] [CrossRef] [Green Version]
  104. Bolejko, K. Emerging spatial curvature can resolve the tension between high-redshift CMB and low-redshift distance ladder measurements of the Hubble constant. Phys. Rev. D 2018, 97, 103529. [Google Scholar] [CrossRef] [Green Version]
  105. Davis, T.M.; Hinton, S.R.; Howlett, C.; Calcino, J. Can redshift errors bias measurements of the Hubble Constant? Mon. Not. R. Astron. Soc. 2019, 490, 2948–2957. [Google Scholar] [CrossRef] [Green Version]
  106. Pandey, S.; Raveri, M.; Jain, B. Model independent comparison of supernova and strong lensing cosmography: Implications for the Hubble constant tension. Phys. Rev. D 2020, 102, 023505. [Google Scholar] [CrossRef]
  107. Camarena, D.; Marra, V. Local determination of the Hubble constant and the deceleration parameter. Phys. Rev. Res. 2020, 2, 013028. [Google Scholar] [CrossRef] [Green Version]
  108. Di Valentino, E.; Mena, O.; Pan, S.; Visinelli, L.; Yang, W.; Melchiorri, A.; Mota, D.F.; Riess, A.G.; Silk, J. In the realm of the Hubble tension—A review of solutions. Class. Quantum Gravity 2021, 38, 153001. [Google Scholar] [CrossRef]
  109. Riess, A.G.; Yuan, W.; Macri, L.M.; Scolnic, D.; Brout, D.; Casertano, S.; Jones, D.O.; Murakami, Y.; Anand, G.S.; Breuval, L.; et al. A comprehensive measurement of the local value of the Hubble constant with 1 km s Mpc−1 uncertainty from the Hubble Space Telescope and the SH0ES team. Astrophys. J. Lett. 2022, 934, L7. [Google Scholar] [CrossRef]
  110. Pogosian, L.; Raveri, M.; Koyama, K.; Martinelli, M.; Silvestri, A.; Zhao, G.B.; Li, J.; Peirone, S.; Zucca, A. Imprints of cosmological tensions in reconstructed gravity. Nat. Astron. 2022, 6, 1484–1490. [Google Scholar] [CrossRef]
  111. Di Valentino, E.; Anchordoqui, L.A.; Akarsu, Ö.; Ali-Haimoud, Y.; Amendola, L.; Arendse, N.; Asgari, M.; Ballardini, M.; Basilakos, S.; Battistelli, E.; et al. Snowmass2021-Letter of interest cosmology intertwined II: The hubble constant tension. Astropart. Phys. 2021, 131, 102605. [Google Scholar] [CrossRef]
  112. Di Valentino, E.; Anchordoqui, L.A.; Akarsu, Ö.; Ali-Haimoud, Y.; Amendola, L.; Arendse, N.; Asgari, M.; Ballardini, M.; Basilakos, S.; Battistelli, E.; et al. Snowmass2021-Letter of interest cosmology intertwined IV: The age of the universe and its curvature. Astropart. Phys. 2021, 131, 102607. [Google Scholar] [CrossRef]
  113. Haug, E.G. Does Lorentz relativistic mass make dark energy superfluous? Universe 2022, 8, 577. [Google Scholar] [CrossRef]
  114. Brout, D.; Daniel, S. It’s Dust: Solving the Mysteries of the Intrinsic Scatter and Host-Galaxy Dependence of Standardized Type Ia Supernova Brightnesses. arxiv 2020, arXiv:2004.10206. [Google Scholar] [CrossRef]
  115. Khetan, N.; Izzo, L.; Branchesi, M.; Wojtak, R.; Cantiello, M.; Murugeshan, C.; Agnello, A.; Cappellaro, E.; Della Valle, M.; Gall, C.; et al. A new measurement of the Hubble constant using Type Ia supernovae calibrated with surface brightness fluctuations. Astron. Astrophys. 2021, 647, A72. [Google Scholar] [CrossRef]
  116. Meldorf, C.; Palmese, A.; Brout, D.; Chen, R.; Scolnic, D.; Kelsey, L.; Galbany, L.; Hartley, W.G.; Davis, T.M.; Drlica-Wagner, A.; et al. The Dark Energy Survey Supernova Program results: Type Ia Supernova brightness correlates with host galaxy dust. Mon. Not. R. Astron. Soc. 2022, 518, 1985–2004. [Google Scholar] [CrossRef]
  117. Dixon, M.; Lidman, C.; Mould, J.; Kelsey, L.; Brout, D.; Möller, A.; Wiseman, P.; Sullivan, M.; Galbany, L.; Davis, T.M.; et al. Using host galaxy spectroscopy to explore systematics in the standardization of Type Ia supernovae. Mon. Not. R. Astron. Soc. 2022, 517, 4291–4304. [Google Scholar] [CrossRef]
  118. Javanmardi, B.; Porciani, C.; Kroupa, P.; Pflam-Altenburg, J. Probing the isotropy of cosmic acceleration traced by type Ia supernovae. Astrophys. J. 2015, 810, 47. [Google Scholar] [CrossRef]
  119. Alam, S.; Croft, R.A.; Ho, S.; Zhu, H.; Giusarma, E. Relativistic effects on galaxy redshift samples due to target selection. Mon. Not. R. Astron. Soc. 2017, 471, 2077–2087. [Google Scholar] [CrossRef] [Green Version]
  120. Libeskind, N.I.; Hoffman, Y.; Forero-Romero, J.; Gottlöber, S.; Knebe, A.; Steinmetz, M.; Klypin, A. The velocity shear tensor: Tracer of halo alignment. Mon. Not. R. Astron. Soc. 2013, 428, 2489–2499. [Google Scholar] [CrossRef] [Green Version]
  121. Aluri, P.K.; Cea, P.; Chingangbam, P.; Chu, M.C.; Clowes, R.G.; Hutsemékers, D.; Kochappan, J.P.; Krasiński, A.; Lopez, A.M.; Liu, L.; et al. Is the observable Universe consistent with the cosmological principle? arXiv 2022, arXiv:2207.05765. [Google Scholar]
  122. Abramo, L.R.; Sodré, L., Jr.; Wuensche, C.A. Anomalies in the low CMB multipoles and extended foregrounds. Phys. Rev. D 2006, 74, 083515. [Google Scholar] [CrossRef] [Green Version]
  123. Mariano, A.; Perivolaropoulos, L. CMB maximum temperature asymmetry axis: Alignment with other cosmic asymmetries. Phys. Rev. D 2013, 87, 043511. [Google Scholar] [CrossRef] [Green Version]
  124. Land, K.; Magueijo, J. Examination of evidence for a preferred axis in the cosmic radiation anisotropy. Phys. Rev. Lett. 2005, 95, 071301. [Google Scholar] [CrossRef]
  125. Ade, P.A.; Aghanim, N.; Armitage-Caplan, C.; Arnaud, M.; Ashdown, M.; Atrio-Barandela, F.; Aumont, J.; Baccigalupi, C.; Banday, A.J.; Barreiro, R.; et al. Planck 2013 results. XXIII. Isotropy and statistics of the CMB. Astron. Astrophys. 2014, 571, A23. [Google Scholar]
  126. Santos, L.; Cabella, P.; Villela, T.; Zhao, W. Influence of Planck foreground masks in the large angular scale quadrant CMB asymmetry. Astron. Astrophys. 2015, 584, A115. [Google Scholar] [CrossRef] [Green Version]
  127. Gruppuso, A.; Kitazawa, N.; Lattanzi, M.; Mandolesi, N.; Natoli, P.; Sagnotti, A. The evens and odds of CMB anomalies. Phys. Dark Universe 2018, 20, 49–64. [Google Scholar] [CrossRef] [Green Version]
  128. Yeung, S.; Chu, M.C. Directional variations of cosmological parameters from the Planck CMB Data. Phys. Rev. D 2022, 105, 083508. [Google Scholar] [CrossRef]
  129. Schwarz, D.J.; Starkman, G.D.; Huterer, D.; Copi, C.J. Is the low-l microwave background cosmic? Phys. Rev. Lett. 2004, 93, 221301. [Google Scholar] [CrossRef] [Green Version]
  130. Ralston, J.P.; Jain, P. The Virgo alignment puzzle in propagation of radiation on cosmological scales. Int. J. Mod. Phys. D 2004, 13, 1857–1877. [Google Scholar] [CrossRef] [Green Version]
  131. Copi, C.J.; Huterer, D.; Schwarz, D.J.; Starkman, G.D. Uncorrelated universe: Statistical anisotropy and the vanishing angular correlation function in WMAP years 1–3. Phys. Rev. D 2007, 75, 023507. [Google Scholar] [CrossRef] [Green Version]
  132. Copi, C.J.; Huterer, D.; Schwarz, D.J.; Starkman, G.D. Large-angle anomalies in the CMB. Adv. Astron. 2010, 2010, 847541. [Google Scholar] [CrossRef] [Green Version]
  133. Copi, C.J.; Huterer, D.; Schwarz, D.J.; Starkman, G.D. Large-scale alignments from WMAP and Planck. Mon. Not. R. Astron. Soc. 2015, 449, 3458–3470. [Google Scholar] [CrossRef] [Green Version]
  134. Eriksen, H.K.; Hansen, F.K.; Banday, A.J.; Gorski, K.M.; Lilje, P.B. Asymmetries in the Cosmic Microwave Background anisotropy field. Astrophys. J. 2004, 605, 14. [Google Scholar] [CrossRef]
  135. Akrami, Y.; Fantaye, Y.; Shafieloo, A.; Eriksen, H.; Hansen, F.K.; Banday, A.J.; Górski, K.M. Power asymmetry in WMAP and Planck temperature sky maps as measured by a local variance estimator. Astrophys. J. Lett. 2014, 784, L42. [Google Scholar] [CrossRef] [Green Version]
  136. Kim, J.; Naselsky, P. Anomalous parity asymmetry of WMAP 7-year power spectrum data at low multipoles: Is it cosmological or systematics? Phys. Rev. D 2010, 82, 063002. [Google Scholar] [CrossRef] [Green Version]
  137. Kim, J.; Naselsky, P. Anomalous parity asymmetry of the Wilkinson Microwave Anisotropy Probe power spectrum data at low multipoles. Astrophys. J. Lett. 2010, 714, L265. [Google Scholar] [CrossRef] [Green Version]
  138. Cruz, M.; Cayon, L.; Martinez-Gonzalez, E.; Vielva, P.; Jin, J. The non-Gaussian cold spot in the 3-year WMAP data. Astrophys. J. 2007, 655, 11–20. [Google Scholar] [CrossRef]
  139. Masina, I.; Notari, A. The cold spot as a large void: Lensing effect on CMB two and three point correlation functions. J. Cosmol. Astropart. Phys. 2009, 2009, 035. [Google Scholar] [CrossRef] [Green Version]
  140. Vielva, P. A comprehensive overview of the cold spot. Adv. Astron. 2010, 2010, 592094. [Google Scholar] [CrossRef] [Green Version]
  141. Mackenzie, R.; Shanks, T.; Bremer, M.N.; Cai, Y.C.; Gunawardhana, M.L.; Kovács, A.; Norberg, P.; Szapudi, I. Evidence against a supervoid causing the CMB Cold Spot. Mon. Not. R. Astron. Soc. 2017, 470, 2328–2338. [Google Scholar] [CrossRef] [Green Version]
  142. Farhang, M.; Movahed, S. CMB Cold Spot in the Planck light. Astrophys. J. 2021, 906, 41. [Google Scholar] [CrossRef]
  143. Bennett, C.; Hill, R.; Hinshaw, G.; Larson, D.; Smith, K.; Dunkley, J.; Gold, B.; Halpern, M.; Jarosik, N.; Kogut, A.; et al. Seven-year wilkinson microwave anisotropy probe (WMAP*) observations: Are there cosmic microwave background anomalies? Astrophys. J. Suppl. Ser. 2011, 192, 17. [Google Scholar] [CrossRef] [Green Version]
  144. Ghosh, S.; Jain, P.; Kashyap, G.; Kothari, R.; Nadkarni-Ghosh, S.; Tiwari, P. Probing statistical isotropy of cosmological radio sources using Square Kilometre Array. J. Astrophys. Astron. 2016, 37, 25. [Google Scholar] [CrossRef] [Green Version]
  145. Tiwari, P.; Jain, P. Dipole anisotropy in integrated linearly polarized flux density in NVSS data. Mon. Not. R. Astron. Soc. 2015, 447, 2658–2670. [Google Scholar] [CrossRef] [Green Version]
  146. Tiwari, P.; Nusser, A. Revisiting the NVSS number count dipole. J. Cosmol. Astropart. Phys. 2016, 2016, 062. [Google Scholar] [CrossRef]
  147. Singal, A.K. Large disparity in cosmic reference frames determined from the sky distributions of radio sources and the microwave background radiation. Phys. Rev. D 2019, 100, 063501. [Google Scholar] [CrossRef] [Green Version]
  148. Marcha, M.J.M.; Browne, I.W.A. Large-scale clustering amongst Fermi blazars; evidence for axis alignments? Mon. Not. R. Astron. Soc. 2021, 507, 1361–1368. [Google Scholar] [CrossRef]
  149. Migkas, K.; Schellenberger, G.; Reiprich, T.; Pacaud, F.; Ramos-Ceja, M.; Lovisari, L. Probing cosmic isotropy with a new X-ray galaxy cluster sample through the LX–T scaling relation. Astron. Astrophys. 2020, 636, A15. [Google Scholar] [CrossRef] [Green Version]
  150. Mészáros, A. An oppositeness in the cosmology: Distribution of the gamma ray bursts and the cosmological principle. Astron. Notes 2019, 340, 564–569. [Google Scholar] [CrossRef] [Green Version]
  151. Perivolaropoulos, L. Large scale cosmological anomalies and inhomogeneous dark energy. Galaxies 2014, 2, 22–61. [Google Scholar] [CrossRef] [Green Version]
  152. Migkas, K.; Pacaud, F.; Schellenberger, G.; Erler, J.; Nguyen-Dang, N.; Reiprich, T.; Ramos-Ceja, M.; Lovisari, L. Cosmological implications of the anisotropy of ten galaxy cluster scaling relations. Astron. Astrophys. 2021, 649, A151. [Google Scholar] [CrossRef]
  153. Krishnan, C.; Mohayaee, R.; Colgáin, E.Ó.; Sheikh-Jabbari, M.; Yin, L. Hints of FLRW breakdown from supernovae. Phys. Rev. D 2022, 105, 063514. [Google Scholar] [CrossRef]
  154. Lin, H.N.; Li, X.; Chang, Z. The significance of anisotropic signals hiding in the Type Ia supernovae. Mon. Not. R. Astron. Soc. 2016, 460, 617–626. [Google Scholar] [CrossRef] [Green Version]
  155. Javanmardi, B.; Kroupa, P. Anisotropy in the all-sky distribution of galaxy morphological types. Astron. Astrophys. 2017, 597, A120. [Google Scholar] [CrossRef] [Green Version]
  156. Adhav, K.; Bansod, A.; Wankhade, R.; Ajmire, H. Kantowski-Sachs cosmological models with anisotropic dark energy. Open Phys. 2011, 9, 919–925. [Google Scholar] [CrossRef]
  157. Adhav, K. LRS Bianchi type-I universe with anisotropic dark energy in Lyra geometry. Int. J. Astron. Astrophys. 2011, 1, 204–209. [Google Scholar] [CrossRef] [Green Version]
  158. Colin, J.; Mohayaee, R.; Rameez, M.; Sarkar, S. Evidence for anisotropy of cosmic acceleration. Astron. Astrophys. 2019, 631, L13. [Google Scholar] [CrossRef] [Green Version]
  159. Webb, J.; King, J.; Murphy, M.; Flambaum, V.; Carswell, R.; Bainbridge, M. Indications of a spatial variation of the fine structure constant. Phys. Rev. Lett. 2011, 107, 191101. [Google Scholar] [CrossRef] [Green Version]
  160. Skeivalas, J.; Paršeliūnas, E.; Šlikas, D. The predictive model for the universe rotation axis identification upon applying the solar system coordinate net in the Milky Way galaxy. Indian J. Phys. 2021, 96, 1625–1634. [Google Scholar] [CrossRef]
  161. Luongo, O.; Muccino, M.; Colgáin, E.Ó.; Sheikh-Jabbari, M.; Yin, L. Larger H0 values in the CMB dipole direction. Phys. Rev. D 2022, 105, 103510. [Google Scholar] [CrossRef]
  162. Hutsemekers, D. Evidence for very large-scale coherent orientations of quasar polarization vectors. Astron. Astrophys. 1998, 332, 410–428. [Google Scholar]
  163. Hutsemékers, D.; Cabanac, R.; Lamy, H.; Sluse, D. Mapping extreme-scale alignments of quasar polarization vectors. Astron. Astrophys. 2005, 441, 915–930. [Google Scholar] [CrossRef]
  164. Secrest, N.J.; von Hausegger, S.; Rameez, M.; Mohayaee, R.; Sarkar, S.; Colin, J. A test of the cosmological principle with quasars. Astrophys. J. Lett. 2021, 908, L51. [Google Scholar] [CrossRef]
  165. Zhao, D.; Xia, J.Q. A tomographic test of cosmic anisotropy with the recently-released quasar sample. Eur. Phys. J. C 2021, 81, 948. [Google Scholar] [CrossRef]
  166. Semenaite, A.; Sánchez, A.G.; Pezzotta, A.; Hou, J.; Scoccimarro, R.; Eggemeier, A.; Crocce, M.; Chuang, C.H.; Smith, A.; Zhao, C.; et al. Cosmological implications of the full shape of anisotropic clustering measurements in BOSS and eBOSS. Mon. Not. R. Astron. Soc. 2021, 512, 5657–5670. [Google Scholar] [CrossRef]
  167. Sommers, P. Cosmic ray anisotropy analysis with a full-sky observatory. Astropart. Phys. 2001, 14, 271–286. [Google Scholar] [CrossRef] [Green Version]
  168. Deligny, O.; Salamida, F. Searches for large-scale anisotropies of cosmic rays: Harmonic analysis and shuffling technique. Astropart. Phys. 2013, 46, 40–49. [Google Scholar] [CrossRef] [Green Version]
  169. Aab, A.; Abreu, P.; Aglietta, M.; Al Samarai, I.; Albuquerque, I.; Allekotte, I.; Almela, A.; Castillo, J.A.; Alvarez-Muñiz, J.; Anastasi, G.A.; et al. Observation of a large-scale anisotropy in the arrival directions of cosmic rays above 8 × 10¹⁸ eV. Science 2017, 357, 1266–1270. [Google Scholar]
  170. Aab, A.; Abreu, P.; Aglietta, M.; Albuquerque, I.; Albury, J.M.; Allekotte, I.; Almela, A.; Castillo, J.A.; Alvarez-Muñiz, J.; Anastasi, G.A.; et al. Probing the origin of ultra-high-energy cosmic rays with neutrinos in the EeV energy range using the Pierre Auger Observatory. J. Cosmol. Astropart. Phys. 2019, 2019, 022. [Google Scholar] [CrossRef] [Green Version]
  171. Jones, B.J.; Martínez, V.J.; Saar, E.; Trimble, V. Scaling laws in the distribution of galaxies. Rev. Mod. Phys. 2005, 76, 1211. [Google Scholar] [CrossRef] [Green Version]
  172. Longo, M.J. Detection of a Dipole in the Handedness of Spiral Galaxies with Redshifts z ~ 0.04. Phys. Lett. B 2011, 699, 224–229. [Google Scholar] [CrossRef] [Green Version]
  173. Shamir, L. Handedness asymmetry of spiral galaxies with z < 0.3 shows cosmic parity violation and a dipole axis. Phys. Lett. B 2012, 715, 25–29. [Google Scholar]
  174. Shamir, L. Cosmological-scale parity violation of galaxy spin patterns. arXiv 2019, arXiv:1912.05429. [Google Scholar]
  175. Shamir, L. Galaxy spin direction distribution in HST and SDSS show similar large-scale asymmetry. Publ. Astron. Soc. Aust. 2020, 37, e053. [Google Scholar] [CrossRef]
  176. Philcox, O.H. Probing parity-violation with the four-point correlation function of BOSS galaxies. arXiv 2022, arXiv:2206.04227. [Google Scholar] [CrossRef]
  177. Hou, J.; Slepian, Z.; Cahn, R.N. Measurement of parity-odd modes in the large-scale 4-Point correlation function of SDSS BOSS DR12 CMASS and LOWZ galaxies. arXiv 2022, arXiv:2206.03625. [Google Scholar]
  178. Pecker, J.C. Some critiques of the big bang cosmology. J. Astrophys. Astron. 1997, 18, 323–333. [Google Scholar] [CrossRef]
  179. Bull, P.; Akrami, Y.; Adamek, J.; Baker, T.; Bellini, E.; Jimenez, J.B.; Bentivegna, E.; Camera, S.; Clesse, S.; Davis, J.H.; et al. Beyond ΛCDM: Problems, solutions, and the road ahead. Phys. Dark Universe 2016, 12, 56–99. [Google Scholar] [CrossRef] [Green Version]
  180. Velten, H.; Gomes, S. Is the Hubble diagram of quasars in tension with concordance cosmology? Phys. Rev. D 2020, 101, 043502. [Google Scholar] [CrossRef] [Green Version]
  181. Krishnan, C.; Mohayaee, R.; Colgáin, E.Ó.; Sheikh-Jabbari, M.; Yin, L. Does Hubble tension signal a breakdown in FLRW cosmology? Class. Quantum Gravity 2021, 38, 184001. [Google Scholar] [CrossRef]
  182. Colgáin, E.Ó. Probing the anisotropic Universe with gravitational waves. arXiv 2022, arXiv:2203.03956. [Google Scholar]
  183. Abdalla, E.; Abellán, G.F.; Aboubrahim, A.; Agnello, A.; Akarsu, Ö.; Akrami, Y.; Alestas, G.; Aloni, D.; Amendola, L.; Anchordoqui, L.A.; et al. Cosmology intertwined: A review of the particle physics, astrophysics, and cosmology associated with the cosmological tensions and anomalies. J. High Energy Astrophys. 2022, 34, 49–211. [Google Scholar] [CrossRef]
  184. Pathria, R. The universe as a black hole. Nature 1972, 240, 298–299. [Google Scholar] [CrossRef]
  185. Stuckey, W. The observable universe inside a black hole. Am. J. Phys. 1994, 62, 788–795. [Google Scholar] [CrossRef]
  186. Easson, D.A.; Brandenberger, R.H. Universe generation from black hole interiors. J. High Energy Phys. 2001, 2001, 024. [Google Scholar] [CrossRef] [Green Version]
  187. Seshavatharam, U. Physics of rotating and expanding black hole universe. Prog. Phys. 2010, 2, 7–14. [Google Scholar]
  188. Popławski, N.J. Radial motion into an Einstein–Rosen bridge. Phys. Lett. B 2010, 687, 110–113. [Google Scholar] [CrossRef] [Green Version]
  189. Christillin, P. The Machian origin of linear inertial forces from our gravitationally radiating black hole Universe. Eur. Phys. J. Plus 2014, 129, 175. [Google Scholar] [CrossRef]
  190. Dymnikova, I. Universes Inside a Black Hole with the de Sitter Interior. Universe 2019, 5, 111. [Google Scholar] [CrossRef] [Green Version]
  191. Chakrabarty, H.; Abdujabbarov, A.; Malafarina, D.; Bambi, C. A toy model for a baby universe inside a black hole. Eur. Phys. J. C 2020, 80, 373. [Google Scholar] [CrossRef]
  192. Popławski, N.J. A nonsingular, anisotropic universe in a black hole with torsion and particle production. Gen. Relativ. Gravit. 2021, 53, 18. [Google Scholar] [CrossRef]
  193. Seshavatharam, U.V.S.; Lakshminarayana, S. Concepts and results of a Practical Model of Quantum Cosmology: Light Speed Expanding Black Hole Cosmology. Mapana J. Sci. 2022, 21, 13–22. [Google Scholar]
  194. Gaztanaga, E. The Black Hole Universe, part I. Symmetry 2022, 14, 1849. [Google Scholar] [CrossRef]
  195. Gaztanaga, E. The Black Hole Universe, Part II. Symmetry 2022, 14, 1984. [Google Scholar] [CrossRef]
  196. Gammie, C.F.; Shapiro, S.L.; McKinney, J.C. Black hole spin evolution. Astrophys. J. 2004, 602, 312. [Google Scholar] [CrossRef] [Green Version]
  197. Takahashi, R. Shapes and positions of black hole shadows in accretion disks and spin parameters of black holes. Astrophys. J. 2004, 611, 996. [Google Scholar] [CrossRef]
  198. Volonteri, M.; Madau, P.; Quataert, E.; Rees, M.J. The distribution and cosmic evolution of massive black hole spins. Astrophys. J. 2005, 620, 69. [Google Scholar] [CrossRef]
  199. McClintock, J.E.; Shafee, R.; Narayan, R.; Remillard, R.A.; Davis, S.W.; Li, L.X. The spin of the near-extreme Kerr black hole GRS 1915 + 105. Astrophys. J. 2006, 652, 518. [Google Scholar] [CrossRef]
  200. Mudambi, S.P.; Rao, A.; Gudennavar, S.; Misra, R.; Bubbly, S. Estimation of the black hole spin in LMC X-1 using AstroSat. Mon. Not. R. Astron. Soc. 2020, 498, 4404–4410. [Google Scholar] [CrossRef]
  201. Reynolds, C.S. Observational constraints on black hole spin. Annu. Rev. Astron. Astrophys. 2021, 59, 117–154. [Google Scholar] [CrossRef]
  202. Montero, P.J.; Janka, H.T.; Müller, E. Relativistic collapse and explosion of rotating supermassive stars with thermonuclear effects. Astrophys. J. 2012, 749, 37. [Google Scholar] [CrossRef] [Green Version]
  203. Reynolds, C.S. Observing black holes spin. Nat. Astron. 2019, 3, 41–47. [Google Scholar] [CrossRef] [Green Version]
  204. Reynolds, C.S. Black holes in a spin. Nature 2013, 494, 432–433. [Google Scholar] [CrossRef]
  205. Carr, B.; Ellis, G. Universe or multiverse? Astron. Geophys. 2008, 49, 2–29. [Google Scholar] [CrossRef] [Green Version]
  206. Hall, L.J.; Nomura, Y. Evidence for the Multiverse in the Standard Model and Beyond. Phys. Rev. D 2008, 78, 035001. [Google Scholar] [CrossRef] [Green Version]
  207. Antonov, A.A. Hidden multiverse. Int. J. Adv. Res. Phys. Sci. 2015, 2, 25–32. [Google Scholar]
  208. Garriga, J.; Vilenkin, A.; Zhang, J. Black holes and the multiverse. J. Cosmol. Astropart. Phys. 2016, 2016, 064. [Google Scholar] [CrossRef] [Green Version]
  209. Trimble, V. Multiverses of the past. Astron. Notes 2009, 330, 761–769. [Google Scholar] [CrossRef]
  210. Kragh, H. Contemporary History of Cosmology and the Controversy over the Multiverse. Ann. Sci. 2009, 66, 529–551. [Google Scholar] [CrossRef]
  211. Campanelli, L.; Cea, P.; Tedesco, L. Ellipsoidal universe can solve the cosmic microwave background quadrupole problem. Phys. Rev. Lett. 2006, 97, 131302. [Google Scholar] [CrossRef] [Green Version]
  212. Campanelli, L.; Cea, P.; Tedesco, L. Cosmic microwave background quadrupole and ellipsoidal universe. Phys. Rev. D 2007, 76, 063007. [Google Scholar] [CrossRef] [Green Version]
  213. Campanelli, L.; Cea, P.; Fogli, G.; Tedesco, L. Cosmic parallax in ellipsoidal universe. Mod. Phys. Lett. A 2011, 26, 1169–1181. [Google Scholar] [CrossRef] [Green Version]
  214. Gruppuso, A. Complete statistical analysis for the quadrupole amplitude in an ellipsoidal universe. Phys. Rev. D 2007, 76, 083010. [Google Scholar] [CrossRef] [Green Version]
  215. Cea, P. The ellipsoidal universe in the Planck satellite era. Mon. Not. R. Astron. Soc. 2014, 441, 1646–1661. [Google Scholar] [CrossRef] [Green Version]
  216. Tatum, E.T.; Seshavatharam, U.; Lakshminarayana, S. The basics of flat space cosmology. Int. J. Astron. Astrophys. 2015, 5, 116. [Google Scholar] [CrossRef] [Green Version]
  217. Tatum, E.T.; Seshavatharam, U.; Lakshminarayana, S. Flat space cosmology as a mathematical model of quantum gravity or quantum cosmology. Int. J. Astron. Astrophys. 2015, 5, 133. [Google Scholar] [CrossRef] [Green Version]
  218. Tatum, E.T.; Seshavatharam, U.V.S. Clues to the fundamental nature of gravity, dark energy and dark matter. J. Mod. Phys. 2018, 9, 1469. [Google Scholar] [CrossRef] [Green Version]
  219. Azarnia, S.; Fareghbal, R.; Naseh, A.; Zolfi, H. Islands in flat-space cosmology. Phys. Rev. D 2021, 104, 126017. [Google Scholar] [CrossRef]
  220. Arciniega, G.; Bueno, P.; Cano, P.A.; Edelstein, J.D.; Hennigar, R.A.; Jaime, L.G. Geometric inflation. PLB 2020, 802, 135242. [Google Scholar] [CrossRef]
  221. Edelstein, J.D.; Rodríguez, D.V.; López, A.V. Aspects of geometric inflation. J. Cosmol. Astropart. Phys. 2020, 2020, 040. [Google Scholar] [CrossRef]
  222. Arciniega, G.; Edelstein, J.D.; Jaime, L.G. Towards geometric inflation: The cubic case. Phys. Lett. B 2020, 802, 135272. [Google Scholar] [CrossRef]
  223. Jaime, L.G. On the viability of the evolution of the universe with Geometric Inflation. Phys. Dark Universe 2021, 34, 100887. [Google Scholar] [CrossRef]
  224. Rajpoot, S.; Vacaru, S.I. On supersymmetric geometric flows and R2 inflation from scale invariant supergravity. Ann. Phys. 2017, 384, 20–60. [Google Scholar] [CrossRef] [Green Version]
  225. Gödel, K. An example of a new type of cosmological solutions of Einstein’s field equations of gravitation. Rev. Mod. Phys. 1949, 21, 447. [Google Scholar] [CrossRef] [Green Version]
  226. Ozsváth, I.; Schücking, E. Finite rotating universe. Nature 1962, 193, 1168–1169. [Google Scholar] [CrossRef]
  227. Ozsvath, I.; Schücking, E. Approaches to Gödel’s rotating universe. Class. Quantum Gravity 2001, 18, 2243. [Google Scholar] [CrossRef]
  228. Su, S.C.; Chu, M.C. Is the universe rotating? Astrophys. J. 2009, 703, 354. [Google Scholar] [CrossRef] [Green Version]
  229. Sivaram, C.; Arun, K. Primordial rotation of the universe, hydrodynamics, vortices and angular momenta of celestial objects. Open Astron. 2012, 5, 7–11. [Google Scholar] [CrossRef] [Green Version]
  230. Chechin, L. Rotation of the Universe at different cosmological epochs. Astron. Rep. 2016, 60, 535–541. [Google Scholar] [CrossRef]
  231. Chechin, L. Does the cosmological principle exist in the rotating Universe? Gravit. Cosmol. 2017, 23, 305–310. [Google Scholar] [CrossRef]
  232. Seshavatharam, U.; Lakshminarayana, S. An Integrated Model of a Light Speed Rotating Universe. Int. Astron. Astrophys. Res. J. 2020, 74–82. [Google Scholar]
  233. Campanelli, L. A conjecture on the neutrality of matter. Found. Phys. 2021, 51, 56. [Google Scholar] [CrossRef]
  234. Feng, B.; Zhang, X. Double inflation and the low CMB quadrupole. Phys. Lett. B 2003, 570, 145–150. [Google Scholar] [CrossRef] [Green Version]
  235. Kavya, N.; Venkatesha, V.; Mandal, S.; Sahoo, P. Constraining Anisotropic Cosmological Model in f( R , L m ) Gravity. Phys. Dark Universe 2022, 38, 101126. [Google Scholar] [CrossRef]
  236. Piao, Y.S.; Feng, B.; Zhang, X. Suppressing the CMB quadrupole with a bounce from the contracting phase to inflation. Phys. Rev. D 2004, 69, 103520. [Google Scholar] [CrossRef] [Green Version]
  237. Rodrigues, D.C. Anisotropic cosmological constant and the CMB quadrupole anomaly. Phys. Rev. D 2008, 77, 023534. [Google Scholar] [CrossRef] [Green Version]
  238. Beltran Jimenez, J.; Maroto, A.L. Cosmology with moving dark energy and the CMB quadrupole. Phys. Rev. D 2007, 76, 023003. [Google Scholar] [CrossRef] [Green Version]
  239. Piao, Y.S. Possible explanation to a low CMB quadrupole. Phys. Rev. D 2005, 71, 087301. [Google Scholar] [CrossRef] [Green Version]
  240. Bohmer, C.G.; Mota, D.F. CMB anisotropies and inflation from non-standard spinors. Phys. Lett. B 2008, 663, 168–171. [Google Scholar] [CrossRef] [Green Version]
Figure 1. Examples of original images (left), the radial intensity plots (center), and the peaks identified in the lines of the radial intensity plots (right). The direction of the lines generated by the peaks determines the direction of the galaxy arms.
Symmetry 15 01190 g001
Figure 2. Galaxies imaged by DECam and the same galaxies imaged by the Hubble Space Telescope. The spin direction is clear in the HST images, but it is not clear in the DECam images.
Symmetry 15 01190 g002
Figure 3. The RA distribution of the SDSS galaxies.
Symmetry 15 01190 g003
Figure 4. The H o computed when using the entire set and when limiting the dataset to supernovae in galaxies rotating in the same direction relative to the Milky Way and to supernovae in galaxies rotating in the opposite direction relative to the Milky Way. The error bars are the 3% errors. Due to the relatively small number of data points, this experiment does not necessarily provide a proof, and analysis with more data will be needed. However, these results are in agreement with the observations according to which the rotational velocity relative to the Milky Way can affect the apparent brightness of objects.
Symmetry 15 01190 g004
Table 1. The ( α , δ ) coordinates of the centered and the number of galaxies in each 60 × 60 field.
Field
Center
# Galaxies
( 192 , 27 ) 1,309,498
( 12 , 27 ) 6,376,803
( 102 , 0 ) 1,377,789
( 282 , 0 ) 1,266,036
Table 2. The g, r, and z magnitude and the number of clockwise and counterclockwise galaxies in the 60 × 60 field centered around the north galactic pole ( α = 192 , δ = 27 ) .
Band# cw# ccwMagMag Δ Mag t-Test p
GalaxiesGalaxiesccwcw
G20,91821,25320.06525 ± 0.01020.10073 ± 0.010−0.035480.01
R20,91721,25118.98522 ± 0.00819.01481 ± 0.008−0.029580.01
Z20,92521,26118.2934 ± 0.00718.31783 ± 0.007−0.024430.01
Table 3. The magnitude and number of clockwise and counterclockwise galaxies in the field centered around the south galactic pole ( α = 12 , δ = 27 ) .
Band# cw# ccwMeanMean Δ Mag t-Test p
GalaxiesGalaxiesMag ccwMag cw
G87,64089,53420.13622 ± 0.00420.11937 ± 0.0040.016850.003
R87,91789,84919.08793 ± 0.00319.07216 ± 0.0030.015740.0002
Z88,22890,14218.38424 ± 0.00318.37225 ± 0.0030.011990.0047
Table 4. The average magnitude of galaxies that rotate clockwise and galaxies that rotate counterclockwise in the 60 × 60 window centered around the control field of ( α = 102 , δ = 0 ) .
BandMagMag Δ Mag p
ccwcw
G20.16695 ± 0.00920.16628 ± 0.0090.0006690.96
R19.09924 ± 0.00719.10284 ± 0.007−0.003560.713
Z18.39402 ± 0.00618.39436 ± 0.006−0.000320.972
Table 5. The mean magnitude of clockwise and counterclockwise galaxies in the 60 × 60 window centered around the control field of ( α = 282 , δ = 0 ) .
BandMagMag Δ Mag p
ccwcw
G20.21329 ± 0.0120.22103 ± 0.01−0.00774 0.58
R19.0787 ± 0.00819.0869 ± 0.008−0.00820.47
Z18.37519 ± 0.00718.37565 ± 0.007−0.000450.96
Table 6. The g, r, and z exponential magnitudes of SDSS galaxies that spin with the Milky Way and galaxies that spin in the opposite direction compared to the Milky Way in the field centered around the north galactic pole.
BandMagMag Δ Mag p
cwccwt-Test
G17.7652 ± 0.00417.7558 ± 0.0040.00940.035
R17.0016 ± 0.00316.9922 ± 0.0030.00940.013
Z16.449 ± 0.00316.4357 ± 0.0030.01320.001
Table 7. The g, r, and z exponential magnitudes of mirrored SDSS galaxies that spin with the Milky Way and galaxies that spin in the opposite direction compared to the Milky Way in the field centered around the north galactic pole.
BandMagMag Δ Mag p
cwccwt-Test
G17.7576 ± 0.00417.762 ± 0.004−0.00440.21
R16.9936 ± 0.00317.0016 ± 0.003−0.0080.025
Z16.4357 ± 0.00316.4479 ± 0.003−0.01220.002
Table 8. The g, r, and z exponential magnitudes of SDSS galaxies annotated as spiral galaxies. The analysis is limited to galaxies in the 60 × 60 centered at the northern galactic pole.
BandMagMag Δ Mag p
cwccwt-Test
G17.7095 ± 0.00517.6948 ± 0.0050.01470.0376
R16.9893 ± 0.00416.9745 ± 0.0040.01480.0089
Z16.4564 ± 0.00416.4393 ± 0.0040.01710.0025
Table 9. The g, r, and z magnitudes of SDSS galaxies limited to z < 0.07 that spin in the opposite directions in the field centered around the north galactic pole.
BandMagMag Δ Mag p
cwccwt-Test
G16.9437 ± 0.00916.9192 ± 0.0090.02450.027
R16.4017 ± 0.00916.3723 ± 0.0090.02940.01
Z15.9827 ± 0.00915.9499 ± 0.0090.03280.005
Table 10. The g, r, and z exponential magnitudes of SDSS galaxies that spin in the opposite directions in a 60 × 60 degree window centered at the northern galactic pole.
BandMagMag Δ Mag p
cwccwt-Test
G17.3834 ± 0.01717.3382 ± 0.0170.04520.03
R16.8389  ± 0.01716.7934 ± 0.0170.04550.029
Z16.4071 ± 0.01816.3597 ± 0.0180.04740.0245
Table 11. The g, r, and z exponential magnitudes of SDSS galaxies annotated by Galaxy Zoo in the field centered around the north galactic pole.
BandMagMag Δ Mag p
cwccwt-Test
G16.9765 ± 0.0116.9579 ± 0.010.01860.09
R16.4129 ± 0.0116.3723 ± 0.010.04060.002
Z15.9817 ± 0.0115.9539 ± 0.010.02780.025
Table 12. The g, r, and z magnitudes of SDSS galaxies annotated as “superclean” by Galaxy Zoo in the field centered around the north galactic pole.
BandMagMag Δ Mag p
cwccwt-Test
G16.3496 ± 0.0316.3122 ± 0.030.03740.189
R15.7912 ± 0.0315.7443 ± 0.030.04680.135
Z15.377 ± 0.0315.3235 ± 0.030.05350.104
Table 13. The g, r, and z exponential magnitudes of Pan-STARRS galaxies around the southern galactic pole.
BandMagMagt-Test p
cwccw
G16.9066 ± 0.0216.9972 ± 0.020.0014
R16.3463 ± 0.0216.4226 ± 0.020.007
Z15.8408 ± 0.0215.9087 ± 0.020.0164
Table 14. The brightness of HST galaxies spinning in opposite directions in the COSMOS field.
BandMag cwMag ccw Δ Mag p (t-Test)
G23.131 ± 0.01923.077 ± 0.0190.0540.023
R22.266 ± 0.01922.218 ± 0.020.0480.045
Z21.358 ± 0.01721.323 ± 0.0180.0350.087
Table 15. The H o determined when using the full set, the H o determined when using a subset in which the host galaxies rotate in the same direction relative to the Milky Way, and the H o determined when using a subset in which the host galaxies rotate in the opposite direction.
Rotation Direction# H o 3% Error RangeSD
All9673.75870.193–77.4041.943
Same direction2269.04962.955–76.0053.42
Opposite direction3674.18268.758–79.9153.2
Disclaimer/Publisher’s Note: The statements, opinions and data contained in all publications are solely those of the individual author(s) and contributor(s) and not of MDPI and/or the editor(s). MDPI and/or the editor(s) disclaim responsibility for any injury to people or property resulting from any ideas, methods, instructions or products referred to in the content.

