Article

Statistical Modeling for Some Real Applications in Reliability Analysis Using Non-Parametric Hypothesis Testing

Department of Statistics and Operations Research, College of Science, King Saud University, P.O. Box 2455, Riyadh 11451, Saudi Arabia
Symmetry 2023, 15(9), 1735; https://doi.org/10.3390/sym15091735
Submission received: 5 August 2023 / Revised: 2 September 2023 / Accepted: 5 September 2023 / Published: 10 September 2023

Abstract

:
Probability life distributions usually describe the time to an event or survival time. Therefore, these life distributions play a crucial role in the analysis and projection of maximum life expectancy using the goodness of fit approach for nonparametric hypothesis testing. This study suggests a nonparametric technique to determine whether the data follow an exponential distribution or belong to the mathematical class of the moment generating function for used better than aged (UBAmgf). These tests can be applied to both censored and non-censored data. The upper percentile points of the test statistics are generated, and the suggested test’s asymptotic normality is established. Some well-known alternative asymmetric probability models are used to compute the Pitman asymptotic relative efficiency (PARE) and powers of the proposed test. To demonstrate the paper’s conclusions, some asymmetric real-world datasets are examined.

1. Introduction

The stochastic comparison of probability distributions, symmetry, and asymmetry are significant principles in probability, statistics, and various associated fields, such as economics, survival analysis, and reliability theory. In reliability analysis, both symmetry and asymmetry are crucial. In general, symmetrical data have an identifiable trend and are simpler to predict than asymmetrical data. Asymmetry assists in locating outliers or anomalies that should be taken into account in the predictive model, whereas symmetry helps uncover patterns within the data that may be used in predictive models. Over the past few decades, this technique has been used to test exponentiality. Patient survival times are noted after implementing the advised strategy. In this investigation, the behavior of the observed data was assessed, assuming the used is better than aged in the moment generating function ordered (UBAmgf) attribute or the constant failure rate (exponential scenario). The most well-known classes proposed over the past few decades include increasing failure rate and average (IFR and IFRA), new better than used and expectation (NBU and NBUE), used is better than aged (UBA), and used better than aged in moment generating function (UBAmgf). One might consult Deshpand et al. [1], Klefsjo [2], Ahmed [3,4], Bakr et al. [5], Barlow and Proschan [6], Rolski [7], Abu Youssef et al. [8], Etman et al. [9], EL-Sagheer et al. [10], Abu Youssef et al. [11], Bakr et al. [12], EL-Sagheer et al. [13], Mahmoud et al. [14], Gadallah et al. [15], and Bakr and Al Babtain [16].
The development of a systematic approach for the investigation of any event or activity taking place in the world was necessitated by the fundamental requirements of modern science and technology. Therefore, a technique like this would be required for examining the dependability of technological systems and products. In real life, there are times when the manufacturer’s warranty expires, and the system’s components gradually deteriorate over time, necessitating the replacement of spare parts in order to extend its functionality. In such cases, the process of renewal attempts to enhance the usability of the system without being able to return the system to its previous state.
We found that nonparametric tests of life distribution are not very effective and have a low power of test. As a result, we have developed a statistical nonparametric hypothesis test (goodness of fit) for the class of life distribution considered in this work, taking into account the efficiency and power of the test.
In reliability studies, specific classes of life distributions and their variants have been introduced. These classes of life distributions are used in engineering, social science, biological science, and maintenance. Statisticians and reliability analysts have demonstrated an increasing interest in modeling survival data using life distribution classifications that are based on aging-related characteristics. Concepts of aging explain how a population of units or systems gets better or worse as they get older. In the literature, statistical ordering is used to categorize and characterize several classes of life distributions.
If X and Y   are two random variables with survivals F ¯ and G ¯ , respectively, then we say that X is smaller than Y in the moment generating function order (   X m g f   Y ), if M X s M Y s ,   f o r   a l l   s > 0 , where
M X s = 0 e s x d F ( x ) ,   a n d   M Y s = 0 e s y d F ( Y ) ,
so that
0 e s x d F ( x ) 0 e s y d G Y , s > 0 .
See Deshpande et al. [1], Kaur et al. [17], and Klar and MÄuller [18] for more details.
Definition 1.
The distribution function  F  is said to be
i
increasing failure rate (IFR), if
F ¯ ( x + t ) F ¯ ( t ) i s   i n c r e a s i n g   i n   t 0   f o r   a l l   x 0 ,
or
F ¯ 2 x + y 2 F ¯ x F ¯ y , f o r   a l l   x , y 0 .
ii
New better than used (NBU), if
F ¯ t F ¯ x F ¯ t + x , f o r   a l l   t , x 0 .
iii
Used better than aged (UBA) for all   x , t 0 , and if  0 < μ < , (See Ahmed [4])
F ¯ t e x / μ ( ) F ¯ x + t ,   x , t 0
where
F ¯ t x = F ¯ ( x + t ) F ¯ ( t ) , F ¯ t > 0 ,
and
μ = 0 F ¯ u d u , μ t = E X t = t F ¯ u d u F ¯ t ,
μ = lim t μ ( t ) = 1 h ( ) ,   h t = d d t ln F ¯ t = f t F ¯ t ,   t 0 ,   F ¯ t > 0
iv
Used better than aged in expectation (UBAE), if
μ t μ ,   x , t 0 .
For more details about these classes, see Bryson and Siddiqui [18], Marshall and Proschan [19], and Shaked and Shanthikumar [20].
The UBAmgf class is one of the most often utilized classes. It is described by Abu-Yossuf et al. [8] as a massive class of life distribution that incorporates all previously established classes, such as IFR, decreasing mean residual life (DMRL), and UBA. Klefsjo [2], Mahmoud and Diab [21], and Ghosh and Mitra [22] have since researched UBA from a variety of perspectives.
Definition 2.
The distribution function  F  is said to be UBAmgf, if for all    x , t 0  and  0 < μ < :
0 e s x F ¯ ( x + t ) d x μ 1 s μ F ¯ t , s > 0 .
It is equivalent to X t m g f X A for all t ≥ 0.
Now,
X s t X A X m g f X A .
It is obvious that I F R U B A U B A m g f .
Testing exponentiality concerns against several types of aging class life distributions have been explored by statisticians and reliability analysts from diverse perspectives; for example, see Mahmoud et al. [23], Navarro and Pellerey [24], Mahmoud El-Morshedy [25], and Navarro [26], among others. Several authors, including Mahmoud and Abdul Alim [27], Abu-Youssef and Gerges [28], and Abu-Youssef and El-Toony [29] have examined testing exponentiality using the goodness of fit approach.
The objective of this paper is to propose a nonparametric test statistic for both complete and censored data based on the goodness of fit approach for testing H 0 : data is exponential against H 1 : data is UBAmgf. The performance of the test statistic was evaluated based on the Pitman asymptotic relative efficiency (PARE) and empirical power of the test. Commonly used alternative distributions were also used.
The organization of this paper is as follows: The test statistic for complete data, along with PARE, the power of the test, and its real-life application, will be discussed in Section 2. The test statistic for censored data, along with the power of the test and its real-life application, will be proposed in Section 3. Finally, we provide a conclusion in Section 4.

2. Testing Exponentiality

We establish a measure of departure from exponentiality in the direction of the UBAmgf class.

2.1. Complete Data

Consider F x = 1 e β x   f o r   β , x > 0 as the class of exponential distribution function. We test H 0 : F is exponential against H 1 : F is UBAmgf not exponential.
The measure of deviation is derived from the following lemma.
Lemma 1.
δ s = E 1 s μ e s x 1 s ( 1 + μ ) 1 e x ,   s 0
Proof. 
Let δ s be written as follows:
δ s = 0 0 e s x F ¯ x + t d x μ 1 s μ F ¯ t d F 0 t .
Since the measurement is scale invariant, we consider μ = 1 and take F 0 x = 1 e x ,   x 0 ,   φ s = 0 e s x d F x , which is affected by e s x , and perform the integration as follows:
δ s = 0 0 e t + s u F ¯ u + t d u d t 1 1 s 0 F ¯ t e t d t = I 1 I 2 .
where
I 1 = 0 0 e s u F ¯ u + t e t d u d t = 0 t e s ( t x ) F ¯ x e t d x d t = 1 s 0 e s t 1 F ¯ t e t d t = 1 s ( 1 + s ) φ s 1 s ( 1 φ 1 ) .
and
I 2 = 1 1 s 0 F ¯ t d F 0 t = 1 1 s ( 1 φ 1 ) .
Therefore, the result was proved. □
The empirical estimator δ ^ n ( s ) based on X 1 , X 2 , , X n ( R a n d o m   v a r i a b l e s ) may be written as:
δ ^ n ( s ) = 1 1 + s n i 1 s e s x 1 2 s 1 e x .
So, δ ^ n ( s ) can be obtained as
δ ^ n ( s ) = 1 ( 1 + s ) n j X i ,
where
X i = 1 s e s x i 1 2 s 1 e x i .
Set
X = 1 s e s x 1 2 s 1 e x .
The asymptotic normality is derived from the following theorem.
Theorem 1.
As  n , ( δ ^ n ( s ) δ ( s ) )  is asymptotically normal with zero mean and  σ 2  given in (2); under  H 0 the variance reduces to (3).
Proof. 
Considering Lee [30], we calculate the following using the Wolfram Mathematica program, version 10:
E X = E 1 s e s x 1 2 s 1 e x , σ 2 = E 1 s e s x 1 2 s 1 e x 2 .  
One may demonstrate that the variance under H 0 is
σ 0 2 s = 2 s 2 ( 1 + s ) 2 3 ( 2 + s ) ( 1 + 2 s ) , R e s < 1 2 .

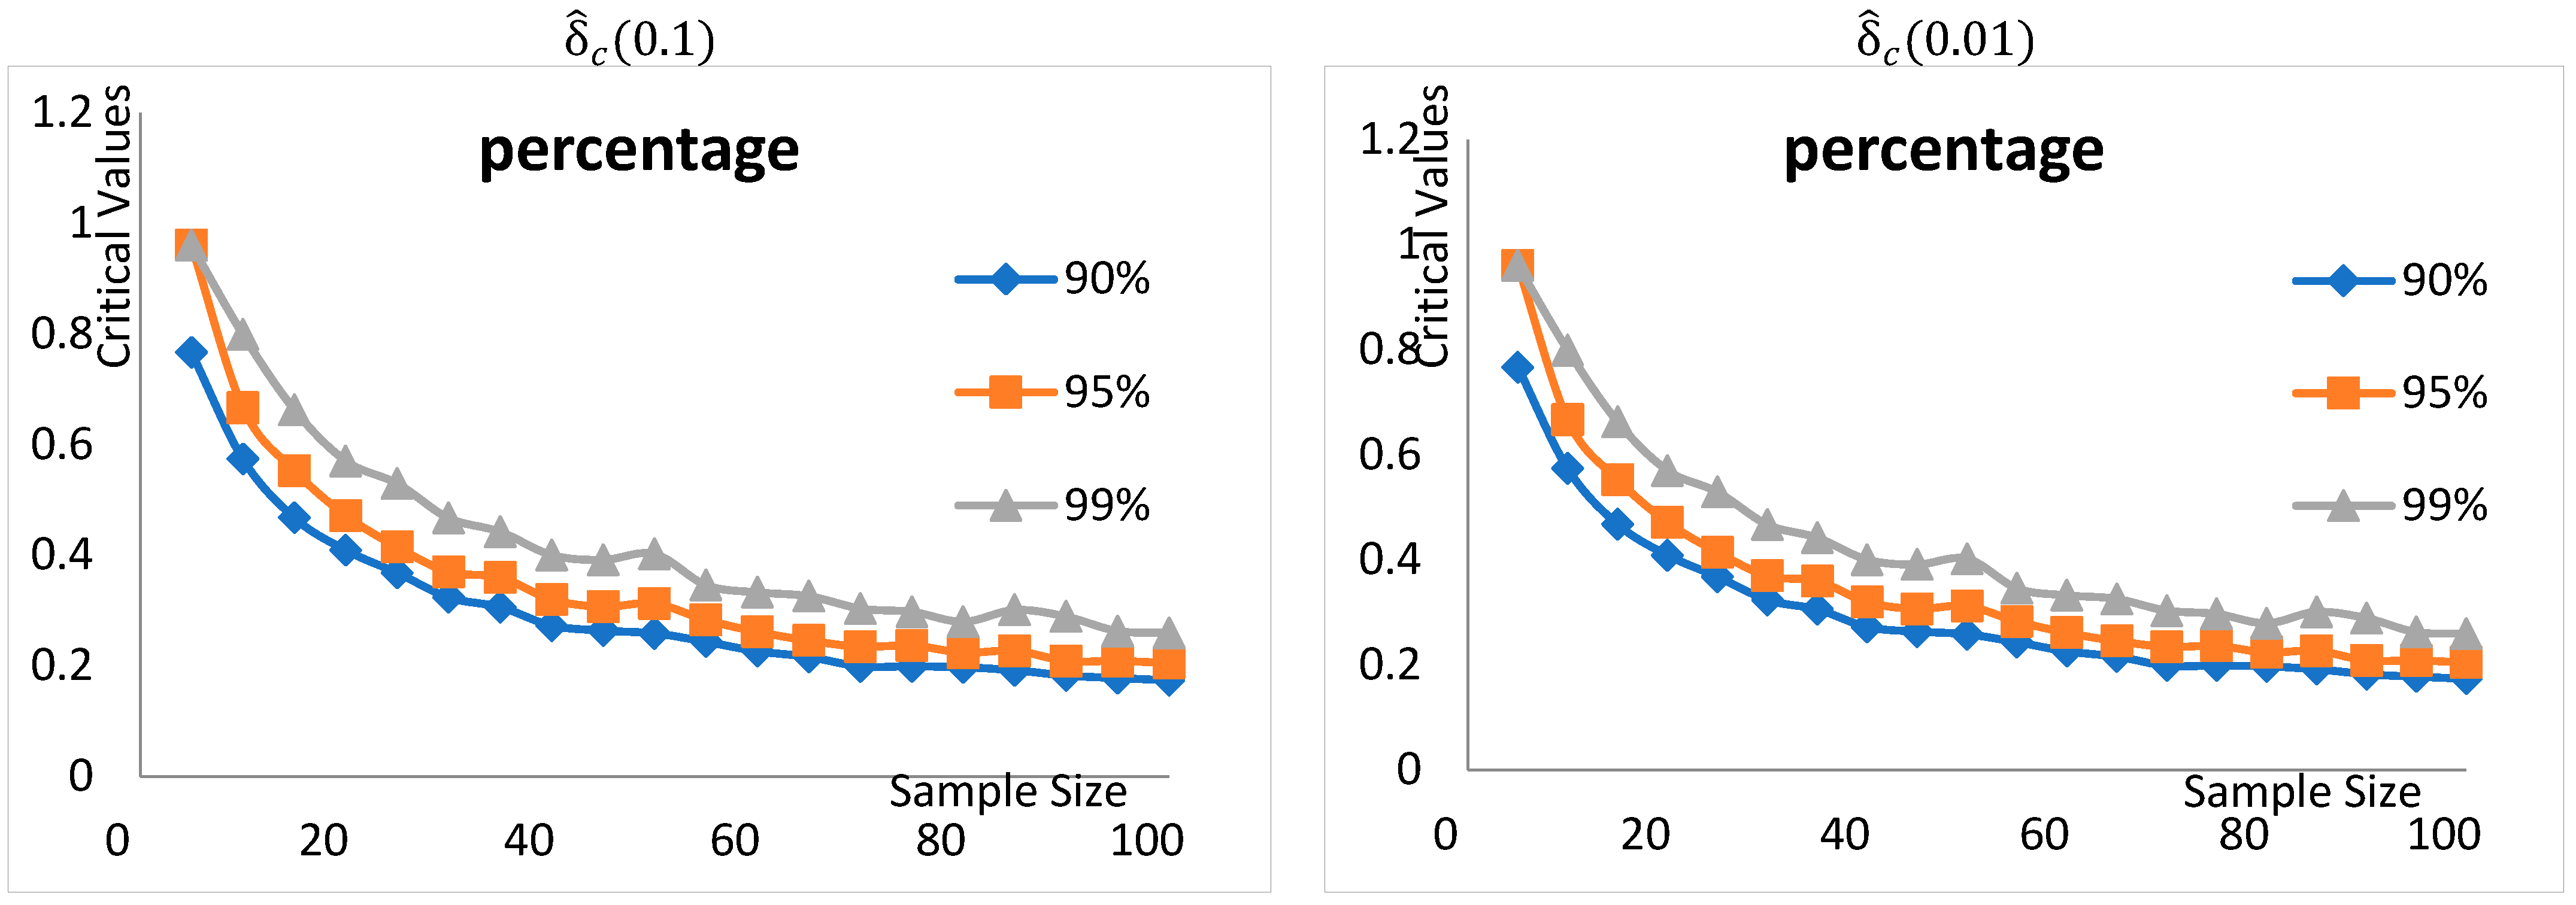
2.2. Critical Values

In this subsection, we obtained the upper percentiles of δ ^ n s , as in Table 1 using the Wolfram Mathematica program, version 10.
Table 1 and Figure 1 show that the critical values behave well. Furthermore, the asymptotic normality of our test improves as s decreases.

2.3. Relative Efficiency

Pitman asymptotic efficiencies (PAEs) were investigated for δ ( s ) and examined with a variety of other tests for some distributions to evaluate the efficacy of this approach.
P A E δ = θ δ θ θ 0 σ 0 = 1 σ 0 1 s 1 + s 0 e s x F ¯ θ 0 x d x + 2 s 1 + s 0 F ¯ θ 0 x d x ,
where F ¯ θ 0 x = d d θ F ¯ θ ( u ) θ θ 0 .
Popular alternate distributions at θ = 0 , 0 , 1 respectively.
i.
LFR:
F ¯ 1 x = e x x 2 2 θ , θ , x 0 .
ii.
Makeham distribution (MD):
F ¯ 3 x = e θ ( e x + x 1 ) x , θ , x 0 .
iii.
Weibull distribution (WD):
F ¯ 2 x = e x θ , θ 1 , x 0 .
A comparison of our test δ ^ n s   to those of ( δ n ( 5 ) ) from Ahmed et al. [31] and ( δ U 2 L ) from Abu-Youssef and El-Toony [29] is proposed in Table 2 for selected values of s.
From Table 2, we conclude that our statistic δ ^ n ( s ) performs well for LFR, Makeham, and Weibull distributions and is more efficient than the other statistics.

2.4. Empirical Power for Different Alternatives

For the test to be sensitive to a divergence from exponentiality towards the UBAmgf class, the power of the test statistics must be estimated. The test statistic’s ability to detect this variation is improved by larger power estimates. Table 3 shows the test statistics’ power at α = 0.05 for the LFR, Gamma, and Weibull alternatives, using the Wolfram Mathematica program, version 10.
According to Table 3, our test yields optimal power for the LFR and Gamma families and good power for the Weibull family. The empirical powers increase as the sample size and the value of θ increase. The powers become stronger as the families deviate further from the exponential distribution.

2.5. Applications for Complete Data

In Table 4, we demonstrate the applicability of the findings of the study to specific real-world datasets.
  • Data # 1: The test statistic from Table 5 was applied to the leukemia dataset and compared with the critical value from Table 1. A total of 40 patients with blood cancer (leukemia) from one of the Saudi Arabian Ministry of Health hospitals are represented by this statistic, which shows their ages (in years). The exponentiality of the null hypothesis is not rejected by our test for any value of s.
  • Data # 2: The test statistic from Table 5 was applied to the lung cancer dataset and compared with the critical value from Table 1. The exponentiality of the null hypothesis is rejected by our test for any value of s.
  • Data # 3: The test statistic from Table 5 was applied to the COVID-19 dataset and compared with the critical value from Table 1. The exponentiality of the null hypothesis is rejected by our test for any value of s.

3. Censored Data

Censored data or censored observations are results obtained from subjects who are no longer approachable after a research period. Particular patients in particular professions, such as the biological sciences, may still be alive or disease-free at the end of the study because it is unclear when survival or the end of the illness will occur.

3.1. Right-Censored Data Testing

Here, a test statistic is suggested to compare H 0 and H 1 using right-censored data. Suppose n components are put on test, and X 1 , X 2 , , X n denote their complete lifetime. (See the critical values in Table 6 calculated using the Wolfram Mathematica program, version 10).
Using the Kaplan and Meier estimator in the case of censored data, the measure of deviation δ c s   from H 0 in comparison to H 1 is provided as follows:
δ c s = 1 n ( 1 + s ) 1 s ( θ 1 ) 2 s η 1
where
θ s = 0 e s x d F x ,
θ ^ s = m = 1 l e s Z m ( p = 1 m 2 C p δ p p = 1 m 1 C p δ p ) ,   η = θ ^ 1 ,
d F n Z i = q = 1 j 2 C i δ i q = 1 j 1 C i δ i ,
F ¯ n t = m < t C m δ m ,
C m = n m n m + 1   ,   t 0 ,   z m .
Table 6 and Figure 2 show that the critical values behave well. Furthermore, the asymptotic normality of our test improves as s decreases.

3.2. Power Estimates

Table 7 shows the power of our test once again for censored data, specifically for the LFR and Weibull distributions.
The simulation studies clearly indicate that the test exhibits high power for both distributions.

3.3. Applications

To apply our test statistic in (4), we considered the dataset in Table 4, which describes the survival periods, in weeks, of 61 patients with incurable lung cancer treated with cyclophosphamide. The patients whose treatment was discontinued due to a deteriorating condition are represented by 33 uncensored observations and 28 censored observations.
We calculated the statistic in (4) for both cases of s = 0.1   a n d   s = 0.01 , and δ c for the two cases are negative values as n = 61, which are both (0.37 and 0.27) greater than the critical value in Table 6. As a result, the exponentiality null hypothesis is rejected using our test for any value of s.

4. Conclusions

Exponential distribution is one of the most important continuous distributions in statistics. It has been used widely in reliability theory, life testing, and stochastic processes due to its memoryless property. Therefore, it is of great interest to determine whether a random sample follows an exponential distribution or not. In this paper, we proposed nonparametric tests for testing whether the data follow an exponential distribution against the data is (UBAmgf). Based on our studies, we were able to determine if the recommended treatments had a positive or negative impact on patients through their survival times (discussed in the Applications section). We considered both complete and censored data. The asymptotic normality of the proposed test was established and, using a Monte Carlo simulation study, the upper percentile points of the test statistics were obtained. The Pitman asymptotic relative efficiencies (PAEs) and power of the proposed test were calculated for LFR, Gamma, and Weibull distributions. Real-life datasets were analyzed to illustrate the findings of this paper.

Funding

The authors would like to express their gratitude to the Deputyship for Research and Innovation, Ministry of Education in Saudi Arabia for funding this research work through the project no. (IFKSUOR3–058–3).

Data Availability Statement

The data are contained within the paper.

Acknowledgments

The authors extend their appreciation to the Deputyship for Research and Innovation, Ministry of Education in Saudi Arabia for funding this research work through the project no. (IFKSUOR3–058–3).

Conflicts of Interest

The author declares that there is no conflict of interest.

Abbreviations

IFRIncreasing failure rate.
IFRAIncreasing failure rate average.
NBUNew better than used.
NBUENew better than used in expectation.
NBRULNew better than renewal used in Laplace transform ordering.
NBUCLNew better (worse) than used in a convex Laplace ordering.
DMRLDecreasing mean residual life.
UBAUsed better than age.
UBACUsed better than age in convex order.
UBAC (2)Used better than age in concave order.
UBALUsed better than age in Laplace transform.
UBAmgfUsed better than age in moment generating function.
mgfmoment generating function.

References

  1. Deshpande, J.V.; Kochar, S.C.; Singh, H. Aspects of positive aging. J. Appl. Probab. 1986, 23, 748–758. [Google Scholar] [CrossRef]
  2. Klefsjo, B. The HNBUE and HNWUE classes of life distribution. Nav. Res. Logist. Q. 1982, 29, 331–344. [Google Scholar] [CrossRef]
  3. Ahmad, I.A. Moments inequalities of aging families with hypotheses testing applications. J. Stat. Plan. Inference 2001, 92, 121–132. [Google Scholar] [CrossRef]
  4. Ahmad, I.A. Some properties of classes of life distributions with unknown age. Stat. Probab. Lett. 2004, 9, 333–342. [Google Scholar] [CrossRef]
  5. Bakr, M.E.; Al-Babtain, A.A.; Khosa, S.K. Statistical Modeling of Some Cancerous Diseases Using the Laplace Transform Approach of Basic Life Testing Issues. Comput. Math. Methods Med. 2022, 2022, 8964869. [Google Scholar] [CrossRef]
  6. Barlow, R.E.; Proschan, F. Statistical Theory of Reliability and Life Testing. Probability Models; To Begin With: Silver Spring, MD, USA, 1981. [Google Scholar]
  7. Rolski, T. Mean residual life. Bull. Int. Stat. Inst. 1975, 4, 266–270. [Google Scholar]
  8. Abu-Youssef, S.E.; Ali, N.S.A.; Bakr, M.E. Used Better than Aged in mgf Ordering Class of Life Distribution with Application of Hypothesis Testing. J. Stat. Appl. Probab. Lett. 2020, 7, 27–32. [Google Scholar]
  9. Etman, W.B.H.; EL-Sagheer, R.M.; Abu-Youssef, S.E.; Sadek, A. On some characterizations to NBRULC class with hypotheses testing application. Appl. Math. Inf. Sci. 2022, 16, 139–148. [Google Scholar]
  10. EL-Sagheer, R.M.; Eliwa, M.S.; Alqahtani, K.M.; EL-Morshedy, M. Asymmetric randomly censored mortality distribution: Bayesian framework and parametric bootstrap with application to COVID-19 data. J. Math. 2022, 2022, 8300753. [Google Scholar] [CrossRef]
  11. Abu-Youssef, S.E.; Ali, N.S.A.; Bakr, M.E. Non-parametric testing for unknown age (UBAL) class of life distribution. J. Test. Eval. 2019, 48, 1–13. [Google Scholar]
  12. Bakr, M.E.; Nagy, M.; Al-Babtain, A.A. Non-parametric hypothesis testing to model some cancers based on goodness of fit. AIMS Math. 2022, 7, 13733–13745. [Google Scholar] [CrossRef]
  13. EL-Sagheer, R.M.; Mahmoud, M.A.W.; Etman, W.B.H. Characterizations and testing hypotheses for NBRUL-to class of life distributions. J. Stat. Theory Pract. 2022, 16, 31–44. [Google Scholar] [CrossRef]
  14. Mahmoud, M.A.W.; EL-Sagheer, R.M.; Etman, W.B.H. Moments inequalities for NBRUL distributions with hypotheses testing applications. Austrian J. Stat. 2018, 47, 95–104. [Google Scholar]
  15. Bakr, M.E.; Al-Babtain, A. Non-Parametric Hypothesis Testing for Unknown Aged Class of Life Distribution Using Real Medical Data. Axioms 2023, 12, 369. [Google Scholar] [CrossRef]
  16. Kaur, A.; Prakasarao, B.L.S.; Singh, H. Testing for second order stochastic dominance of two distributions. Econ. Theory 1994, 10, 849–866. [Google Scholar] [CrossRef]
  17. Klar, B.; MÄuller, A. Characterizations of classes of lifetime distributions generalizing the NBUE class. J. Appl. Prob. 2003, 40, 20–32. [Google Scholar] [CrossRef]
  18. Bryson, M.C.; Siddiqui, M.M. Some criteria for aging. J. Am. Statist. Assoc. 1969, 64, 1472–1483. [Google Scholar] [CrossRef]
  19. Marshall, A.W.; Proschan, F. Classes of life distributions applicable in replacement with renewal theory implications. Sixth Berkeley Symp. Math. Stat. Probab. 1972, 1, 395–415. [Google Scholar]
  20. Shaked, M.; Shanthikumar, J.G. Stochastic Orders and Their Applications; Academic Press: New York, NY, USA, 1994. [Google Scholar]
  21. Mahmoud, M.A.W.; Diab, L.S. On testing exponentiality against HNRBUE based on a goodness of fit. Int. J. Rel. Appl. 2007, 8, 27–93. [Google Scholar]
  22. Ghosh, S.; Mitra, M. A new test for exponentiality against HNBUE alternatives. Commun. Stat. Theor. Meth. 2020, 49, 27–43. [Google Scholar] [CrossRef]
  23. Mahmoud, M.A.W.; Hassan, E.M.A.; Gadallah, A.M. On NRBUL Class of Life Distributions. J. Egypt. Math. Soc. 2018, 26, 483–490. [Google Scholar] [CrossRef]
  24. Navarro, J.; Pellerey, F. Preservation of ILR and IFR aging classes in sums of dependent random variables. Appl. Stoch. Models Bus. Ind. 2022, 38, 240–261. [Google Scholar] [CrossRef]
  25. El-Morshedy, M.; Al-Bossly, A.; El-Sagheer, R.M.; Almohaimeed, B.; Etman, W.B.H.; Eliwa, M.S. A Moment Inequality for the NBRULC Class: Statistical Properties with Applications to Model Asymmetric Data. Symmetry 2022, 14, 2353. [Google Scholar] [CrossRef]
  26. Navarro, J. Preservation of DMRL and IMRL aging classes under the formation of order statistics and coherent systems. Stat. Probab. Lett. 2018, 137, 264–268. [Google Scholar] [CrossRef]
  27. Mahmoud, M.A.W.; Abdul Alim, A.N. A Goodness of Fit Approach to for Testing NBUFR (NWUFR) and NBAFR (NWAFR) Properties. Int. J. Reliab. Appl. 2008, 9, 125–140. [Google Scholar]
  28. Abu-Youssef, S.E.; Gerges, S.T. Based on the goodness of fit approach, a new test statistic for testing NBUCmgf class of life distributions. Pak. J. Statist. 2022, 38, 129–144. [Google Scholar]
  29. Abu-Youssef, S.E.; El-Toony, A.A. A New Class of Life Distribution based on Laplace Transform and It’s Applications. Inf. Sci. Lett. 2022, 11, 355–362. [Google Scholar]
  30. Lee, A.J. U-Statistics Theory and Practice; Marcel Dekker, Inc.: New York, NY, USA, 1990. [Google Scholar]
  31. Ahmad, I.A.; Alwasel, I.A.; Mugdadi, A.R. A goodness of fit approach to major life testing problems. Int. J. Reliab. Appl. 2001, 2, 81–97. [Google Scholar]
  32. Jamal, F.; Reyad, H.; Chesneau, C.; Nasir, M.A.; Othman, S. The Marshall-Olkin odd Lindley-G family of distributions: Theory and applications. Punjab Univ. J. Math. 2020, 51, 111–125. [Google Scholar]
  33. Almetwally, E.M.; Alharbi, R.; Alnagar, D.; Hafez, E.H. A new inverted toppleone distribution: Applications to the COVID-19 mortality rate in two different countries. Axioms 2021, 10, 25. [Google Scholar] [CrossRef]
  34. Abbas, K.; Hussain, Z.; Rashid, N.; Ali, A.; Taj, M.; Khan, S.A.; Manzoor, S.; Khalil, U.; Khan, D.M. Bayesian Estimation of Gumbel Type-II Distribution under Type-II Censoring with Medical Applications. J. Comput. Math. Methods Med. 2020, 7, 1876073. [Google Scholar] [CrossRef]
Figure 1. The relationship between critical values and sample size.
Symmetry 15 01735 g001
Figure 2. The relationship between critical values and sample size.
Symmetry 15 01735 g002
Table 1. Critical values of δ ^ n s used to produce an exponential distribution-based 10,000-sample simulated sample.
δ ^ n ( 0.1 ) δ ^ n ( 0.01 )
n90%95%99%90%95%99%
50.02695680.03760370.05831090.002291310.0030890.0044668
100.0220750.03005240.04624160.001808290.002395560.0034263
150.02015120.02648410.04058750.001588650.002096560.00300109
200.01758850.02336250.03441350.001397080.001811390.0026182
250.01575620.02161150.03192830.00128240.0016803100239751
300.01450930.01953680.02939870.001203510.001541230.00212703
350.01361820.01804980.02664190.001114290.001461950.00205294
400.01310650.0171010.02487280.001038910.001354360.00188826
450.01270.01687350.02443850.001003980.001299050.00185749
500.01183130.01564810.02328320.0009797580.001284910.00178655
550.01145890.01522710.0218650.000920960.001169870.00166315
600.01113490.01454450.02101730.0008976310.001146250.00160462
650.01044270.01394710.02023930.000869860.001115670.00154781
700.01053060.01378650.01958620.0008296010.001082860.00153534
750.009724760.0128780.01927120.0007971390.001045520.00148272
800.009497360.01249920.01827690.0007736350.0009890830.0014461
850.009394240.0123630.01797130.0007597790.0009811240.00137304
900.009098390.01206640.01743250.0007248140.0009389910.00134655
950.008930480.01177640.01706830.0007237730.000923580.00129325
1000.008788760.01137280.01670650.0007011530.0009161340.00129516
Table 2. Selected values of s.
Distribution δ n ( 5 ) δ U 2 L δ ^ n ( s )
S = 0.01S = 0.1
LFR1.14561.31.351.30
Makeham0.54550.580.8030.86
Weibull_____0.7910.990.97
Table 3. Empirical powers at α = 0.05 with 10,000 replications.
Distributionn
θ = 1
θ = 2
θ = 3
LFR100.995811
20111
30111
Gamma10111
20111
30111
Weibull100.5670.9931
200.56811
300.57311
Table 4. Some actual biological datasets.
Dataset No.ObservationsSource
10.019, 0.129, 0.159, 0.203, 0.485, 0.636, 0.748, 0.781, 0.869, 1.175, 1.206, 1.219, 1.219, 1.282, 1.356, 1.362, 1.458, 1.564, 1.586, 1.592, 1.781, 1.923, 1.959, 2.134, 2.413, 2.466, 2.548, 2.652, 2.951, 3.038, 3.6, 3.655, 3.745, 4.203, 4.690, 4.888, 5.143, 5.167, 5.603, 5.633, 6.192, 6.655, 6.874Bakr et al. [5]
21.1, 1.4, 1.3, 1.7, 1.9, 1.8, 1.6, 2.2, 1.7, 2.7, 4.1, 1.8, 1.5, 1.2, 1.4, 3.0, 1.7, 2.3, 1.6, 2.0Jamal et al. [32]
33.1091, 3.3825, 3.1444, 3.2135, 2.4946, 3.5146, 4.9274, 3.3769, 6.8686, 3.0914, 4.9378, 3.1091, 3.2823, 3.8594, 4.0480, 4.1685, 3.6426, 3.2110, 2.8636, 3.2218, 2.9078, 3.6346, 2.7957, 4.2781, 4.2202, 1.5157, 2.6029, 3.3592, 2.8349, 3.1348, 2.5261, 1.5806, 2.7704, 2.1901, 2.4141, 1.9048Almetwally et al. [33]
4Censored observations:
0.57, 1.86, 3.00, 3.00, 0.14, 0.14, 0.29, 0.43, 0.57, 3.29, 3.29, 6.00 6.00, 6.14, 8.71, 10.57, 11.86, 15.57, 16.57, 27.57, 32.14, 33.14, 47.29, 17.29, 18.71, 21.29, 23.86, 26.00
Kamran Abbas et al. [34]
Uncensored:
0.43, 2.86, 3.14, 3.14, 3.43, 3.43, 3.71, 3.86, 6.14, 6.86, 9.00, 9.43 10.71, 10.86, 11.14, 13.00, 14.43, 15.71, 18.43, 18.57, 20.71, 29.14, 29.71, 40.57, 48.57, 49.43, 53.86, 61.86, 66.57, 68.71, 68.96, 72.86, 72.86.
Table 5. Detailed statistics for datasets.
s = 0.1 s = 0.01
Data # 1 δ ^ n s = 0.16 δ ^ n s = 0.013
Data # 2 δ ^ n s = 0.026 δ ^ n s = 0.0025
Data # 3 δ ^ n s = 0.17 δ ^ n s = 0.014
Table 6. Critical values of the upper percentile for δ ^ c .
δ ^ c ; s = 0.1 δ ^ c ; s = 0.01
n90%95%99%90%95%99%
50.4980880.6363640.6363640.7666280.9603960.960396
100.3361340.3824730.5173960.5738760.6666840.799073
150.2654390.3232310.4304040.4676420.552970.662725
200.2085520.2751790.3568350.4087770.4714590.570148
250.1659840.2068250.2908940.3677480.4146110.529359
300.1526460.1967520.2778190.3237650.3697650.467179
350.1242090.1631550.2404930.3059780.359760.442183
400.1015620.1433980.2140790.2724520.3196950.400209
450.08499520.1233470.1975540.2635580.3068320.391493
500.08876080.1402630.2025610.2584780.3122310.402083
550.07199560.1092070.1992410.2435160.2827150.345942
600.06420980.1003450.1687290.2261440.2613910.332767
650.05393720.08983830.1627770.2160270.2456220.325733
700.04125810.08088660.1490230.1989310.2345240.303373
750.03591890.06826740.1278370.1989210.2364630.297495
800.03300020.06355180.1193550.1973490.2239040.279493
850.03106880.06568150.1200760.1918550.2270.300977
900.02434090.05420470.1079650.1824720.2087440.288981
950.01821630.04971250.1115210.177740.2086660.262691
1000.005991880.03718240.08245090.1738080.2050470.259568
Table 7. Estimates of powers at α = 0.05 with 10,000 replications.
Distributionn
θ = 1
θ = 2
θ = 3
LFR100.9560.960.971
200.9830.9910.999
300.9910.9921
Weibull10111
20111
30111
Disclaimer/Publisher’s Note: The statements, opinions and data contained in all publications are solely those of the individual author(s) and contributor(s) and not of MDPI and/or the editor(s). MDPI and/or the editor(s) disclaim responsibility for any injury to people or property resulting from any ideas, methods, instructions or products referred to in the content.

