
Numerical Analysis of the Shape Effect on the Mechanical Behaviors of Rocks in True 3D Compression Test

Abstract
:1. Introduction
2. Material and Methods
3. Results
3.1. The Influence of the End Effect on the Shape Effect
3.2. The Influence of on the Shape Effect
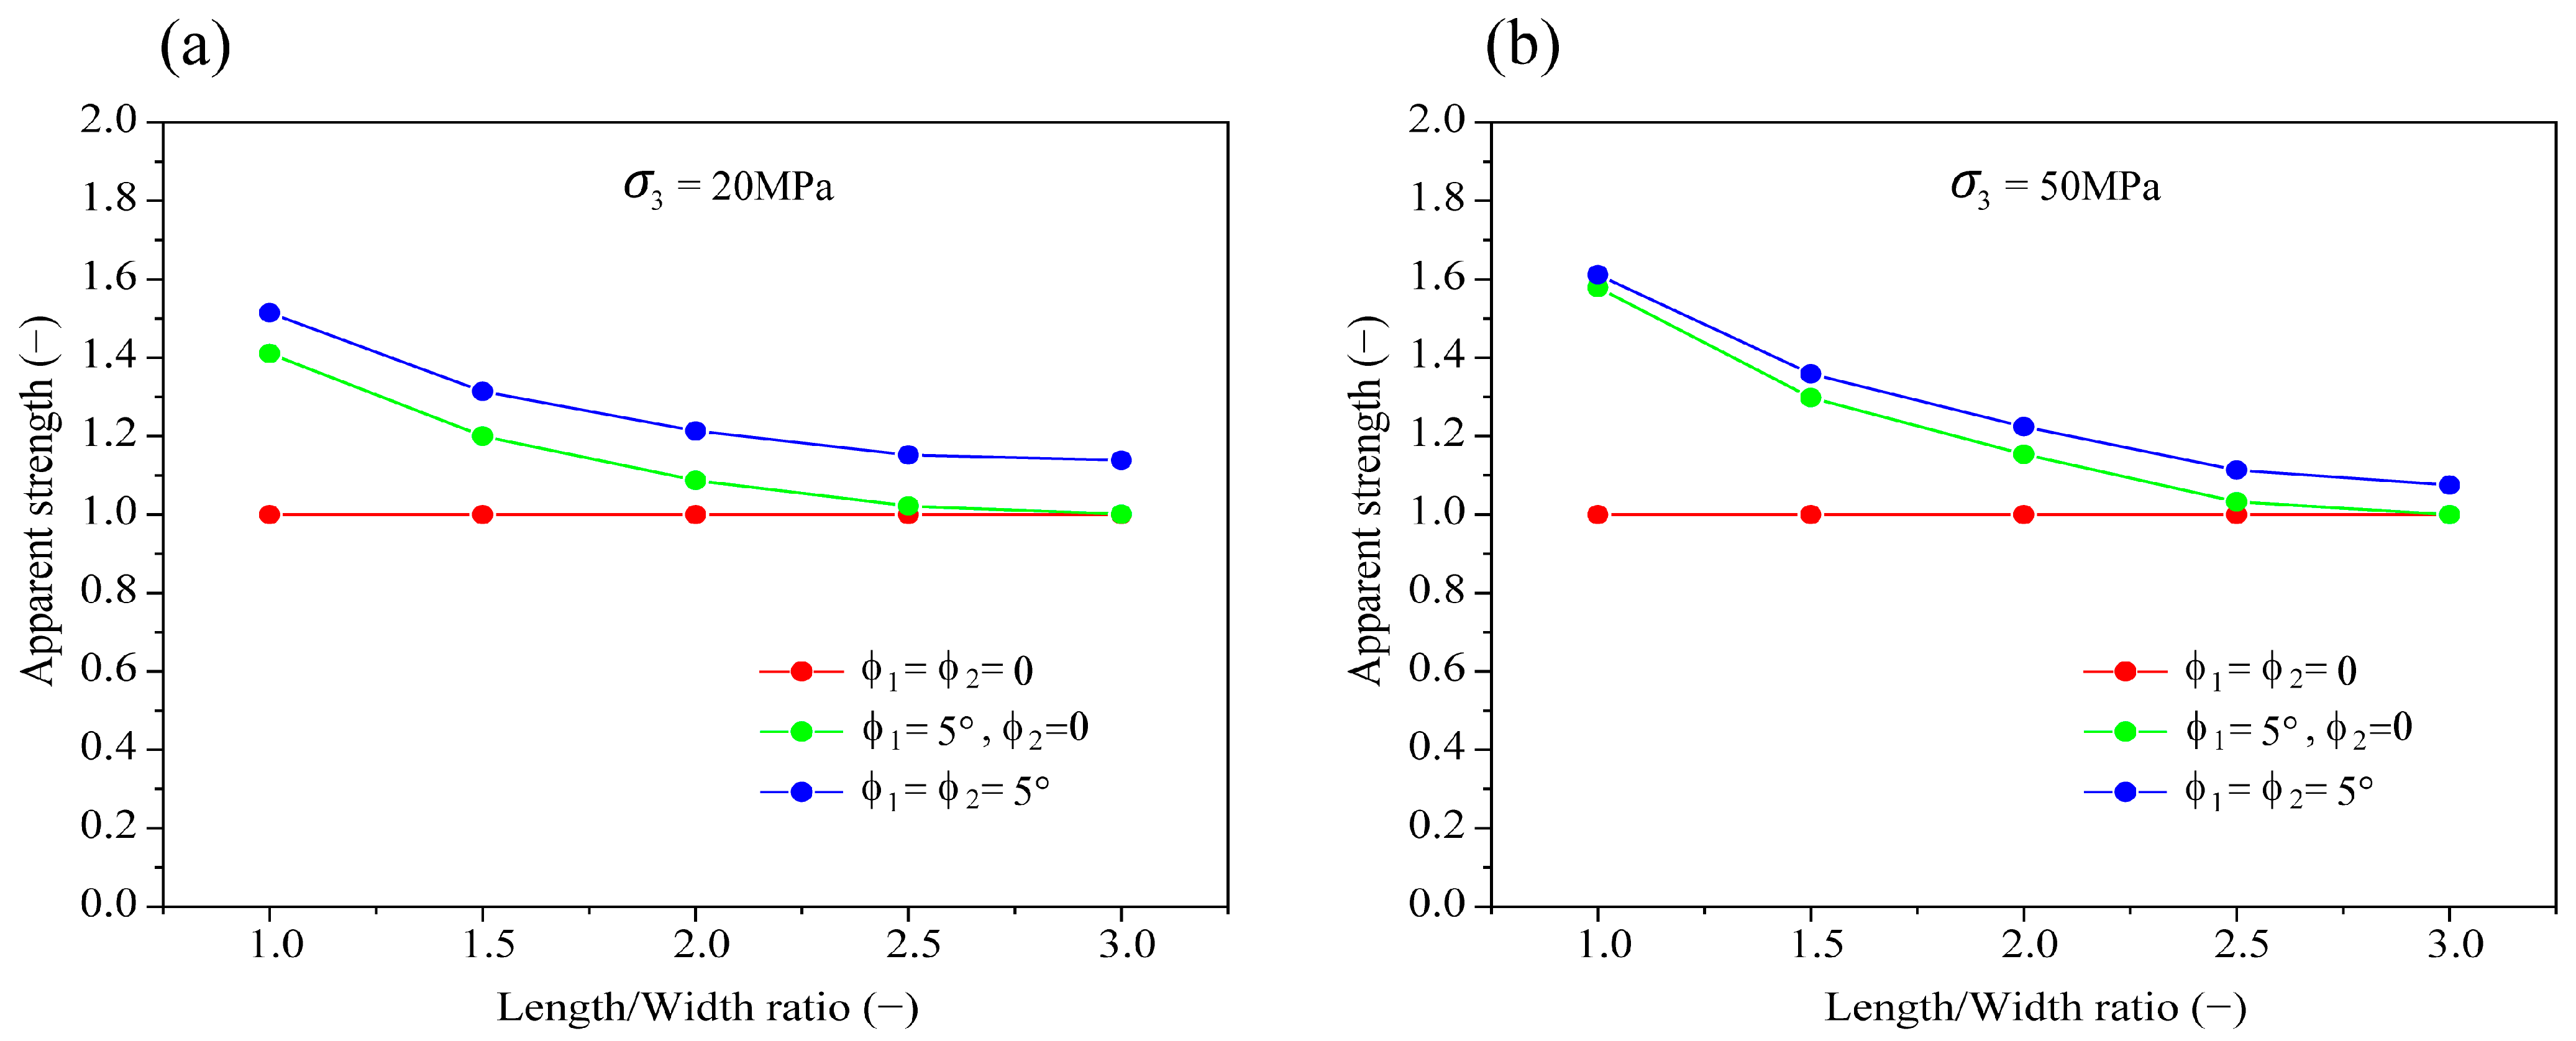
3.3. The Influence of on the Shape Effect
4. Discussion
4.1. The Reason for Shape Effect
4.2. End Effect for Rock Strength
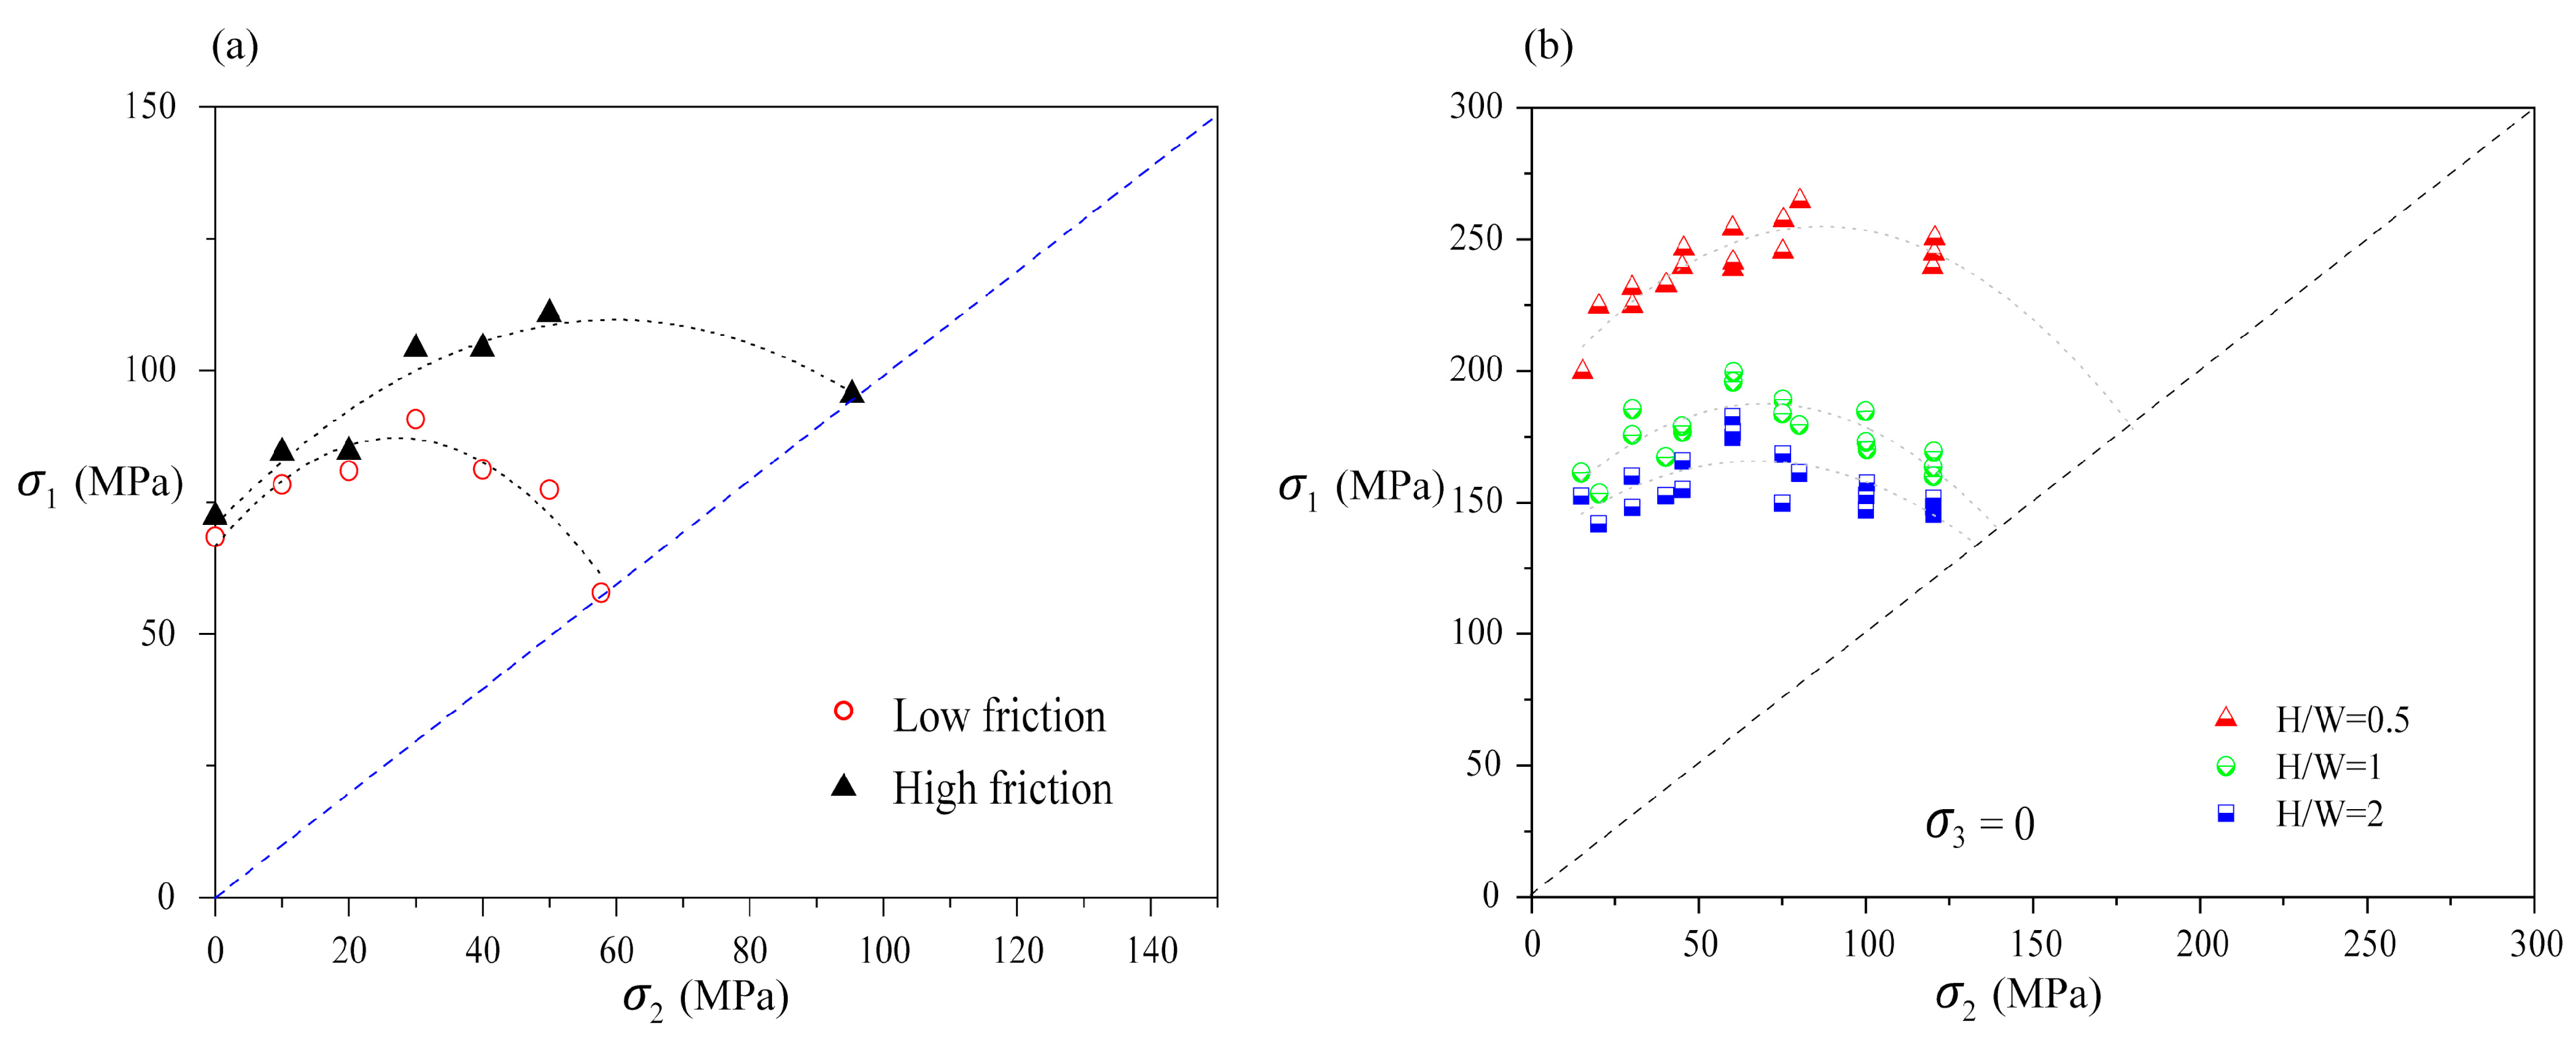
4.3. Comparison with the Available Experimental Data
5. Conclusions
- (1)
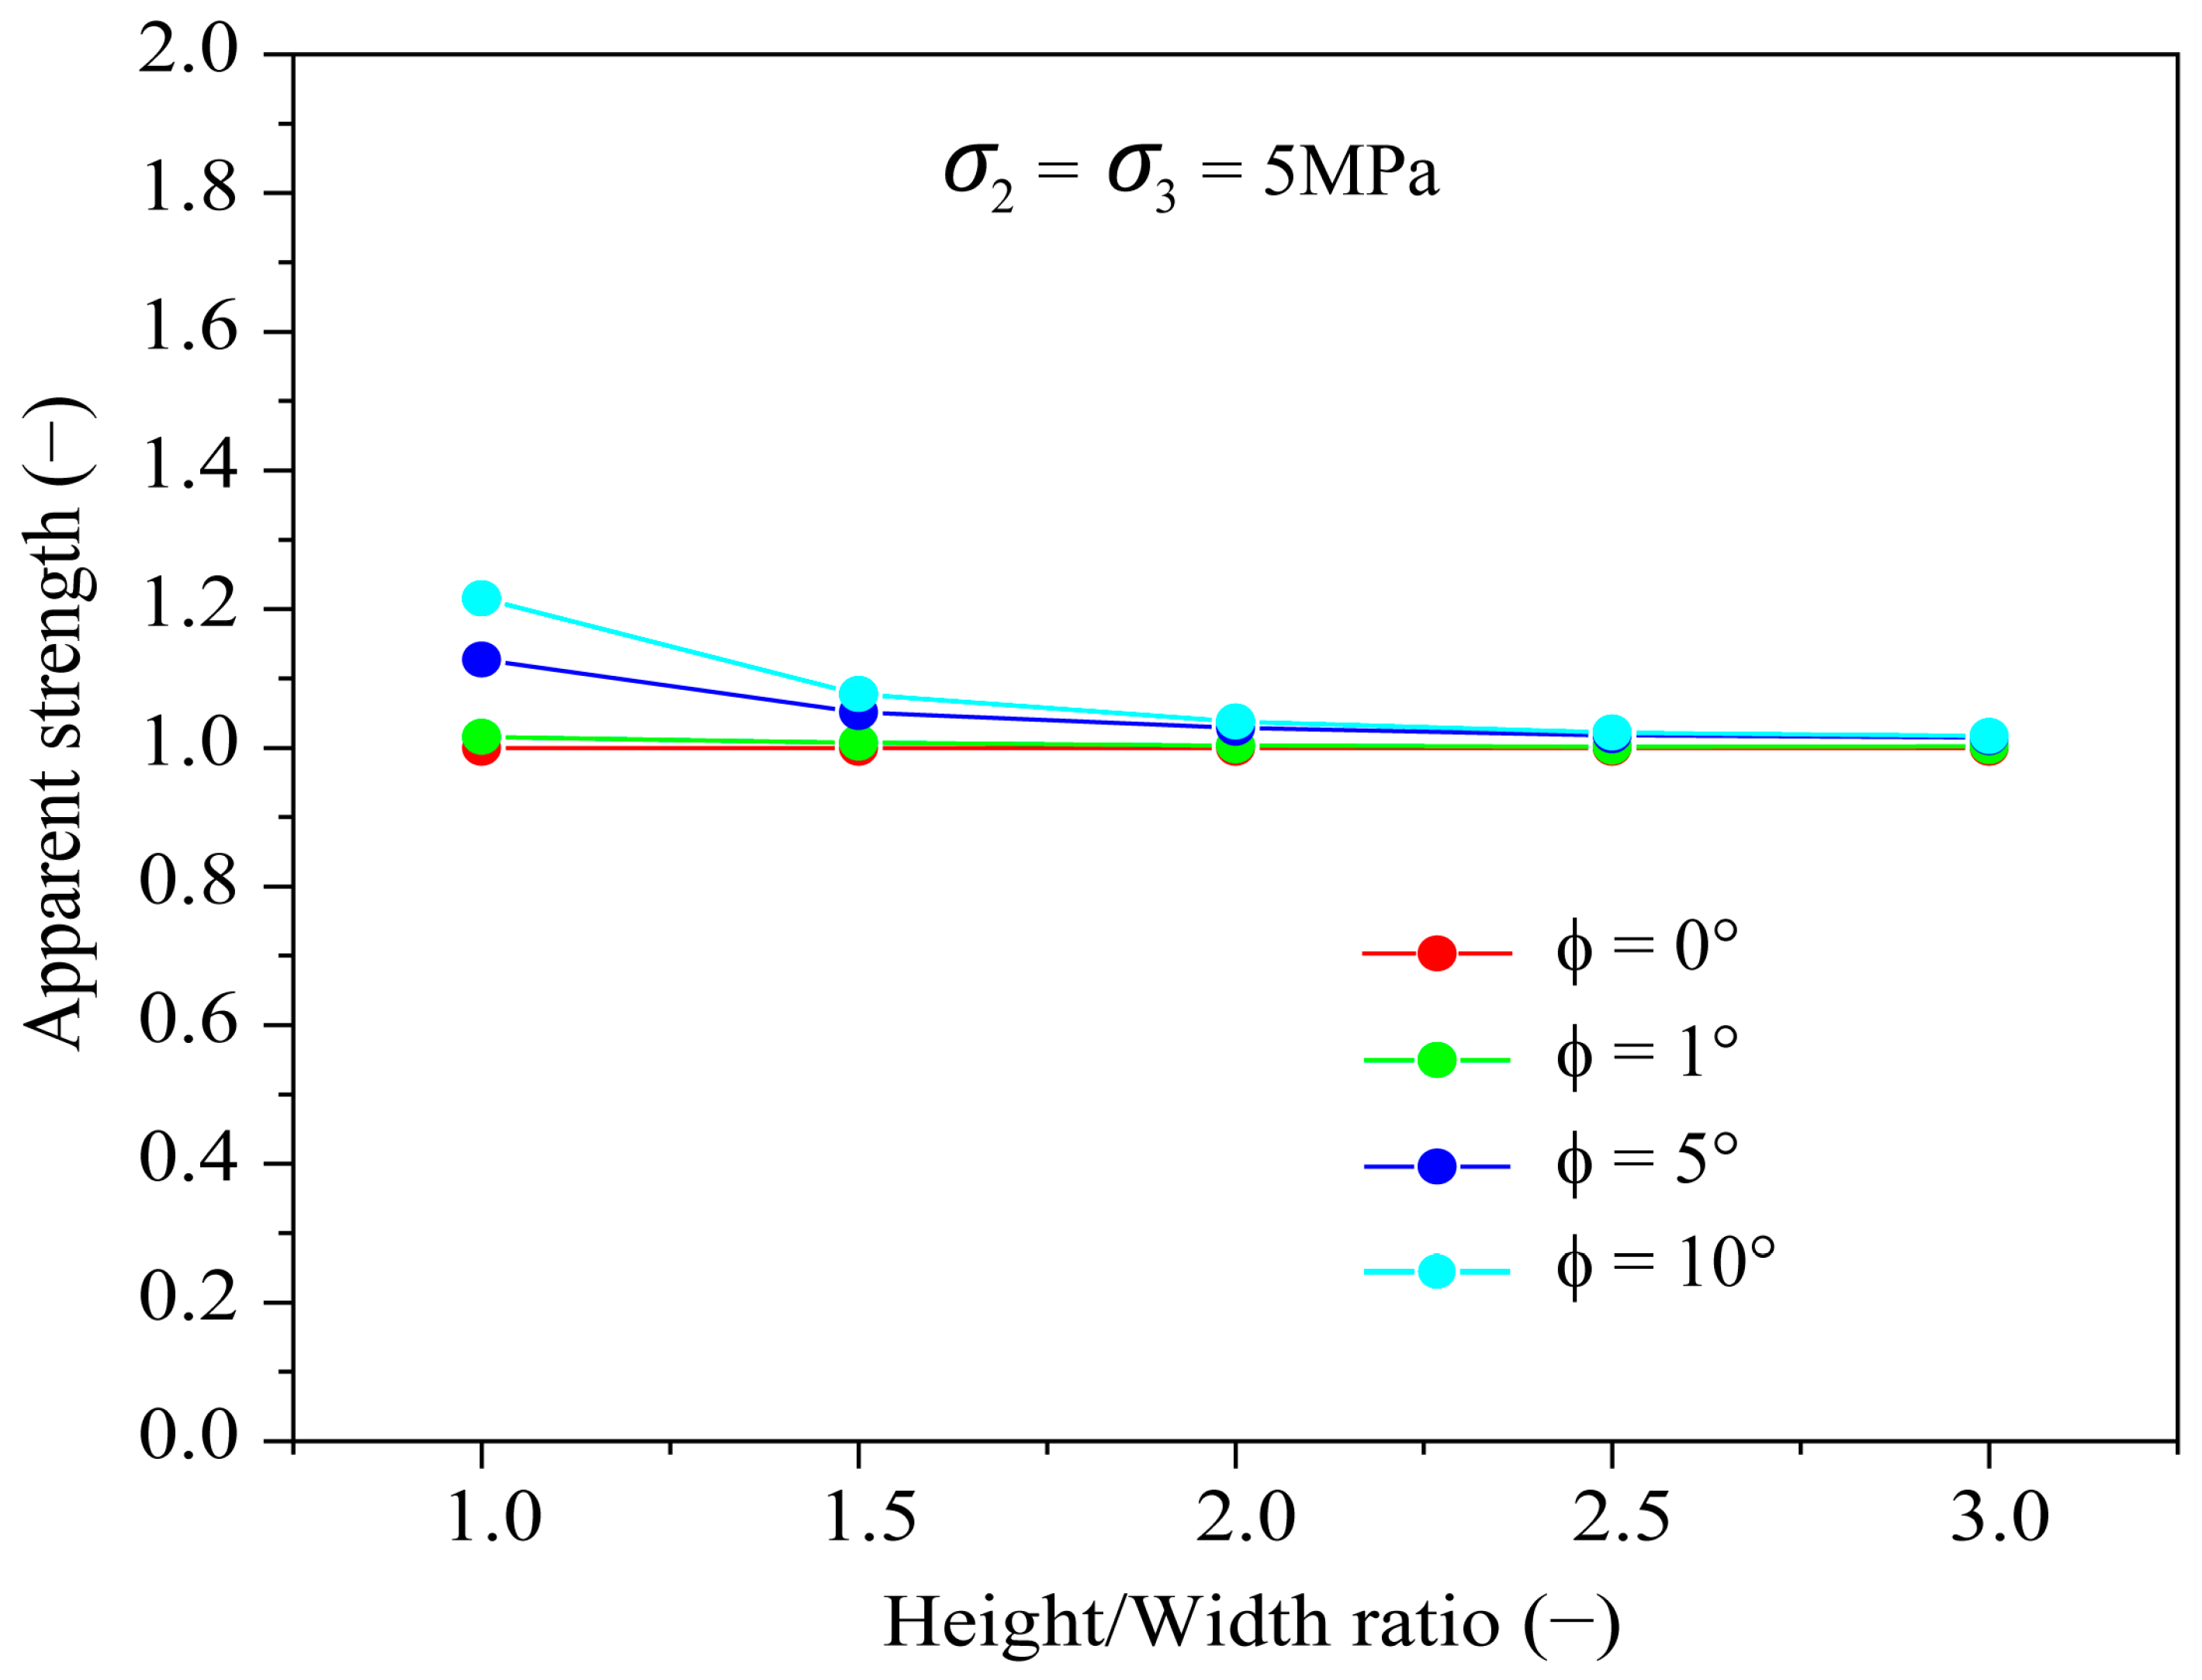
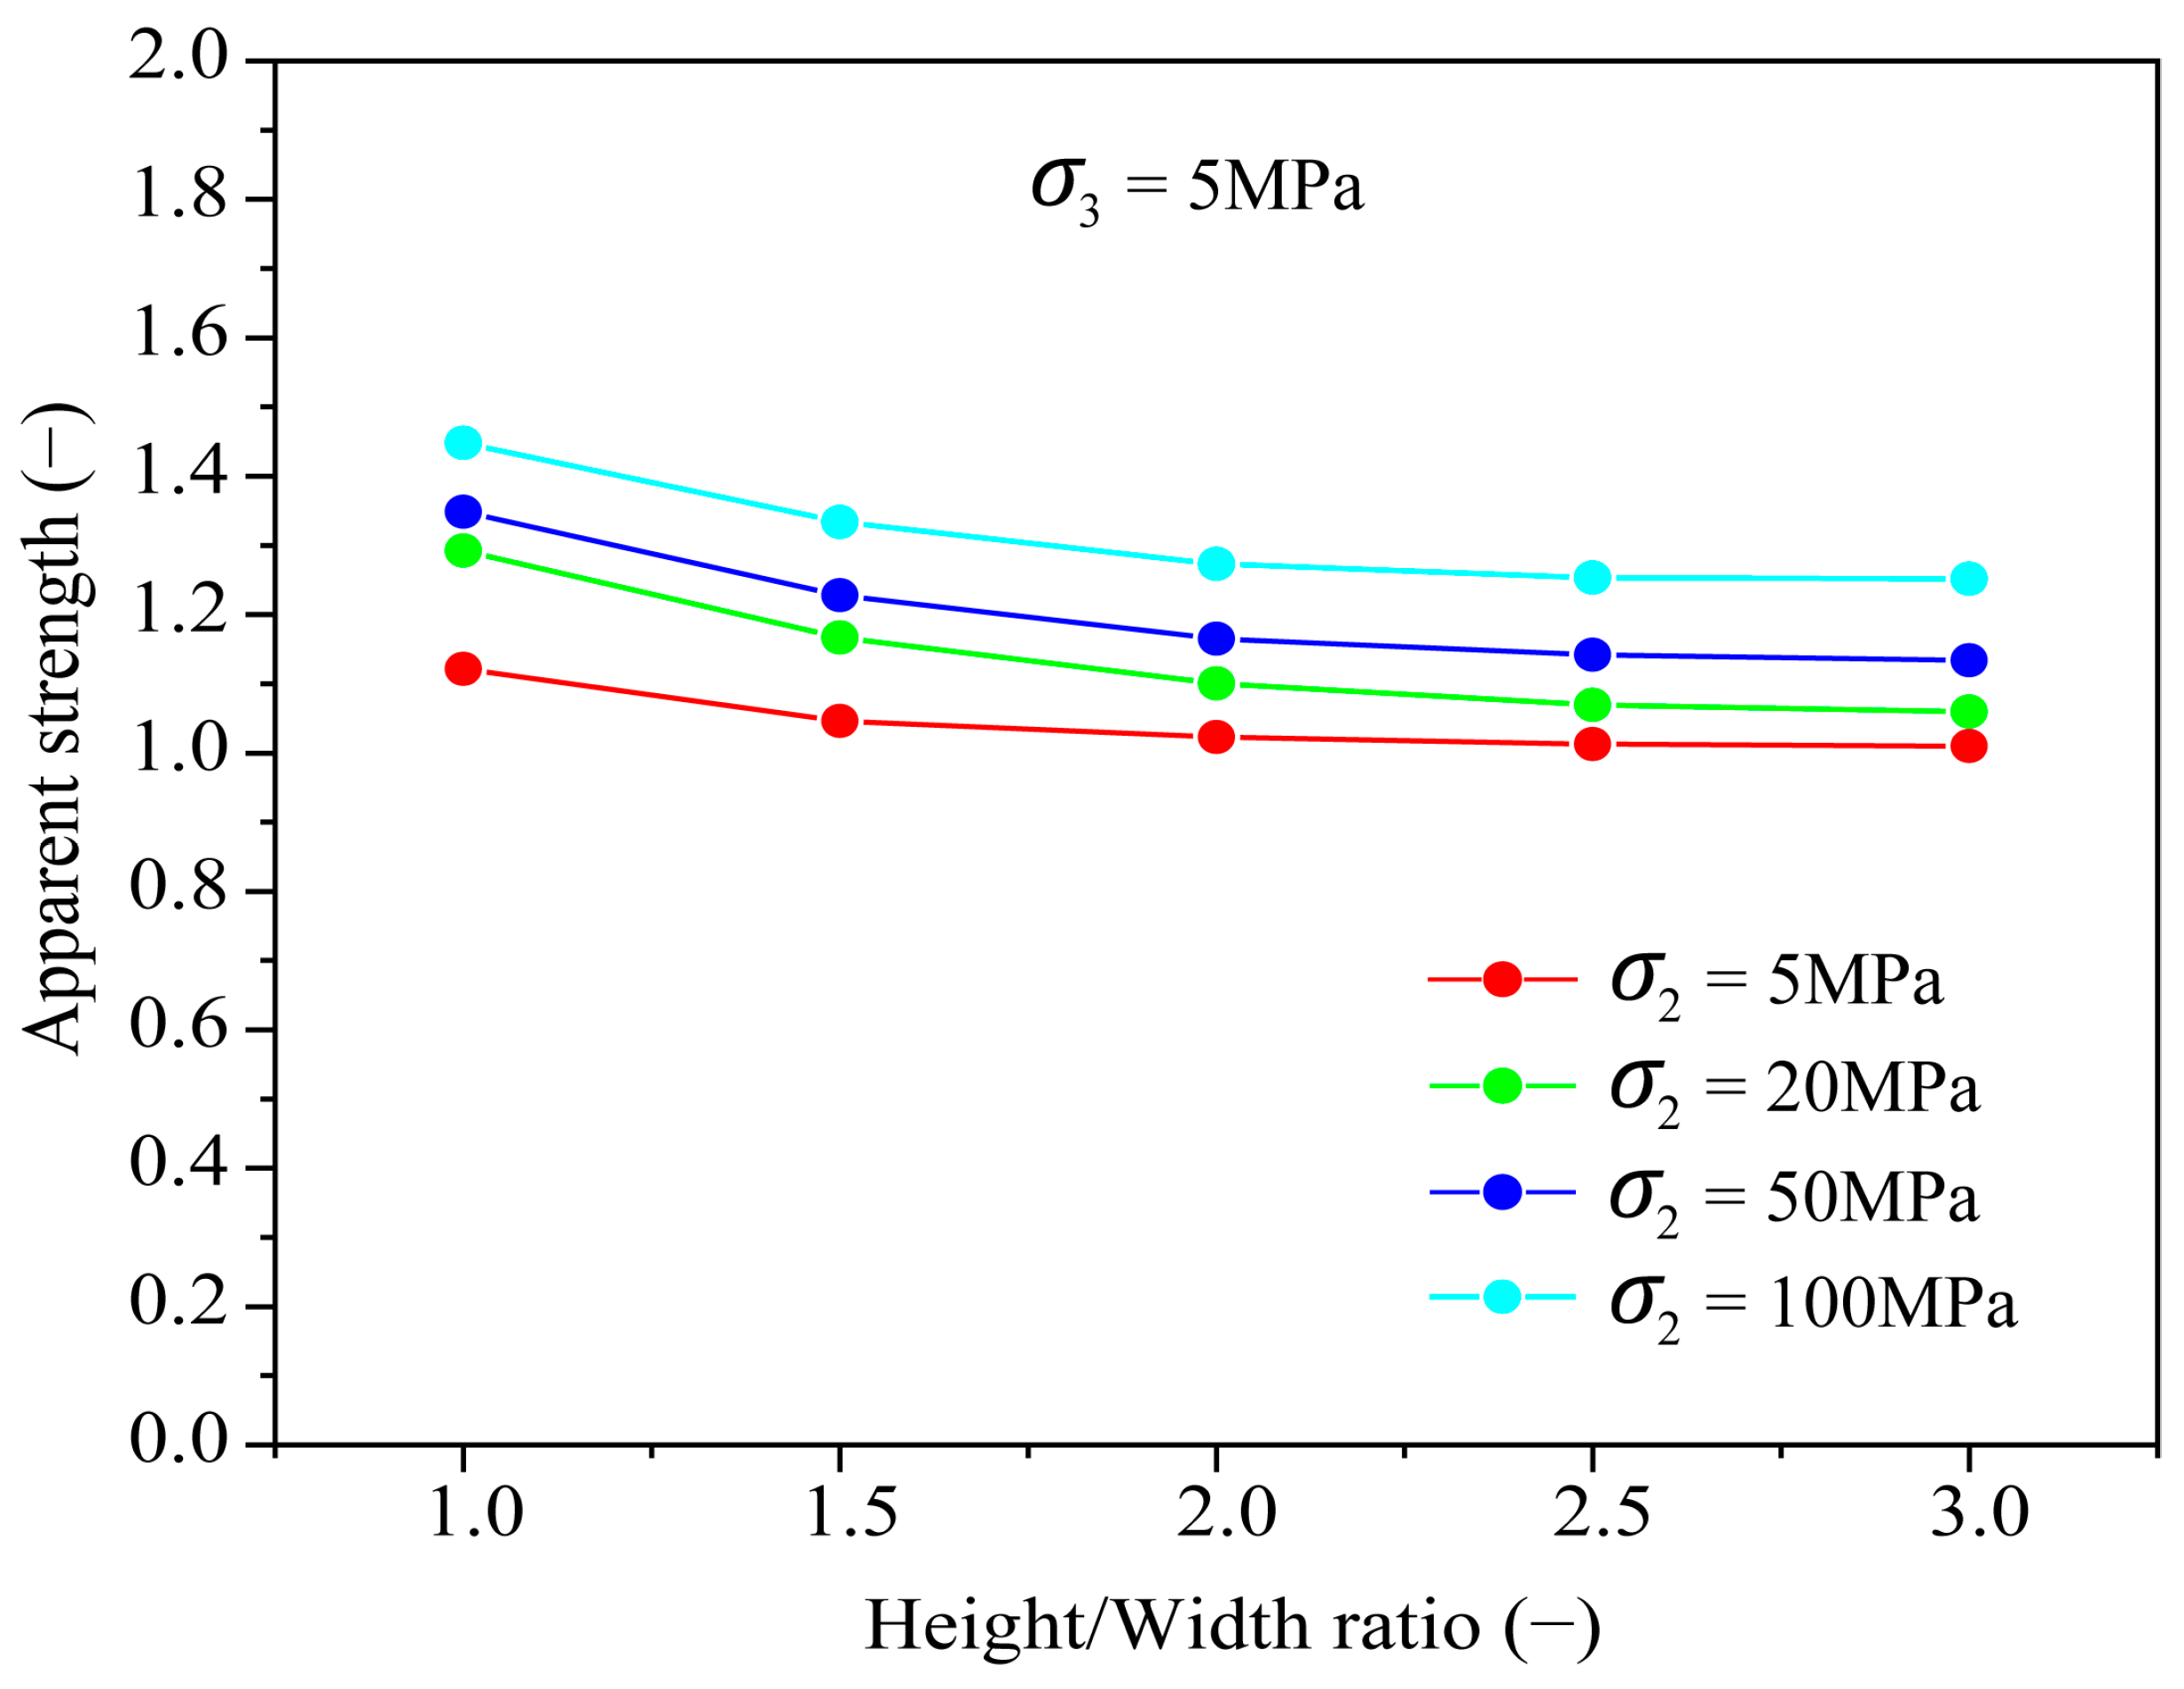
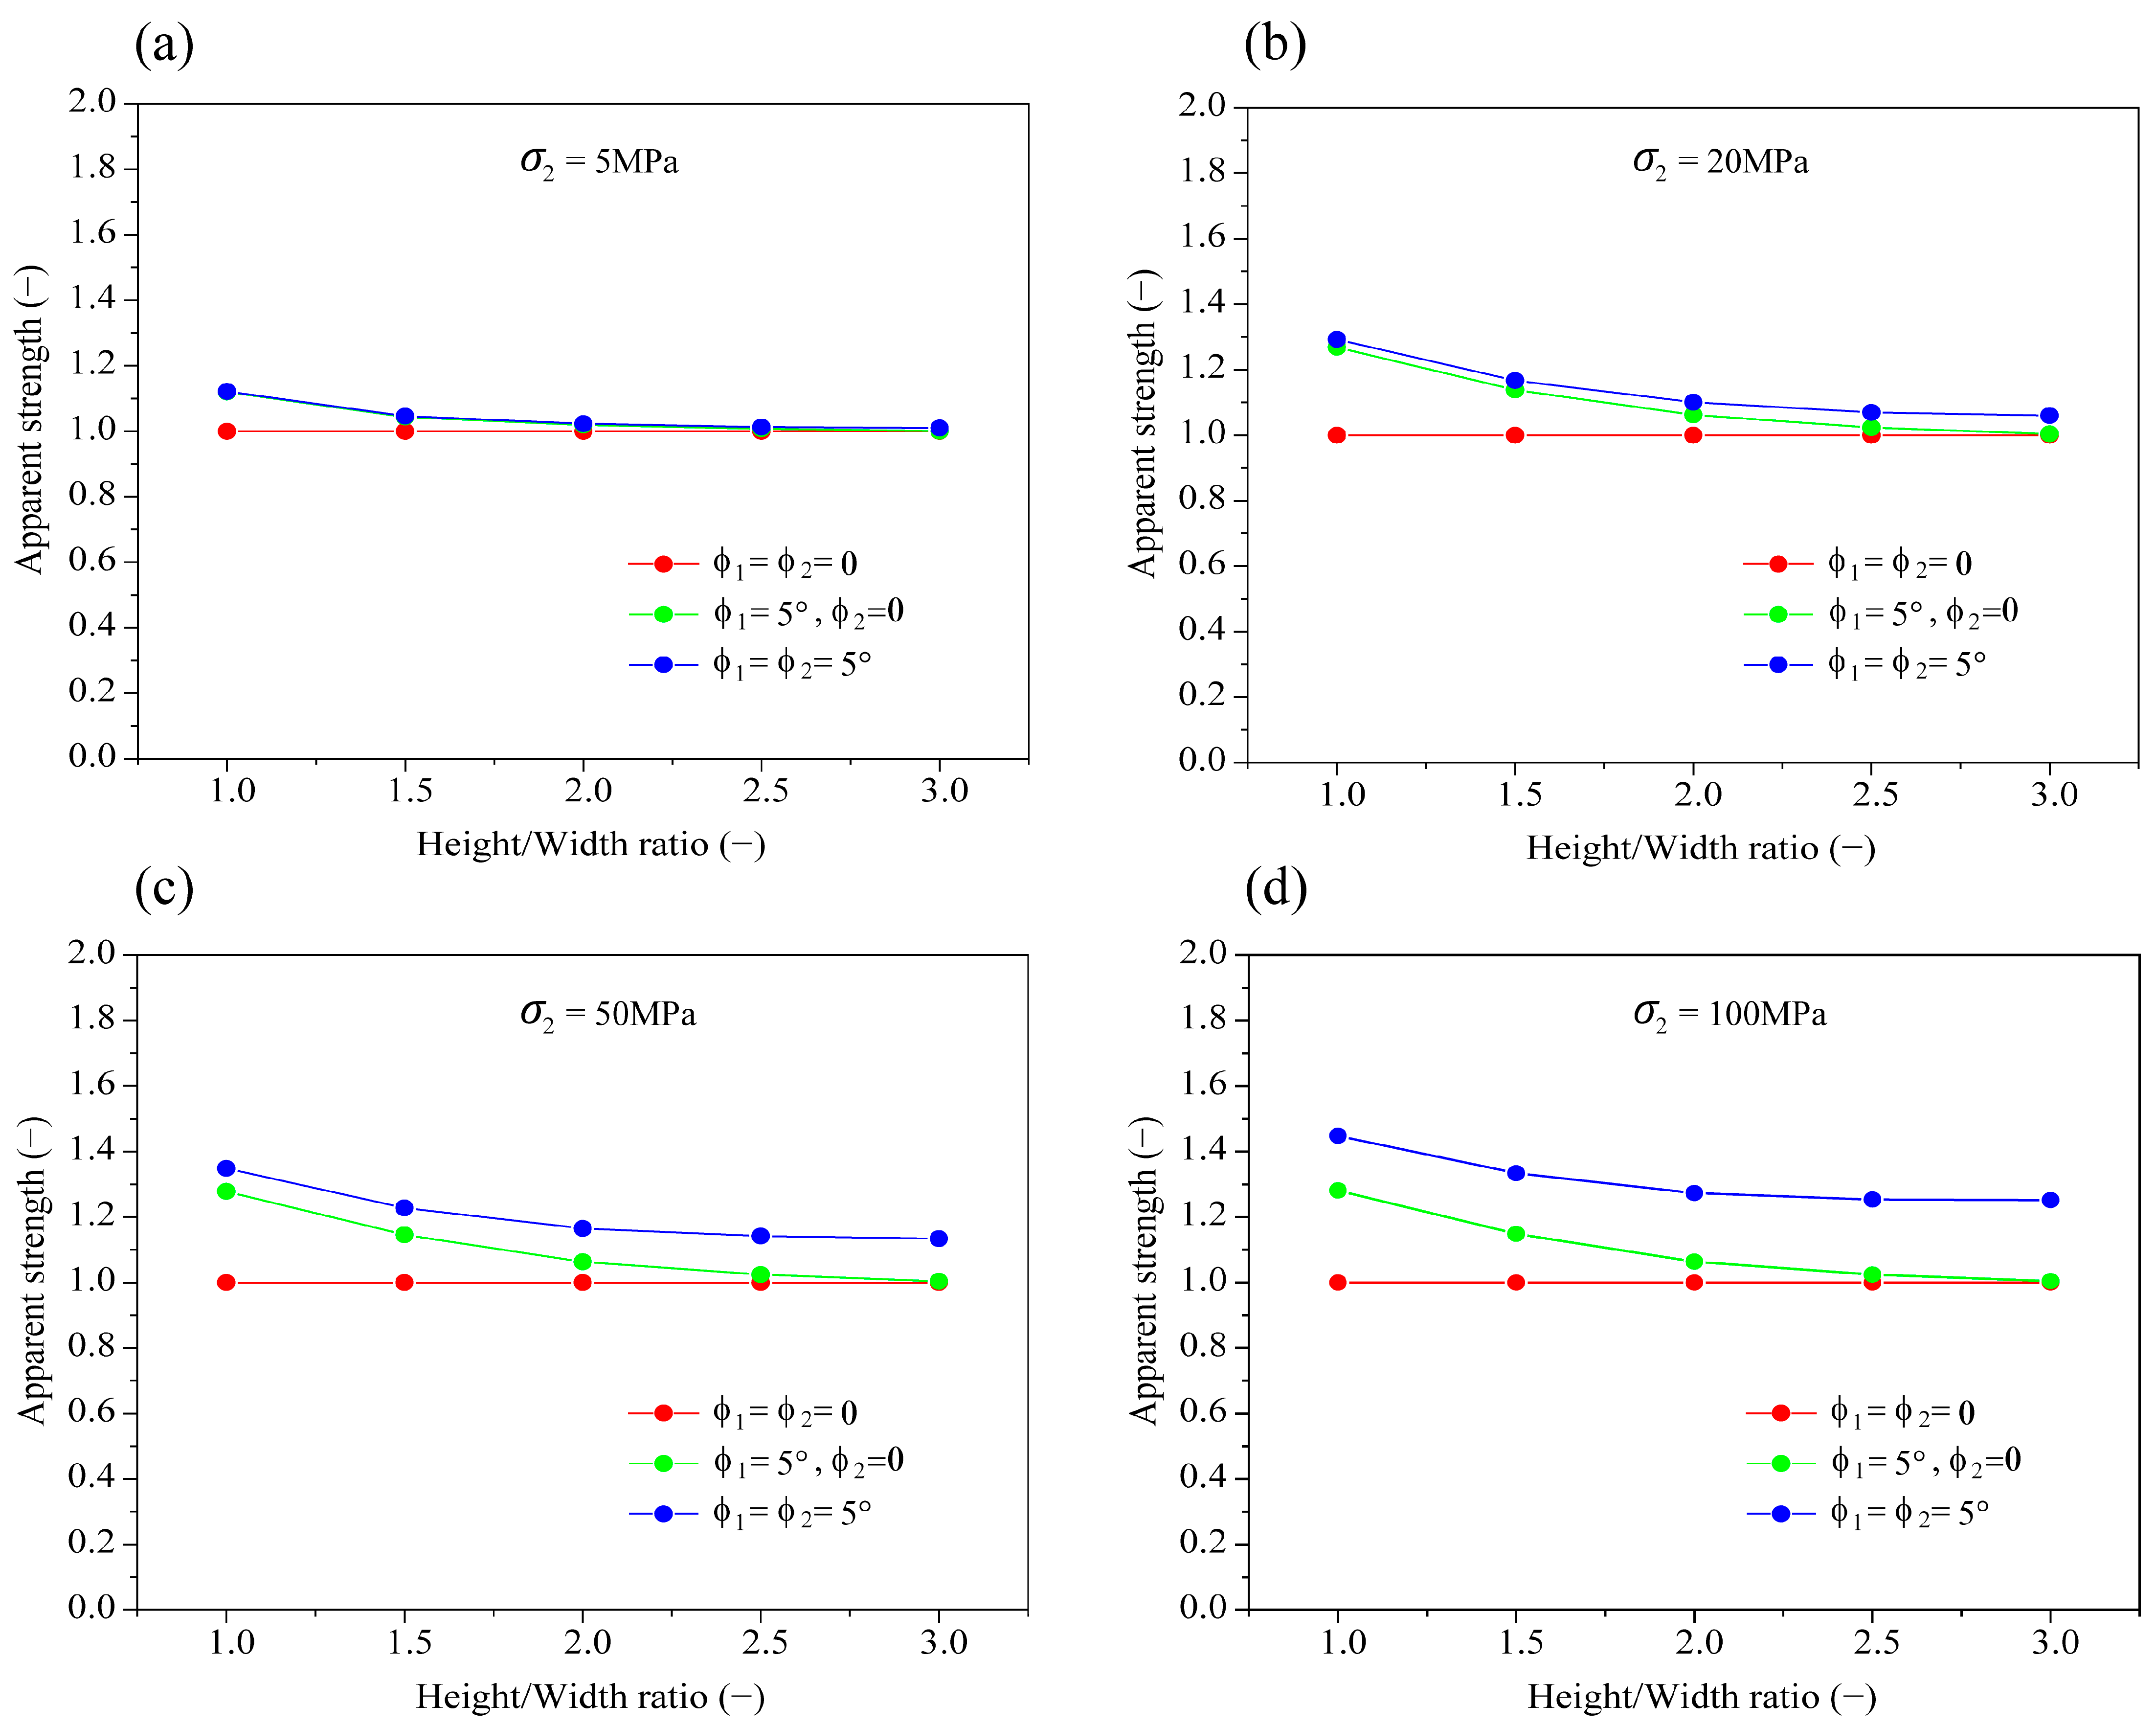
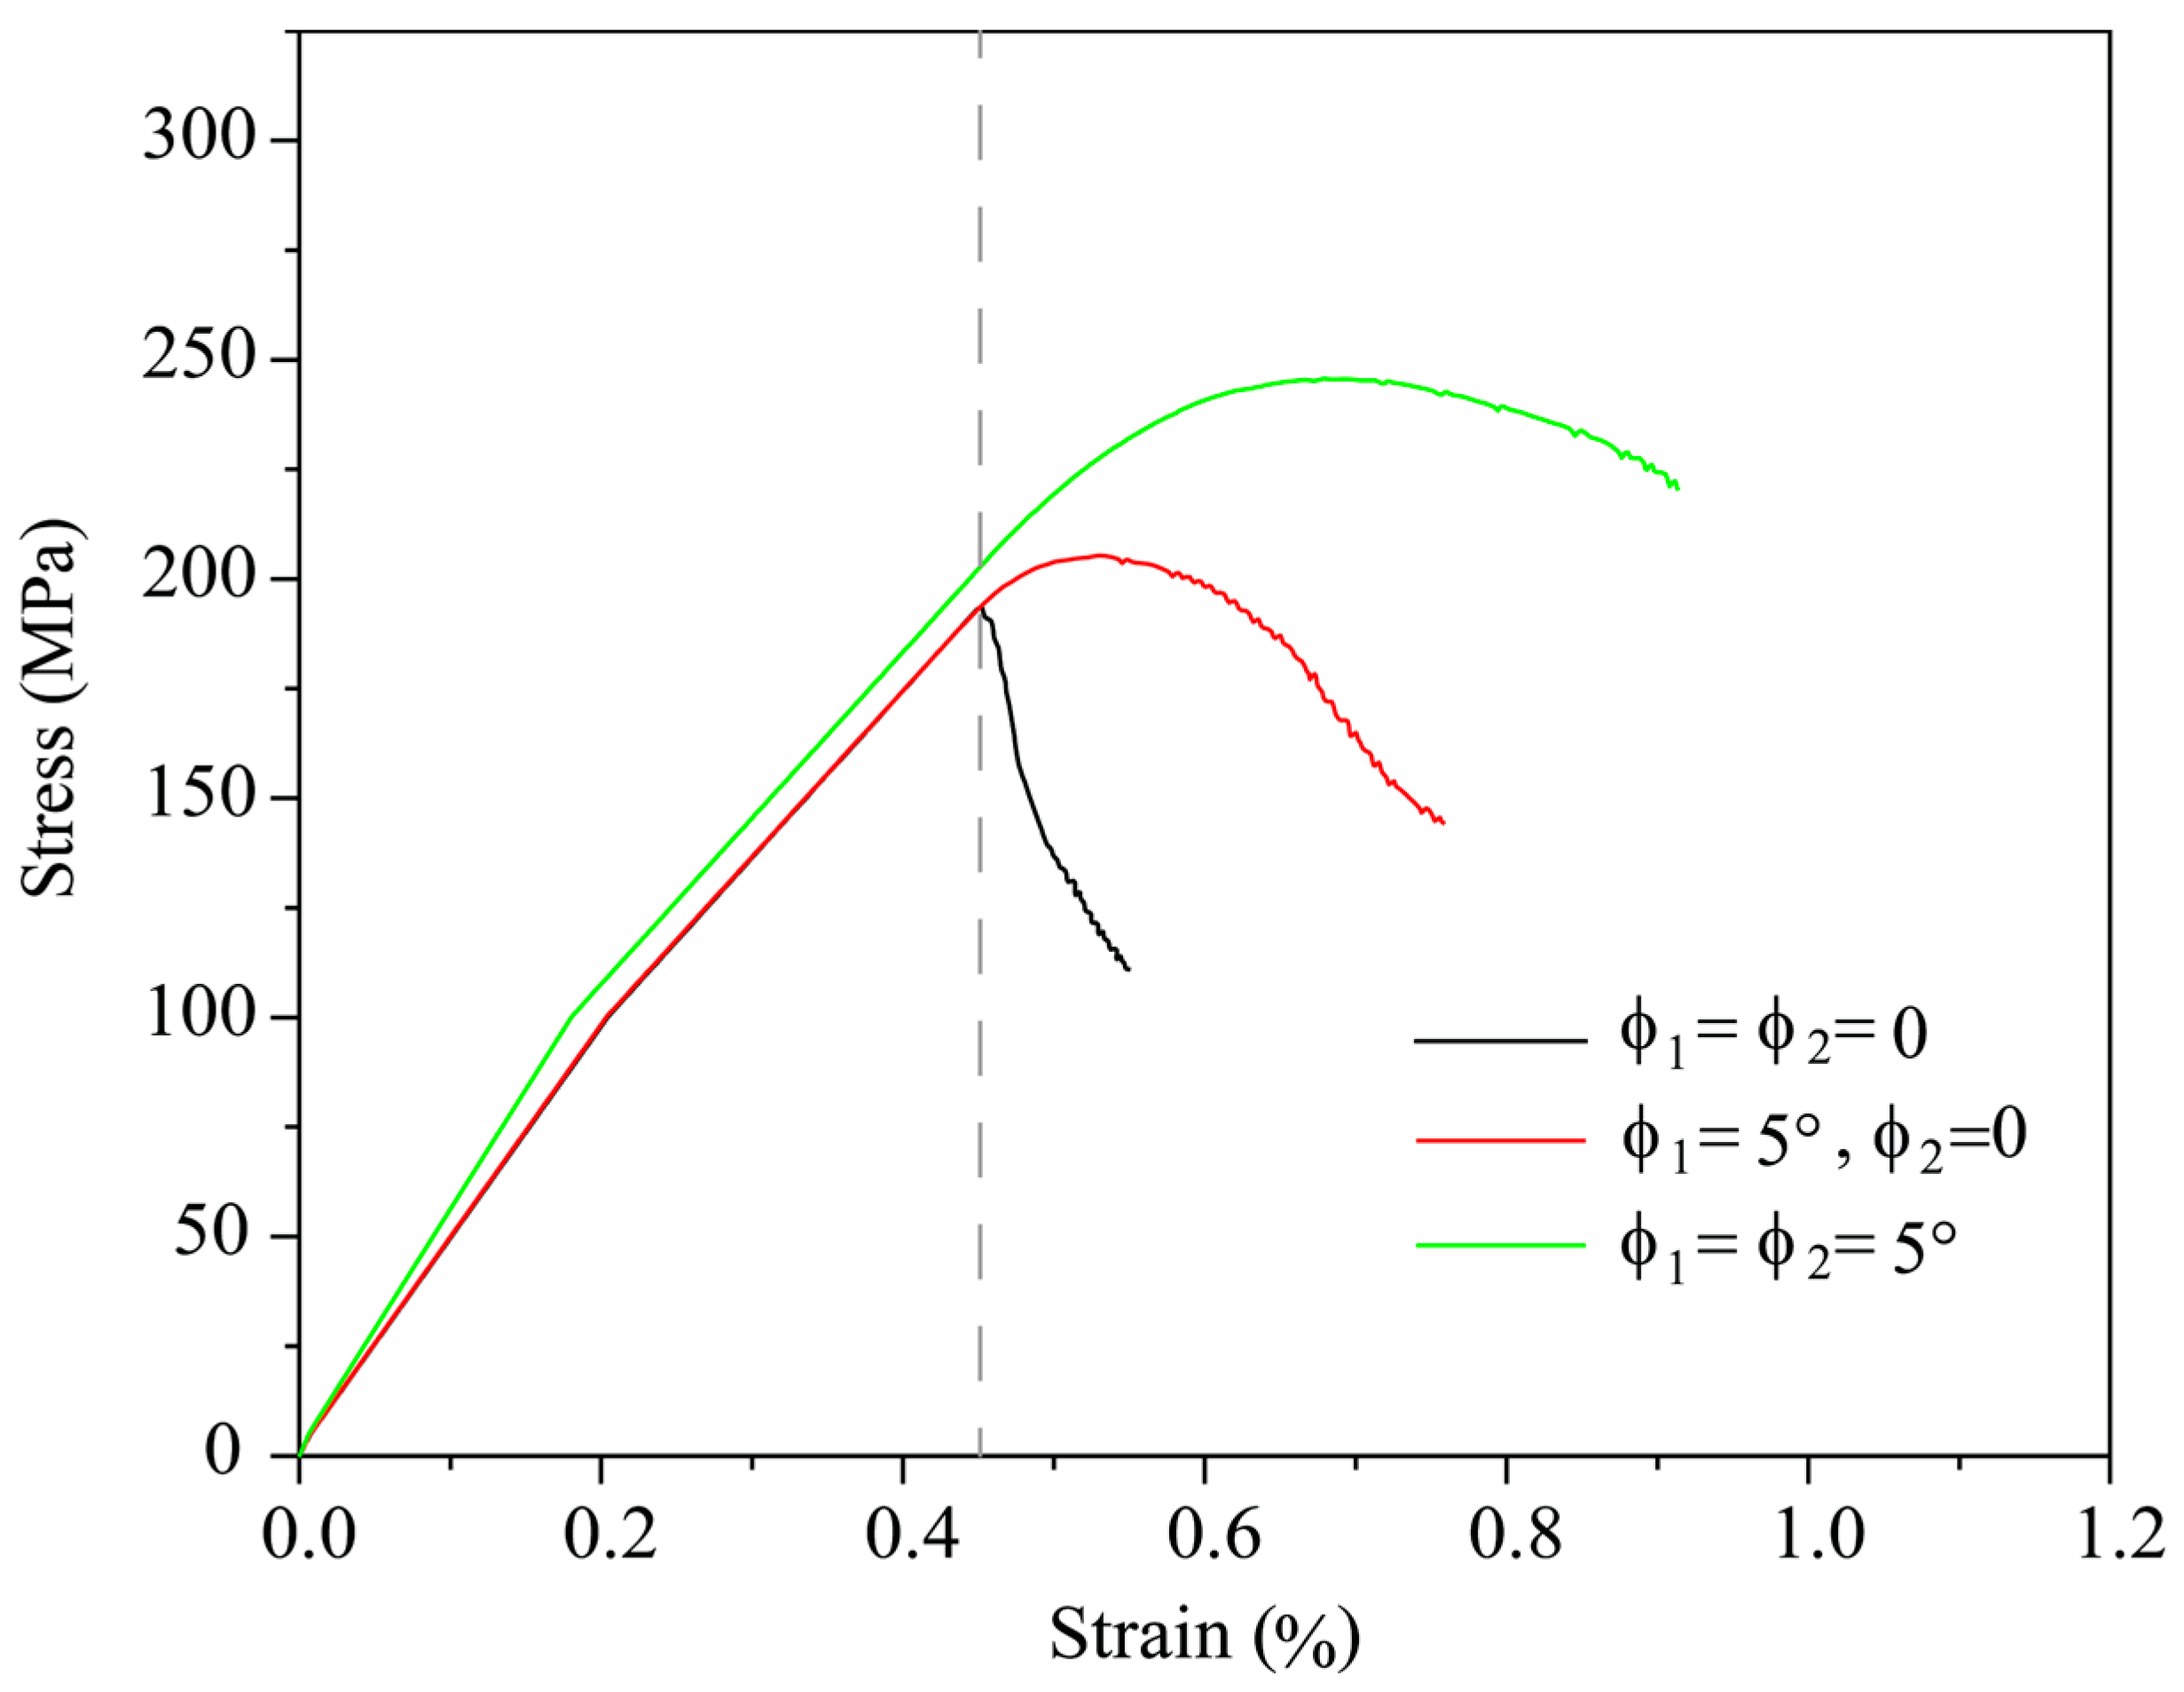
- The shape effect could significantly affect both the measured rock strength and stiffness. The apparent strength decreases sharply with the increase in slenderness ratio and remains almost unchanged when the slenderness ratio extends beyond 2. For a high slenderness ratio (2), the shape effect is still significant in true 3D tests, which is not the case for uniaxial compression tests. The shape effect could be enhanced by , whereas restricted by .
- (2)
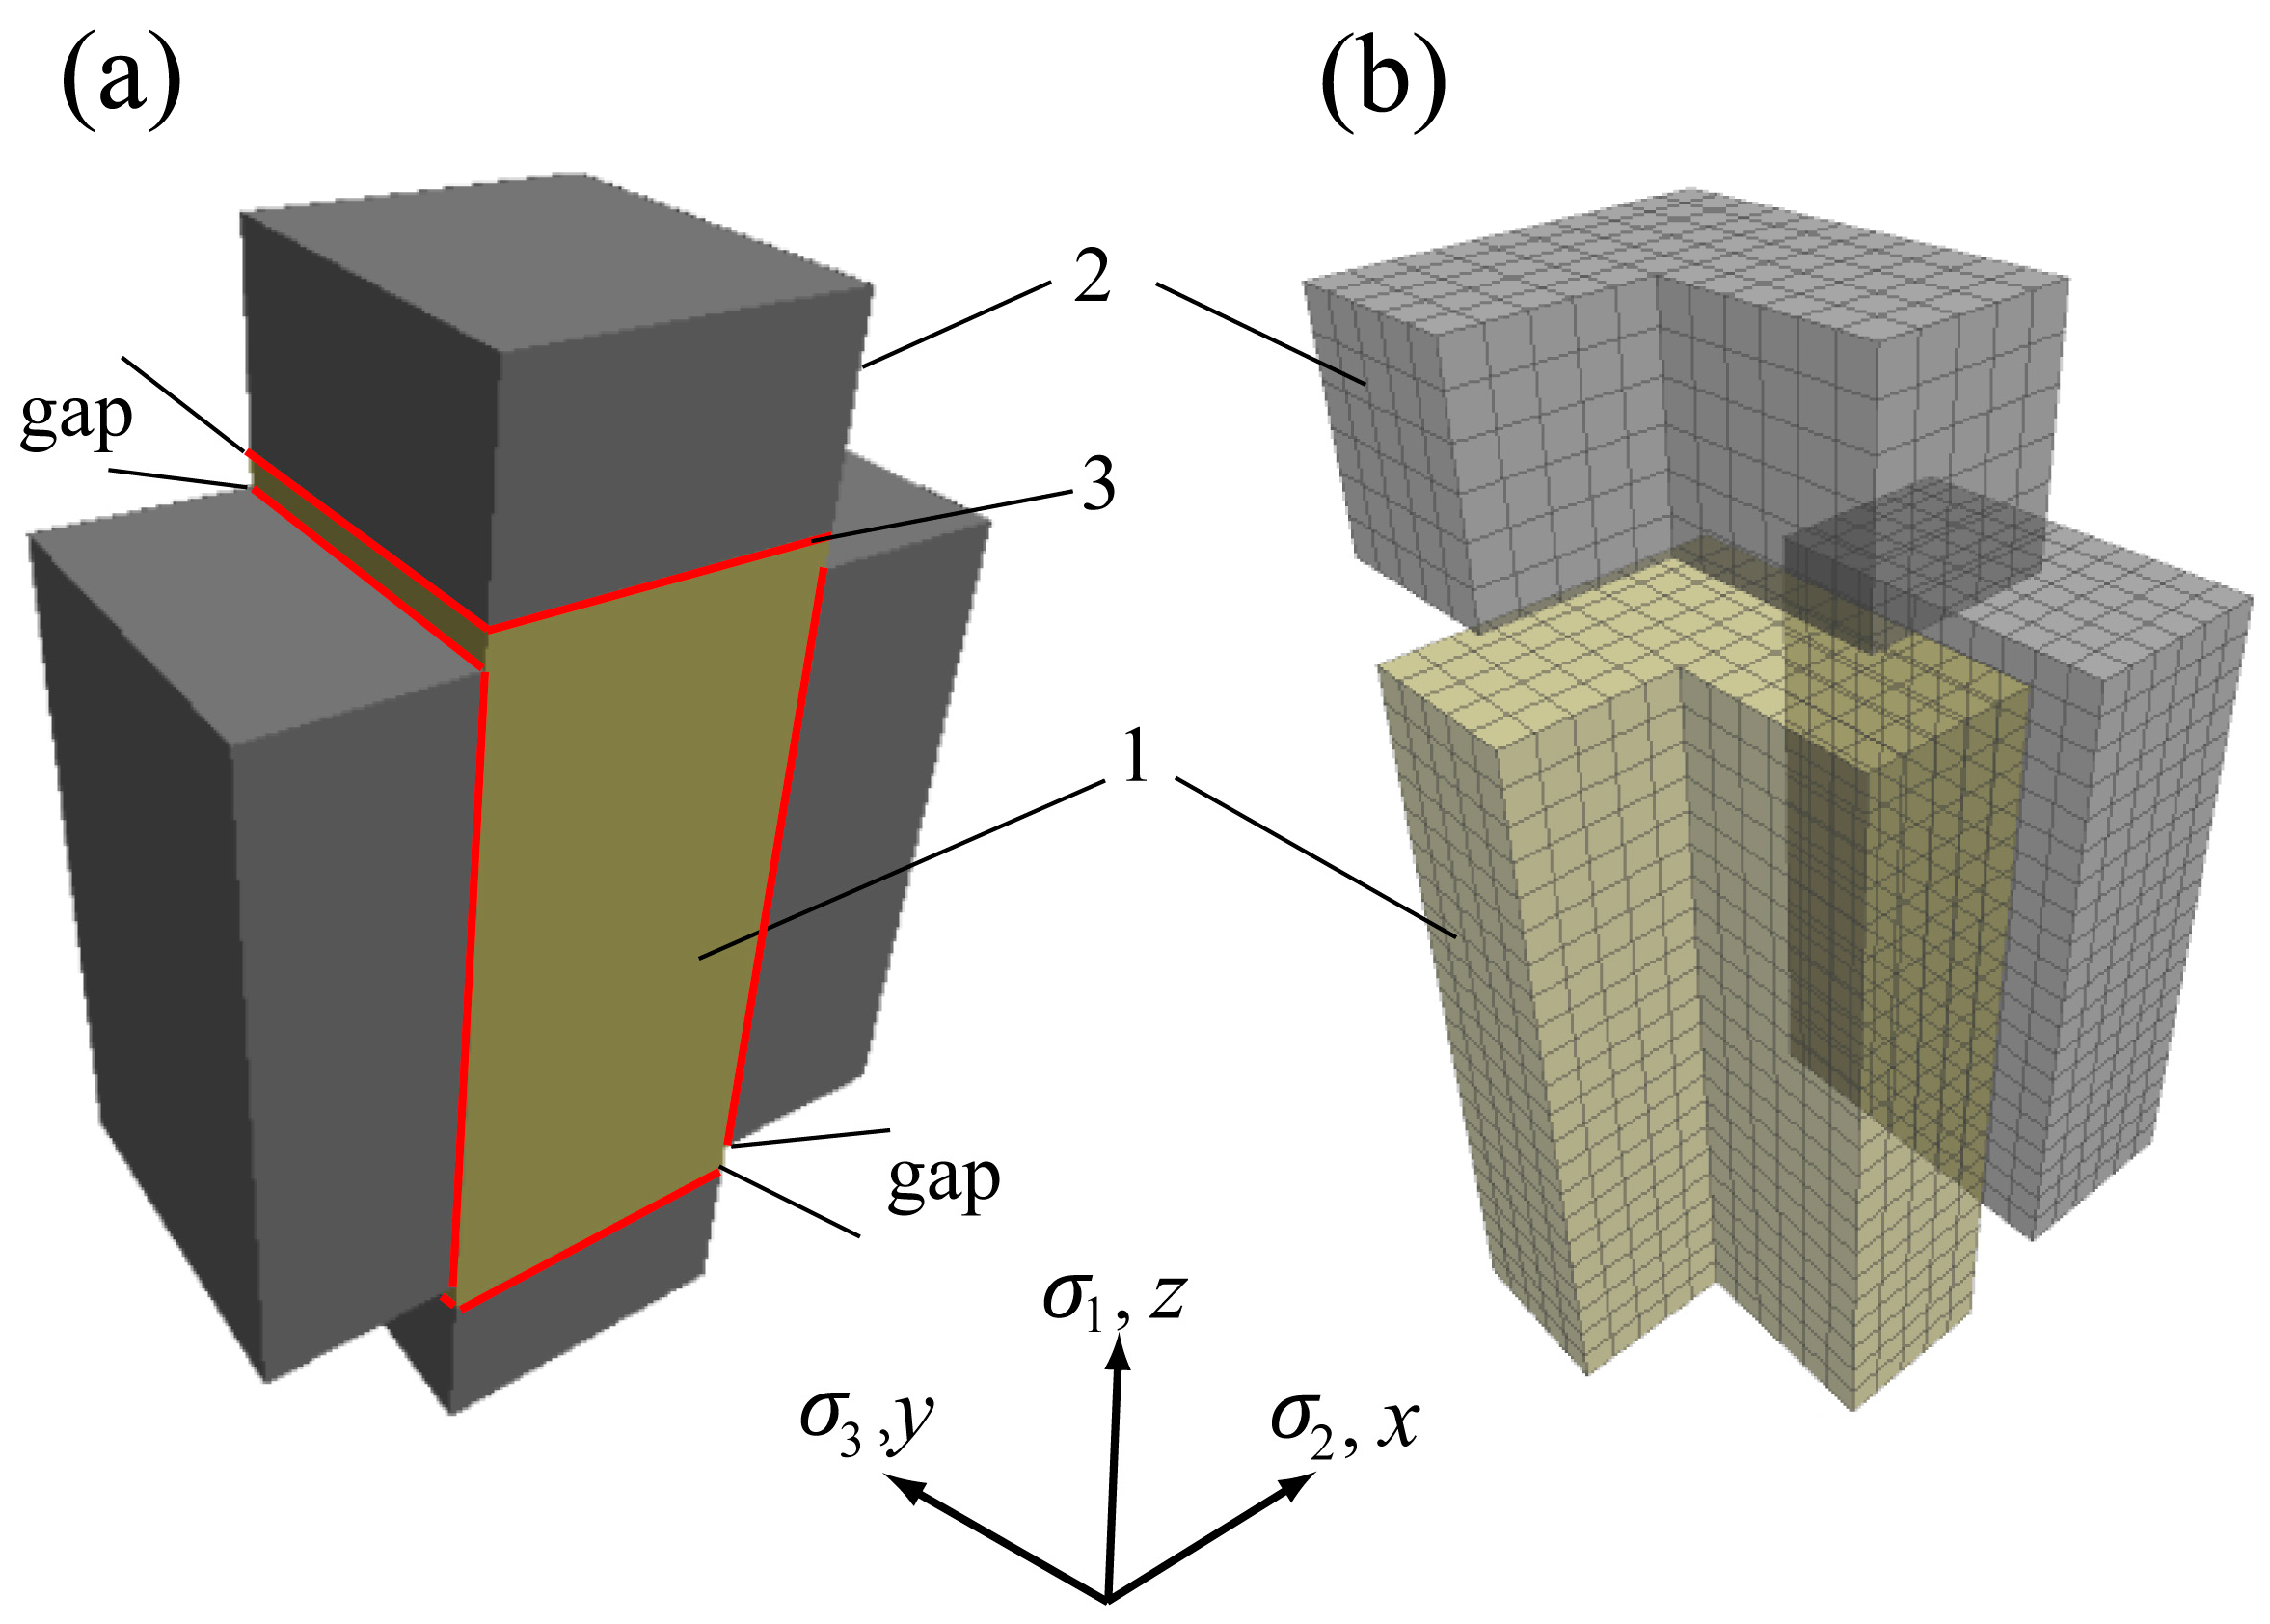
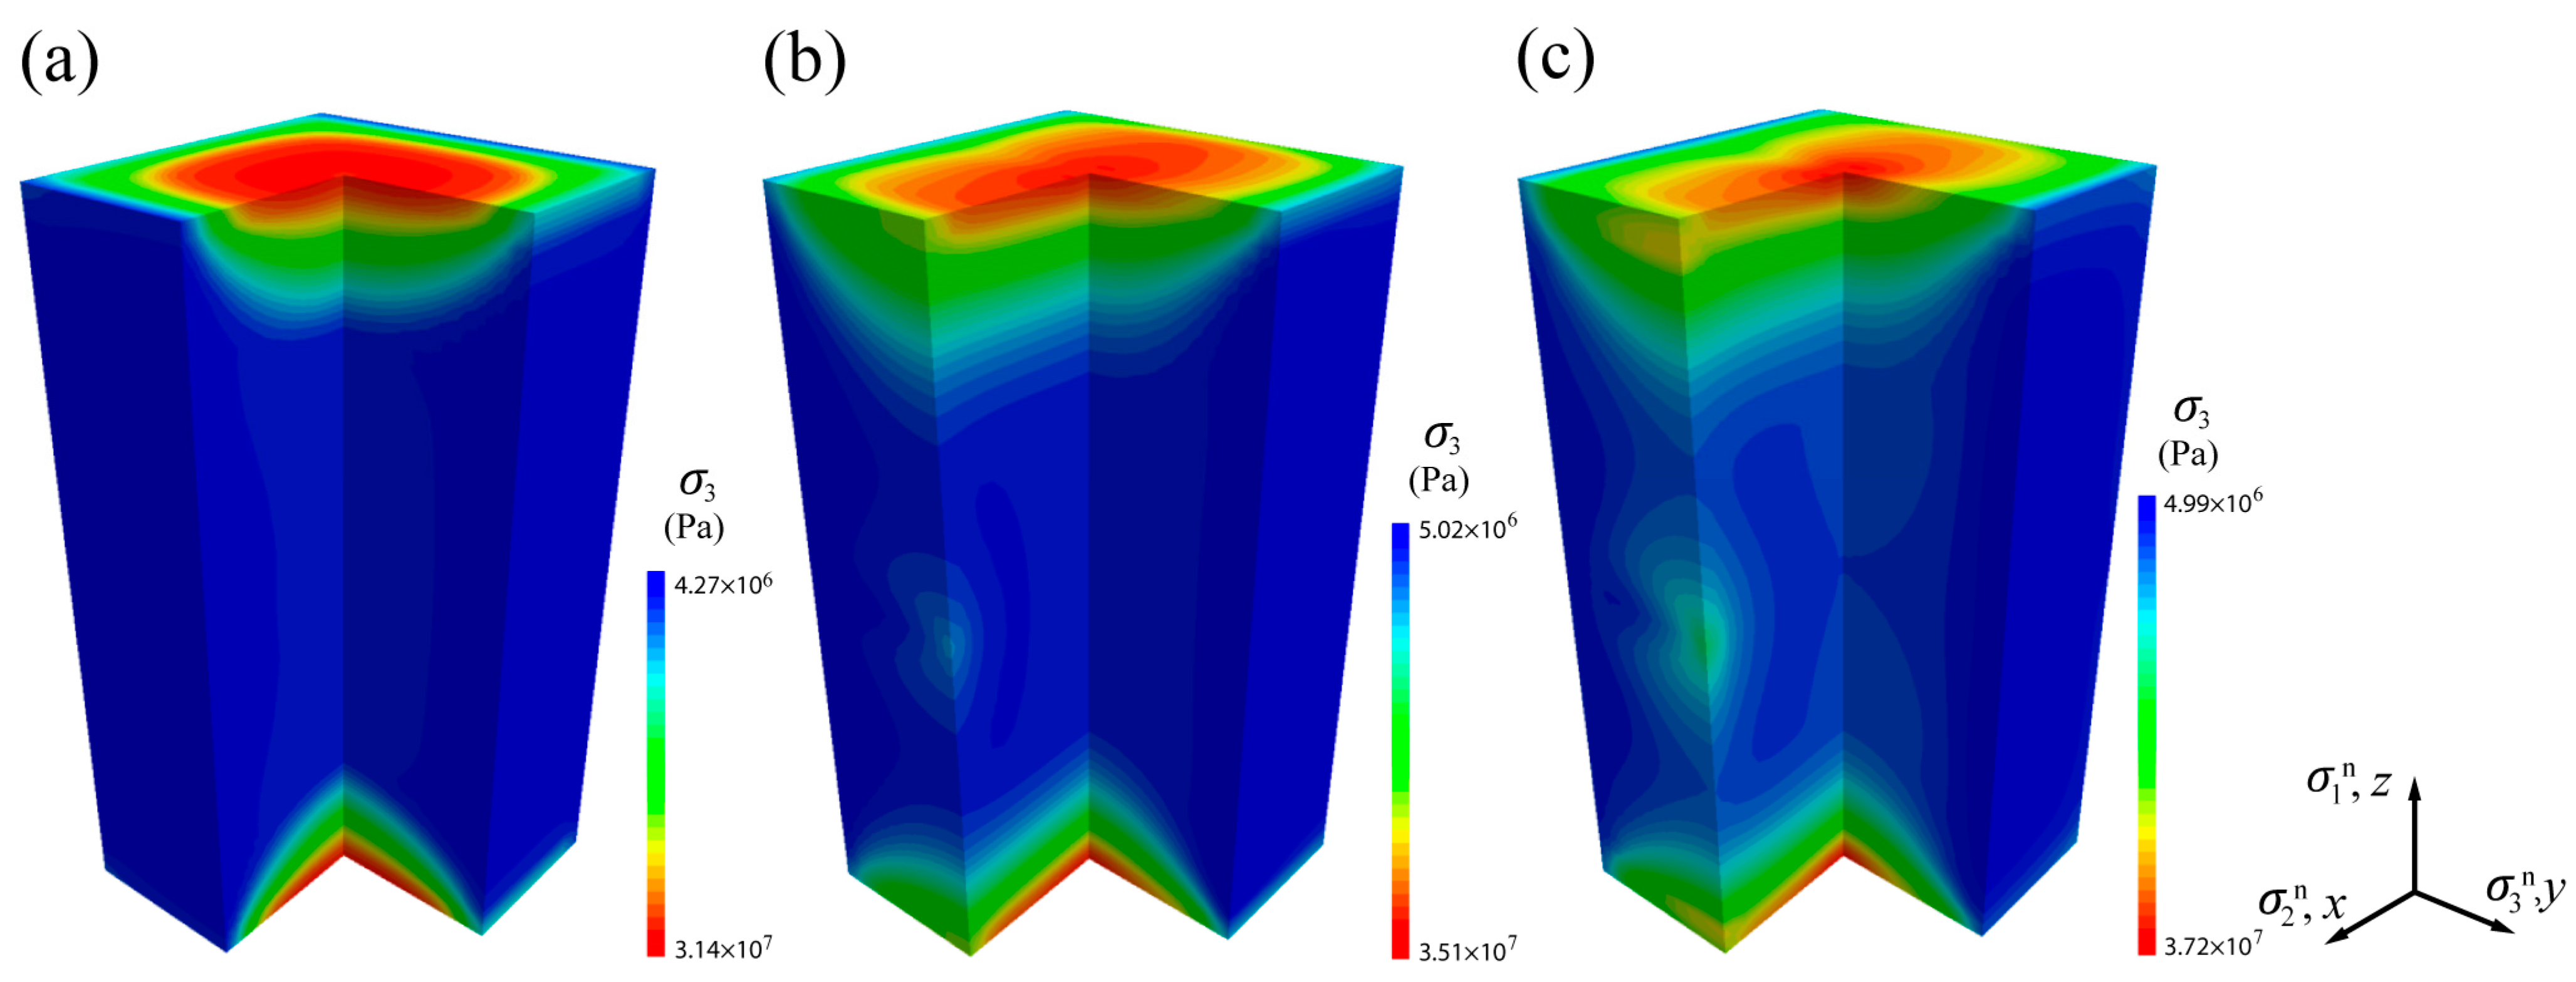
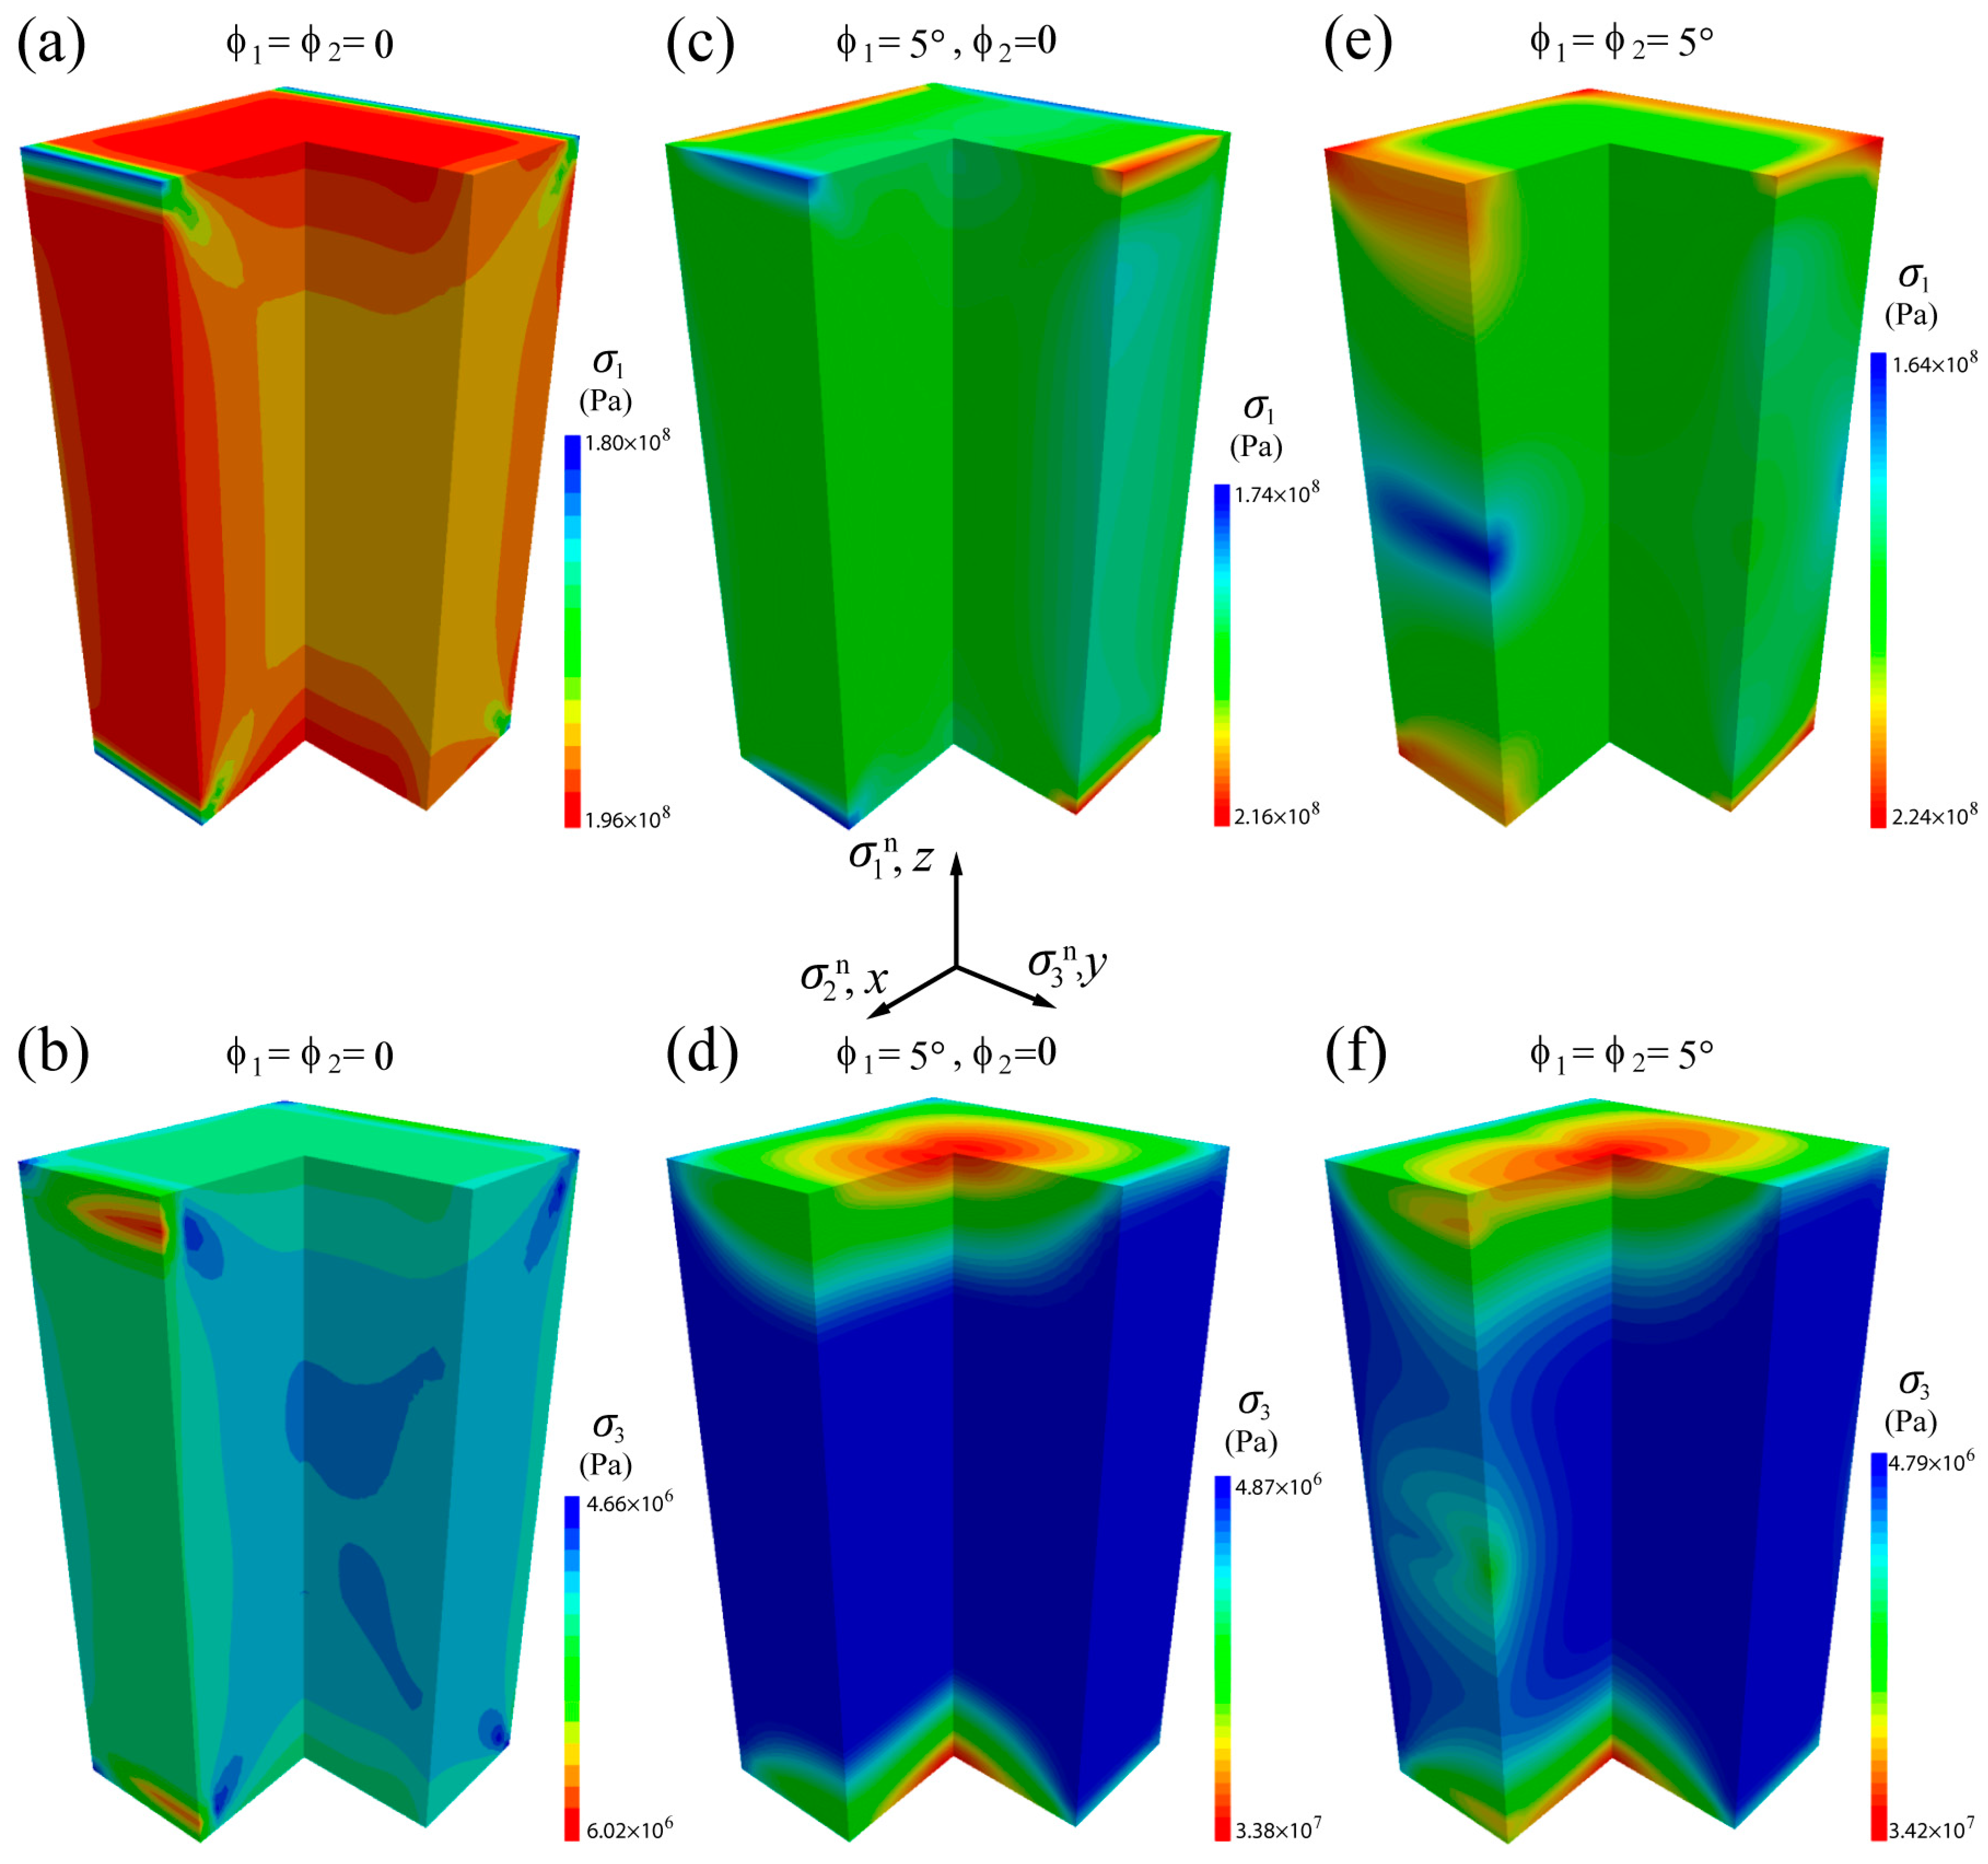
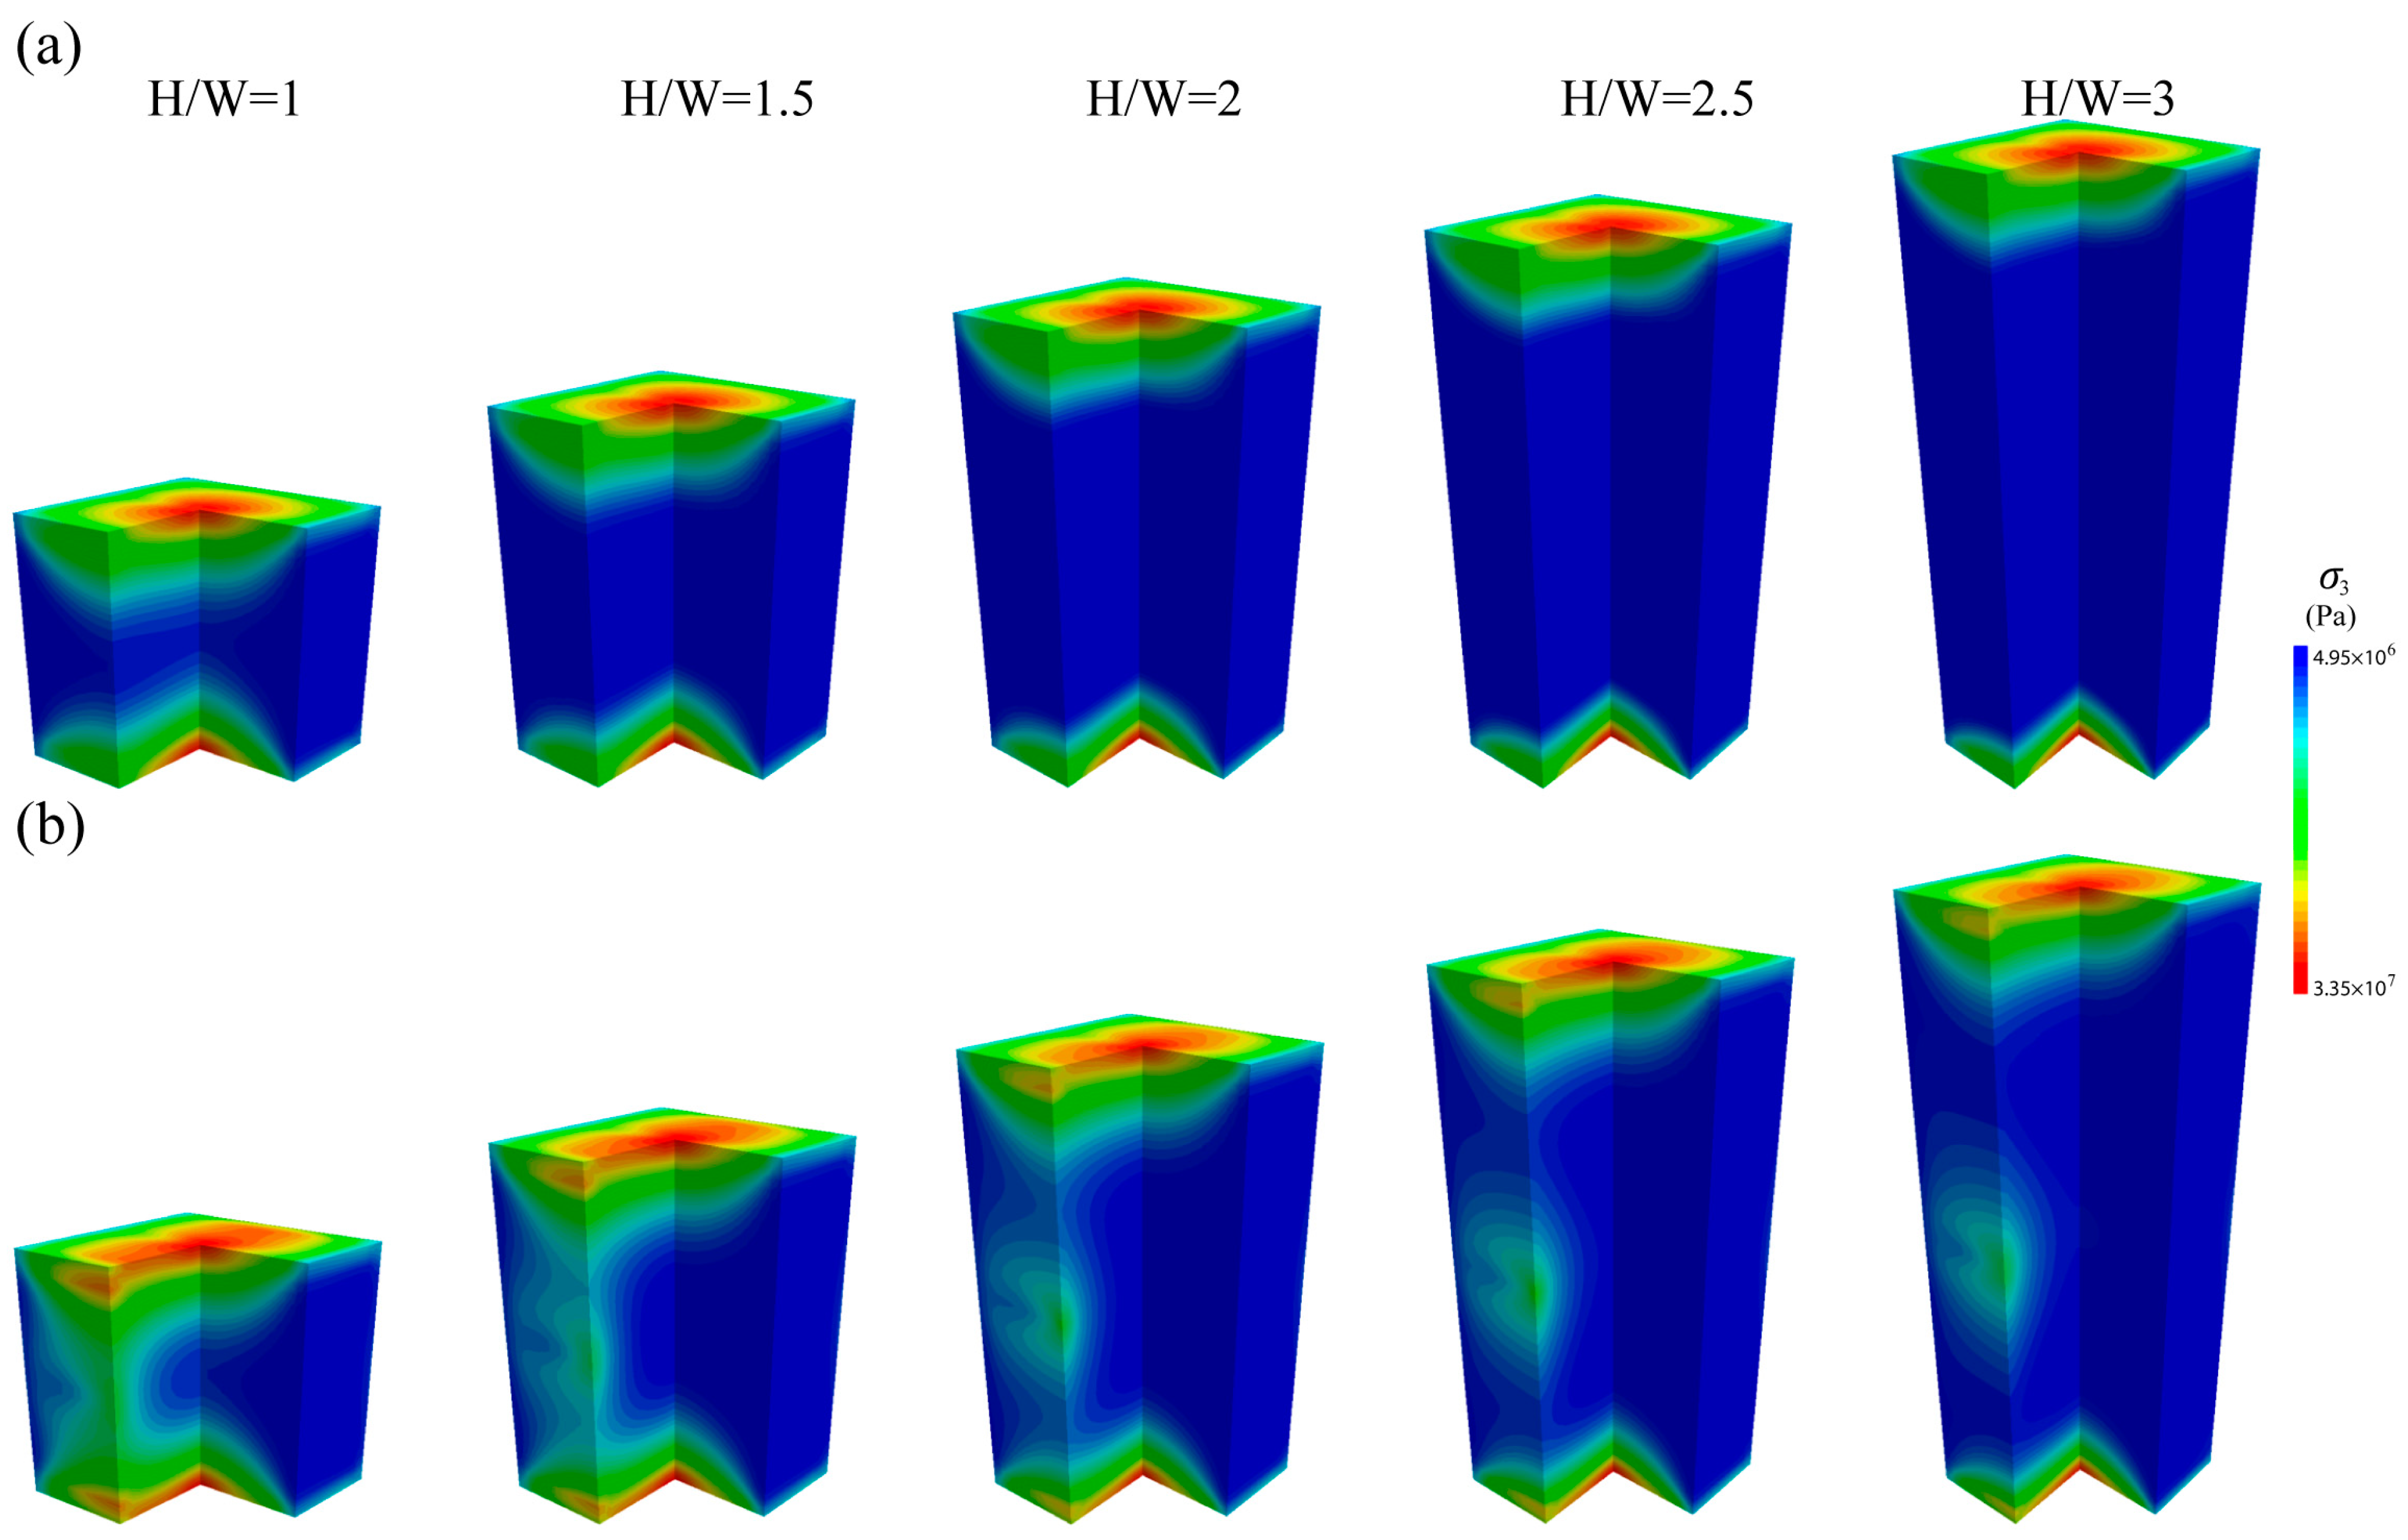
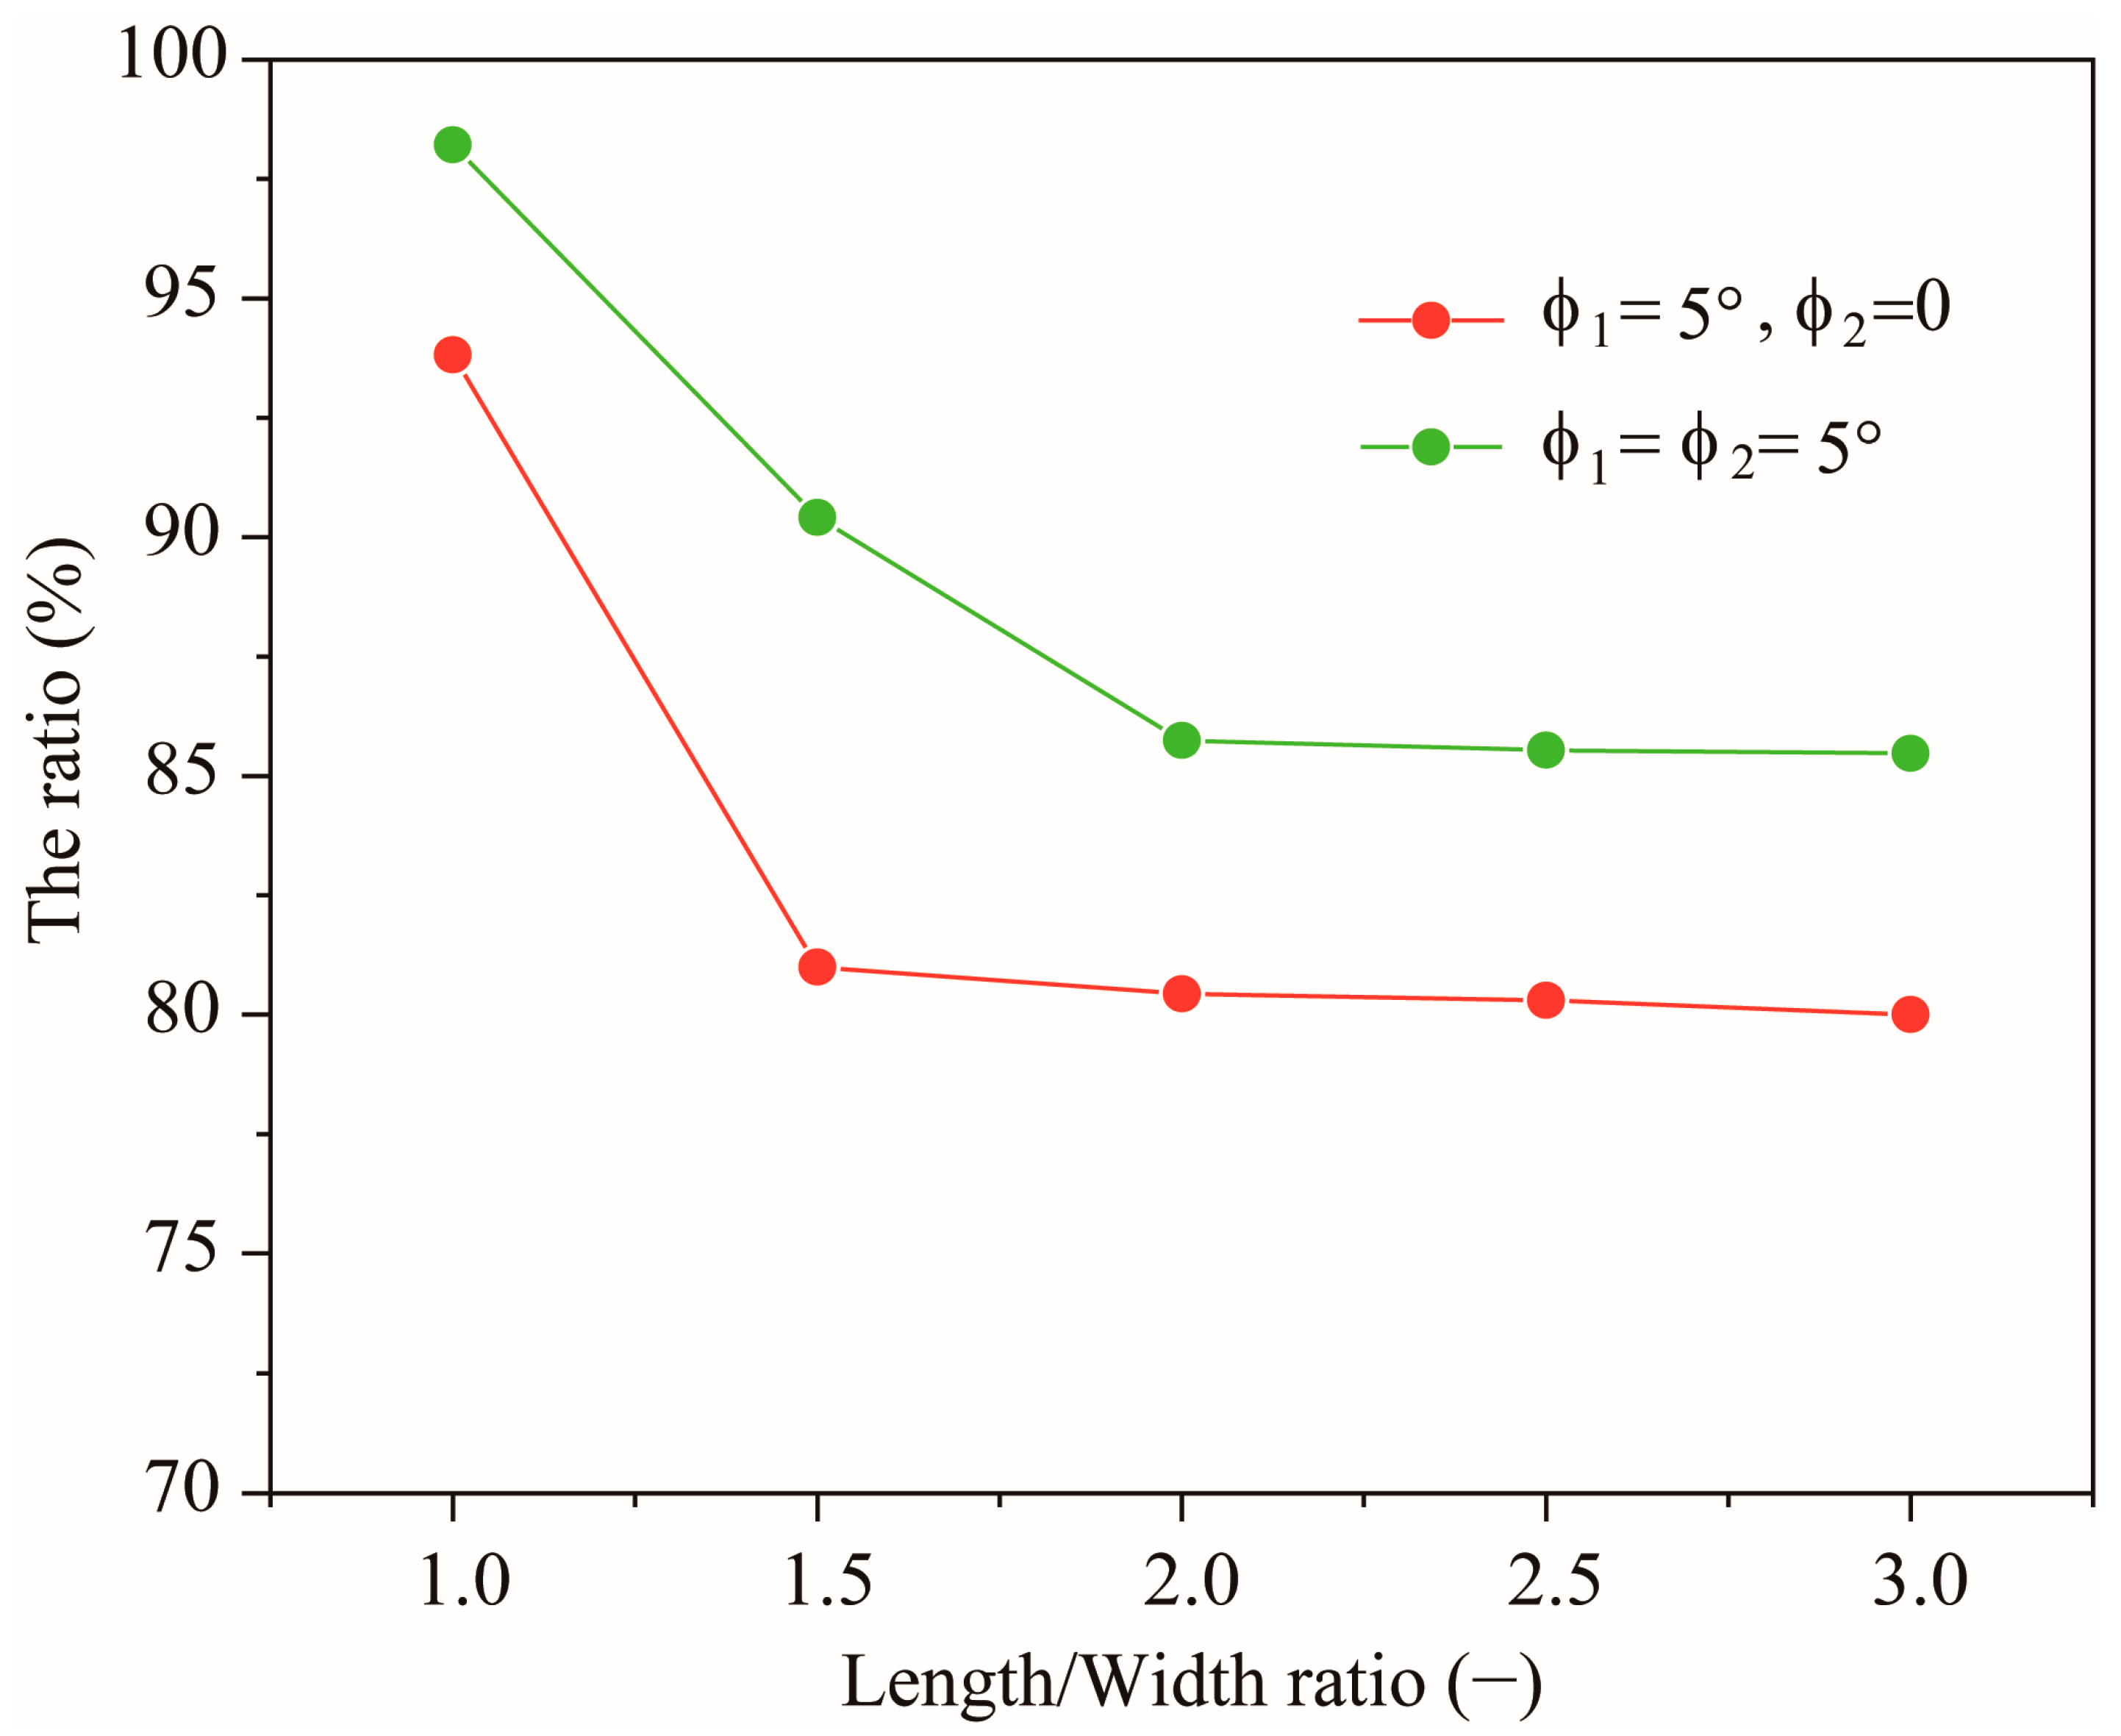
- The shape effect is mainly ascribed to the end effect, which is caused by the mismatch in the elastic parameters between steel platen and rocks. Stress distribution within the specimen becomes not uniform due to the end effect. The stress heterogeneity grows practically as the slenderness ratio decreases. This heterogeneity could be mostly reflected by the highly confined zones near the vicinity of specimen faces in contact with platens.
- (3)
- The actual intrinsic shape of the envelope in at each is partly uplifted due to the end effect. It seems that the intrinsic shape should be symmetrical, but more relevant research studies are needed to confirm this point.
Author Contributions
Funding
Informed Consent Statement
Data Availability Statement
Conflicts of Interest
References
- Chen, J.; Yang, R.; Kang, Y. Influence of the Rock Length-to-Diameter Ratio and Failure Modes on Uniaxial Compression Strength. Geotech. Geol. Eng. 2020, 38, 2551–2557. [Google Scholar] [CrossRef]
- Thuro, K.; Plinninger, R.J. Scale effects in rock strength properties. Part 1: Unconfined compressive test and Brazilian test. In Rock Mechanics-A Challenge for Society; ISRM: Espoo, Finland, 2001; pp. 169–174. [Google Scholar]
- Li, X.; Li, X.; Lu, W.; Lu, W.; He, Y.; He, Y. 3D Mechanical Characters and Their Fabric Evolutions of Granular Materials by DEM Simulation. Math. Probl. Eng. 2022, 2022, 4765887. [Google Scholar] [CrossRef]
- Yan, J.; Gong, F.; Luo, S. Effects of length-to-diameter ratio on energy storage characteristics of rock materials under uniaxial compression. Bull. Eng. Geol. Environ. 2022, 81, 508. [Google Scholar] [CrossRef]
- Pan, P.-Z.; Feng, X.-T.; Hudson, J.A. Study of failure and scale effects in rocks under uniaxial compression using 3D cellular automata. Int. J. Rock Mech. Min. Sci. 2009, 46, 674–685. [Google Scholar] [CrossRef]
- Liang, C.Y.; Zhang, Q.B.; Li, X.; Xin, P. The effect of specimen shape and strain rate on uniaxial compressive behavior of rock material. Bull. Eng. Geol. Environ. 2015, 75, 1669–1681. [Google Scholar] [CrossRef]
- Zou, C.; Wong, L.N.Y. Size and Geometry Effects on the Mechanical Properties of Carrara Marble Under Dynamic Loadings. Rock Mech. Rock Eng. 2016, 49, 1695–1708. [Google Scholar] [CrossRef]
- Gao, M.; Liang, Z.; Li, Y.; Wu, X.; Zhang, M. End and shape effects of brittle rock under uniaxial compression. Arab. J. Geosci. 2018, 11, 614. [Google Scholar] [CrossRef]
- Peng, J.; Wong, L.N.Y.; Teh, C.I. A re-examination of slenderness ratio effect on rock strength: Insights from DEM grain-based modelling. Eng. Geol. 2018, 246, 245–254. [Google Scholar] [CrossRef]
- Brady, B. Effects of inserts on the elastic behavior of cylindrical materials loaded between rough end-plates. Int. J. Rock Mech. Min. Sci. Géoméch. Abstr. 1971, 8, 357–369. [Google Scholar] [CrossRef]
- Labuz, J.; Bridell, J. Reducing Frictional Constraint in Compression Testing through Lubrication; University of Minnesota: Minneapolis, MN, USA, 1991. [Google Scholar]
- Labuz, J.; Bridell, J. Reducing frictional constraint in compression testing through lubrication. Int. J. Rock Mech. Min. Sci. 1993, 30, 451–455. [Google Scholar] [CrossRef]
- Pellegrino, A.; Sulem, J.; Barla, G. The effects of slenderness and lubrication on the uniaxial behavior of a soft limestone. Int. J. Rock Mech. Min. Sci. 1997, 34, 333–340. [Google Scholar] [CrossRef]
- Shi, L.; Li, X.C. Analysis of end friction effect in true triaxial test. Rock Soil Mech. 2009, 30, 1159–1164. (In Chinese) [Google Scholar] [CrossRef]
- Feng, X.-T.; Zhang, X.; Yang, C.; Kong, R.; Liu, X.; Peng, S. Evaluation and reduction of the end friction effect in true triaxial tests on hard rocks. Int. J. Rock Mech. Min. Sci. 2017, 97, 144–148. [Google Scholar] [CrossRef]
- Shi, L.; Li, X.; Bing, B.; Wang, A.; Zeng, Z.; He, H. A Mogi-Type True Triaxial Testing Apparatus for Rocks With Two Moveable Frames in Horizontal Layout for Providing Orthogonal Loads. Geotech. Test. J. 2017, 40, 542–558. [Google Scholar] [CrossRef]
- Xu, Y.; Cai, M.; Zhang, X.; Feng, X. Influence of end effect on rock strength in true triaxial compression test. Can. Geotech. J. 2017, 54, 862–880. [Google Scholar] [CrossRef]
- Chen, J.; Chemenda, A.I. Numerical Simulation of True 3D Rock Tests with Classical and New Three-Invariant Constitutive Models Focusing on the End Effects. Arab. J. Sci. Eng. 2020, 45, 9367–9378. [Google Scholar] [CrossRef]
- Xu, Y.; Cai, M.; Feng, X.; Zhang, X.; Li, Y. A method to remove end effect for the determination of intrinsic 3D rock strength envelopes. Int. J. Rock Mech. Min. Sci. 2020, 131, 104353. [Google Scholar] [CrossRef]
- Pan, P.Z.; Zhou, H. Research on effect of loading conditions on failure processes of rocks with different sizes under uniaxial compression. CJRME 2008, 27, 3636–3642. Available online: http://schlr-cnki-net-s.tsgvpn.xhu.edu.cn:8118/Detail/doi/GARJ0010_4/SJWTD7546212D068A646A11329C1BE2B289A (accessed on 10 February 2008). (In Chinese).
- Qi, C.; Wang, M.; Bai, J.; Wei, X.; Wang, H. Investigation into size and strain rate effects on the strength of rock-like materials. Int. J. Rock Mech. Min. Sci. 2016, 86, 132–140. [Google Scholar] [CrossRef]
- Xu, Y.H.; Cai, M. Influence of Loading System Stiffness on Post-peak Stress–Strain Curve of Stable Rock Failures. Rock Mech. Rock Eng. 2017, 50, 2255–2275. [Google Scholar] [CrossRef]
- Bieniawski, Z.; Bernede, M. Suggested methods for determining the uniaxial compressive strength and deformability of rock materials. Int. J. Rock Mech. Min. Sci. Géoméch. Abstr. 1979, 16, 135–140. [Google Scholar] [CrossRef]
- Philadelphia, P.A. Annual Book of ASTM Standards; American Society for Testing and Materials: West Conshohocken, PA, USA, 2014. [Google Scholar]
- Mogi, K. Fracture and flow of rocks under high triaxial compression. J. Geophys. Res. 1971, 76, 1255–1269. [Google Scholar] [CrossRef]
- Takahashi, M.; Koide, H. Effect of the intermediate principal stress on strength and deformation behavior of sedimentary rocks at the depth shallower than 2000 m. ISRM 1989, 30, 19–26. [Google Scholar]
- Chang, C.; Haimson, B. True triaxial strength and deformability of the German Continental Deep Drilling Program (KTB) deep hole amphibolite. J. Geophys. 2000, 105, 18999–19013. [Google Scholar] [CrossRef]
- Haimson, B.; Chang, C. A new true triaxial cell for testing mechanical properties of rock, and its use to determine rock strength and deformability of Westerly granite. Int. J. Rock Mech. Min. Sci. 2000, 37, 285–296. [Google Scholar] [CrossRef]
- Ingraham, M.D.; Issen, K.A.; Holcomb, D.J. Response of Castlegate sandstone to true triaxial states of stress. J. Geophys. Res. 2013, 118, 536–552. [Google Scholar] [CrossRef]
- Feng, X.-T.; Zhang, X.; Kong, R.; Wang, G. A Novel Mogi Type True Triaxial Testing Apparatus and Its Use to Obtain Complete Stress–Strain Curves of Hard Rocks. Rock Mech. Rock Eng. 2016, 49, 1649–1662. [Google Scholar] [CrossRef]
- Li, M.; Yin, G.; Xu, J.; Li, W.; Song, Z.; Jiang, C. A Novel True Triaxial Apparatus to Study the Geomechanical and Fluid Flow Aspects of Energy Exploitations in Geological Formations. Rock Mech. Rock Eng. 2016, 49, 4647–4659. [Google Scholar] [CrossRef]
- Ma, X.; Rudnicki, J.W.; Haimson, B.C. Failure characteristics of two porous sandstones subjected to true triaxial stresses. J. Geophys. Res. 2016, 121, 6477–6498. [Google Scholar] [CrossRef]
- Fan, P.X.; Li, Y. End friction effect of Mogi type true-triaxial test apparatus. Chin. J. Rock Mech. Eng. 2017, 36, 2720–2730. [Google Scholar] [CrossRef]
- Feng, X.-T.; Kong, R.; Zhang, X.; Yang, C. Experimental Study of Failure Differences in Hard Rock Under True Triaxial Compression. Rock Mech. Rock Eng. 2019, 52, 2109–2122. [Google Scholar] [CrossRef]
- Li, X.; Feng, F.; Li, D.; Du, K.; Ranjith, P.G.; Rostami, J. Failure Characteristics of Granite Influenced by Sample Height-to-Width Ratios and Intermediate Principal Stress Under True-Triaxial Unloading Conditions. Rock Mech. Rock Eng. 2018, 51, 1321–1345. [Google Scholar] [CrossRef]
- Feng, F.; Li, X.; Rostami, J.; Peng, D.; Li, D.; Du, K. Numerical Investigation of Hard Rock Strength and Fracturing under Polyaxial Compression Based on Mogi-Coulomb Failure Criterion. Int. J. Géoméch. 2019, 19, 04019005. [Google Scholar] [CrossRef]
- Zhang, S.; Wu, S.; Zhang, G. Strength and deformability of a low-porosity sandstone under true triaxial compression conditions. Int. J. Rock Mech. Min. Sci. 2020, 127, 104204. [Google Scholar] [CrossRef]
- Van, V.M.; Van, M.J. Experimental investigation of concrete fracture under uniaxial compression. Mech. Cohes-Frict. Mat. 1996, 1, 115–127. [Google Scholar]
- Itasca Consulting Group. FLAC 3D (Fast Lagrangian Analysis of Continua in 3-Dimensions) 5.0 manual; Itasca Consulting Group: Minneapolis, MN, USA, 2013. [Google Scholar]
- Xu, Y.; Cai, M. Numerical study on the influence of cross-sectional shape on strength and deformation behaviors of rocks under uniaxial compression. Comput. Geotech. 2017, 84, 129–137. [Google Scholar] [CrossRef]
- Mogi, K. Effect of the intermediate principal stress on rock failure. J. Geophys. Res. 1967, 72, 5117–5131. [Google Scholar] [CrossRef]
- Feng, X.-T.; Haimson, B.; Li, X.; Chang, C.; Ma, X.; Zhang, X.; Ingraham, M.; Suzuki, K. ISRM Suggested Method: Determining Deformation and Failure Characteristics of Rocks Subjected to True Triaxial Compression. Rock Mech. Rock Eng. 2019, 52, 2011–2020. [Google Scholar] [CrossRef]
- Jimenez, R.; Ma, X. A note on the strength symmetry imposed by Mogi’s true-triaxial criterion. Int. J. Rock Mech. Min. Sci. 2013, 64, 17–21. [Google Scholar] [CrossRef]


| Slenderness Ratio | Dimension (mm) |
|---|---|
| 1 | 50 × 50 × 50 |
| 1.5 | 50 × 50 × 75 |
| 2 | 50 × 50 × 100 |
| 2.5 | 50 × 50 × 125 |
| 3 | 50 × 50 × 150 |
| Properties | Young’s Modulus GPa | Poisson’s Ratio - | Cohesion MPa | Friction Angle ° | Dilatancy Angle ° | Tension MPa |
|---|---|---|---|---|---|---|
| Specimen | 38 | 0.22 | 19 | 58 | 29 | 7 |
| Cohesion MPa | Plastic Strain - |
|---|---|
| 19 | 0 |
| 16 | 0.008 |
| 9.5 | 0.035 |
| 1 | 0.090 |
Disclaimer/Publisher’s Note: The statements, opinions and data contained in all publications are solely those of the individual author(s) and contributor(s) and not of MDPI and/or the editor(s). MDPI and/or the editor(s) disclaim responsibility for any injury to people or property resulting from any ideas, methods, instructions or products referred to in the content. |
© 2023 by the authors. Licensee MDPI, Basel, Switzerland. This article is an open access article distributed under the terms and conditions of the Creative Commons Attribution (CC BY) license (https://creativecommons.org/licenses/by/4.0/).
Share and Cite
Chen, J.; Long, Y.; Chen, Y.; Liu, X. Numerical Analysis of the Shape Effect on the Mechanical Behaviors of Rocks in True 3D Compression Test. Symmetry 2024, 16, 40. https://doi.org/10.3390/sym16010040
Chen J, Long Y, Chen Y, Liu X. Numerical Analysis of the Shape Effect on the Mechanical Behaviors of Rocks in True 3D Compression Test. Symmetry. 2024; 16(1):40. https://doi.org/10.3390/sym16010040
Chicago/Turabian StyleChen, Junchao, Yuke Long, Yulin Chen, and Xiaofei Liu. 2024. "Numerical Analysis of the Shape Effect on the Mechanical Behaviors of Rocks in True 3D Compression Test" Symmetry 16, no. 1: 40. https://doi.org/10.3390/sym16010040