Abstract
New molecular genetic algorithms, as tools for the visualization and analysis of big data, have made it possible not only to illustrate the internal structure of DNA molecules within their parameters but also to explore the field of chaos theory, particularly to display processes and signals close to chaotic ones. This provides a new perspective on the problem of determining criteria for borderline states between order and chaos. This article demonstrates the differences between chaotic and quasi-chaotic signals when visualized with molecular genetic algorithms. It presents examples of molecular genetic mappings of signals generated using various pseudorandom noise generators, as well as acoustic signals. This article considers structural and integral (folded) mappings as one-dimensional and two-dimensional projections of the pattern. The authors illustrate the internal structure of the reconstructed signal mappings in spaces of fractional dimensionality, which is considered as a visualization of the entropy structure based on functional mappings in spaces of the fractional dimension. As a result of this research, it was found that the use of molecular genetic algorithms for visualizing information signals makes it possible to identify the so-called entropy structure of these signals. At the same time, the entropy structure of chaotic signals is absent.
1. Introduction
The nonlinear dynamics of physical processes in states bordering on chaos and the mathematics behind these phenomena have long interested researchers. Self-organization is a characteristic of many physical and natural phenomena, such as the well-known Belousov–Zhabotinsky oscillatory reactions. Biophysics has shown that quasi-chaotic signals (which are not absolute noise) can contain internal regularities and provide practical information. For example, the electroencephalogram signal is noisy and obtained from the contact surface of the human skin using electrodes, but it contains biorhythms that indicate human brain activity.
In this article, we will address methodological issues regarding the study of various noises and signals using new methods obtained from biophysical research [1,2,3]. To compare chaotic and quasi-chaotic signals, we will use various generators of pseudo-random numbers (“bad” noise generators) and examine various sources of natural noise. In other words, the general essence of this study is reduced to an experiment on the application of mathematical algorithms developed earlier for molecular biology for the analysis of arbitrary signals. Various quasi-chaotic and acoustic signals were used as an example for analysis. As a result, patterns were established and prerequisites for using these methods for processing digital signals were identified.
To conduct our research, we will use visualization methods we have previously developed [1,2,3], based on the principles of matrix analysis of the molecular genetic structure of DNA and RNA molecules. Our visualization methods allow us to display the structure of nucleic acids in different parametric spaces with different dimensions and coordinate systems. These results are useful for visualizing large genetic data sets and the ergonomics of perception. The results we obtain are equally applicable for optimizing artificial intelligence systems, machine learning, and decision support systems. In this article, we will focus on exploring the borderline properties of chaos utilizing these methods.
It is recognized [4] that physical processes can increase the degree of symmetry in a system, whereas the phenomenon of life is based on a violation of symmetry. In article [5], chaos theory was used to analyze ECG signals, where each trajectory includes a phase space region (attractor) for determining the type of arrhythmia. In [6], a hybrid method for optimizing the spatial domain coverage of swarm robots with collective behavior was presented: a chaotic dragonfly algorithm and a chaotic bat algorithm with the optimization of the swarm of accelerated chaotic particles were implemented. Authors of [7] presented a reconfigurable Gaussian noise generator based on Xilinx FPGA for error correction, parity checking, and polar coding technologies. In the work by [8], a random number generator for programmable systems-on-a-chip was presented, using the thermal noise of resistors as the entropy source.
Wide practical applications exist for noise signal visualization technologies. Specifically, in paper [9], an application was developed for the visualization and identification of the geometry and dynamics of urban noise landscapes. In [10], the visualization of electromagnetic field flows was demonstrated. In [11], data on sea temperature (temperature and wind fields), including data on cloudiness and storm surges, were visualized. Furthermore, in [12], the theory of chaos and fractal geometry was analyzed in terms of its influence on culture and the literature. In [13], the authors considered opportunities of utilizing Lagrangian descriptors for the evaluation of molecular systems’ oscillation dynamics and differentiation of structures existing in the phase space. Article [14] describes the synthesis of texture of discrete elements to create molecular agents with chaotic mesoscale environment visualization of molecule interactions.
Simultaneously, research on chaotic and quasi-chaotic sets has a diverse nature. Article [15] describes the interaction of a fractal function with chaotic systems and describes the procedure for reconstructing a self-affine Lorenz attractor. Article [16] proposes a set of complex-similar numbers. The authors illustrated that all chaotic attractors in three dimensions were three-dimensional mappings on a new set. The authors of [17] use an iterative chaotic dragon algorithm. In [18], differential synchronization and chaos control in systems with nonlinear exponential terms were studied. The researchers of [19] put forward a model based on fuzzy logic with a sinusoidal chaos map for sensor fault detection. Article [20] presents a neural network, where synaptic weights were replaced with hyperbolic memristors (memristive neural networks can generate chaos through period-doubling bifurcation and generate various stable and periodic states by changing parameters from diverse initial conditions). The researchers of [21] discuss a class of fractal sorting matrices for an encryption algorithm related to local Shannon entropy. The purpose of paper [22] is to investigate a four-dimensional system with no equilibria. The authors explored the dynamic behavior of the system using phase portraits, Poincare maps, Lyapunov exponents, and others. Further, article [23] investigates the transition properties of the hidden chaotic set of direct current motor dynamics.
2. Materials and Methods
Visualization of the boundary between chaos and order in an ultrametric space has been shown to have practical applications for comparative genetics. Through the study of the DNA of various organisms and viruses, including bacteria [3], it has become evident that nature is prone to the fractal organization of all living things at every level, including the molecular genetic coding level. Many bacteria and microorganisms, in particular, have unique genetic patterns that are extraordinarily diverse and can now be visualized using new imaging methods. These algorithms have already contributed significantly to science by enabling researchers to visualize the structure of DNA [1,2,3].
While radiography is a well-known method for visualizing DNA structures, X-ray images have poor image quality and do not reveal the organization of chromatin structures. Additionally, X-ray radiation is penetrating and ionizing, which can damage the molecule’s structure. It interacts with electrons, knocking them out of atoms, and destroys the structure of the molecule. On the other hand, parametric visualization spaces offer improved advantages over traditional radiography, as they allow for functional mappings of the fractal structure of DNA information, enabling certain genes to be highlighted. This is extremely useful for practical applications in comparative genetics, such as establishing kinship, etc.
By taking a long arbitrary signal and converting it to binary and then to quaternary form through a tetra-representation, molecular genetic algorithms can generate visual representations of the data. It should be noted that the information in the quaternary code is displayed in spaces of the fractional dimension due to the use of the Hadamard matrix, which describes the fundamental properties of nucleotides. The ultrametric properties of these spaces allow for the observation of fractal structures of ordered signals but produce chaotic patterns in the absence of order. As we will demonstrate below, chaotic signals lack any internal structure and produce a chaotic pattern.
Various classical noise generators, developed by different authors in different periods, were explored and visualized to consider the dynamics of chaotic and quasi-chaotic phenomena. The first generators developed historically were not of superior quality and produced some periodicity, resulting in regular patterns that were easily observable utilizing the proposed method. We hypothesize that the use of molecular genetic algorithms and Hadamard matrices can display the signal entropy structure, and parametric visualization in a space of fractional dimensions can reduce signal entropy while increasing its information content.
These studies are of interest from the perspectives of dynamic chaos theory, phase attractors theory, programming theory, and information processing theory. Before describing the experiments and their results, let us review the critical provisions outlined in our previous articles [1,2,3].
The molecular genetic mapping algorithm consists of three main stages. At the first stage, we select a display scale N, which represents the length of the nucleotide sequence, the minimum image unit. In the second stage, we divide the molecular genetic character sequence into fragments of equal length N, according to the minimum display unit chosen in the previous step, with the possibility of overlaps between neighboring fragments of length N.
The step at which the sequence is cut into equal fragments of N nucleotides long is represented with the overlap parameter S. The parameter S falls within
The amount of overlap in the molecular genetic character sequence can vary significantly. For example, when S = 1, only one character remains not overlapped, while if S = N, there is no overlap between the fragments.
The third stage involves constructing various mappings using coding in different coordinate systems. Each nucleotide is encoded using physicochemical parameters (sub-alphabets) such as purine/pyrimidine, keto/amino, and 2 or 3 hydrogen bonds. In other words, after choosing the method for setting the coding matrix (in this article, we only deal with the Hadamard nucleotide matrix, which is used in molecular genetic algorithms [1,2,3]), the basic algorithm consists of three main stages: scaling (choosing the scale parameter N); cutting the sequence into equal parts across all sub-alphabets; and building a visual representation in a particular geometric space.
There are various options for structural mapping spaces, as discussed in our previous articles [1,2,3]. The main steps and parameters of the generalized algorithm are presented in Table 1.

Table 1.
Variants, parameters, and generalizations of the molecular genetic algorithm.
Integral mappings are generated based on structural mappings, representing their convolutions and considering the total amount of each of the physical and chemical parameters within each minimum possible display unit.
2.1. Estimation of the Dimensions of Objects of Discrete Geometry Displaying Representations of the Nucleotide Composition
An estimate of the dimension of the representation of the nucleotide composition based on the considerations of the founder of the theory of dimension of P.S. Uryson:
where d is the dimension; N is the equality of the numbers of parts into which the object is considered; and k is the similarity coefficient between parts. Let us calculate the dimension of the Sierpinski tetrahedron, which defines the triple nucleotide Walsh functions. The dimension of the dts Sierpinski tetrahedron is derived:
Thus, each of the two dimensions is characterized by the ratio of three coordinates to two dimensions.
2.2. Computational Limitations of the Method
As the visualization scale increases, the amount of RAM required increases exponentially; therefore, the capabilities of modern computers do not allow visualizing long genetic sequences with arbitrarily large detail. In order to visualize the orderliness and internal patterns of genetic coding or large volumes of signals on arbitrarily large scales, it is required to develop specialized software or firmware solutions to solve problems with memory allocation. This is due to the problem of bit depth when constructing structural visualizations, where decimal representations of binary numbers are used. The computer architecture does not allow considering values greater than the maximum stored in memory. On a 64-bit architecture, the maximum stored integer is 264.
To partially solve this problem, the authors used software methods for working with large numbers and floating-point numbers.
3. Results and Discussion
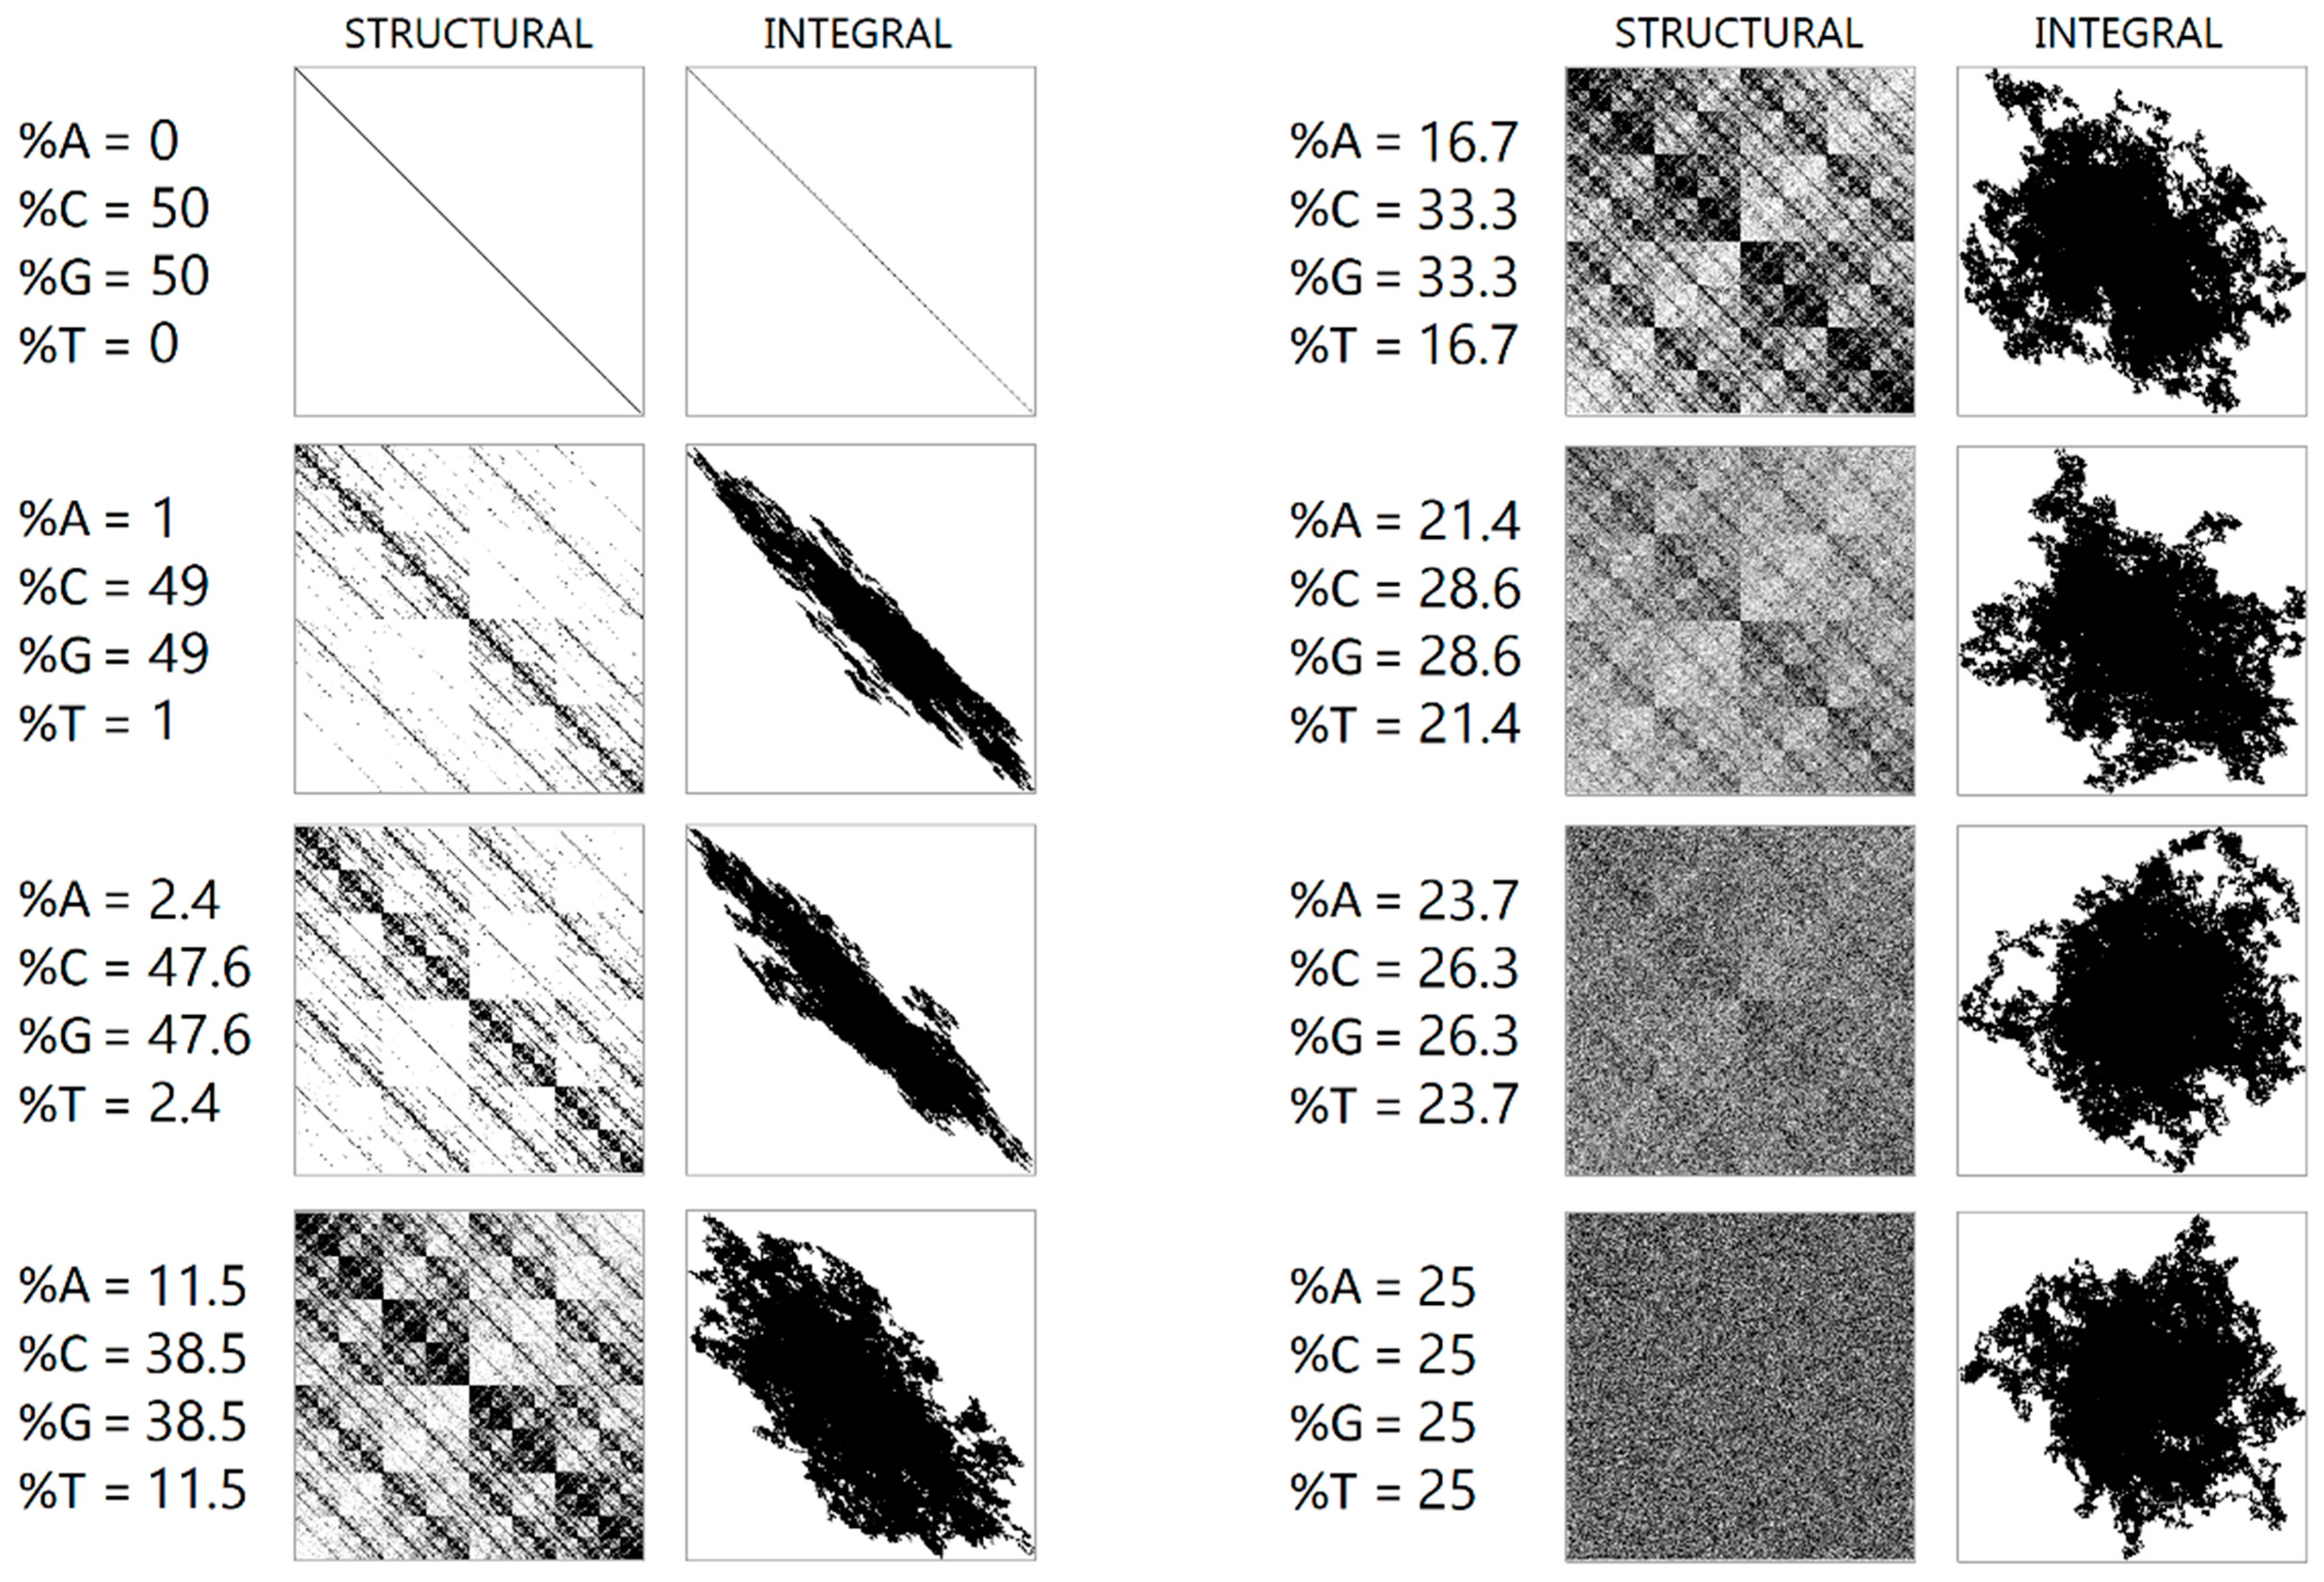
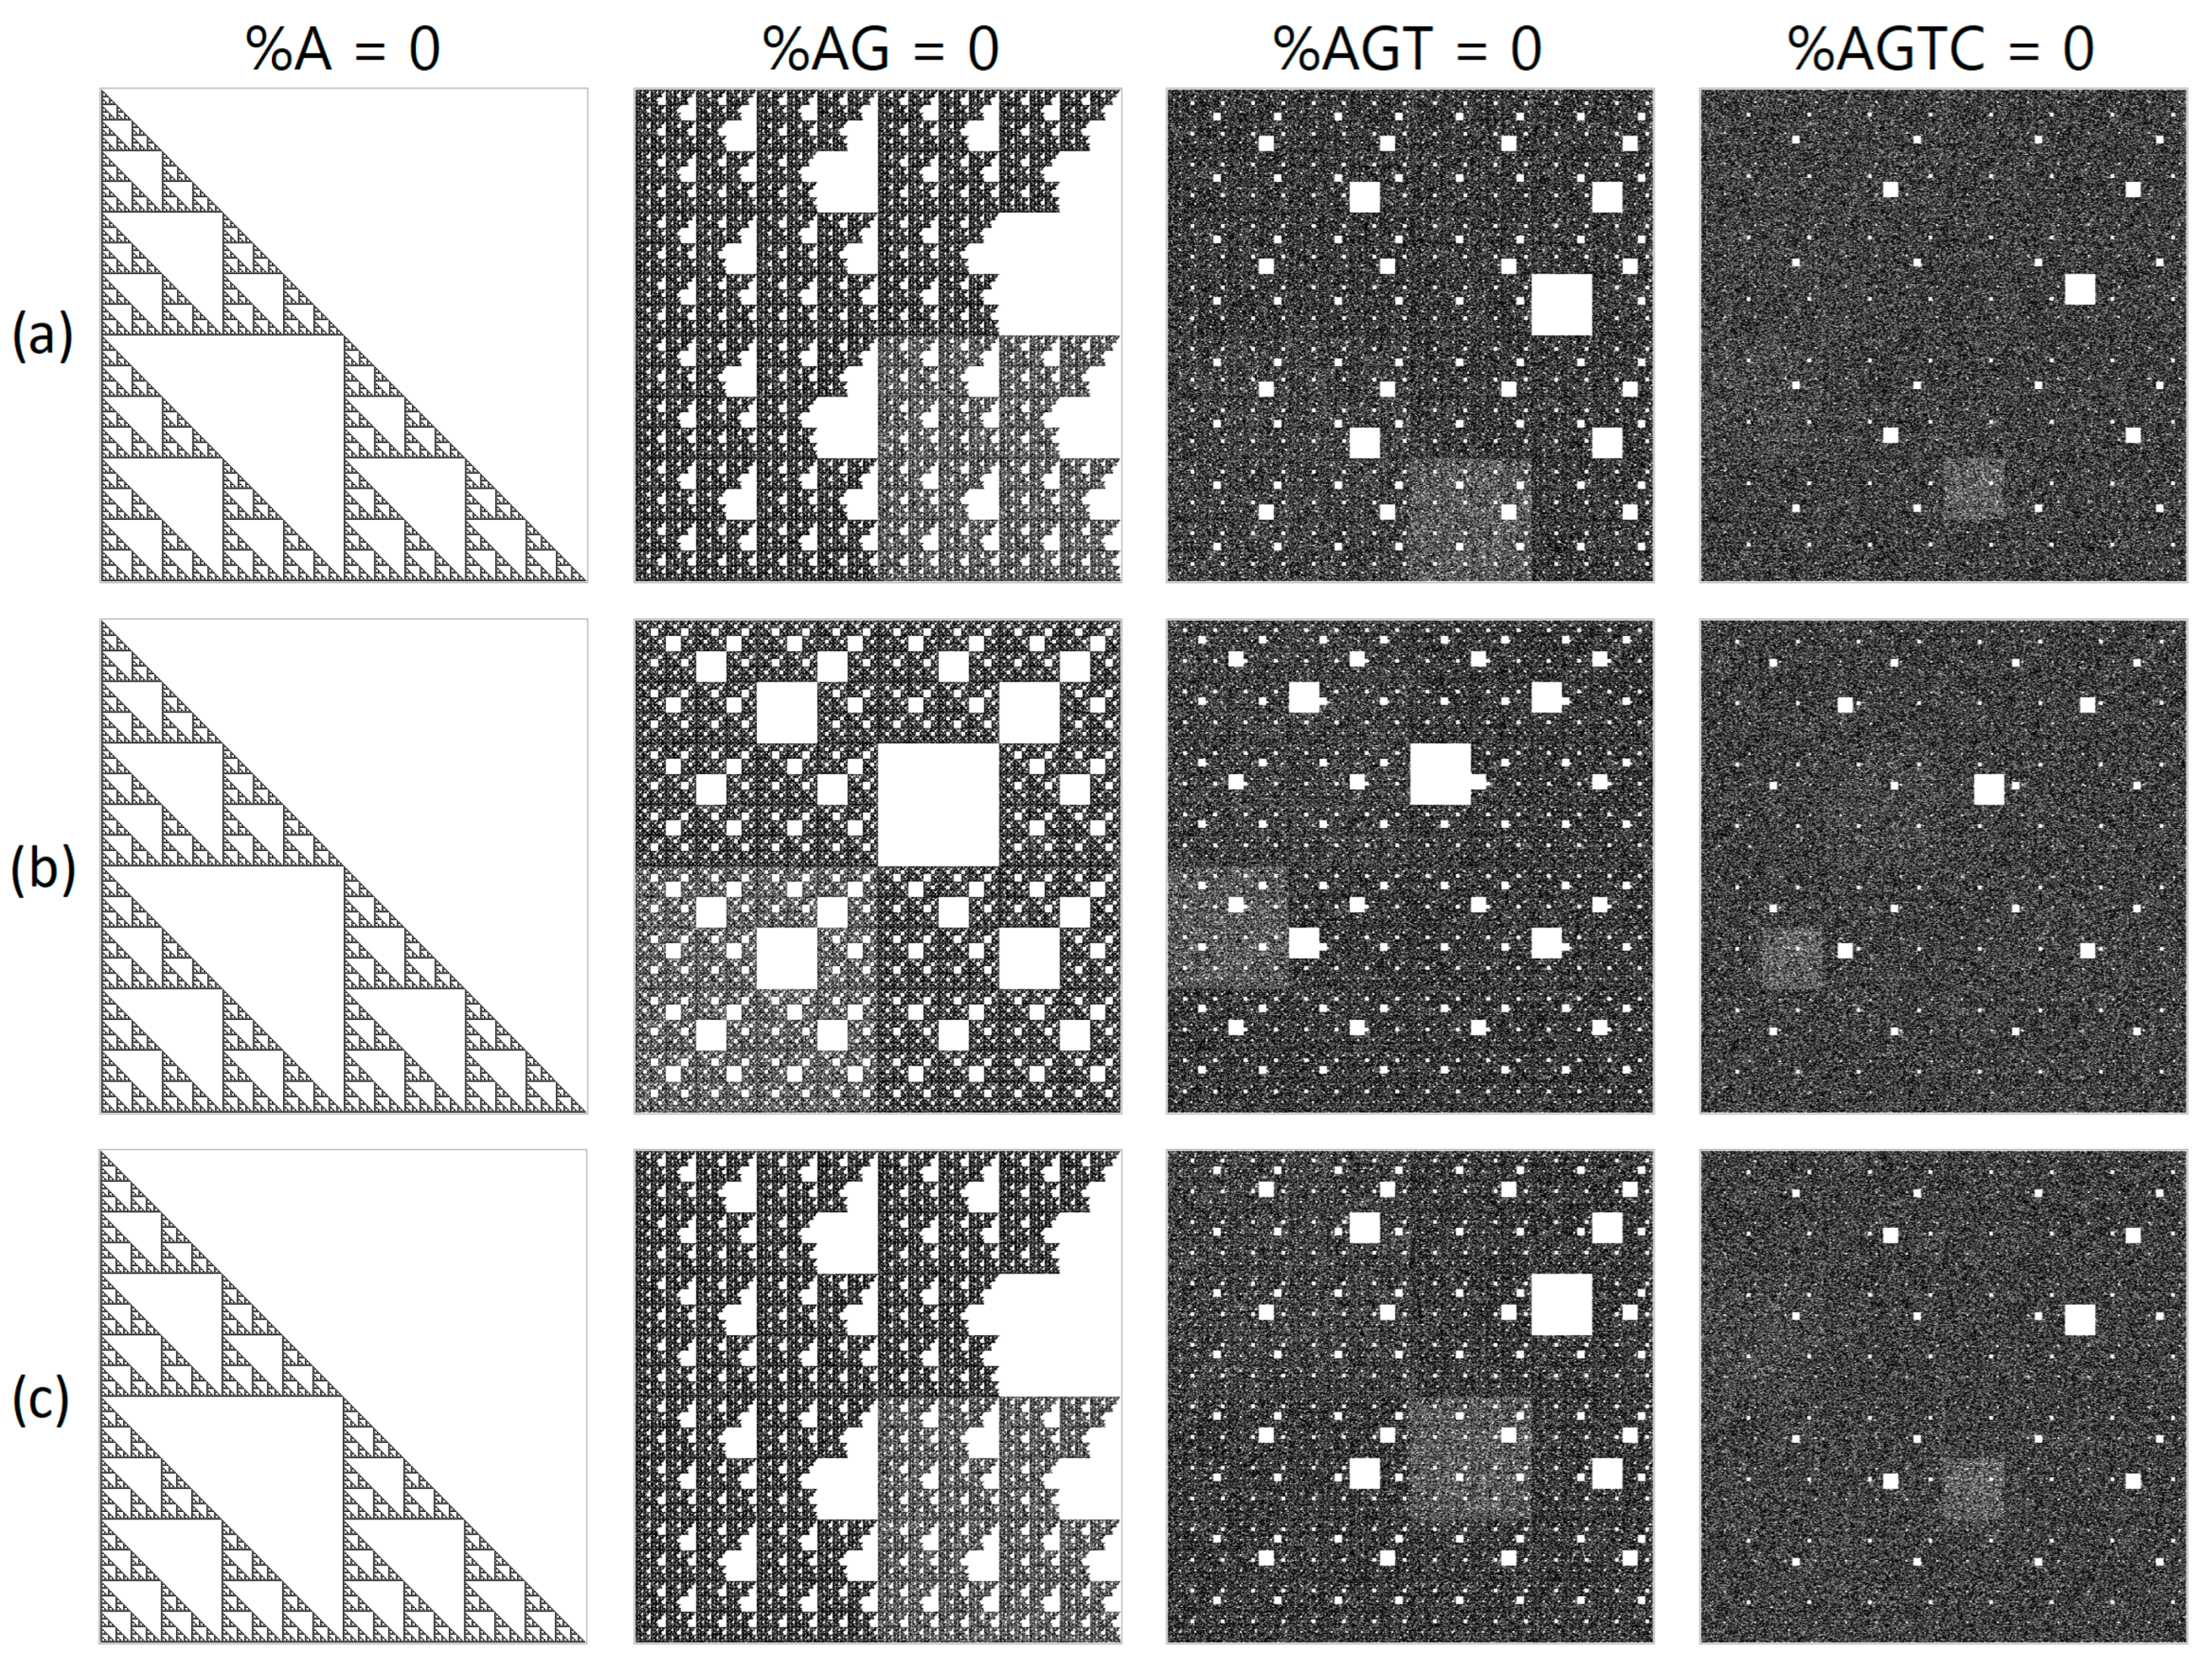
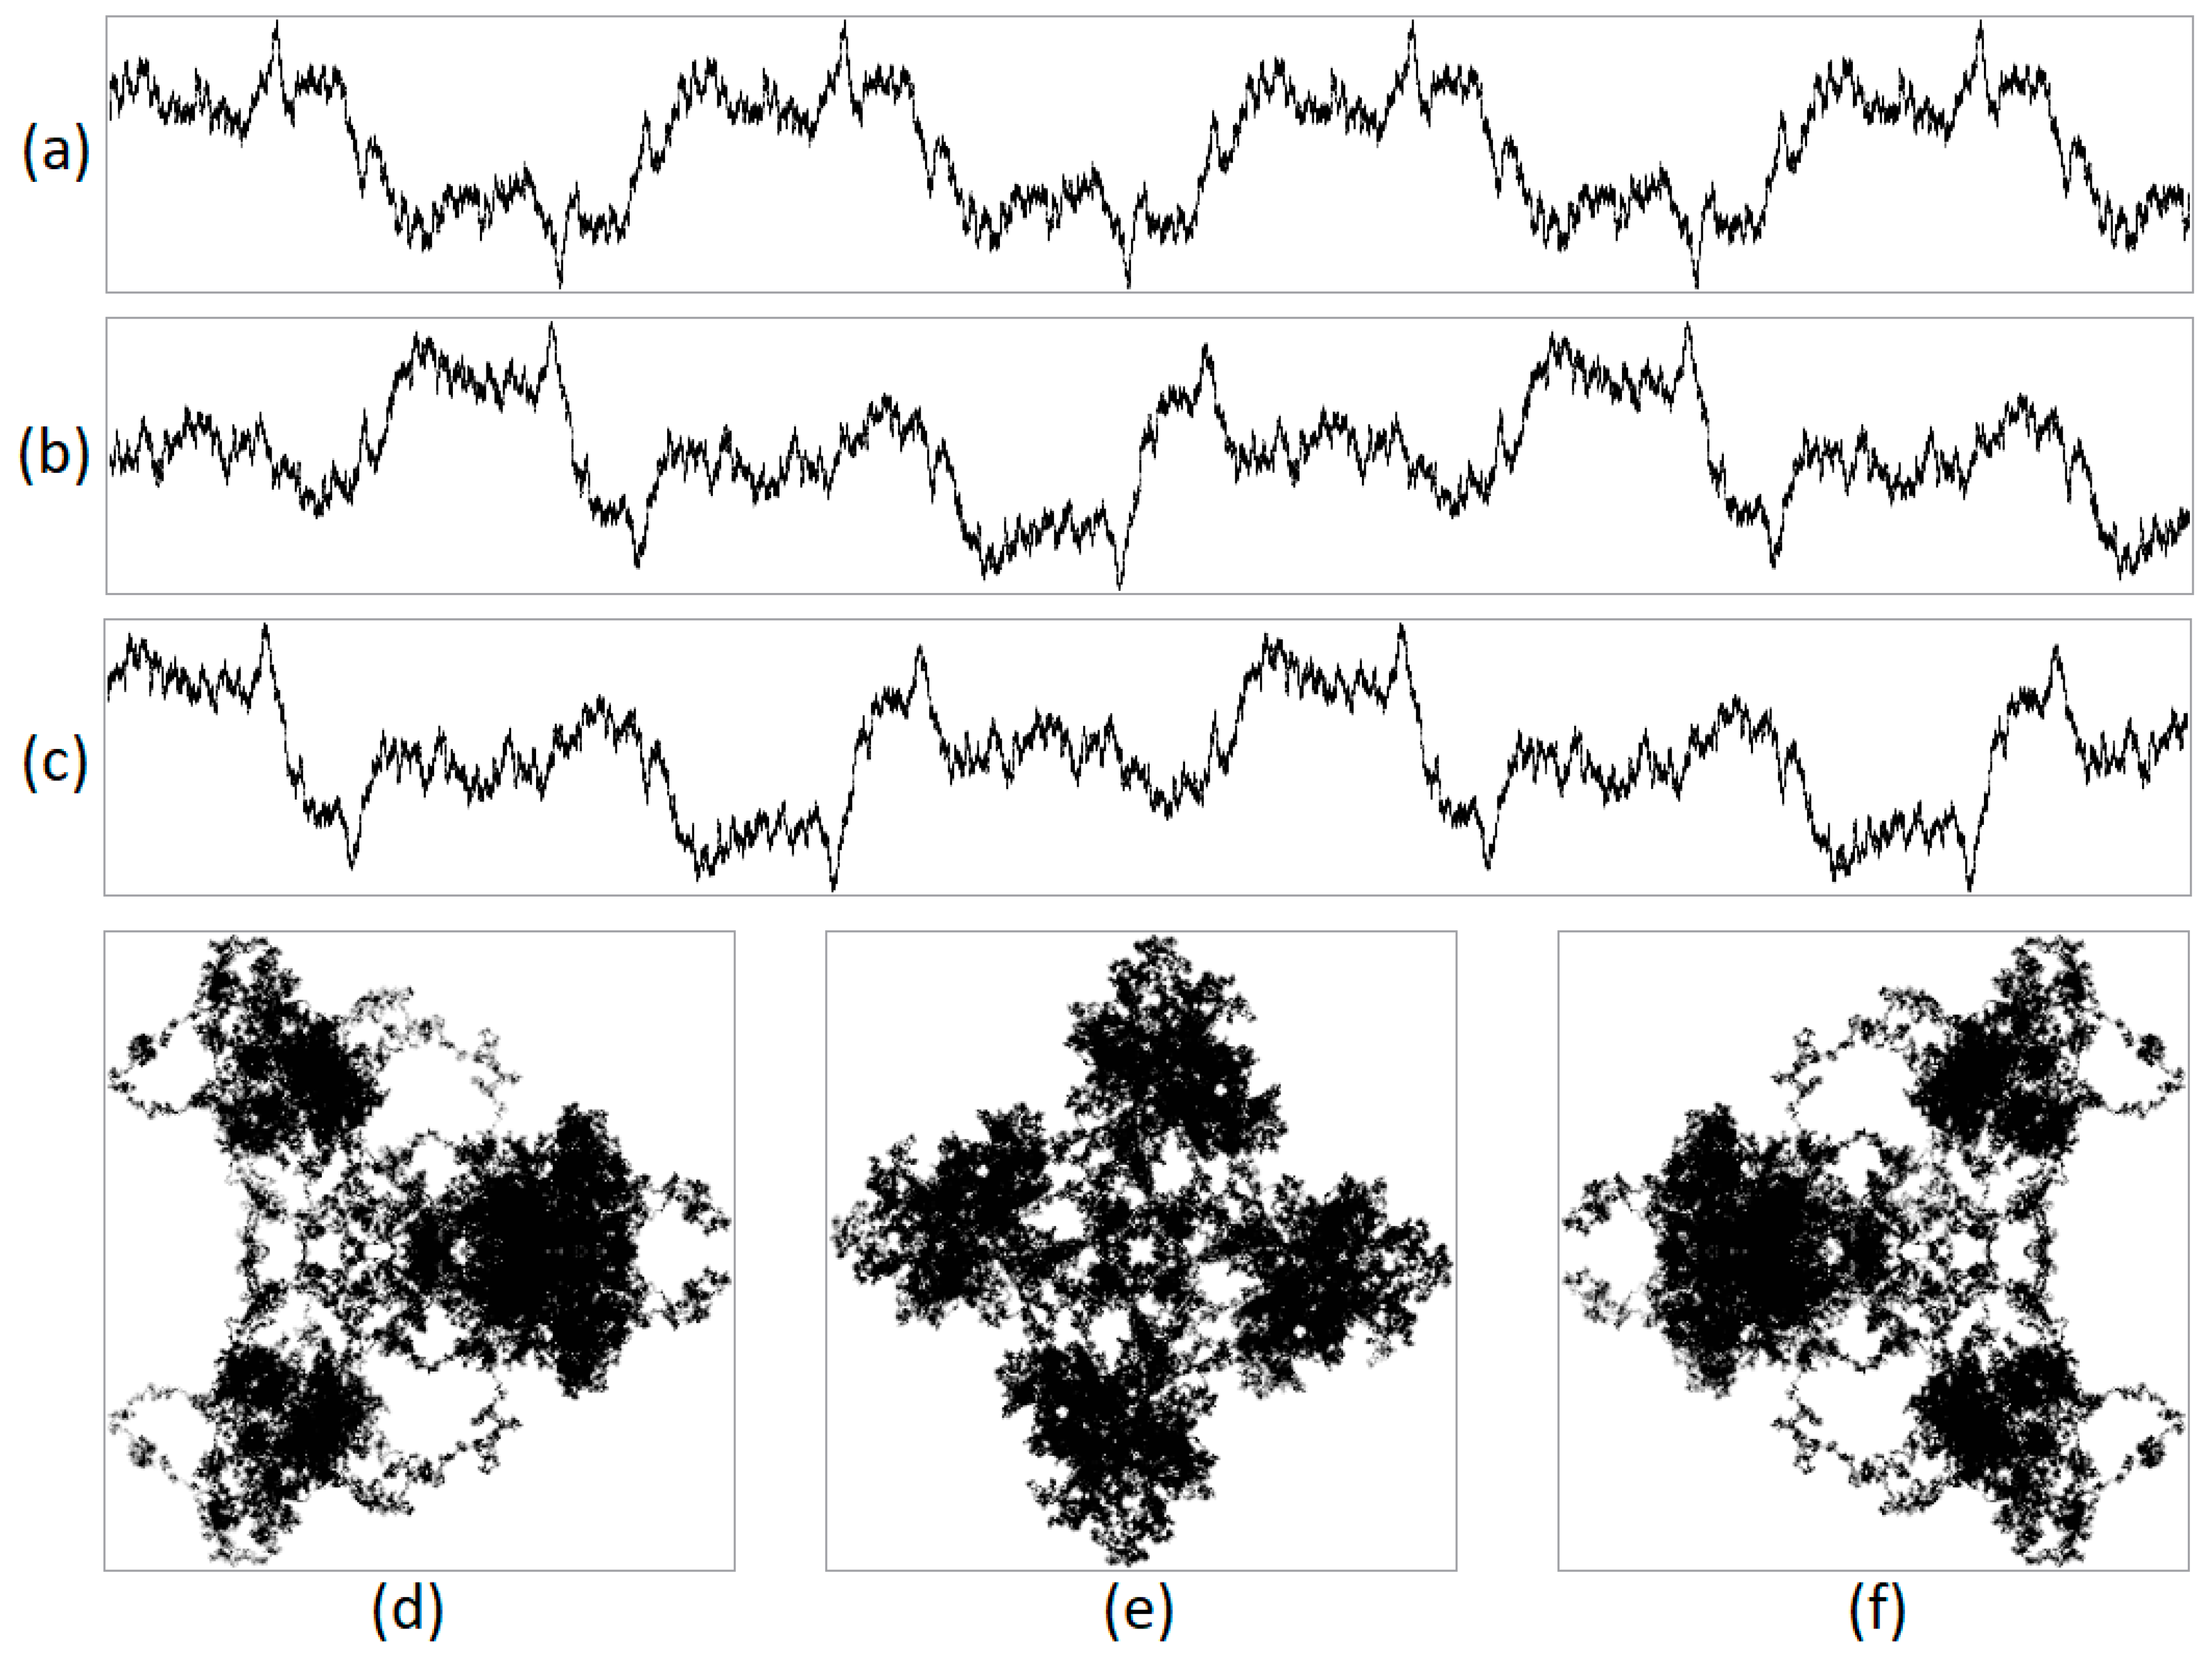
During numerical experiments, pseudo-random symbolic genetic sequences were generated. Mappings were constructed with different scaling parameters (N). Figure 1 displays the results of randomly generated genetic sequences of length 500,000 with different ratios of nucleotides. Figure 2 shows the mappings for a randomly generated sequence with deletions of sub-strings “A”, “AG”, “AGT”, and “AGTC”. Examples of the operation of the pseudo-random sequence generator during the synthesis of a 500,000-character nucleotide sequence are presented in Figure 3.
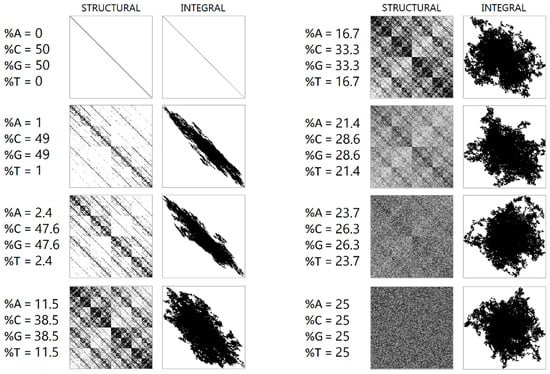
Figure 1.
A visualization of a randomly generated sequence of 500,000 letters with different nucleotide ratios is shown. The left column shows a structural visualization at N = 16, while the right column shows an integral visualization at N = 10,000.
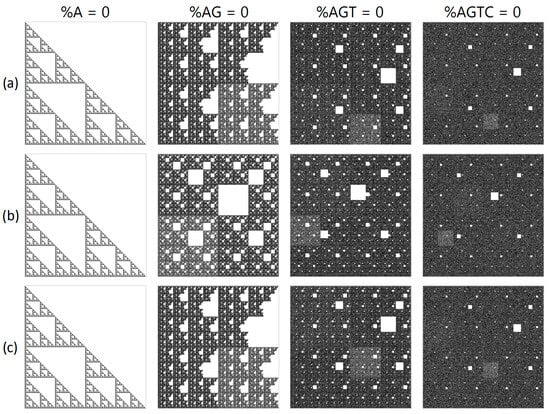
Figure 2.
A structural visualization at N = 16 of a randomly generated sequence with the removal of particular sub-strings of nucleotides. The first column depicts all “A” nucleotides removed; the second column shows sub-strings “AG” removed; the third column demonstrates sub strings “AGT” removed; and the fourth column has “AGTC” sub-strings removed. The projections shown are (a) XY, (b) YZ and, (c) XZ, where X denotes purines/pyrimidines; Y represents amino/keto; and Z represents the number of hydrogen bonds.
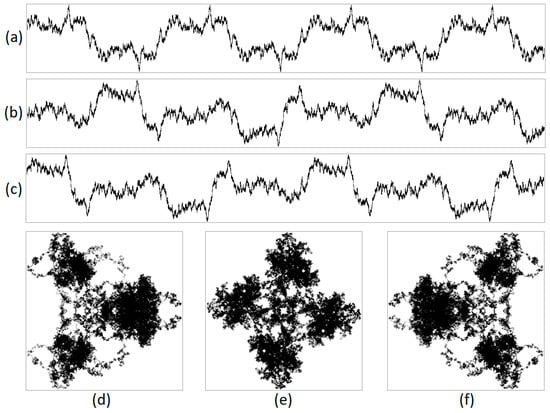
Figure 3.
An example of the operation of a pseudo-random sequence generator is illustrated. This figure includes an integrated visualization at N = 20,000, with a sequence length of 500,000 nucleotides. The projections are (a) X, (b) Y, (c) Z, (d) XY, (e) YZ, and (f) XZ, where X denotes purines/pyrimidines; Y denotes amino/keto; and Z represents the number of hydrogen bonds. It is demonstrated that the generator loops.
Entropy Transformations of Chaotic and Quasi-Chaotic Sets in Acoustic Signal Processing
The conversion of an acoustic signal into a sequence of nucleotides is accomplished by converting each amplitude into a binary representation and encoding each binary pair into the corresponding nucleotide under the following rule:
00 → A, 01 → C, 10 → G, 11 → T.
Depending on the resolution of the digital acoustic signal, each amplitude will correspond to a specific number of nucleotides. For example, for an 8-bit signal, each amplitude corresponds to 4 nucleotides. Similarly, with a 16-bit signal, each amplitude corresponds to 8 nucleotides.
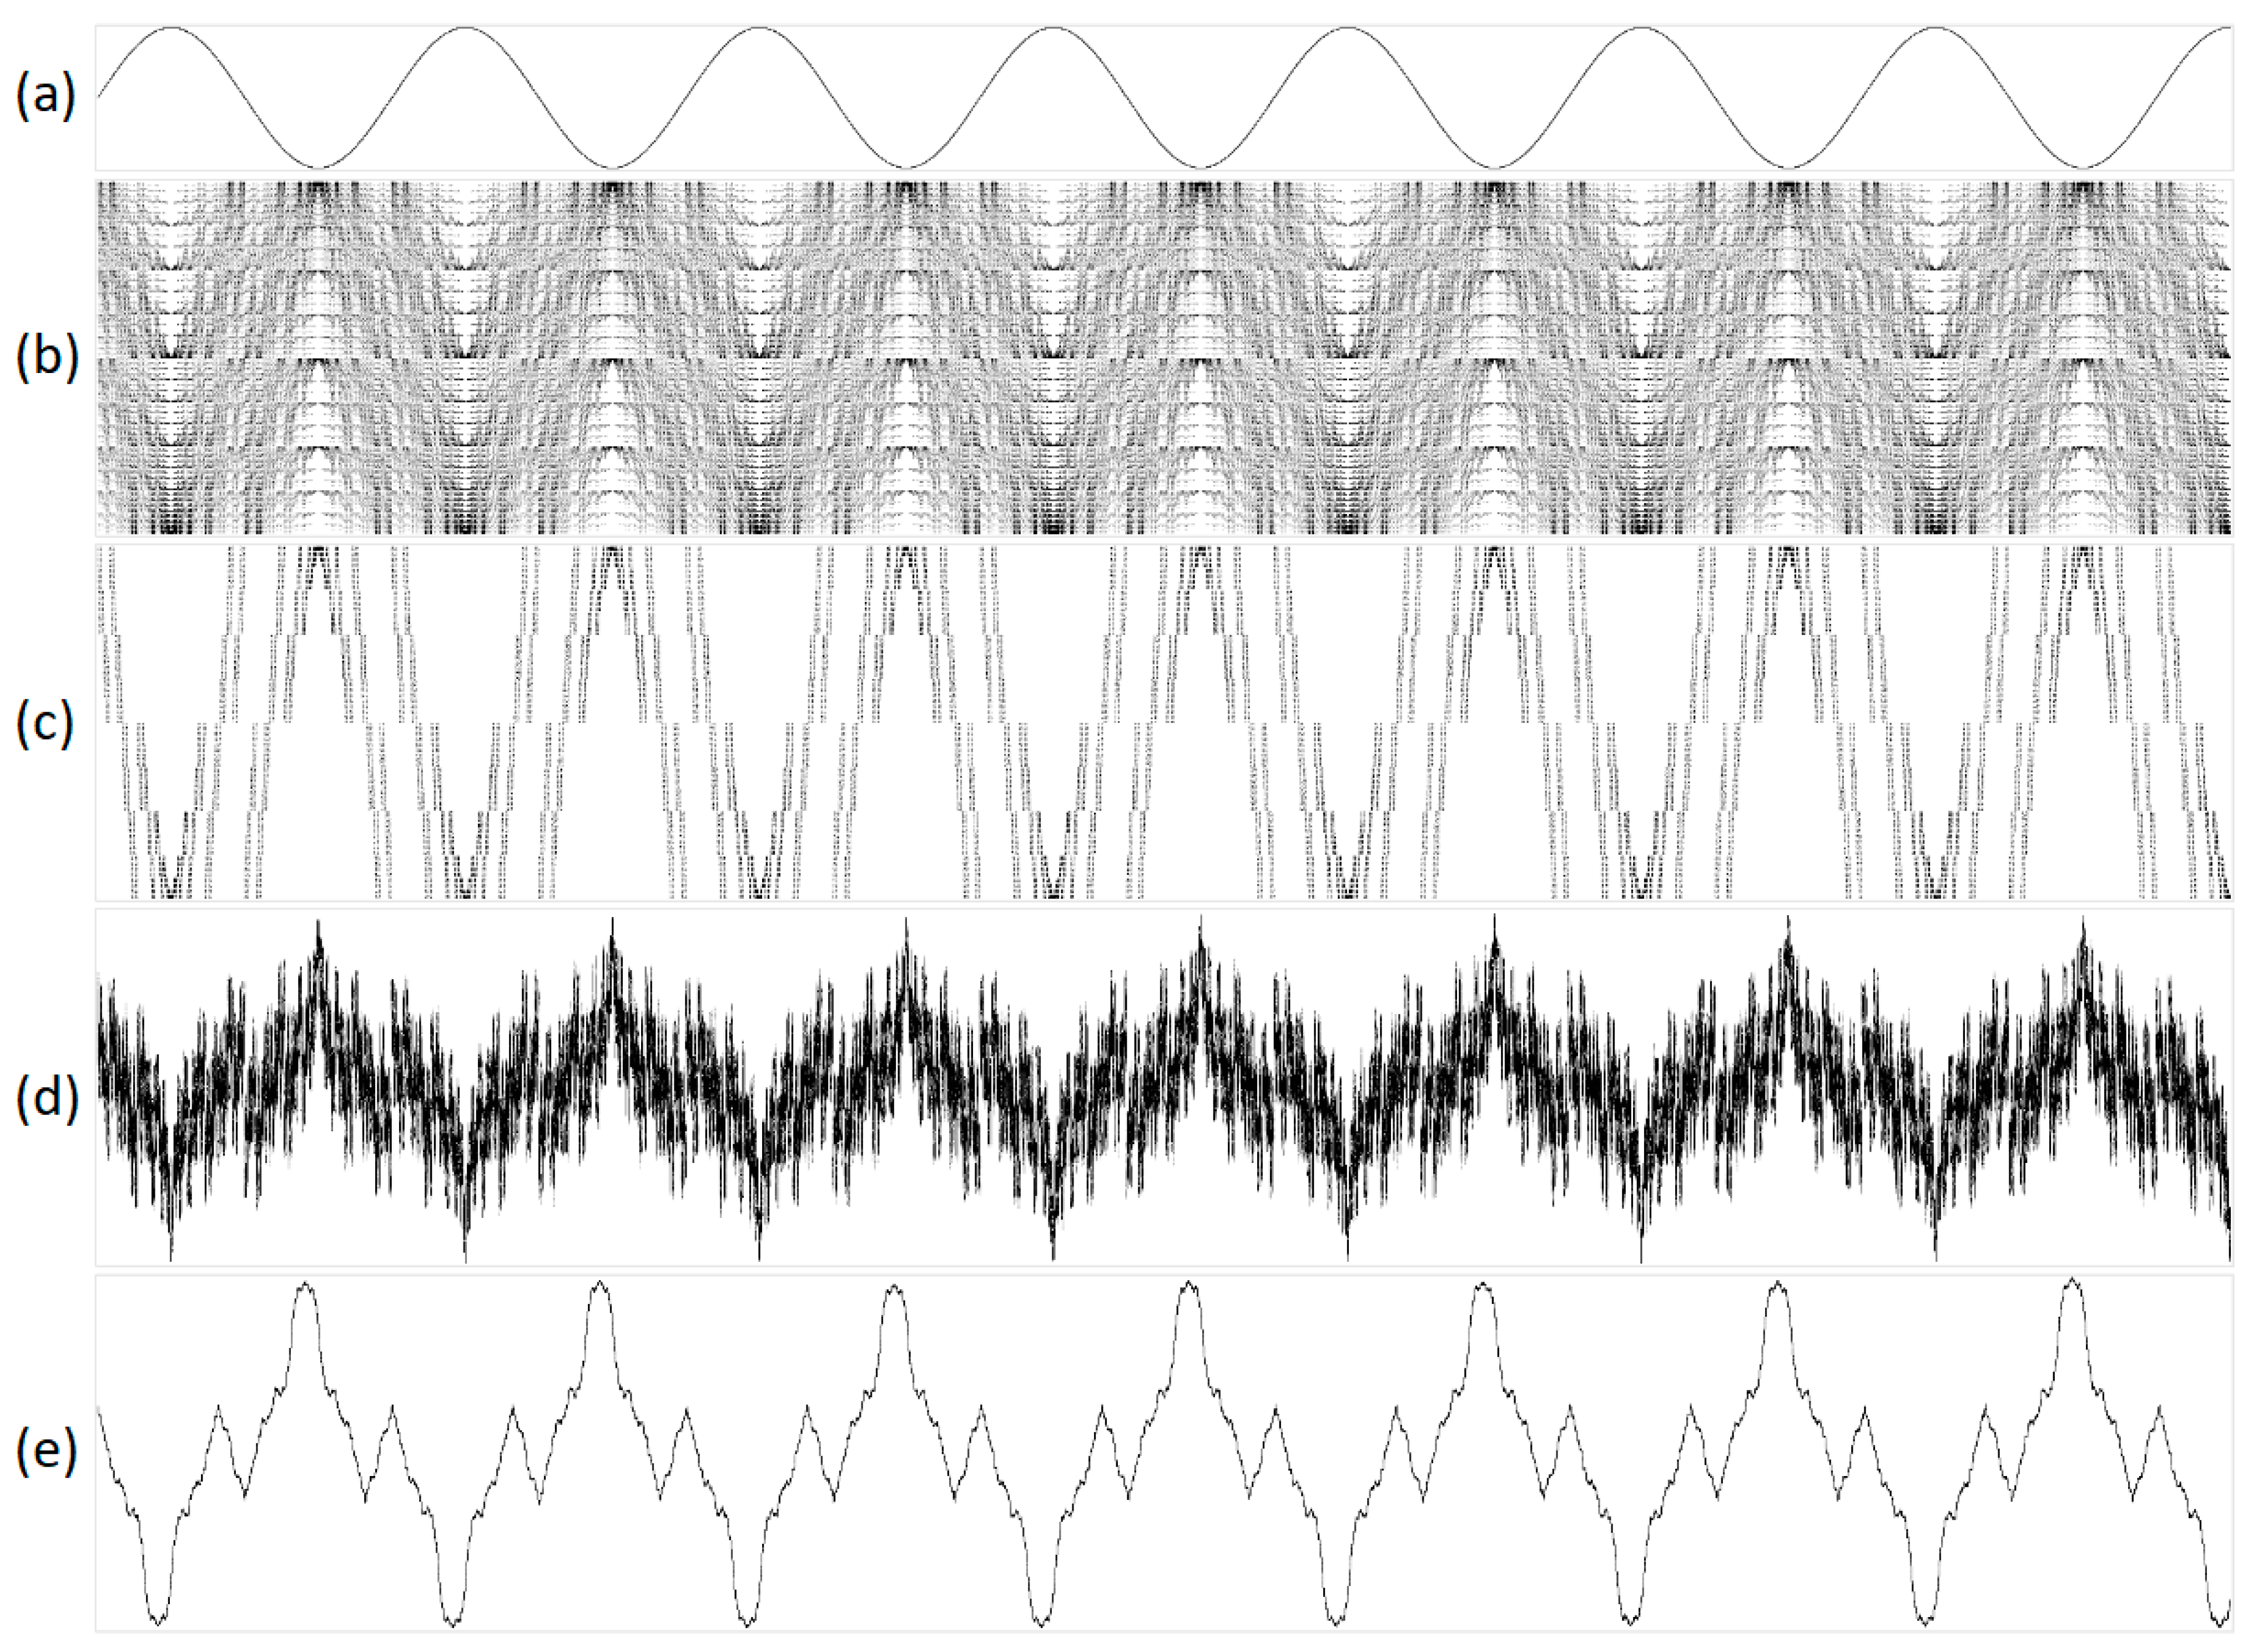
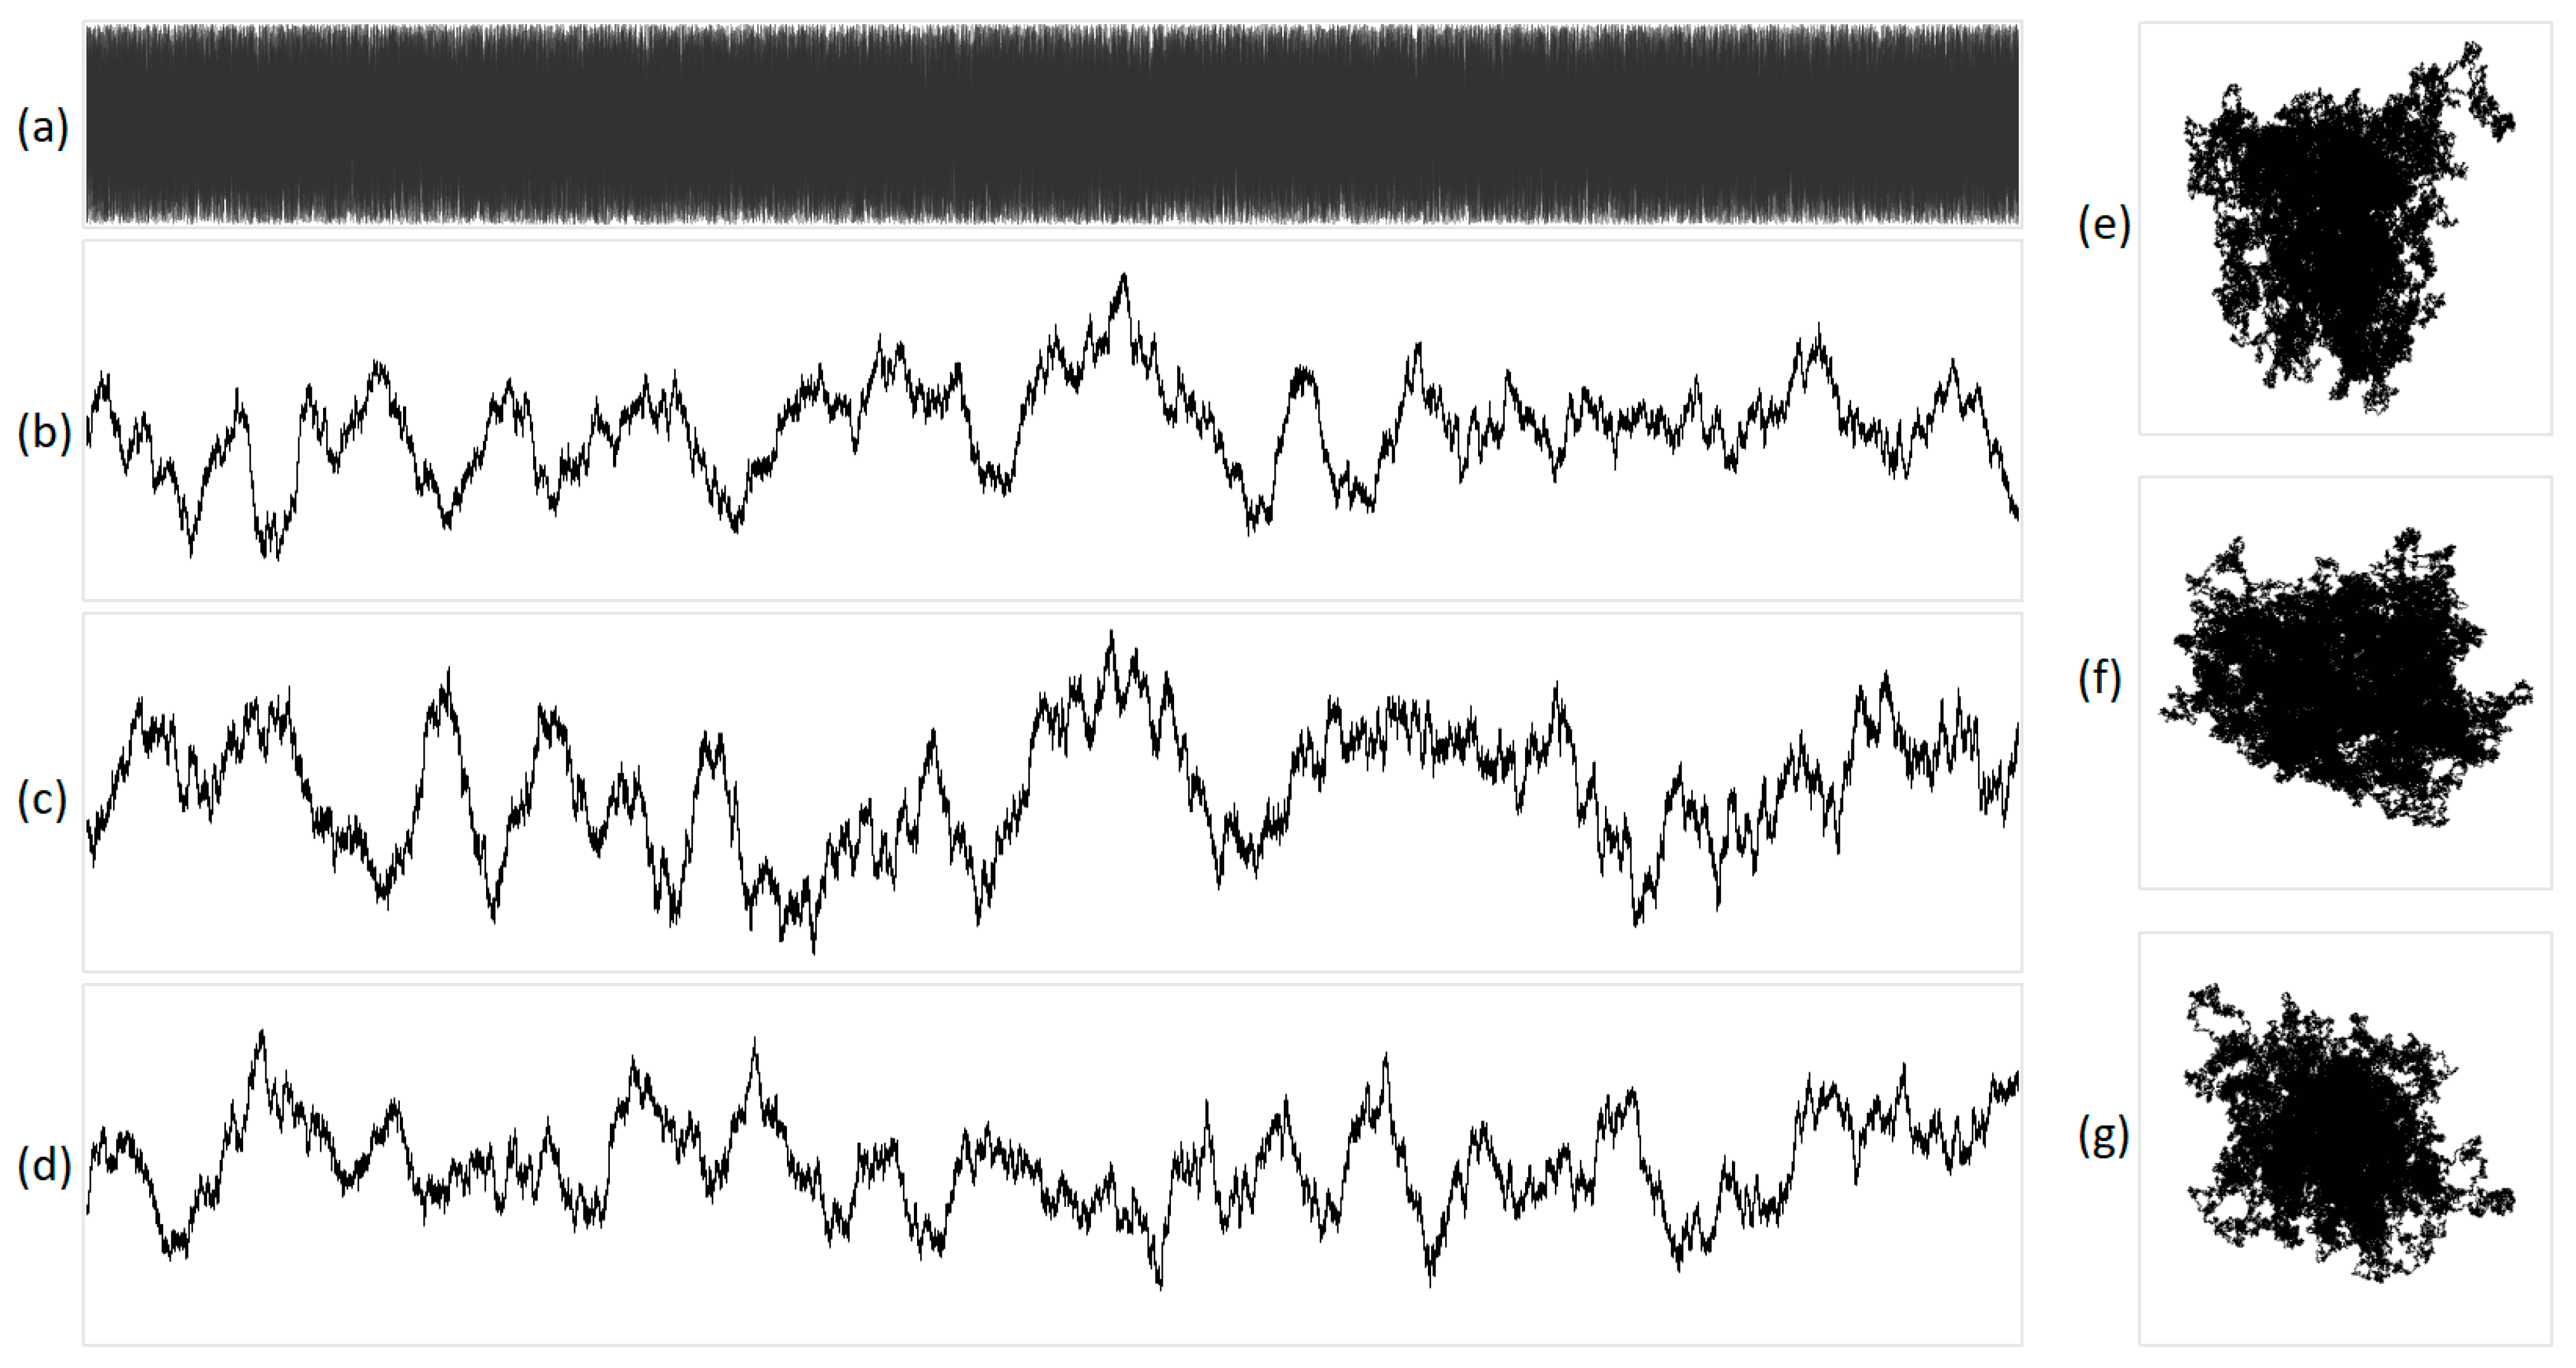
As part of this experiment, we visualized various types of audio signals, including natural sounds such as birdsong, the murmur of a fountain, simple melodies, and rhythmic musical patterns. Figure 4 and Figure 5 show different projections of a sinusoidal signal with a frequency of 1 Hz. Additionally, we illustrate white, brown, and pink noises in Figure 6, Figure 7, and Figure 8, respectively.
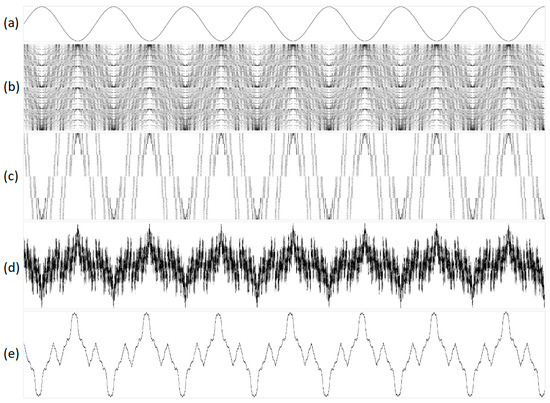
Figure 4.
A 1 Hz signal transformed into one-dimensional representations using purines/pyrimidines sub-alphabet with varying parameters. The sub-figures are as follows: (a) original acoustic signal; (b) structural representation with N = 16 and S = 1; (c) structural representation with N = 16 and S = 16; (d) integral representation with N = 160 and S = 1; and (e) integral representation with N = 32,000 and S = 1. In the geometric representations, the abscissa indicates the serial number of the N, while the ordinate denotes the value of N.
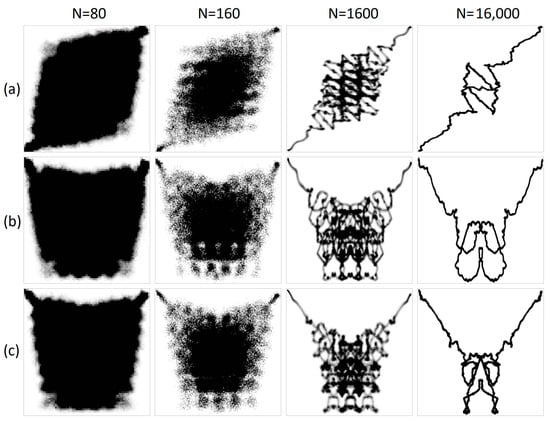
Figure 5.
The process of converting a 1 Hz acoustic wave into two-dimensional geometric representations with varying parameter N. The projections include the following: (a) XY; (b) YZ; and (c) XZ. Here, X represents purines/pyrimidines, Y represents amino/keto, and Z represents two/three hydrogen bonds.
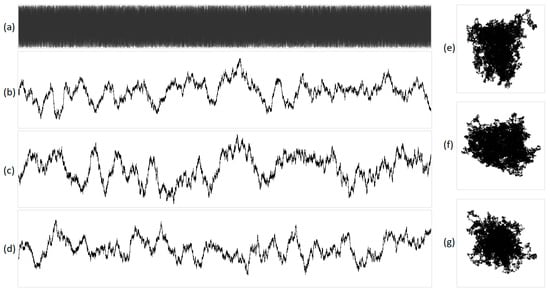
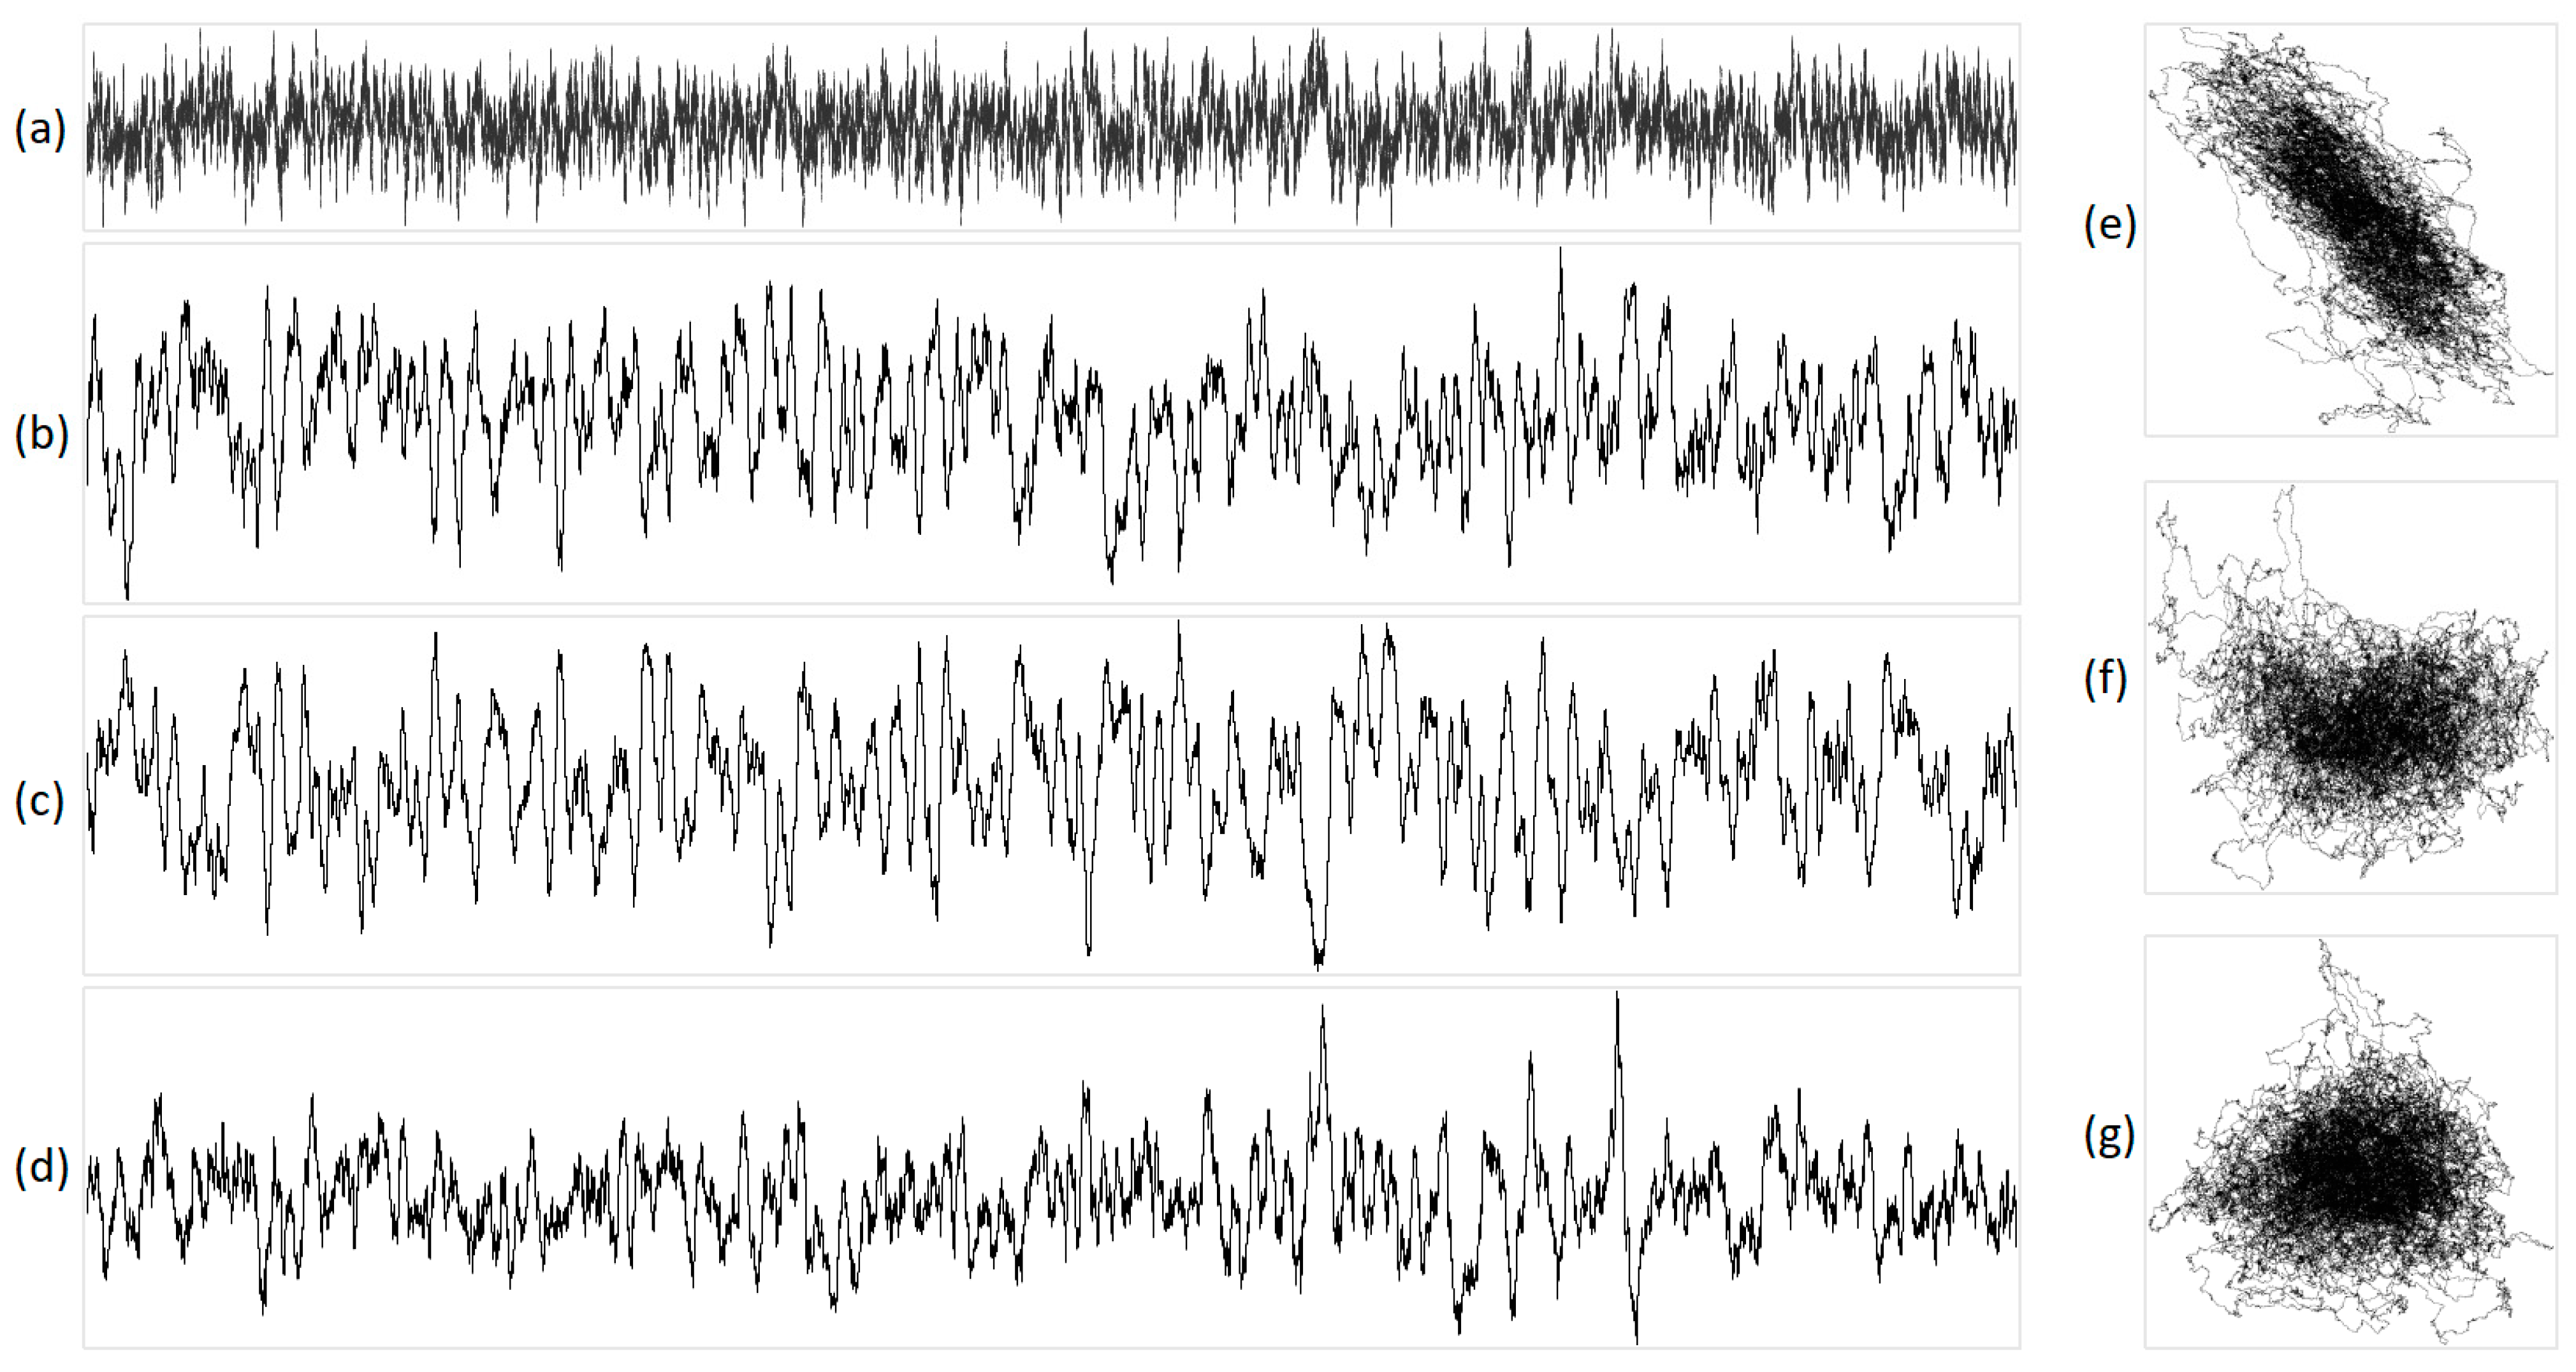
Figure 6.
The integral representation of white noise at N = 16,000. The original acoustic signal is shown in (a), and its projections are illustrated in (b) X, (c) Y, (d) Z, (e) XY, (f) YZ, and (g) XZ. X represents purines/pyrimidines, Y represents amino/keto, and Z represents two/three hydrogen bonds.
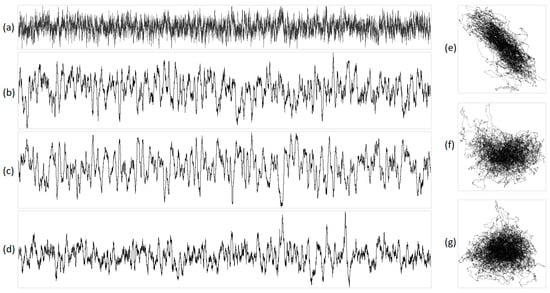
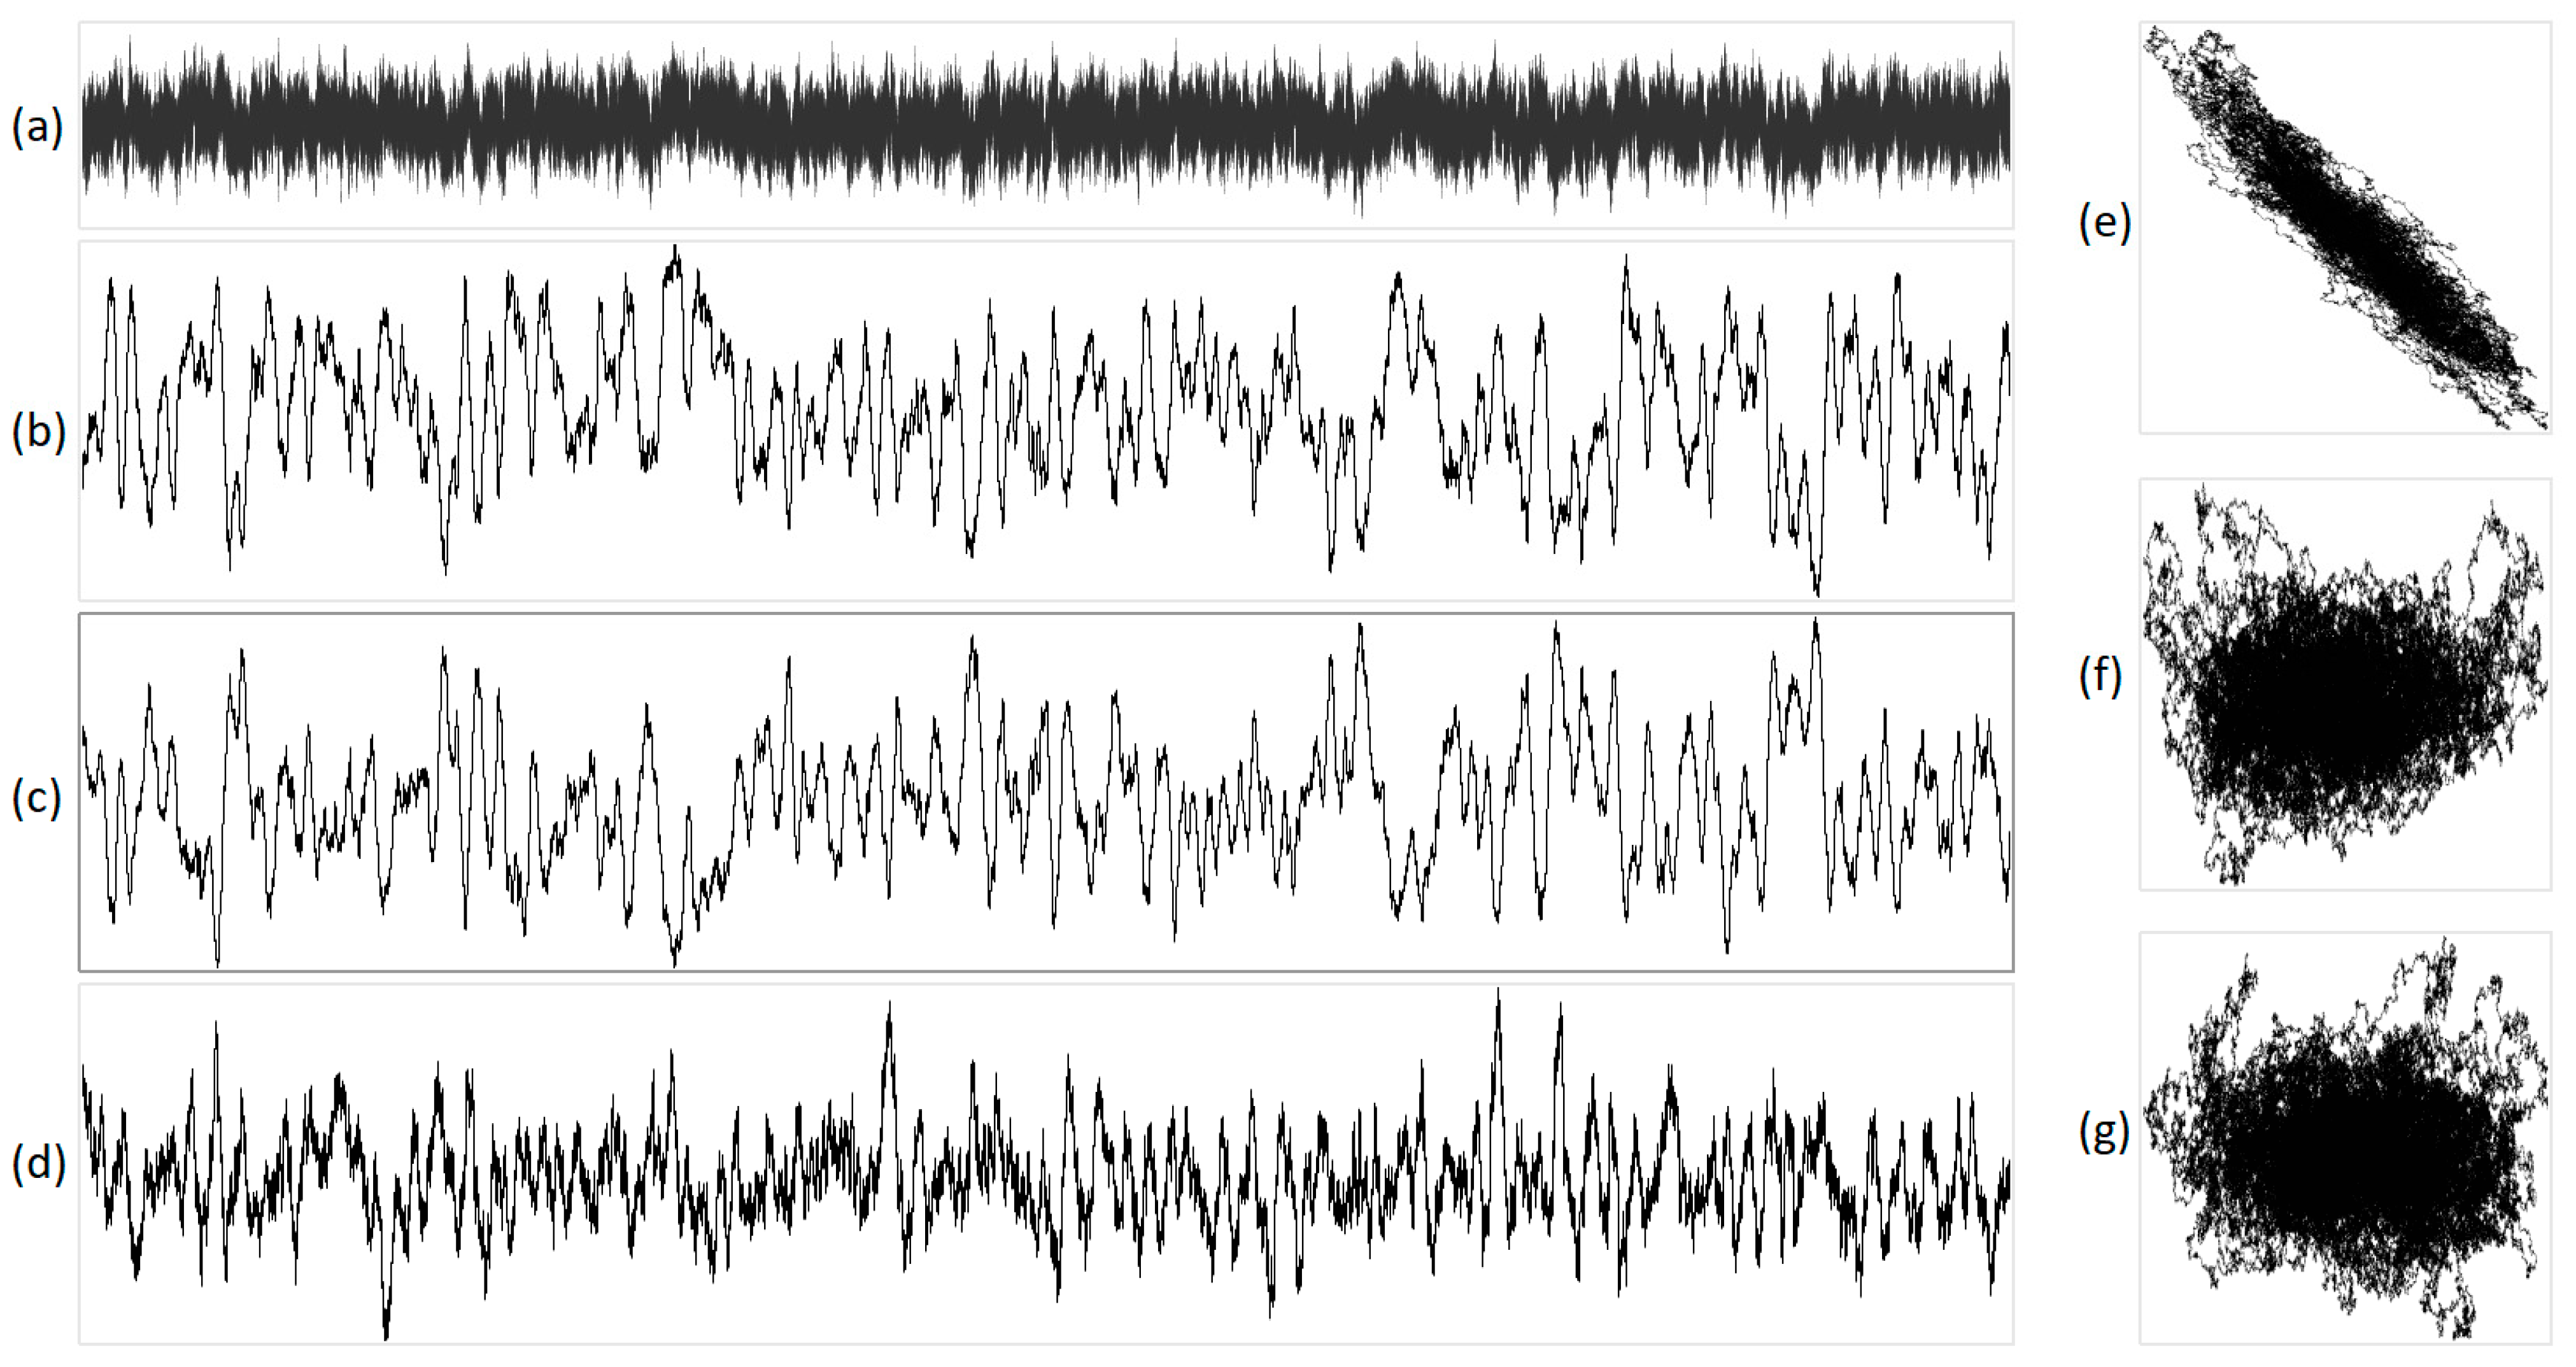
Figure 7.
The integral representation of brown noise with N = 16,000. Illustration (a) shows the original acoustic signal; projections are exhibited in (b) X, (c) Y, (d) Z, (e) XY, (f) YZ, and (g) XZ. In this representation, X corresponds to purines/pyrimidines, Y denotes amino/keto, and Z represents two/three hydrogen bonds.
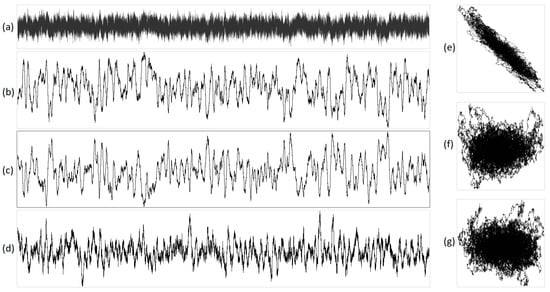
Figure 8.
The integral representation of pink noise with N = 16,000. Illustration (a) shows the original acoustic signal, projections are exhibited in (b) X, (c) Y, (d) Z, (e) XY, (f) YZ, and (g) XZ. In this representation, X corresponds to purines/pyrimidines, Y denotes amino/keto, and Z represents two/three hydrogen bonds.
The algorithm features a notable trait, whereby the original monophonic signal with a singular channel transforms into a triplet of channels with interlocking coordinates achieved through the addition of modulo two. This feature stems from the properties of Hadamard matrices. Such spaces have a fractional dimension, with a combination of any two coordinates being adequate to specify three dimensions, enabling the selection of two out of three coordinates for the acquisition of a stereo signal. As previously noted, this type of processing results in reduced entropy, akin to what is inherent in living systems.
Reduced entropy and an increase in degrees of symmetry are characteristic of living systems. Hence, the molecular genetic algorithms presented exhibit nature-like properties, rendering them suitable for deployment in information processing systems for various purposes, including visualization, sonification, and other areas that are under active investigation.
During this research, an inverse transformation was performed from the obtained geometric mappings back into acoustic signals. Each value was scaled into amplitudes of 16 bits. We set the structural transformation parameters to N = 16 and S = 16, while the integral transformation parameters were N = 16,000 and S = 1. The left channel represented purines/pyrimidines, while the right channel represented amino/keto. Several examples of visualizations and corresponding acoustic signals are presented below. For the purines/pyrimidines structural transformation data, amplitudes were cyclically shifted by 8 bits to the right.
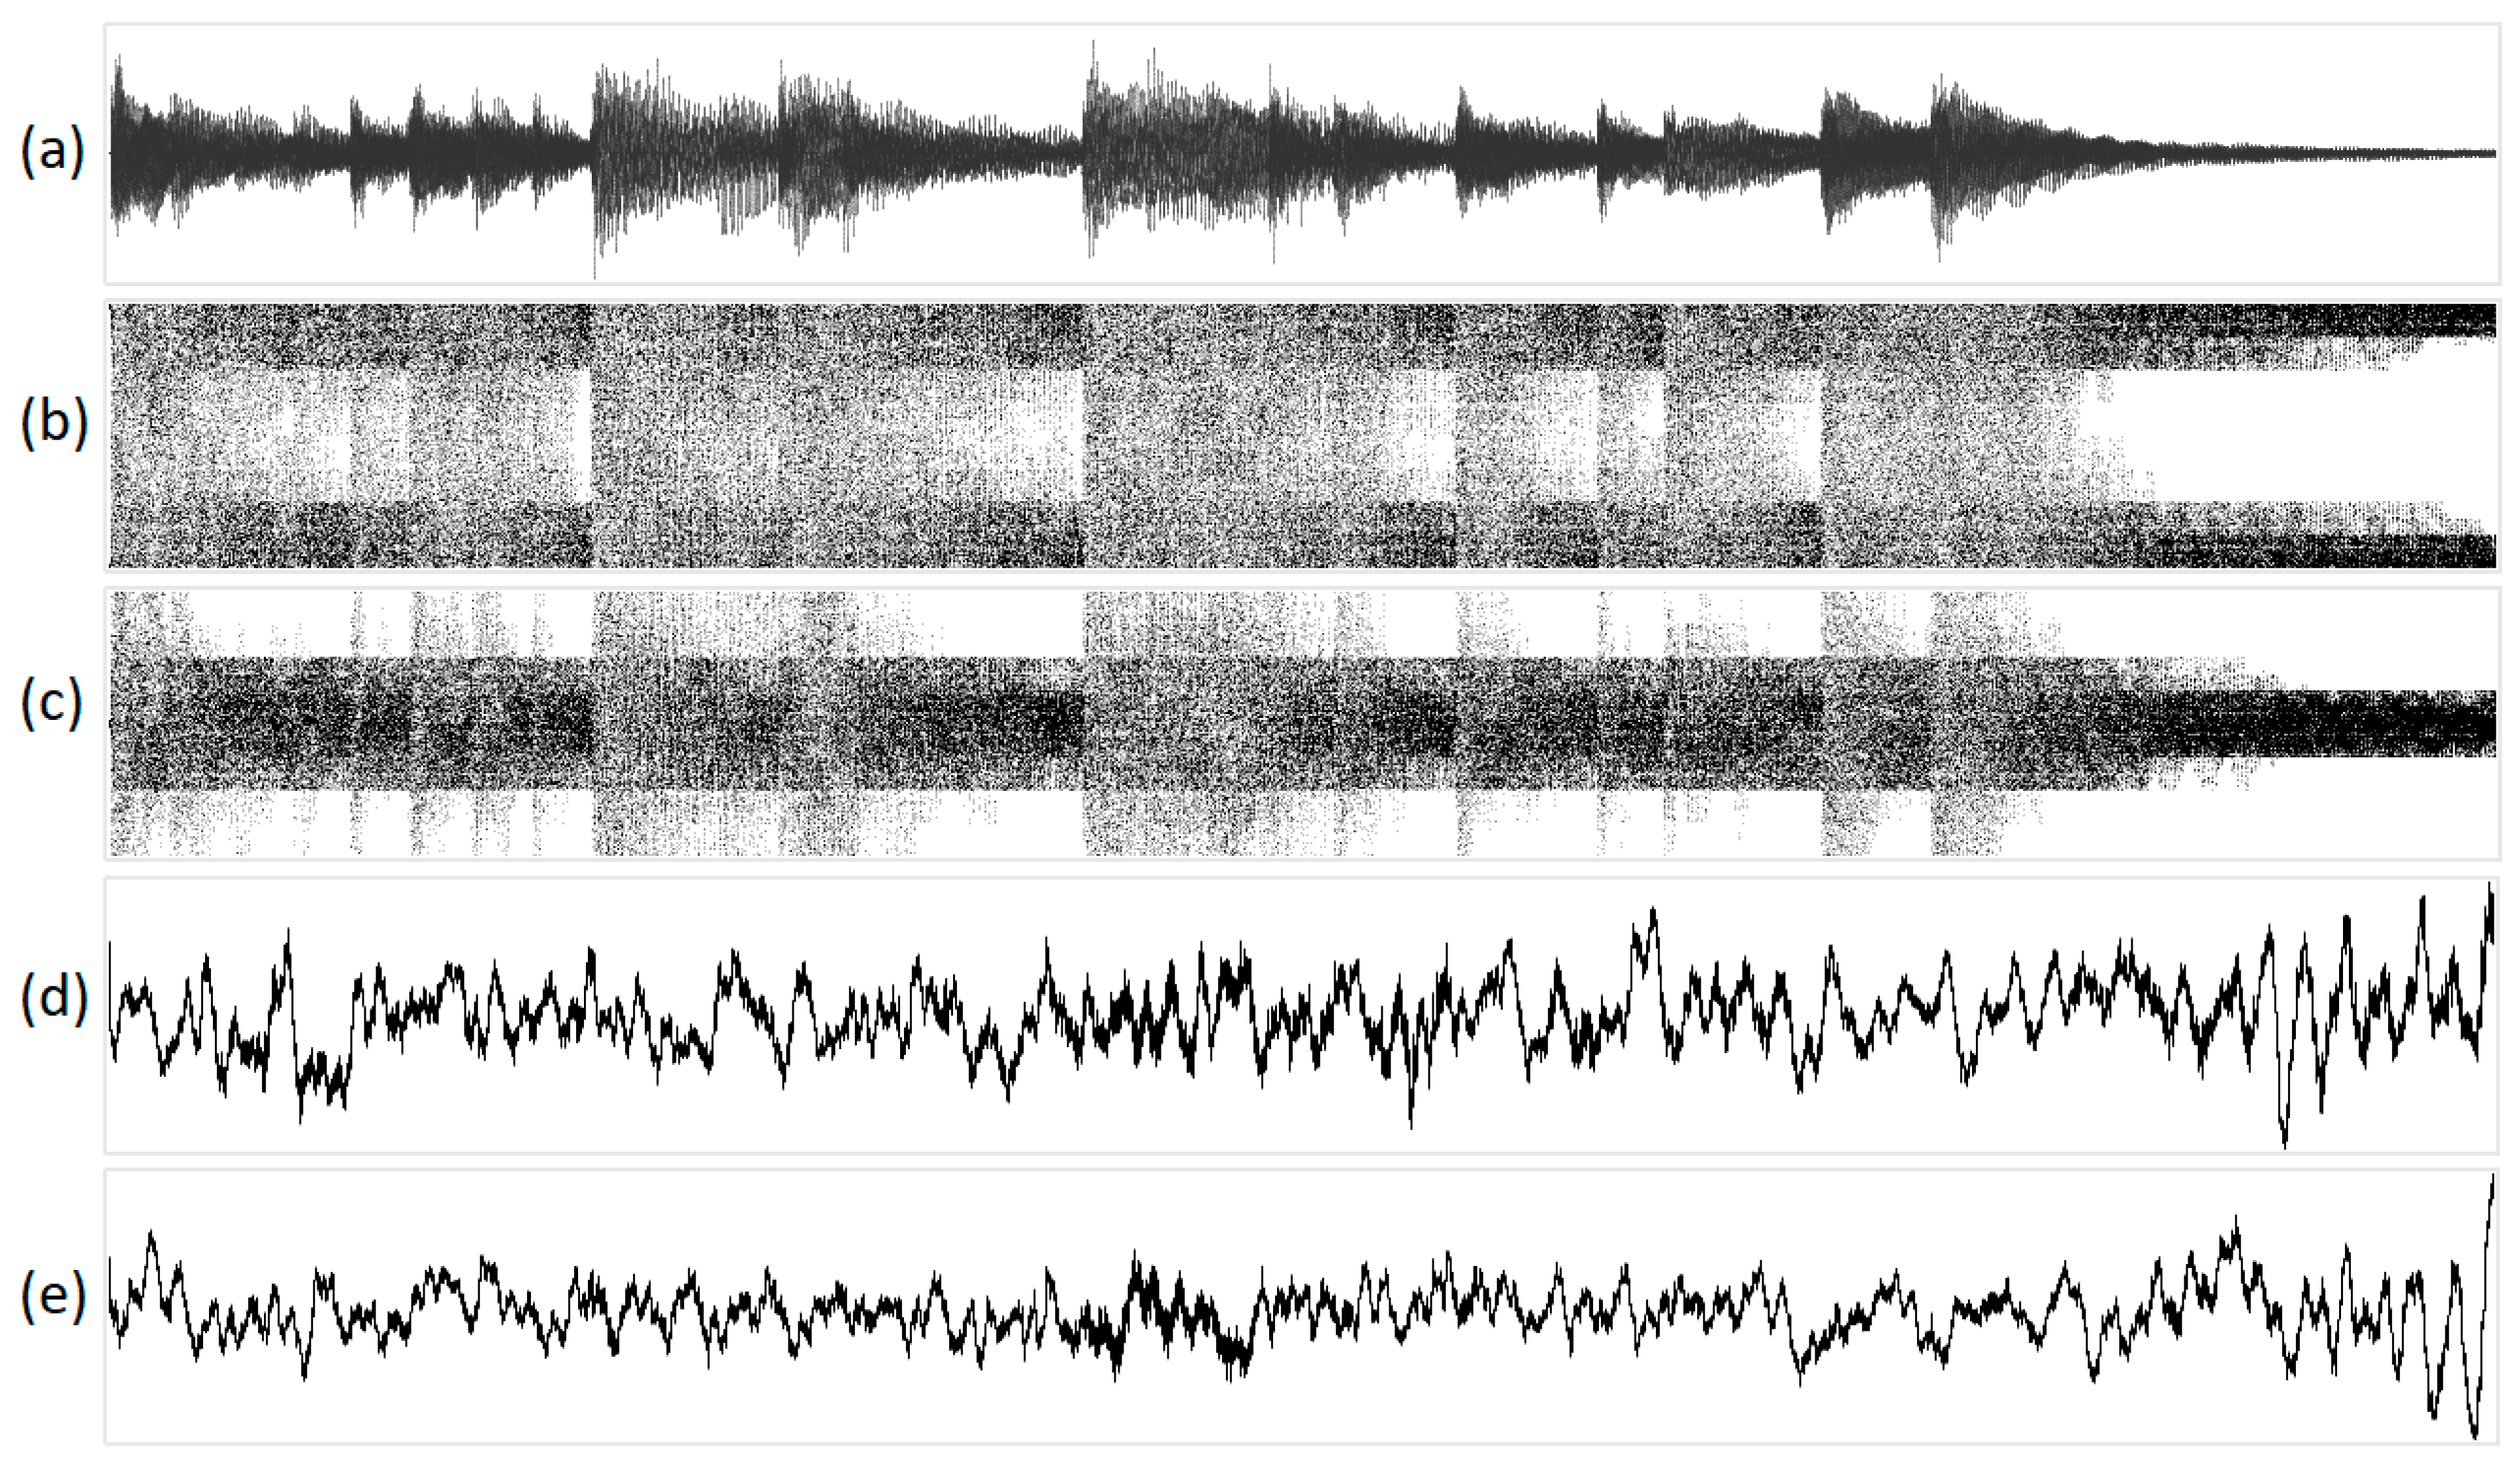
Figure 9 shows the geometric visualization of the sound of a bell, while Figure 10 shows the geometric visualization of birdsong. Playback of the processed acoustic signals resembles some overdrive effect for structural mappings and noise for integral ones.
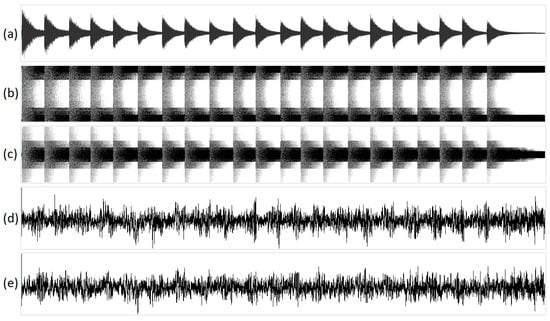
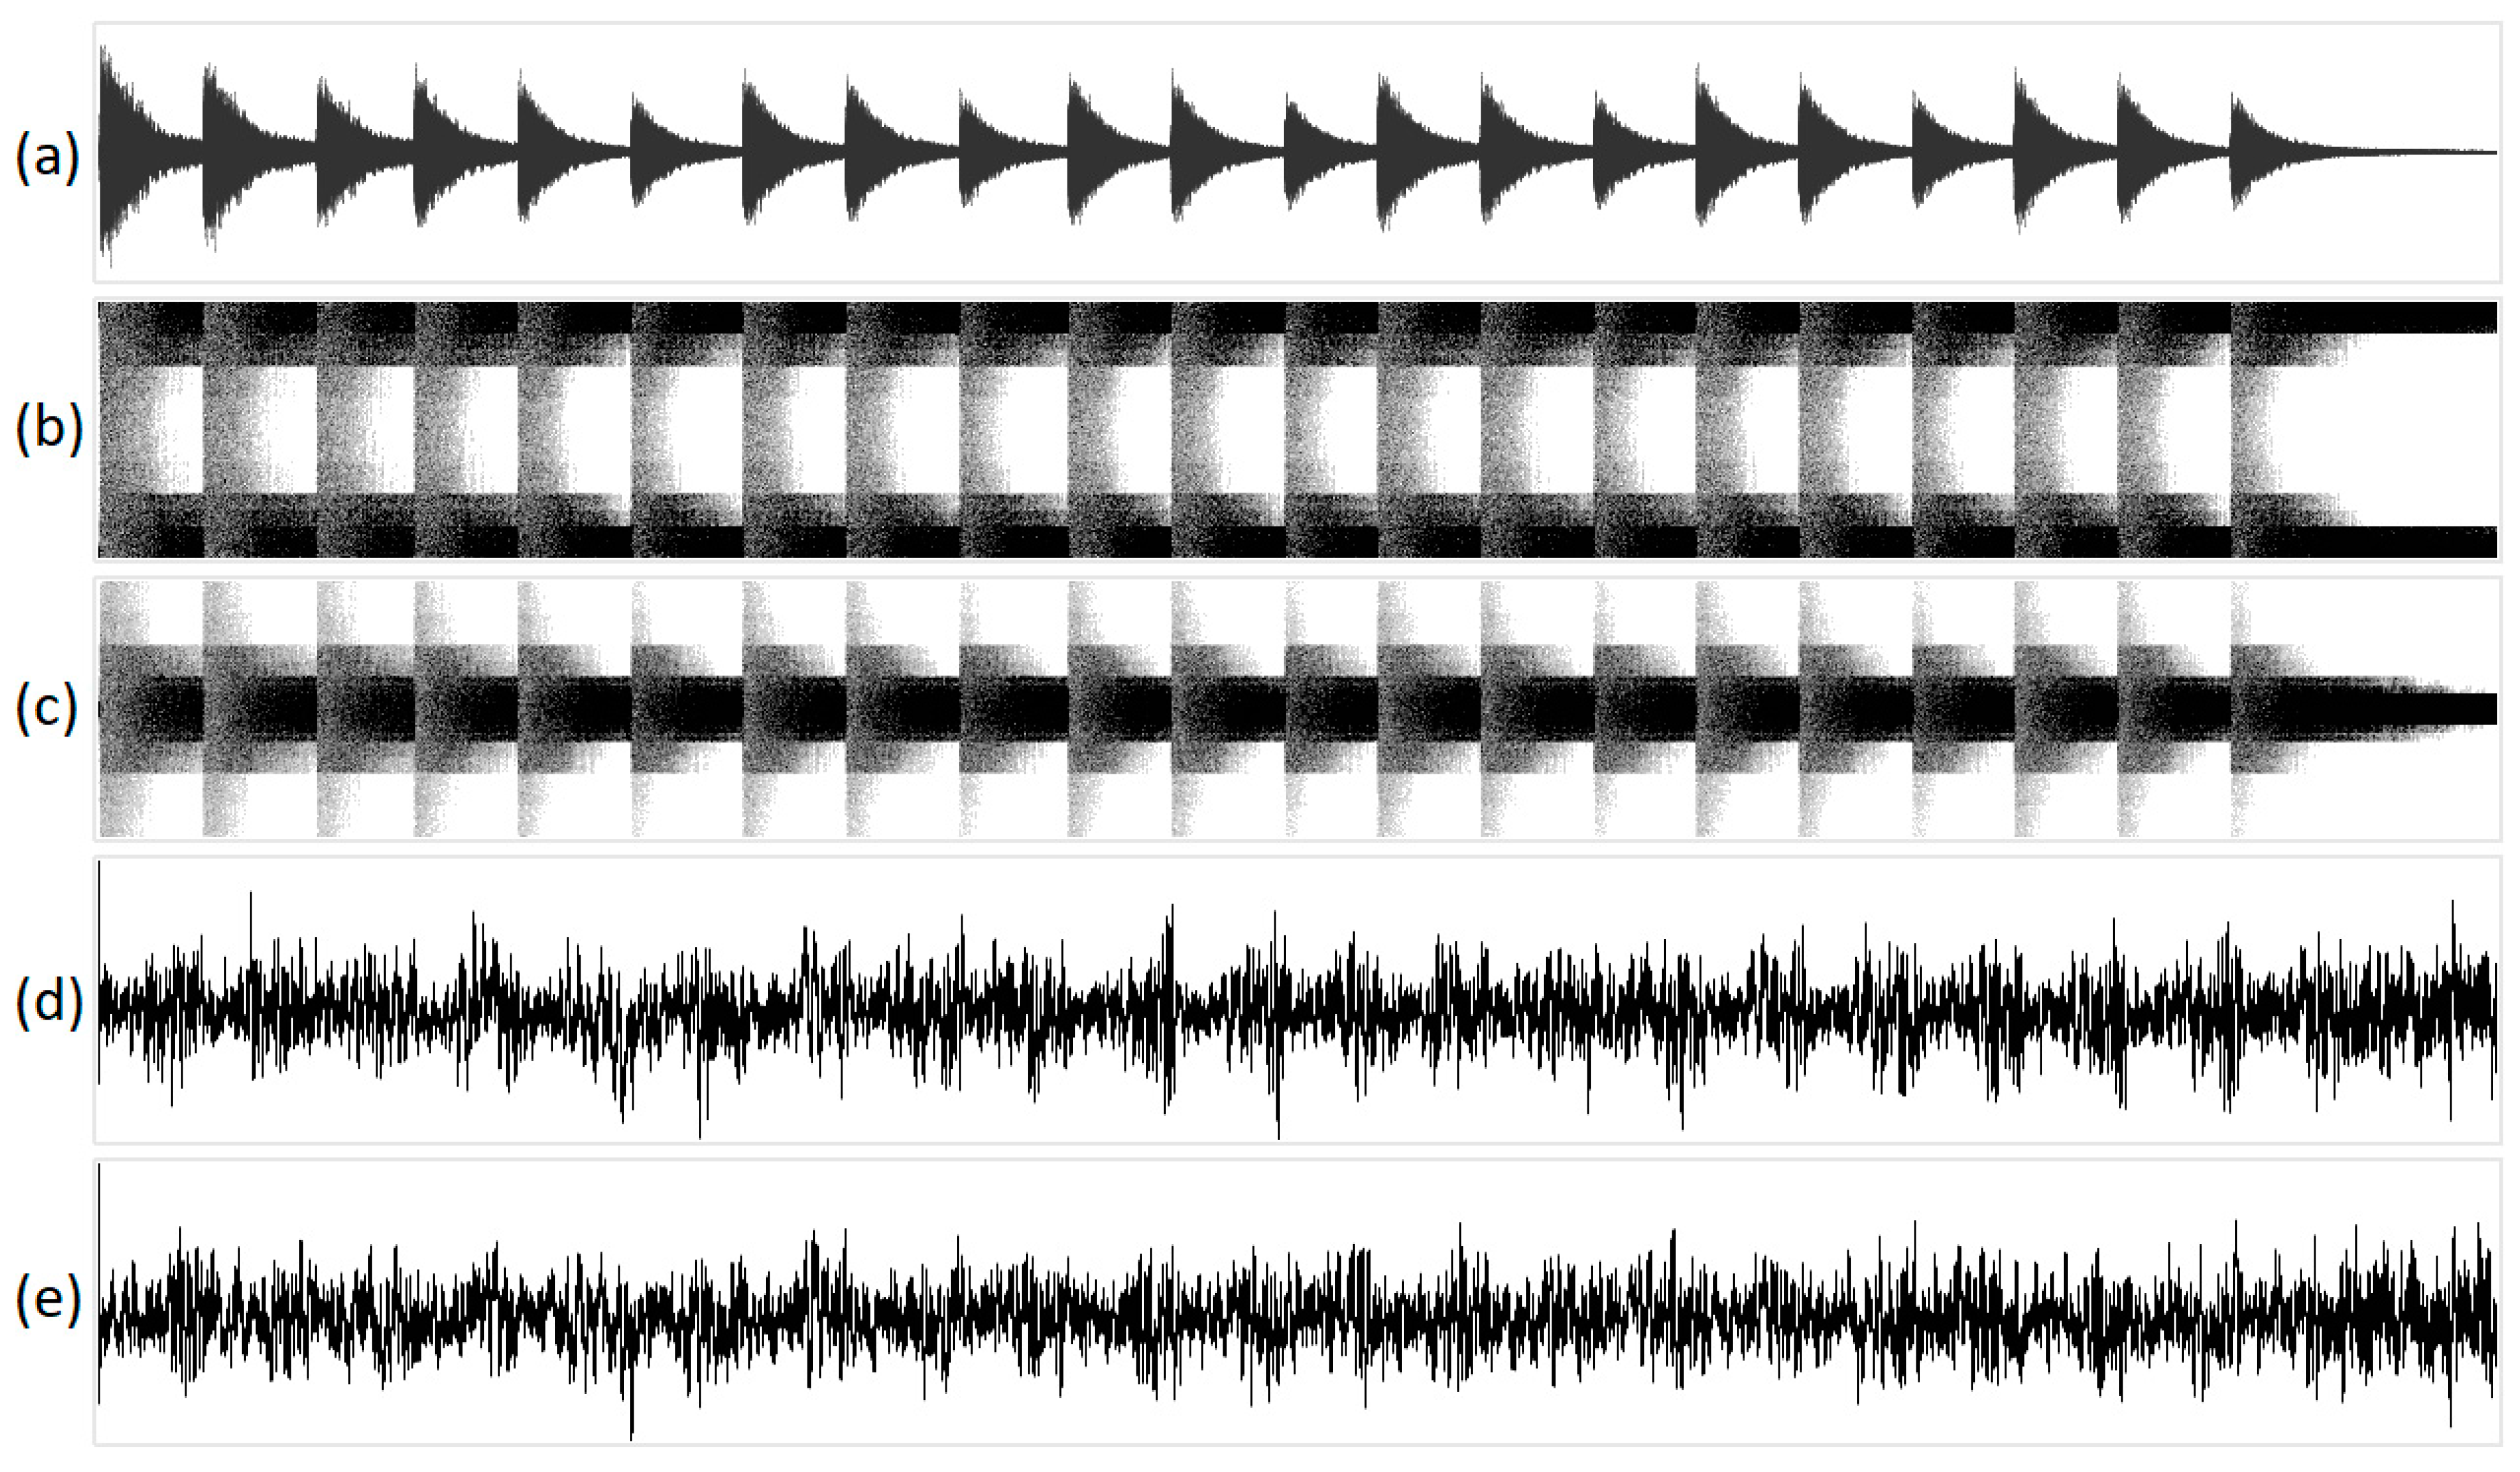
Figure 9.
The visualization of the sound of a bell in various one-dimensional projections: (a) original acoustic signal; (b) structural representation of purine/pyrimidine; (c) structural representation of amino/keto; (d) integral representation of purine/pyrimidine; and (e) integral representation of amino/keto. The x-axis of the geometric representations denotes the ordinal number of the N-plet, while the y-axis denotes the value of the N-plet.
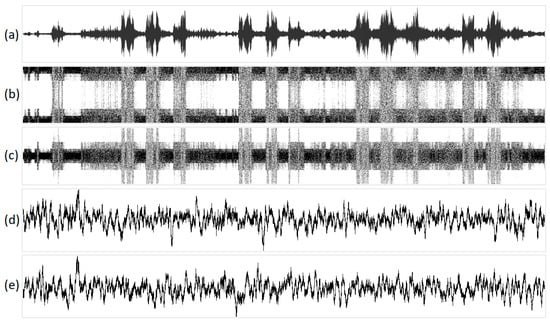
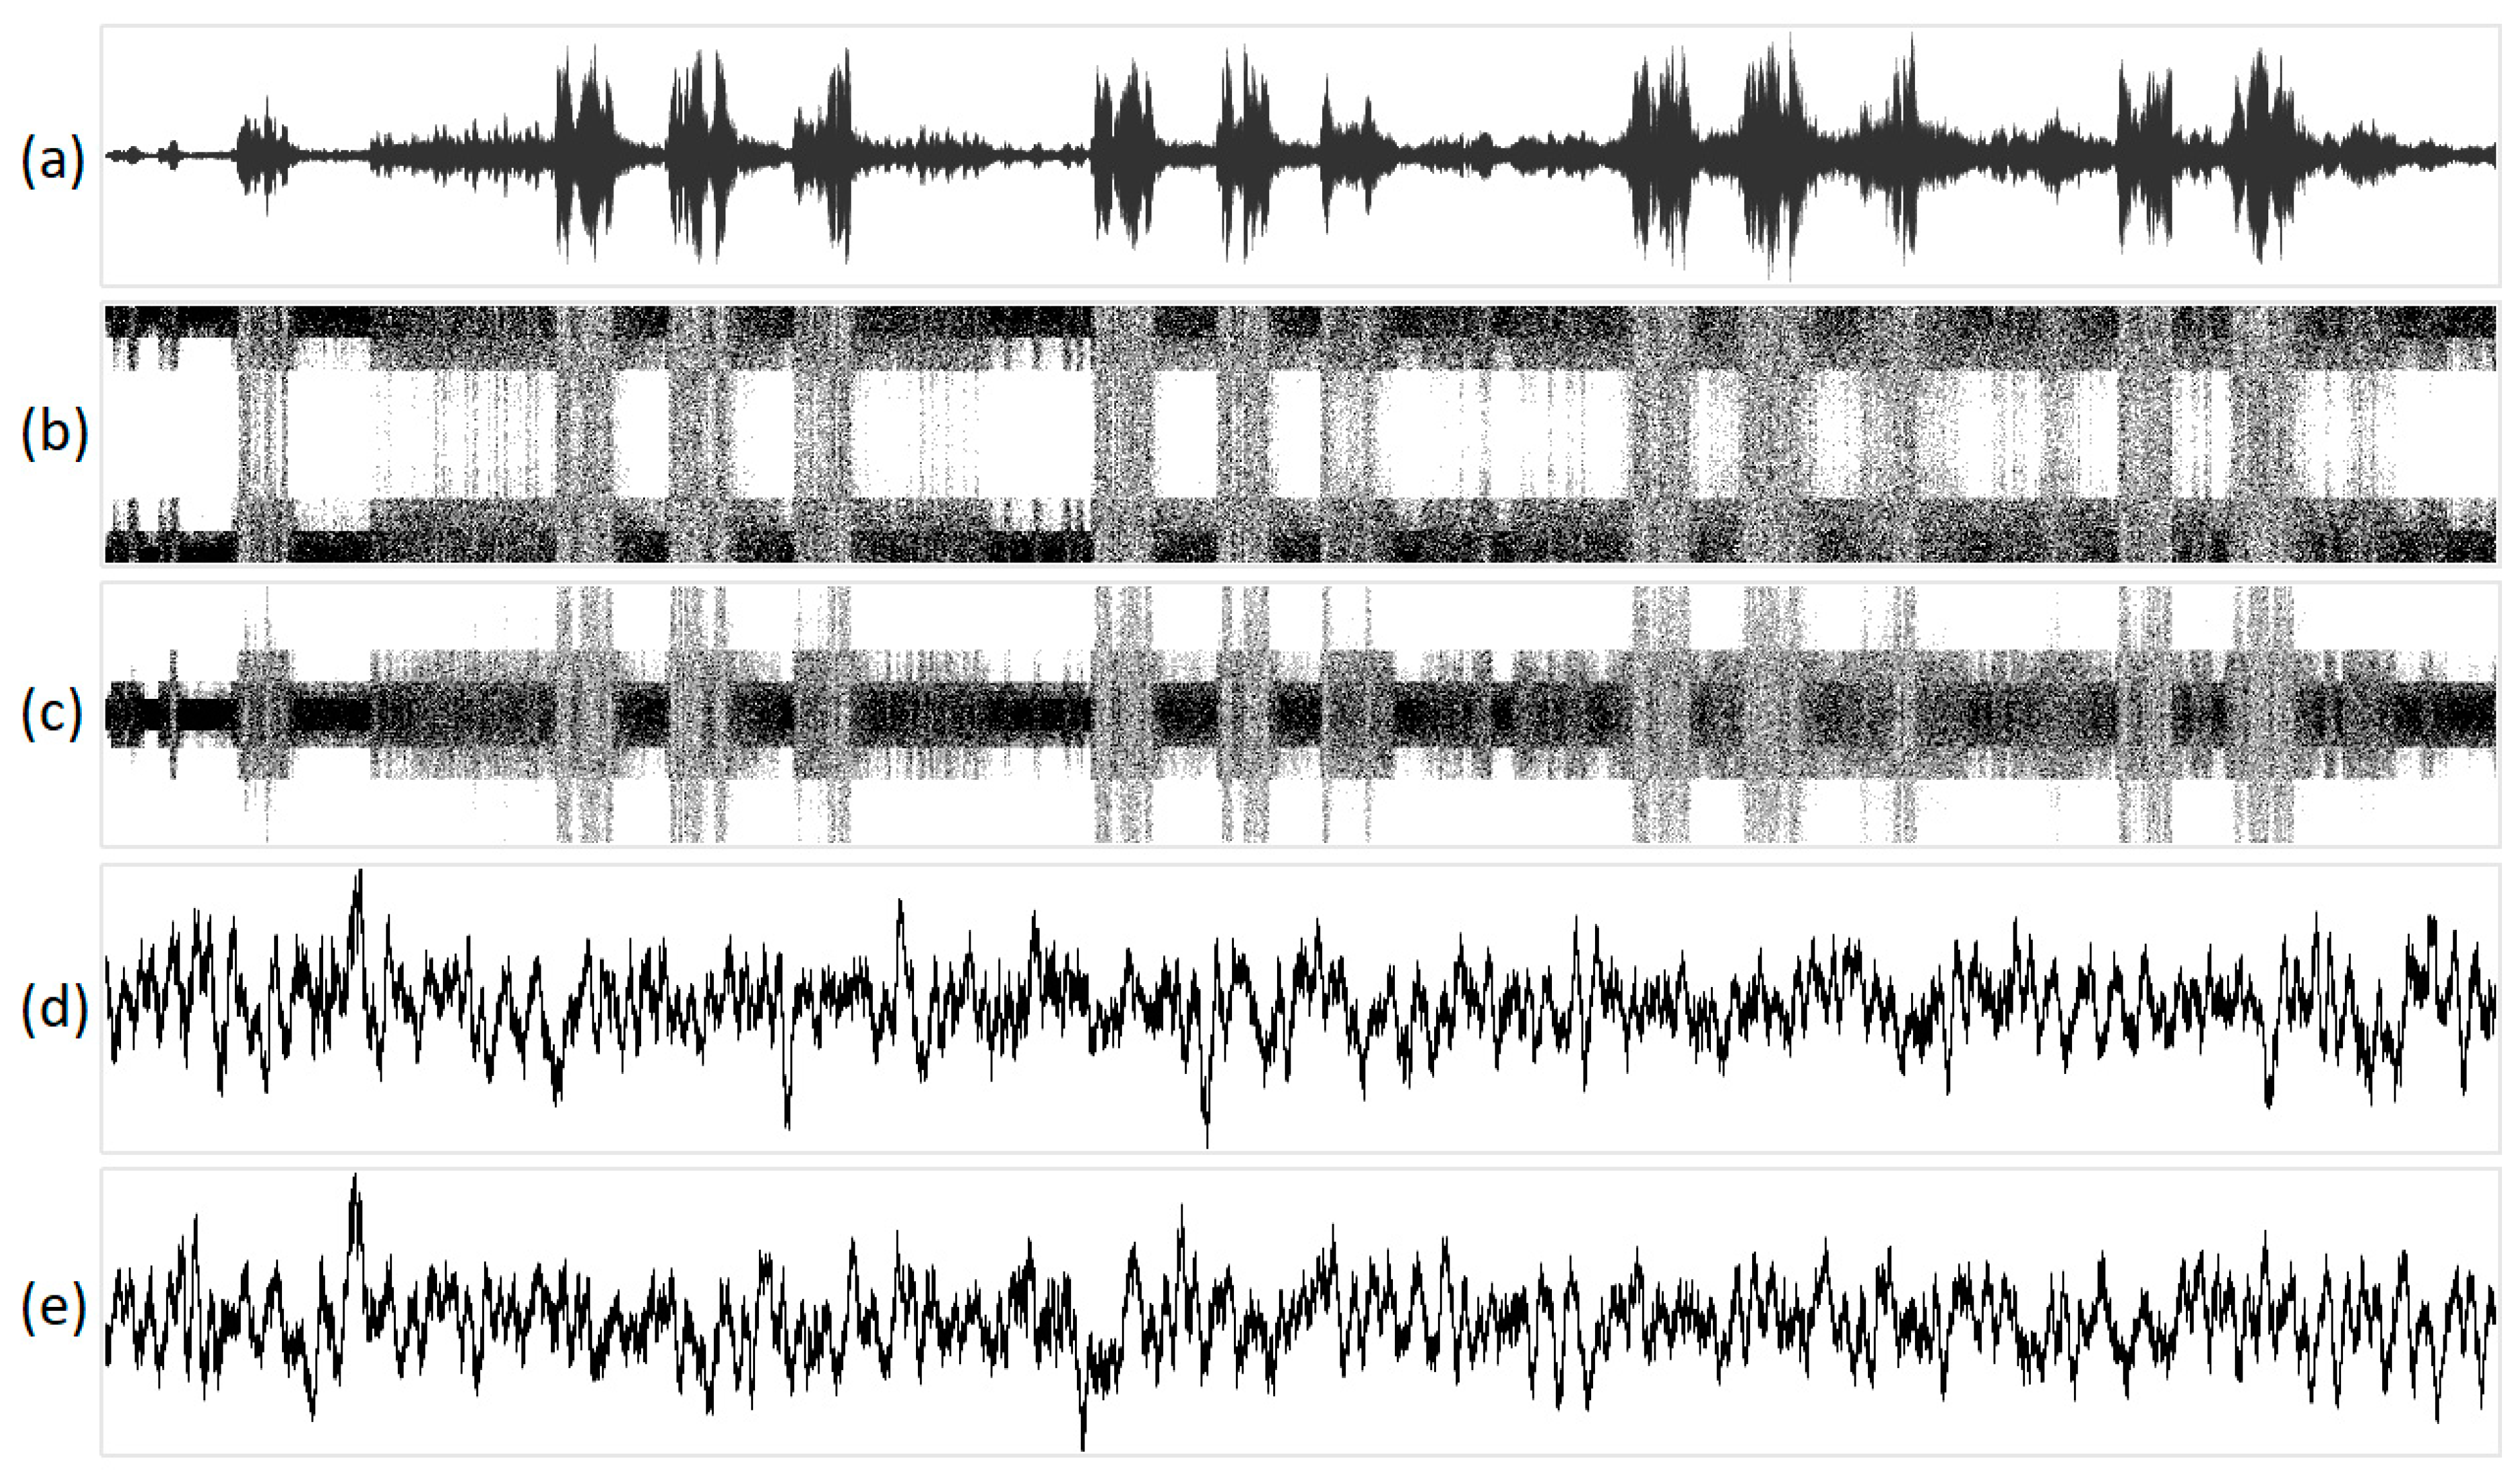
Figure 10.
The visualization of the sound of birds singing in various one-dimensional projections: (a) original acoustic signal; (b) structural representation of purines/pyrimidines; (c) amino/keto structural representation; (d) integral representation of purines/pyrimidines; and (e) amino/keto integral representation. Geometric representations along the abscissa axis are marked with the sequence number of the N-plet, while N-plet values are marked on the ordinate.
The original sound of a bell is 16-bit mono and can be accessed at the following link: https://on.soundcloud.com/cd4rH (accessed on 27 July 2023).
Additionally, the structural transformation to 16-bit stereo can be found at: https://on.soundcloud.com/VSxX1 (accessed on 27 July 2023).
The integral transformation to 16-bit stereo can be accessed at: https://on.soundcloud.com/CU76X (accessed on 27 July 2023).
The original sound of birdsong is 16-bit mono and can be found at the following link: https://on.soundcloud.com/ZTRj5. (accessed on 27 July 2023).
The structural conversion in 16-bit stereo and the integral conversion in 16-bit stereo can be accessed via the following links: https://on.soundcloud.com/9CXaL and https://on.soundcloud.com/jGarq, respectively (accessed on 27 July 2023).
Figure 11 depicts the geometric visualization of a musical fragment (piano timbre). The original sound of a musical fragment is 16-bit mono, available: https://on.soundcloud.com/1JKWv (accessed on 27 July 2023).
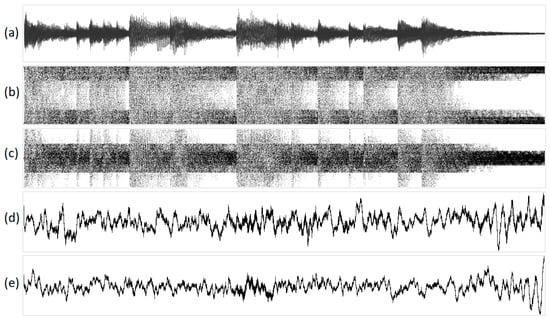
Figure 11.
The visualization of a musical fragment (piano timbre) in various one-dimensional projections: (a) original acoustic signal; (b) structural representation of purines/pyrimidines; (c) amino/keto structural representation; (d) integral representation of purines/pyrimidines; and (e) amino/keto integral representation. Geometric representations along the abscissa axis are marked with the sequence number of the N-plet, while N-plet values are marked on the ordinate.
The 16-bit stereo structural and integral conversions can be found at the following links: https://on.soundcloud.com/YtP2Q and https://on.soundcloud.com/D5G1W, respectively (accessed on 27 July 2023).
The video below displays the signal obtained from the pseudo-random noise generator. The produced signal, although not chaotic, results in visually aesthetic patterns that resemble fractal structures. https://www.youtube.com/watch?v=HbjP_GjazEs (accessed on 27 July 2023).
4. Conclusions
In this article, we have explored the potential applications of novel molecular genetic algorithms for analyzing various types of signals, including acoustic, chaotic, and quasi-chaotic signals, with entropy visualization in the form of structure mappings in parametric spaces of fractional dimensionality.
There are several interesting things about this study. First, it is a biomorphism due to the biological origin of algorithms. Secondly, the results that the algorithms give are non-trivial and interesting in themselves. With regard to practical applications, there are still not enough, but it is quite possible that some practical applications will be proposed as a result of further research. Neural networks may perform better when trained on data that has been preprocessed using molecular genetic algorithms, as these algorithms naturally increase signal regularity, mimicking the orderliness found in DNA molecules in nature. Therefore, molecular genetic algorithms are not only perspective for digital signal processing, but also for enhancing the performance of artificial intelligence systems.
Furthermore, we have observed a specific result related to the acoustic processing of sound signals. As demonstrated, to achieve a specific acoustic effect that involves transforming a monophonic signal into a stereophonic one, two binary sub-alphabets can be utilized for encoding original signals with two projections of the DNA parametric space (e.g., purine/pyrimidine and keto/amino in external DNA structures). The resulting two signals can then be separated into channels, producing an interesting acoustic effect associated with genetic coding and the mathematics behind transformations that describe the nature and phenomenology of DNA.
Discussing possible directions of fundamental and applied research in this area, it should be noted that, firstly, these are the mathematics of Hadamard matrices, which can be applied to analyze arbitrary signals in a new way. In addition to the so-called nucleotide Hadamard matrix considered in this paper, there are a number of Hadamard matrices that can also be used to obtain new results. The use of the Hadamard “nucleotide” matrix is justified for the analysis of molecular genetic information. Finally, another direction is the visualization of information to identify internal structures and patterns, which can be useful for preprocessing signals before neural network analysis. Multi-scale analysis is also promising, in which numerical characteristics and their internal relationships of visualized displays are obtained using the algorithm described in this article and are analyzed at various scales.
Author Contributions
Conceptualization, I.V.S.; methodology, I.V.S.; software, M.Y.L. and I.V.S.; validation, I.V.S. and M.Y.L.; formal analysis, M.Y.L.; investigation, I.V.S. and M.Y.L.; resources, M.Y.L.; data curation I.V.S. and M.Y.L.; writing—soriginal draft preparation, I.V.S.; writing—review and editing, I.V.S. and M.Y.L.; visualization, M.Y.L.; supervision, I.V.S.; project administration, I.V.S. funding acquisition, I.V.S. All authors have read and agreed to the published version of the manuscript.
Funding
This research was funded by the RUDN University Scientific Projects Grant System, project No. 202235-2-000.
Data Availability Statement
All links are inside the article above.
Acknowledgments
This publication has been supported by the RUDN University Scientific Projects Grant System, project No. 202235-2-000.
Conflicts of Interest
The authors declare no conflict of interest.
References
- Stepanyan, I.V.; Lednev, M.Y. Chromatic Differentiation of Functional Mappings of the Composition of Nucleic Acids. Symmetry 2023, 15, 942. [Google Scholar] [CrossRef]
- Stepanyan, I.V.; Lednev, M.Y. Parametric Multispectral Mappings and Comparative Genomics. Symmetry 2022, 14, 2517. [Google Scholar] [CrossRef]
- Stepanyan, I.V.; Lednev, M.Y. A Comparative Analysis of Different Strains of Coronavirus Based on Genometric Mappings. Symmetry 2022, 14, 942. [Google Scholar] [CrossRef]
- Tverdislov, V.A.; Sidorova, A.E.; Yakovenko, L.V. Biophysical Ecology; URSS, KRASAND: Moscow, Russia, 2012; 544p. [Google Scholar]
- Gupta, V.; Mittal, M.; Mittal, V. Chaos theory: An emerging tool for arrhythmia detection. Sens. Imaging 2020, 21, 10. [Google Scholar] [CrossRef]
- Singh, A.P.; Kumar, G.; Dhillon, G.S.; Taneja, H. Hybridization of chaos theory and dragonfly algorithm to maximize spatial area coverage of swarm robots. In Evolutionary Intelligence; Springer: Berlin/Heidelberg, Germany, 2023; pp. 1–14. [Google Scholar]
- Puntsri, K.; Bunsri, B.; Pittayang, Y.; Bubpawan, T.; Partipralam, W.; Phakphisut, W. Reconfigurable AWGN Generator Using Box-Muller Method with CORDIC-Based Square Root Calculation. In Proceedings of the 2022 37th International Technical Conference on Circuits/Systems, Computers and Communications (ITC-CSCC), Phuket, Thailand, 5–8 July 2022; pp. 1–4. [Google Scholar]
- Matsuoka, S.; Ichikawa, S.; Fujieda, N. A true random number generator that utilizes thermal noise in a programmable system-on-chip (PSoC). Int. J. Circuit Theory Appl. 2021, 49, 3354–3367. [Google Scholar] [CrossRef]
- Franco Moreno, J.J.; Alsina Pagès, R.M.; Vázquez Alcocer, P.P. Visual analysis of environmental noise data. In Proceedings of the International Conferences on Computer Graphics, Visualization, Computer Vision and Image Processing 2022; Connected Smart Cities 2022; Big Data Analytics, Data Mining and Computational Intelligence 2022 and Theory and Practice in Modern Computing 2022, Lisbon, Portugal, 19–22 July 2022; IADIS Press: Porto, Portugal, 2022; pp. 45–53. [Google Scholar]
- Frolov, V.; Tyutyukin, K. Specifics of NMR-visualization at ultralow magnetic field. In Magnetic Resonance and Its Applications; Springer: Berlin/Heidelberg, Germany, 2020; p. 37. [Google Scholar]
- Li, C.X.; Zheng, C.W. High-efficiency method for 3D visualization of marine environmental information. Earth Sci. Inform. 2023, 16, 367–377. [Google Scholar] [CrossRef]
- Kasman, A. Uses of Chaos Theory and Fractal Geometry in Fiction. In The Palgrave Handbook of Literature and Mathematics; Springer: Berlin/Heidelberg, Germany, 2021; pp. 129–147. [Google Scholar]
- Revuelta, F.; Benito, R.M.; Borondo, F. Unveiling the chaotic structure in phase space of molecular systems using Lagrangian descriptors. Phys. Rev. E 2019, 99, 032221. [Google Scholar] [CrossRef] [PubMed]
- Davison, T.; Samavati, F.; Jacob, C. LifeBrush: Painting, simulating, and visualizing dense biomolecular environments. Comput. Graph. 2019, 82, 232–242. [Google Scholar] [CrossRef]
- Fataf, N.A.A.; Gowrisankar, A.; Banerjee, S. In search of self-similar chaotic attractors based on fractal function with variable scaling approximately. Phys. Scr. 2020, 95, 075206. [Google Scholar] [CrossRef]
- Atangana, A.; Mekkaoui, T. Trinition the complex number with two imaginary parts: Fractal, chaos and fractional calculus. Chaos Solitons Fractals 2019, 128, 366–381. [Google Scholar] [CrossRef]
- Sayed, G.I.; Tharwat, A.; Hassanien, A.E. Chaotic dragonfly algorithm: An improved metaheuristic algorithm for feature selection. Appl. Intell. 2019, 49, 188–205. [Google Scholar] [CrossRef]
- Yadav, V.K.; Shukla, V.K.; Das, S. Difference synchronization among three chaotic systems with exponential term and its chaos control. Chaos Solitons Fractals 2019, 124, 36–51. [Google Scholar] [CrossRef]
- Anter, A.M.; Gupta, D.; Castillo, O. A novel parameter estimation in dynamic model via fuzzy swarm intelligence and chaos theory for faults in wastewater treatment plant. Soft Comput. 2020, 24, 111–129. [Google Scholar] [CrossRef]
- Lai, Q.; Lai, C.; Kuate, P.D.K.; Li, C.; He, S. Chaos in a simplest cyclic memristive neural network. Int. J. Bifurc. Chaos 2022, 32, 2250042. [Google Scholar] [CrossRef]
- Xian, Y.; Wang, X. Fractal sorting matrix and its application on chaotic image encryption. Inf. Sci. 2021, 547, 1154–1169. [Google Scholar] [CrossRef]
- Jahanshahi, H.; Orozco-López, O.; Munoz-Pacheco, J.M.; Alotaibi, N.D.; Volos, C.; Wang, Z.; Chu, Y.M. Simulation and experimental validation of a non-equilibrium chaotic system. Chaos Solitons Fractals 2021, 143, 110539. [Google Scholar] [CrossRef]
- Faradja, P.; Qi, G. Analysis of multistability, hidden chaos and transient chaos in brushless DC motor. Chaos Solitons Fractals 2020, 132, 109606. [Google Scholar] [CrossRef]

Disclaimer/Publisher’s Note: The statements, opinions and data contained in all publications are solely those of the individual author(s) and contributor(s) and not of MDPI and/or the editor(s). MDPI and/or the editor(s) disclaim responsibility for any injury to people or property resulting from any ideas, methods, instructions or products referred to in the content. |
© 2024 by the authors. Licensee MDPI, Basel, Switzerland. This article is an open access article distributed under the terms and conditions of the Creative Commons Attribution (CC BY) license (https://creativecommons.org/licenses/by/4.0/).