Article

Implications of Asymptomatic Carriers for Tuberculosis Transmission and Control in Thailand: A Modelling Approach

by
Md Abdul Kuddus
1,2,
Sazia Khatun Tithi
1 and
Thitiya Theparod
2,*
1
Department of Mathematics, University of Rajshahi, Rajshahi 6205, Bangladesh
2
Department of Mathematics, Mahasarakham University, Maha Sarakham 44150, Thailand
*
Author to whom correspondence should be addressed.
Symmetry 2024, 16(11), 1538; https://doi.org/10.3390/sym16111538
Submission received: 11 October 2024 / Revised: 10 November 2024 / Accepted: 14 November 2024 / Published: 17 November 2024
(This article belongs to the Special Issue Mathematical Modeling of the Infectious Diseases and Their Controls)

Abstract

:
Tuberculosis (TB) is a regional and global bacterial illness that has been expanding and affecting individuals in every generation. An unknown percentage of asymptomatic hosts have TB, and the infection can spread while exhibiting no symptoms. These asymptomatic TB carriers, who contribute to the spread of the illness yet go mostly undetected, may make it more difficult to prevent transmission. In this study, we utilized the concept of symmetry to construct a manageable disease modelling framework for TB transmission and control. We developed a TB model to investigate the potential influence of asymptomatic carriers, symptomatic infections, and the entirety of TB prevalence on different approaches to treatment and prevention in Thailand. Annual TB incidence data from Thailand from 2000 to 2022 were used to calibrate the model parameters. We assessed the potential for reaching conflicting results about the management and spread of tuberculosis in Thailand. Our results showed that some TB strategies that were thought to be effective in reducing transmission may have the opposite impact, or that an intervention’s effectiveness might be overestimated, making it seem unfeasible in certain scenarios. For example, the objective of TB treatment, which attempts to decrease the occurrence of symptomatic TB infections, is to decrease the TB infection and propagation rates if the relative carrier (η) is less than one. Nonetheless, our results indicate that this strategy may increase the frequency of asymptomatic TB patients, symptomatic TB viral infections, and overall TB prevalence if η has been sufficiently understated. We also found that reducing only the progression rate of symptomatic TB infections cannot stop asymptomatic TB carriers and total TB prevalence, even when the relative infection of carriers ( η ) is less than unity. Our research provides a better understanding of the role of asymptomatic patients in spreading TB and highlights the need to accurately include bearers in models that guide Thailand’s TB control strategy.

1. Introduction

The most prevalent infectious cause of death globally is tuberculosis (TB) caused by the Mycobacterium tuberculosis (MTB) complex [1,2]. One of the primary causes of death and disease worldwide is TB. Numerous variables linked to a higher risk of contracting TB in the population as a whole included bacillary pressure, close contact with the index case, immunosuppressive conditions related to recent TB (e.g., HIV, immune-mediated inflammatory disorder, immunosuppressive agent treatment), malnourishment, obesity, chronic kidney disease, transplantation, silicosis, and alcohol consumption [3,4,5,6]. A thorough understanding of the clinical pathogenic spectrum of TB, from infection to disease onset, is necessary to reduce the illness and fatality rate [7,8]. A continuum of infection has been described by the traditional dichotomy between latent and active TB [9]. Others have recently demonstrated that human TB infections exhibit a continuous range of harmful immunological reactions and metabolic bacterial activity, from inactive infections to developing diseases [8,10].
TB mainly spreads through the air when individuals who have active TB in their lungs cough, sneeze, or speak, releasing MTB germs into the air. People who breathe in these airborne particles can become infected, especially in crowded or poorly ventilated spaces. The terms “asymptomatic carrier” and “symptomatic patient” are used in TB disease to differentiate between people relative to their tendency for disease transmission and whether or not they develop symptoms. An asymptomatic carrier of TB is someone who is infected with MTB but does not exhibit symptoms. Asymptomatic carriers with latent TB are not contagious and cannot spread TB bacteria to others. However, if the immune system is weakened, latent TB may become active, causing the individual to become ill and infectious. Symptomatic TB patients, on the other hand, are usually in the active stage of the infection and are infectious because they release TB germs into the air when they cough, sneeze, or even speak. Symptomatic TB patients are the main contributors to the transmission of TB in the community.
Given that the escalating bacillary burden and consequent host damage are correlated with the development of clinical symptoms [7], asymptomatic intervals that preceded both active and dormant TB disease, encompassing beginning and mild TB, can be identified [8]. Healthcare workers (HCWs) were identified as one of the risk variables linked to the incidence of TB [6]. Subclinical TB is defined as the presence of feasible MTB identified using current microbial or auditory techniques [8]. Significantly, it is becoming increasingly acknowledged that people with subclinical TB contribute significantly to the spread of TB in the lungs [11]. An international political agreement to lower TB infections and deaths was reached in 2014 when the UN adopted the End TB Strategy. By 2035, the proclamation aimed to eliminate nearly all TB-related deaths and drastically decrease the incidence of the disease [12].
Latent infection with TB (LTBI) was shown to be prevalent in middle-income and low-income nations among healthcare workers (HCWs) at 54 percent (range 33–79%), according to a systematic review [13]. Between 69 and 5780 cases of TB per 100,000 healthcare workers (HCWs) showed a range in the yearly risk of LTBI (0.5–14.3%). Compared to the general population, HCWs have an attributable risk for TB of 25–5361 incidents annually per 100,000 persons [14]. A separate systematic analysis looked at LTBI and TB among medical providers globally more than five years later, encompassing both high- and low-income nations, and found that HCWs had an increased risk of TB compared to the general population (RR 2.97, 95%CI 2.43–2.51) [15]. Therefore, TB among healthcare workers remains a major problem in hospitals. China’s national TB incidence rate was expected to be 58/100,000 in 2019, despite significant progress in the past few decades [2,16]. According to a prevalence assessment conducted on TB in the public, 26.3% of common culture-positive infections have no symptoms [16]. Approximately 8 million cases of TB are reported annually worldwide, with 95% of the TB cases occurring in underdeveloped nations. TB primarily affects individuals aged 15–59 years. For the most part, in Sub-Saharan Africa’s developing nations, TB is the top cause of mortality [17]. TB is estimated to kill a minimum of two million individuals each year in sub-Saharan Africa [18].
Thailand has experienced a TB epidemic. Data from 2019 showed that Thailand belongs to a group of 14 nations with a high TB burden [12]. Other high-burden countries, including HIV-positive individuals, have higher rates of TB (15 per 100,000 with a 95% trustworthy duration [CI], 12 to 20), MDR-TB (5.7 per 100,000 with 3.3 to 8.8), and total TB incidence (153 per 100,000 individuals with 95% confidential period [CI], 116 to 195). Since the 1950s, Thailand has become a member of international TB control efforts [19]. WHO declared TB a “global emergency” in the 1990s because of the HIV outbreak and epidemics of TB with multiple drug resistance (MDR-TB) [20].
Reports on TB among healthcare workers in Thailand ranged from 20 to 22. All reports showed that HCWs had a higher incidence of TB than the overall population [21,22,23]. Fifty percent of healthcare workers (HCWs) with fewer than five years of experience had TB at Ramathibodi Hospital and thirty percent at Chiang Mai Hospital [21,22,23]. The majority of them were middle-aged (20), with 40.4% between the ages of 30 and 39, and 28.4% between the ages of 20 and 29. Furthermore, TB was found in 22.9% of healthcare workers (HCWs) who did not exhibit any symptoms during their yearly physical examinations [21].
To stop the spread of the TB epidemic, Thailand created a National Strategy Policy on TB (2017–2021) in 2017 [24]. New recommendations for diagnosing and treating TB were developed, along with initiatives such as the use of cocktail medications, improvement of the Directly Observe Treatment (DOT) program, and proactive case detection to stop the emergence of new cases, among others. As TB cases were common among “migrants”, they were recognized as a high-risk group in need of particular care. Plans and initiatives at the national level appeared to be well crafted in compliance with international standards. However, the borderlands’ practical execution was far more difficult. Given the prevalence of MDR-TB, endogenous reactivation, and increased incidence of HIV in the past 20 years, modern practice adaptation aids in improving TB control.
In order to combat TB, a thorough understanding of treatment strategies regarding the disease’s regional dissemination is essential. Mathematical modelling has been recognized as a crucial instrument that offers qualitative data regarding the prevalence of numerous illnesses and approaches to managing them. Numerous theoretical investigations on TB infection have been conducted. Various authors have created and examined several integer-order TB models [25,26,27,28,29,30]. Because they lack the memory effect necessary to provide an accurate forecast, the aforementioned integer TB models cannot make correct predictions. On the other hand, memory effects are present in non-integer models, and most operators include crossover qualities that improve prediction accuracy.
In this study, we developed a mathematical framework to better comprehend the constantly changing actions of TB better in Thailand, including asymptomatic carriers. Aiming to reach a decisive impact in the rational design of the new TB model, our main focus in this work will be on the analysis of a mathematical model that considers the intervention and treatment effects that occur among the entire population in Thailand. Therefore, this research will enhance our knowledge of evolving TB epidemics and help shape plans for policy and TB control initiatives in Thailand. As a result, the TB burden will be reduced at the community level.

2. Methods and Materials

The transmission of TB among the following compatible compartments is represented by a predictable mathematical model that we developed: susceptible S(t), which is made up of uninfected people who have been identified as susceptible to TB disease; those living with TB develop latently infected L(t), which is made up of those who become infected but have yet to develop active TB; C(t), which is the compartment containing individuals who are actively TB positive, TB-affected people I(t) who exhibited clinical signs, and recovered individuals R(t). In light of these, N(t), the overall number of individuals during time t, is given by
N = S + L + C + I + R .
People in every compartment naturally die at an identical constant rate μ. To ensure the population size remains constant, we replace all deaths as newborns in the susceptible compartment. Individuals within the S compartment are susceptible to infection at a rate determined by time, β (I + ηC), and they transfer to the compartment with latent contamination L. Latent infection carriers enter active TB (I) groups at a certain percentage, ρ α. A fraction (1 − ρ with latent sicknesses progresses to compartment C, where recipients exhibit no symptoms. A percentage of treated active TB cases may go to compartment C, and the rate of τ of infected people with no signs may shift to compartment I. A fraction δ2 of active TB without any symptoms that get well naturally enters compartment R. Of the active TB, δ2 moves inside the recovered compartment R after recovering on its own; a fraction of κ moves into chamber R receiving proper treatment. Our proposed TB model is designed to understand the spread of asymptomatic carriers, symptomatic infections, and total TB prevalence. Since those who die from TB no longer contribute to transmission, our transmission dynamics model excluded TB-related death. In addition, the healthcare infrastructure and effective TB treatment programs are very strong in Thailand, and the TB-related mortality rate is very low. Therefore, neglecting the TB-related mortality rate in our model is reasonable. A flow diagram of our proposed model is presented in Figure 1.
The following deterministic arrangement of equations with nonlinear differentials characterizing the model yields the transmission of TB:
d S d t = μ N β I + η C S μ S + γ R ,
d L d t = β I + η C S ρ α L 1 ρ α L ψ L μ L ,  
d C d t = 1 ρ α L + ω I τ C μ C δ 1 C ,
d I d t = ρ α L ω I + τ C μ I δ 2 I κ I ,
d R d t = δ 1 C + ψ L + δ 2 I + κ I γ R μ R .
It is simple to demonstrate that, in the system above, given non-negative initial conditions, every state variable remains non-negative for every t > 0. In addition, we establish that the size of the entire population, N(t), satisfies by adding Equations (2)–(6)
d S d t + d L d t + d C d t + d I d t + d R d t = d N d t ˙ = 0 .
Integrating this inequality, we find
N t = C o n s t a n t .
This indicates that the total population size N(t) is bounded in this case, and hence, all compartment phases (S, L, C, I, and R) are bounded as well.

3. System Properties

3.1. Existence of Equilibria

A disease-free equilibrium (represented by E * ) is always present, as shown in Equations (2)–(6):
E * = ( S * ,   L * ,   C * ,   I * ,   R * ) = ( N ,   0 ,   0 ,   0 ,   0 )
Equations (2)–(6) can also be used to determine the endemic equilibrium point (represented by E # ):
E # = S # ,   L # ,   C # ,   I # ,   R # ,
where
S # = S * R 0 = N R 0 ,
I # = μ N B α δ 1 + τ + μ γ + μ R 0 1 R 0 F ,
L # = μ N A δ 1 + τ + μ γ + μ R 0 1 R 0 F ,
C # = μ N α γ + μ R 0 1 1 ρ A + ω B R 0 F ,
R # = μ N   R 0 1 A α + ψ + μ δ 1 + τ + μ γ + μ F R 0 F γ .
where A = δ 1 + τ + μ δ 2 + κ + μ + δ 1 + μ ω , B = τ + δ 1 + μ ρ , F = δ 1 + τ + μ A α + ψ + μ γ + μ A γ ψ γ B α δ 2 + κ γ δ 1 α A α 1 ρ + B ω .

3.2. Basic Reproduction Number

Here, we estimate the basic reproduction numbers (2)–(6) of the model. The expected number of additional infections resulting from introducing one infected case into a susceptible population is the fundamental reproduction number in the epidemic model. A higher basic reproduction number means that there are more infected people overall, and the illness usually behaves in a lasting manner. However, the number of infectious individuals tends to zero if the basic reproduction number is smaller than one [31,32,33,34]. Here, we determine the basic reproduction number of our system (2)–(6) using the next-generation matrix technique.
The simplified system (2)–(6) consists of one uninfected form (S), one recovered unit (R), and three affected states (L, C, and I).
After linearizing the structure of the disease-free equilibrium, we see the linearized infected sub-model Equations (3)–(5).
d L d t = β I + η C S α + ψ + μ L ,
d C d t = 1 ρ α L + ω I τ + μ + δ 1 C ,
d I d t = ρ α L + τ C μ + δ 2 + κ + ω I .
Here, the ODEs (7)–(9) elucidate the spread of the infection and the modifications made to the conditions of those already affected.
The infected subsystem can be expressed in the following manner using the value x T = L ,   C ,   I T , where T stands for transposition:
x ˙ = ( T + Σ ) x .
The shifting mechanism section of Equations (7)–(9), that is, the entry of susceptible people into the infected divisions L, C, and I, is the transmission (new infections) matrix T which represents the rates of new infections generated by each compartment. Here, new infections are introduced only into the latent compartment L from interactions with C and I compartments. The entries in T are derived from the term β ( I + η C ) S in (7).
At the disease-free equilibrium S * = N (since the total population is susceptible) and all infected compartments L ,   C ,   I = 0 . Then the new transmission (infections) matrix T is given by
T = 0 β η S * β S * 0 0 0 0 0 0 = 0 β η N β N 0 0 0 0 0 0 .
The matrix Σ represents the transition rates out of each infected compartment due to recovery, TB progression, amplification, and death. For each equation, the term contributing to outflows from L, C, and I are α + ψ + μ , ( δ 1 + τ + μ ) and δ 2 + ω + κ + μ , respectively.
Hence, the transition matrix Σ is then
Σ = α + ψ + μ 0 0 ( 1 ρ ) α ( δ 1 + τ + μ ) ω ρ α τ ( δ 2 + ω + κ + μ ) ,
Then, we have [32] as the next-generation matrix (NGM),
N G M = T   Σ 1 .
The basic reproduction number R 0 is the dominant eigenvalue (spectral radius) of the NGM; it describes the average number of secondary infections produced by a single infected individual in a totally susceptible population. Hence, the basic reproduction number is
R 0 = N α β τ + ( 1 ρ ) δ 2 + κ + μ + ω η + δ 1 + μ ρ α + ψ + μ δ 1 + τ + μ δ 2 + κ + μ + δ 1 + μ ω .
In Figure 2, the vertical axis represents the relative infectiousness of carriers (η), whereas the horizontal axis represents the rate of development of symptomatic illness (τ). These factors together determine the fundamental reproduction number, R 0 . Directions with rising R 0 are indicated by dashed black lines and contours with constant R 0 are indicated by solid white lines. Whether η > 1 or η < 1 determines R 0 ’s slope in τ direction is evident. Table 1 provides parameter values.
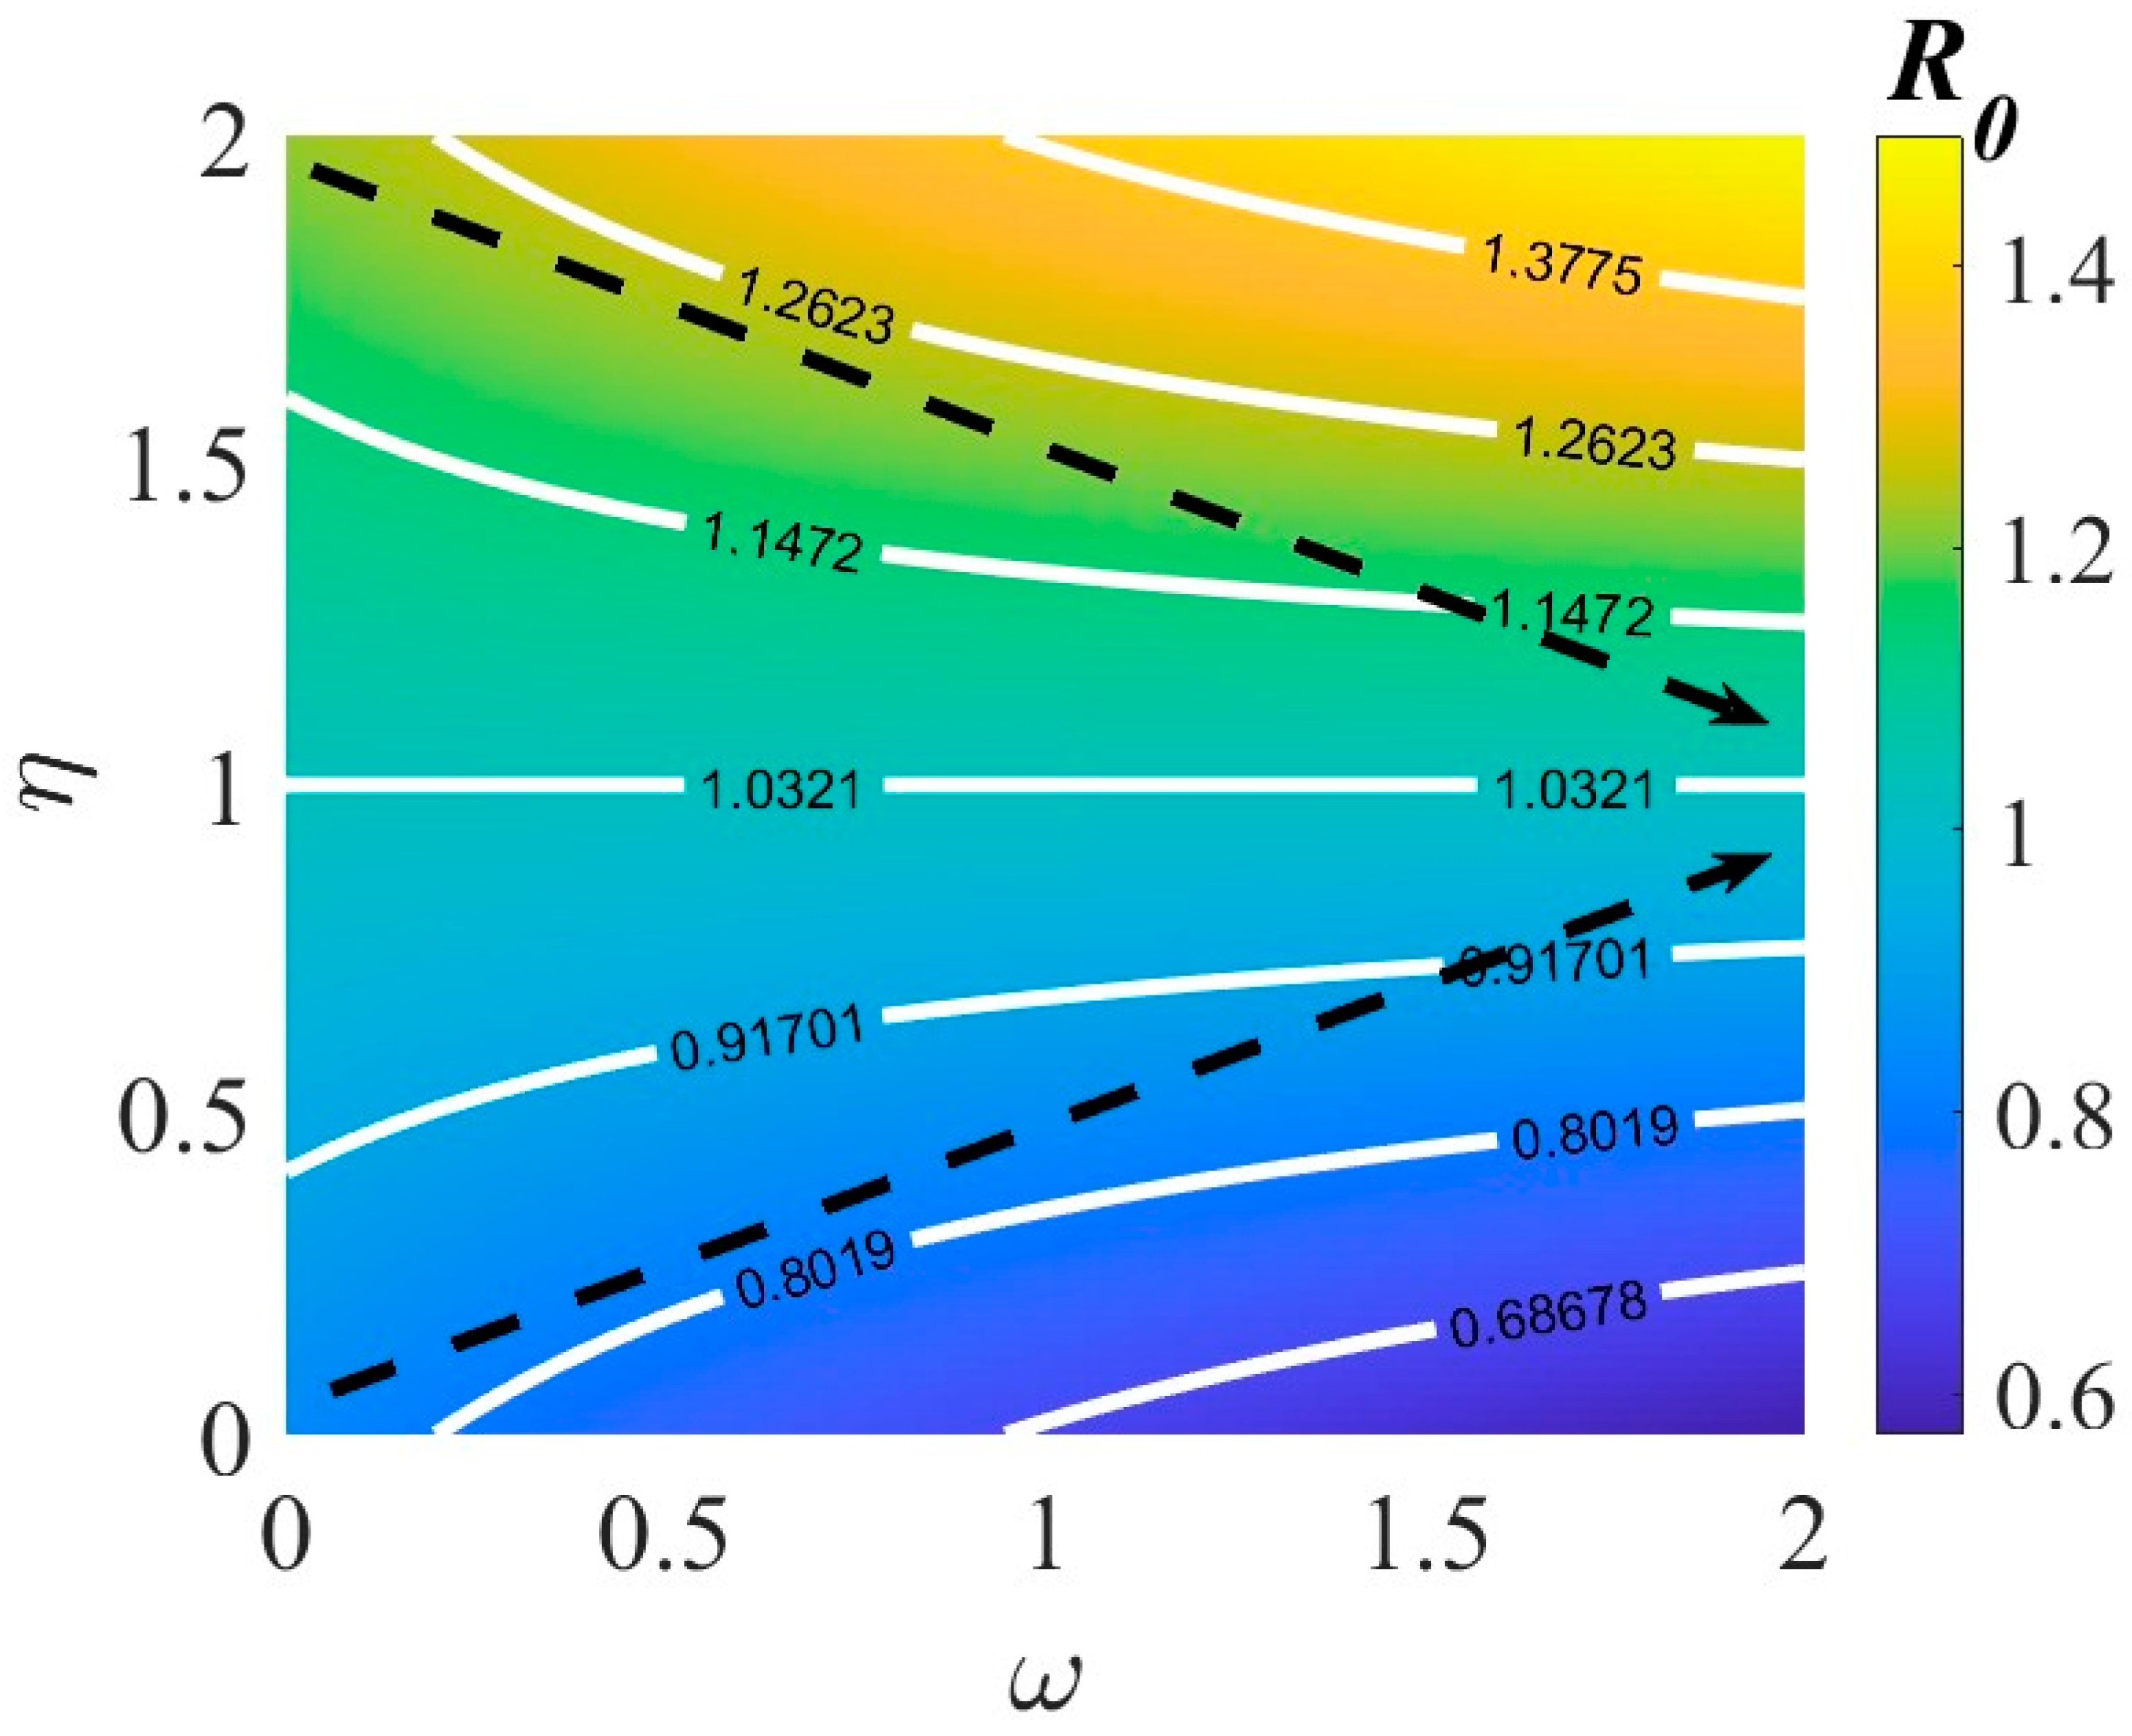
In Figure 3, the basic reproduction number ( R 0 ) is shown as a function of the relative infectiousness of carriers, η (vertical axis), and the progression rate to asymptomatic infection, ω (horizontal axis). The dashed black lines indicate directions where R 0 is increasing and decreasing, while the solid white lines indicate contours where R 0 is constant. The slope of R 0 in the direction of ω is dependent on η > 1 or η < 1 .

3.3. Parameters Estimation

The spread of TB from person to person is the primary characteristic of the disease. As a result, a critical aspect of the global epidemic of TB is the rate of transmission. We evaluate this section’s parameter values by looking at statistics on TB outbreaks in Thailand between 2000 and 2022 [39]. Figure 4 shows the fitted line as a solid red line, and the number of TB cases over this period is shown as blue dots indicating the 95% confidence interval (CI) measured in the green-shaded boundaries. A connection between its appearance and the path of data establishment can be immediately observed using this figure, providing important insights into the accuracy and efficiency of our parameter-setting process.
These parameters were determined by fitting the known TB cases in Thailand into the model to ensure accuracy. We employ the best parameter estimate method available: the least-squares approach. This method is used with the proposed models (2)–(6) to reduce the total squared differences, which is then subtracted using the method M t ,   x Ҡ a c t u a l 2 , where Ҡ a c t u a l corresponds to numerous TB cases, and M t ,   x corresponds to the model’s solution, where the estimated parameters, x, represent the total number of TB-infected people throughout time, t. Here, we estimated model parameters such as the transmission rate β = 2.19 × 10 7 , progression rate α = 0.36 , relative infection of carriers η = 0.0018 , and treatment rate of symptomatic infection κ = 0.60 . Additional parameter values were obtained from reliable literature bases and are listed in Table 1. This approach can help improve decision making regarding public health measures and provide a more realistic portrayal of the situation in Thailand.

4. Results

4.1. Calculating Asymptomatic Carries and Symptomatic Infection

The total prevalence of TB infection, or P(t), is defined as the proportion of infections in the host community at a given period t, comprising both asymptomatic and symptomatic patients. P(t) is provided by the proposed model:
P = P A t + P I t
where P A ( t ) represents the frequency of carriers without symptoms and P I ( t ) represents the frequency of infection with symptoms at time t such that
P A ( t ) = C ( t )   and   P I t = I t .
According to the infection-type prevalence, at the epidemiological equilibrium,
P A # = lim t P A ( t )   and   P I # = lim t P I ( t ) .
Applying the system equations allows for the calculation of (4) and (5) to be zero. So that
1 ρ α L # + ω I # τ + μ + δ 1 C # = 0
ρ α L # + τ C # μ + δ 2 + κ + ω I # = 0
adding (12) and (13), we obtain
α L # δ 1 + μ C # δ 2 + κ + μ I # = 0 , α L # = δ 1 + μ C # + δ 2 + κ + μ I # = 0
Inserting (14) into (12), we obtain
1 ρ δ 1 + μ C # + δ 2 + κ + μ I # + ω I # τ + μ + δ 1 C # = 0 , δ 1 + μ C # ρ δ 1 + μ C # + 1 ρ δ 2 + κ + μ I # + ω I # δ 1 + μ C # τ C # = 0 , ω + 1 ρ δ 2 + κ + μ I # = τ + ρ δ 1 + μ C # , P = C # ( t ) I # ( t ) = ω + ( 1 ρ ) ( δ 2 + κ + μ ) τ + ρ ( δ 1 + μ ) .
Here, we observe that the prevalence of asymptomatic carriers will exceed the prevalence of symptomatically infected individuals if P > 1 ; in the absence of P > 1 , symptomatic infections will be more prevalent. In a broad sense, the value P may alternatively be seen as the migration rates from I to C and from C to I, net per capita.
Here, we demonstrate the dependence of the fundamental reproduction number R 0 on P.
R 0 = N α β τ + 1 ρ δ 2 + κ + μ + ω η + δ 1 + μ ρ α + ψ + μ δ 1 + τ + μ δ 2 + κ + μ + δ 1 + μ ω , = N α β τ + ρ δ 1 + μ + ω + ( 1 ρ ) δ 2 + κ + μ η α + ψ + μ δ 1 + τ + μ δ 2 + κ + μ + δ 1 + μ ω .
Now, dividing the numerator and denominator by τ + ρ δ 1 + μ , we obtain
R 0 = N α β τ + ρ δ 1 + μ + ω + 1 ρ δ 2 + κ + μ η τ + ρ δ 1 + μ α + ψ + μ δ 1 + τ + μ δ 2 + κ + μ + δ 1 + μ ω τ + ρ δ 1 + μ ,
R 0 = N α β 1 + ω + ( 1 ρ ) δ 2 + κ + μ η τ + ρ δ 1 + μ α + ψ + μ δ 1 + τ + μ δ 2 + κ + μ + δ 1 + μ ω τ + ρ δ 1 + μ ,
R 0 = N α β 1 + η P K .
where P = ω + ( 1 ρ ) δ 2 + κ + μ τ + ρ δ 1 + μ and K = α + ψ + μ δ 1 + τ + μ δ 2 + κ + μ + δ 1 + μ ω τ + ρ δ 1 + μ .
Now, inserting C # = P I # into (12)
1 ρ α L # + ω I # τ + μ + δ 1 P I # = 0 , τ + μ + δ 1 P ω I # = 1 ρ α L # τ + μ + δ 1 P ω I # = 1 ρ α μ N A δ 1 + τ + μ γ + μ R 0 1 R 0 F , I # ( t ) = P I # = 1 ρ α μ N A δ 1 + τ + μ γ + μ R 0 1 R 0 F τ + μ + δ 1 P ω , = 1 ρ α μ N A δ 1 + τ + μ γ + μ F τ + μ + δ 1 P ω 1 1 R 0 , = G 1 1 R 0 ,
  • where G = 1 ρ α μ N A δ 1 + τ + μ γ + μ F τ + μ + δ 1 P ω ,
  • F = δ 1 + τ + μ A α + ψ + μ γ + μ A γ ψ γ B α δ 2 + κ γ δ 1 α A α 1 ρ + B ω ,
  • A = δ 1 + τ + μ δ 2 + κ + μ + δ 1 + μ ω , B = τ + δ 1 + μ ρ  and
  • P = ω + ( 1 ρ ) ( δ 2 + κ + μ ) τ + ρ ( δ 1 + μ ) .
We can also derive the respective infection-type prevalence P C # so that
P C # = P G 1 1 R 0 ,
Lastly, the overall frequency of endemic infections is
P # = lim t P t = 1 1 R 0 .
Evidently, the fundamental reproduction number R 0 determines the endemic prevalence, which increases and is positive only when R 0 > 1 .

4.2. Asymptomatic Carriers Are Essential to the Spread of TB Transmission

To understand how carriers without symptoms might contribute to the transmission of TB at endemic equilibrium, even if they are less common than symptomatic patients, we look at the endemic incidence of TB infection Θ ^ , which is the total number of new cases in a given amount of time at endemic equilibrium (including symptomatic infection and asymptomatic carriage). In our model, it is found from the system of Equations (2)–(6) as
Θ ^ = Θ ^ A + Θ ^ I
where Θ ^ A is the asymptomatic carrier’s contribution to the endemic incidence of TB infection and Θ ^ I is the contribution of the symptomatic infection such that
Θ ^ A = β η S ^   C ^   and   Θ ^ I = β S ^   I ^ .
Undoubtedly, asymptomatic carriers promote an endemic incidence when Θ ^ A > Θ ^ I which remains confirmed. When η P > 1 , it is only possible if carriers without symptoms have a sufficiently higher infectious potential than infectious agents with symptoms. Hence, even if the frequency of asymptomatic carriers is completely overshadowed by that of symptomatic infectives, it is still feasible for asymptomatic carriers to play a significant role in TB transmission.

4.3. Effects of Various Interventions on TB Dynamics

In this section, we explore how different interventions may change the prevalence of symptomatic TB infections ( P I # ) at the equilibrium level. Here, we only consider the case where R 0 > 1 , indicating the stability of the endemic equilibrium and being biologically meaningful. It is straightforward to show that
δ P I # δ x = 1 G 2 δ G δ x   1 1 R 0 + 1 G   1 R 0 2 δ R 0 δ x
Therefore, δ P I # δ x > 0 when
1 G   δ G δ x < 1 R 0 2 R 0   δ R 0 δ x .
For the parameters x ϵ { β ,   η } , condition (17) always holds since δ G δ x = 0 and δ R 0 δ x > 0 for all x ϵ { β ,   η } . This makes logical sense because it increases the interactivity of any form of infection (by raising β or η) and will always result in more cases of both asymptomatic and symptomatic TB infection types. For all other parameters, interventions’ impact on the pattern of TB infections with symptoms being more complicated at the equilibrium level of prevalence.
For x   ϵ   { ω } , δ P I # δ x < 0 when η < 1 since δ G δ x > 0 always holds true and δ R 0 δ x < 0 for x   ϵ   { ω } if and only if η < 1 . However, if η > 1 , then an intervention that alters ω may either increase or decrease P I # , depending on whether condition (17) is satisfied. For x   ϵ   { τ ,   α } , δ P I # δ x > 0 when η < 1 since δ G δ x < 0 always holds true and δ R 0 δ x > 0 for x   ϵ   { τ ,   α } if and only if η < 1 . However, if η > 1 , then an intervention that alters τ or α may either increase or decrease P I # , depending on whether condition (17) is satisfied. Therefore, when asymptomatic carriers have less potential for infection reproduction than symptomatic infectives ( η < 1 ), eliminating the total prevalence of infection with symptom manifestation (by decreasing τ or α or increasing ω) is always an effective strategy to lessen the endemic risk of TB frequency of symptomatic infections P I # . Conversely, carriers who do not exhibit symptoms have a greater capacity for reproduction (so that η > 1 ), then reducing the corresponding percentage of symptomatic infection manifestations could increase the endemic TB frequency among symptomatic illnesses P I # .
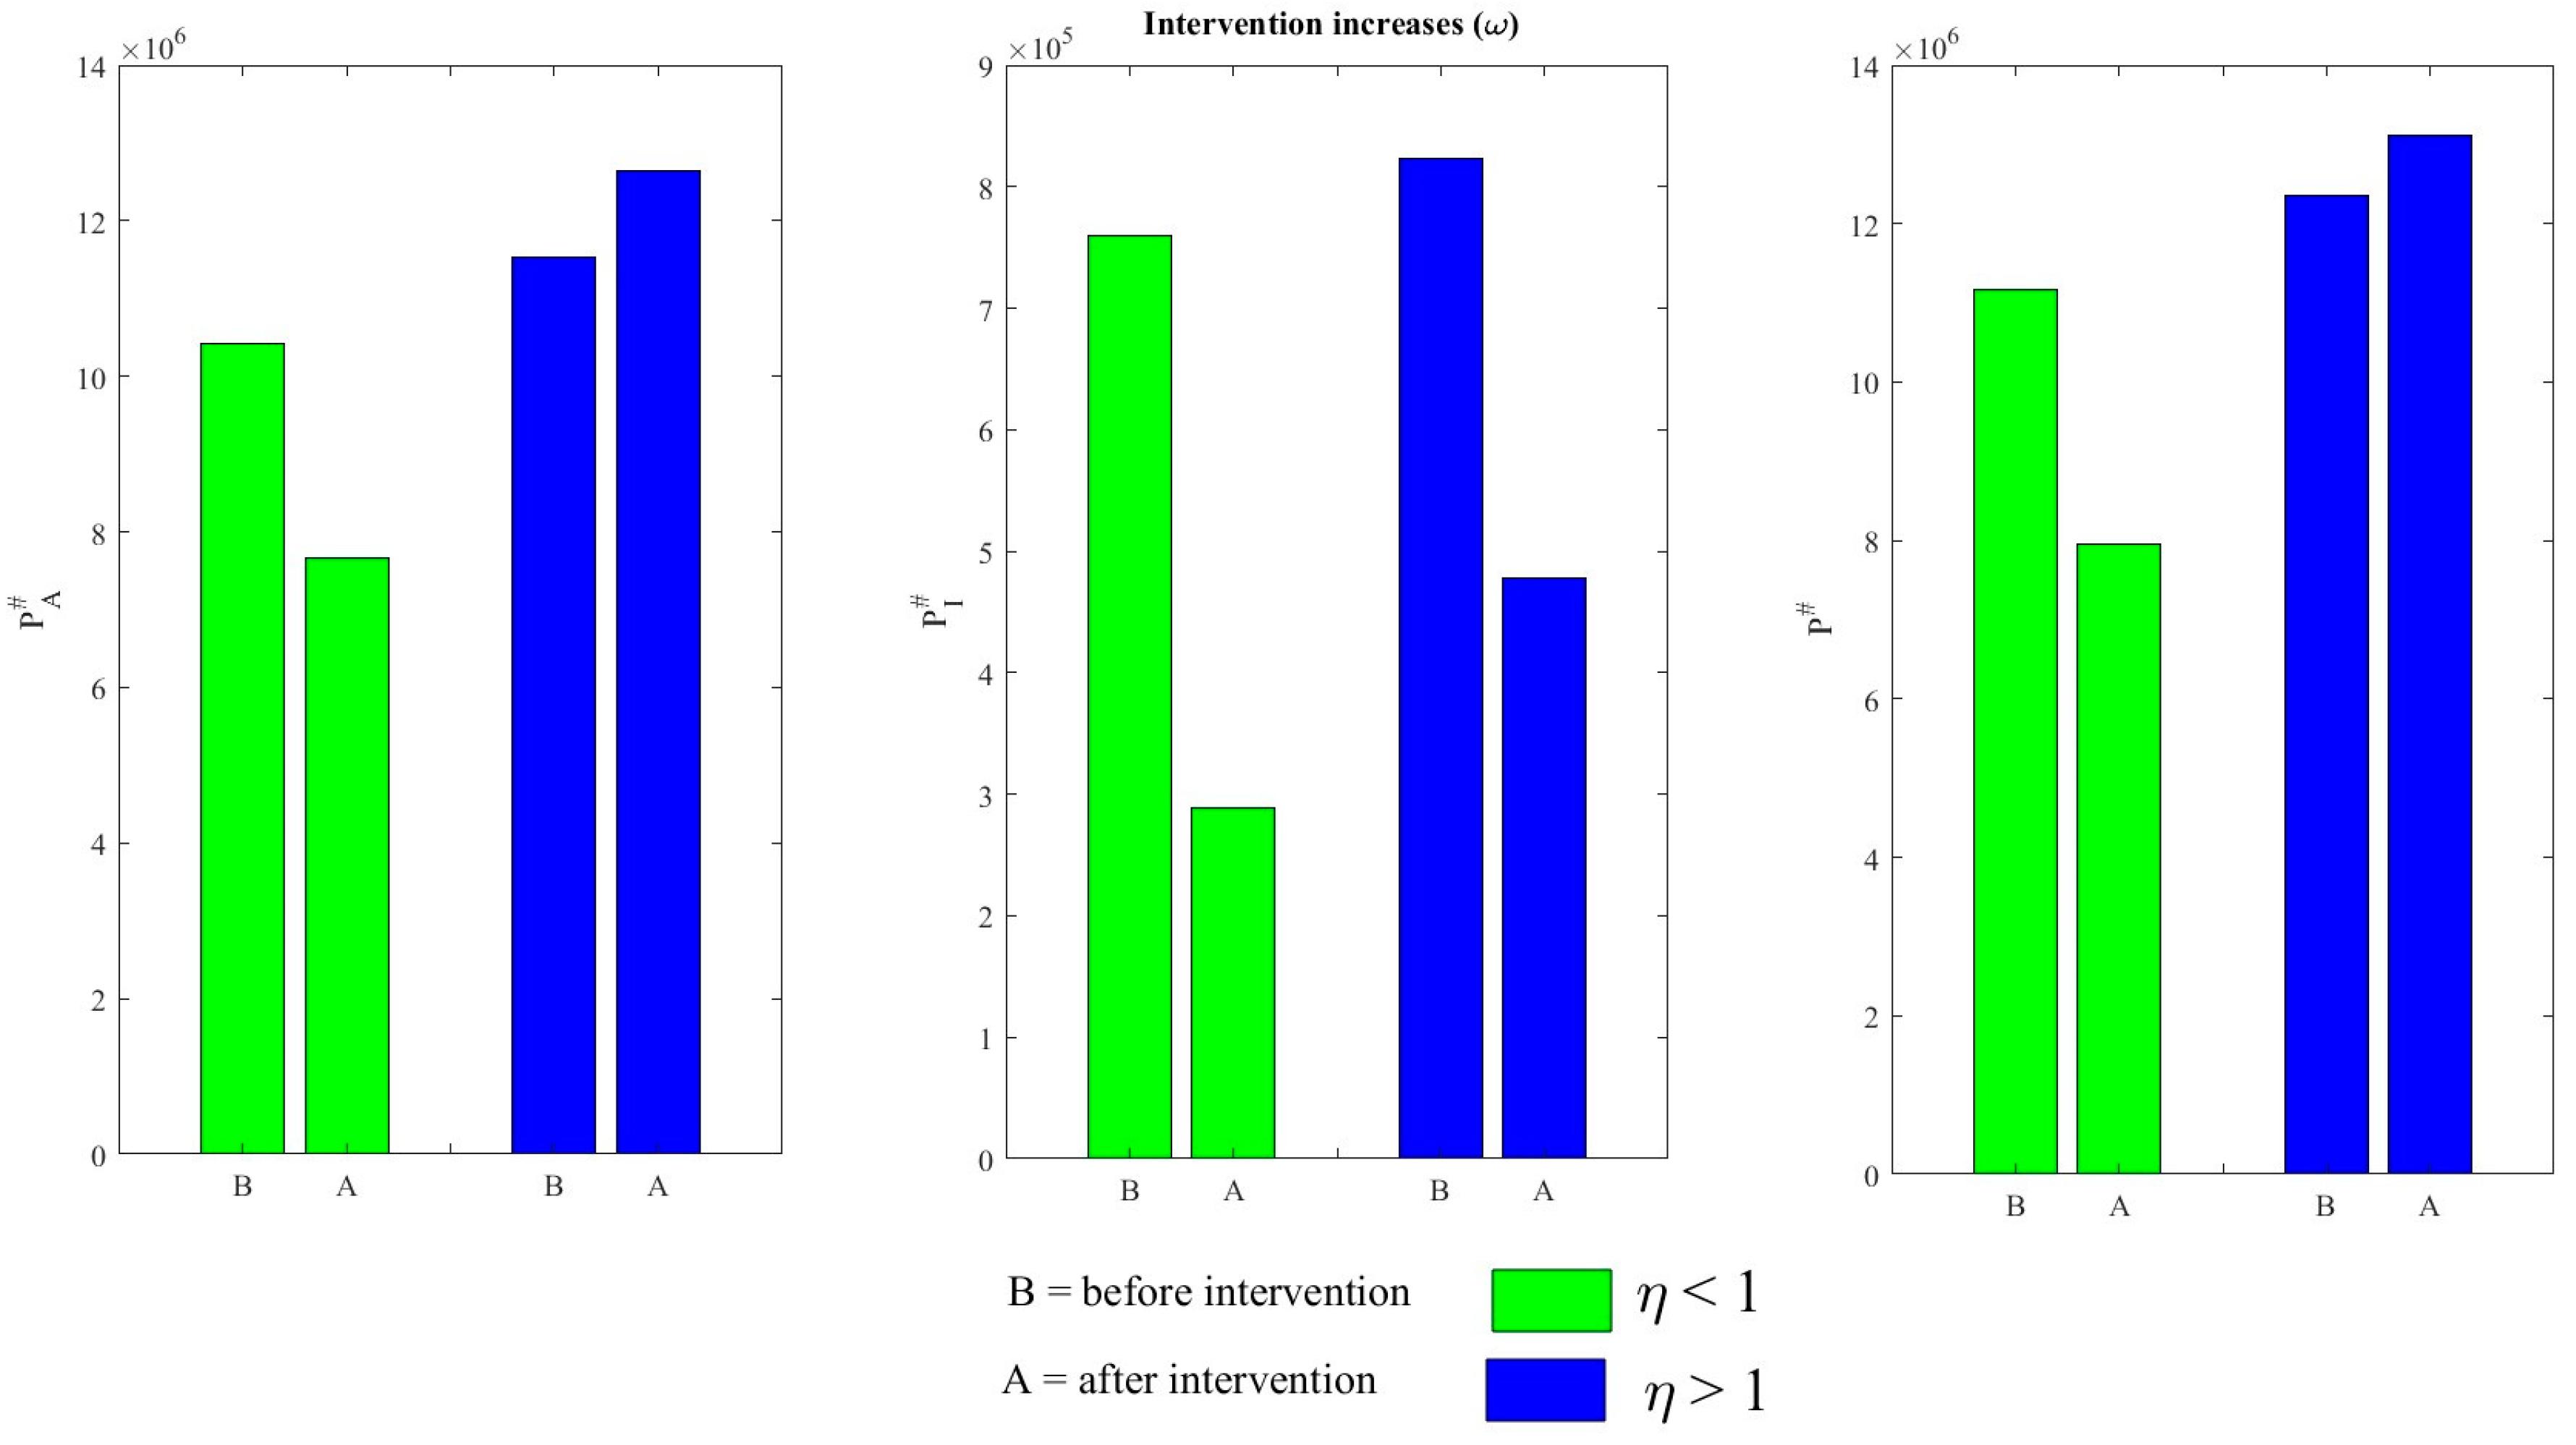
Figure 5 and Figure 6 show how η affects the progression rate to asymptomatic carriage ( ω ) corresponding to endemic prevalence of carriers without symptoms, symptoms exhibiting infections, and overall frequency both before and after the intervention. In Figure 5, due to the influence of the pace of progression (ω) from infections with symptoms to silent carriers and η, we show the overall TB prevalence. Here, we note a proportionate relationship between ω and η and the overall TB prevalence, with the latter increasing as ω increases. From Figure 6, the endemic proportion of asymptomatic TB containers falls when η < 1 but increases when η > 1 if the spread rate (ω) is increased. The endemic prevalence of symptomatic TB infections decreases either η < 1 or η > 1 . The total endemic prevalence of TB reduces when η < 1 but raises when η > 1 . Therefore, it is very important to maintain the values of η below 1.
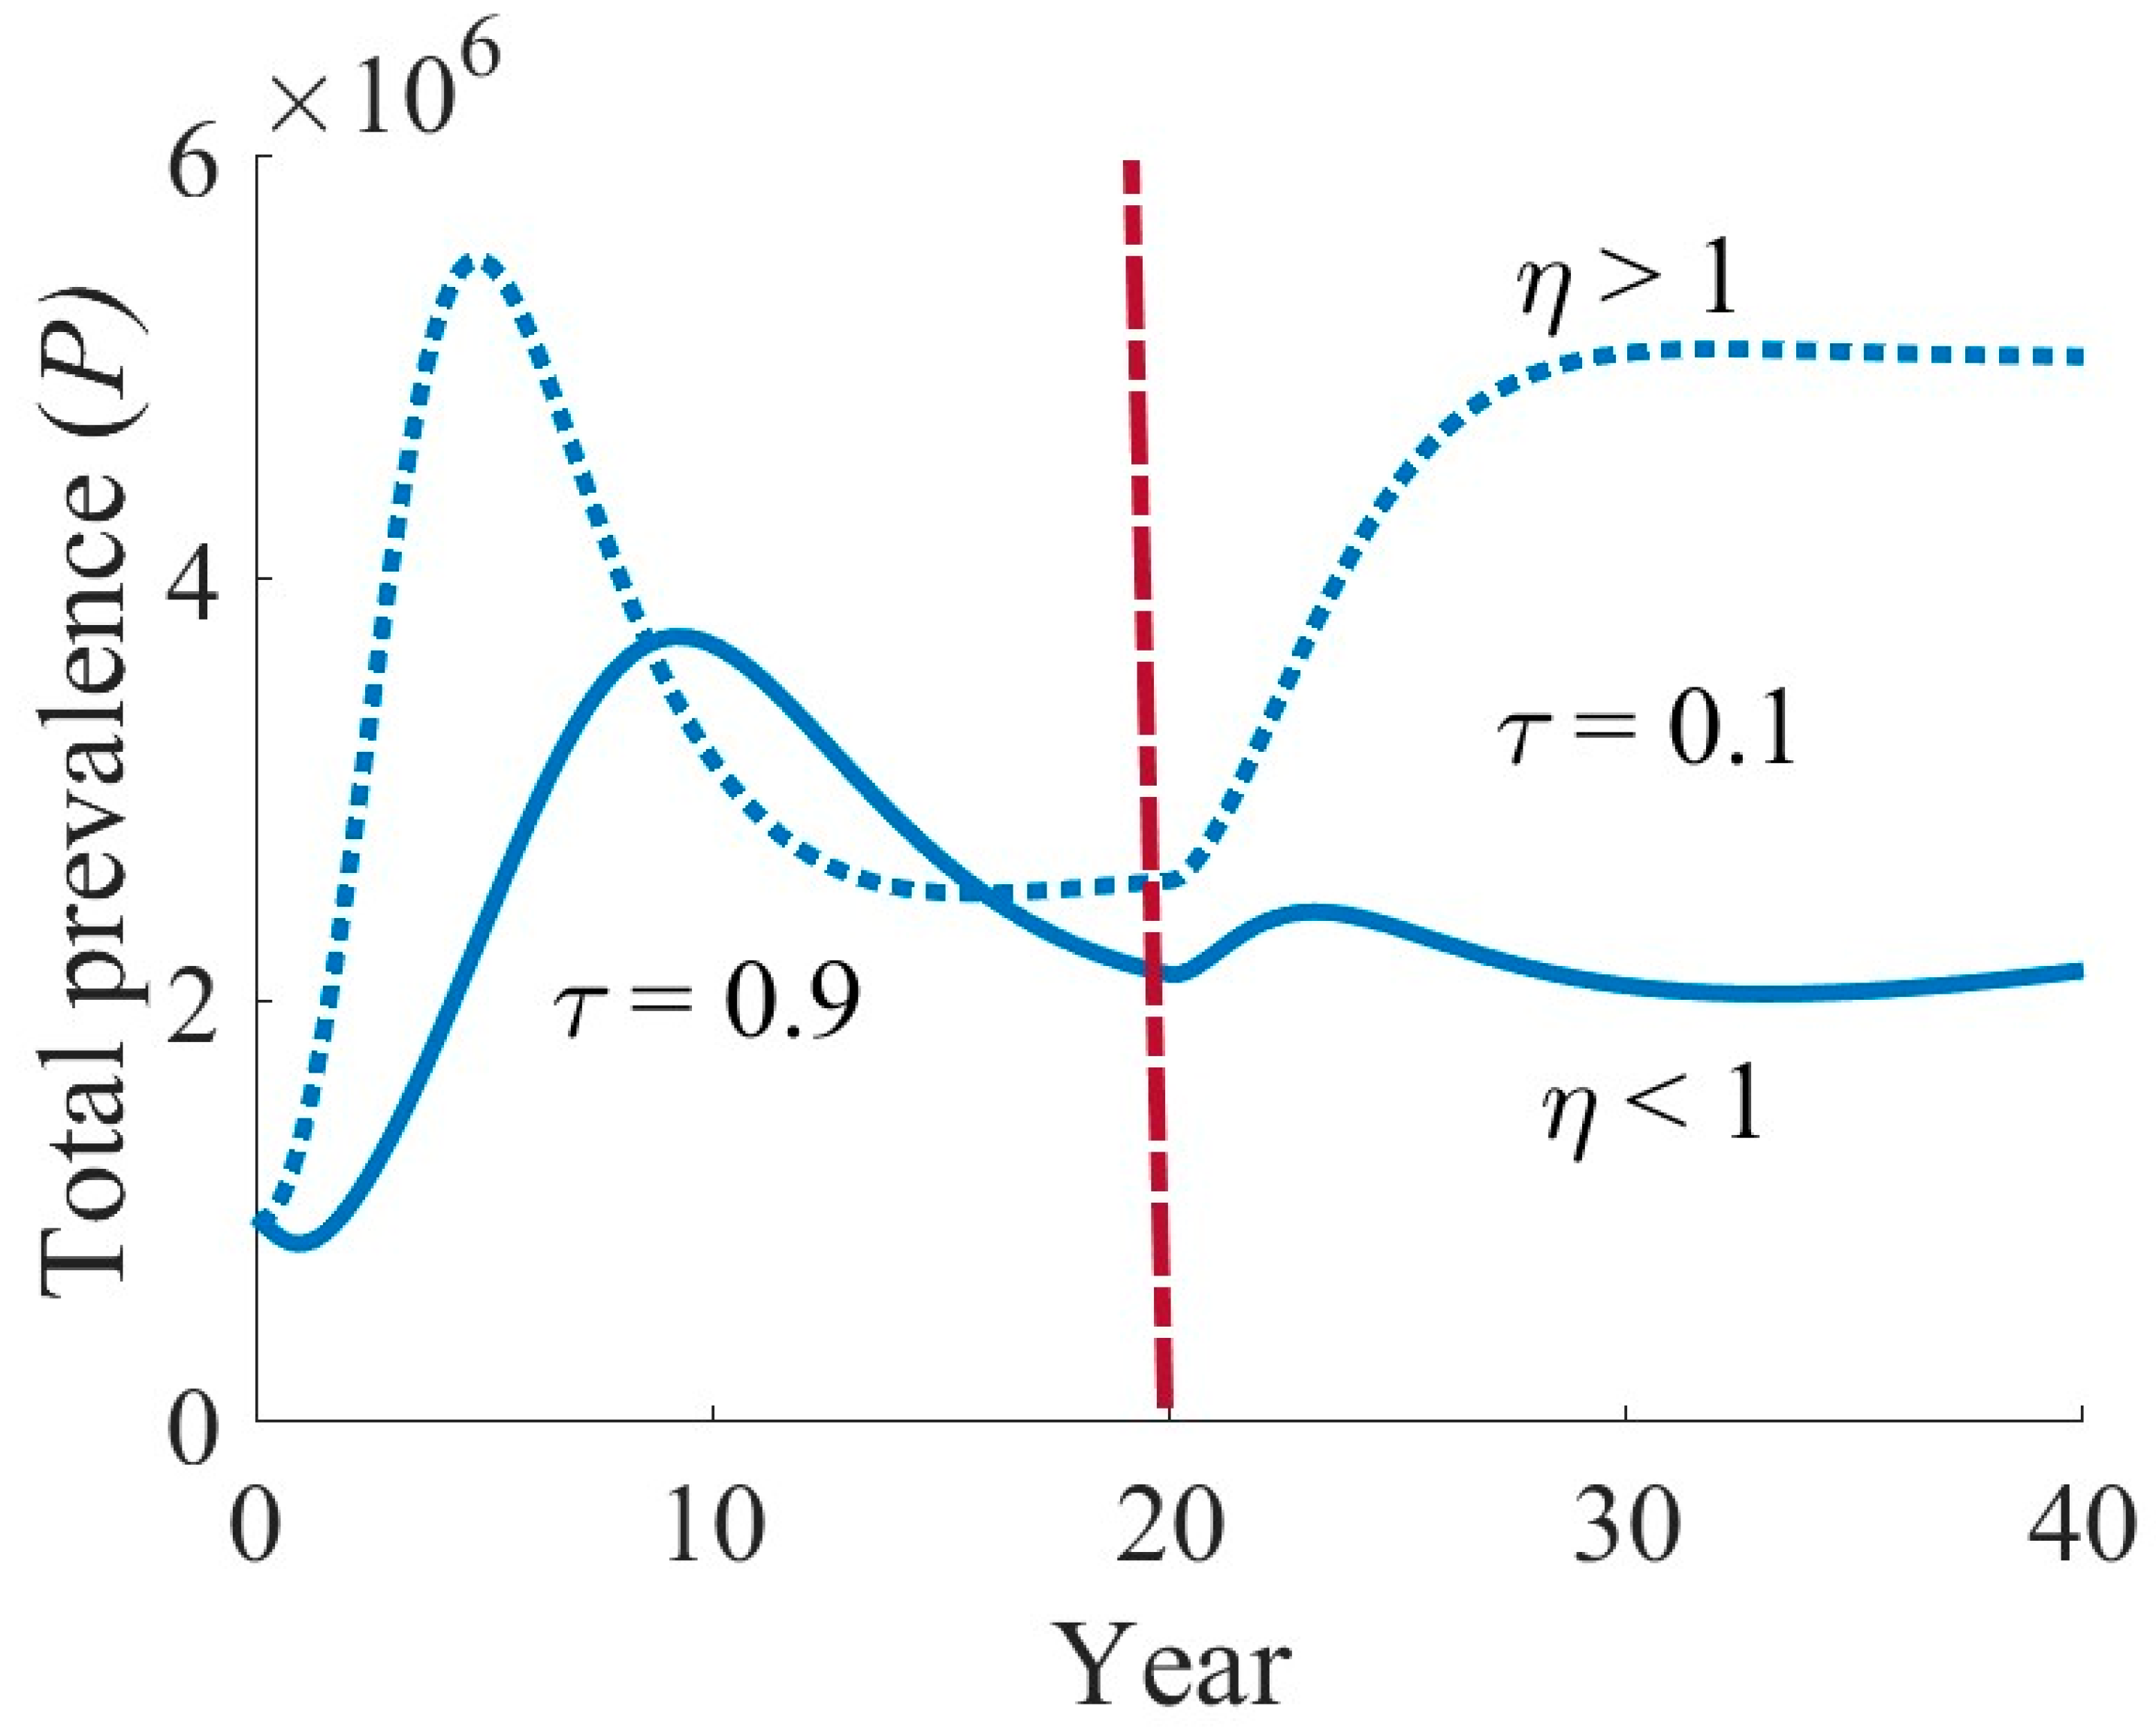
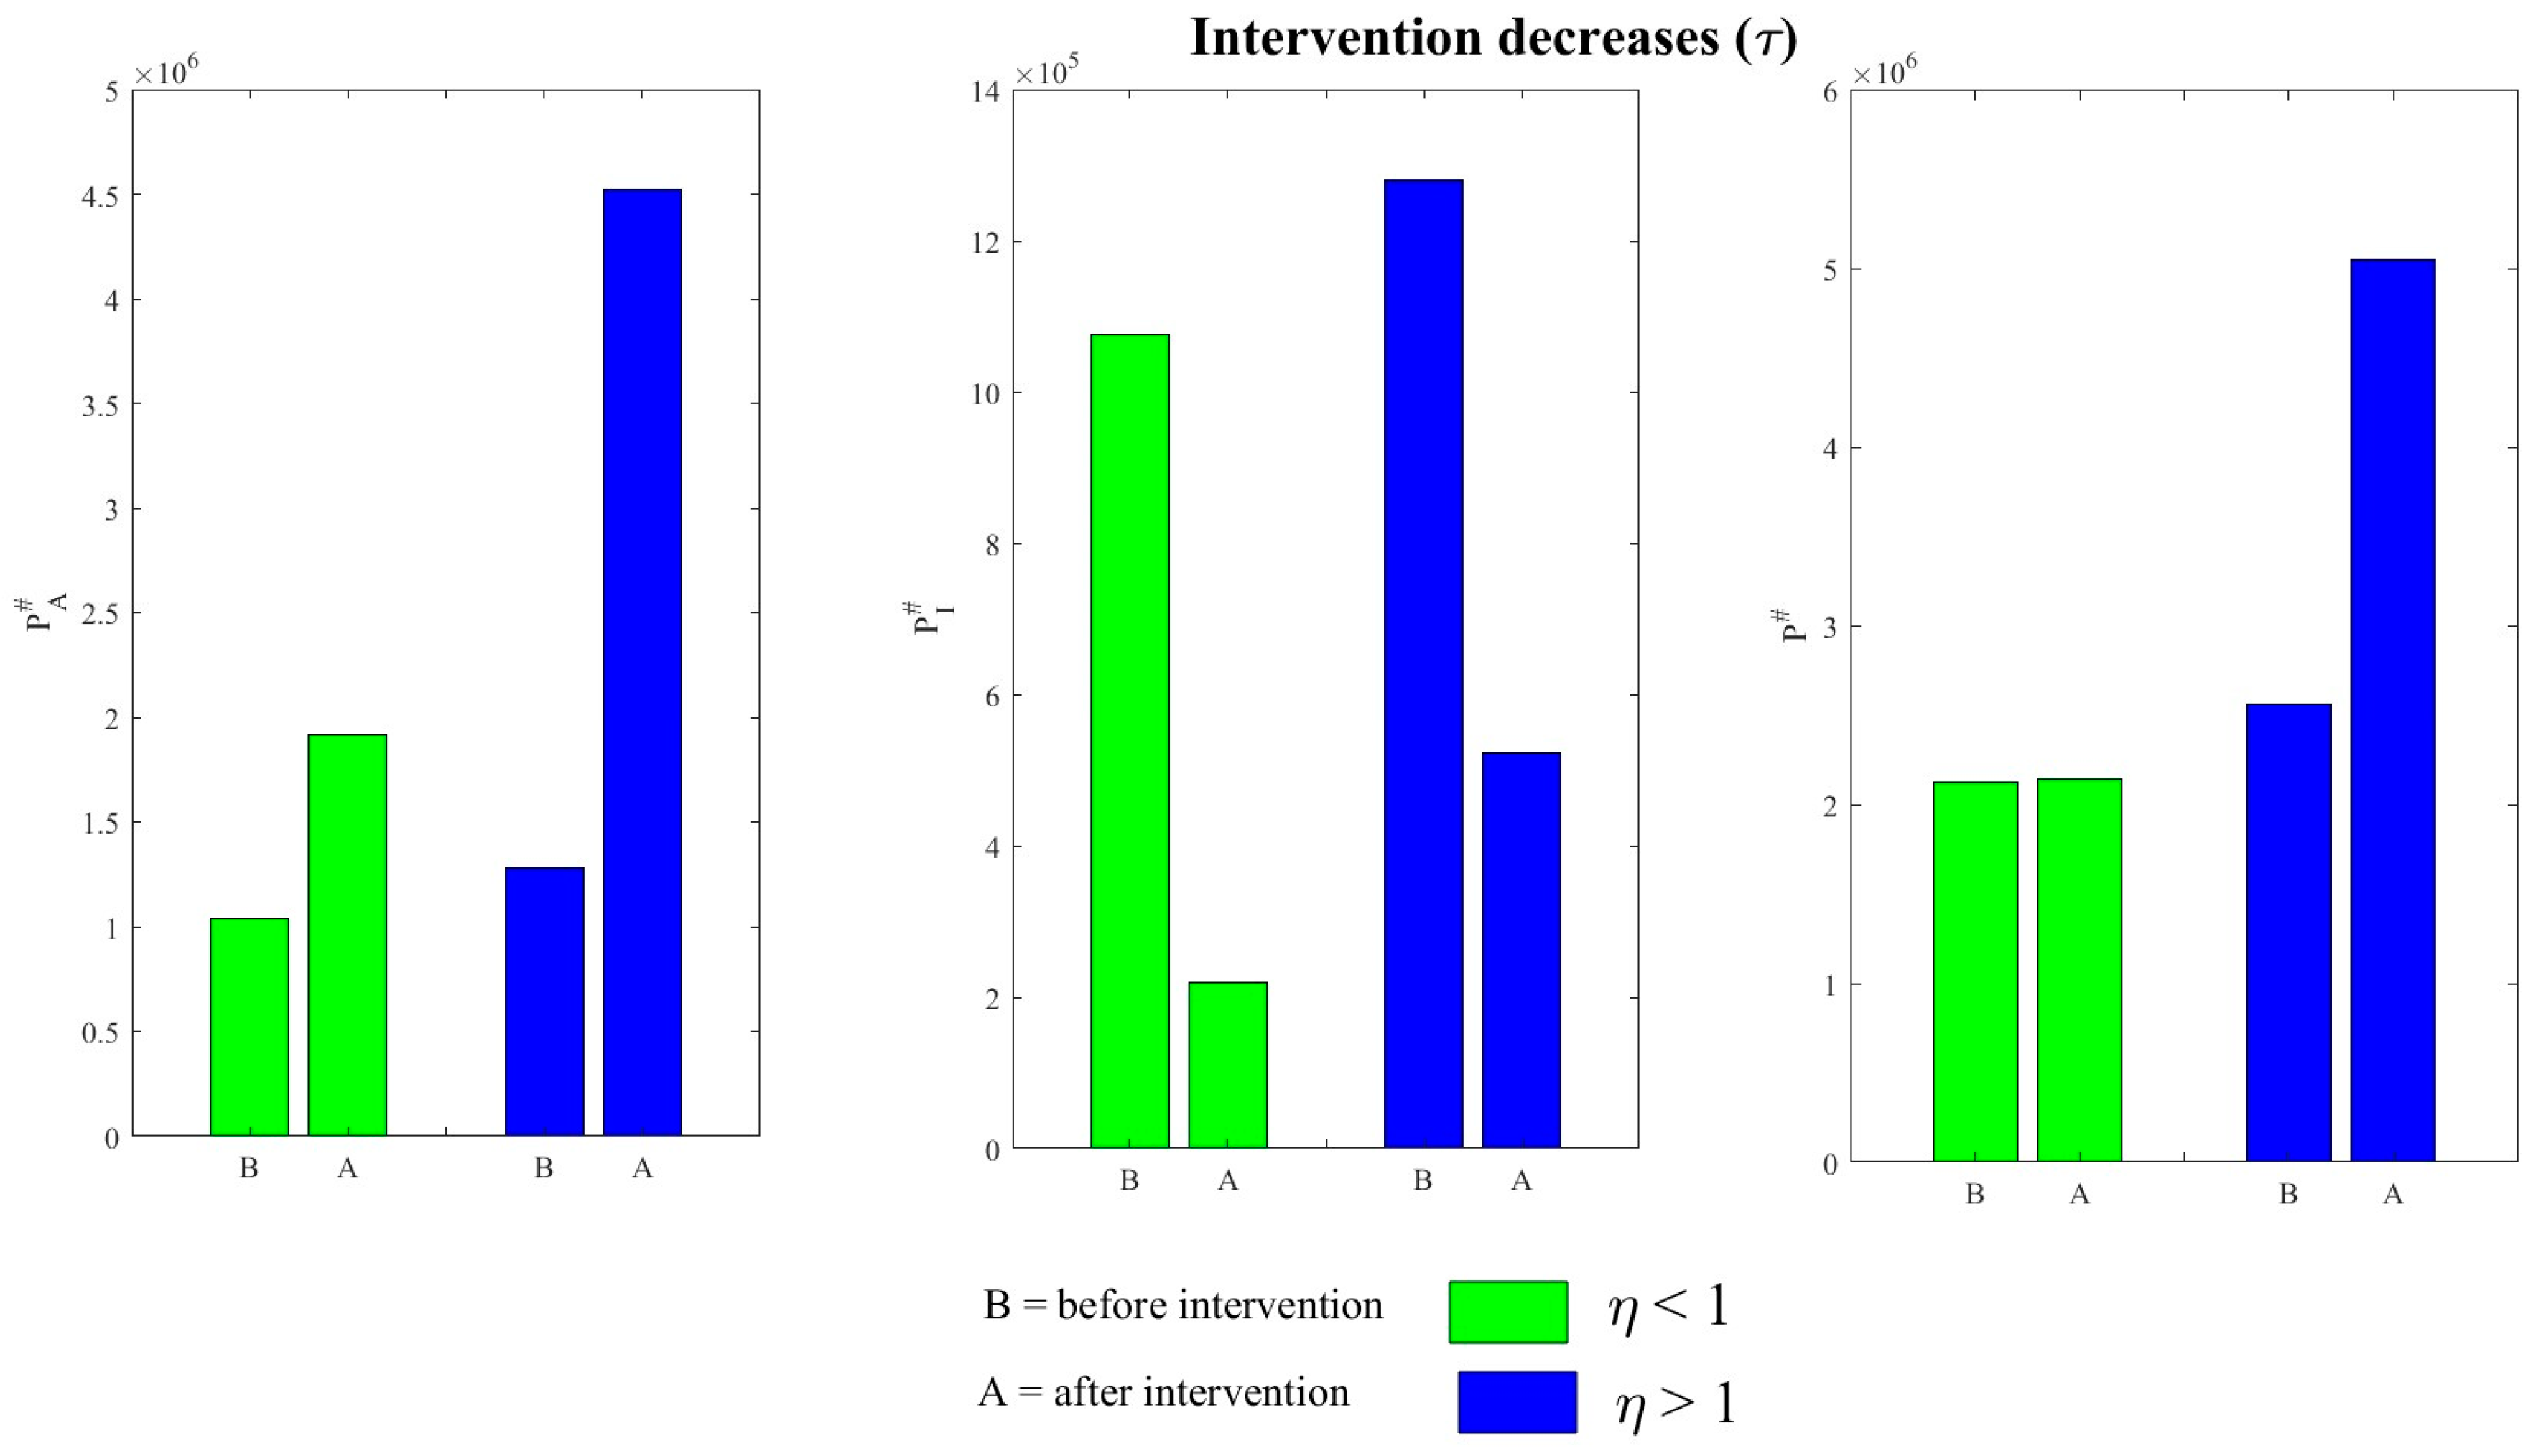
Figure 7 and Figure 8 illustrate how η influences the progression from asymptomatic carriers to symptomatic infections. These figures depict the impact of η on both the prevalence of asymptomatic carriers and symptomatic infections as well as the overall incidence rates before and after the intervention. Here, it is shown that a drop in the progression rate (τ) leads to an increase in the pandemic incidence of asymptomatic TB carriers η < 1 or η > 1 . The endemic prevalence of TB infections that cause symptom decline, either η < 1 or η > 1. However, the total endemic prevalence of TB remains constant when η < 1 but rises when η > 1 if we decrease the progression rate ( τ ) . This could indicate that the dispersion of the progression rate to symptomatic infections ( τ ) reduces the prevalence of symptomatic TB infections in Thailand but increases the asymptomatic and total TB prevalence due to the relative infectious of carriers ( η > 1 ) greater than 1. Therefore, it is noteworthy that efficacious measures for the relative infectious carriers ( η > 1 ) in addition to other preventative measures reduce the frequency of asymptomatic carriers, symptomatic infections, and the total prevalence of TB in Thailand.
Figure 9 and Figure 10 represent the impact of the treatment rate ( κ ) for symptomatic TB infections when the relative carrier ( η ) is less than or greater than 1. In Figure 9, we show the overall prevalence of TB as a function of the intervention rate (κ) for infections with symptoms and η. At this point, as we can see that there is a proportionate relationship between κ and η and the overall TB prevalence, with the latter increasing as κ decreases. From Figure 10, it can be stated that when η < 1 and η > 1 before decreasing treatment for symptomatic TB infections, the prevalence of severe TB infection, undetected TB carriers, and overall TB prevalence are still low even when the treatment rate is decreased, and this amount considerably rises. Therefore, increasing the treatment rate for symptomatic TB infections not only reduces the widespread occurrence of symptomatic TB infections but also decreases the endemic frequency of asymptomatic TB carriers as well as total TB. The biological explanation of Figure 9 and Figure 10, limited the transmission of TB infections as the rate of therapy for symptomatic TB infections (κ) escalates properly.
Figure 11 and Figure 12 describe how η affects the rate of progression ( α ) corresponding to the endemic frequency of TB carriers without symptoms ( P A # ) , symptoms of TB infection ( P I # ) and overall TB prevalence ( P # ) preceding and following this intervention. Here, we find that the endemic incidence of TB carriers with no symptoms falls when η < 1 but rises when η > 1 when we enhance the disease development rate (α). The endemic prevalence of TB symptomatic infections decreases when η < 1 but increases when η > 1 . The total endemic prevalence of TB reduces when η < 1 but rises when η > 1 . Therefore, it is very important to control the progression rate α and keep the values of relative carriers ( η ) below 1. The suggested approach can offer valuable insights to decisionmakers regarding treating TB carriers who do not exhibit symptoms, treating TB infections that do, managing epidemics of overall TB prevalence, and the planned implementation of treatment guidelines. Overall, our analysis shows that the impact of the intervention on a TB, the fundamental number of reproduction R 0 , and the endemic frequency of symptomatic infections with TB ( P I # ) are mostly determined by the relative infectiousness of carriers (η) considering the overall prevalence of infectious illnesses ( P # ), when steps are implemented to change how frequently asymptomatic TB carriers occur concerning one another (i.e., change τ ,   ω ,   κ , and α ).
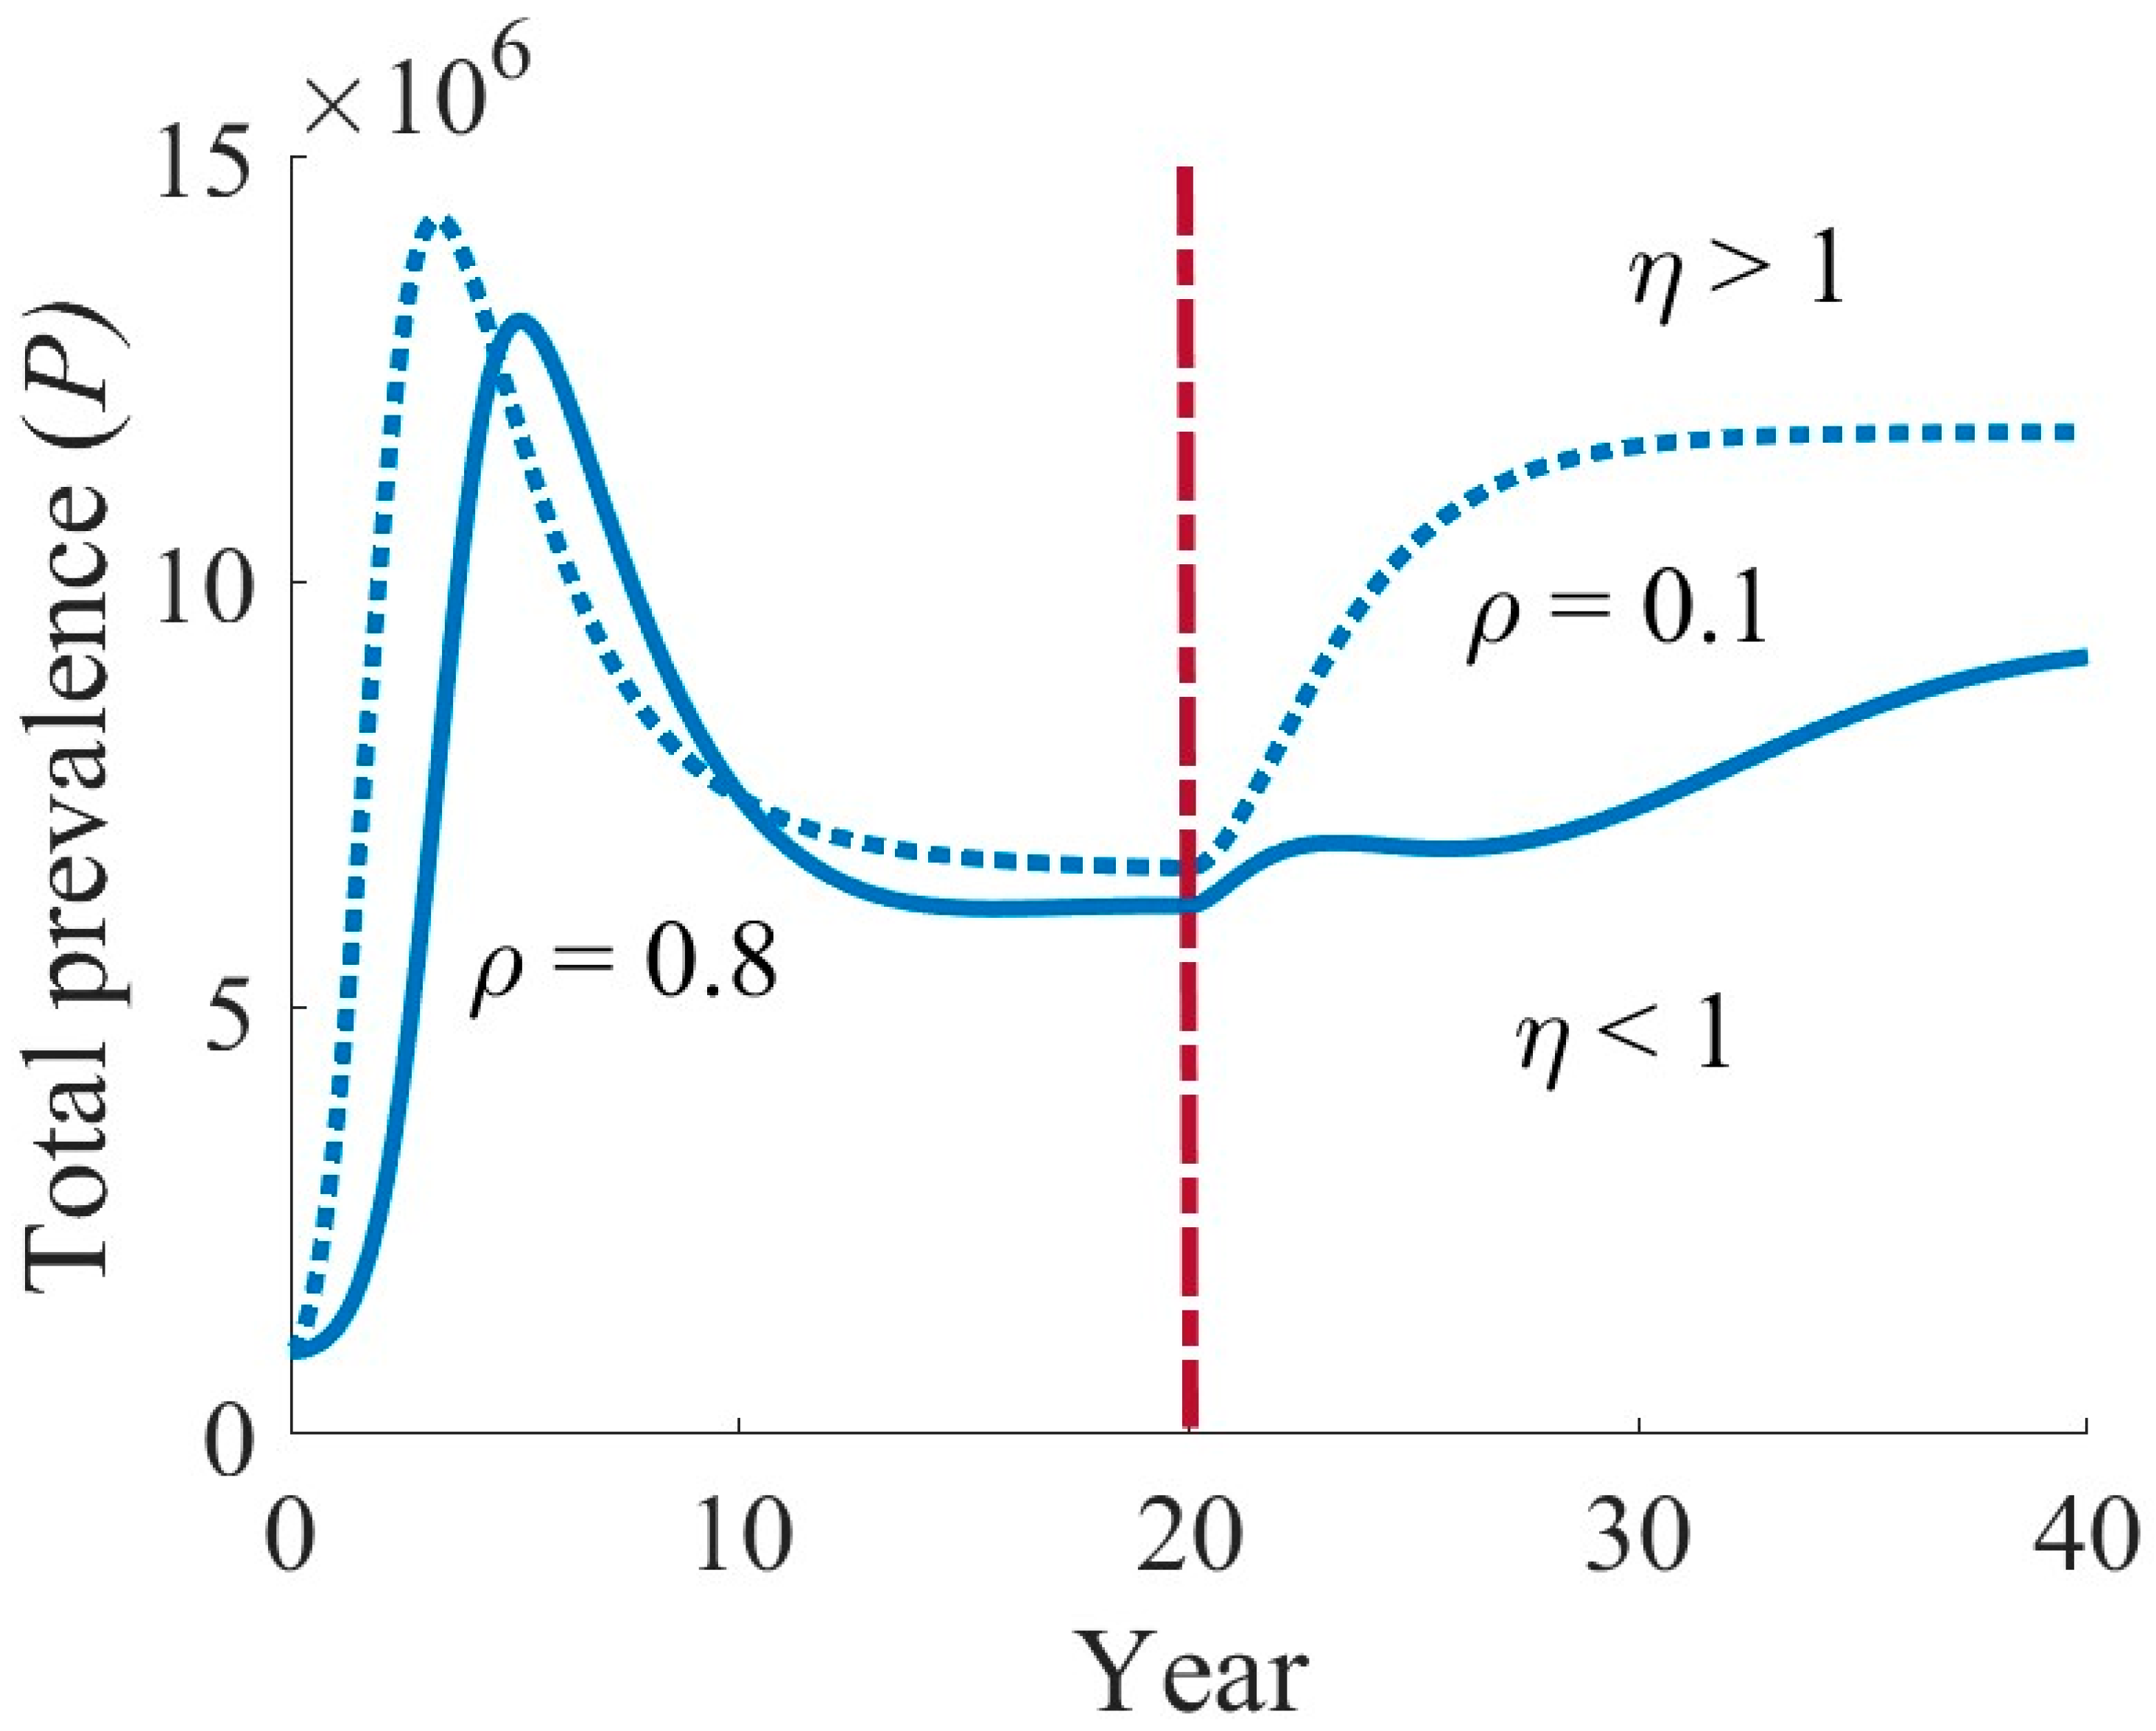
Figure 13 and Figure 14 represent the impact of the percentage of newly diagnosed cases with TB infection symptoms ( ρ ) when the relative carrier ( η ) is less than or greater than 1. In Figure 13, because the percentage of newly diagnosed patients that exhibit symptoms of TB ( ρ ) and η have an impact on the overall TB prevalence, we can show it. At this point, the overall TB prevalence increases with the decline in ρ , as can be seen from the proportional association between η and ρ . From Figure 14, it can be stated that when η < 1 , the percentage of new instances is symptomatic TB infection, the frequency of asymptomatic TB carriers, and the total TB prevalence remain low, but the prevalence of symptomatic infections is increasing. However, when the significance of carriers’ relative infections is greater than one ( i . e . ,   η > 1 ) and the percentage of new TB infection symptoms is reduced, this result is considerably opposite. Therefore, reducing new cases of symptomatic TB infections not only reduces symptomatic TB cases but also increases the prevalence of asymptomatic TB carriers and the total TB prevalence when relative infections of carriers are greater than one. Hence, policymakers should be more careful when implementing this strategy.

5. Discussion and Conclusions

TB is currently the most prevalent transmissible illness that kills people worldwide, and asymptomatic carriers are potential sources of TB transmission [2]. It is presently very difficult to organize public health campaigns because of a lack of understanding of the incidence of carriers who do not exhibit symptoms. The estimation of both silent and symptomatic levels is essential for the surveillance of TB, and inadequate data on the rate of transmission could lead to inefficient measures to address common public health problems.
The characteristics of bearers who do not exhibit symptoms have three important implications for understanding and treating TB. First, the fact that incidence data for TB often only include symptomatic cases of infection may make it difficult to estimate the true percentage of silent TB carriage [40]. Second, the lack of clear direct evidence of carriers with no symptoms complicates the comprehension of epidemiological reports and casts doubt on the specifics of the carrier state [41]. In conclusion, the existence of carriers who show no symptoms endangers control tactics that depend on identifying infected individuals, including border surveillance, or treating and/or isolating infectious patients [42]. Asymptomatic carriers may also reduce the efficacy of interventions, such as immunization and targeting susceptible persons, as it may be difficult to distinguish vulnerable individuals from asymptomatic carriers [36].
Mathematical modelling is a useful tool to clarify some of the nuances of carriage without symptoms and how they relate to TB control [43,44]. The significance of including carriers with no symptoms in epidemiological models was further demonstrated via modelling. For instance, it has been demonstrated that, in some circumstances, ignoring pre-symptomatic influenza transmission might lead to an overestimation of the effectiveness of treatments aimed at symptomatic hosts [43]. Carriage is, therefore, not sufficiently captured in computational models, which may lead to a loss of chances to reduce disease and an increased likelihood that the viability of an intervention would be evaluated incorrectly.
In this study, we developed a mathematical model of the infectious circumstances of TB that includes a broad spectrum of infection stages that remain undiagnosed and asymptomatic. Here, we extend this idea to investigate how undetected illnesses might influence the course of a community’s sickness, even in the absence of clinically visible TB cases, and the kind of resistance they can produce. Previous research has examined the significance of latent diseases when active clinical signs co-occur during a communicable disease outbreak. Our first findings indicate that hidden TB-related illnesses have the potential to drastically change the disease landscape for subsequent epidemics and have a substantial impact on the spread of asymptomatic TB carriers, symptomatic TB infections, and total TB prevalence. These results have little impact on the importance of identifying and distinguishing clinical instances from other people throughout the course of a TB outbreak. However, because mycobacterial transmission can occur during the asymptomatic stages of TB, there are clinical circumstances that do not seem to have distinguishable clinical cases from their progenitors.
Our study showed that some TB strategies that were thought to be effective in reducing transmission may have the opposite impact, or that an intervention’s effectiveness might be overestimated, making it seem unfeasible in certain scenarios. Accurate examinations of a parameter that we understand as the proportion of infectious carriers in a host that exhibits symptoms, η, may result in erroneous evaluations of several actions intended to change the typical rate at which infected people experience TB infection symptoms. For example, if η < 1, the goal of TB treatment is to lower the incidence of symptomatic TB infections to reduce the prevalence and transmission of the illness. However, if η is underestimated to a sufficient extent, then, as shown in Figure 9 and Figure 10, this intervention may increase the prevalence of asymptomatic TB carriers, symptomatic TB infections, and total TB prevalence.
Furthermore, we included the assumption in our model that recovery is permitted from asymptomatic TB carriers through natural recovery and from symptomatic TB infections through natural causes and treatment. A reduction in the number of symptomatic infections is usually expected to result in a decrease in the spread of TB. However, this intervention may have a reverse impact and promote TB transmission if recovery from both infection stages is feasible (Figure 7 and Figure 8).
In TB control, defaulter rates and multidrug-resistant TB (MDR-TB) cases are considered more critical than the rate of asymptomatic carriers due to their significant impact on treatment success, disease management, and transmission dynamics. The defaulter rate measures the proportion of TB patients who start treatment but do not complete it, which is a main challenge in TB control. Defaulters are at risk of relapse and may spread TB, including drug-resistant strains, to others. High defaulter rates lead to rising TB transmission and make TB elimination efforts difficult because incomplete treatment progresses resistance to TB drugs, leading to MDR-TB. Priorities must be set to decrease defaulter rates and control MDR-TB in order to stop the spread of TB and stop the emergence of drug-resistant strains, which have serious consequences for public health.
Our findings emphasize the significance of precisely defining the connection between asymptomatic TB carriers and symptomatic TB infections by means of a purposeful procedure that includes the identification of the predominant TB transmission modes and execution of carriage studies to facilitate the accurate attribution of infectious states. Future research should focus on human migration across regional modifications, TB fundamental variants that alter the disease pattern of transportation, violence, and fatalities over time, or the unexpected establishment of an ongoing foothold in the community. Therefore, further research may be required to determine more pertinent and precise policy measures to use in the effort to eradicate TB from the population in Thailand.

Author Contributions

Conceptualization, M.A.K., S.K.T., and T.T.; data curation, M.A.K. and S.K.T.; formal analysis, M.A.K. and T.T.; investigation, M.A.K., S.K.T., and T.T.; methodology, M.A.K., S.K.T., and T.T.; project administration, T.T.; resources, M.A.K. and T.T.; software, M.A.K.; supervision, T.T.; visualization, M.A.K., S.K.T., and T.T.; writing—original draft, M.A.K.; writing—reviewing and editing, M.A.K., S.K.T., and T.T.; funding acquisition, T.T. All authors have read and agreed to the published version of the manuscript.

Funding

This research project was financially supported by Mahasarakham University. Grant No: 6802036.

Data Availability Statement

Data are contained within the article.

Conflicts of Interest

The authors declare no conflicts of interest.

References

  1. Floyd, K.; Raviglione, M.C.; Glaziou, P. Global epidemiology of tuberculosis. Semin. Respir. Crit. Care Med. 2018, 39, 271–285. [Google Scholar] [CrossRef] [PubMed]
  2. World Health Organization. Global Tuberculosis Report; WHO: Geneva, Switzerland, 2020. [Google Scholar]
  3. Antonucci, G.; Girardi, E.; Raviglione, M.C.; Ippolito, G. Risk factors for tuberculosis in HIV-infected persons. A prospective cohort studies. The Gruppo Italiano di Studio Tubercolosi e AIDS (GISTA). JAMA 1995, 274, 143–148. [Google Scholar] [CrossRef] [PubMed]
  4. Cowie, R.L. The epidemiology of tuberculosis in gold miners with silicosis. Am. J. Respir. Crit. Care Med. 1994, 150, 1460–1462. [Google Scholar] [CrossRef]
  5. Rieder, H.L.; Cauthen, G.M.; Comstock, G.W.; Snider, D.E. Epidemiology of tuberculosis in the United States. Epidemiologic Rev. 1989, 11, 79–98. [Google Scholar] [CrossRef]
  6. Narasimhan, P.; Wood, J.; Macintyre, C.R.; Mathai, D. Risk factors for tuberculosis. Pulm. Med. 2013, 2013, 828939. [Google Scholar] [CrossRef]
  7. Lenaerts, A.; Barry, C.E.; Dartois, V. Heterogeneity in tuberculosis pathology, microenvironments and therapeutic responses. Immunol. Rev. 2015, 264, 288–307. [Google Scholar] [CrossRef]
  8. Drain, P.K.; Bajema, K.L.; Dowdy, D.; Dheda, K.; Naidoo, K.; Schumacher, S.G.; Ma, S.; Meermeier, E.; Lewinsohn, D.M.; Sherman, D.R. Incipient and Subclinical Tuberculosis: A Clinical Review of Early Stages and Progression of Infection. Clin. Microbiol. Rev. 2018, 31, e00021-18. [Google Scholar] [CrossRef]
  9. Bajema, K.L.; Bassett, I.V.; Coleman, S.M.; Ross, D.; Freedberg, K.A.; Wald, A.; Drain, P.K. Subclinical tuberculosis among adults with HIV: Clinical features and outcomes in a South African cohort. BMC Infect. Dis. 2019, 19, 14. [Google Scholar] [CrossRef]
  10. Kendall, E.A.; Shrestha, S.; Dowdy, D.W. The epidemiological importance of subclinical tuberculosis. A critical reappraisal. Am. J. Respir. Crit. Care Med. 2021, 203, 168–174. [Google Scholar] [CrossRef]
  11. Xu, Y.; Cancino-Muñoz, I.; Torres-Puente, M.; Villamayor, L.M.; Borrás, R.; Borrás-Máñez, M.; Bosque, M.; Camarena, J.J.; Colomer-Roig, E.; Colomina, J.; et al. High-resolution mapping of tuberculosis transmission: Whole genome sequencing and phylogenetic modelling of a cohort from Valencia Region, Spain. PLOS Med. 2019, 16, e1002961. [Google Scholar] [CrossRef]
  12. Global Tuberculosis Report 2019: World Health Organization. Available online: https://www.who.int/publications/i/item/global-tuberculosis-report-2019 (accessed on 3 June 2021).
  13. Pichanon, M.; Leilani, P.; Kamon, K.; Pirapon, J.O.; Gompol, S. Tuberculosis at a university hospital, Thailand: A surprising incidence of TB among a new generation of highly exposed health care workers who may be asymptomatic. PLoS ONE 2022, 17, e0273027. [Google Scholar]
  14. Joshi, R.; Reingold, A.L.; Menzies, D.; Pai, M. Tuberculosis among health-care workers in low- and middle-income countries: A sys-tematic review. PLoS Med. 2006, 3, e494. [Google Scholar] [CrossRef] [PubMed]
  15. Baussano, I.; Nunn, P.; Williams, B.; Pivetta, E.; Bugiani, M.; Scano, F. Tuberculosis among health care workers. Emerg. Infect. Dis. 2011, 17, 488–494. [Google Scholar] [CrossRef]
  16. Wang, L.; Zhang, H.; Ruan, Y.; Chin, D.P.; Xia, Y.; Cheng, S.; Chen, M.; Zhao, Y.; Jiang, S.; Du, X.; et al. Tuberculosis prevalence in China, 1990–2010; a longitudinal analysis of national survey data. Lancet 2014, 383, 2057–2064. [Google Scholar] [CrossRef]
  17. Blaser, N.; Zahnd, C.; Hermans, S.; Salazar-Vizcaya, L.; Estill, J.; Morrow, C.; Egger, M.; Keiser, O.; Wood, R. Tuberculosis in Cape Town: An age-structured transmission model. Epidemics 2016, 14, 54–61. [Google Scholar] [CrossRef]
  18. Bhunu, C.P.; Garira, W.; Mukandavire, Z.; Zimba, M. Tuberculosis transmission model with chemoprophylaxis and treatment. Bull. Math. Biol. 2008, 70, 1163–1191. [Google Scholar] [CrossRef]
  19. Songkram, S. Samakhom Prab Wannarok Hang Prathetthai Nai Phra Borom Rachupatham [The Anti-Tuberculosis Association of Thailand Under the Royal Patronage of His Majesty the King], 5th ed.; Banyat, P., Chaivej, N., Songkram, S., Eds.; Wannarok. Anti-Tuberculosis Association of Thailand: Bangkok, Thailand, 2003; pp. 26–30. [Google Scholar]
  20. World Health Organization. TB: A Global Emergency; World Health Organization: Geneva, Switzerland, 1994. [Google Scholar]
  21. Inchai, J.; Liwsrisakun, C.; Bumroongkit, C.; Euathrongchit, J.; Tajarernmuang, P.; Pothirat, C. Tuberculosis among Healthcare Workers at Chiang Mai University Hospital, Thailand: Clinical and Microbiological Characteristics and Treatment Outcomes. Jpn. J. Infect. Dis. 2018, 71, 214–219. [Google Scholar] [CrossRef]
  22. Jiamjarasrangsi, W.; Hirunsuthikul, N.; Kamolratanakul, P. Tuberculosis among health care workers at King Chulalongkorn Memorial Hospital, 1988–2002. Int. J. Tuberc Lung Dis. 2005, 9, 1253–1258. [Google Scholar]
  23. Pongwittayapanu, P.; Anothaisintawee, T.; Malathum, K.; Wongrathanandha, C. Incidence of Newly Diagnosed Tuberculosis among Healthcare Workers in a Teaching Hospital, Thailand. Ann. Glob. Health 2018, 84, 342–347. [Google Scholar] [CrossRef]
  24. Department of Disease Control. Panyutthasat Wannarok Radabchat Por. Sor. 2560–2564 [National Strategic Plan on Tuberculosis B.E. 2560–2564]; Department of Disease Control, Ministry of Public Health: Bangkok, Thailand, 2017. [Google Scholar]
  25. Blower, S.M.; Small, P.M.; Hopewell, P.C. Control strategies for tuberculosis epidemics: New models for old problems. Science 1996, 273, 497–500. [Google Scholar] [CrossRef]
  26. Fatmawati; Tasman, H. An optimal treatment control of TB-HIV coinfection. Int. J. Math. Math. Sci. 2016, 2016, 8261208. [Google Scholar] [CrossRef]
  27. Hickson, R.I.; Mercer, G.N.; Lokuge, K.M. A metapopulation model of tuberculosis transmission with a case study from high to low burden areas. PLoS ONE 2012, 7, e34411. [Google Scholar] [CrossRef]
  28. Houben, R.M.G.J.; Sumner, T.; Grant, A.D.; White, R.G. Ability of preventive therapy to cure latent Mycobacterium tuberculosis infection in HIV-infected individuals in high-burden settings. Proc. Natl. Acad. Sci. USA 2014, 111, 5325–5330. [Google Scholar] [CrossRef]
  29. Kaplan, R.; Caldwell, J.; Middelkoop, K.; Bekker, L.G.; Wood, R. Impact of ART on TB case fatality stratified by CD4 count for HIV-positive TB patients in Cape Town, South Africa (2009–2011). JAIDS J. Acquir. Immune Defic. Syndr. 2014, 66, 487–494. [Google Scholar] [CrossRef]
  30. Purwati, U.D.; Riyudha, F.; Tasman, H. Optimal control of a discrete age-structured model for tuberculosis transmission. Heliyon 2020, 6, e03030. [Google Scholar] [CrossRef]
  31. Childs, L.M.; Abuelezam, N.N.; Dye, C.; Gupta, S.; Murray, M.B.; Williams, B.G.; Buckee, C.O. Modelling challenges in context: Lessons from malaria, HIV, and tuberculosis. Epidemics 2015, 10, 102–107. [Google Scholar] [CrossRef]
  32. Diekmann, O.; Heesterbeek, J.A.P.; Roberts, M.G. The construction of next-generation matrices for compartmental epidemic models. J. R. Soc. Interface 2009, 7, 873–885. [Google Scholar] [CrossRef]
  33. van den Driessche, P. Reproduction numbers of infectious disease models. Infect. Dis. Model. 2017, 2, 288–303. [Google Scholar] [CrossRef]
  34. Shuai, Z.; van den Driessche, P. Global Stability of Infectious Disease Models Using Lyapunov Functions. SIAM J. Appl. Math. 2013, 73, 1513–1532. [Google Scholar] [CrossRef]
  35. Data Commons. Place Explorer Thailand. Available online: https://datacommons.org/place/country/THA/?utm_medium=explore&mprop=lifeExpectancy&popt=Person&hl=en (accessed on 23 December 2023).
  36. Chisholm, R.H.; Campbell, P.T.; Wu, Y.; Tong, S.Y.C.; McVernon, J.; Geard, N. Implications of asymptomatic carriers for infectious disease transmission and control. R. Soc. Open Sci. 2018, 5, 172341. [Google Scholar] [CrossRef]
  37. Shaweno, D.; Trauer, J.M.; Denholm, J.T.; McBryde, E.S. The role of geospatial hotspots in the spatial spread of tuberculosis in rural Ethiopia: A mathematical model. R. Soc. Open Sci. 2018, 5, 180887. [Google Scholar] [CrossRef] [PubMed]
  38. Kuddus, A.; Meehan, M.T.; White, L.J.; McBryde, E.S.; Adekunle, A.I. Modeling drug-resistant tuberculosis amplification rates and intervention strategies in Bangladesh. PLoS ONE 2020, 15, e0236112. [Google Scholar] [CrossRef] [PubMed]
  39. World Health Organization. Global Tuberculosis Programme. Available online: https://www.who.int/teams/global-tuberculosis-programme/tb-reports (accessed on 10 June 2023).
  40. Furuya-Kanamori, L.; Cox, M.; Milinovich, G.J.; Magalhaes, R.J.S.; Mackay, I.M.; Yakob, L. Heterogeneous and dynamic prevalence of asymptomatic influenza virus infections. Emerg. Infect. Dis. 2016, 22, 1052–1056. [Google Scholar] [CrossRef] [PubMed]
  41. DeMuri, G.P.; Wald, E.R. The group A streptococcal carrier state reviewed: Still an enigma. J. Pediatr. Infect. Dis. Soc. 2014, 3, 336–342. [Google Scholar] [CrossRef] [PubMed]
  42. Gerding, D.N.; Muto, C.A.; Owens, R.C., Jr. Measures to control and prevent Clostridium difficile infection. Clin. Infect. Dis. 2008, 46, S43–S49. [Google Scholar] [CrossRef]
  43. Robinson, M.; Stilianakis, N.I. A model for the emergence of drug resistance in the presence of asymptomatic infections. Math. Biosci. 2013, 243, 163–177. [Google Scholar] [CrossRef]
  44. Wang, X.; Panchanathan, S.; Chowell, G. A Data-driven mathematical model of ca-mrsa transmission among age groups: Evaluating the effect of control interventions. PLoS Comput. Biol. 2013, 9, e1003328. [Google Scholar] [CrossRef]
Figure 1. Diagram of TB model with asymptomatic compartment.
Symmetry 16 01538 g001
Figure 2. The impact of the relative infectiousness of carriers ( η ) and rate of infection propagation leading to symptoms (τ) based on the basic reproductive number ( R 0 ).
Symmetry 16 01538 g002
Figure 3. The impact of the relative infectiousness of carriers ( η ) and rate of infection propagation leading to asymptomatic ( ω ) based on the basic reproductive number ( R 0 ). Table 1 provides parameter values.
Symmetry 16 01538 g003
Figure 4. The best fit of our proposed model (red solid curve) and the reported TB incidence data (blue dots) with the 95% confidence interval (CI) measured in the green-shaded limits.
Symmetry 16 01538 g004
Figure 5. The overall prevalence of TB, P (shown as a function of time t) for two distinct values of the proportional infectiousness of carriers η—greater than unity (dashed-dot blue bar) and lower than unity (solid blue line)—is estimated using a model that considers asymptomatic carriers. Time t = 20, represented by the dashed line, is the year in which the intervention was implemented. As seen in the example case, the intervention increases the progression rate to silent carriage ω from 0.1 to 0.9. The parameter values are presented in Table 1.
Symmetry 16 01538 g005
Figure 6. The chronic frequency of infections with symptoms P I # , asymptomatic TB holders P A # , and the total pandemic prevalence P # are shown before (B) and after (A), an intervention ω increases when η < 1 (green bar) and when η > 1 (blue bar). The parameter values are provided in Table 1.
Symmetry 16 01538 g006
Figure 7. At the time (year) t = 20, as shown by the dashed maroon line, the overall incidence of TB (P), derived from the model that takes into account carriers who do not exhibit symptoms, is shown as an expression of time t for two distinct values of the correlated infectiousness of carriers (η): greater than unity (solid blue line), and less than unity (dashed-dot blue line). The progress rate τ in this case is decreased by the intervention from 0.90 to 0.1. The parameter values are presented in Table 1.
Symmetry 16 01538 g007
Figure 8. The chronic frequency of infections of symptoms P I # , of asymptomatic TB holders P A # , and the total pandemic prevalence P # are shown before (B) and after (A), an intervention τ decreases when η < 1 (green bar) and when η > 1 (blue bar). The parameter values are provided in Table 1.
Symmetry 16 01538 g008
Figure 9. The overall prevalence of TB P, which was determined using the model incorporating carriers with no symptoms, is displayed as an expression of duration t for two distinct values of the correlated infectious of containers η: exceeding unity (dashed-dot navy line) and below unity (solid navy line) when a treatment is given at period t = 20, represented by the dashed maroon line. The symptomatic infection therapy rate for this instance is decreased from 0.95 to 0.1 by the intervention. The parameter values are shown in Table 1.
Symmetry 16 01538 g009
Figure 10. The chronic frequency of infections of symptoms P I # , of asymptomatic TB holders P A # , and the total pandemic prevalence P # are shown before (B) and after (A), an intervention κ , and decreases when η < 1 (green bar) and when η > 1 (blue bar). The parameter values are provided in Table 1.
Symmetry 16 01538 g010
Figure 11. The overall prevalence of TB P, which was determined using the model incorporating carriers with no symptoms, is displayed as an expression of duration t preceding and following treatment given for two distinct values of the correlated infectiousness of carriers η, larger than unity (dashed-dot navy line) and lower than unity (solid navy line), at time (year) t = 20 (shown by the dashed maroon line). In this case, the intervention causes the advancement rate (α) to rise from 0.3 to 0.9. Table 1 contains the parameter values.
Symmetry 16 01538 g011
Figure 12. The chronic frequency of infections of symptoms P I # , asymptomatic TB holders P A # , and the total pandemic prevalence P # are shown before (B) and after (A), an intervention α increases when η < 1 (green bar) and when η > 1 (blue bar). The parameter values are provided in Table 1.
Symmetry 16 01538 g012
Figure 13. The overall prevalence of TB P, which was determined using the model incorporating carriers with no symptoms, is displayed as an expression of duration t preceding and following treatment given for two distinct values of the correlated infectiousness of carriers η, larger than unity (dashed-dot navy line) and lower than unity (solid navy line), at time (year) t = 20 (shown by the smashed maroon line). In this case, the intervention causes the advancement rate ρ to rise from 0.8 to 0.1. Table 1 contains the parameter values.
Symmetry 16 01538 g013
Figure 14. The chronic frequency of infections of symptoms P I # , of asymptomatic TB holders P A # , and the total pandemic prevalence P # are shown before (B) and after (A), an intervention ρ decreases when η < 1 (green bar) and when η > 1 (blue bar). The parameter values are provided in Table 1.
Symmetry 16 01538 g014
Table 1. Model parameter values.
ParametersDescriptionValuesReferences
N Populations in Thailand, 202172,000,000[35]
μ Birth/mortality rate 1 79.27 [35]
β Transmission rate 2.19 × 10 7 Fitted
ω The pace of advancement toward the asymptomatic carriage0.1[36]
τ Rate of progression to symptomatic infection 0.06 [36]
ρ Percentage of newly reported cases with symptoms0.02[36]
α Rate of progression0.36Fitting
ψ The rate at which latency is recovered0.3[36]
δ 1 The rate at which asymptomatic carriage recovers0.2[37]
δ 2 The recovery rate from symptomatic infection0.205[37]
η Relative infectious of carriers compared to symptomatically infected hosts0.0018Fitted
κ Treatment rate of symptomatic infection0.60Fitted
γ Rate of loss of immunity0.1[38]
Disclaimer/Publisher’s Note: The statements, opinions and data contained in all publications are solely those of the individual author(s) and contributor(s) and not of MDPI and/or the editor(s). MDPI and/or the editor(s) disclaim responsibility for any injury to people or property resulting from any ideas, methods, instructions or products referred to in the content.