
Evaluation of Symmetrical Face Pressure of EPB


1
The Graduate School of Natural and Applied Sciences, Dokuz Eylul University, İzmir 35160, Turkey
2
Department of Mining Engineering, Engineering Faculty, Dokuz Eylul University, İzmir 35390, Turkey
*
Author to whom correspondence should be addressed.
Symmetry 2024, 16(4), 484; https://doi.org/10.3390/sym16040484
Submission received: 9 January 2024
/
Revised: 14 March 2024
/
Accepted: 15 March 2024
/
Published: 16 April 2024
(This article belongs to the Section Engineering and Materials)
Abstract
:The content of this study combines city safety, optimum excavation situation, mining, geology, and civil engineering principles. Tunnel boring machines (TBM) are the most commonly used machines in the excavation of urban tunnels. These machines prevent the inward movement of the tunnel face and control the amount of settlement formed on the ground by applying pressure to the tunnel face. The most important question here is to determine the amount of pressure to be applied to the tunnel face. There are many widely accepted formulas used in the calculation of the face pressure and these formulas generally attempt to limit the settlements on the ground by using parameters such as groundwater level, overburden thickness, physical and mechanical properties of the surrounding rocks, etc. In this study, a new formula was developed. This new formula calculates the face pressure required to be applied by EPB to the tunnel face in order to prevent damage to a structure located on the route and within the area to be affected by tunnel excavation, instead of only preventing settlements on the surface. In the formula, produced within the scope of this study, in addition to other studies, 3D distances of the structure to which the deformation limitation will be made to prevent damage is also one of the parameters.
1. Introduction
Population in cities will increase rapidly in the coming years, and even small cities will turn into metropolises [1]. The increasing population brings a requirement for more living space and therefore more energy, transportation, and infrastructure systems. This requirement has brought with it distinctive designs and applications, and the importance of tunnel systems in daily life has increased to a great extent. The structures needed in expanding cities require studies involving more than one engineering branch. Especially during subway excavations, it is very important to maintain city safety at the maximum level by ensuring optimum excavation performance. By keeping up with the advancing age and developing technology, tunnel constructions have advanced in many fields such as safety, construction, shortening of the commissioning time, and reduction in costs. Conventional methods used during tunnel construction have also left their place in rapidly developing mechanized excavation systems. Because, of all of the environmental problems, blast-induced vibrations often cause concern to surrounding residents [2]. On the other hand, rock masses remain under constant load due to the engineering structures in rocks [3]. In this way, systems that recognize the formations to be excavated have been developed and it has become easier to predetermine the loads and risks to be encountered and take precautions. The fact that conventional tunneling methods have a higher probability of damaging the structures and topography on the ground compared to mechanized excavations has increased the interest in these machines. Especially, mechanized excavations have started to be preferred in order to prevent the problems encountered in urban tunneling. The shield tunneling method featured a great improvement in safety, convenience, and construction speed, as well as minimal impacts on the surrounding environment in urban areas [4,5]. Key features such as high excavation capacity and safety have also increased the interest in mechanized excavation. On the other hand, the high initial investment cost and limited mobility are among the important disadvantages. There are three crucial factors affecting mechanized excavation; geological and geotechnical factors, operational (mechanical) factors, and environmental factors [6,7,8,9,10,11,12,13]. When a large diameter tunnel passes near some important existing buildings or residential sensitive infrastructure, special attention should be paid to the ground deformation caused by the shield tunnel, as the safety of the geological environment is of great importance and may cause potential damage to the building [14].
In soils below the groundwater level, it is very likely that face flows will occur in the excavation face during excavation. EPBs are designed to be used in such formations, that is, rocks and soils that cannot hold themselves even slightly during excavation. In these machines, it is aimed to control the water input or the flow in the formation during the excavation phase. Ref. [15] stated that the basic working principle of these machines is to keep the face cavity under pressure by making it a closed volume in order to control the water input or soil flow of the land. They defined it as “allowing the formation of a natural pressure in the cutting head and face cavity by the effect of water pressure in the field itself”. The critical point here is to balance the face pressure, to control the face material flow and water flow, and to prevent the formation of settlements on the surface. During tunneling in the delicate ground, different techniques were developed for the prediction of surface settlement [16].
At this stage, one of the first and most important questions that come to mind is how much pressure will be applied to the face in order to prevent any damage to the structures on the surface. The answer to this question has so many parameters that it is very complex, especially in difficult ground conditions. Within the scope of this study, an answer to this complexity was sought and as a result, a mathematical formula was developed.
2. Previous Studies
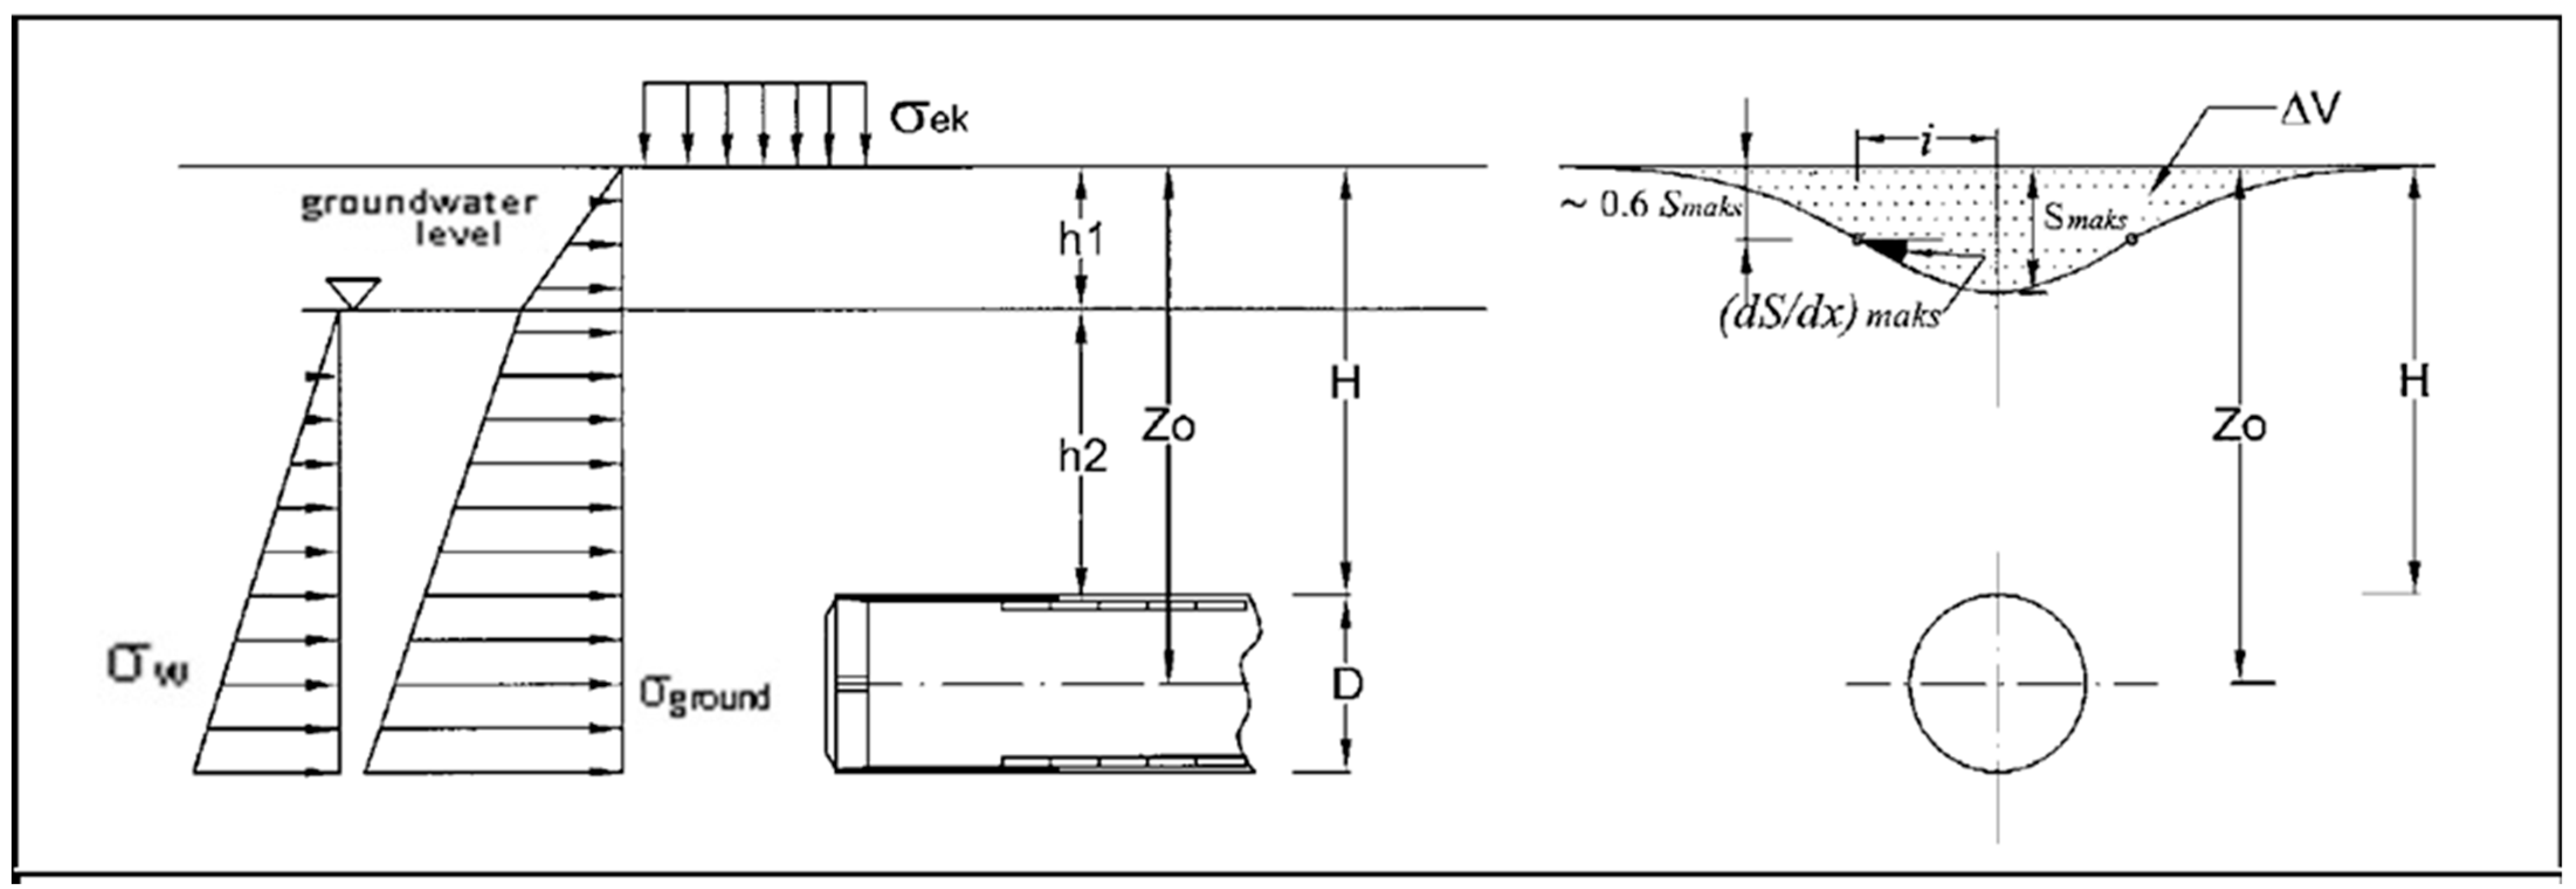
Although there are many approaches to this issue, some of the most common approaches in the literature are given in this article. As a result of the excavation process, depending on the rock properties of the excavated formation, flowing on the face and, accordingly, settlements occur on the surface. It was determined that the collapse curve (settlement) formed as a result of excavation should be below a certain value so that settlements do not cause any damage to the surrounding structures, and this value should be in the range of 1/500 m–1/250 m for light damage level [17]. The face pressure in the tunnel is the sum of the formation pressure, the groundwater pressure, and the additional (surcharge) loads caused by the traffic-building loads on the ground (Figure 1). This total pressure determines the pressure that the EPB machine will apply to the excavation face [18].
Another approach includes the “N” value, known as the face stability measure. The N value can be determined by using the given equation [19,20]:
: Surcharge from building and traffic loads
According to the values of N, face stability is distinguished as follows:
- 0 < N < 2—Low flowing elastic conditions;
- 2 < N < 4—Limited flowing;
- 4 < N < 6—Plastic flowing;
- N > 6—Serious stability problems on the face can be seen.
Several formulas used to calculate the face pressure that should be applied to the tunnel face during excavation are given below.
- Ground loss rate [21]
- Maximum settlement amount [22]
- The maximum slope of the settlement curve [18]
The given formula is obtained when the above-given relations are combined, and the necessary simplifications are made [18]:
In this formula:
- = Tunnel face pressure;
- = Surcharge from building and traffic loads;
- = Water pressure;
- = Depth of the groundwater level from the surface;
- = Average unit weight of soil;
- = Depth of tunnel axis;
- = Cohesion of the excavated formation;
- = Modulus of elasticity of the excavated formation;
- = Settlement value measured on the surface in the tunnel axis;
- = Distance of inflection point from tunnel axis;
- , = Coefficients depending on the formation and the applied technology.
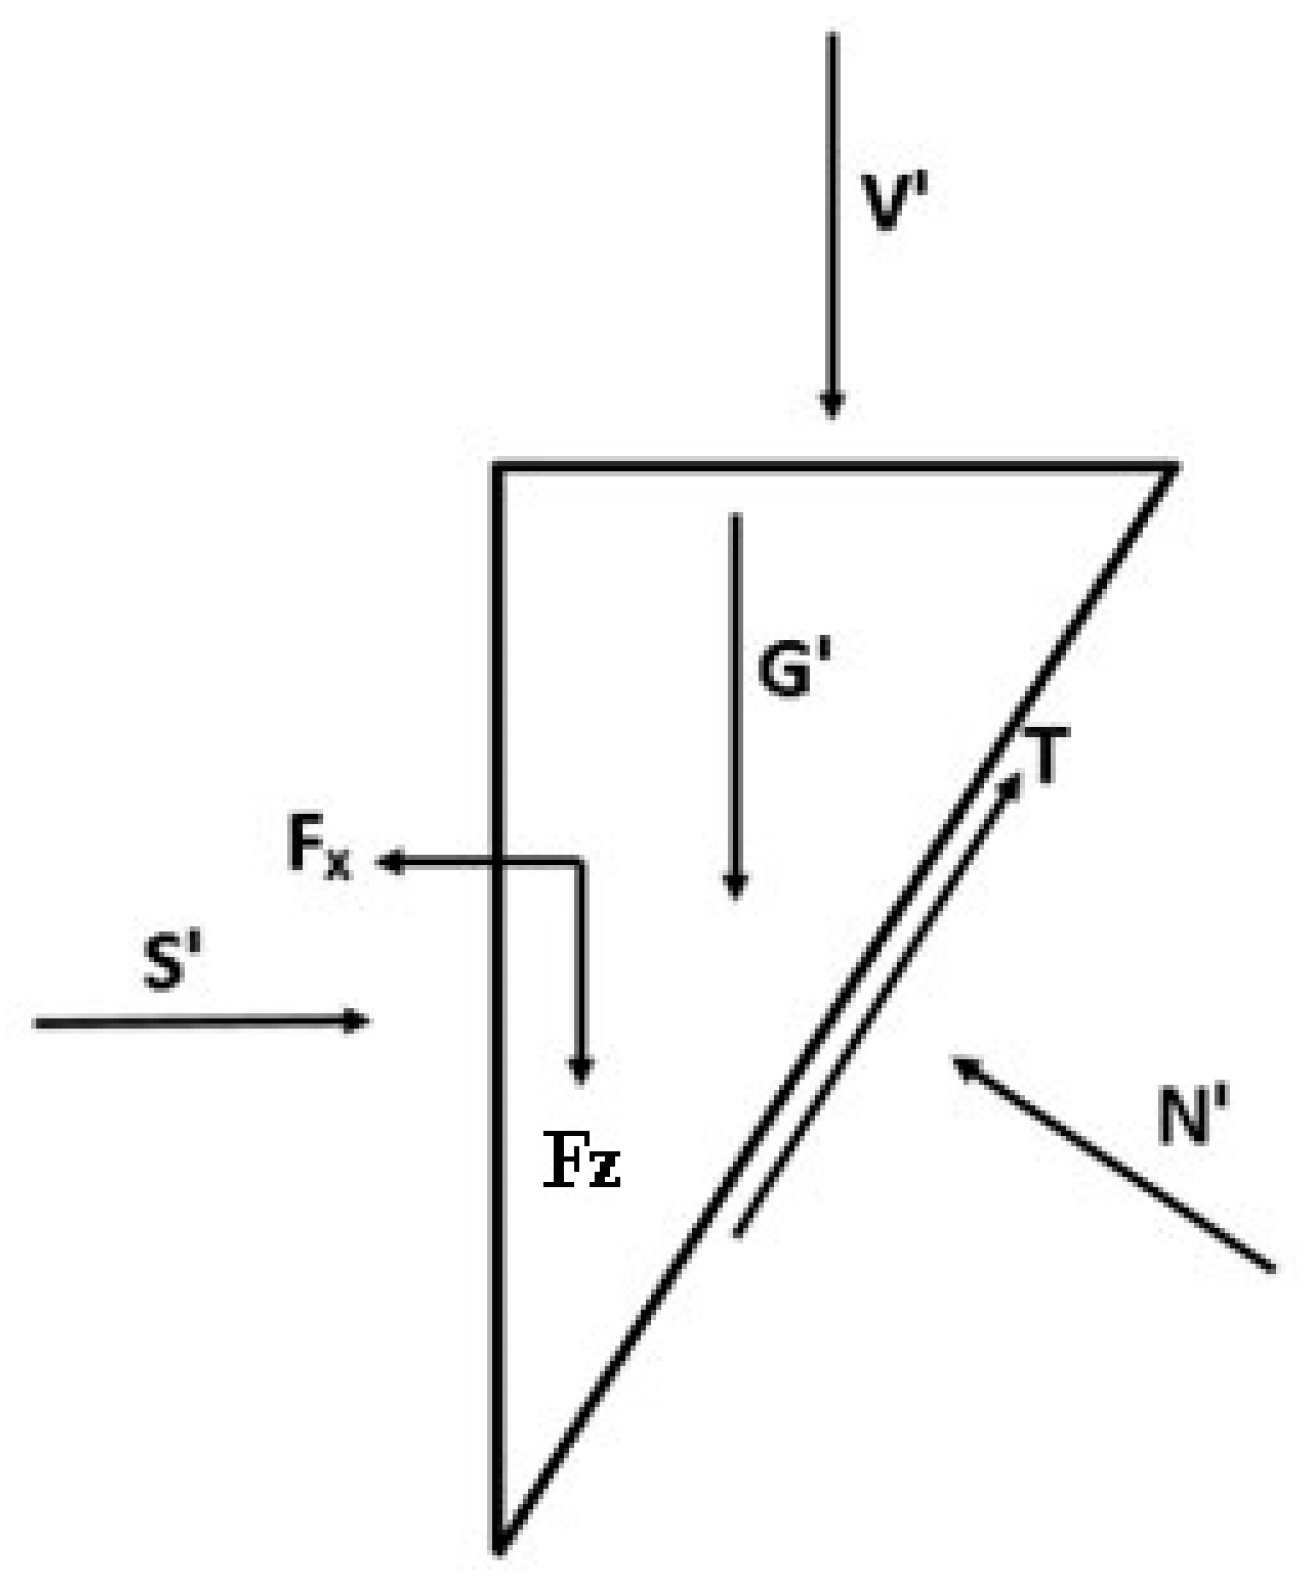
Face stability in homogeneous soil is evaluated by considering the boundary balance of a wedge-shaped mass loaded by the prismatic soil mass. The visual in Figure 2 shows this situation [24,25].
In this situation:
- G′, surcharge weight;
- V′ is the vertical force at the intermediate CDEF interface of the wedge-prism resulting from the effective force;
- Fx, Fz, Fz leakage forces, (Fy forces in the two opposite wedges will cancel each other, so the force in this direction is not taken into account);
- S′, normal force from the mud support in the tunnel face;
- N′, normal stress on the inclined sliding surface;
- T, shear force on inclined sliding surface.
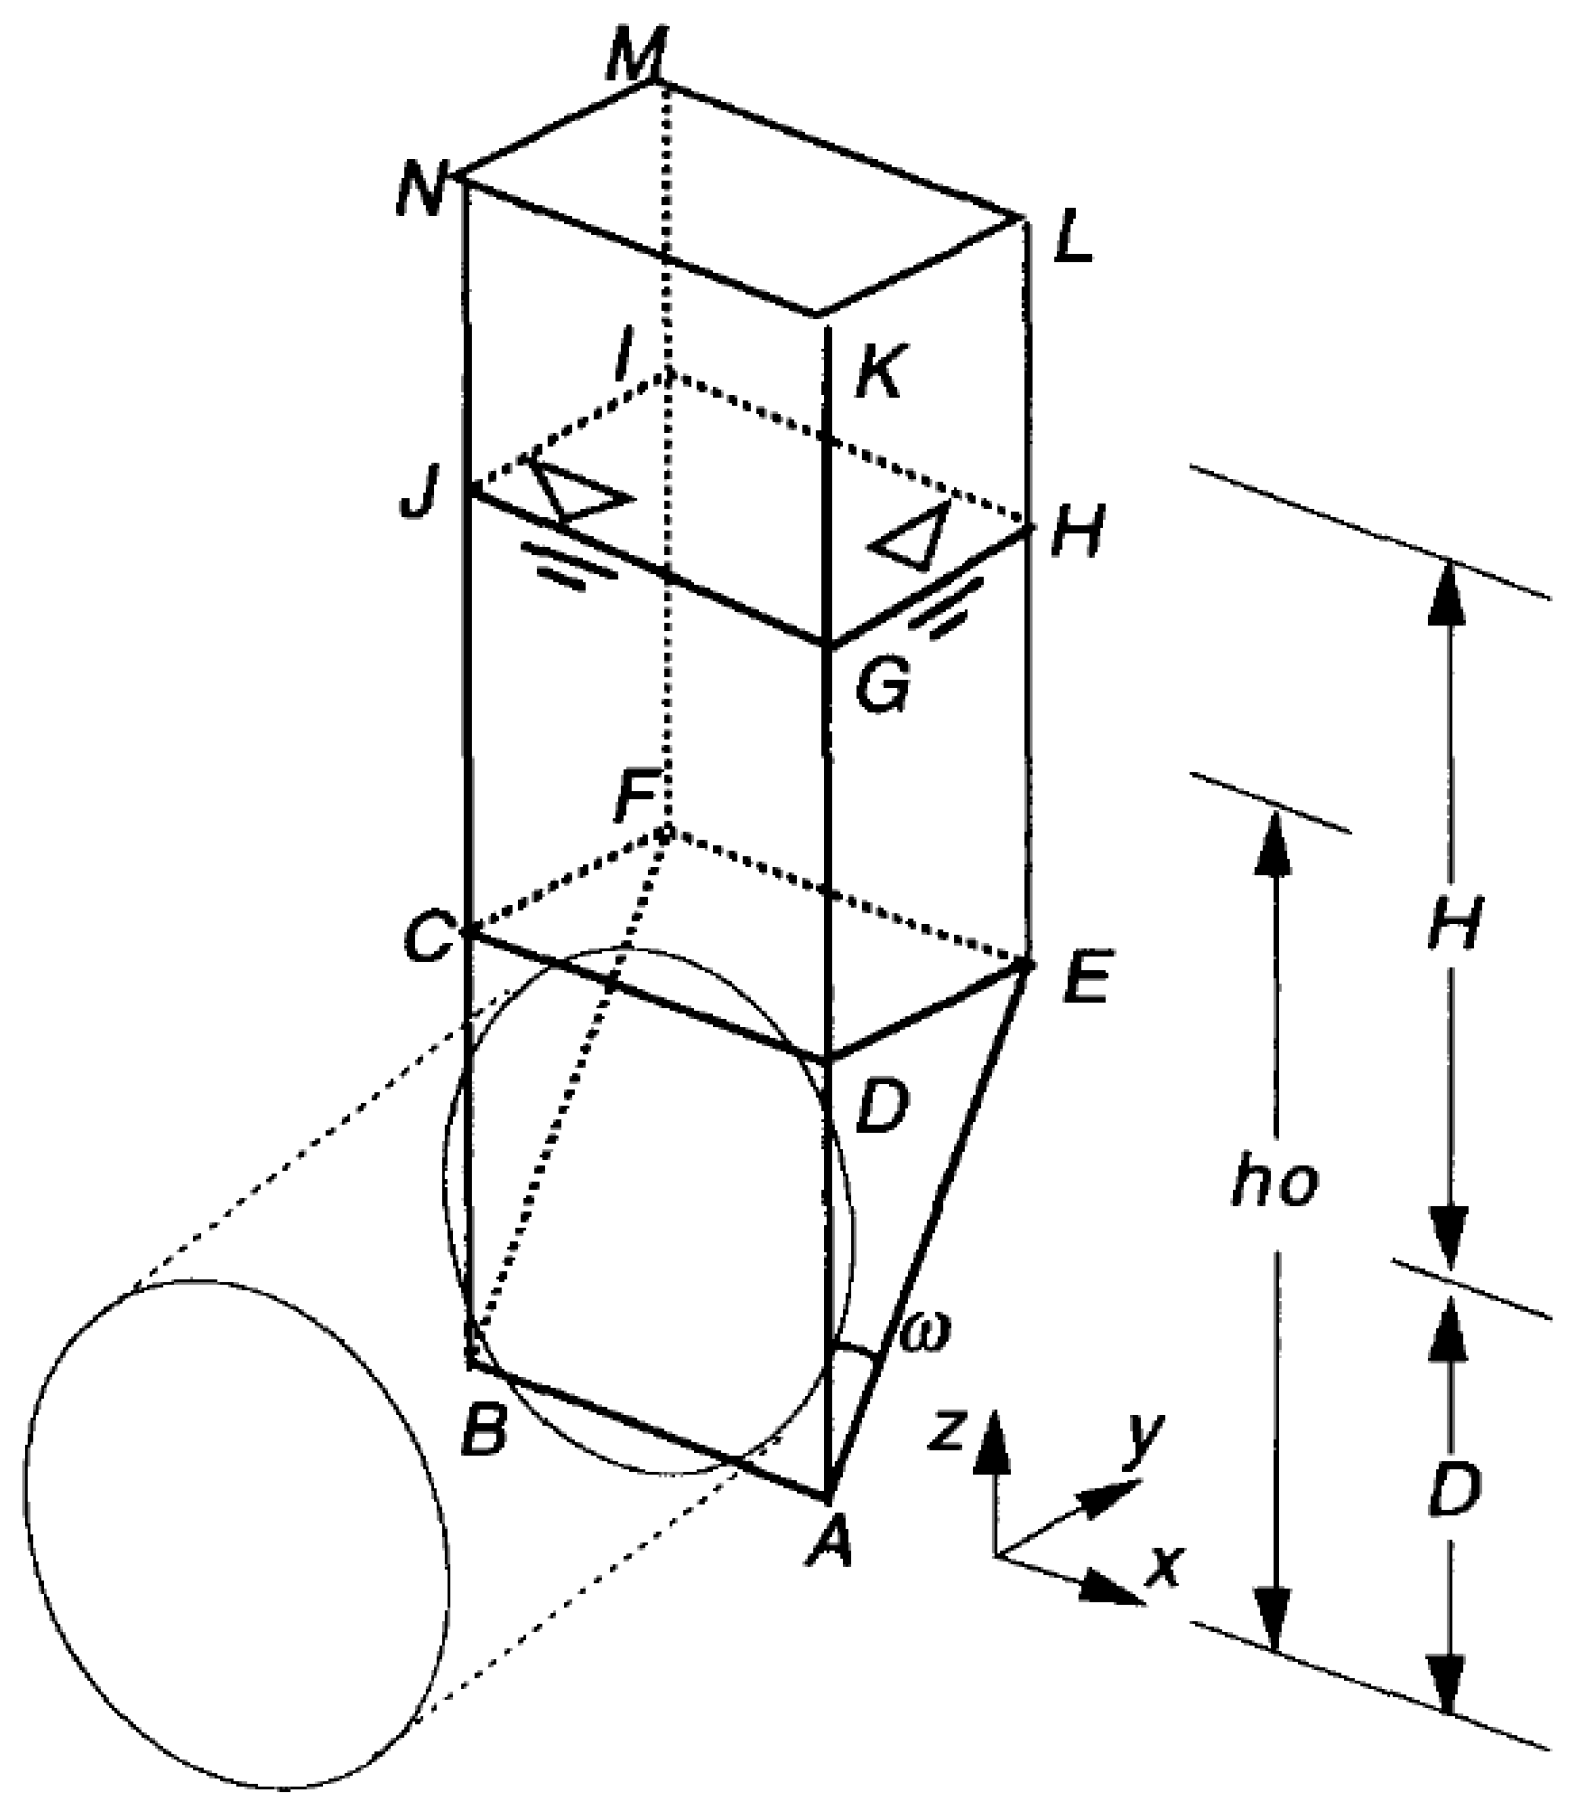
Ref. [24], using dimensional analysis and taking into account the linearity of the equilibrium and failure equations, proposed the following general equation for the boundary equilibrium state:
In this equation:
- , effective support pressure at limit equilibrium;
- , tunnel diameter;
- , depth of cover layer (overburden);
- ∆h, h0-hf (where hf, piezometric head in the chamber and h0 elevation of the water table);
- c, cohesion;
- F0, F1, F2, and F3, parameters depending on the internal friction angle of the formation;
- , is the water-saturated unit volume weight of the soil.
The main purpose of the face pressure formulas detailed above is to prevent face collapse and thus to prevent settlement on the surface (especially in shallow tunnels). These formulas are successfully used, but there is an absolute settlement on the surface. In this study, in addition to the other formulas, a new formula that will provide the calculation of the magnitude of face pressure that will prevent damage to a structure in the tunnel effect area by limiting the deformation has been emphasized. In the proposed formula, the structure need not be directly above the tunnel. With this formula, the face pressure that should be applied to the tunnel face can be calculated with the 3D position in order to prevent a structure from being damaged by the excavation works from the moment it enters the affected area by tunnel excavation to the moment it leaves the affected area.
In order to develop the formula, the study was carried out within the scope of the construction of the III. Stage of the Izmir Metro, the Fahrettin Altay-Ucyol Metro Line. The feature of the line is that it has very difficult ground conditions. Within the scope of this study, geological–geotechnical studies, hydrogeological studies, geophysical studies (GPR measurements), topographic measurement studies, and face pressure observations on the EPB machine were made. Finally, numerical modeling studies were carried out by integrating the developed formula with numerical modeling software. The results obtained are highly similar to the actual data. When the results were examined, it was determined that there was a significant correlation between the data measured in the field and the data calculated with the formula. According to these results, an important contribution has been made to previous research.
3. Material and Methods
3.1. Study Area Location and Geological and Geotechnical Setting
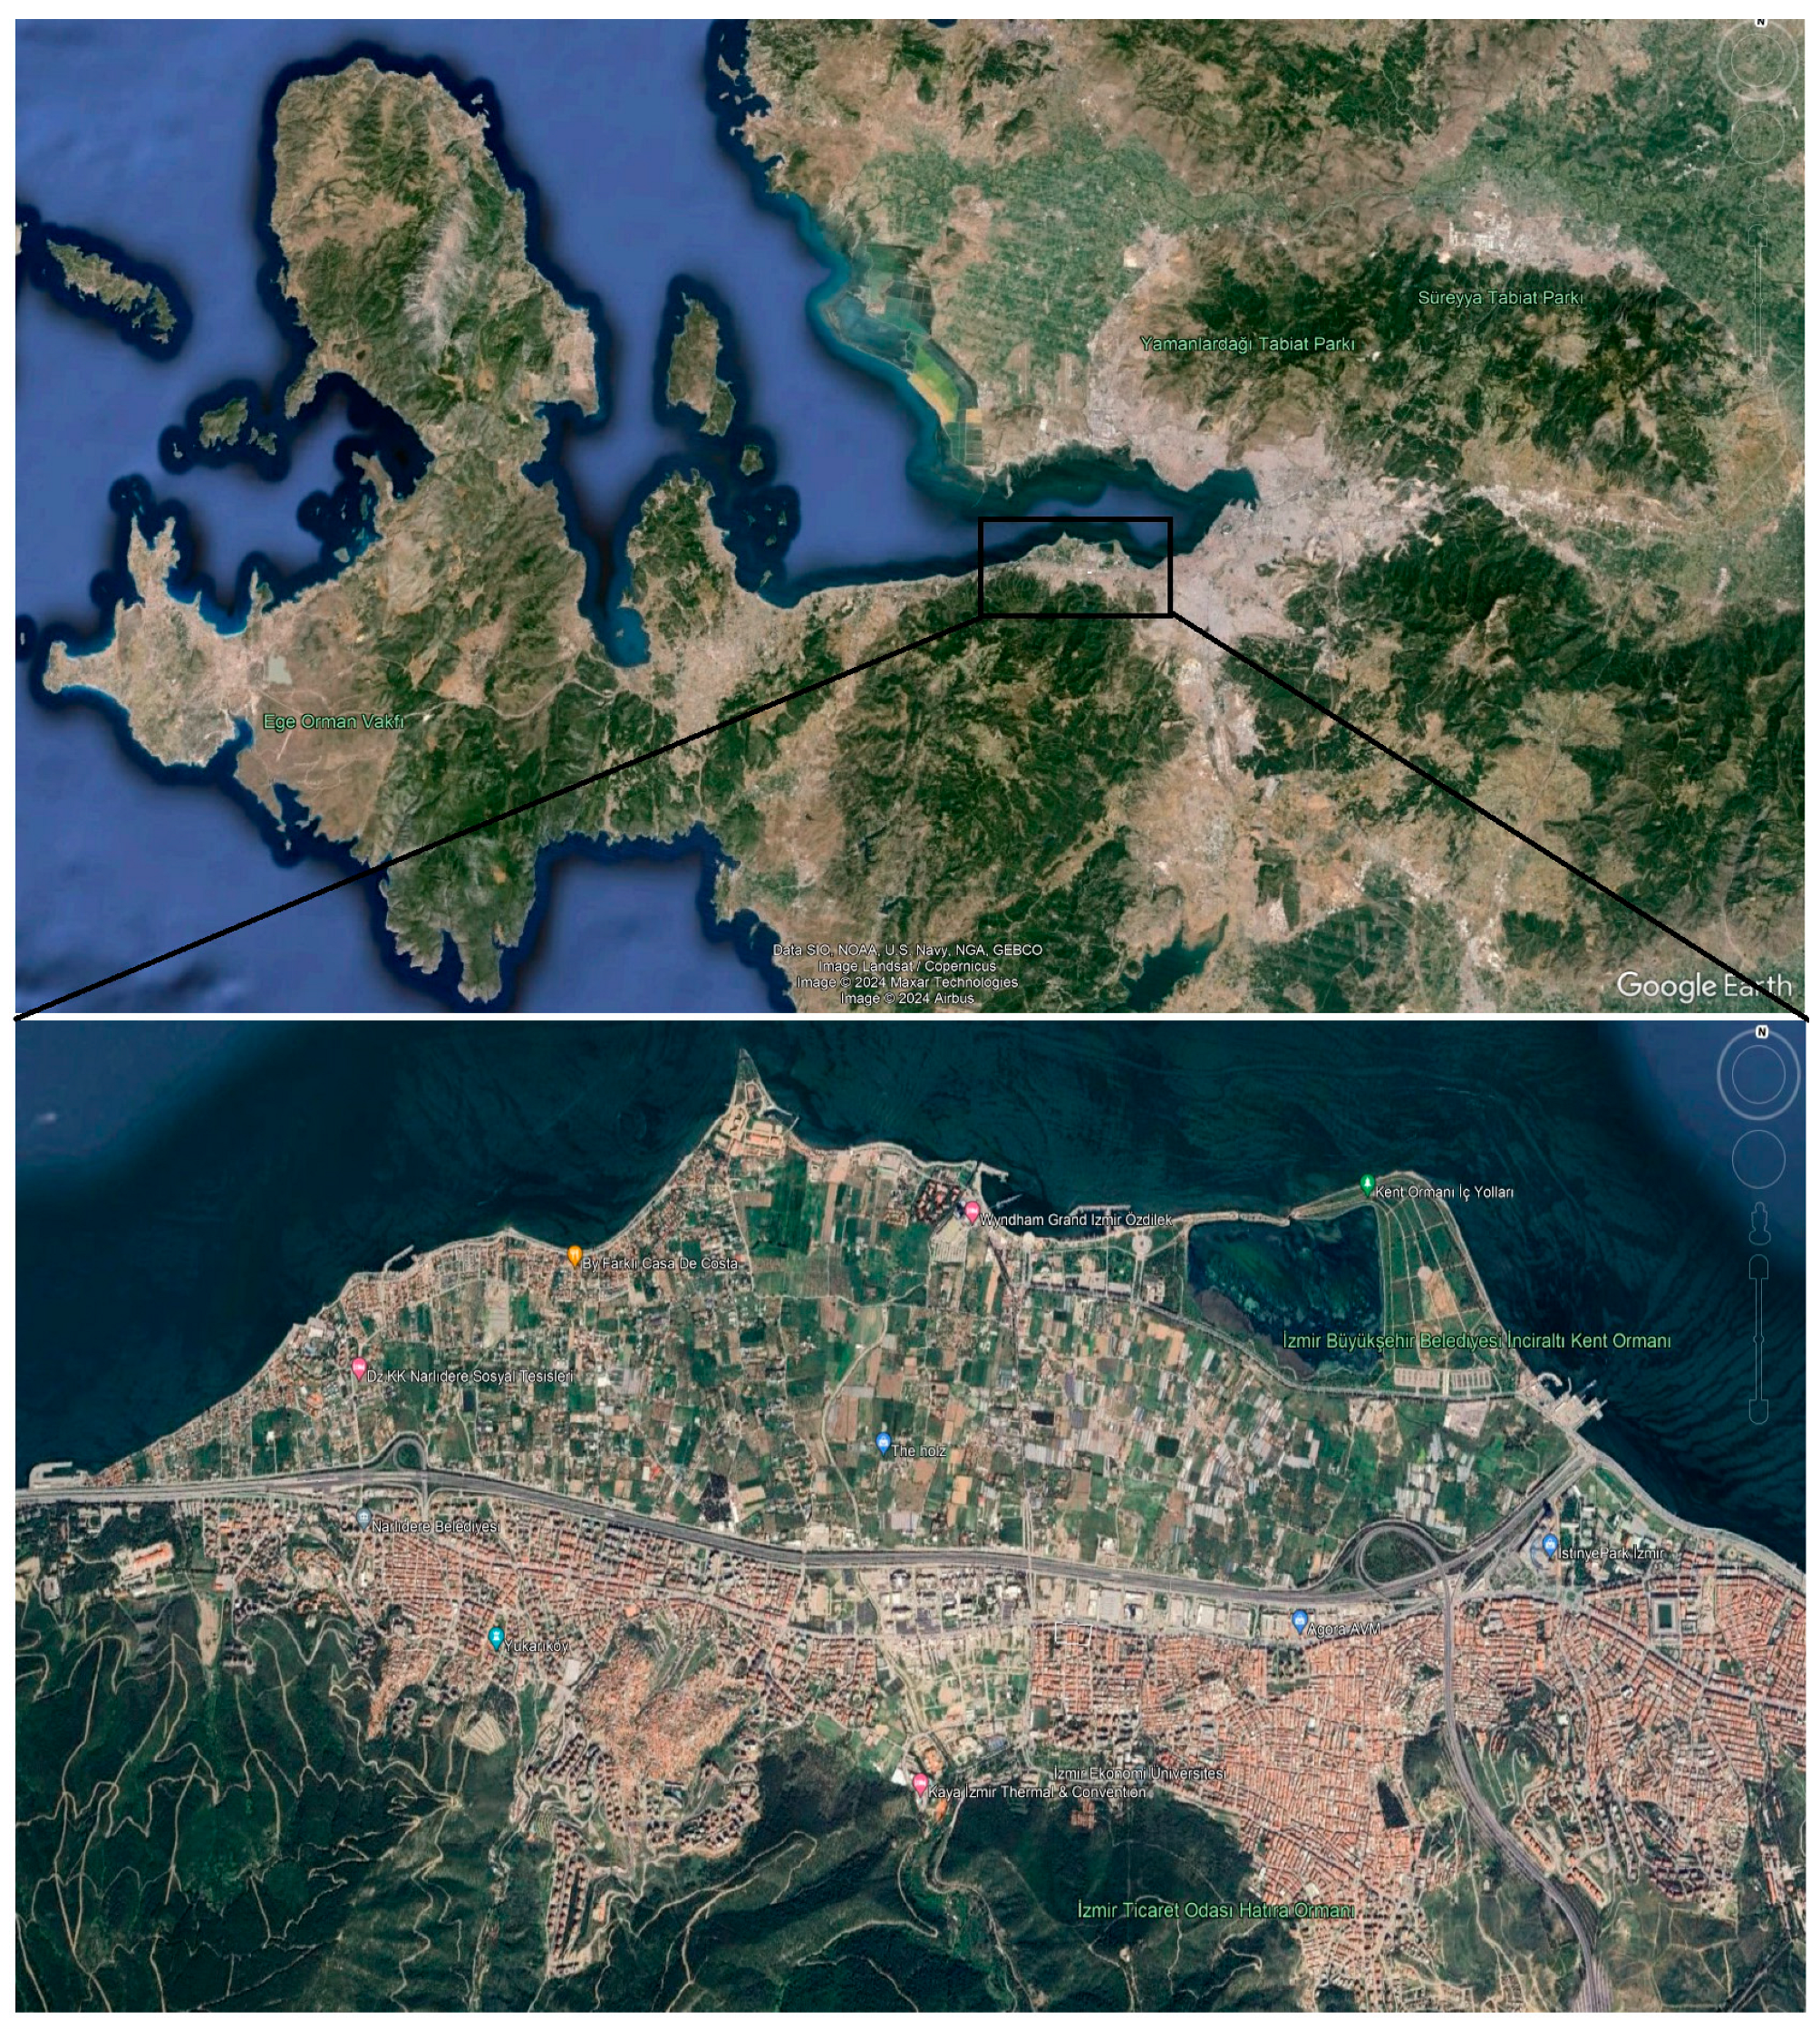
The study area is located on an alluvial plain extending in the E–W direction, 10 km west of İzmir Province. The south of the area is limited to high regions and the north is the Aegean Sea. The location map of the study area is presented in Figure 4.
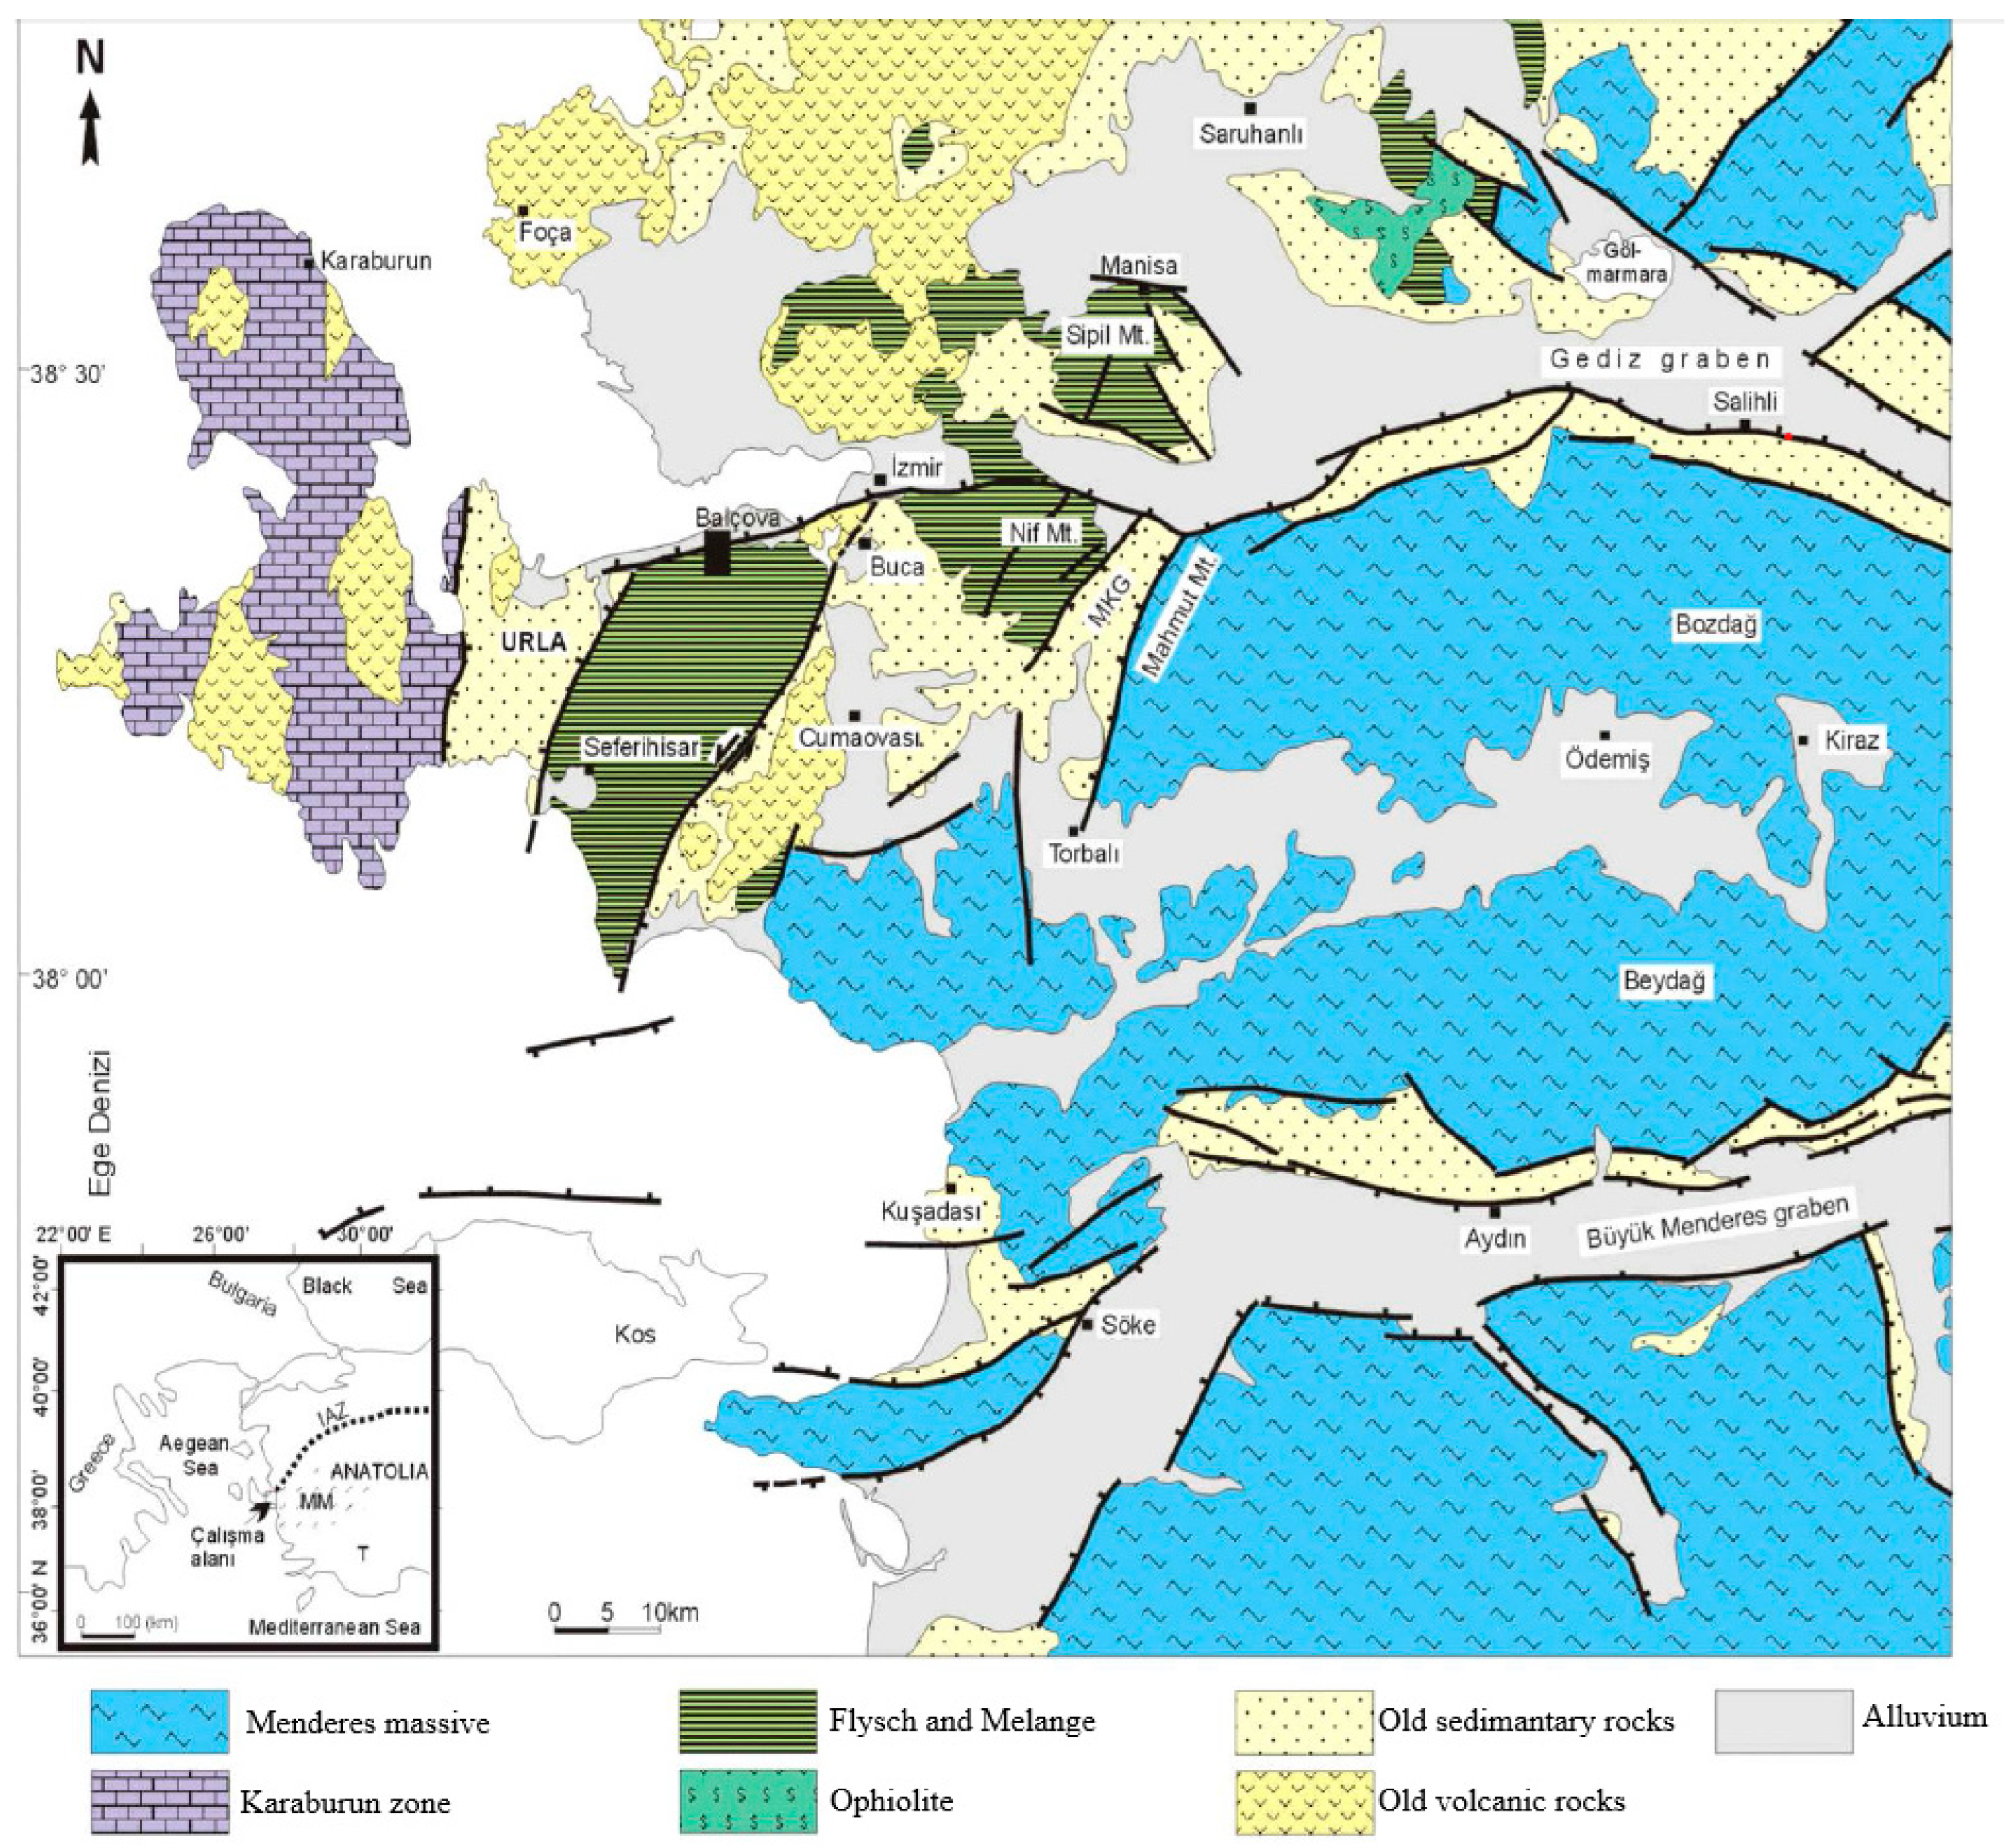
When the western part of Anatolia is examined in terms of tectonic belts, as seen in Figure 5, there is the Karaburun Belt in the western part, the metamorphic rocks known as the Menderes Massif in the east, and the İzmir–Ankara Zone in the middle [26]. The Menderes Massif, which is composed of metamorphic rocks, has gneiss and micaschists in the lower part and a thick carbonate structure in the upper part [27,28,29]. Ophiolites, mafic volcanites, and flysch-type rocks are found in the western part of the Menderes massif.
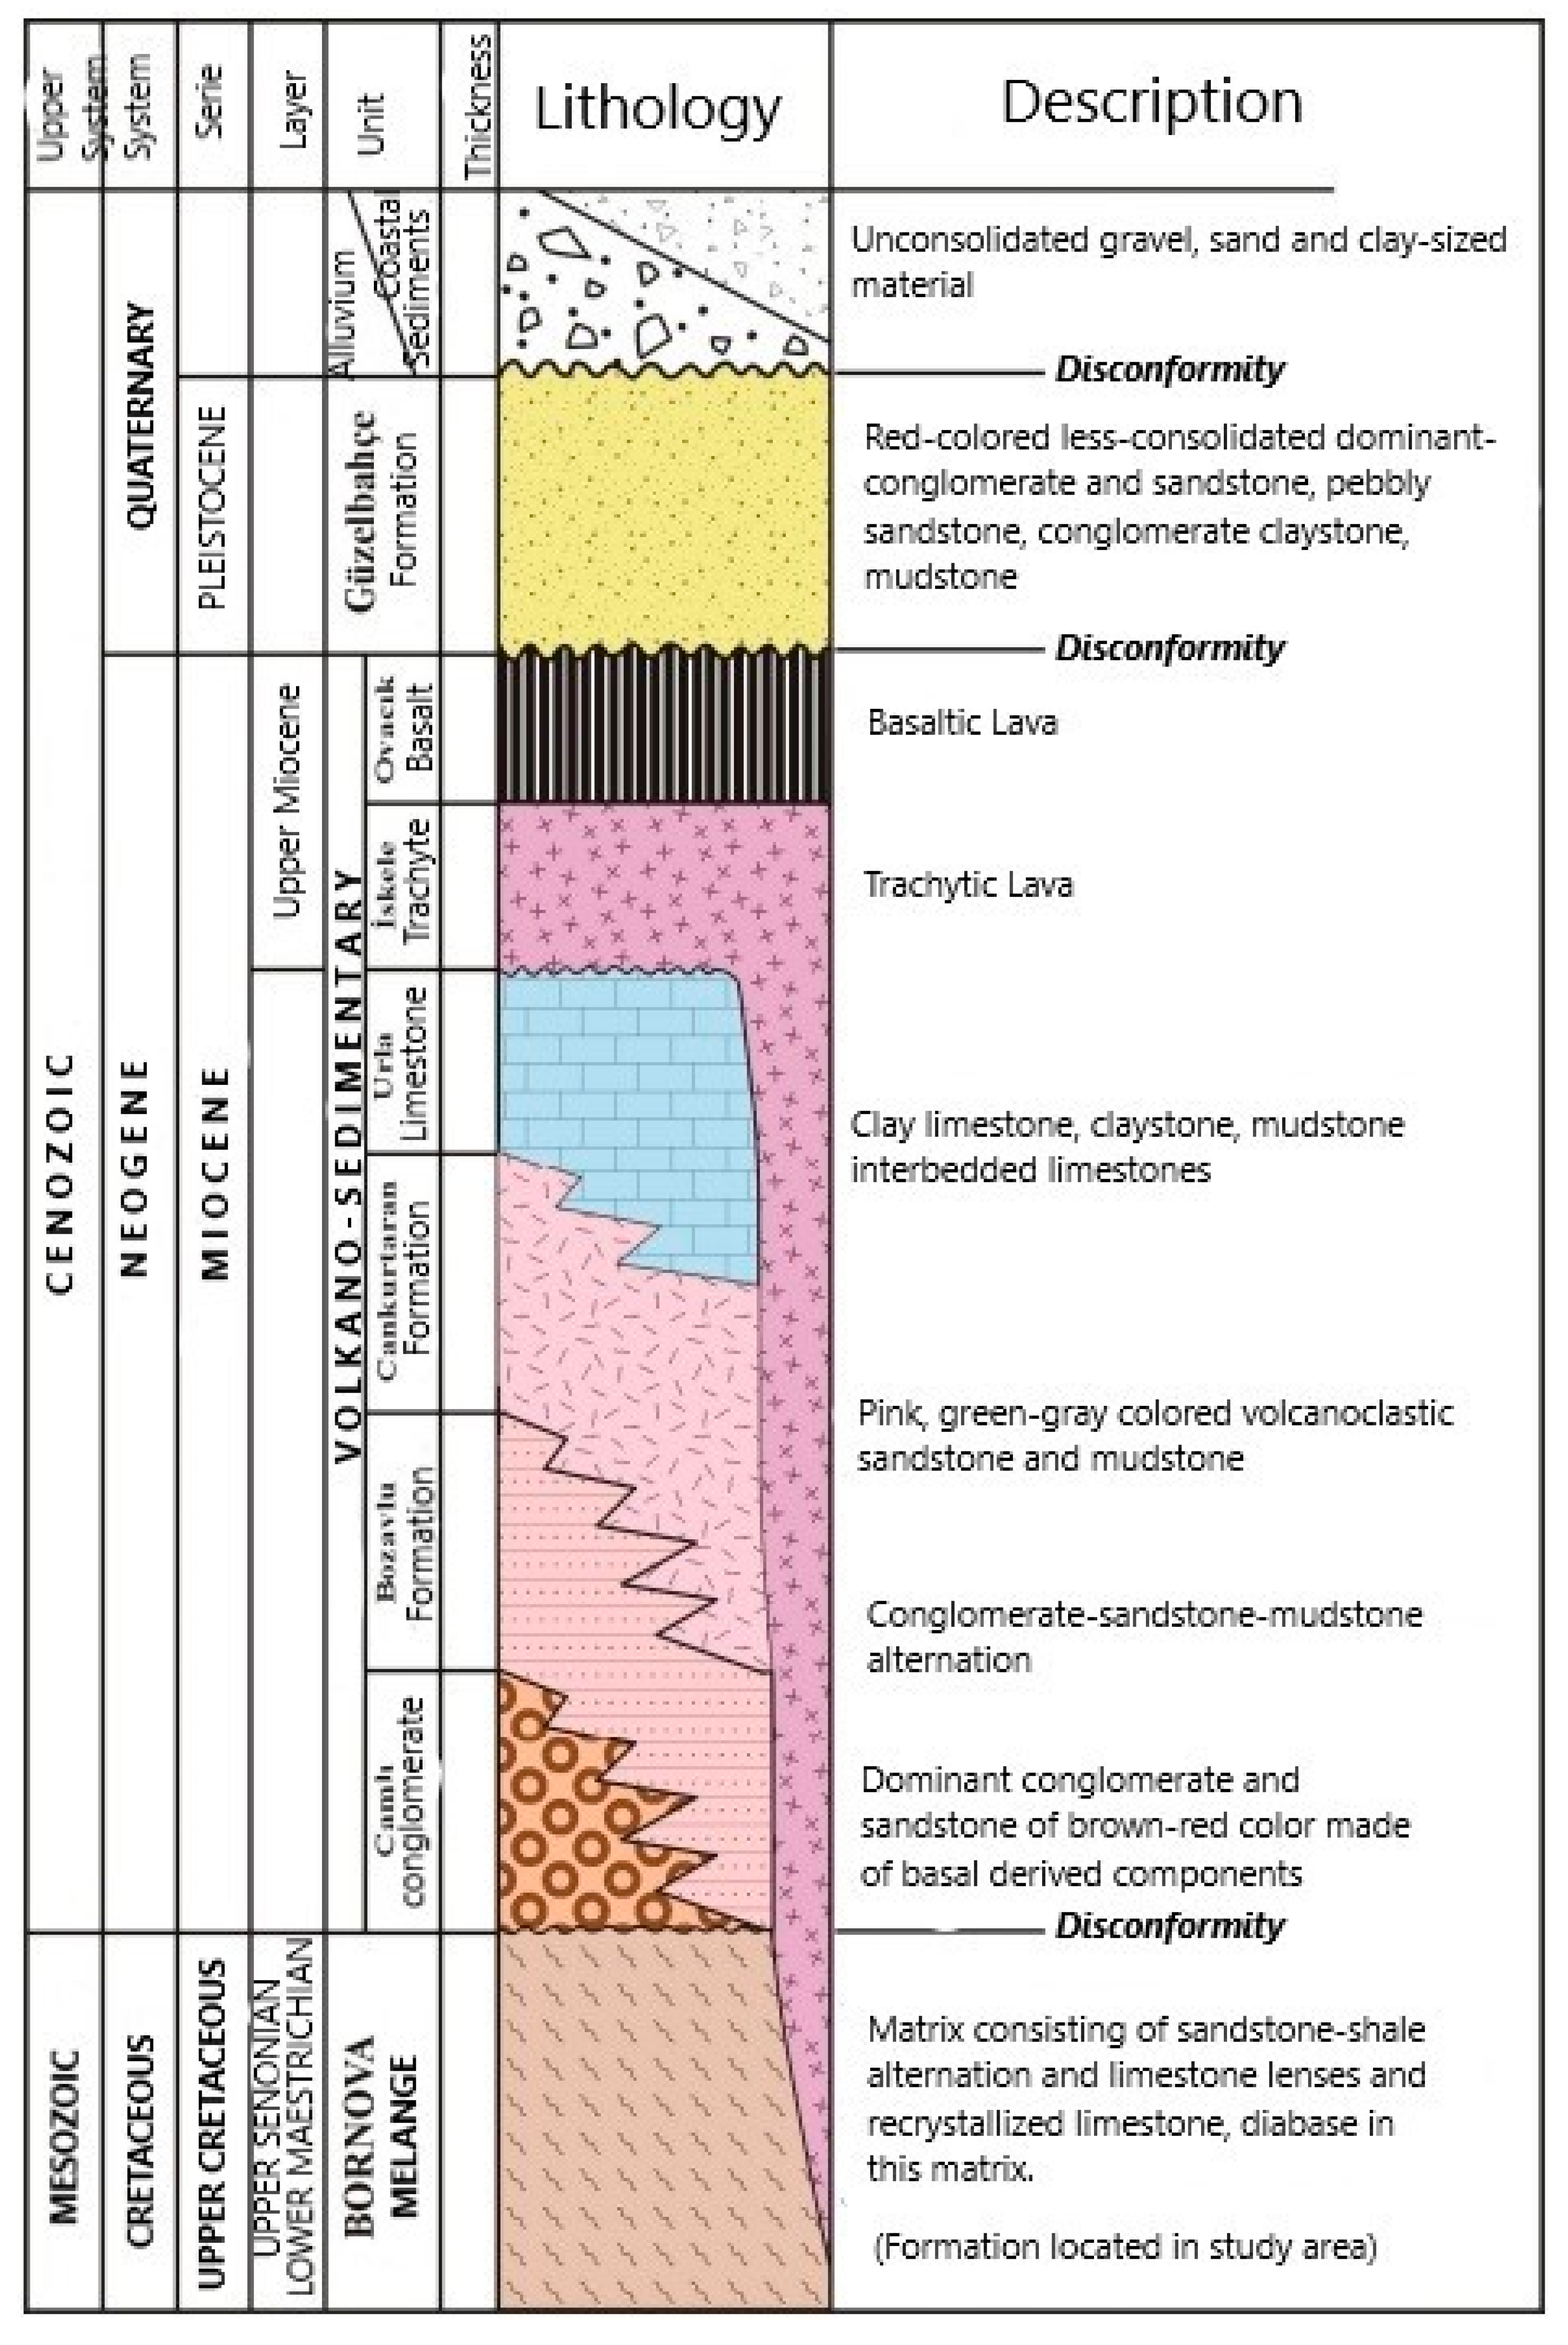
The Karaburun Zone is located on the west side of the İzmir–Ankara Zone. At the bottom of this belt are the lower-middle carboniferous limestones and overlying it is a continuum from the Lower Triassic to the Lower Cretaceous [26,30]. The stratigraphic section of the study area is given in Figure 6.
Figure 5.
Simplified geological map of the study area and its surroundings [31].
Figure 5.
Simplified geological map of the study area and its surroundings [31].


The RMR Rating and GSI Rating values and rock classes of the rock structure in the route as a result of the studies carried out in the drilling holes are given in Table 1 below.
3.2. Hydrogeological Studies
Permeability tests were determined in the alluvial sections in the drillings along the route and permeability values were determined by pressurized water test in the Bornova Melange unit. Permeability values of the excavation route in general are given in Table 2.
3.3. GPR Studies
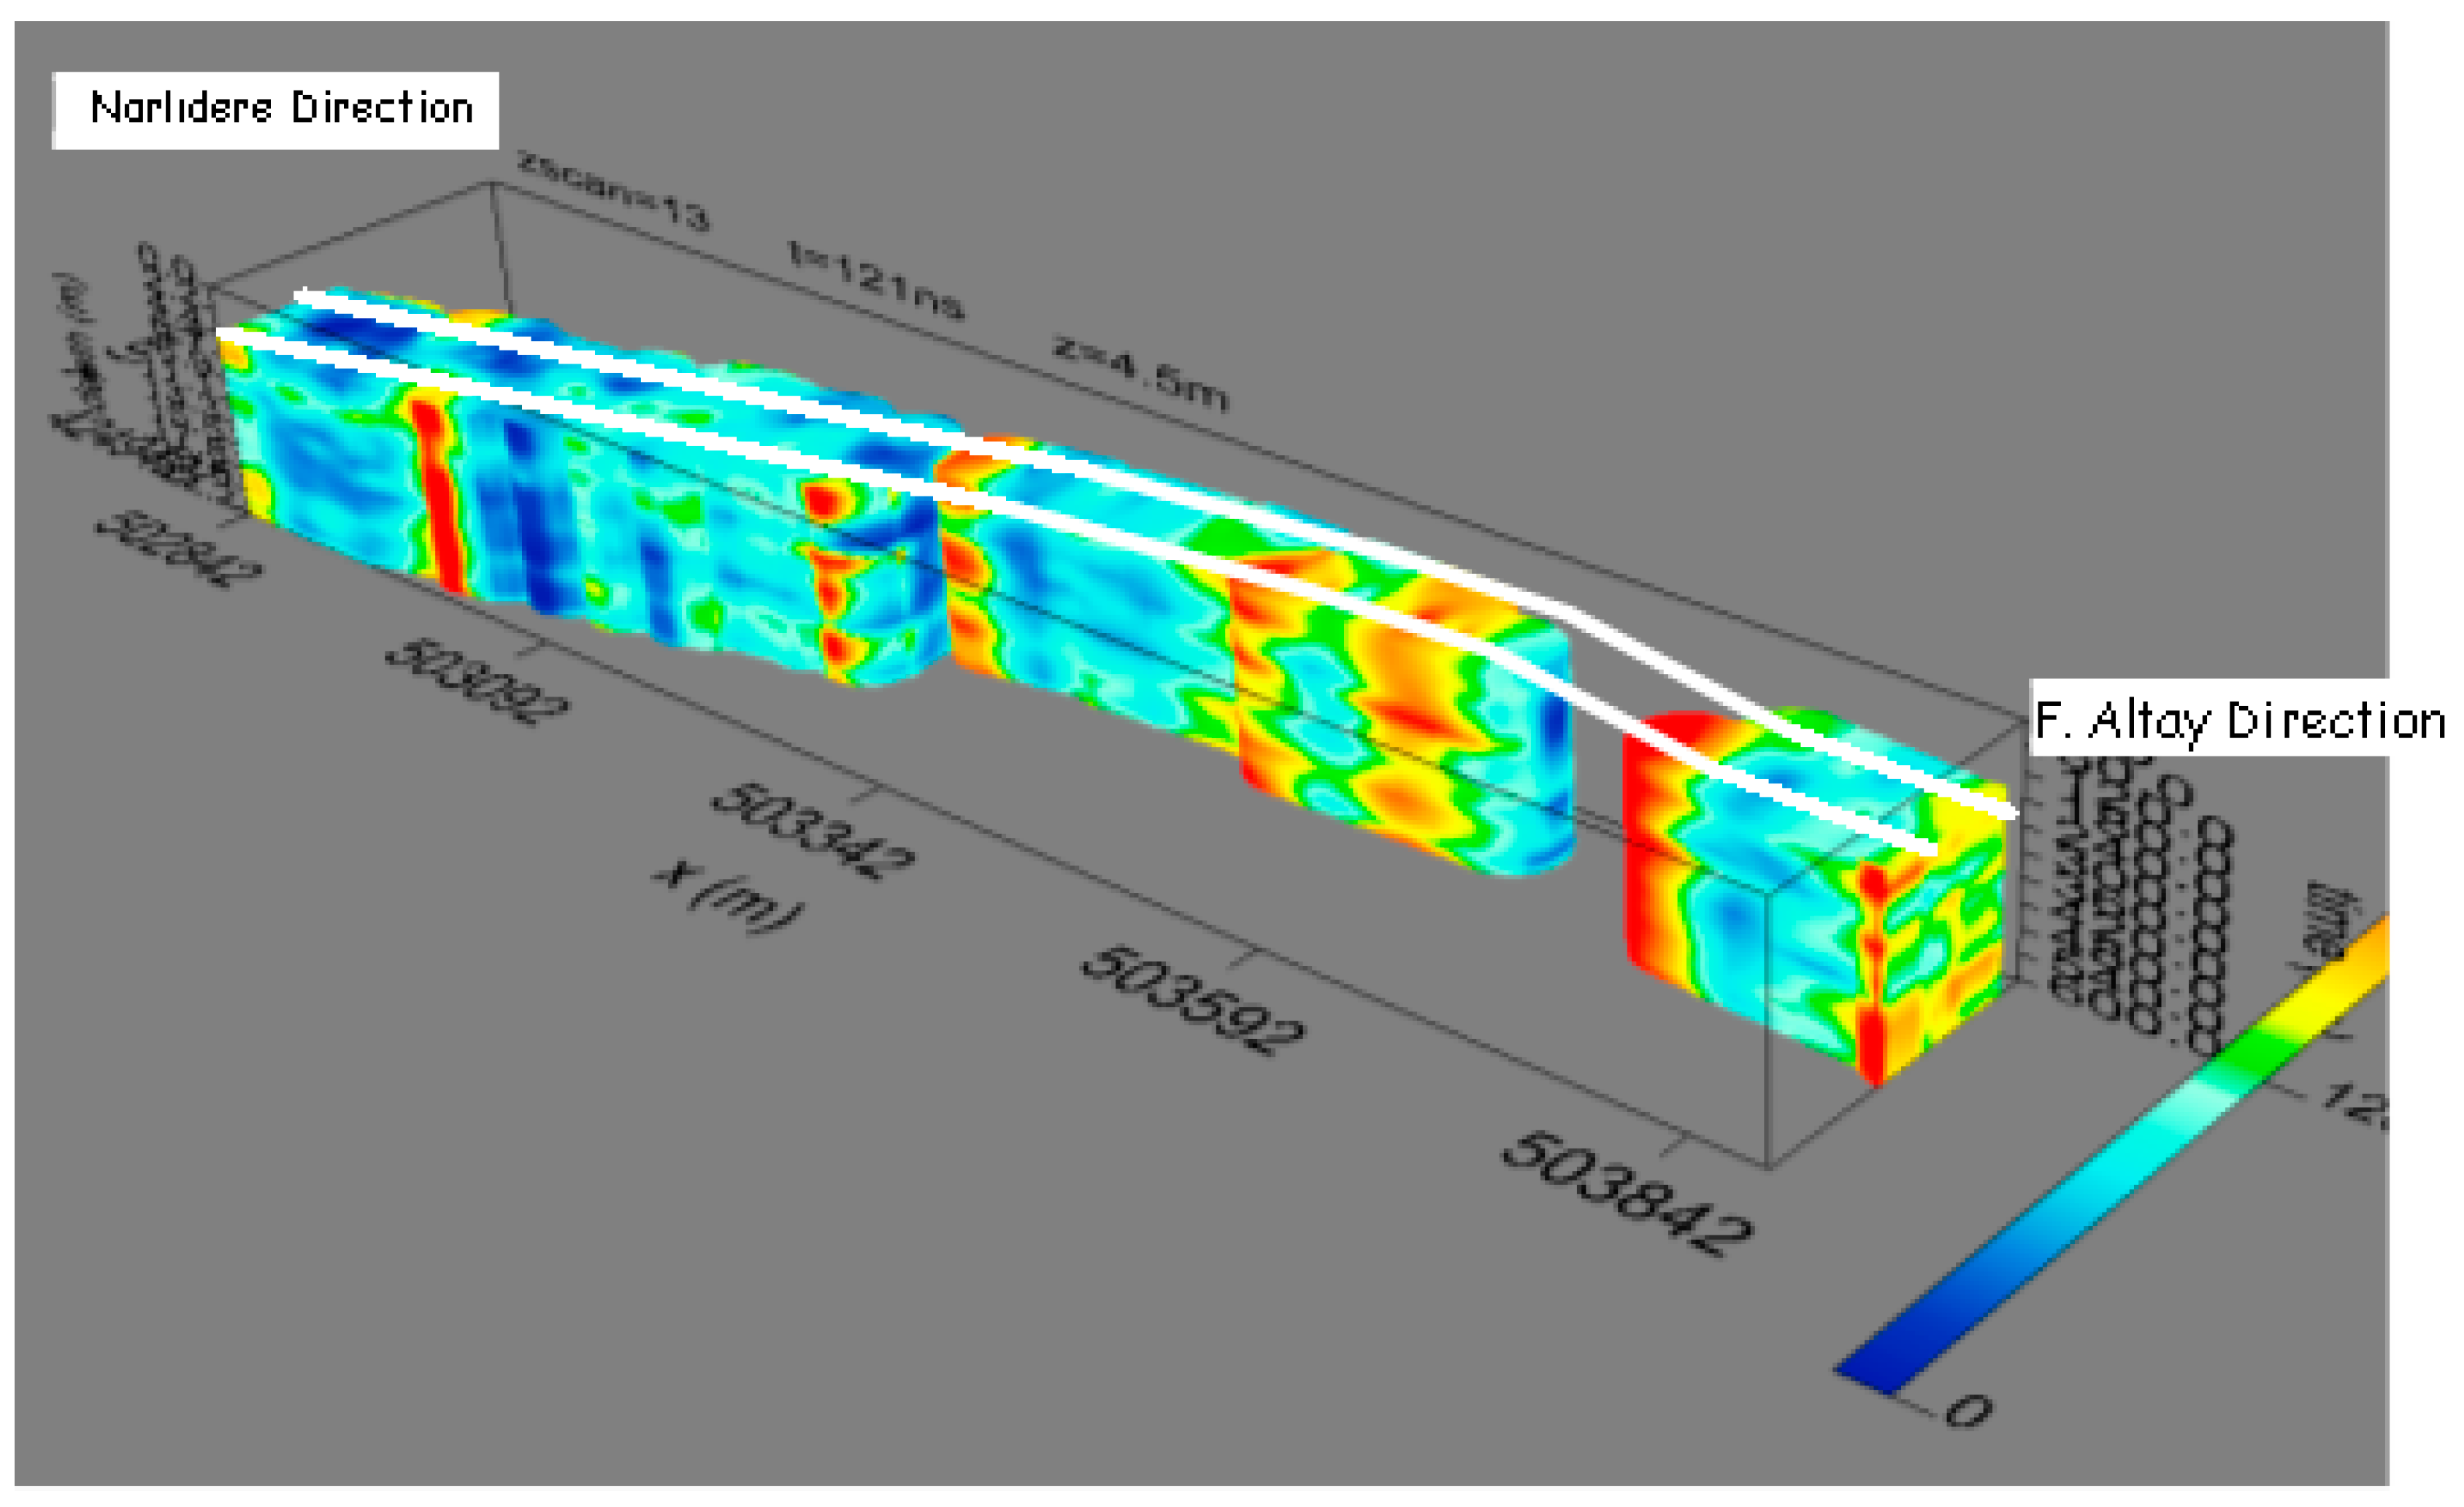
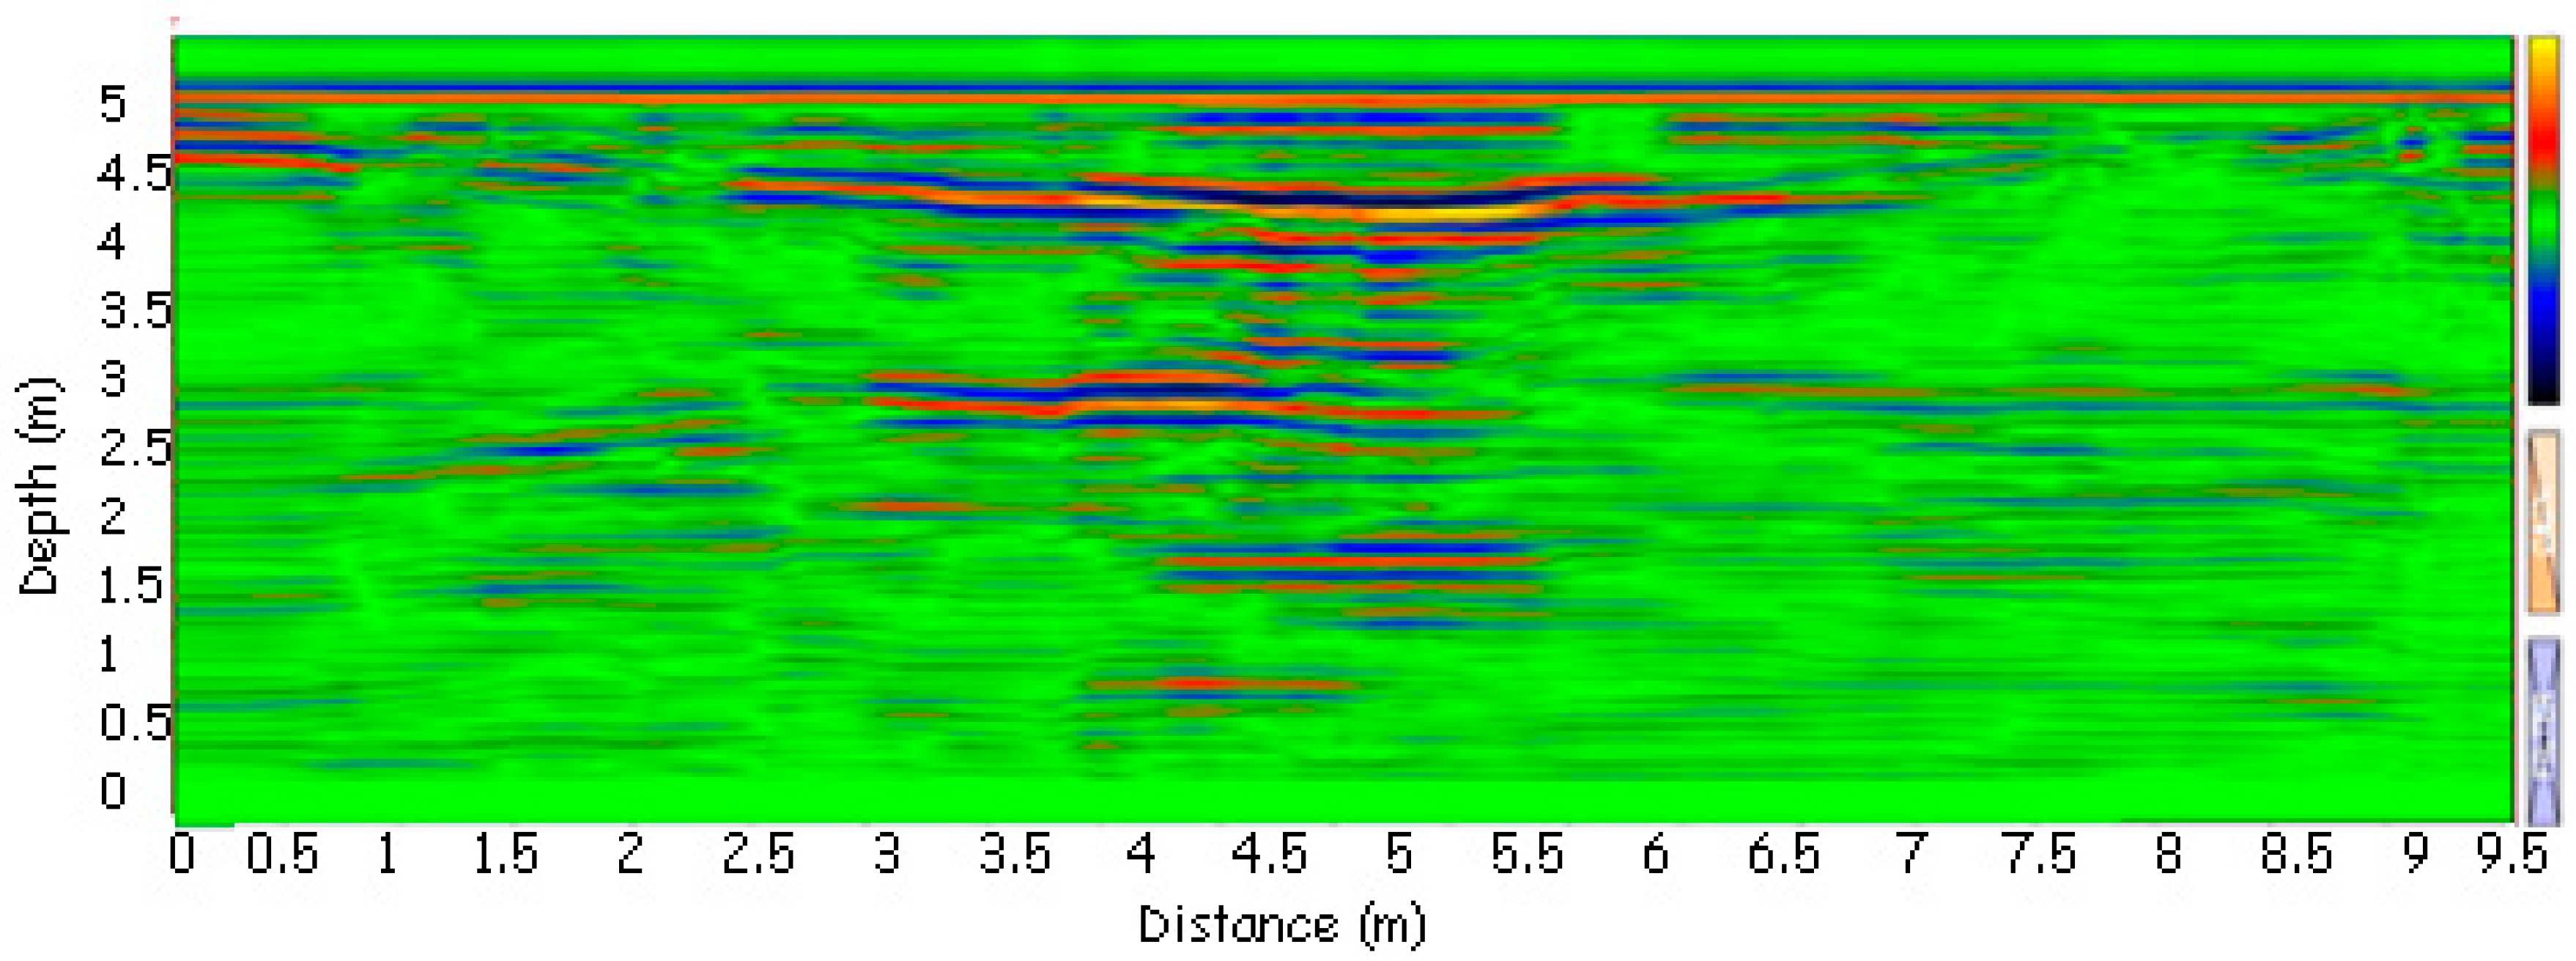
Ground penetrating radar (GPR), which is one of the fast and non-destructive geophysical methods offering high discrimination, is widely used in the investigation of shallow underground structures. GPR studies were carried out to determine the water condition of the ground structure on the tunnel route and whether there is any gap in the ground or whether there is a geological structure that will cause the EPB machine to be forced within the scope of this research. Figure 7 shows one of these surface studies and Figure 8 shows one of the measurements made on the tunnel face.
3.4. Deformation Measurements with LIDAR
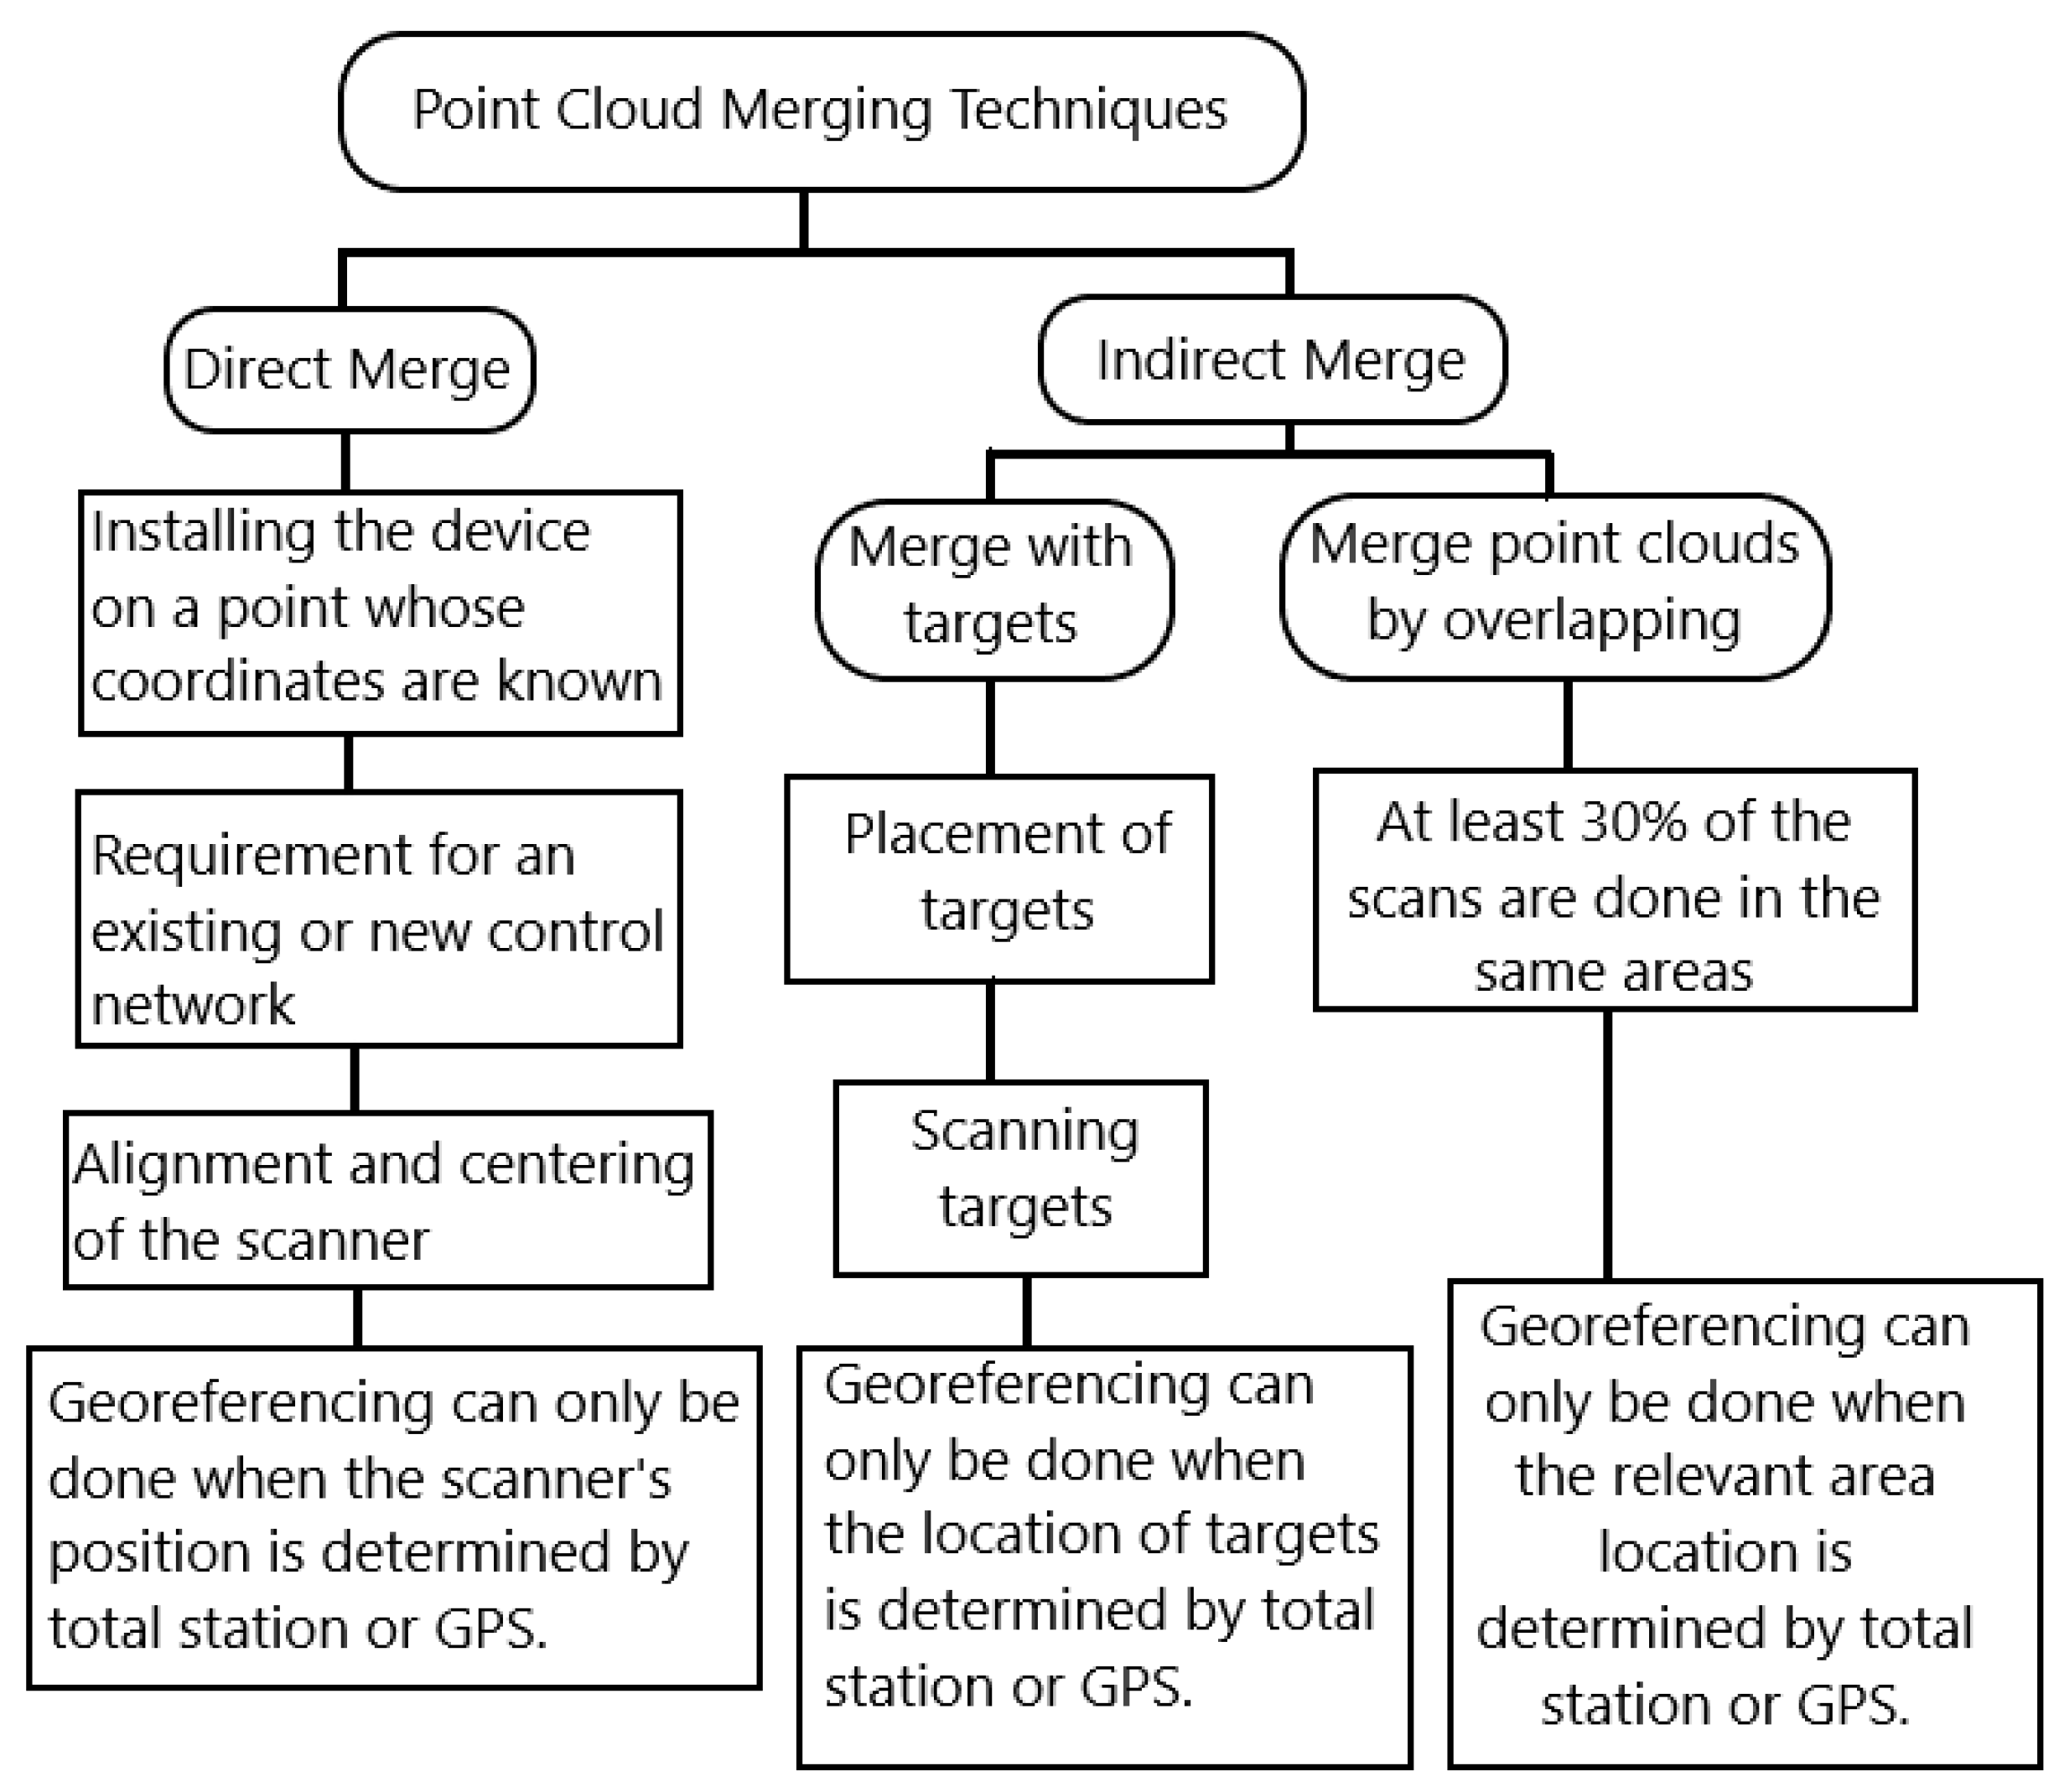
LiDAR technology has developed in recent years and has become one of the most frequently used methods for measuring the effects of excavation in tunneling. The merging of point clouds can be accomplished in two steps: point clouds contain congruent points because they are implicitly scanned over each other during acquisition. With the help of these points, approximate point clouds are subject to the registration process. In the second stage, it is optimized with the ICP (iterative closest point) algorithm to combine more precisely, and thus it is combined with the least error rate between different scans. With these merging techniques, the width of the areal measurements can be increased. Point cloud merging techniques are given in Figure 9.
4. Empirical Development of the Face Pressure Formula
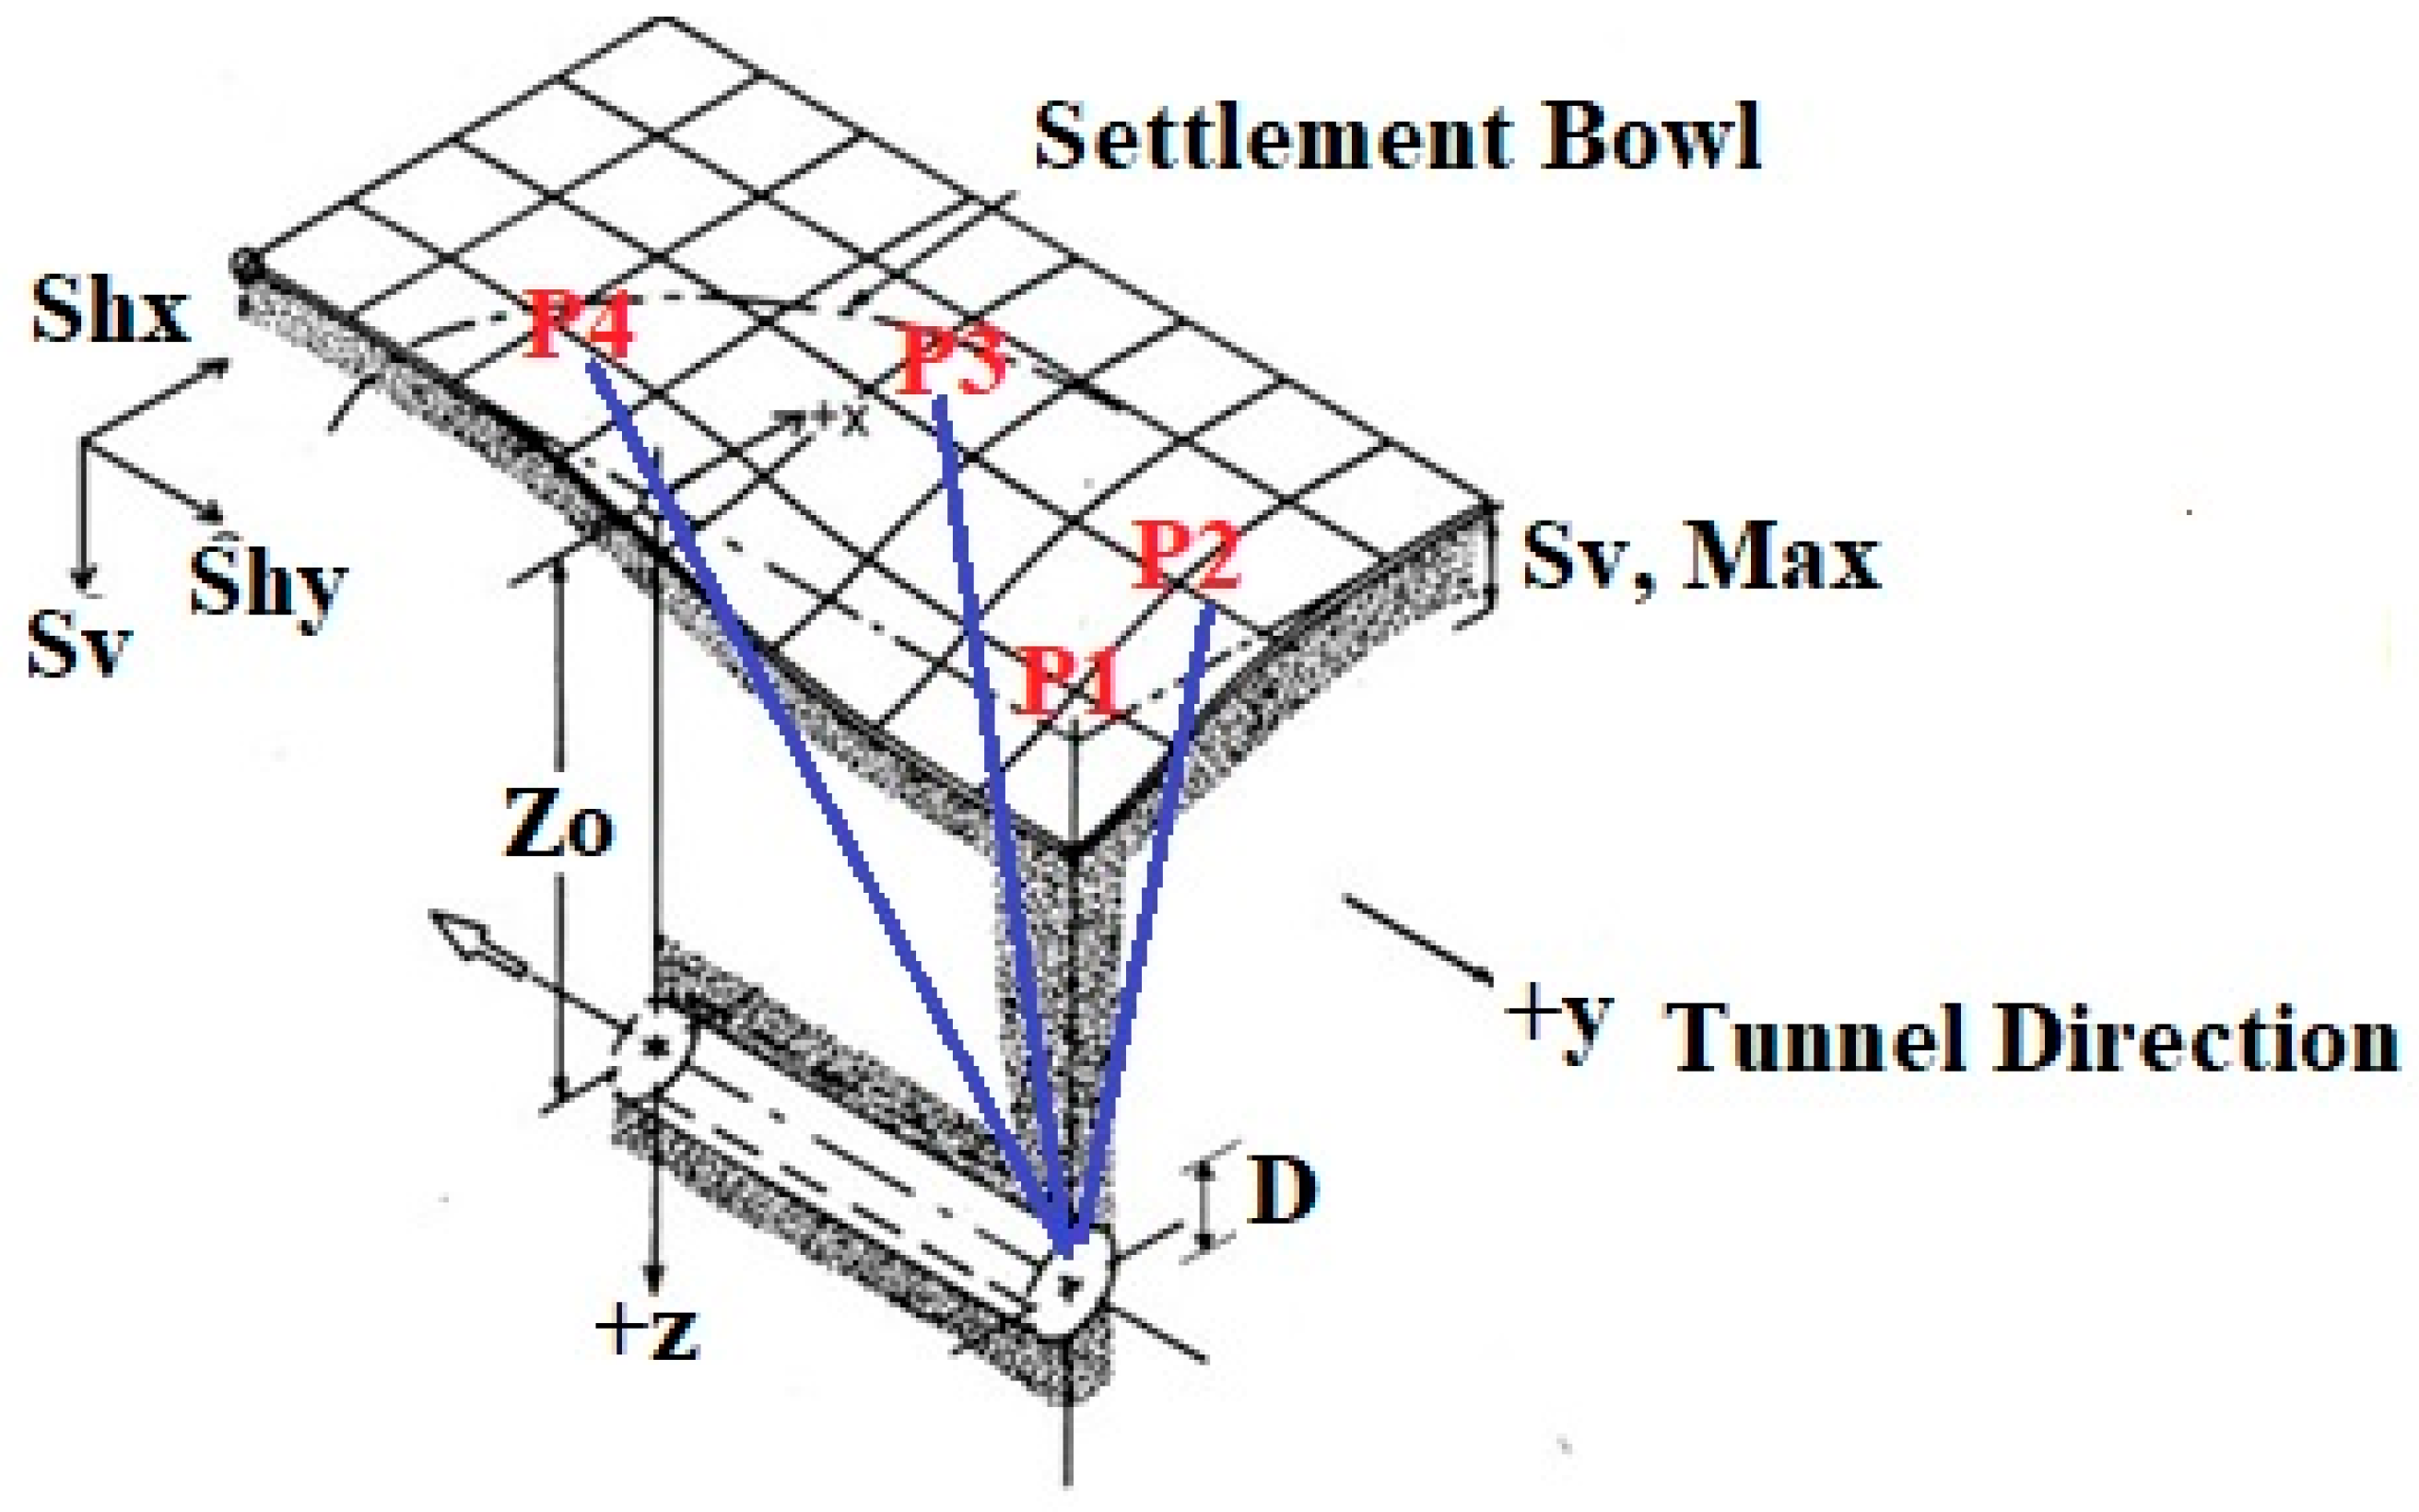
Pressure is applied to the tunnel face to ensure stability in the excavation face in tunnel excavations made with EPB machines. This pressure must be symmetrical to the pressure on the excavation face. Some empirical formulas are used to calculate the amount of face pressure that must be applied. The pressure calculated with these formulas is intended to prevent inward movement and yield in the tunnel face. However, in some cases, when the pressure is insufficient, the tunnel face moves inward, or vice versa, in cases where excessive pressure is applied, there may be swelling on the surface. In both cases, structures on the surface may be subject to damage. In order to prevent structural damage, a good excavation period has been planned and a formula has been worked on to prevent damage to structures and to keep the tunnel face stable. The data collected from the field studies mentioned in the previous sections and given above were used in order to develop the new formula. The important parameter in this formula is the positional state of the structure. The horizontal, vertical, and longitudinal distance of the structure to the tunnel face and the change in this distance during the excavation are integrated into the formula. To explain the issue simply with an example, the positions of the structures (P1, P2, P3, and P4) are integrated into the formula as given in Figure 11 At this stage, along with the parameters such as the horizontal, vertical, and longitudinal distance between the center of the tunnel and the structure, the thickness of the overburden, and the unit volume weight, the angle (α) that the structure makes with the tunnel face spatially gains importance.
In this part, deformation (D), face pressure (σFP), vertical stress (σVS), the modulus of deformation (Emass), internal friction angle (Φ), and the horizontal distance between the place where the deformation is measured and the axis of the tunnel (HD) were examined. Face pressure developing according to D, σFP, σVS, Emass, Φ, and HD parameters was investigated to find the most suitable hypersurface using the “Least Squares Method” (LSM), and the most suitable nonlinear hypersurface was determined. This nonlinear hypersurface is defined as follows. The following is the hypersurface about the face pressure:
where a, b, and c are coefficients.
In order to find the most suitable coefficients of a and b in the hypersurface function defined by this formula, it must be linearized and calculated with the LSM. When this hypersurface is linearized, the following result is obtained.
Here,
And,
briefly.
where is the error of the term.
In finite numbers of experimental data, there should be sufficient data to minimize the error. The linear equation system given by Equation (11) is minimized by LSM and the function given in Equation (12).
There,
From here,
Is obtained. If mathematically organized,
is the equation obtained. From here,
and,
Since det(B) ≠ 0, the system of linear equations has only one solution. Therefore,
is the equation obtained. If the data from the study area are applied,
Is obtained. From Equation (19),
In this situation, hypersurface can be written as,
Verification of New Formula
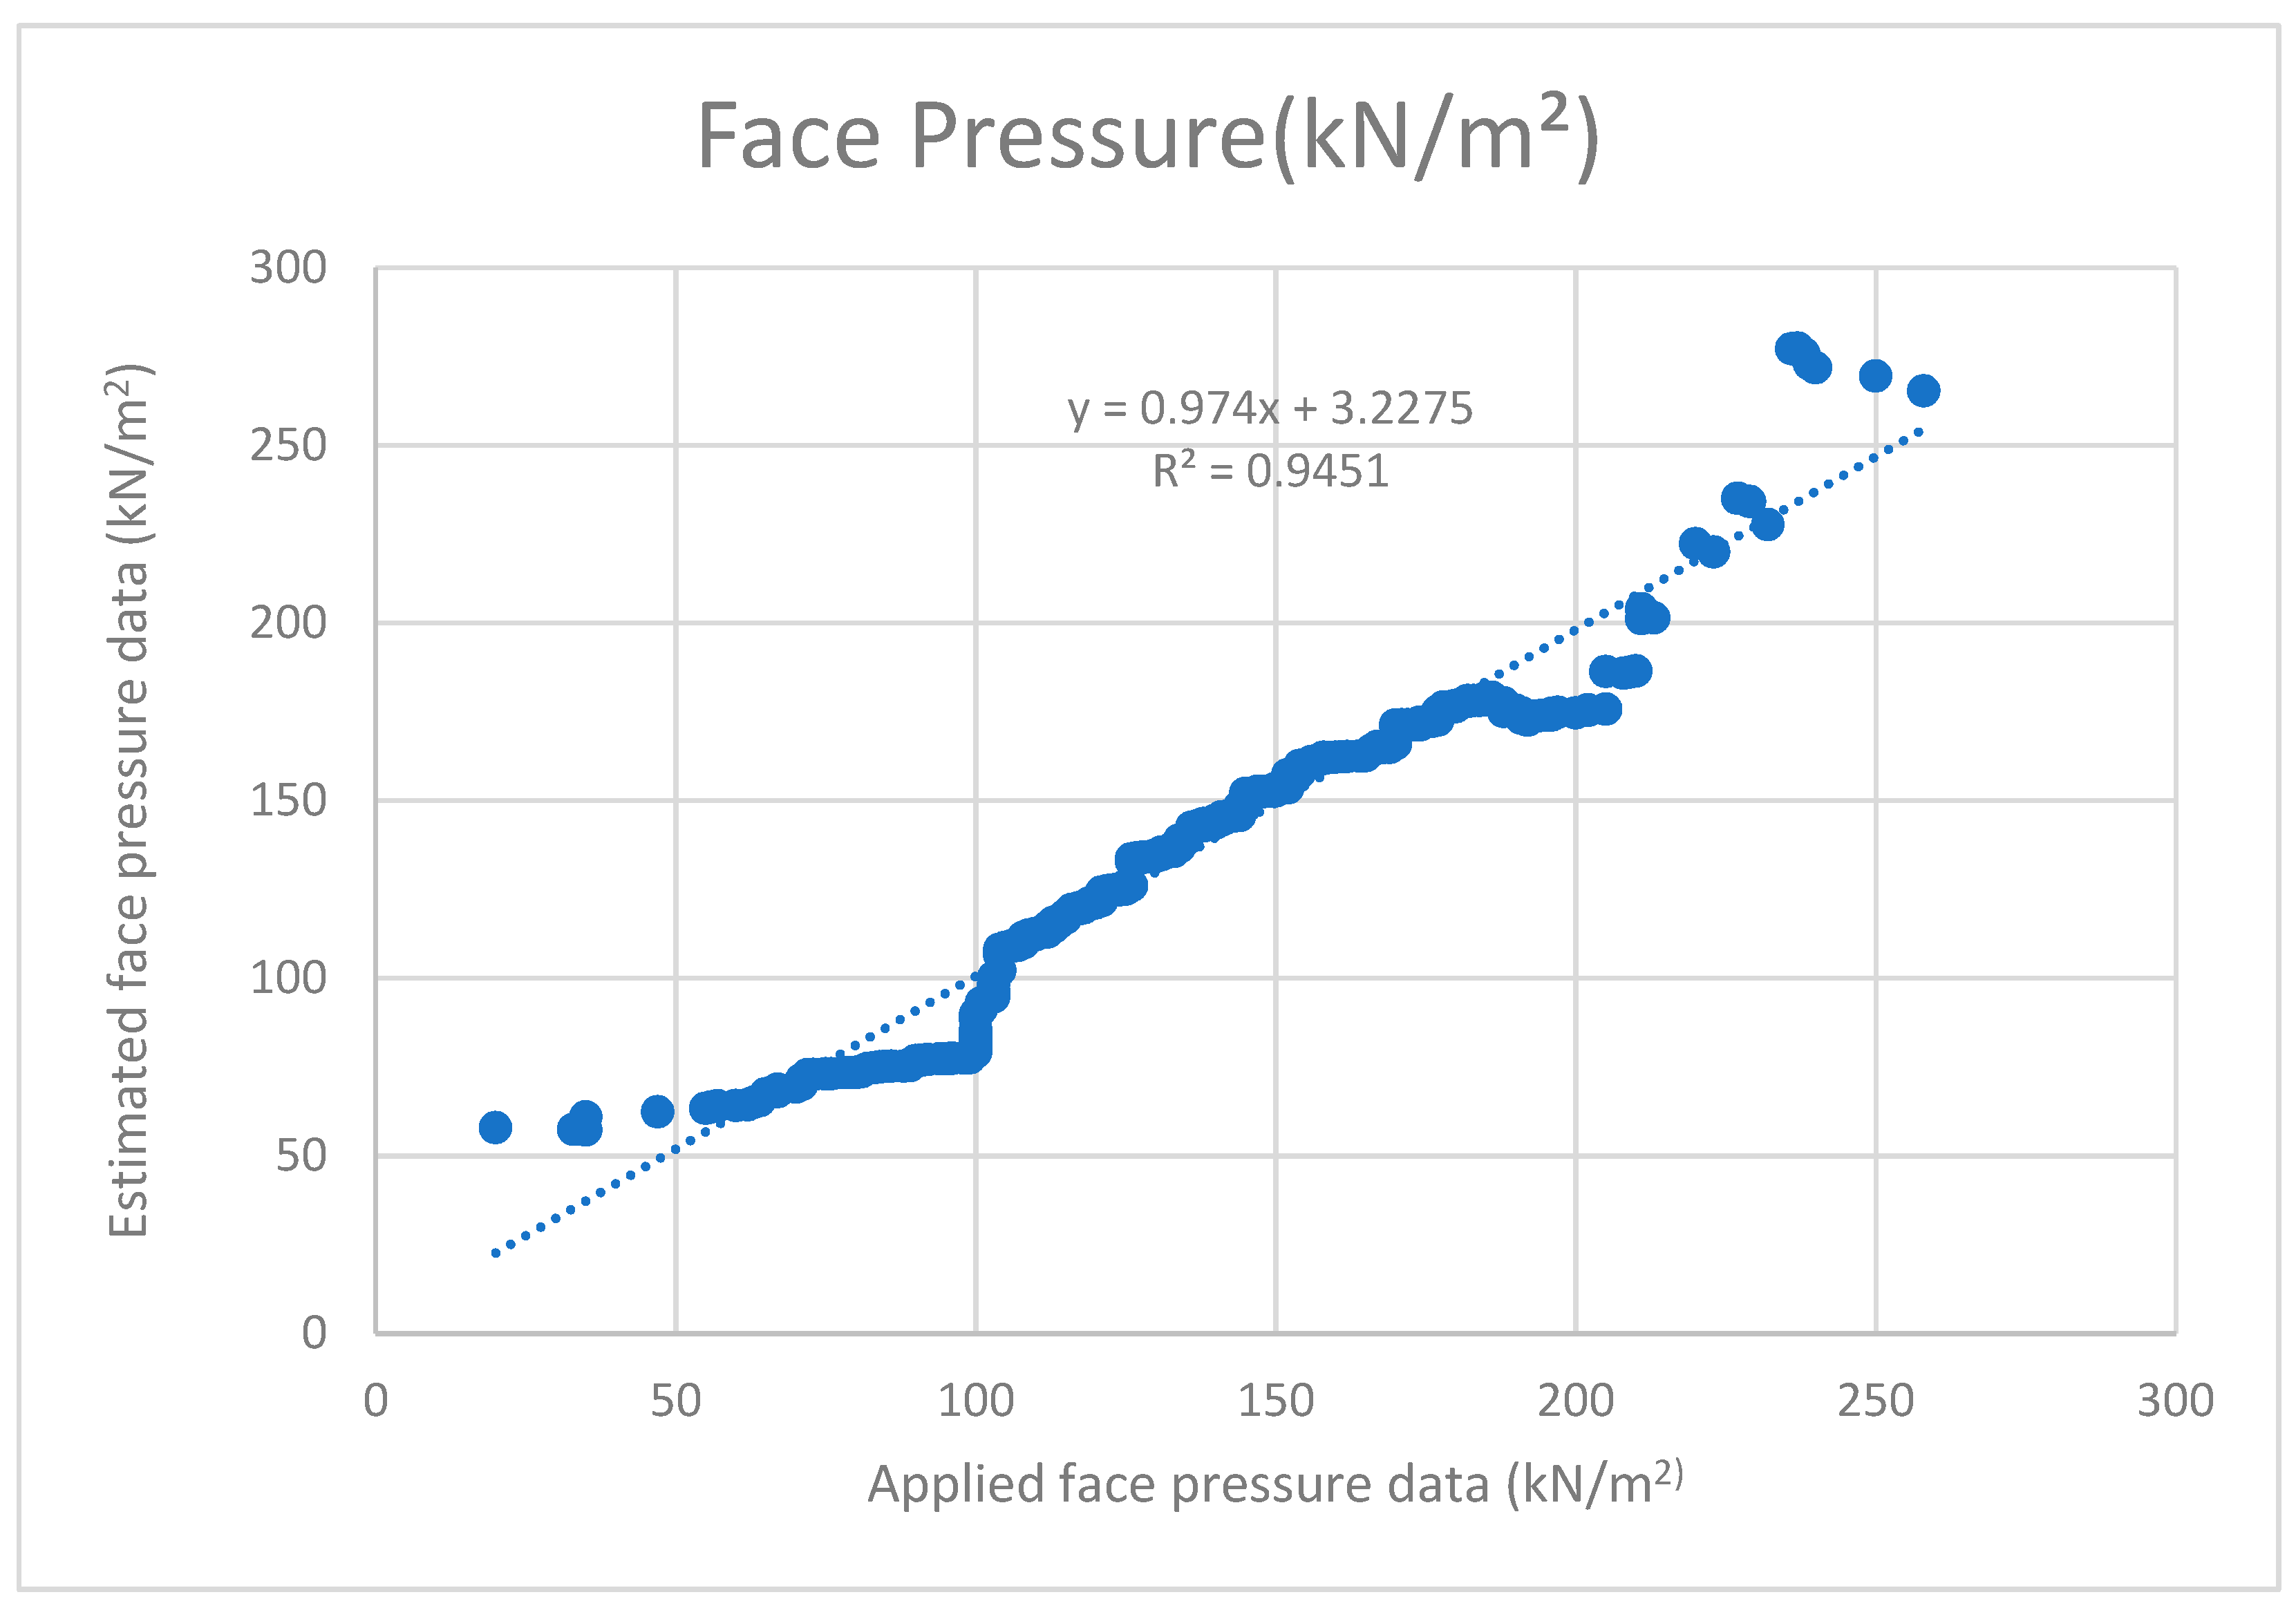
When the face pressure data applied to the excavation surface and the face pressure data calculated from the formula produced within the scope of this research were compared, the regression value R2 ≈ 0.9451 was obtained (Figure 12). The performance of the formula is considered to be significantly good with the high correlation obtained.
5. Numerical Modeling Analysis with the Developed Formula
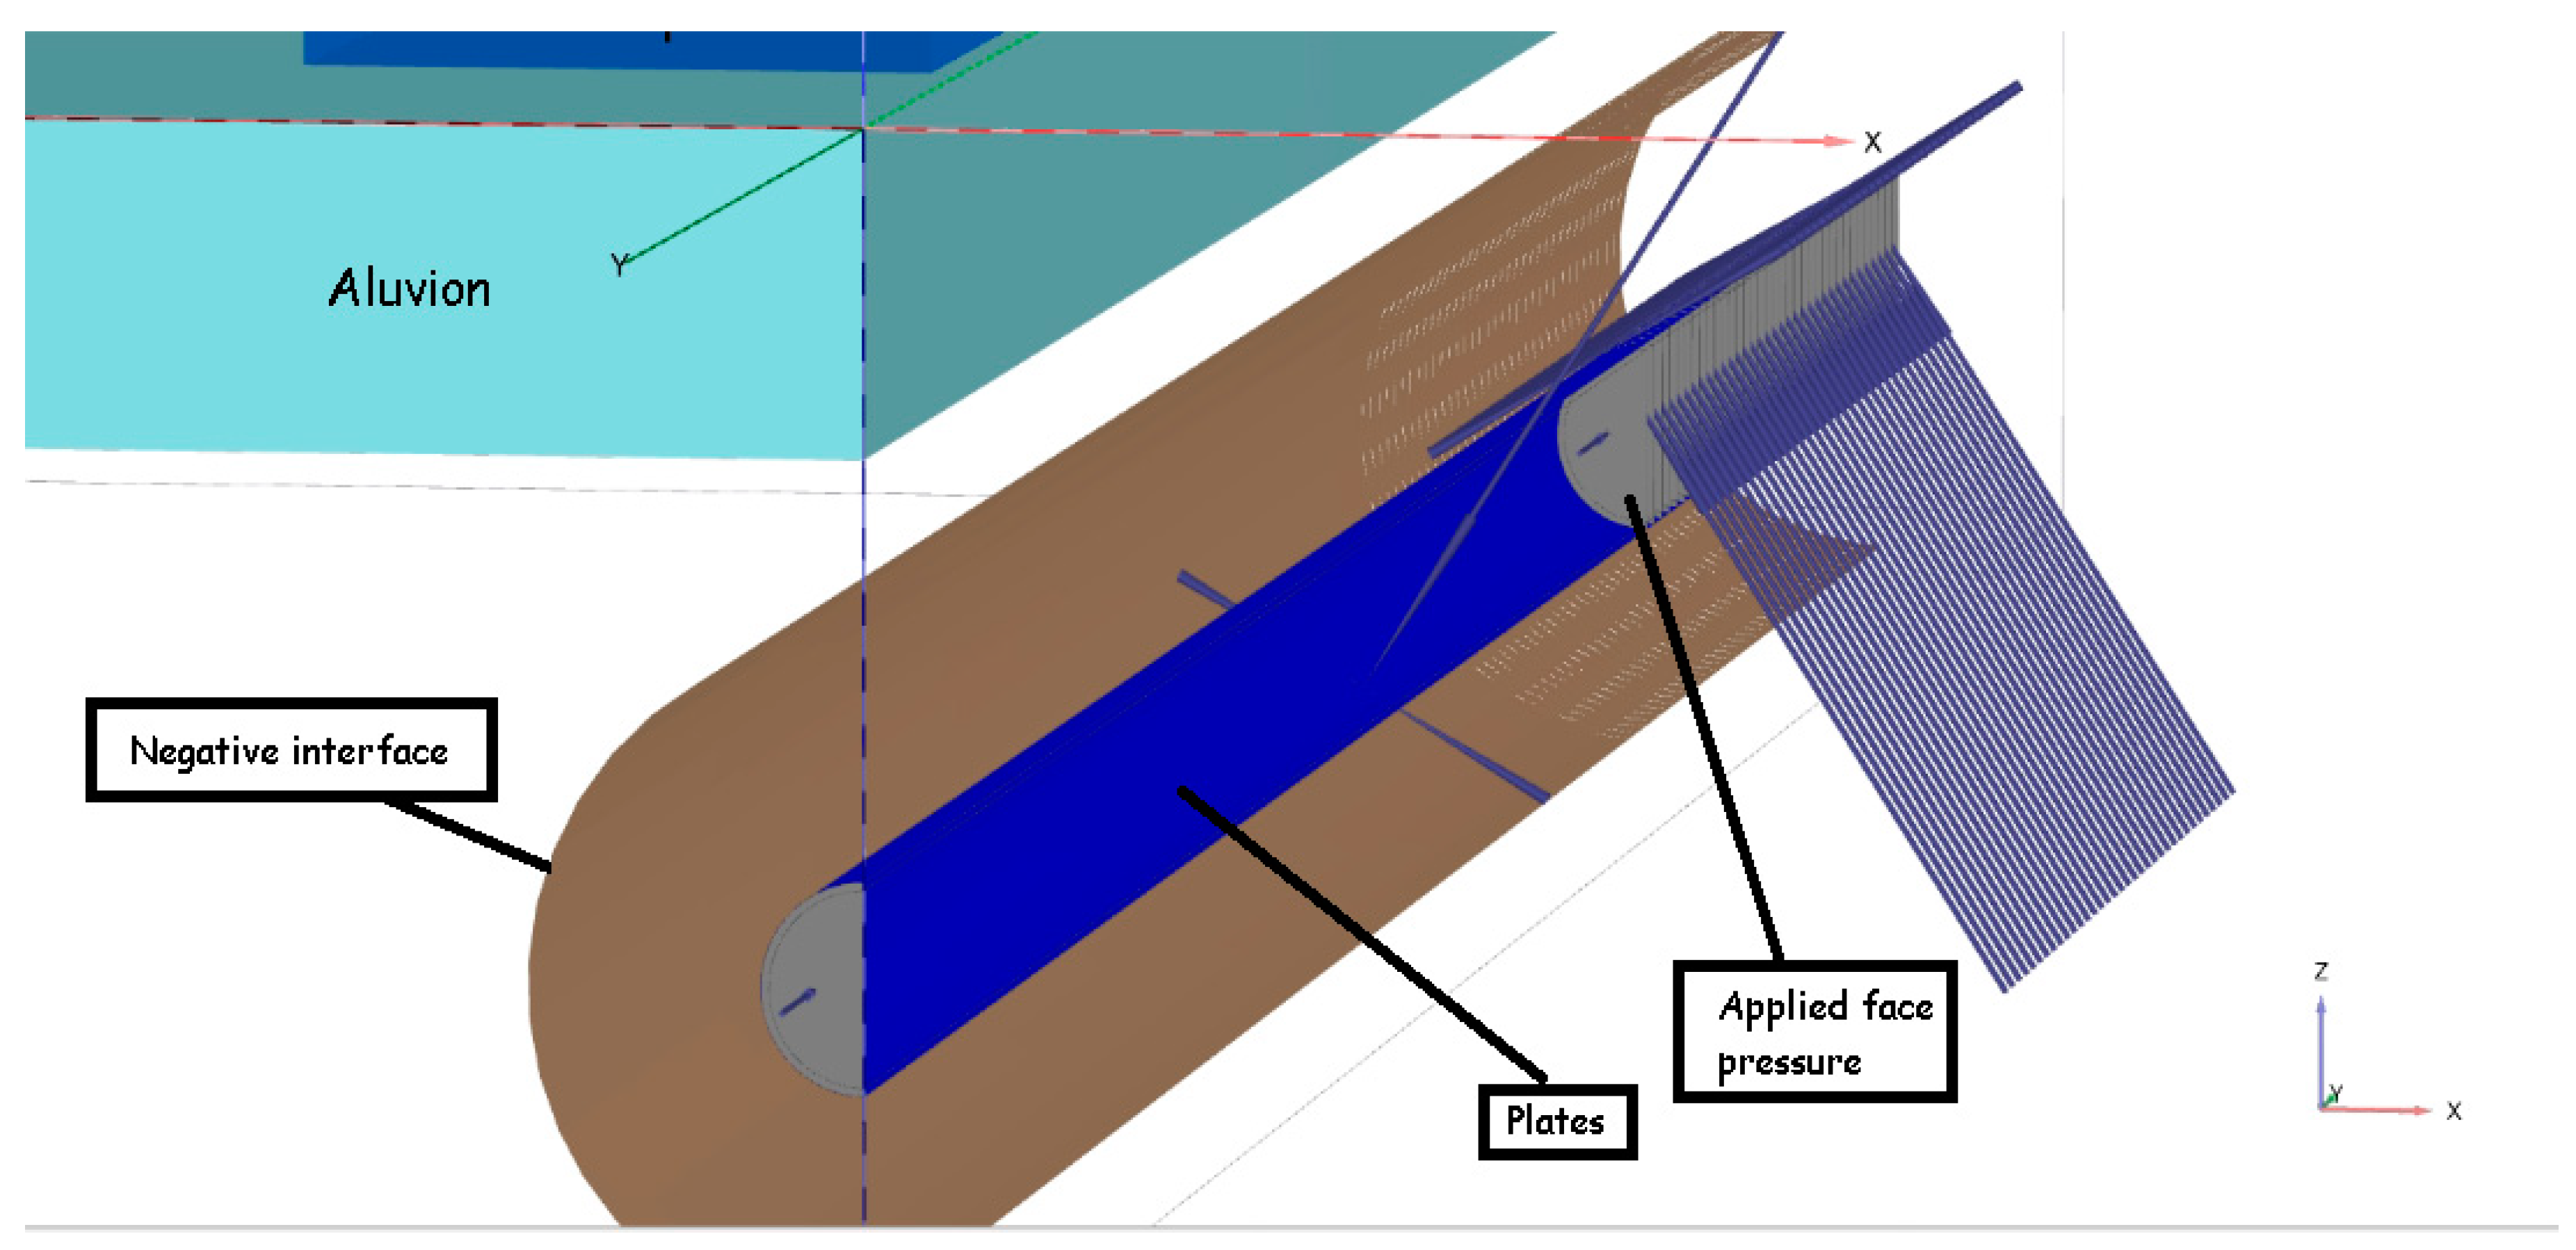
The formula developed within the scope of the research was integrated into the numerical modeling software used with new code which was created by the authors. In this code, all parameters in the formula were defined. The code takes parameters such as model content, groundwater level, strength, etc., from the input file. It calculates the required amount of face pressure using the data in the input file and applies this pressure to the tunnel face. The tunneling methodology is defined as in the software’s tutorial [36]. Numerical modeling analyses are tools that seek an answer to the question of “what is going on” in rock mechanics and enable us to understand the events [37]. In order to see the results of the analyses made with the developed formula and how the formula works, one of the numerical modeling analyses made on the tunnel sections is given. Mohr–Coulomb criteria were used for the rock formation in these analyses. Table 4 shows the rock and its parameters and Table 5 shows structure parameters used in numerical modeling.
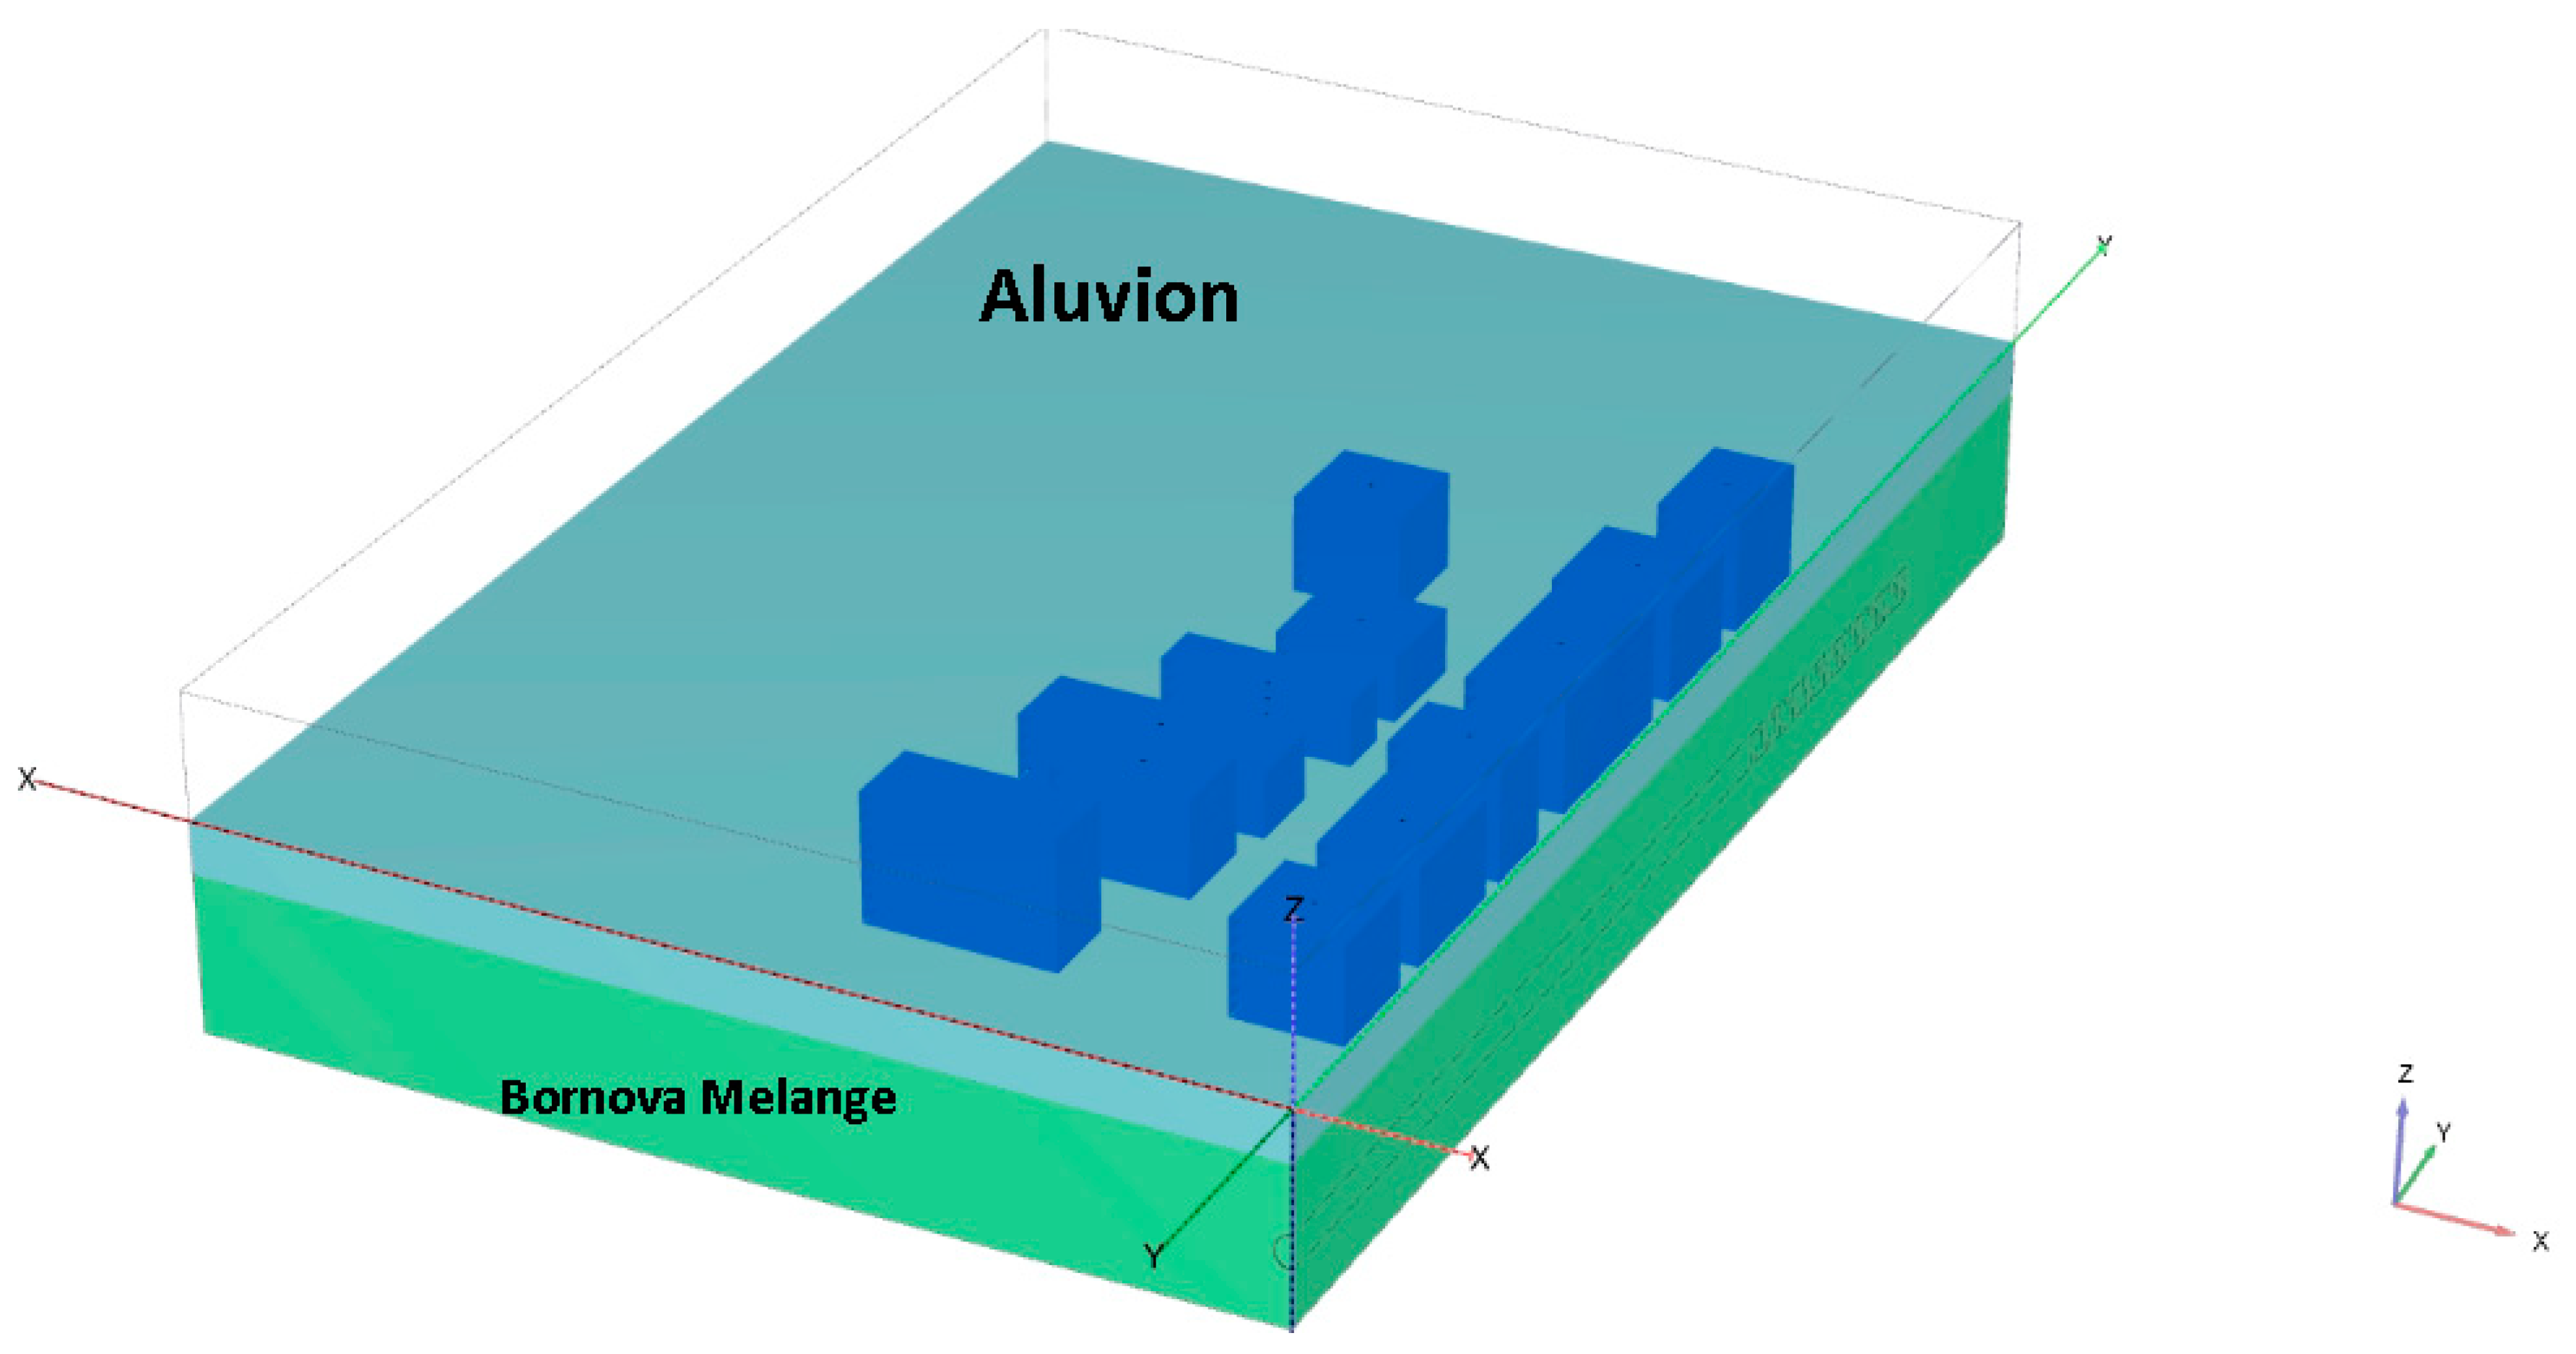
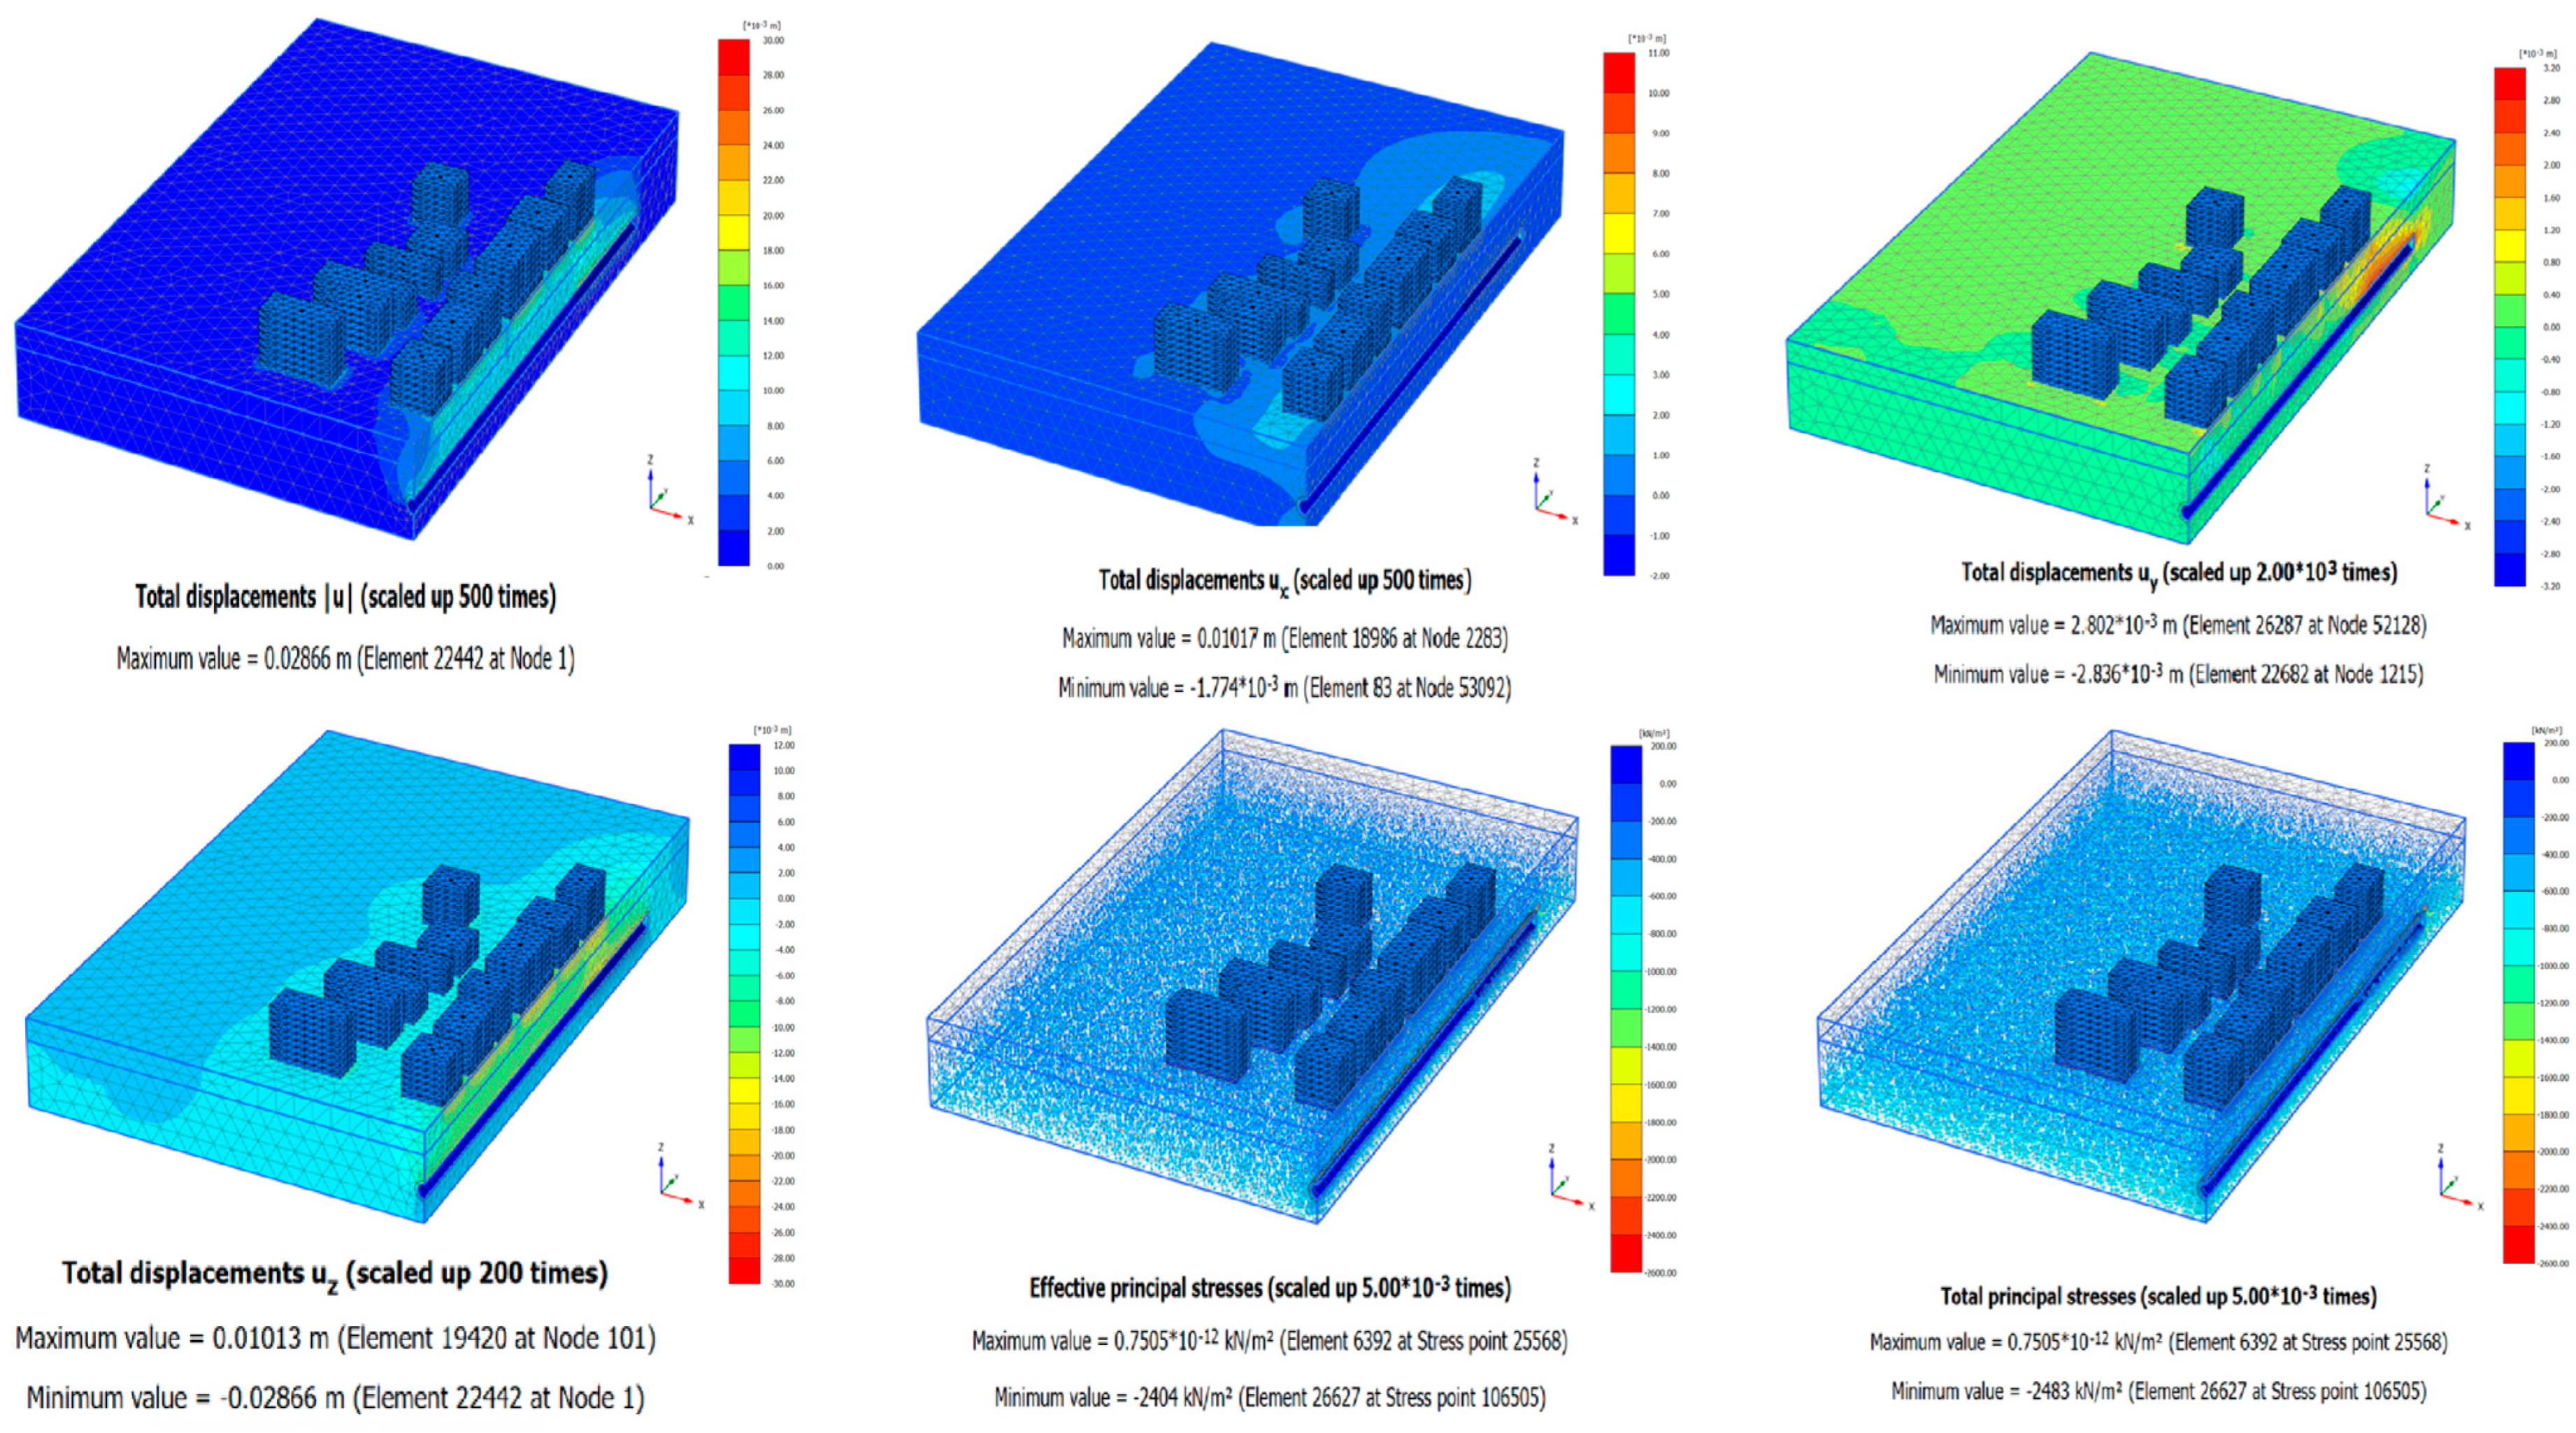
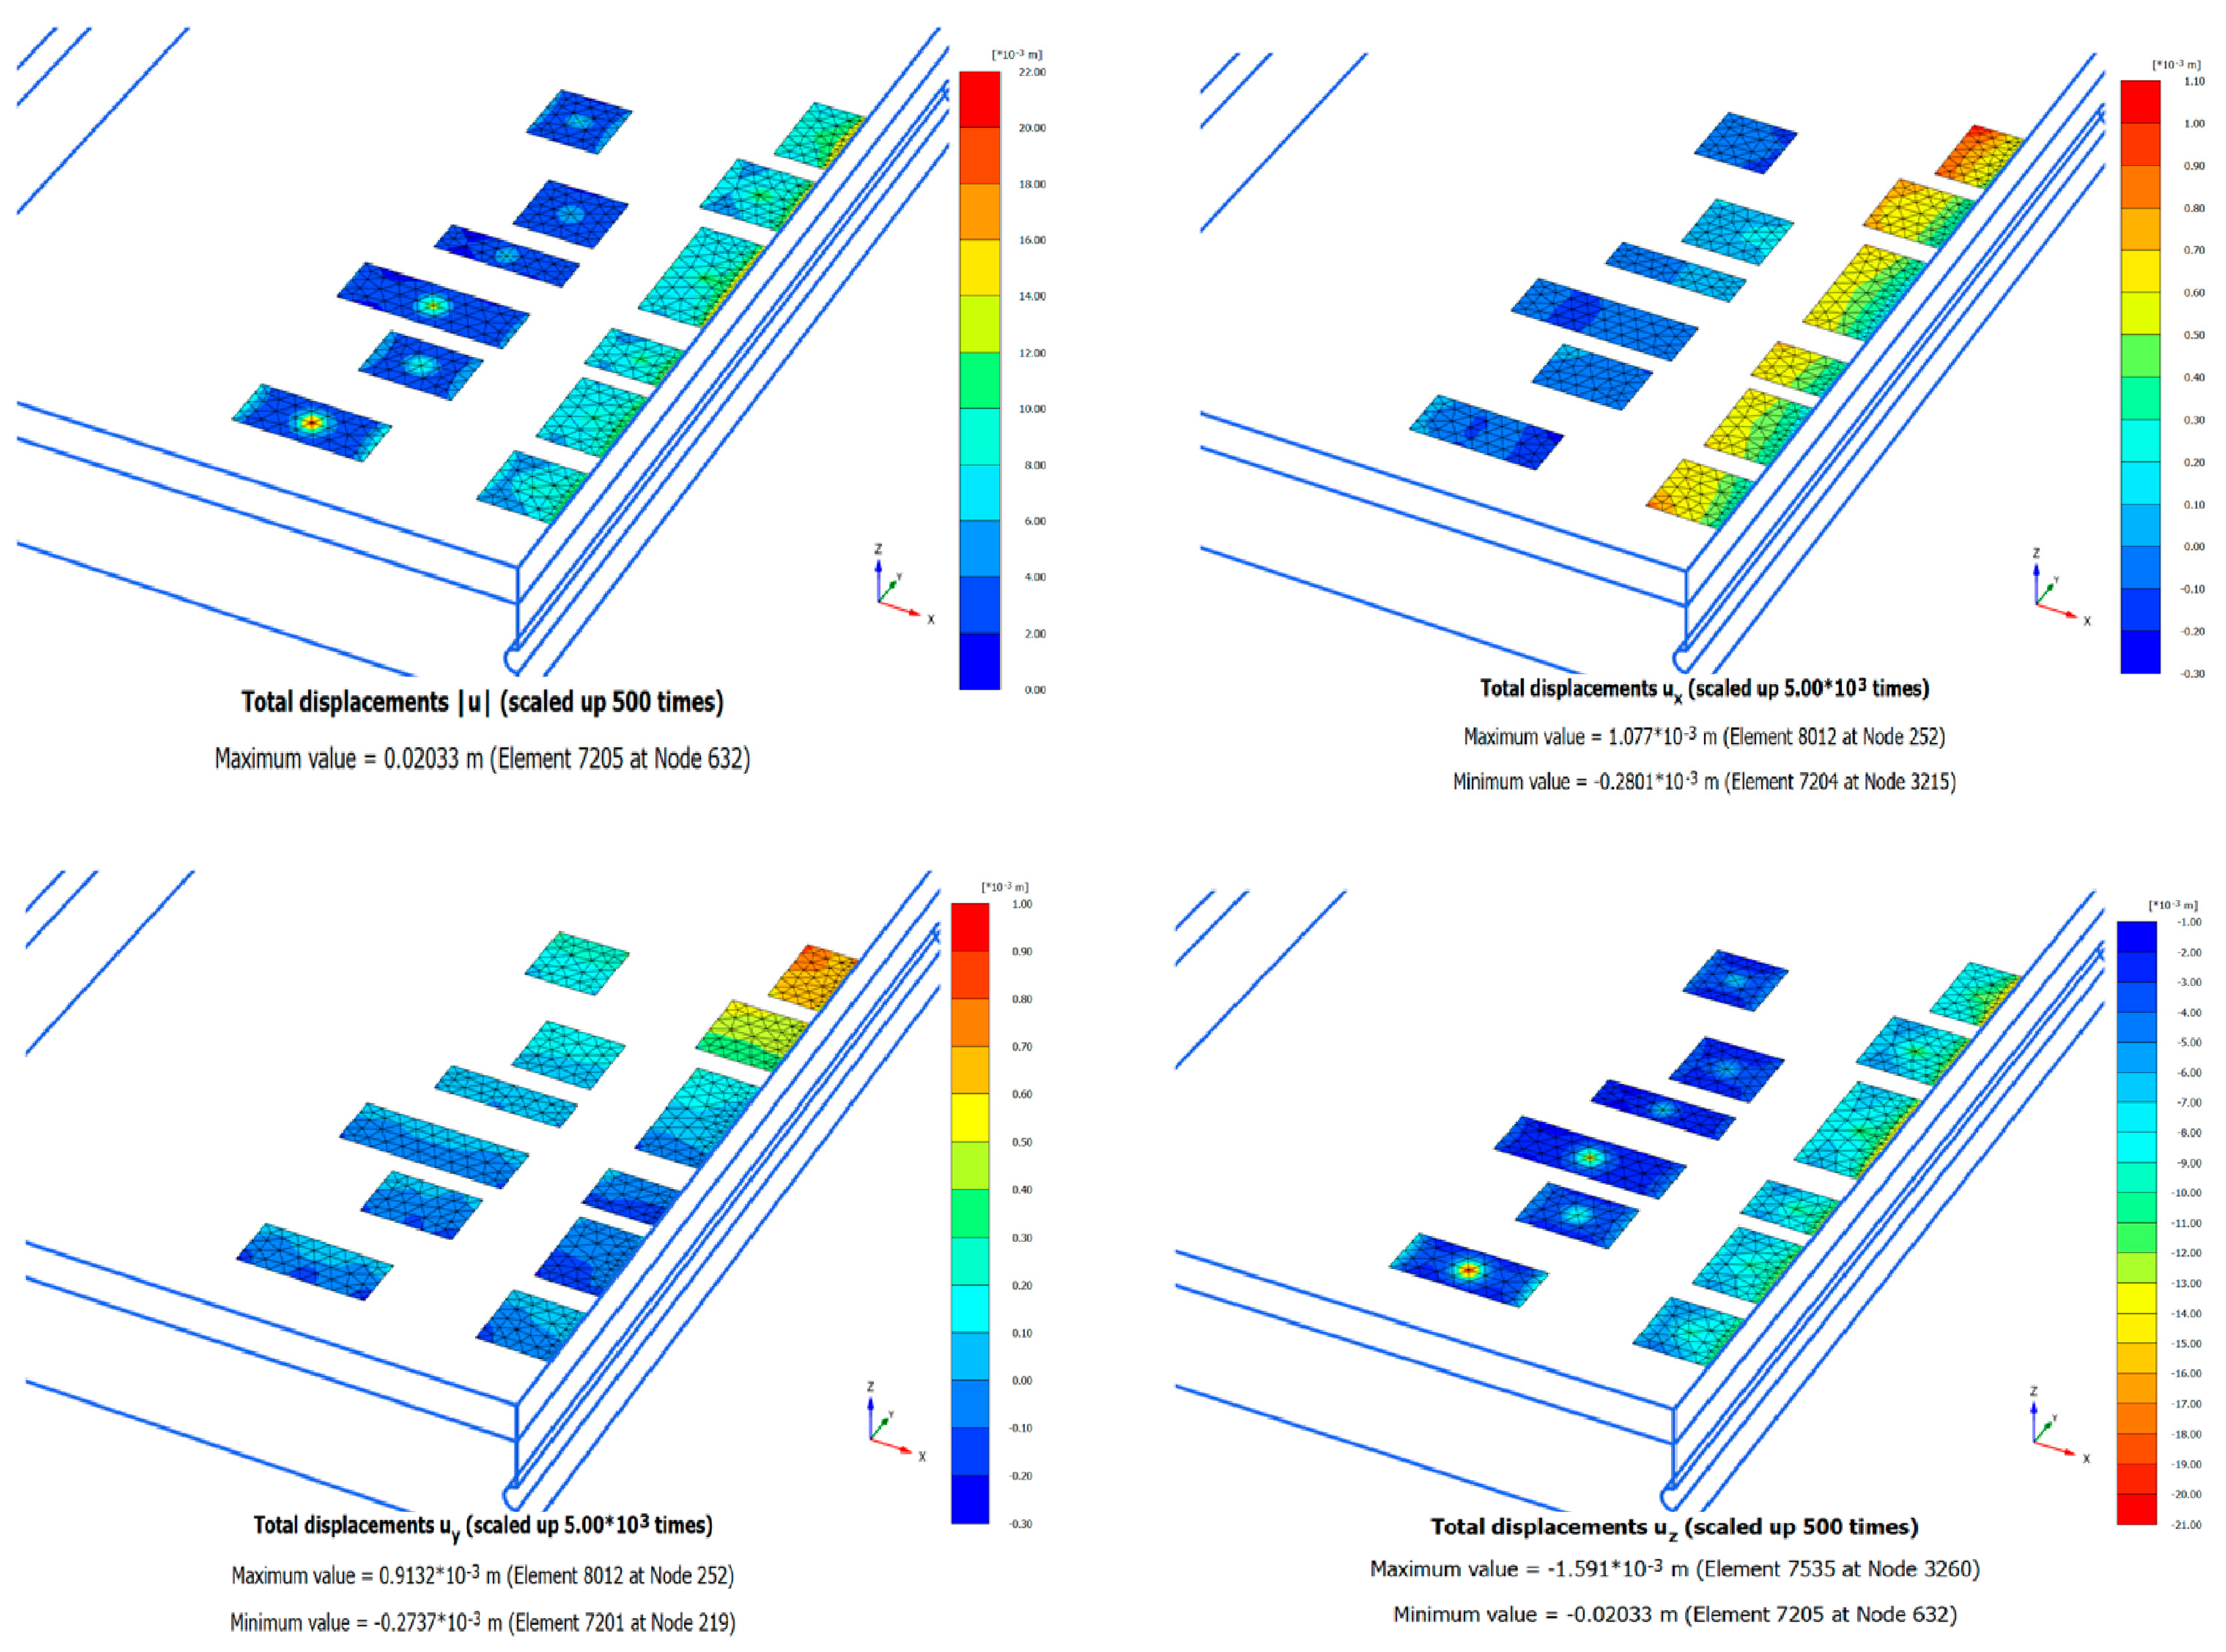
In order to predict the amount of deformation that may occur in the location of the structure, nine structures are integrated into the numerical model. This scenario reflects the area where the tunnel is a small building complex located at Km: 3+215. The first version of the model created for the numerical modeling made with this formula is given in Figure 13. In the newly developed formula, the deformation value is entered as 30 mm. The reason for this is to stay in the safer area. Figure 14 shows the longitudinal profile of the tunnel designed in the model. The modeling results are given in Figure 15, Figure 16 and Figure 17.
In the measurements made during and after the excavation in the tunnel route area, which is the subject of the numerical model, the maximum amount of settlement on the surface in the area where the structures are located is 5.8 mm, and the maximum amount of movement in the lateral direction is 23 mm. As a result of the numerical modeling analysis in which the new formula was integrated, the maximum vertical settlement amount was estimated as 5.2 mm and the horizontal deformation amount was estimated as 28 mm. For the 28 mm settlement, the face pressure is calculated as follows:
These results show that with the newly developed formula, the amount of face pressure that will not only ensure tunnel face stability but also not damage the structures on the surface can be calculated.
6. Conclusions
It can easily be seen that multiple engineering strategies were used while preparing this study. Tunnels have the most prominent place among transportation solutions in big cities where construction is intense. At the same time, it is desirable that the structures are not damaged by these tunnels. EPB-type machines are the best friend of tunnelers in this solution. These machines apply symmetrical loads to the excavation face while performing excavation operations. However, correct face pressure must be applied to avoid damage to structures during the use of these machines. Correct selection of the face pressure prevents the collapse of the tunnel face. Thanks to the new formula developed within the scope of this study, the flows in the tunnel face can be prevented and at the same time, the risk of damage to the structures on the tunnel route is eliminated. This formula considers the three-dimensional position of the structure in addition to the formulas developed previously. In addition to parameters such as the characteristics of the overburden rock on the tunnel, groundwater conditions, and the positional information of the structure used, the face pressure required to be applied along the route can be easily calculated. In Figure 12, the actual mirror pressure data are compared with the mirror pressure data calculated as a result of the formula derived within the scope of the study. As can be seen in the figure, there is a correlation of approximately 94%. In this context, it has been concluded that the results obtained as a result of the formula integrated into the numerical model are highly accurate. The high correlation between the new formula proposed in this study and field measurements will further reduce the risk of damage to the structures on the tunnel route by using the formula.
Author Contributions
Conceptualization H.E.Y. and C.O.A.; Methodology H.E.Y. and C.O.A.; Software H.E.Y. and C.O.A.; Validation H.E.Y. and C.O.A.; Formal analysis H.E.Y. and C.O.A.; Investigation H.E.Y. and C.O.A.; Resources H.E.Y. and C.O.A.; Data Curation H.E.Y. and C.O.A.; writing—original draft preparation H.E.Y. and C.O.A.; Writing—review and editing H.E.Y.; Visualization H.E.Y. and C.O.A.; Supervision C.O.A.; Project administration C.O.A.; Funding acquisition H.E.Y. and C.O.A. All authors have read and agreed to the published version of the manuscript.
Funding
This research received no external funding.
Data Availability Statement
Data are contained within the article.
Acknowledgments
This project, STB Code: 053336, was supported by Dokuz Eylul University, Technology Development Zone (DEPARK). The authors thank DEPARK for their support of the project. At the same time, the authors thank Marilena CARDU for providing a research opportunity at Politechnico di Torino-DIATTI.
Conflicts of Interest
The authors declare no conflict of interest.
References
- Guglielmetti, V.; Grasso, P.; Mahtap, A.; Xu, S. Mechanized Tunnelling in Urban Areas Design Methodology and Construction Control; Taylor and Francis: Abingdon, UK, 22 October 2007. [Google Scholar]
- Ozacar, V. New methodology to prevent blasting damages for shallow tunnel. Geomech. Eng. 2018, 15, 1227–1236. [Google Scholar]
- Aksoy, C.O.; Safak, S.; Uyar, G.G.; Ozacar, V. A new mathematical approach for representing the deformation mechanism of rocks under constant load. Géotechnique Lett. 2018, 8, 80–90. [Google Scholar] [CrossRef]
- Chen, S.L.; Gui, M.W.; Yang, M.C. Applicability of the principle of superposition in estimating ground surface settlement of twin-and quadruple-tube tunnels. Tunn. Undergr. Space Technol. 2012, 28, 135–149. [Google Scholar] [CrossRef]
- Huang, X.; Huang, H.; Zhang, J. Flattening of jointed shield-driven tunnel induced by longitudinal differential settlements. Tunn. Undergr. Space Technol. 2012, 31, 20–32. [Google Scholar] [CrossRef]
- Avunduk, E.; Copur, H. Empirical modeling for predicting excavation performance of EPB TBM based on soil properties. Tunn. Undergr. Space Technol. 2018, 71, 340–353. [Google Scholar] [CrossRef]
- Bilgin, N.; Copur, H.; Balci, C. Mechanical Excavation in Mining and Civil Industries; CRC Press: Boca Raton, FL, USA, 2013. [Google Scholar]
- Copur, H.; Tuncdemir, H.; Bilgin, N.; Dincer, T. Specific energy as a criterion for the use of rapid excavation systems in Turkish mines. Min. Technol. 2001, 110, 149–157. [Google Scholar] [CrossRef]
- Herrenknecht, M.; Watts, D. EPB or slurry machine = the choice. Tunn. Ve Tunn. 1994, 26, 35–36. [Google Scholar]
- Herrenknecht, M.; Rehm, U. Mechanized full face tunneling. In Proceedings of the ITA/AITES-Training Course, World Tunnel Congress, Istanbul, Turkey, 7–12 May 2005. [Google Scholar]
- Lovat, R.P.; Eng, P. TBM design considerations: Selection of earth pressure balance or slurry pressure balance tunnel boring machines. In New Advanced Methods of Tunnel Engineering; TeE: Athens, Greece, 2007. [Google Scholar]
- Maidl, U.; Wingmann, J. Predicting the performance of earth pressure shields in loose rock. Geomech. Tunn. 2009, 2, 189–197. [Google Scholar] [CrossRef]
- Rehm, U. Big challenges in Turkey for mechanized tunneling. In Proceedings of the 2nd Underground Excavation Symposium for Transportation, İstanbul, Turkey, 15–17 October 2007; pp. 17–24. [Google Scholar]
- Xie, X.; Yang, Y.; Ji, M. Analysis of ground surface settlement induced by the construction of a large-diameter shield-driven tunnel in Shanghai, China. Tunn. Undergr. Space Technol. 2016, 51, 120–132. [Google Scholar] [CrossRef]
- Cinar, M.; Feridunoglu, C. Tunneling Machines (TBM). 2020. Available online: https://docplayer.biz.tr/2643897-Tunel-acma-makineleri-tbm.html (accessed on 12 April 2020). (In Turkish).
- Mahmoodzadeh, A.; Mohammadi, M.; Daraei, A.; Ali, H.F.H.; Al-Salihi, N.K.; Omer, R.M.D. Forecasting maximum surface settlement caused by urban tunneling. Autom. Constr. 2020, 120, 103375. [Google Scholar] [CrossRef]
- Skempton, A.W.; MacDonald, D.H. The allowable settlements of buildings. Proc. Inst. Civ. Eng. 1956, 5, 727–768. [Google Scholar] [CrossRef]
- Arioglu, B.; Yuksel, A.; Arioglu, E. Ground pressure balancing tunnel method (EPBM) application in Izmir metro Ummuhan main tunnel. In Proceedings of the 9th Soil Mechanics and Foundation Engineering Congress, Tokyo, Japan, 21–22 October 2002. (In Turkish). [Google Scholar]
- Broms, B.B.; Bennermark, H. Stability of clay at vertical opening. J. Soil Mech. Found. Div. 1967, 93, 71–94. [Google Scholar] [CrossRef]
- Peck, R.B. Deep excavations and tunneling in soft ground. In Proceedings of the 7th International Conference on Soil Mechanics and Foundation Engineering, Mexico City, Mexico, 25–29 August 1969; pp. 225–290. [Google Scholar]
- Mitchell, R.J. Earth mechanics in earth structures engineering. In Earth Structures Engineering; Springer: Dordrecht, The Netherlands, 1983; pp. 38–86. [Google Scholar]
- Schmidt, B. Settlements and Ground Movements Associated with Tunneling in Soil; University of Illinois at Urbana-Champaign: Champaign, IL, USA, 1969. [Google Scholar]
- Arioglu, E.; Arioglu, E.; Odbay, O. Estimation of the Parameters of Surface Strain Resulting from the Drilling of Shallow and Medium Deep Underground Engineering Structures. In Proceedings of the 4th Soil Mechanics and Foundation Engineering Congress, Istanbul, Turkey, 22–23 October 1992. (In Turkish). [Google Scholar]
- Anagnostou, G.; Kovári, K. Face stability conditions with earth-pressure-balanced shields. Tunn. Undergr. Space Technol. 1996, 11, 165–173. [Google Scholar] [CrossRef]
- Horn, M. Some Results of Six-Six Horizontal Fold Pressure Tests on the Face Safety of Tunnels. Presentations of the Deep Construction Industry Conference in Orszégos, Kdzlekedesi Dokumentacios Vallalatt, Budapest (in Hungarian), See Also Horizontal Earth Pressure on Vertical Faces of Tumuli. National Conference of the Hungarian Civil Engineering Industry, Budapest (in German), (German transalation, STUVA, Dtisseldorf). 1961. Available online: https://www.scribd.com/document/525179912/Anagnostou-G-Kovari-K-Face-stability-conditions-with-Earth-Pressure-Balance-Shields (accessed on 1 January 2024).
- Erdogan, B. Stratigraphic features and tectonic evolution of the Izmir-Ankara Zone in the region between İzmir and Seferihisar. TPDJ Newsl. 1990, 2, 1–20. (In Turkish) [Google Scholar]
- Boray, A.; Akat, U.; Akdeniz, N.; Akcoren, Z.; Caglayan, A.; Gunay, E.; Korkmazer, B.; Oztürk, E.M.; Sav, H. Some important problems along the southern edge of the Menderes Massif and their possible solutions. In Proceedings of the 50th Anniversary Earth Sciences Congress of the Republic, Ankara, Turkey, 17–19 December 1973; Volume 50, pp. 11–20. (In Turkish). [Google Scholar]
- Caglayan, A.; Ozturk, E.; Ozturk, Z.; Halit, S.; Umur, A. Findings and structural interpretation from the south of the Menderes Massif. J. Geol. Eng. 1980, 4, 9–18. (In Turkish) [Google Scholar]
- Konak, N.; Akdeniz, N.; Ozturk, E.M.; Doyuran, S. Geology of the south of Menderes Massif. IGCP Proj. 1987, 5, 42–53. [Google Scholar]
- Brinkmann, R. Mesozoic troughs and crustal structure in Anatolia. Geol. Soc. Am. Bull. 1972, 83, 819–826. [Google Scholar] [CrossRef]
- Ramazanoglu, I. Active Tectonics and Seismicity of Balcova District and Its Surroundings: Comparison of Geological and Seismological Data. Master’s Dissertation, Eylul University, İzmir, Turkey, 2008. (In Turkish). [Google Scholar]
- Inci, U.; Sozbilir, H.; Sumer, O.; Erkul, F. The reason for the earthquakes between Urla and Balikesir is a fossil fault. Repub. Sci. Tech. J. 2003, 21, 7–8. (In Turkish) [Google Scholar]
- Kaya, O. Stratigraphy and tectonics of the Middle East Aegean depression (Neogene). Bull. Turk. Geol. Inst. 1979, 22, 35–58. (In Turkish) [Google Scholar]
- Savascin, Y. Mineralogical and Geochemical Investigation and Origin Interpretation of Foca-Urla Neogene Volcanites. Doctoral Dissertation, Eylul University, İzmir, Turkey, 1978. (In Turkish). [Google Scholar]
- Sozbilir, H.; Kocer, T.; Demirtas, R.; Uzel, B.; Ersoy, Y.; Akgun, M.; Ozkaymak, C. Paleoseismological studies on Seferihisar-Yelki Fault Zone: Evidence for active normal faulting on strike-slip fault zone. In Proceedings of the 10th Meeting of Active Tectonics Research Group, Abstracts, İzmir, Turkey, 2–4 October 2006; pp. 76–77. (In Turkish). [Google Scholar]
- Plaxis 3D Tutorial. 2020. Available online: https://communities.bentley.com/cfs-file/__key/communityserver-wikis-components-files/00-00-00-05-58/3513.PLAXIS3DCE_2D00_V20.02_2D00_1_2D00_Tutorial.pdf (accessed on 1 January 2024).
- Alejano, L.R.; Gui, J.Y.; González-Fernández, M.A.; Pérez-Rey, I.; Muñiz, M. Toppling of a rock block resting on a rough surface. In IOP Conference Series: Earth and Environmental Science; IOP Publishing: Helsinki, Finland, 2023; Volume 1124, No. 1; p. 012054. [Google Scholar]
Figure 1.
Pressures on the tunnel face and surface settlement [18].
Figure 1.
Pressures on the tunnel face and surface settlement [18].


Figure 3.
The forces acting on the wedge surface in front of the face [24].
Figure 3.
The forces acting on the wedge surface in front of the face [24].

Figure 4.
The location map of the study area.

Figure 7.
Three-dimensional solid model created with data obtained from surface GPR measurements between KM of the route: 1+720 − 2+780.
Figure 7.
Three-dimensional solid model created with data obtained from surface GPR measurements between KM of the route: 1+720 − 2+780.

Figure 8.
Image from the GPR measurements made from the tunnel face between KM: 1+720 − 2+780 of the route.
Figure 8.
Image from the GPR measurements made from the tunnel face between KM: 1+720 − 2+780 of the route.

Figure 9.
Merging cloud points produced with LIDAR and georeferencing.

Figure 10.
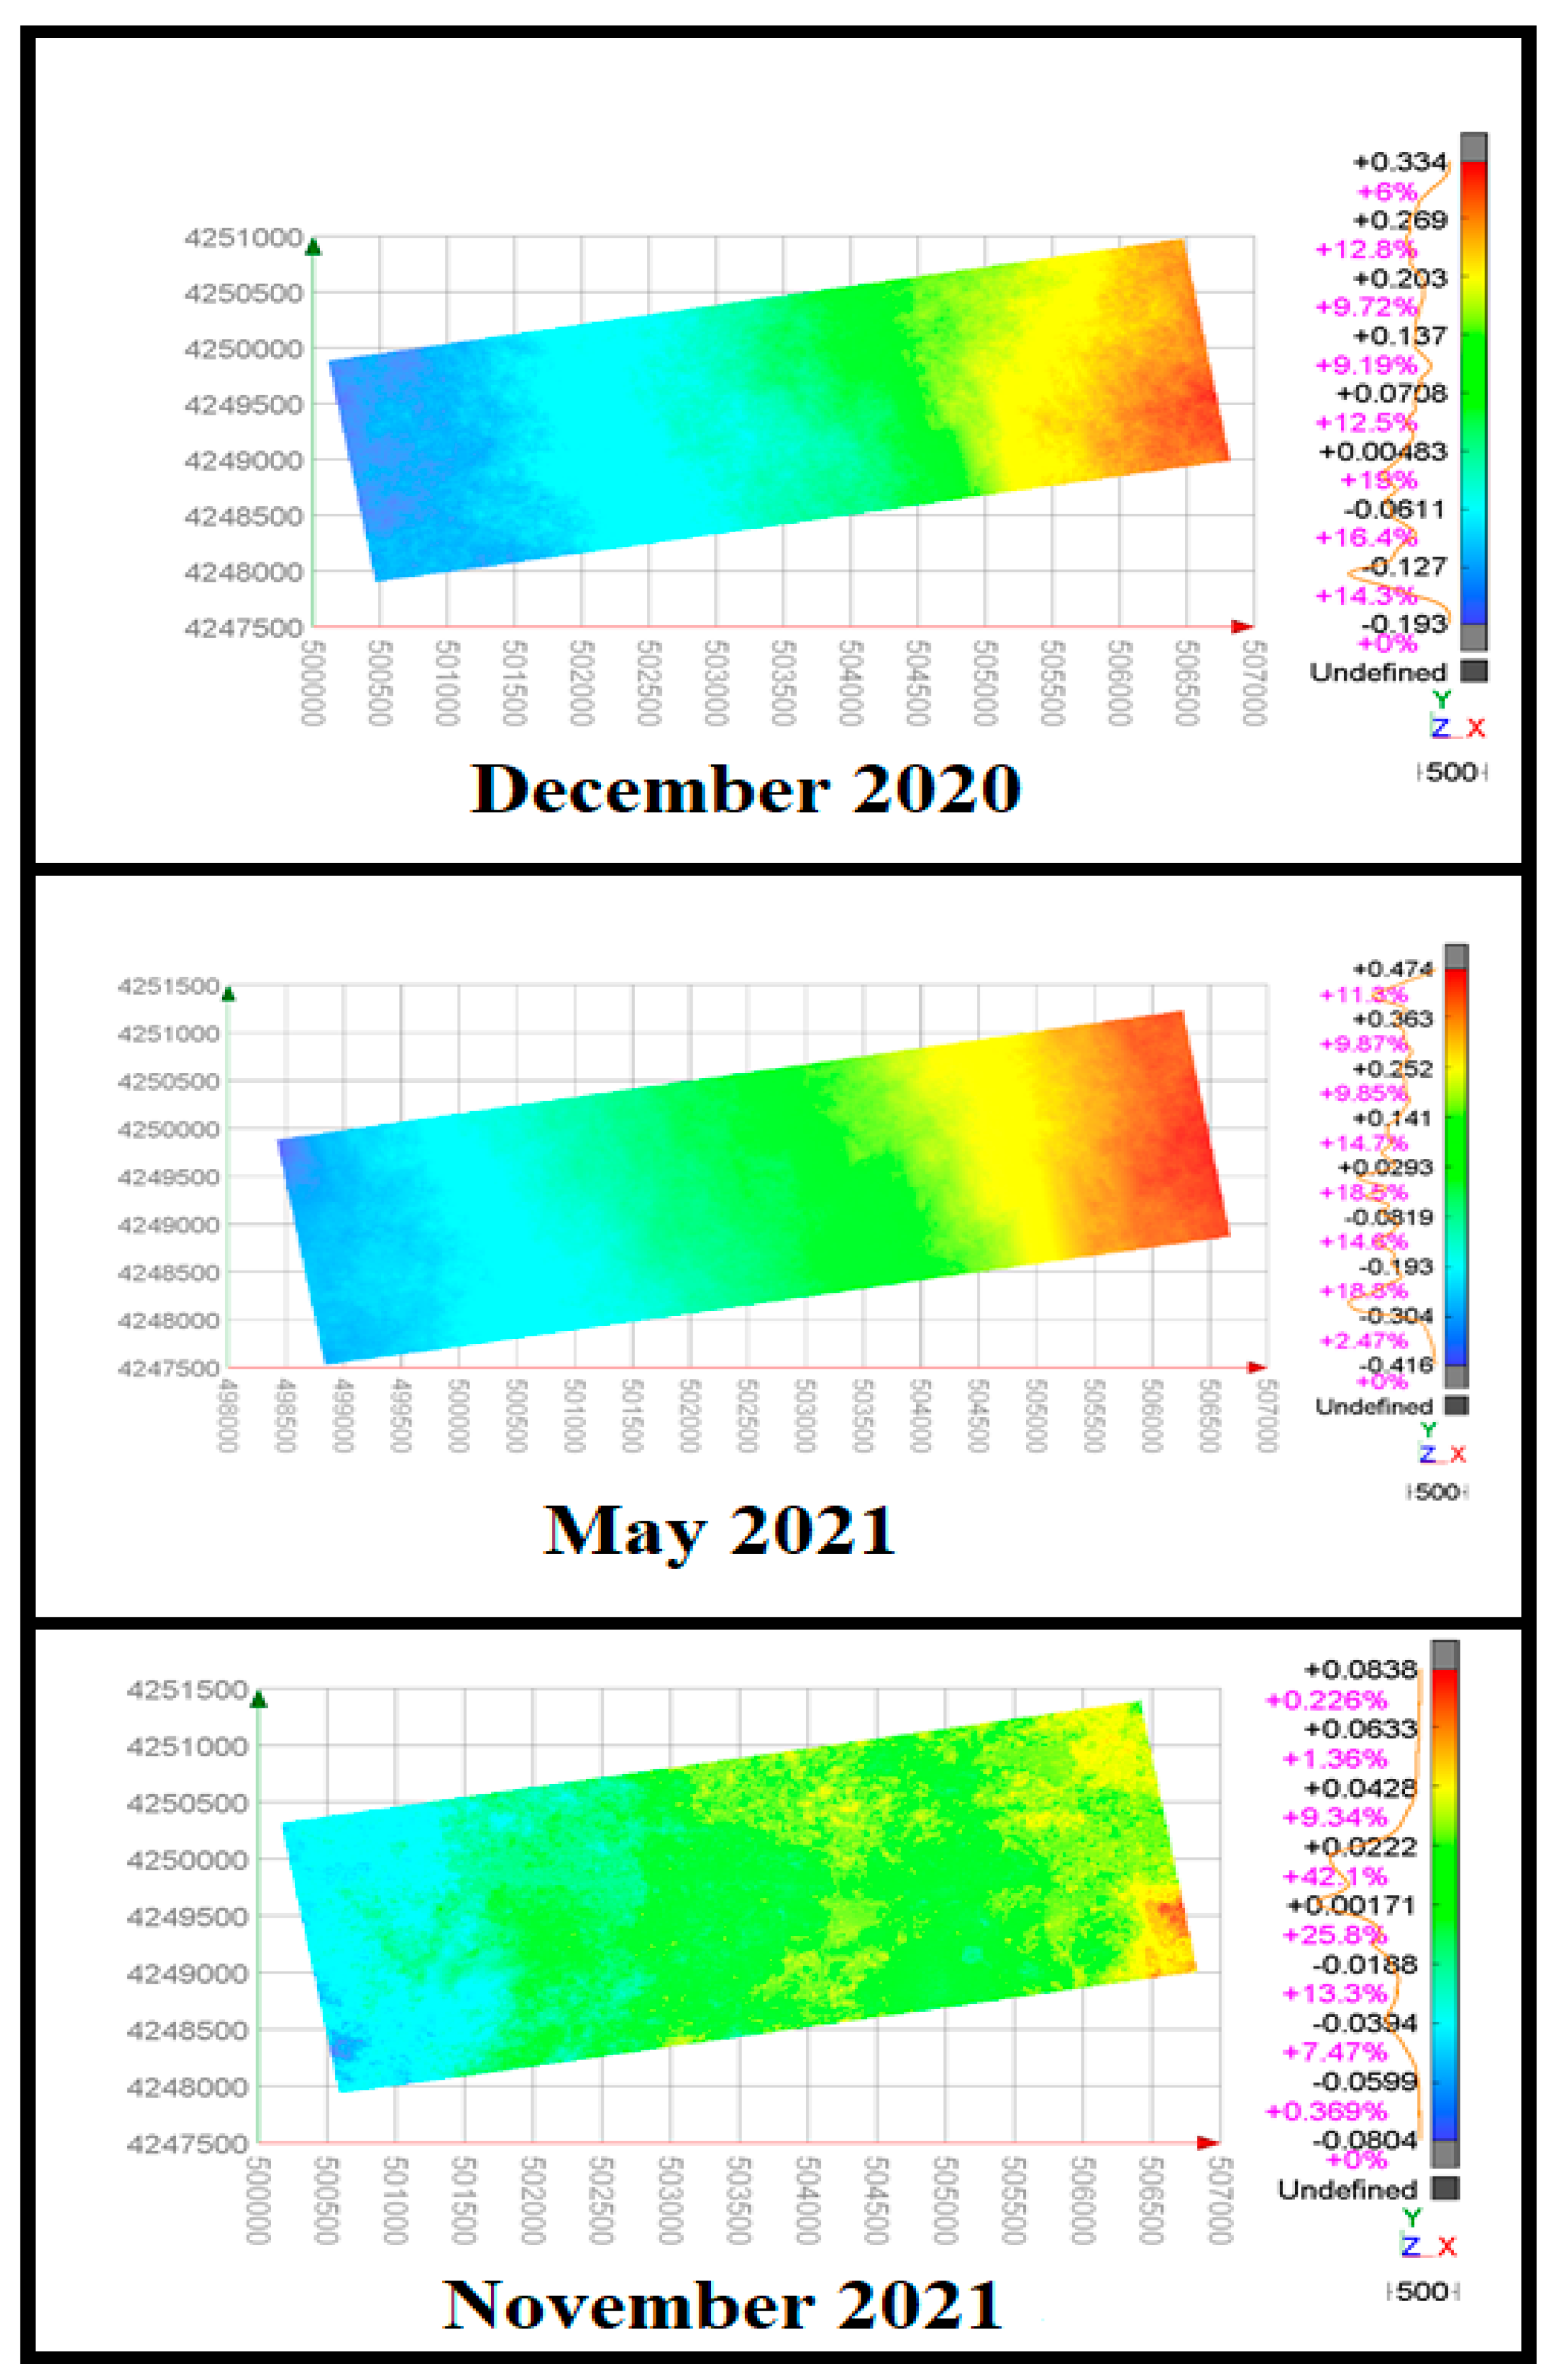
Surface deformation measurements made on different dates within the scope of the research.
Figure 10.
Surface deformation measurements made on different dates within the scope of the research.

Figure 11.
Representation of the positional angle of the structure with the tunnel face for the developed formula.
Figure 11.
Representation of the positional angle of the structure with the tunnel face for the developed formula.

Figure 12.
Comparison of applied face pressure data with estimated face pressure data.

Figure 13.
Principle view of the model.

Figure 14.
Longitudinal profile of the tunnel designed in the model.

Figure 15.
Results of numerical modeling analysis (for whole model).

Figure 16.
Results of numerical modeling analysis (for basements).

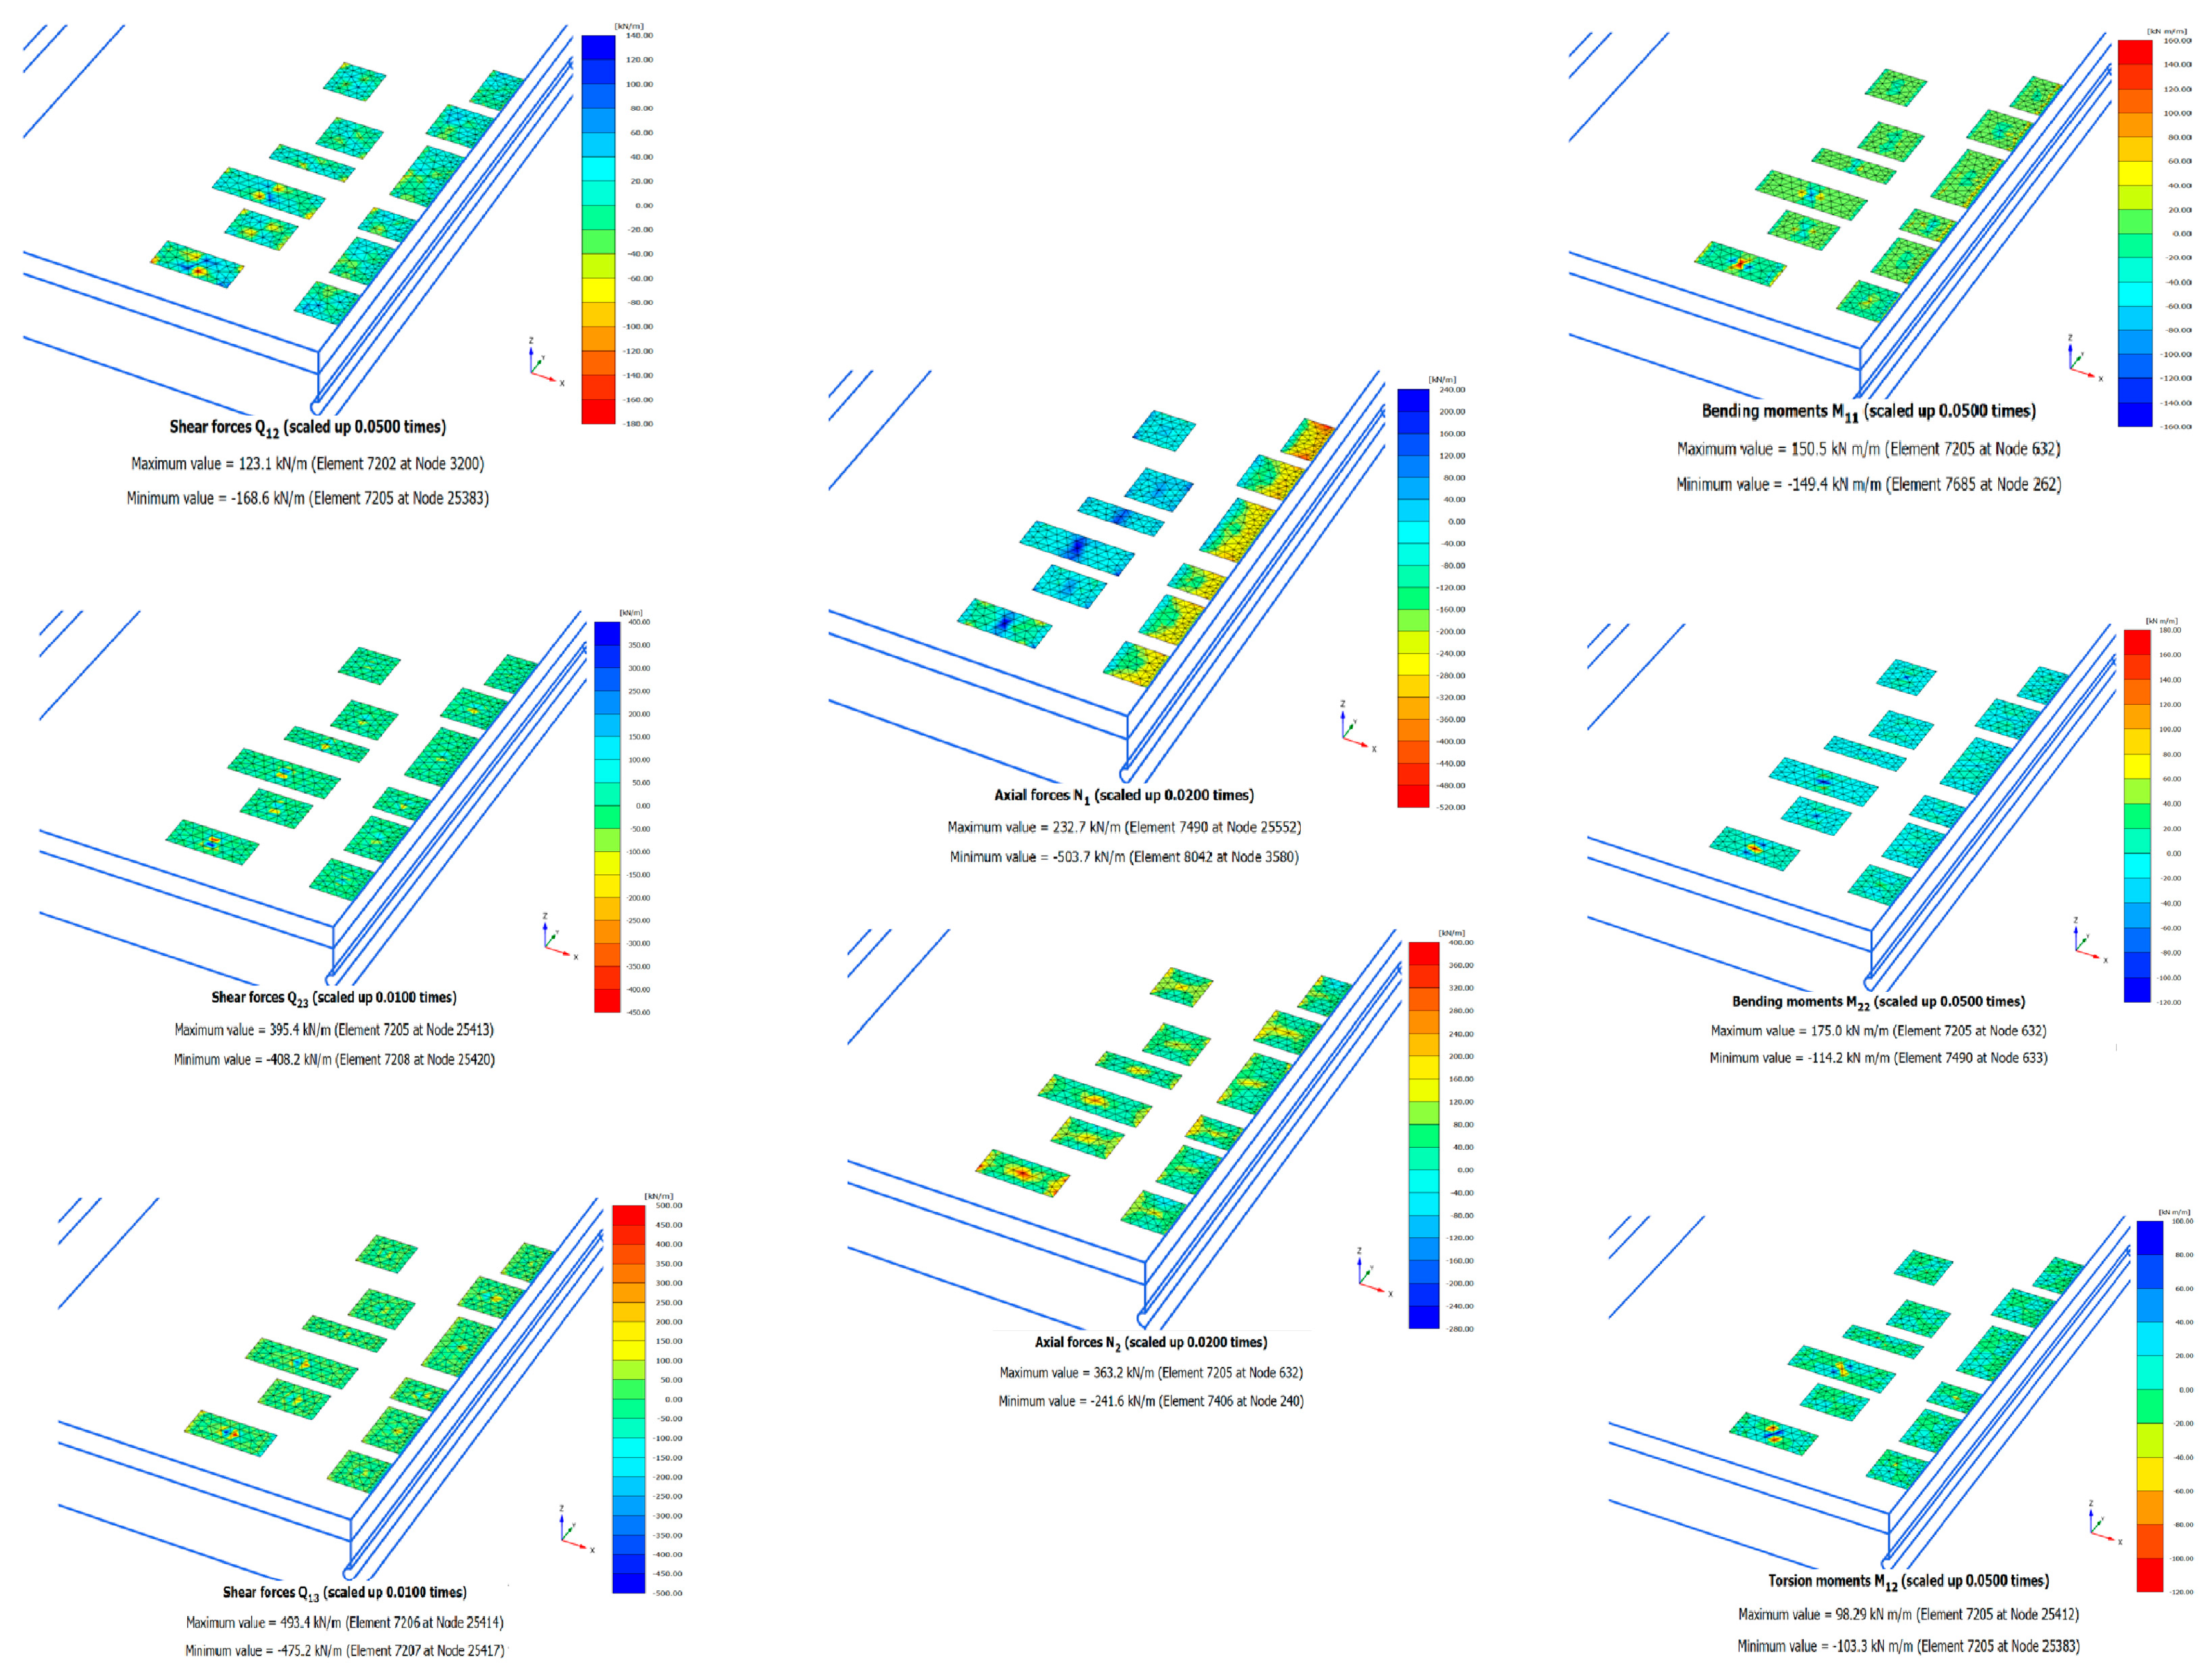
Figure 17.
Results of numerical modeling analysis (forces acting on basements).


Table 1.
Rock mass ratings and rock definitions in the study area.
| Drilling No. | RMR Rating | RMR Rock Class | GSI Rock Identification |
|---|---|---|---|
| YSK-1 | 29 | Weak Rock | Blocky/Disturbed |
| YSK-1 | 29 | Weak Rock | Laminated/Foliated/Sheared |
| YSK-1 | 49 | Medium Rock | Very Blocky |
| YSK-2 | 42 | Medium Rock | Blocky/Disturbed |
| YSK-2 | 29 | Weak Rock | Laminated/Foliated/Sheared |
| YSK-3 | 29 | Weak Rock | Laminated/Foliated/Sheared |
| YSK-3 | 37 | Weak Rock | Laminated/Foliated/Sheared |
| YSK-4 | 29 | Weak Rock | Laminated/Foliated/Sheared |
| YSK-6 | 29 | Weak Rock | Laminated/Foliated/Sheared |
| YSK-6 | 26 | Weak Rock | Laminated/Foliated/Sheared |
| YSK-7 | 32 | Weak Rock | Blocky/Disturbed |
| YSK-8 | 32 | Weak Rock | Laminated/Foliated/Sheared |
| YSK-9 | 32 | Weak Rock | Laminated/Foliated/Sheared |
| YSK-10 | 30 | Weak Rock | Laminated/Foliated/Sheared |
| YSK-12 | 30 | Weak Rock | Laminated/Foliated/Sheared |
| YSK-14 | 30 | Weak Rock | Laminated/Foliated/Sheared |
| YSK-15 | 32 | Weak Rock | Laminated/Foliated/Sheared |
| YSK-15 | 37 | Weak Rock | Laminated/Foliated/Sheared |
| YSK-16 | 32 | Weak Rock | Laminated/Foliated/Sheared |
| YSK-16 | 32 | Weak Rock | Blocky/Disturbed |
| YSK-16 | 32 | Weak Rock | Laminated/Foliated/Sheared |
| YSK-17 | 25 | Weak Rock | Laminated/Foliated/Sheared |
| YSK-17 | 54 | Medium Rock | Blocky/Disturbed |
| YSK-18 | 32 | Weak Rock | Blocky/Disturbed |
| YSK-18 | 34 | Weak Rock | Blocky/Disturbed |
| YSK-19 | 44 | Medium Rock | Blocky/Disturbed |
| YSK-19 | 34 | Weak Rock | Laminated/Foliated/Sheared |
| YSK-20 | 44 | Medium Rock | Blocky/Disturbed |
| YSK-20 | 34 | Weak Rock | Laminated/Foliated/Sheared |
| YSK-22 | 29 | Weak Rock | Laminated/Foliated/Sheared |
| YSK-22 | 32 | Weak Rock | Blocky/Disturbed |
| YSK-23 | 32 | Weak Rock | Laminated/Foliated/Sheared |
Table 2.
Permeability values of geological units.
| Bornova Melange (LU) | Alluvium (cm/s) | |
|---|---|---|
| Min. | 1.73 | 9.16 × 10⁻⁵ |
| Max. | 7.60 | 1.14 × 10⁻³ |
| Average | 3.91 | 4.66 × 10⁻⁴ |
Table 3.
LiDAR measurement dates.
| Measurement No. | Date |
|---|---|
| 1 | December 2020–January 2021 |
| 2 | May 2021–June 2021 |
| 3 | November 2021–December 2021 |
Table 4.
Rock parameters used in numerical modeling.
| Rock Type | Unit Volume Weight (kN/m3) | Deformation Modulus (kN/m2) | Poisson’s Ratio | Internal Friction Angle (°) | Cohesion (kPa) |
|---|---|---|---|---|---|
| Aluvion | 20 | 125,000 | 0.34 | 27 | 20 |
| Bornova Melenge | 24 | 214,000 | 0.3 | 34 | 47 |
Table 5.
Construction parameters used in numerical modeling.
| Material | Unit Volume Weight (kN/m3) | Deformation Modulus (kN/m2) | Poisson’s Ratio | Thickness (m) |
|---|---|---|---|---|
| Concrete | 27 | 31,000,000 | 0.15 | 0.25 |
| Plate (for basement of constructions) | 50 | 30,000,000 | 0.15 | 0.3 |
| Plate (for rest of the constructions) | 33.3 | 30,000,000 | 0.15 | 0.25 |
Disclaimer/Publisher’s Note: The statements, opinions and data contained in all publications are solely those of the individual author(s) and contributor(s) and not of MDPI and/or the editor(s). MDPI and/or the editor(s) disclaim responsibility for any injury to people or property resulting from any ideas, methods, instructions or products referred to in the content. |
© 2024 by the authors. Licensee MDPI, Basel, Switzerland. This article is an open access article distributed under the terms and conditions of the Creative Commons Attribution (CC BY) license (https://creativecommons.org/licenses/by/4.0/).
Share and Cite
MDPI and ACS Style
Yaman, H.E.; Aksoy, C.O. Evaluation of Symmetrical Face Pressure of EPB. Symmetry 2024, 16, 484. https://doi.org/10.3390/sym16040484
AMA Style
Yaman HE, Aksoy CO. Evaluation of Symmetrical Face Pressure of EPB. Symmetry. 2024; 16(4):484. https://doi.org/10.3390/sym16040484
Chicago/Turabian StyleYaman, Hasan Eray, and Cemalettin Okay Aksoy. 2024. "Evaluation of Symmetrical Face Pressure of EPB" Symmetry 16, no. 4: 484. https://doi.org/10.3390/sym16040484
Note that from the first issue of 2016, this journal uses article numbers instead of page numbers. See further details here.