

Multi-Dimensional Data Analysis Platform (MuDAP): A Cognitive Science Data Toolbox


Abstract
:1. Introduction
- The framework structure of the multi-dimensional data analysis platform (MuDAP) is introduced.
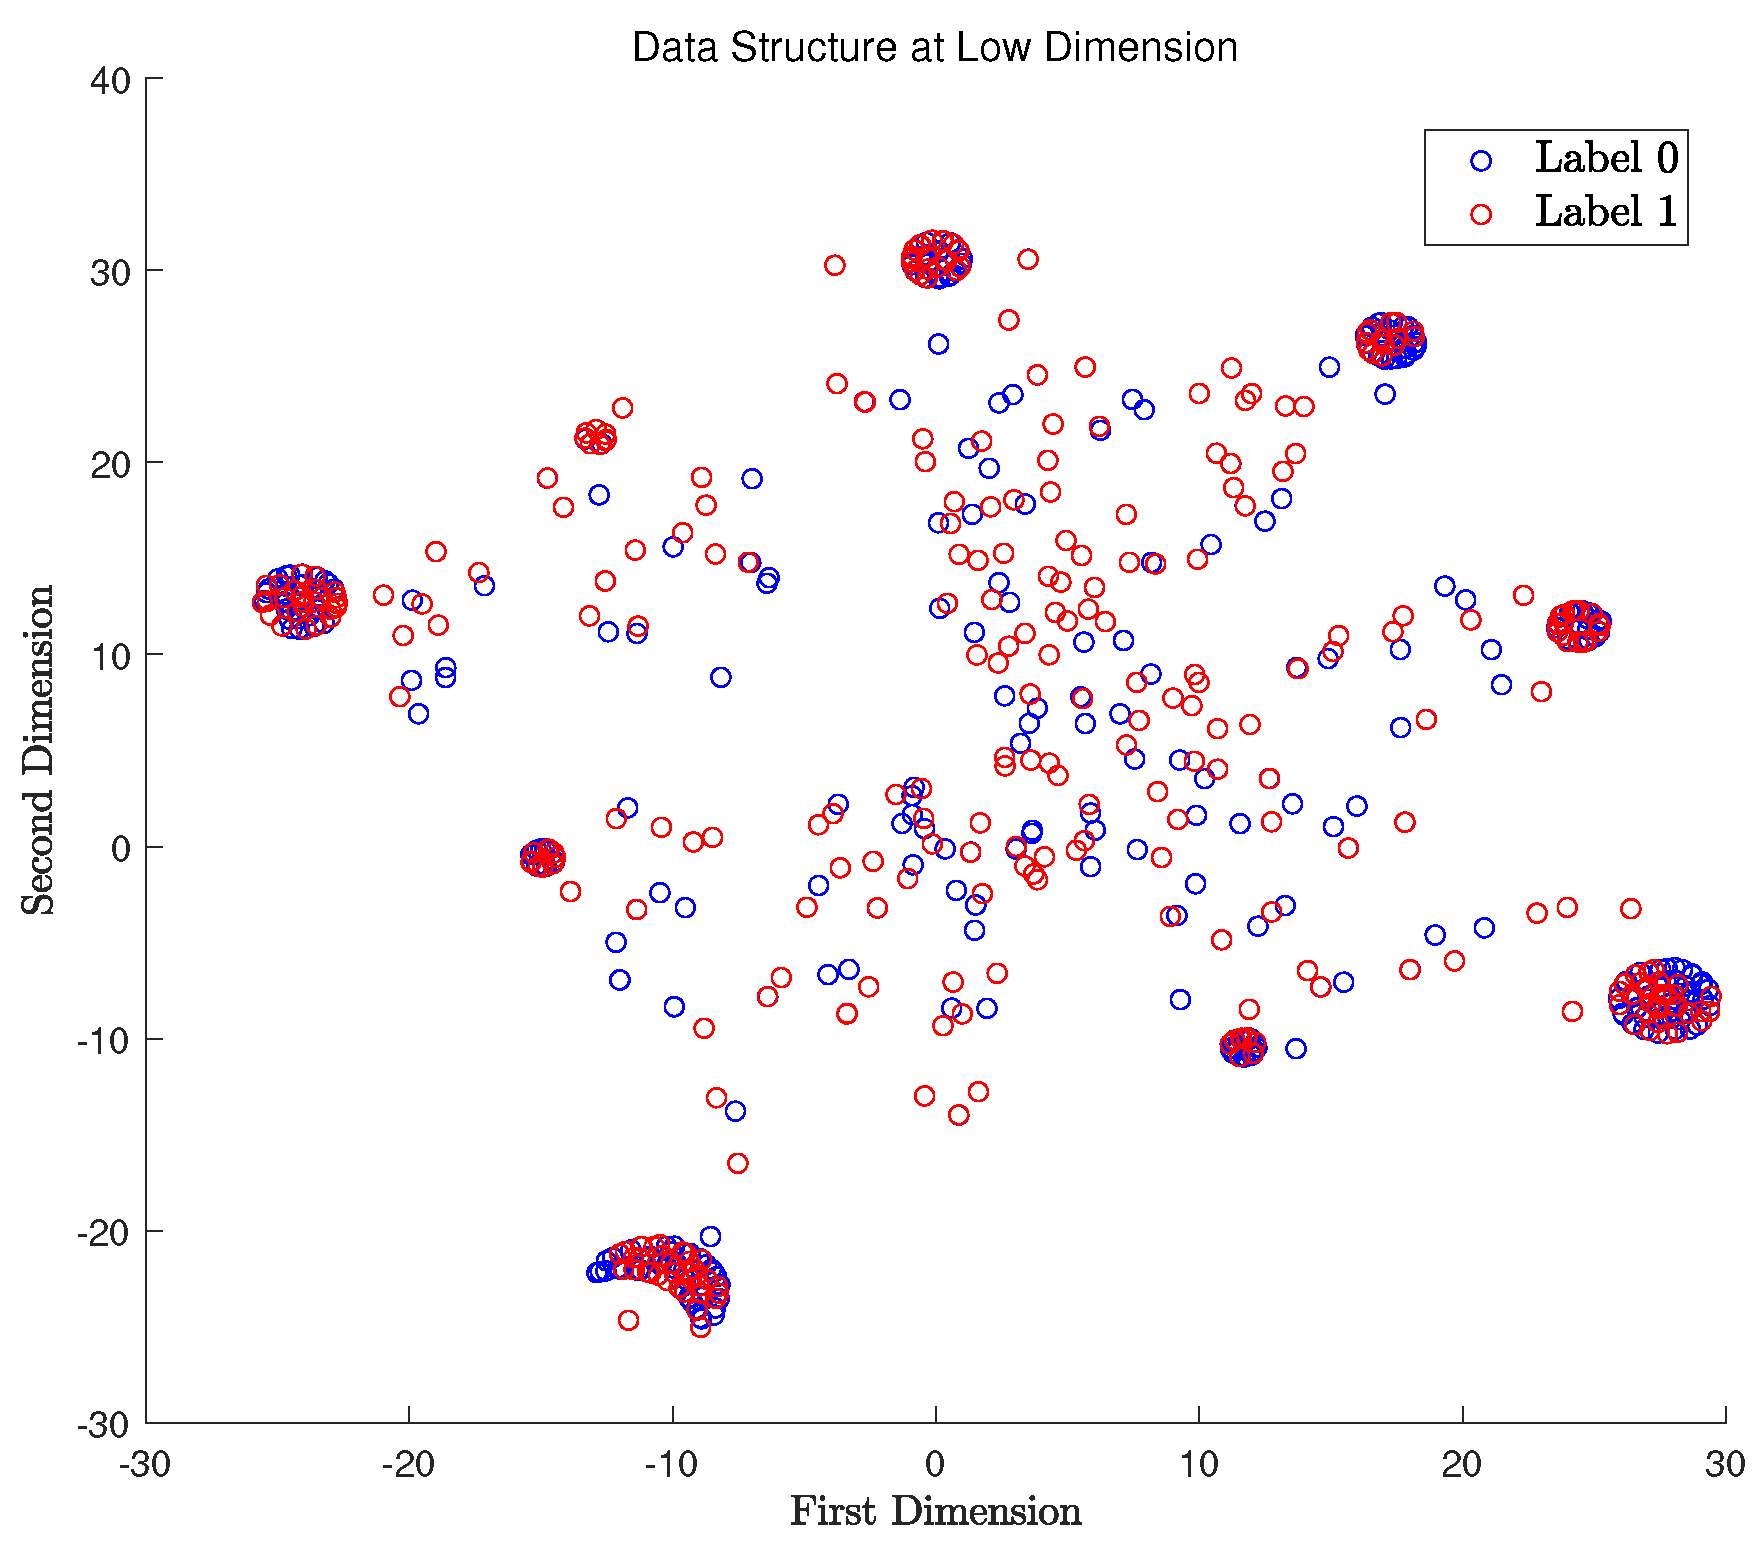
- A graphic visualization data-dimension-reduction algorithm based on t-SNE is utilized to dig the real clusters based on the inner structure of the data.
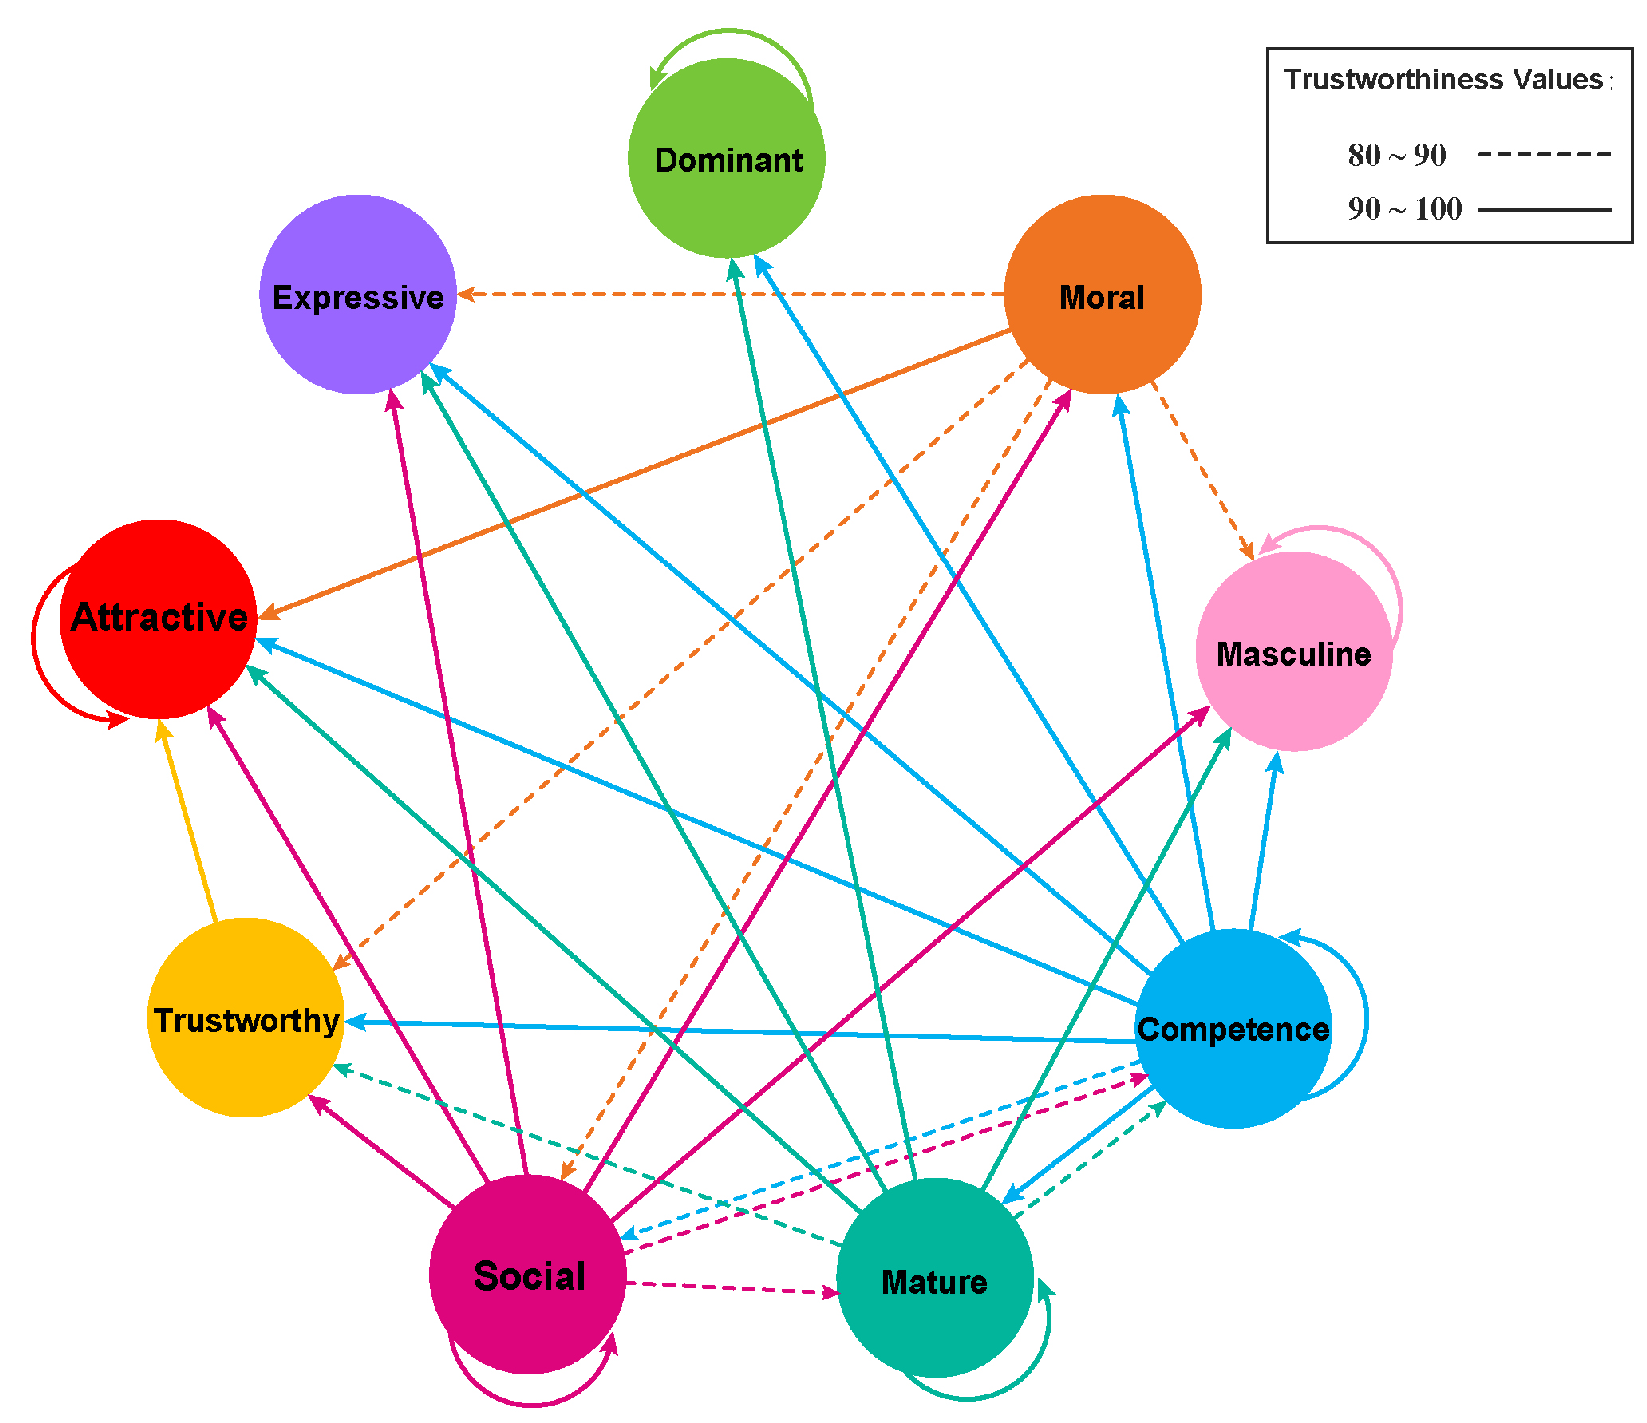
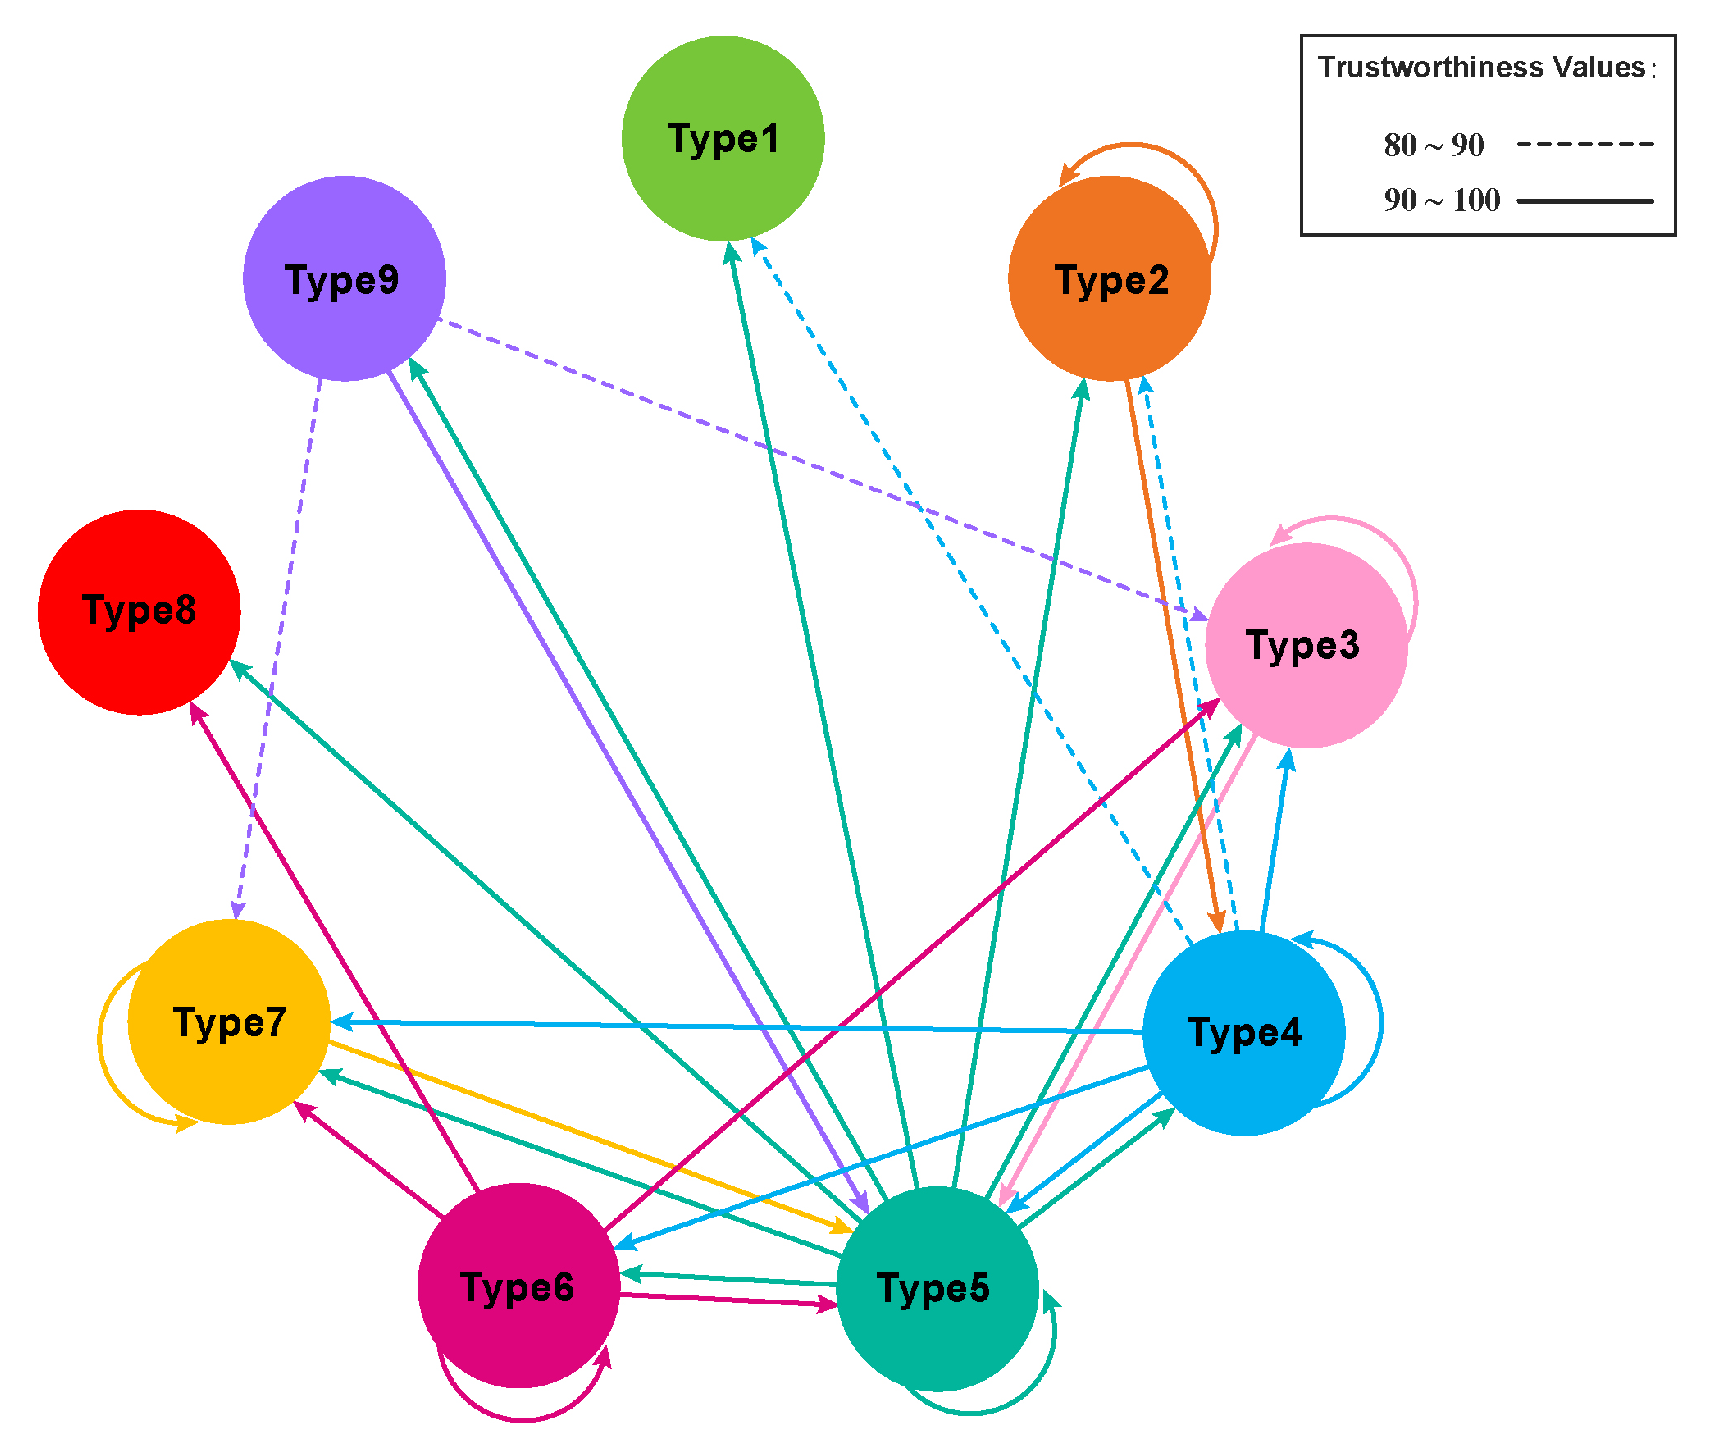
- A network analysis taking advantage of the symmetric structure of the data on correlations between each predicted cluster is performed to verify the reliability of the clustering results based on the result trustworthiness.
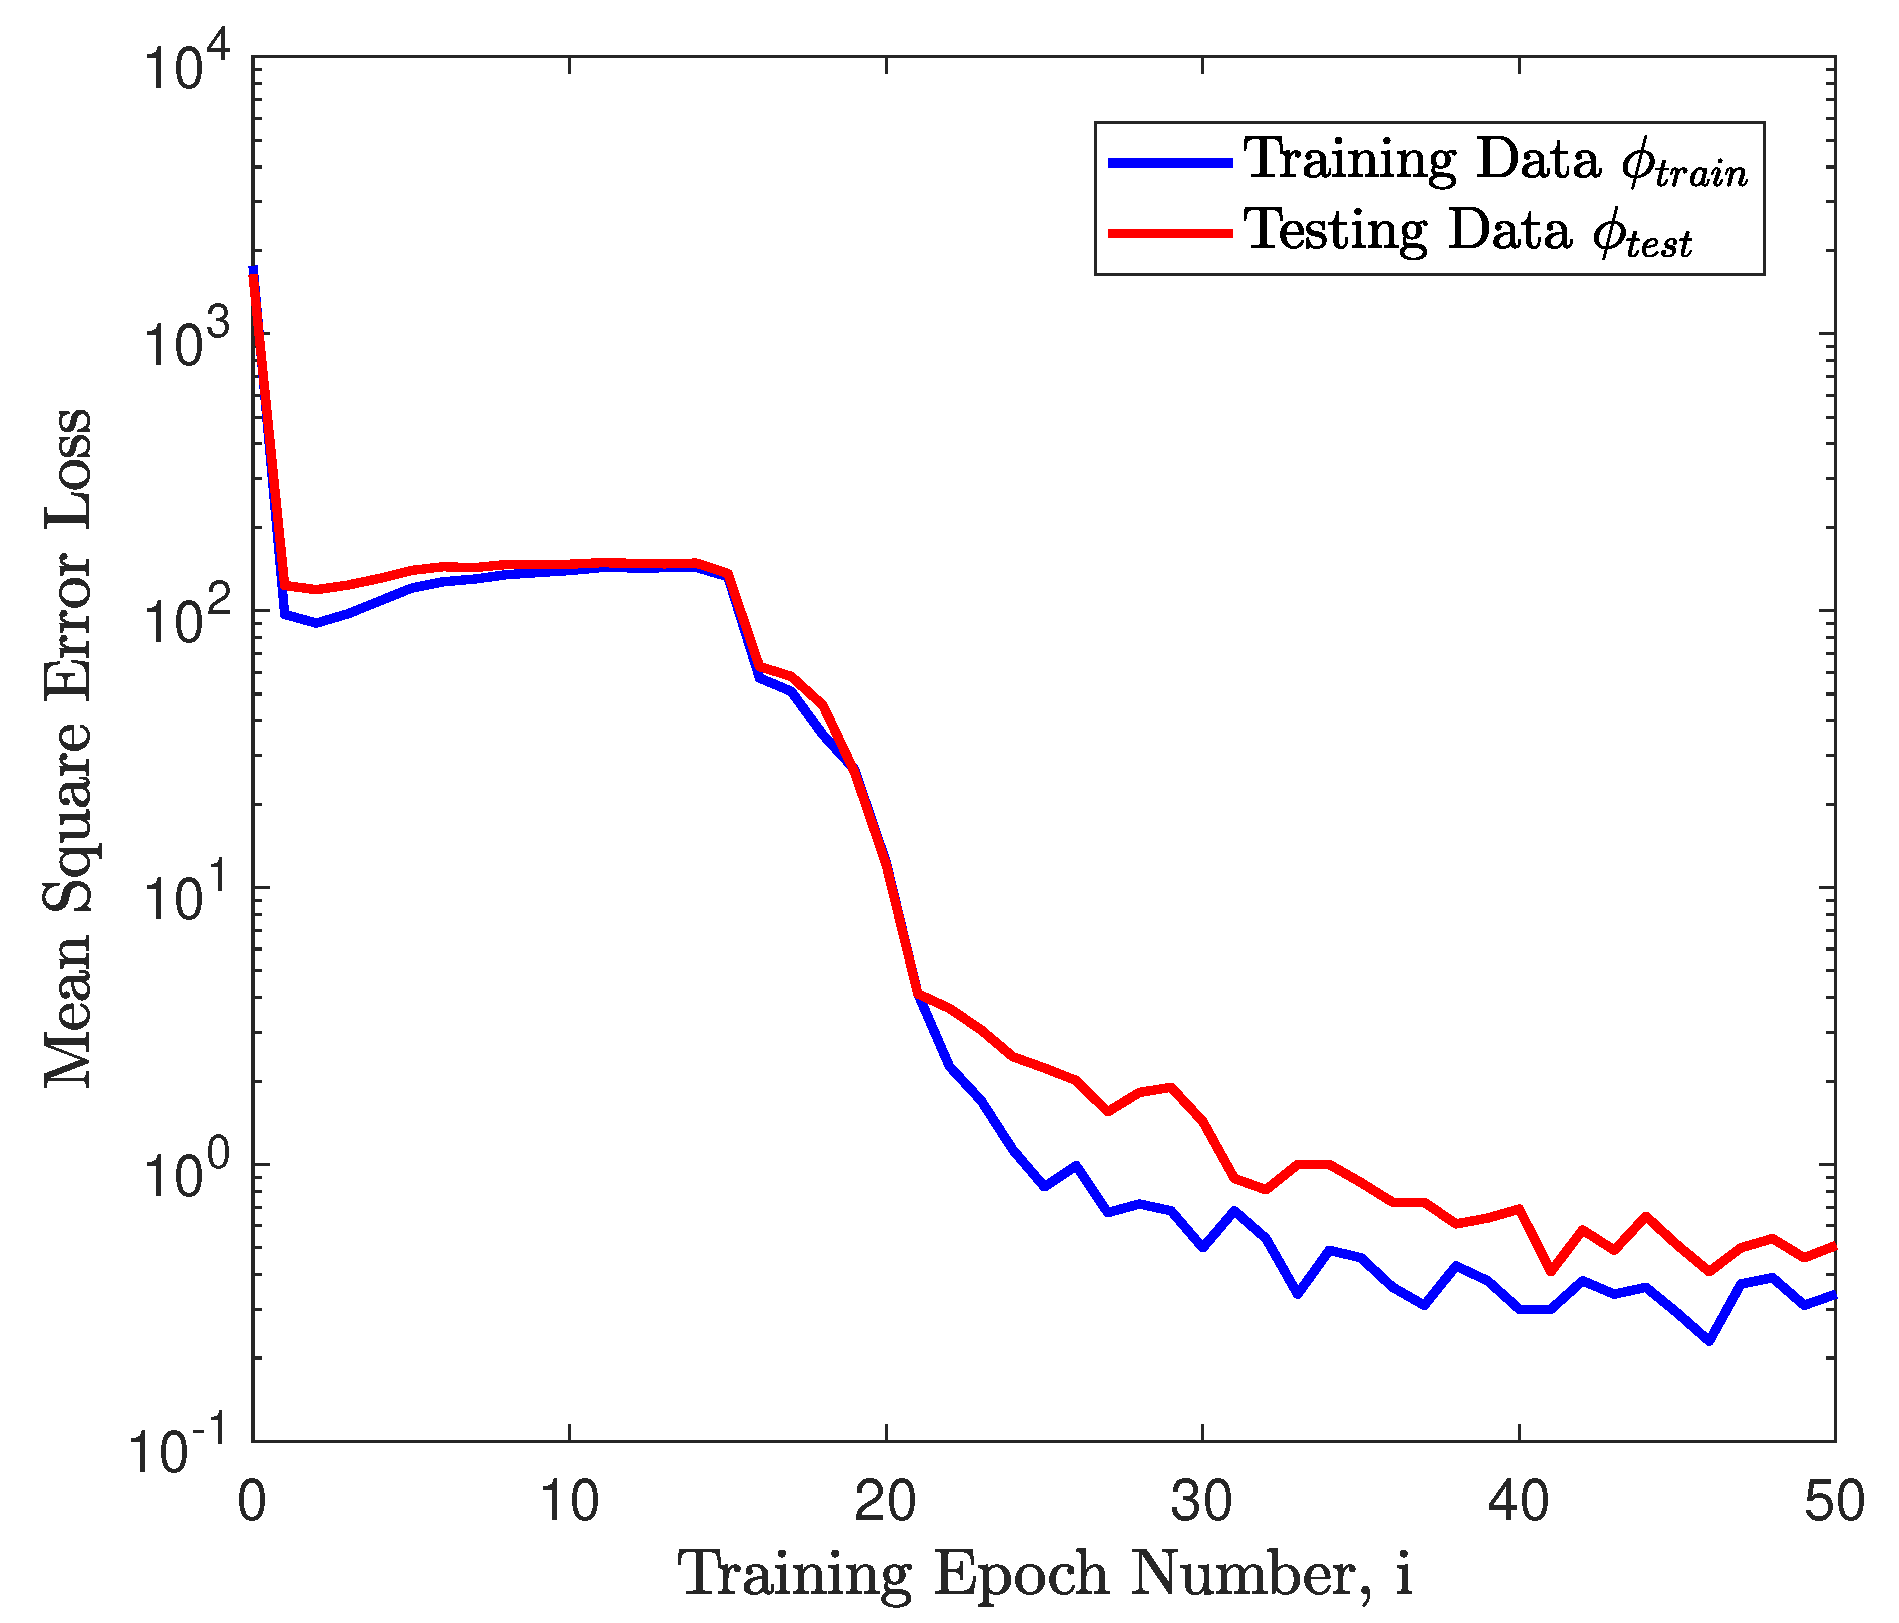
- An embedded neural network training algorithm is proposed to solve the corresponding regression and classification problems using the cluster results as labels.
- A step-by-step illustration of how to use MuDAP, analyzing the introduced face perception experiment data, is shown that verifies the function of the MuDAP.
2. Framework Structure
2.1. Dataset Import
2.2. Graphic User Interface
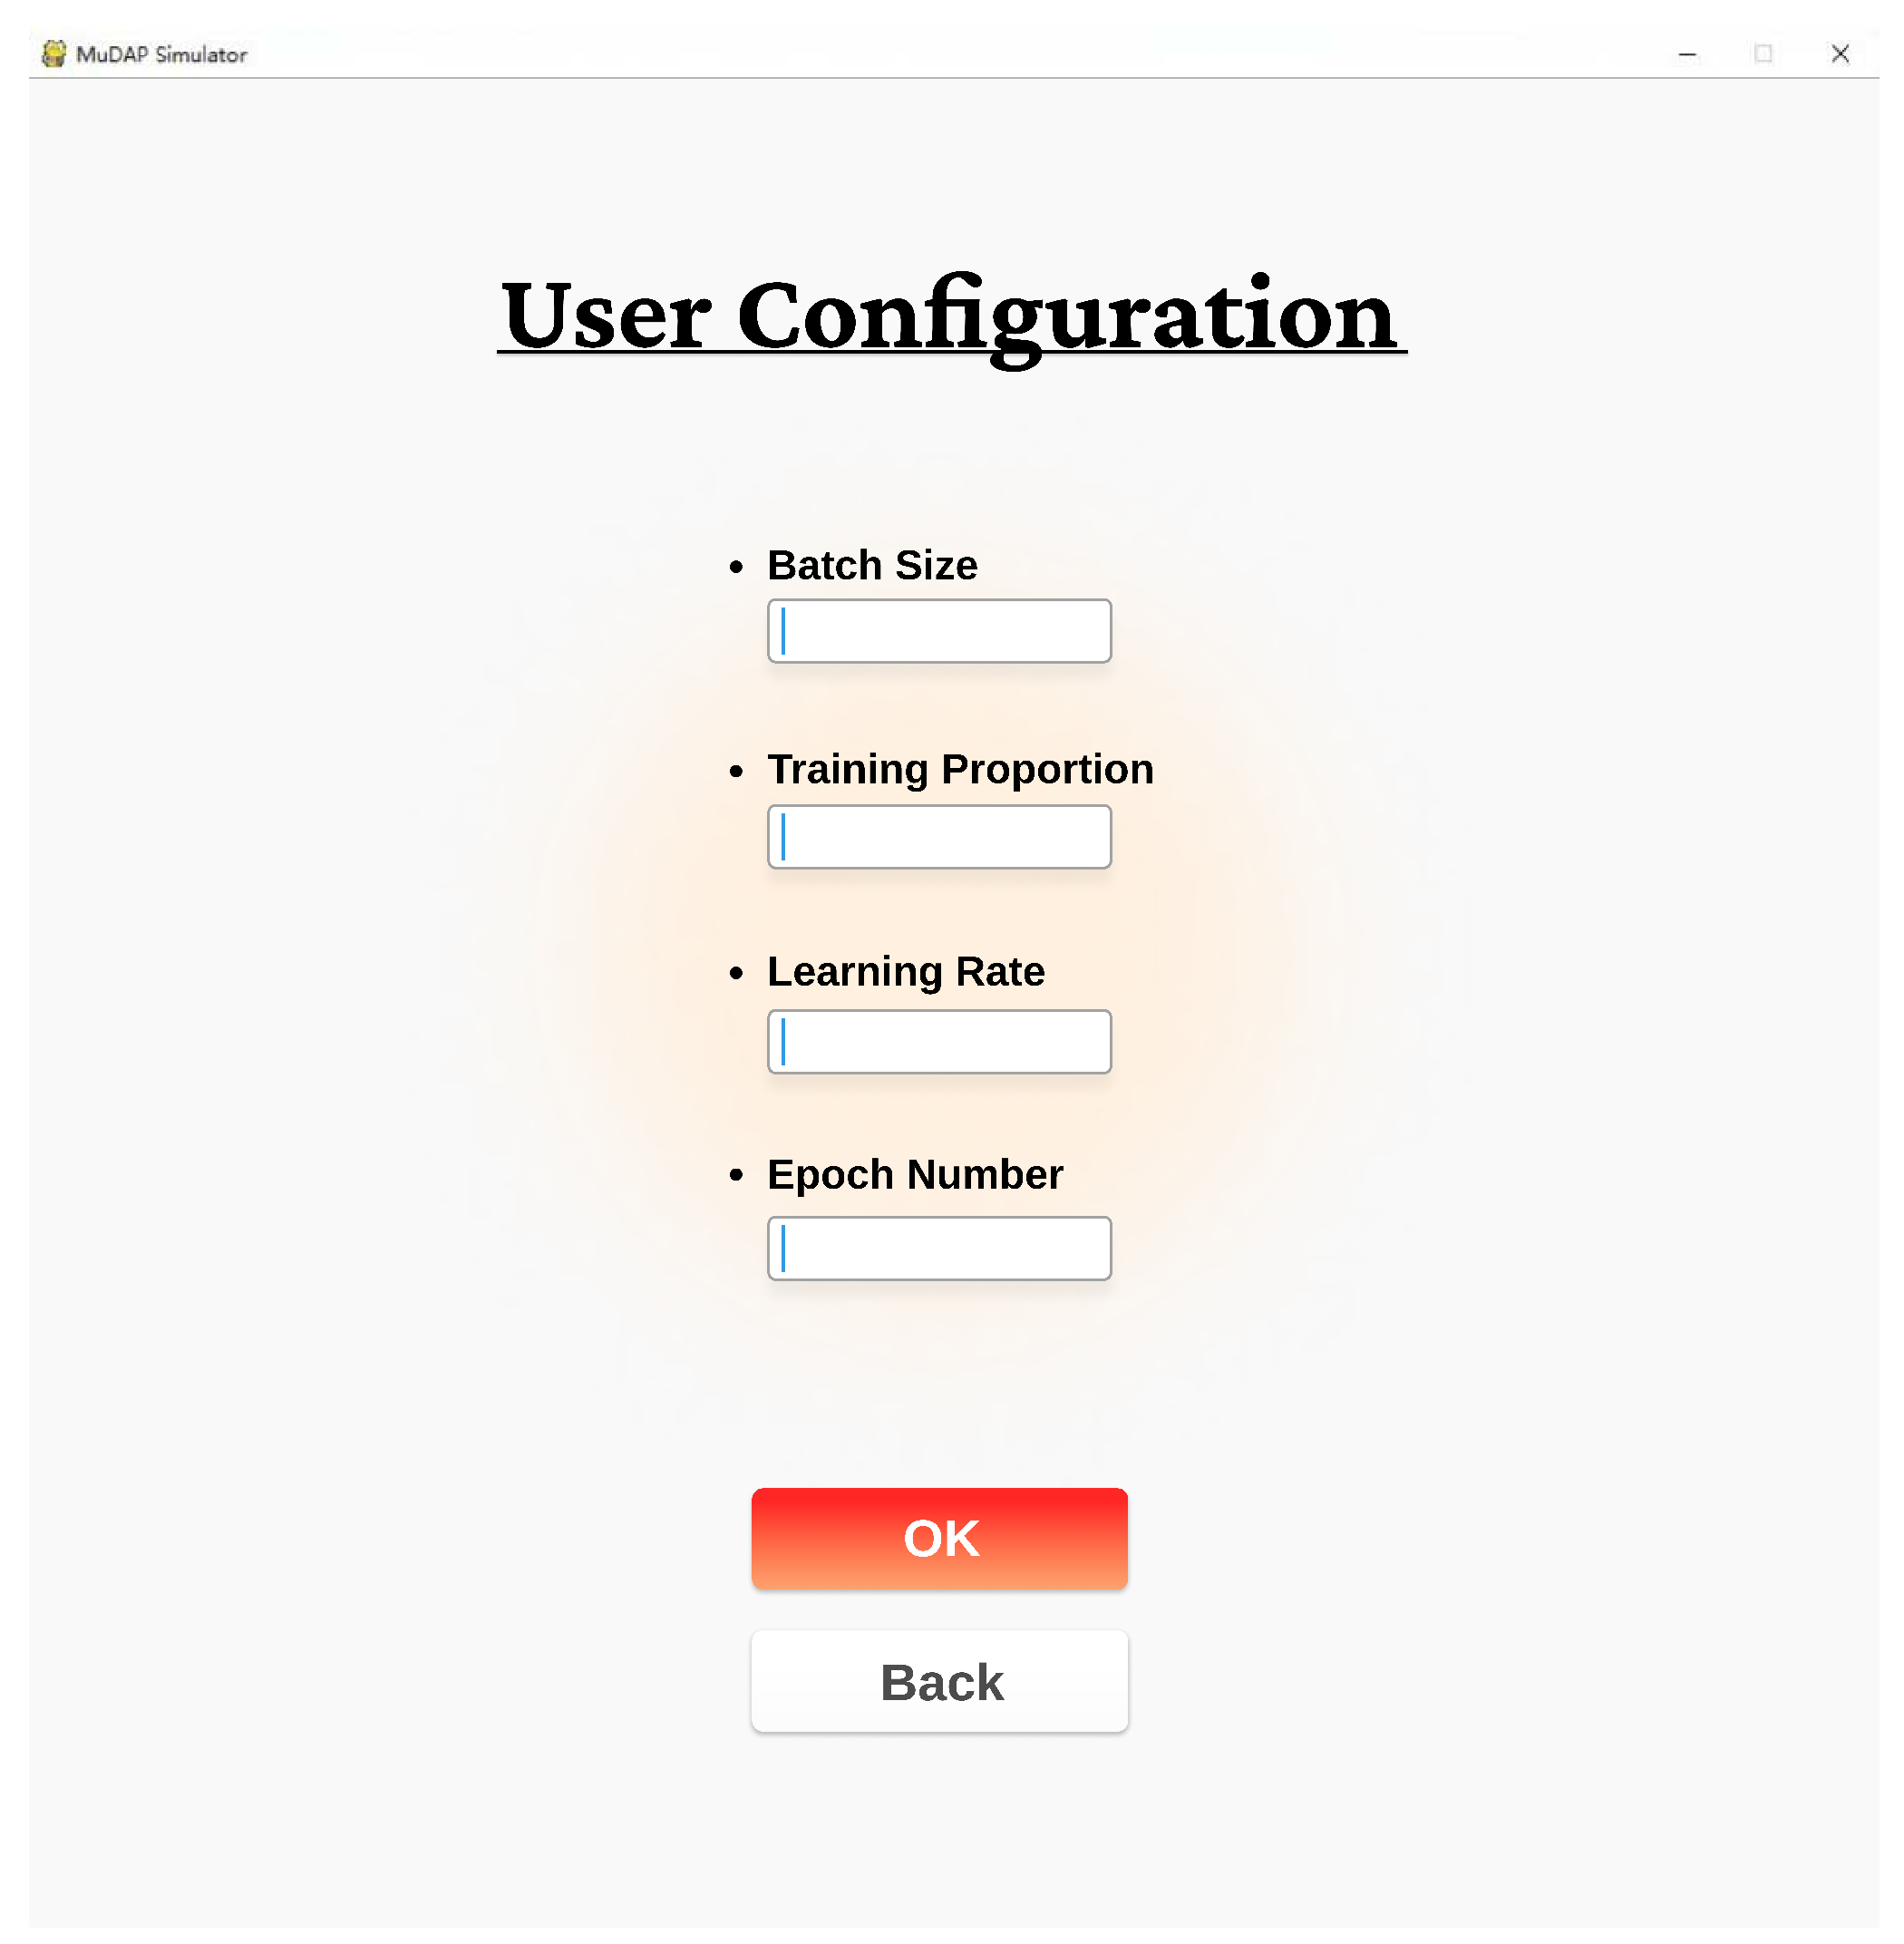
2.3. User Instructions for MuDAP
3. Neural-Network-Based Training Procedure Description
3.1. Problem Formulation
3.2. Neural Network Structure
3.3. A Training Algorithm Description
| Algorithm 1 The embedded neural network training algorithm. |
|
4. Data Analysis
4.1. Design Parameter Specifications
4.2. t-SNE Plot Analysis
4.3. Perception Data Analysis
4.4. Neural Network Analysis
5. Conclusions and Future Work
Author Contributions
Funding
Data Availability Statement
Acknowledgments
Conflicts of Interest
Abbreviations
| CUDA | Compute unified device architecture |
| GPU | Graphics processing unit |
| t-SNE | t-Distributed Stochastic Neighbor Embedding |
Appendix A. Graphic User Interface


References
- Willis, J.; Todorov, A. First Impressions: Making up your mind after a 100-ms exposure to a face. Psychol. Sci. 2006, 17, 592–598. [Google Scholar] [CrossRef]
- Palermo, R.; Rhodes, G. Are you always on my mind? A review of how face perception and attention interact. Neuropsychologia 2007, 45, 75–92. [Google Scholar] [CrossRef] [PubMed]
- Holmes, A.; Vuilleumier, P.; Eimer, M. The processing of emotional facial expression is gated by spatial attention: Evidence from event-related brain potentials. Cogn. Brain Res. 2003, 16, 174–184. [Google Scholar] [CrossRef]
- Bruce, V.; Young, A. Understanding face recognition. Br. J. Psychol. 1986, 77, 305–327. [Google Scholar] [CrossRef] [PubMed]
- Young, A.W.; Bruce, V. Understanding person perception. Br. J. Psychol. 2011, 102, 959–974. [Google Scholar] [CrossRef]
- Calder, A.J.; Young, A.W. Understanding the recognition of facial identity and facial expression. Nat. Rev. Neurosci. 2005, 6, 641–651. [Google Scholar] [CrossRef]
- Fox, C.J.; Barton, J.J. What is adapted in face adaptation? The neural representations of expression in the human visual system. Brain Res. 2007, 1127, 80–89. [Google Scholar] [CrossRef]
- Oosterhof, N.N.; Todorov, A. The functional basis of face evaluation. Proc. Natl. Acad. Sci. USA 2008, 105, 11087–11092. [Google Scholar] [CrossRef] [PubMed]
- Sutherland, C.A.; Oldmeadow, J.A.; Santos, I.M.; Towler, J.; Burt, D.M.; Young, A.W. Social inferences from faces: Ambient images generate a three-dimensional model. Cognition 2013, 127, 105–118. [Google Scholar] [CrossRef]
- Jolliffe, I.T. Principal component analysis. Technometrics 2003, 45, 276. [Google Scholar] [CrossRef]
- Masulli, P.; Galazka, M.; Eberhard, D.; Åsberg Johnels, J.; Fried, E.I.; McNally, R.J.; Robinaugh, D.J.; Gillberg, C.; Billstedt, E.; Hadjikhani, N.; et al. Data-driven analysis of gaze patterns in face perception: Methodological and clinical contributions. Cortex 2022, 147, 9–23. [Google Scholar] [CrossRef] [PubMed]
- Fysh, M.C.; Trifonova, I.V.; Allen, J.; McCall, C.; Burton, A.M.; Bindemann, M. Avatars with faces of real people: A construction method for scientific experiments in virtual reality. Behav. Res. Methods 2022, 54, 1461–1475. [Google Scholar] [CrossRef]
- Jones, B.C.; DeBruine, L.M.; Flake, J.K.; Liuzza, M.T.; Antfolk, J.; Arinze, N.C.; Ndukaihe, I.L.; Bloxsom, N.G.; Lewis, S.C.; Foroni, F.; et al. To which world regions does the valence-dominance model of social perception apply? Nat. Hum. Behav. 2021, 5, 159–169. [Google Scholar] [CrossRef] [PubMed]
- Chang, J.; Lan, Z.; Cheng, C.; Wei, Y. Data Uncertainty Learning in Face Recognition. In Proceedings of the IEEE/CVF Conference on Computer Vision and Pattern Recognition (CVPR), Seattle, WA, USA, 13–19 June 2020; pp. 5710–5719. [Google Scholar]
- Calder, A.J.; Burton, A.; Miller, P.; Young, A.W.; Akamatsu, S. A principal component analysis of facial expressions. Vis. Res. 2001, 41, 1179–1208. [Google Scholar] [CrossRef] [PubMed]
- Gisbrecht, A.; Schulz, A.; Hammer, B. Parametric nonlinear dimensionality reduction using kernel t-SNE. Neurocomputing 2015, 147, 71–82. [Google Scholar] [CrossRef]
- Cai, T.T.; Ma, R. Theoretical Foundations of t-SNE for Visualizing High-Dimensional Clustered Data. J. Mach. Learn. Res. 2022, 23, 1–54. [Google Scholar]
- Hajibabaee, P.; Pourkamali-Anaraki, F.; Hariri-Ardebili, M.A. An Empirical Evaluation of the t-SNE Algorithm for Data Visualization in Structural Engineering. In Proceedings of the 2021 20th IEEE International Conference on Machine Learning and Applications (ICMLA), Pasadena, CA, USA, 13–15 December 2021; pp. 1674–1680. [Google Scholar]
- Alshazly, H.; Linse, C.; Barth, E.; Martinetz, T. Handcrafted versus CNN Features for Ear Recognition. Symmetry 2019, 11, 1493. [Google Scholar] [CrossRef]
- Chatzimparmpas, A.; Martins, R.M.; Kerren, A. t-viSNE: Interactive Assessment and Interpretation of t-SNE Projections. IEEE Trans. Vis. Comput. Graph. 2020, 26, 2696–2714. [Google Scholar] [CrossRef] [PubMed]
- Fried, E.; von Stockert, S.; Haslbeck, J.; Lamers, F.; Schoevers, R.; Penninx, B. Using network analysis to examine links between individual depressive symptoms, inflammatory markers, and covariates. Psychol. Med. 2022, 50, 2682–2690. [Google Scholar] [CrossRef]
- Yan, L.; Wang, Y. The application of multivariate data chain network in the design of innovation and entrepreneurship teaching and learning in colleges and universities. Appl. Math. Nonlinear Sci. 2024, 9. [Google Scholar] [CrossRef]
- Hao, X.; Liu, Y.; Pei, L.; Li, W.; Du, Y. Atmospheric Temperature Prediction Based on a BiLSTM-Attention Model. Symmetry 2022, 14, 2470. [Google Scholar] [CrossRef]
- Borsboom, D.; Deserno, M.K.; Rhemtulla, M.; Epskamp, S.; Fried, E.I.; McNally, R.J.; Robinaugh, D.J.; Perugini, M.; Dalege, J.; Costantini, G.; et al. Network analysis of multivariate data in psychological science. Nat. Rev. Methods Prim. 2021, 1, 58. [Google Scholar] [CrossRef]
- Bahrami, M.; Laurienti, P.J.; Shappell, H.M.; Simpson, S.L. Brain Network Analysis: A Review on Multivariate Analytical Methods. Brain Connect. 2023, 13, 64–79. [Google Scholar] [CrossRef]
- Wang, Y.; Chen, C.; Chen, W. Nonlinear directed information flow estimation for fNIRS brain network analysis based on the modified multivariate transfer entropy. Biomed. Signal Process. Control. 2022, 74, 103422. [Google Scholar] [CrossRef]
- Ning, X.; Tian, W.; He, F.; Bai, X.; Sun, L.; Li, W. Hyper-sausage coverage function neuron model and learning algorithm for image classification. Pattern Recognit. 2023, 136, 109216. [Google Scholar] [CrossRef]
- Liu, S.; Wang, L.; Yue, W. An efficient medical image classification network based on multi-branch CNN, token grouping Transformer and mixer MLP. Appl. Soft Comput. 2024, 153, 111323. [Google Scholar] [CrossRef]
- Wu, X.; Feng, Y.; Xu, H.; Lin, Z.; Chen, T.; Li, S.; Qiu, S.; Liu, Q.; Ma, Y.; Zhang, S. CTransCNN: Combining transformer and CNN in multilabel medical image classification. Knowl. Based Syst. 2023, 281, 111030. [Google Scholar] [CrossRef]
- Ma, P.; He, X.; Liu, Y.; Chen, Y. ISOD: Improved small object detection based on extended scale feature pyramid network. Vis. Comput. 2024. early access. [Google Scholar] [CrossRef]
- Wang, G.; Zhang, F.; Chen, Y.; Weng, G.; Chen, H. An active contour model based on local pre-piecewise fitting bias corrections for fast and accurate segmentation. IEEE Trans. Instrum. Meas. 2023, 72, 5006413. [Google Scholar] [CrossRef]
- Wang, L.; Huangfu, Z.; Li, R.; Wen, X.; Sun, Y.; Chen, Y. Iterative learning control with parameter estimation for non-repetitive time-varying systems. J. Frankl. Inst. 2024, 361, 1455–1466. [Google Scholar] [CrossRef]
- Yang, C.; Wu, L.; Chen, Y.; Wang, G.; Weng, G. An Active Contour Model Based on Retinex and Pre-Fitting Reflectance for Fast Image Segmentation. Symmetry 2022, 14, 2343. [Google Scholar] [CrossRef]
- Mikolov, T.; Sutskever, I.; Chen, K.; Corrado, G.S.; Dean, J. Distributed representations of words and phrases and their compositionality. In Proceedings of the 2013 International Conference on Neural Information Processing Systems (NIPS), Lake Tahoe, NV, USA, 5–10 December 2013; pp. 3111–3119. [Google Scholar]
- Gridach, M. A framework based on (probabilistic) soft logic and neural network for NLP. Appl. Soft Comput. 2020, 93, 106232. [Google Scholar] [CrossRef]
- Trinh, T.T.Q.; Chung, Y.C.; Kuo, R. A domain adaptation approach for resume classification using graph attention networks and natural language processing. Knowl. Based Syst. 2023, 266, 110364. [Google Scholar] [CrossRef]
- Wang, L.; Song, Z.; Zhang, X.; Wang, C.; Zhang, G.; Zhu, L.; Li, J.; Liu, H. SAT-GCN: Self-attention graph convolutional network-based 3D object detection for autonomous driving. Knowl. Based Syst. 2023, 259, 110080. [Google Scholar] [CrossRef]
- Chen, Y.; Cheng, C.; Zhang, Y.; Li, X.; Sun, L. A neural network-Based navigation approach for autonomous mobile robot systems. Appl. Sci. 2022, 12, 7796. [Google Scholar] [CrossRef]
- Cheng, C.; Duan, S.; He, H.; Li, X.; Chen, Y. A generalized robot navigation analysis platform (RoNAP) with visual results using multiple navigation algorithms. Sensors 2022, 23, 9036. [Google Scholar] [CrossRef] [PubMed]
- Cui, S.; Chen, Y.; Li, X. A robust and efficient UAV path planning approach for tracking agile targets in complex environments. Machines 2022, 10, 931. [Google Scholar] [CrossRef]
- Chen, Y.; Wu, L.; Wang, G.; He, H.; Weng, G.; Chen, H. An active contour model for image segmentation using morphology and nonlinear poisson’s equation. Optik 2023, 287, 170997. [Google Scholar] [CrossRef]
- Zhao, Z.; Wang, J.; Tao, Q.; Li, A.; Chen, Y. An unknown wafer surface defect detection approach based on Incremental Learning for reliability analysis. Reliab. Eng. Syst. Saf. 2024, 244, 109966. [Google Scholar] [CrossRef]
- Wen, C.; Xue, Y.; Liu, W.; Chen, G.; Liu, X. Bearing fault diagnosis via fusing small samples and training multi-state siamese neural networks. Neurocomputing 2024, 576, 127355. [Google Scholar] [CrossRef]
- Liang, P.; Deng, C.; Yuan, X.; Zhang, L. A deep capsule neural network with data augmentation generative adversarial networks for single and simultaneous fault diagnosis of wind turbine gearbox. ISA Trans. 2023, 135, 462–475. [Google Scholar] [CrossRef]


| Unit: % | Attractive | Competence | Trustworthy | Dominant | Moral | Masculine | Mature | Social | Expressive |
|---|---|---|---|---|---|---|---|---|---|
| Type 1 | 0.00 | 91.76 | 81.18 | 0.00 | 84.71 | 98.82 | 83.53 | 88.24 | 80.00 |
| Type 2 | 0.00 | 87.50 | 56.25 | 97.66 | 67.19 | 16.41 | 85.94 | 73.44 | 81.25 |
| Type 3 | 0.00 | 92.93 | 100.00 | 100.00 | 89.90 | 100.00 | 98.99 | 87.88 | 100.00 |
| Type 4 | 29.67 | 76.37 | 49.45 | 97.25 | 54.95 | 89.01 | 79.67 | 43.96 | 35.71 |
| Type 5 | 100.00 | 97.21 | 100.00 | 100.00 | 98.61 | 100.00 | 100.00 | 100.00 | 100.00 |
| Type 6 | 94.41 | 76.92 | 65.03 | 99.30 | 78.32 | 51.05 | 62.24 | 93.01 | 55.24 |
| Type 7 | 100.00 | 90.22 | 90.22 | 0.00 | 91.30 | 100.00 | 83.70 | 97.83 | 100.00 |
| Type 8 | 100.00 | 82.09 | 86.57 | 0.00 | 86.57 | 20.90 | 82.09 | 97.01 | 64.18 |
| Type 9 | 4.06 | 56.35 | 62.94 | 0.51 | 69.04 | 4.06 | 56.85 | 75.13 | 60.41 |
| Unit: % | Attractive | Competence | Trustworthy | Dominant | Moral | Masculine | Mature | Social | Expressive |
|---|---|---|---|---|---|---|---|---|---|
| Type 1 | 0.00 | 7.37 | 7.08 | 0.00 | 7.06 | 10.00 | 6.80 | 7.08 | 7.11 |
| Type 2 | 0.00 | 10.58 | 7.38 | 15.04 | 8.43 | 2.50 | 10.54 | 8.88 | 10.88 |
| Type 3 | 0.00 | 8.69 | 10.15 | 11.91 | 8.73 | 11.79 | 9.39 | 8.22 | 10.36 |
| Type 4 | 8.40 | 13.13 | 9.23 | 21.30 | 9.80 | 19.29 | 13.89 | 7.55 | 6.80 |
| Type 5 | 44.63 | 26.35 | 29.44 | 34.54 | 27.75 | 34.17 | 27.49 | 27.10 | 30.02 |
| Type 6 | 21.00 | 10.39 | 9.54 | 17.09 | 10.98 | 8.69 | 8.52 | 12.56 | 8.26 |
| Type 7 | 14.31 | 7.84 | 8.51 | 0.00 | 8.24 | 10.95 | 7.38 | 8.50 | 9.62 |
| Type 8 | 10.42 | 5.19 | 5.95 | 0.00 | 5.69 | 1.67 | 5.27 | 6.14 | 4.50 |
| Type 9 | 1.24 | 10.48 | 12.72 | 0.12 | 13.33 | 0.95 | 10.73 | 13.98 | 12.45 |
| Unit: % | Attractive | Competence | Trustworthy | Dominant | Moral | Masculine | Mature | Social | Expressive |
|---|---|---|---|---|---|---|---|---|---|
| Attractive | 99.70 | 0.00 | 0.00 | 0.00 | 0.00 | 0.00 | 0.00 | 0.00 | 0.00 |
| Competence | 98.30 | 92.30 | 92.80 | 97.40 | 90.40 | 98.70 | 92.80 | 89.40 | 94.80 |
| Trustworthy | 92.90 | 0.00 | 0.00 | 0.00 | 0.00 | 0.00 | 0.00 | 0.00 | 0.00 |
| Dominant | 0.00 | 0.00 | 0.00 | 100.00 | 0.00 | 0.00 | 0.00 | 0.00 | 0.00 |
| Moral | 98.20 | 0.00 | 84.30 | 0.00 | 0.00 | 87.80 | 0.00 | 80.10 | 86.60 |
| Masculine | 0.00 | 0.00 | 0.00 | 0.00 | 0.00 | 99.00 | 0.00 | 0.00 | 0.00 |
| Mature | 94.30 | 87.60 | 89.40 | 97.00 | 84.00 | 98.40 | 90.40 | 0.00 | 92.20 |
| Social | 99.80 | 89.40 | 96.50 | 0.00 | 95.20 | 91.70 | 87.60 | 96.90 | 97.30 |
| Expressive | 0.00 | 0.00 | 0.00 | 0.00 | 0.00 | 0.00 | 0.00 | 0.00 | 0.00 |
| Unit: % | Type1 | Type2 | Type3 | Type4 | Type5 | Type6 | Type7 | Type8 | Type9 |
|---|---|---|---|---|---|---|---|---|---|
| Type1 | 0.00 | 0.00 | 0.00 | 0.00 | 0.00 | 0.00 | 0.00 | 0.00 | 0.00 |
| Type2 | 0.00 | 90.80 | 0.00 | 94.07 | 0.00 | 0.00 | 0.00 | 0.00 | 0.00 |
| Type3 | 0.00 | 0.00 | 96.55 | 0.00 | 97.76 | 0.00 | 0.00 | 0.00 | 0.00 |
| Type4 | 89.30 | 88.57 | 99.95 | 96.87 | 99.99 | 98.82 | 98.93 | 0.00 | 0.00 |
| Type5 | 100.00 | 100.00 | 100.00 | 100.00 | 100.00 | 100.00 | 100.00 | 100.00 | 100.00 |
| Type6 | 0.00 | 0.00 | 98.92 | 0.00 | 99.99 | 99.40 | 99.38 | 93.81 | 0.00 |
| Type7 | 0.00 | 0.00 | 0.00 | 0.00 | 95.27 | 0.00 | 91.13 | 0.00 | 0.00 |
| Type8 | 0.00 | 0.00 | 0.00 | 0.00 | 0.00 | 0.00 | 0.00 | 0.00 | 0.00 |
| Type9 | 0.00 | 0.00 | 89.79 | 0.00 | 95.71 | 0.00 | 88.89 | 0.00 | 0.00 |
Disclaimer/Publisher’s Note: The statements, opinions and data contained in all publications are solely those of the individual author(s) and contributor(s) and not of MDPI and/or the editor(s). MDPI and/or the editor(s) disclaim responsibility for any injury to people or property resulting from any ideas, methods, instructions or products referred to in the content. |
© 2024 by the authors. Licensee MDPI, Basel, Switzerland. This article is an open access article distributed under the terms and conditions of the Creative Commons Attribution (CC BY) license (https://creativecommons.org/licenses/by/4.0/).
Share and Cite
Li, X.; Wang, Y.; Bi, X.; Xu, Y.; Ying, H.; Chen, Y. Multi-Dimensional Data Analysis Platform (MuDAP): A Cognitive Science Data Toolbox. Symmetry 2024, 16, 503. https://doi.org/10.3390/sym16040503
Li X, Wang Y, Bi X, Xu Y, Ying H, Chen Y. Multi-Dimensional Data Analysis Platform (MuDAP): A Cognitive Science Data Toolbox. Symmetry. 2024; 16(4):503. https://doi.org/10.3390/sym16040503
Chicago/Turabian StyleLi, Xinlin, Yiming Wang, Xiaoyu Bi, Yalu Xu, Haojiang Ying, and Yiyang Chen. 2024. "Multi-Dimensional Data Analysis Platform (MuDAP): A Cognitive Science Data Toolbox" Symmetry 16, no. 4: 503. https://doi.org/10.3390/sym16040503
APA StyleLi, X., Wang, Y., Bi, X., Xu, Y., Ying, H., & Chen, Y. (2024). Multi-Dimensional Data Analysis Platform (MuDAP): A Cognitive Science Data Toolbox. Symmetry, 16(4), 503. https://doi.org/10.3390/sym16040503