Article

The Influence of the Interface on the Micromechanical Behavior of Unidirectional Fiber-Reinforced Ceramic Matrix Composites: An Analysis Based on the Periodic Symmetric Boundary Conditions

1
Zhejiang Key Laboratory of Data-Driven High-Safety Energy Materials and Applications, Ningbo Key Laboratory of Special Energy Materials and Chemistry, Ningbo Institute of Materials Technology and Engineering, Chinese Academy of Sciences, Ningbo 315201, China
2
University of Chinese Academy of Sciences, Beijing 100049, China
3
School of Material Science and Chemical Engineering, Ningbo University, Ningbo 315211, China
4
School of Mechanical Engineering, Zhejiang University of Technology, Hangzhou 310018, China
5
Engineering Laboratory of Advanced Energy Materials, Ningbo Institute of Material Technology and Engineering, Chinese Academy of Sciences, Ningbo 315201, China
*
Author to whom correspondence should be addressed.
Symmetry 2024, 16(6), 695; https://doi.org/10.3390/sym16060695
Submission received: 9 April 2024 / Revised: 26 May 2024 / Accepted: 31 May 2024 / Published: 5 June 2024
(This article belongs to the Special Issue Asymmetry and Symmetry in Dynamical Systems)

Abstract

:
The long-term periodicity and uncontrollable interface properties during the preparation process for silicon carbide fiber reinforced silicon carbide-based composites (SiCf/SiC CMC) make it difficult to thoroughly investigate their mechanical damage behavior under complex loading conditions. To delve deeper into the influence of the interface strength and toughness on the mechanical response of microscopic representative volume element (RVE) models under complex loading conditions, in this work, based on numerical simulation methods, a microscale representative volume element (RVE) with periodic symmetric boundary conditions for the material is constructed. The phase-field fracture theory and cohesive zone model are coupled to capture the brittle cracking of the matrix and the debonding behavior at the fiber/matrix interface. Simulation analysis is conducted for tensile, compressive, and shear loading as well as combined loading, and the validity of the model is verified based on the Chamis theory. Further investigation is conducted into the mechanical response behavior of the microscale RVE model under complex loading conditions in relation to the interface strength and interface toughness. The results indicate that under uniaxial loading, increasing the interface strength leads to a tighter bond between the fiber and matrix, suppressing crack initiation and propagation, and significantly increasing the material’s fracture strength. However, compared to the transverse compressive strength, increasing the interface strength does not continuously enhance the strength under other loading conditions. Meanwhile, under the condition of strong interface strength of 400 MPa, an increase in the interface toughness significantly increases the transverse compressive strength of the material. When it increases from 2 J/m2 to 20 J/m2, the transverse compressive strength increases by 28.49%. Under biaxial combined loading, increasing the interface strength significantly widens the failure envelope space under σ2-τ23 combined loading; with the transition from transverse compressive stress to tensile stress, the transverse shear strength shows a trend of first increasing and then decreasing, and when the ratio of transverse shear displacement to transverse tensile/compressive displacement is −1, it reaches the maximum. This study provides strong numerical support for the investigation of the interface properties and mechanical behavior of SiCf/SiC composites under complex loading conditions, offering important references for engineering design and material performance optimization.

1. Introduction

The continuous silicon carbide fiber-reinforced silicon carbide ceramic matrix composites (SiCf/SiC CMC) possess the advantageous properties of SiC ceramics, including high temperature resistance, corrosion resistance, oxidation resistance, and high specific strength. Moreover, they effectively address the inherent brittleness and low toughness of pure ceramic materials by exhibiting exceptional damage tolerance and impact resistance [1]. These characteristics enable their widespread application in various fields, such as aerospace thermal structure systems [2], high-speed aircraft thermal protection systems [3], and high-speed braking [4]. Ceramic matrix composites are commonly manufactured through weaving or winding processes to create fiber preforms. These preforms are subsequently impregnated with a liquid precursor and cured to form composite preforms. Finally, the ceramic matrix preforms undergo high-temperature pyrolysis, typically between 1000 °C and 1200 °C, to attain the desired final material properties. However, the long period required for preparation of the materials and the instability of the interface control limit the in-depth understanding of their mechanical damage behavior under complex loads, thereby affecting their further application and development. Introducing the concept of symmetry as a means of simplified analysis can effectively assist us in understanding the mechanical behavior inside the materials, improve the simulation efficiency, and thus better guide the design and optimization of SiCf/SiC CMCs.
In the field of composite materials, different interface bonding methods can lead to different propagation paths of cracks [5]. Especially in ceramic matrix composites (CMCs), the interface layer plays a crucial buffering role [6], effectively transferring loads from the matrix to the fibers, thus playing a key role in the failure and fracture mechanisms of CMCs. Researchers have conducted numerous significant experiments to explore the mechanical properties of interface performance in the microstructure of ceramic matrix composites. For example, Hu et al. [7] successfully prepared two toughened three-dimensional continuous carbon fiber-reinforced ZrC-SiC composites by applying a PyC coating on the surface of the carbon fibers as the interface between the fibers and matrix. The research results showed that by introducing the PyC coating, the originally strong interface between the fibers and matrix transformed into a weaker interface, allowing the fiber pull-out and bridging lengths to exceed 50 μm, which was more than twice that without the PyC coating, thus significantly enhancing the fracture toughness of the composite material. Qin Lang et al. [8] controlled the formation of different thicknesses of pyrolytic carbon (PyC) interface layers on the surface of T300 carbon fibers by adjusting the time of the chemical vapor infiltration (CVI) process, thereby preparing three-dimensional carbon fiber-reinforced SiC composites. It was found that both too low and too high a thickness of the PyC interface layer would result in a decrease in the bending strength of 3D-Cf/SiC composite materials. Liu Haitao et al. [9] improved the interface strength of carbon fiber-reinforced ceramic matrix composites by vacuum heat treatment of Toray T300 carbon fibers to form in situ carbon coatings on their surface, thereby enhancing the toughness of the composite materials. Although these experimental methods can directly measure the mechanical properties of composite materials, challenges such as the long cycle, high cost, and uncontrollability of the sample performance pose significant challenges to the safety, convenience, and repeatability of such experiments.
With the development of computer technology, numerical simulation techniques have become a powerful tool to address the challenges of the long cycle and high cost in the preparation of composite materials, making it more convenient and accurate to obtain mechanical performance data of composite materials [10,11,12]. Researchers such as Wan Xiaopeng [13] constructed a micromechanical model of representative volume elements with randomly arranged fibers using the random expansion algorithm, thereby predicting the mechanical behavior and damage modes of unidirectional composite materials and exploring the influence of the random fiber arrangement and interface strength on the transverse compressive properties of the materials. Braginsky et al. [14] utilized the extended finite element method to investigate the crack propagation and flexural behavior of ceramic matrix continuous fiber-reinforced composites with weak interface phases, analyzing how the stiffness between the fibers, matrix, and interface, as well as the matrix/interface strength, affect the crack initiation, flexure, and penetration of CMCs under different boundary conditions. W. Tan et al. [15] established microscopic and mesoscopic models of unidirectional resin-based composites through computer simulation, investigating the influence of the interface properties of resin-based composites under different curing pressures on their intra-layer and inter-layer shear failure. Danial et al. [16] examined how porosity affects the transverse mechanical properties of unidirectional fiber-reinforced composite materials and compared the failure trajectories of composite laminates under transverse tension/compression and in-plane shear with the Puck failure criterion through micromechanical computational simulations. The findings demonstrated a significant decrease in the strength of composite materials due to the presence of porosity. Feng Yajie et al. [17] developed a micro-scale finite element model of SiCf/SiC nuclear fuel cladding tubes and performed mechanical performance simulations under transverse tension, compression, and in-plane and out-of-plane shear. Despite the in-depth exploration of the mechanical properties of composite materials at the microscopic scale through these finite element numerical simulation techniques, there are relatively few research reports on the interface properties of such materials and their deep-level damage evolution mechanisms.
In the study of the micromechanical behavior of SiCf/SiC ceramic matrix composites (CMCs), scholars have conducted in-depth explorations using methods such as mechanical experiments, microscopic structure characterization, and finite element numerical simulation, providing a theoretical basis for the structural design and application optimization of CMCs. Nevertheless, research on the interface strength and toughness of the materials remains relatively insufficient. Traditional experimental methods face challenges such as the long cycles and unstable performance. These challenges limit the possibility of in-depth analysis of complex failure mechanisms, thereby hindering the further development and optimization of SiCf/SiC CMCs and their extended structures. Hence, this study employs numerical simulation methods to construct representative volume element (RVE) models considering the principle of symmetry at the microscopic scale. The objective is to efficiently and accurately analyze the influence of the interface strength and toughness on the mechanical response behavior of the model under various loads. This will uncover the synergistic mechanisms and failure evolution laws among the material components, aiming to offer effective theoretical guidance and design optimization solutions for the application of SiCf/SiC CMCs in engineering practice.

2. Materials and Methods

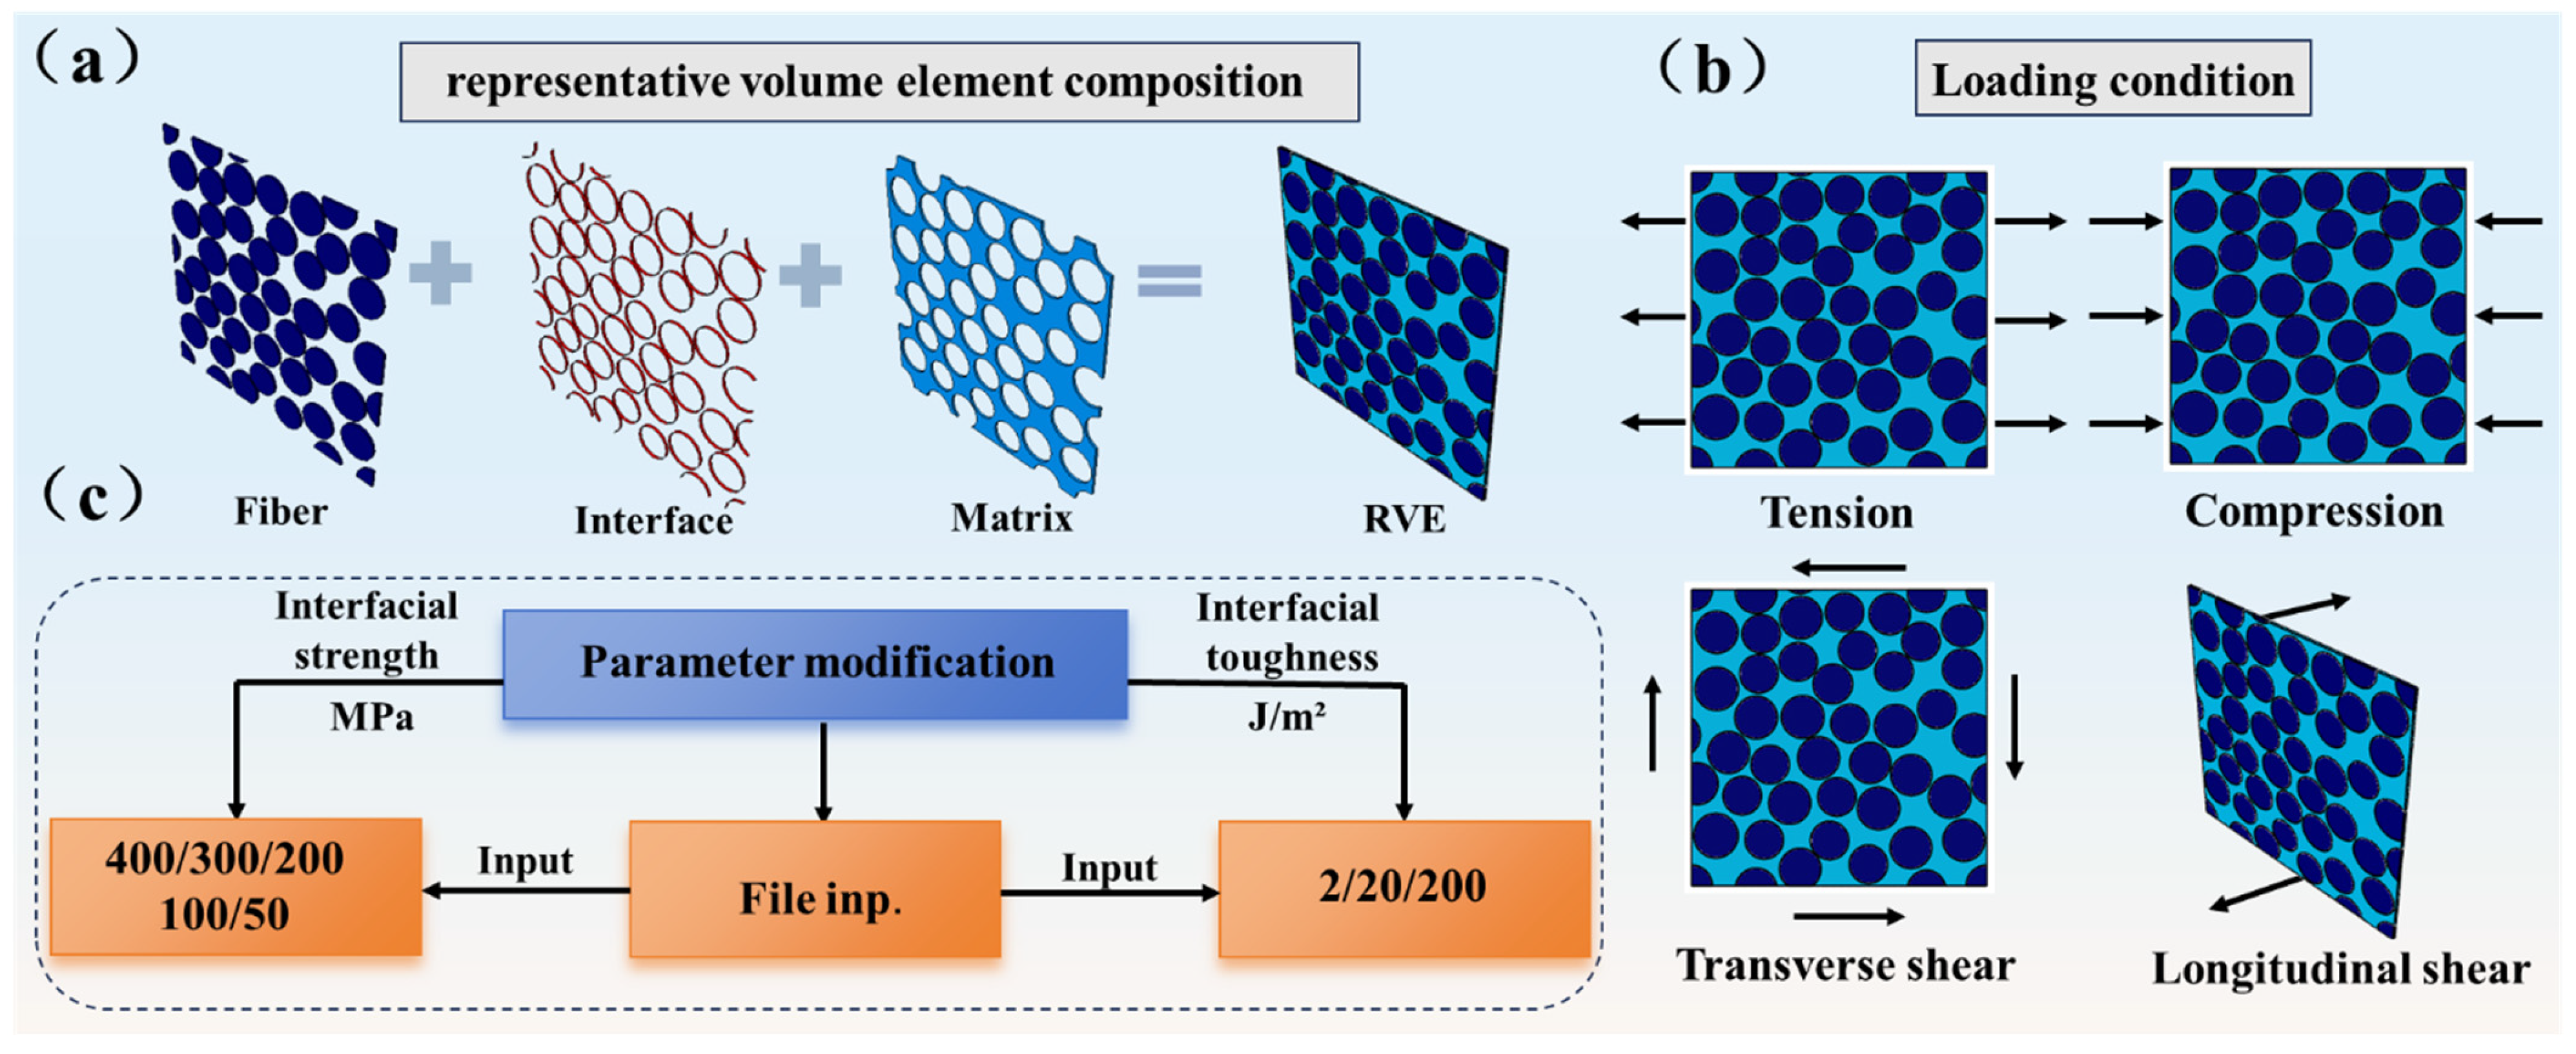
2.1. Construction of Microscopic Representative Volume Element

Due to the occasional inability of experimental methods to achieve the desired level of interface performance in CMCs, hindering subsequent research, this work aims to establish representative volume elements (RVEs) at the microscale using numerical simulation methods to set the parameters of the interface performance, thereby achieving controllability of the model interface performance and providing a research direction for subsequent work.
According to the research by J.R. Brockenbrough et al. [18], the square cross-section RVE model exhibits an excellent stress–strain response under transverse loading, which supports the small deformation assumption of the RVE model in this paper. Therefore, the square cross-section RVE model is chosen in this paper. Along the thickness direction of the RVE model along the fiber axis, F. Naya et al. [19] used an RVE model with a thickness of 0.5 μm to predict the mechanical properties of resin-based composites. Simulation results showed that using this thickness can meet the requirements for calculating the transverse mechanical properties of composite materials. Meanwhile, simulation experiments have shown that the use of different thicknesses in the RVE model has little effect on the calculation results of the transverse properties because there is no deformation gradient along the fiber axis direction during transverse loading. Therefore, in this paper, the thickness direction of the RVE model is set to 0.5 μm, with the thickness direction being represented by a single element. Additionally, to enhance computational efficiency and ensure accuracy, the cross-sectional dimensions of the RVE model in this study are set to 50 μm × 50 μm.
Thus, the discussion in this subsection is grounded on the framework of finite deformation theory [20]. The RVE model, depicted in Figure 1a, comprises fiber and matrix components, with the incorporation of the fiber/matrix interface. The fiber volume fraction in the RVE model is set at 60%, with a fiber diameter of 10 μm. The fiber/matrix interface is represented by cohesive elements to exclude the influence of the interface strength. The matrix is meshed using 8-node linear hexahedral elements (C3D8T), while the fibers are meshed using 6-node linear wedge elements (C3D6). The interface between the fiber and the matrix is meshed using 8-node 3-dimensional cohesive elements (COH3D8) to account for the interface debonding effects. The converged finite element model comprises approximately 11,145 solid elements, 1278 cohesive elements, and 15,274 nodes, representing a sufficiently refined discretization. Additionally, the mesh size of the RVE model is set to 0.5, 0.7, and 1.0, and the convergence of the mesh is validated through simulations under transverse tensile loading. Therefore, the grid size used in this article is 1.0 μm, which ensures convergence and high accuracy while further reducing the computational time cost of the model.
Simultaneously, the fiber/matrix interface is considered a perfect interface, and the RVE model is assumed to be free of porosity. Additionally, to characterize the overall macroscopic properties of SiCf/SiC composites using the RVE, the silicon carbide fibers intersecting with the RVE boundary are cut along the boundary. The internal portion of the boundary is retained, and the remaining portion is moved to the symmetric side to ensure the periodicity [21] and symmetry of the model boundary. In numerical simulations, the fiber is characterized by linear elasticity and isotropy, while the ceramic matrix is a brittle material. After the model is constructed, the material parameters for each component of SiCf/SiC composite materials are assigned. The specific parameters are listed in Table 1. Meanwhile, based on the parameters in Figure 1, different interface strengths and interface toughness are input for different loading conditions to explore their effects on mechanical performance.

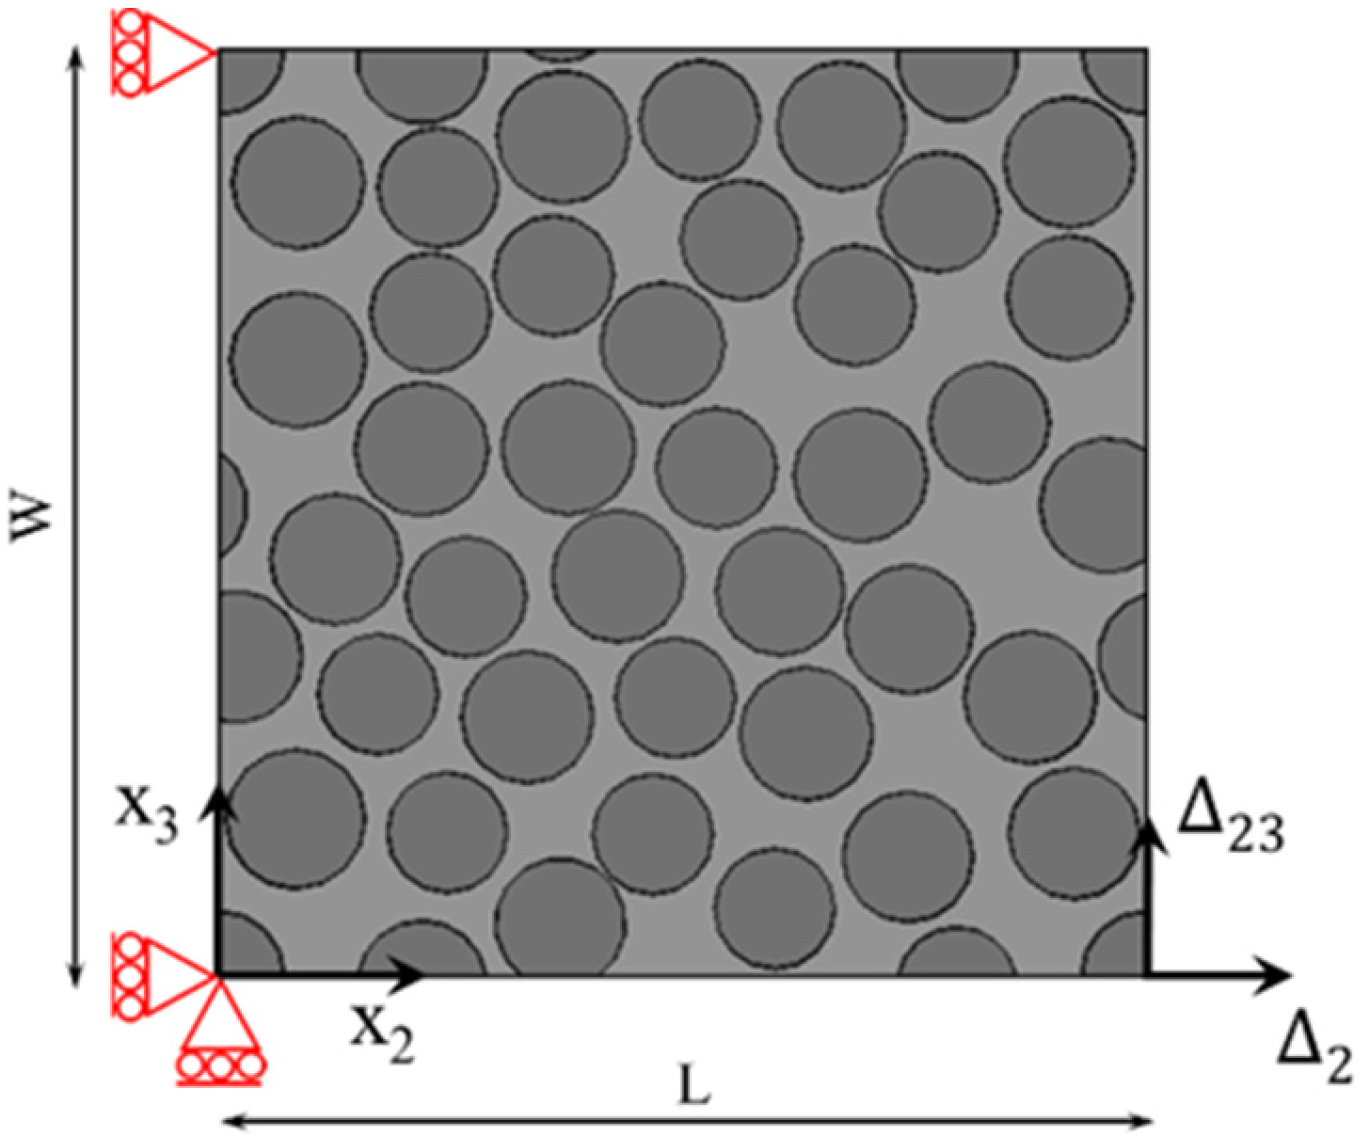
2.2. Periodic Symmetric Boundary Condition

In the structure of ceramic matrix composites, there are microscopic units known as cells that can form the entire macroscopic structure solely through translation without any rotation. The finite element method based on microscopic unit cells can yield stress–strain distributions and damage characteristics at the microscopic level of the material. In the microscopic mechanical analysis of composite materials, the RVE is a broader concept than a unit cell. To represent a typical unit cell within the macroscopic composite material, an RVE model should possess geometric periodic symmetry and satisfy the assumption of small deformations [26,27].
Applying periodic symmetric boundary conditions [28] to the edges of the RVE model ensures continuity and symmetry between adjacent unit cells, thus enabling the accurate determination of the microscopic mechanical properties of the unit cell.
As shown in Figure 2, the periodic symmetric boundary conditions can be represented using displacement vectors related to the displacement U 2 and U 3 , as in Equations (1) and (2).
u ( 0 , x 3 ) u ( L 0 , x 3 ) = U 2
u ( x 2 , 0 ) u ( x 2 , L 0 ) = U 3
The combined uniaxial tension/compression along the x2 axis and the plane shear out-of-plane are determined by U 2 = ( Δ 2 , Δ 23 ) and U 3 = ( u 2 , u 3 ) together, where the sign of Δ 2 in the RVE model represents tension or compression, and Δ 23 represents shear deformation.

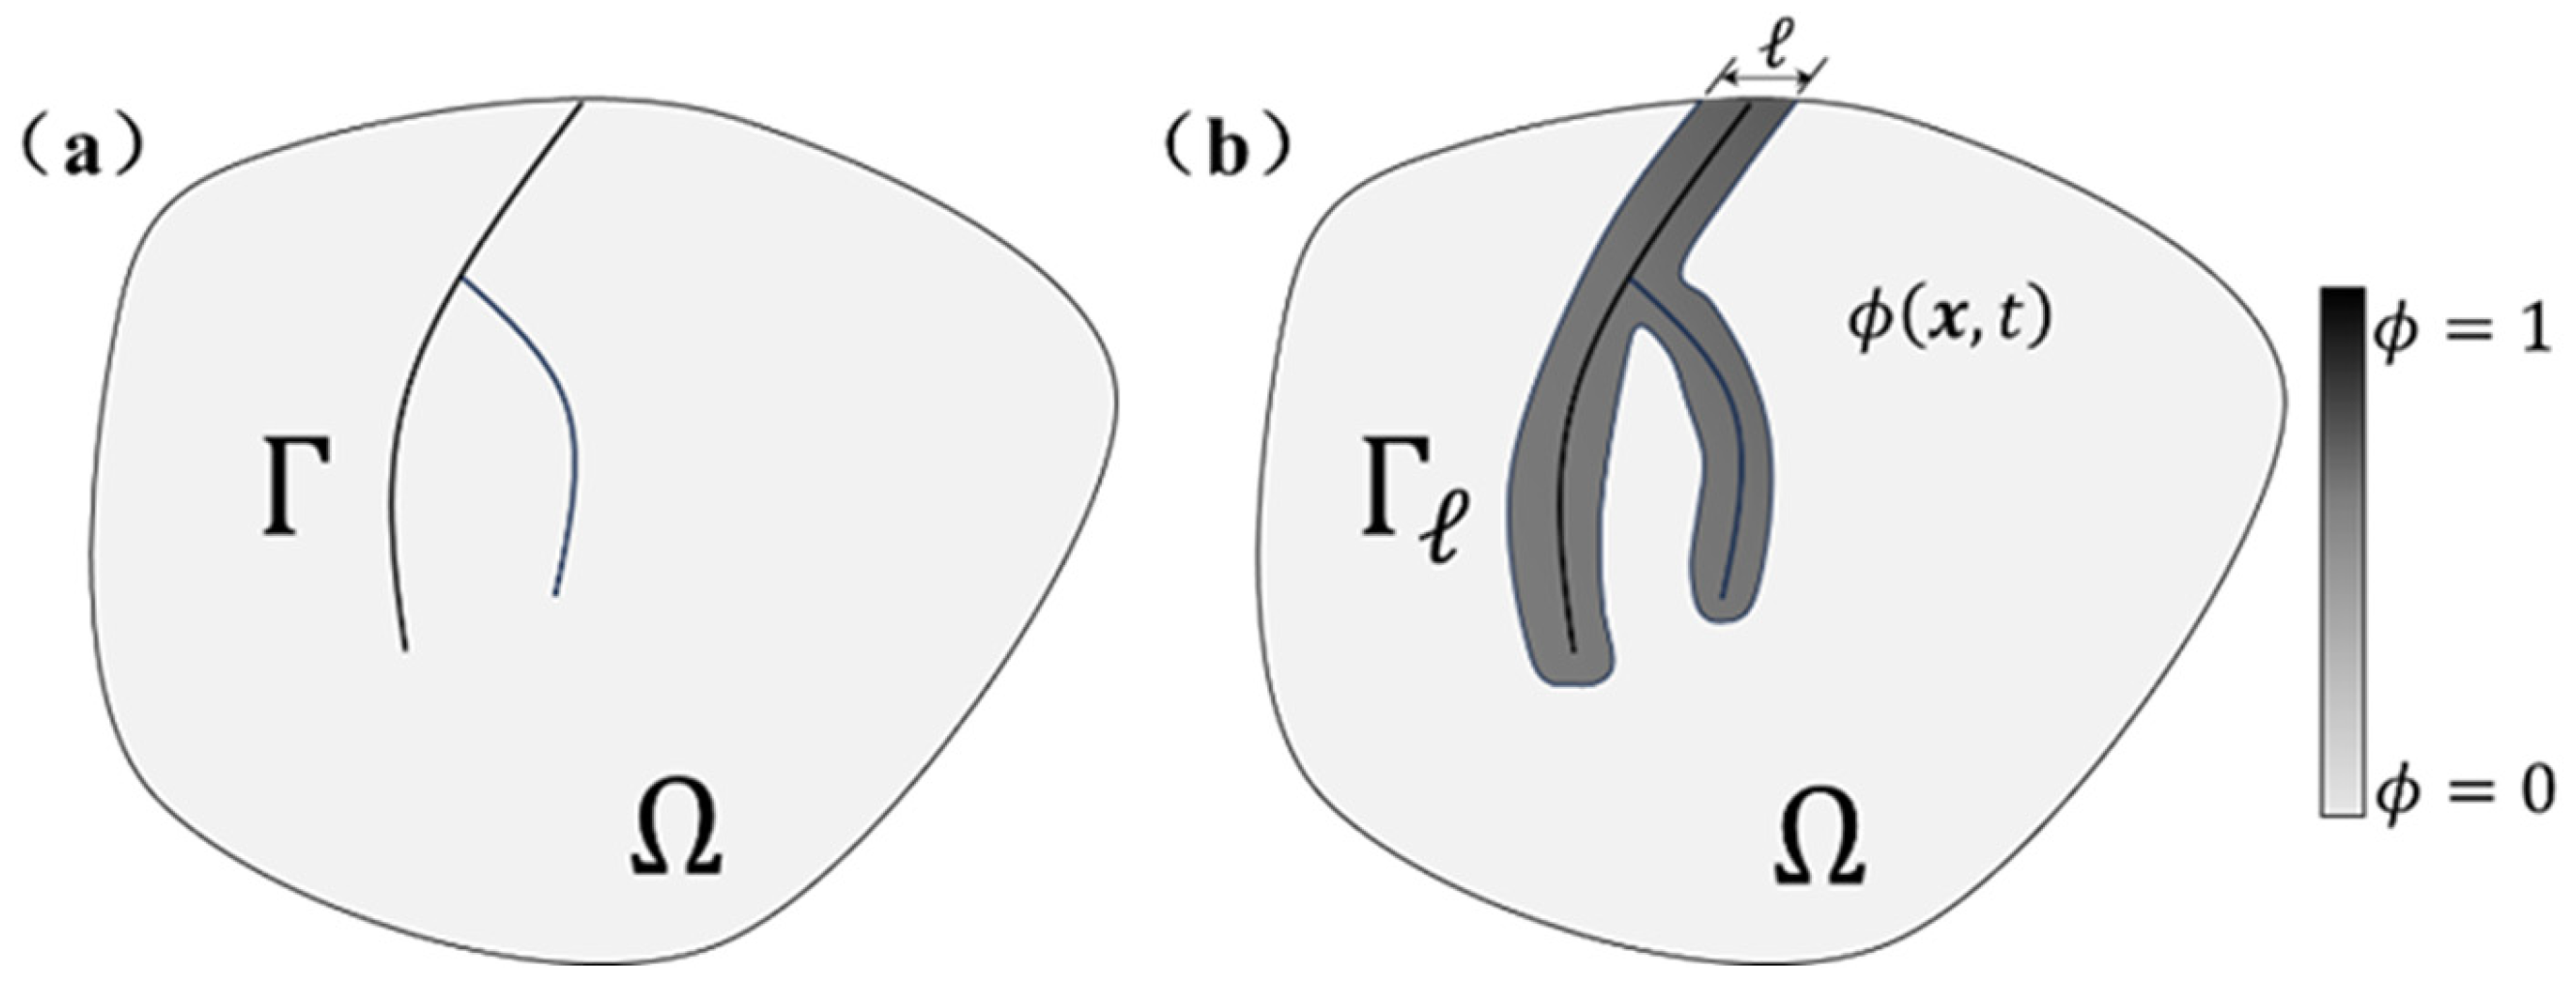
2.3. Ceramic Matrix Phase-Field Damage Model

Silicon carbide ceramics, being brittle materials, require a description of the crack initiation and propagation during failure. Phase-field damage theory [29] achieves this by introducing a scalar phase field (ranging from 0 to 1) to represent the extent of the fracture or damage from the intact to completely damaged states. This approach predicts the failure process of the material and is often utilized to assess the overall extent of the material degradation. This model can not only predict the failure of ceramic matrix composites but also analyze the asymptotic evolution process of structural damage in concrete [30] and organic glass [31].
The asymptotic phase-field damage method is founded upon Griffith’s thermodynamic principles [32]. Griffith’s energy-based failure criterion can be expressed in variational form. Considering an arbitrary object Γ with internal discontinuous boundaries Ω I R n ( n [ 1 , 2 , 3 ] ) , the total potential energy of the object consists of strain energy Ψ and fracture energy Gc, as shown in Equation (3):
Π ( u ) = Ω Ψ ( ε ( u ) ) d V + Γ G c D S
where u and ε = ( u + u ) / 2 , respectively, represent the displacement field and strain field. The uncertainty surrounding the propagation of cracks in brittle materials hinders the minimization of the Griffith’s energy functional in Equation (3) However, one can introduce a continuously varying auxiliary phase-field variable ϕ to track the initiation and propagation of cracks, regularizing sharp cracks inside the object into diffuse localized bands with infinite support. ϕ is a damage parameter ranging from 0 to 1. It takes the value of 0 in undamaged regions and 1 within the cracks, as illustrated in Figure 3.
In accordance with continuum damage mechanics, the degradation function of the strain energy Ψ is defined. This function g ( ϕ ) = ( 1 ϕ ) 2 reduces the stiffness of the material as the crack damage evolves and it possesses the following properties: when ϕ = 0 , g = 1; when ϕ = 1 , g = 0. Therefore, the total potential energy can be reformulated as Equation (4):
Π L ( u , ϕ ) = Ω ( 1 ϕ ) 2 Ψ ( ε ( u ) ) d V + Ω G c ( ϕ 2 2 L + L 2 | ϕ | 2 ) d V
where “L” is the length scale parameter controlling the size of the fracture process region.
However, classical standard phase-field asymptotic damage models require pre-setting the material’s characteristic crack length, treating it as a material property rather than a numerical parameter. This renders the predictive results of the model susceptible to the choice of the characteristic length value. Wu et al. [33,34,35] proposed a phase-field damage model that does not rely on inputting characteristic crack length scales. In contrast to existing phase-field damage models, this model requires only a small number of material parameters to accurately describe the quasi-brittle/brittle fracture behavior of the object. The model indicates that the crack length scale parameter, as a numerical factor, does not impact the ultimate global response of the material but solely influences the visual morphology of the crack. According to the work of Wu et al., the total potential energy of the phase-field damage model with insensitive crack length scale parameters is controlled by the following two characteristic functions (5) and (6):
g ( ϕ ) = ( 1 ϕ ) 2 ( 1 ϕ ) 2 + a 1 ϕ · ( 1 1 2 ϕ ) , a 1 = 4 E G c L c 2
Y ( ϕ , ϕ , L ) = 2 ϕ · ϕ 2 L + ϕ · ϕ π 2
where E represents the modulus of the solid material, G c denotes the fracture energy of the material (J/m2), and c represents the cohesive strength.

2.4. Fiber/Matrix Cohesive Model

Modeling the fiber/matrix interface is a crucial component of establishing the microscopic RVE model. Since Barenblatt [36] and Dugdale [37] proposed the cohesive zone model (CZM) theory to address the problem of elastoplastic fracture in ductile metal materials, scholars [38,39] have refined and developed this theory. Currently, this theory is widely applied in the study of the damage mechanisms in composite materials. In this section, the inherent CZM is applied to the debonding behavior at the fiber/matrix interface in CMCs. The stiffness degradation of zero-thickness cohesive elements is utilized to simulate the propagation of cracks at the fiber/matrix interface. When the interface is undamaged, the traction-displacement response on both sides of the interface exhibits linearly increasing behavior. The quadratic interaction criterion defines the form of the damage evolution at the interface. It is defined as:
( t n t n 0 ) 2 + ( t s t s 0 ) 2 + ( t t t s 0 ) 2 = 1
where tn, ts, and tt, represent the normal stress and the two shear stresses acting on the interface, and t n 0 , t s 0 , and t t 0 are the corresponding strength values of the stress components. When the state of the interface layer element results in the value on the left-hand side of the equation being equal to 1, it is considered that damage has occurred at the interface.

3. Results and Discussion

3.1. Validation of the RVE Model Effectiveness

To validate the effectiveness of the RVE model in predicting the failure behavior of ceramic matrix composites under load, comparisons are performed between the results obtained from the Chamis formula [40] and those from the RVE model’s loading. The predictions of the Chamis model for the tensile strength YT, compressive strength YC, longitudinal shear strength S12, and transverse shear strength S23 of composite materials are given by Equations (8), (9), (10) and (11), respectively:
Y T = [ 1 ( V f V f ) ( 1 E m E f ) ] σ m T
Y C = [ 1 ( V f V f ) ( 1 E m E f ) ] σ m C
S 12 = [ 1 ( V f V f ) ( 1 G m G f ) ] τ m
S 23 = S 12
where the subscripts f and m denote the fiber and matrix, respectively, V f is the fiber volume fraction, Em and Gm represent the elastic modulus and shear modulus of the matrix, Ef and Gf represent the elastic modulus and shear modulus of the fiber, and σ m T , σ m C , and τ m represent the tensile strength, compressive strength, and shear strength of the matrix, respectively.
In Table 2 and Table 3, RVE-1, RVE-2, and RVE-3 represent RVE models with different fiber distributions. The finite element method was utilized to predict the equivalent elastic and strength properties of single-layer ceramic matrix composite RVE models with three different fiber distributions. These results were then compared with the numerical analytical solutions obtained from the Chamis model, and the outcomes are presented in Table 2 and Table 3. The results indicate that the random distribution of fibers has almost no impact on the elastic properties but can lead to some differences in the strength. This is primarily because changes in the fiber distribution alter the crack propagation paths, resulting in differences in the final strength. In predicting the elastic properties, the RVE model is nearly consistent with the Chamis model, with the errors within 5%. This indicates the reliability of the RVE model in predicting the mechanical properties of single-layer composites.
In conclusion, the finite element RVE model established in this section can be utilized for further studies on the mechanical properties of single-layer ceramic matrix composites in subsequent sections.

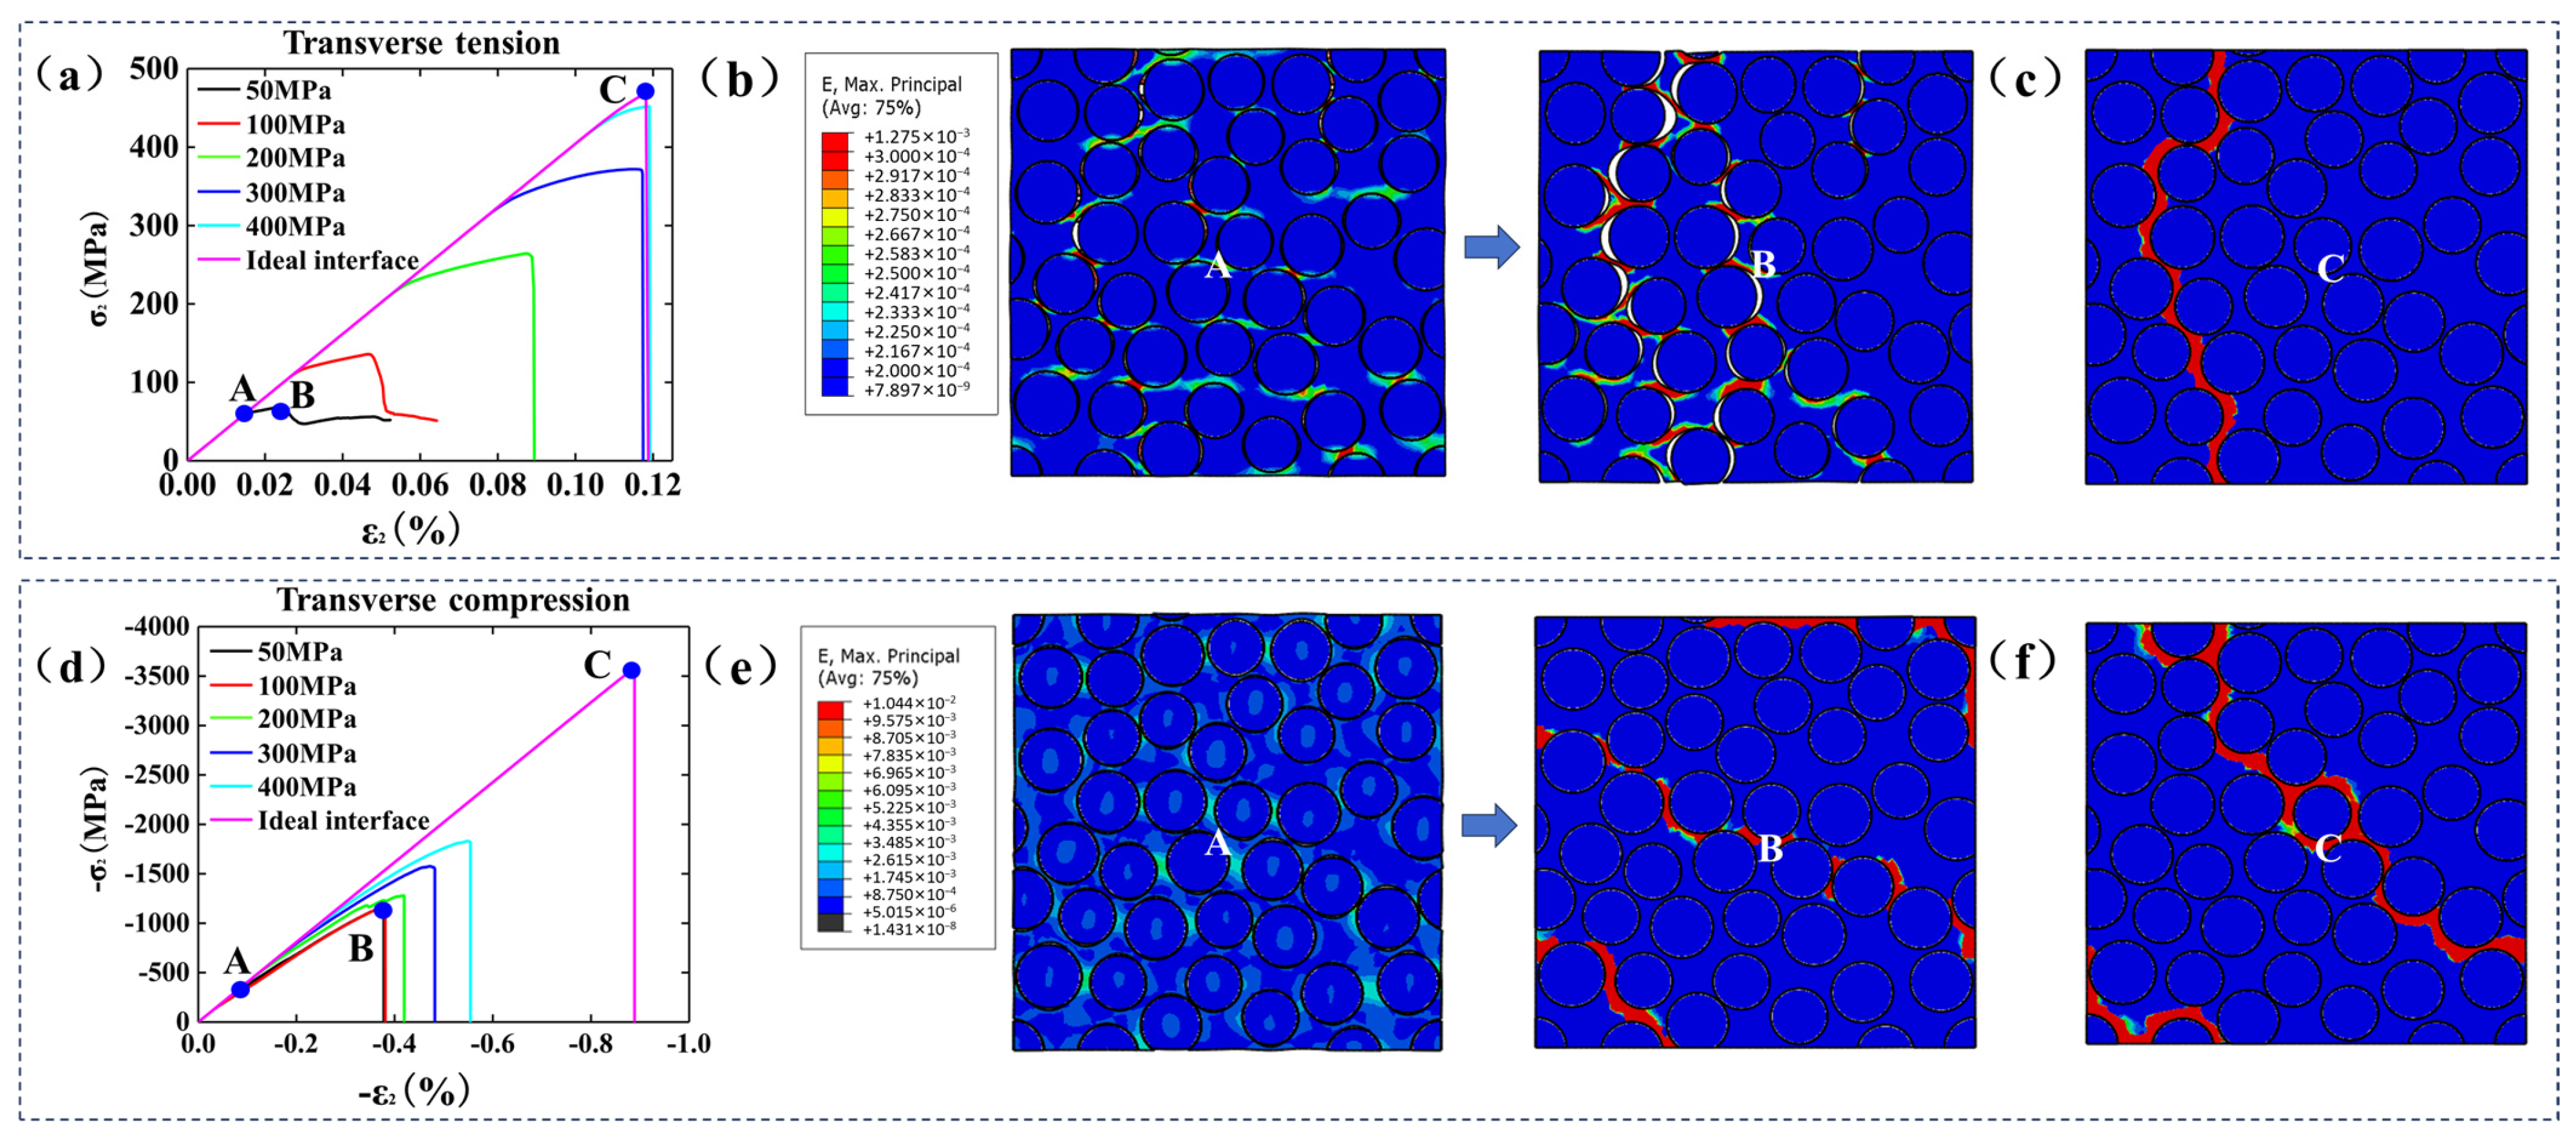
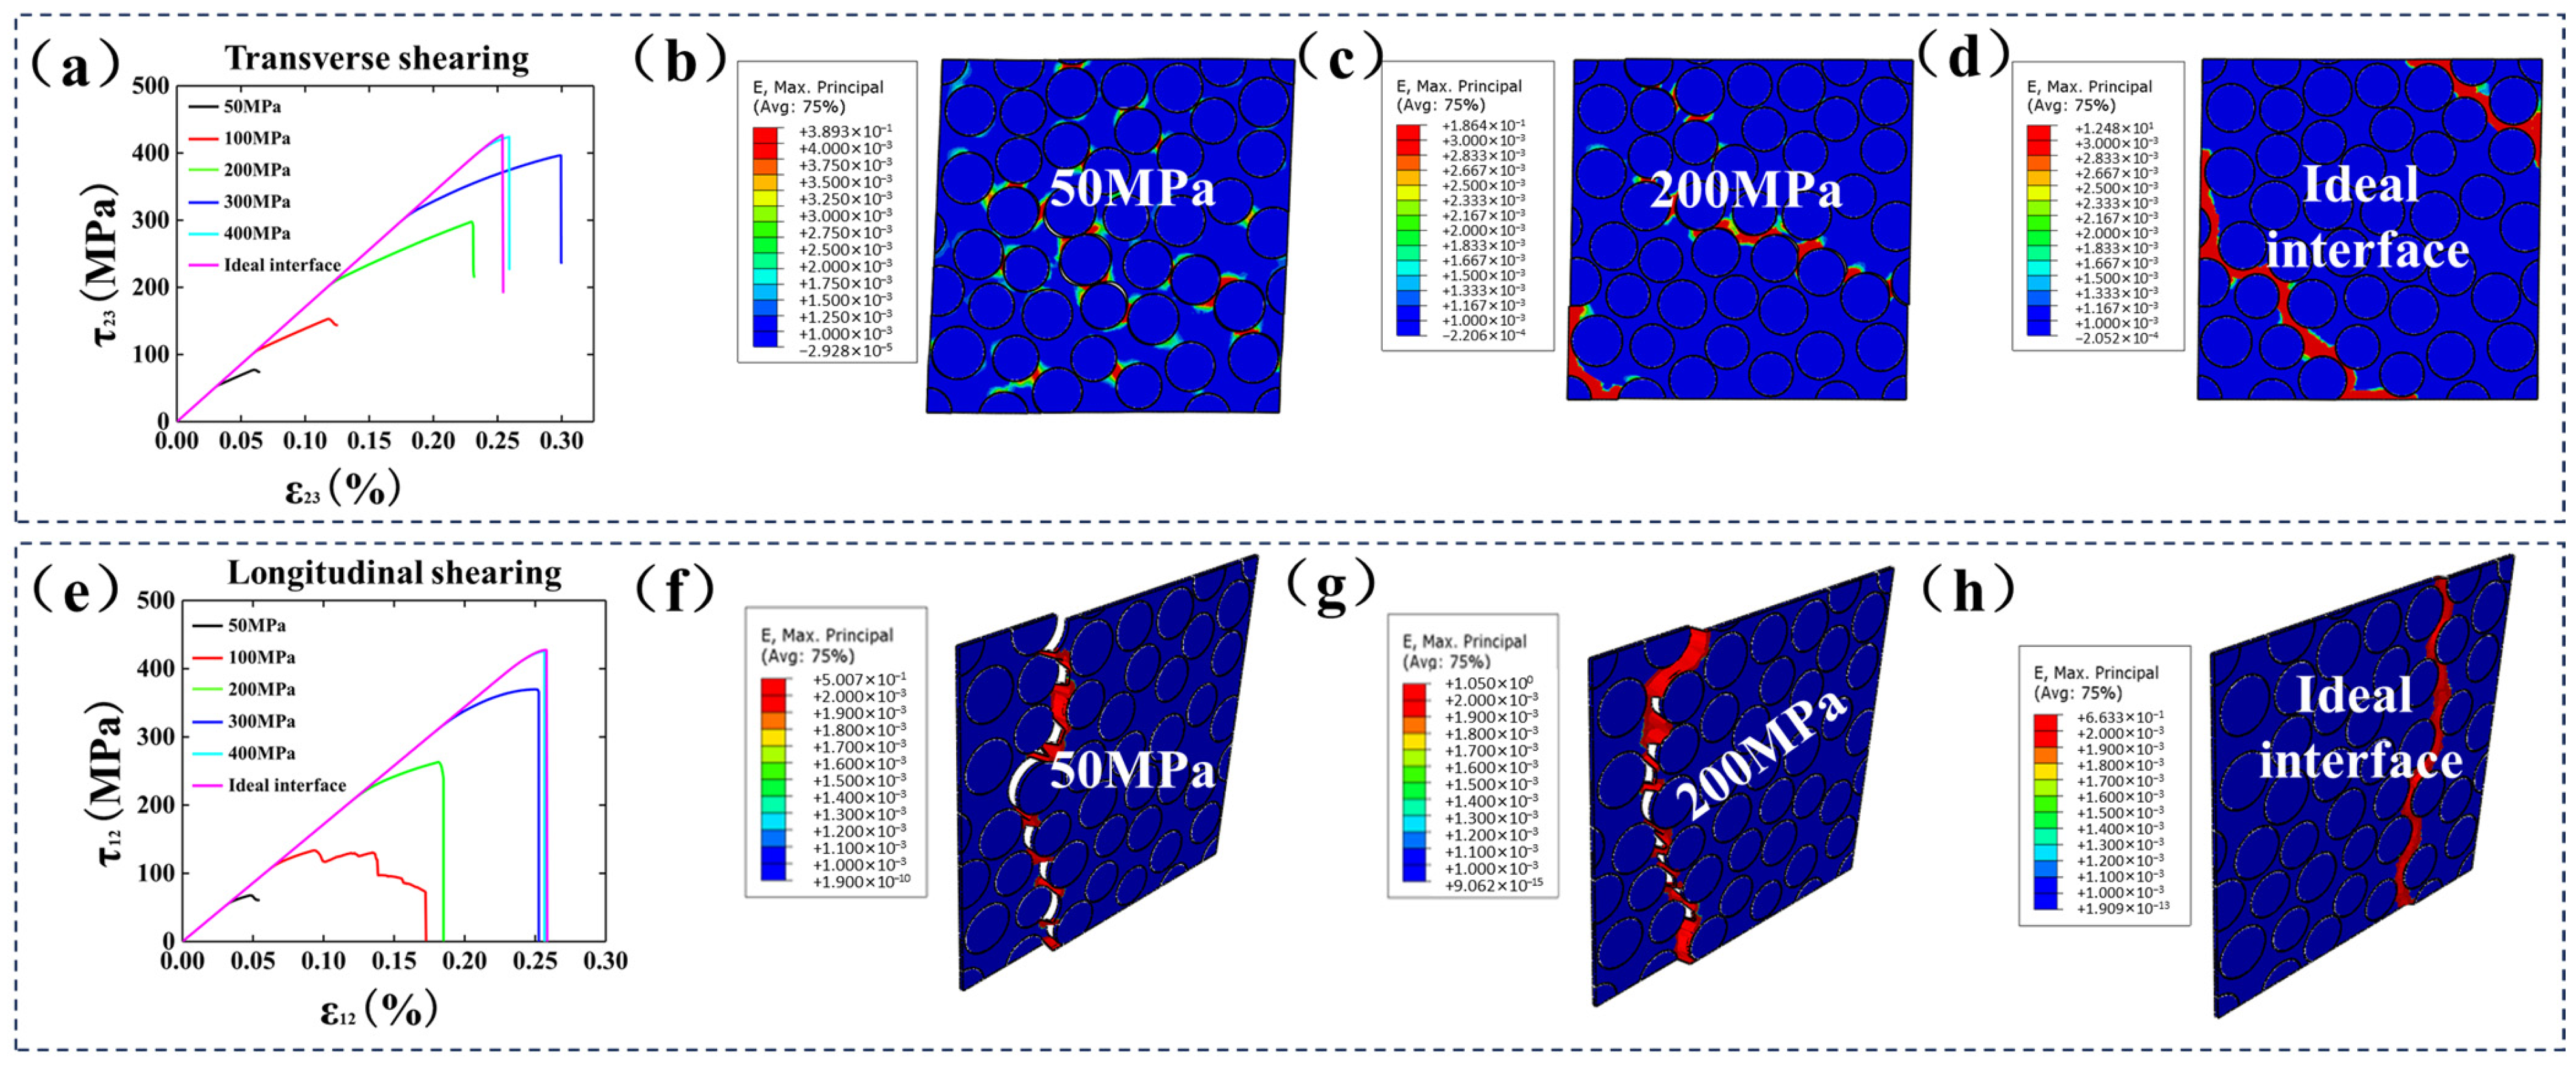
3.2. Impact of Interfacial Strength on Mechanical Behavior under Uniaxial Loading

To investigate the influence of the interfacial strength on the failure behavior of UD-CMCs, this investigation established six distinct groups of interfacial strengths through numerical simulation techniques, namely, the perfect interface, 400 MPa, 300 MPa, 200 MPa, 100 MPa, and 50 MPa. Additionally, the UD-CMC RVE model underwent transverse tension, compression, and transverse/longitudinal shear loading.
Figure 4a–f depict the numerical simulation stress–strain curves and damage strain contours for the RVE models with different interfacial strengths under transverse tensile and compressive loads. Under transverse tensile load, the stress–strain curve exhibits three mechanical response phases: the linear elastic phase, the damage accumulation phase, and the fracture failure phase. The three mechanical response stages derived from the numerical simulations closely align with the damage and failure mechanisms observed in experiments conducted by Liu et al. [41] for SiCf/SiC ceramic matrix composites. Comparing Figure 4a,d leads to the conclusion that the interfacial strength does not affect the stress–strain response trend of UD-CMCs, but the ultimate failure strength is influenced by the interfacial strength. This aligns well with the research conducted by Pu et al. [42] on the influence of the interfacial strength on the transverse tensile behavior of RVE models.
Under transverse tensile loading, the failure contour of the 50 MPa weak interface model exhibits multiple irregular fracture cracks; in contrast, the failure contour of the perfect interface model displays a single through crack perpendicular to the direction of the tensile loading. The stress–strain curve shown in Figure 4a and the failure map depicted in Figure 4c demonstrate good alignment with the research findings of Peng et al. [43], thus indicating consistency. Moreover, the transverse tensile strength of the 50 MPa weak interface model decreased by 85.32% compared to that of the perfect interface model. The primary reason for the aforementioned phenomenon is that the presence of a weak interface acts as a defect in the ceramic matrix composites, accelerating the propagation of microcracks. When a transverse tensile load is applied to the RVE model, the weaker interface bond strength is the first to undergo debonding damage and failure. Conversely, a stronger interface bond strength can effectively withstand the transverse tensile load, thereby enhancing the material’s transverse tensile strength. Feng et al. [17] examined the impact of weak interfaces on the material failure, damage, and crack propagation in their investigation of the failure modes in unidirectional ceramic matrix composites across diverse loading conditions. This study can provide literature validation for the current research.
Under transverse compressive loading, the stress–strain curves all exhibit an approximately linear ascending process. When the transverse compressive strain reaches a certain value, the transverse compressive stress suddenly drops vertically from its maximum to 0 MPa, demonstrating the typical brittle failure mode of ceramic matrix composites. The influence of different interfacial strengths on the mode of failure under transverse compressive loading is manifested in the damage contour maps as variations in the angles of fracture cracks: When the interface is perfect, the direction of the fracture cracks exhibits a 45-degree failure angle relative to the direction of the transverse compressive loading, whereas with a weak interface, the angle of the fracture cracks relative to the direction of the transverse compressive loading is greater than 45 degrees. The aforementioned phenomenon arises because when ceramic matrix composites are subjected to transverse compressive loading, the weak interfaces are compromised, resulting in fiber slippage within the material. This causes the cracks to deflect, altering the crack propagation path and subsequently affecting the angle of the cracks in the material. Wan et al. [13] examined the impact of the interface strength on the transverse compressive performance of randomly arranged fiber configurations in RVE models. By comparing the stress–strain curve and failure map derived from our RVE model under transverse compression loading with Wan et al.’s research findings, we observed a significant alignment. This observation underscores the reliability and applicability of the results presented in our study.
Figure 5a–h depict the stress–strain curves and damage strain cloud maps of single cells under different interface strengths subjected to transverse shearing and longitudinal shearing, respectively. It is apparent that as the interface strength gradually increases, the relative growth rate of the transverse shearing strength progressively diminishes, with values of 97.97%, 94.60%, 33.18%, 6.97%, and 0.66% in sequence. Similarly, the relative growth rate of the longitudinal shearing strength also decreases gradually, with values of 97.76%, 96.86%, 40.55%, 15.20%, and 0.37% in sequence. The declining relative growth rates of the transverse and longitudinal shearing strengths indicate that increasing the interface strength does not sustainably enhance the transverse and longitudinal shearing strengths.
From Figure 5a,e, it can be inferred that the RVE model exhibits earlier crack initiation and crack propagation failure under weak interface conditions compared to strong interface conditions. The stress–strain curve also enters the nonlinear response stage earlier. At an interface strength of 50 MPa, the RVE model exhibits crack initiation at a transverse shearing strain of 0.032%. In contrast, under an interface strength of 400 MPa, the RVE model shows crack initiation at a transverse shearing strain of 0.24%. The difference in the shearing strain at which crack initiation occurs between these two interface strength conditions is 7.5 times. The main reason for the observed phenomenon is that when transverse/longitudinal shearing loads are applied to the RVE model, the interface layer with weaker strength experiences adhesive damage failure first, leading to crack initiation. Conversely, the interface layer with stronger strength can withstand transverse/longitudinal shearing loads well, thus delaying the onset of crack initiation.
Figure 5b, Figure 5c and Figure 5d, respectively, depict the equivalent strain cloud maps of RVE models with different fiber/matrix interface strengths under transverse shearing loads when they experience final failure. Under weak interface conditions, the transverse shearing section failure angle of the RVE model is greater than 45°, and multiple fracture cracks are present. Under strong interface conditions, the transverse shearing section of the RVE model exhibits a failure angle of 45°, with only one fracture crack penetrating the model. From Figure 5f–h, it can be observed that the interface strength has little influence on the final failure morphology of the RVE model under longitudinal shearing. Both weak and strong interface conditions show an equivalent strain cloud map with a vertical crack penetrating the model during the final longitudinal shearing failure, and the weak interface model exhibits crack fracture positions and morphologies identical to those of the strong interface model.
Zhou et al. [44] conducted a study on the mechanical response and damage evolution process of microscale single-cell in-plane and out-of-plane shear in ceramic matrix composites. Their findings revealed a notable similarity in the equivalent stress–strain curves for both in-plane and out-of-plane shear, along with comparable strengths. Our investigation into the mechanical response and damage evolution of in-plane and out-of-plane shear in ceramic matrix composite RVE models shows excellent consistency with Zhou et al.’s research findings. This demonstrates that the simulation approach employed in this study serves as a robust tool for studying the mechanical behavior of ceramic matrix composites under both in-plane and out-of-plane shear.

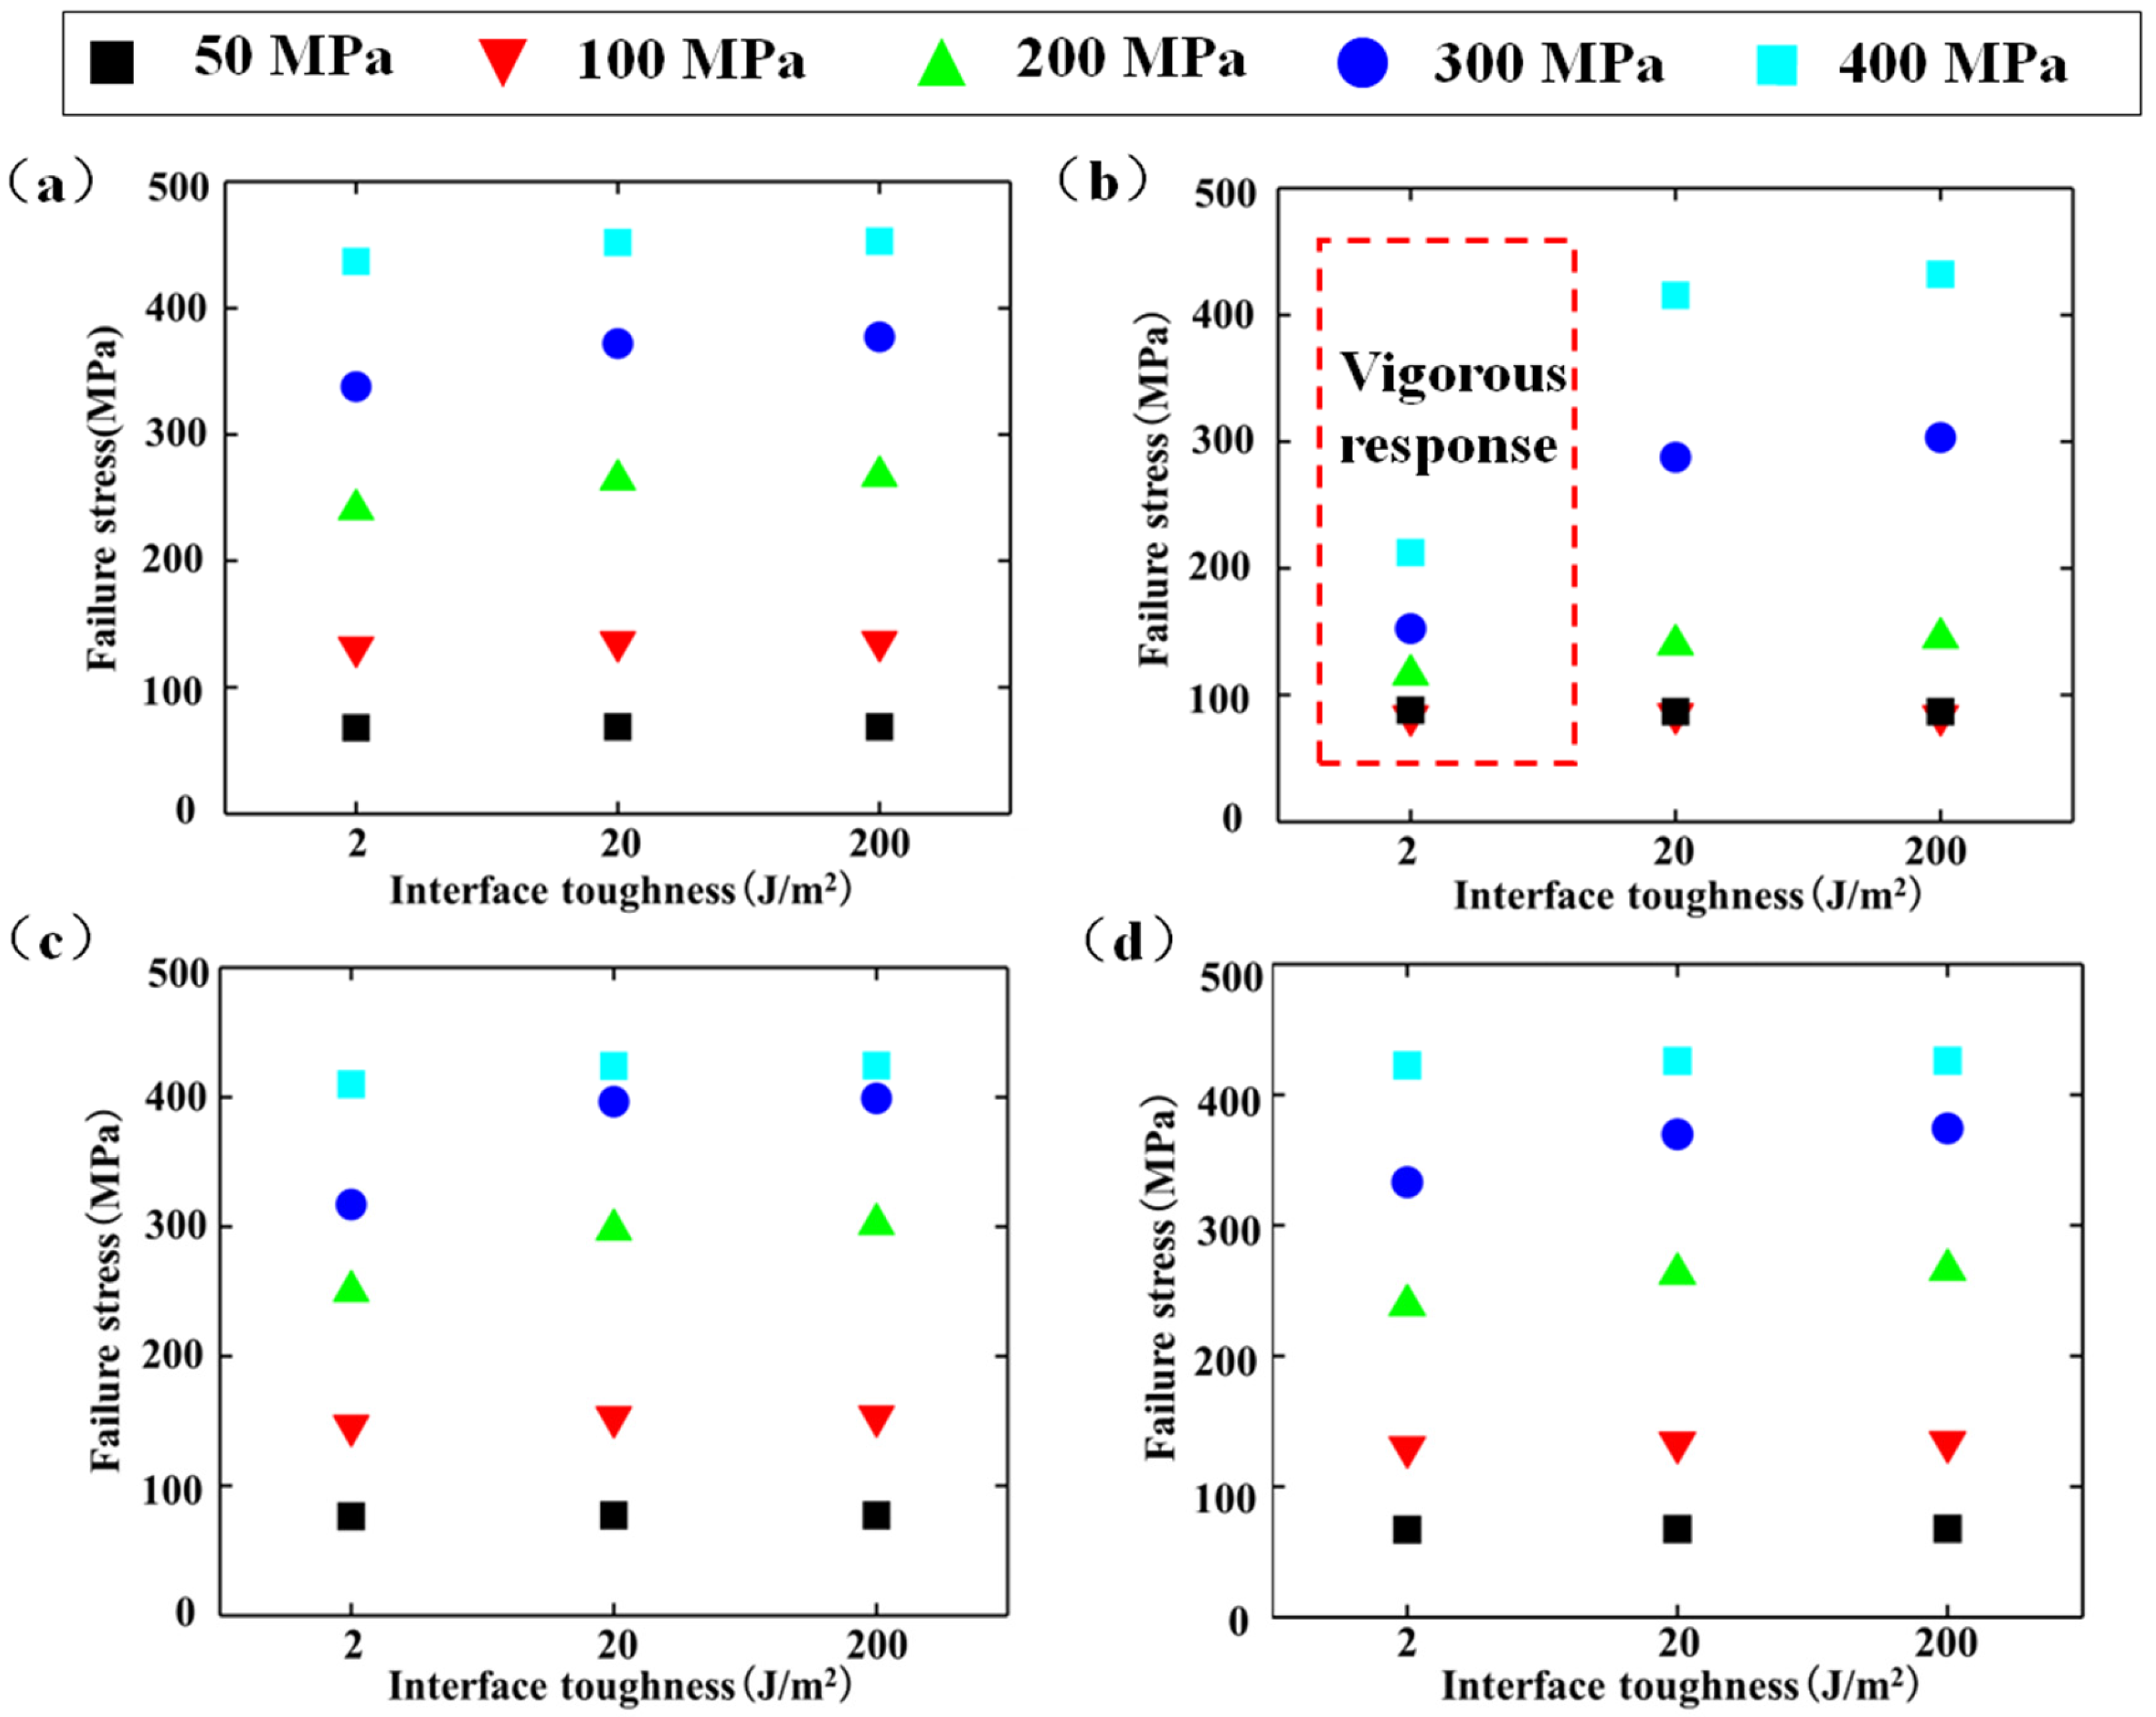
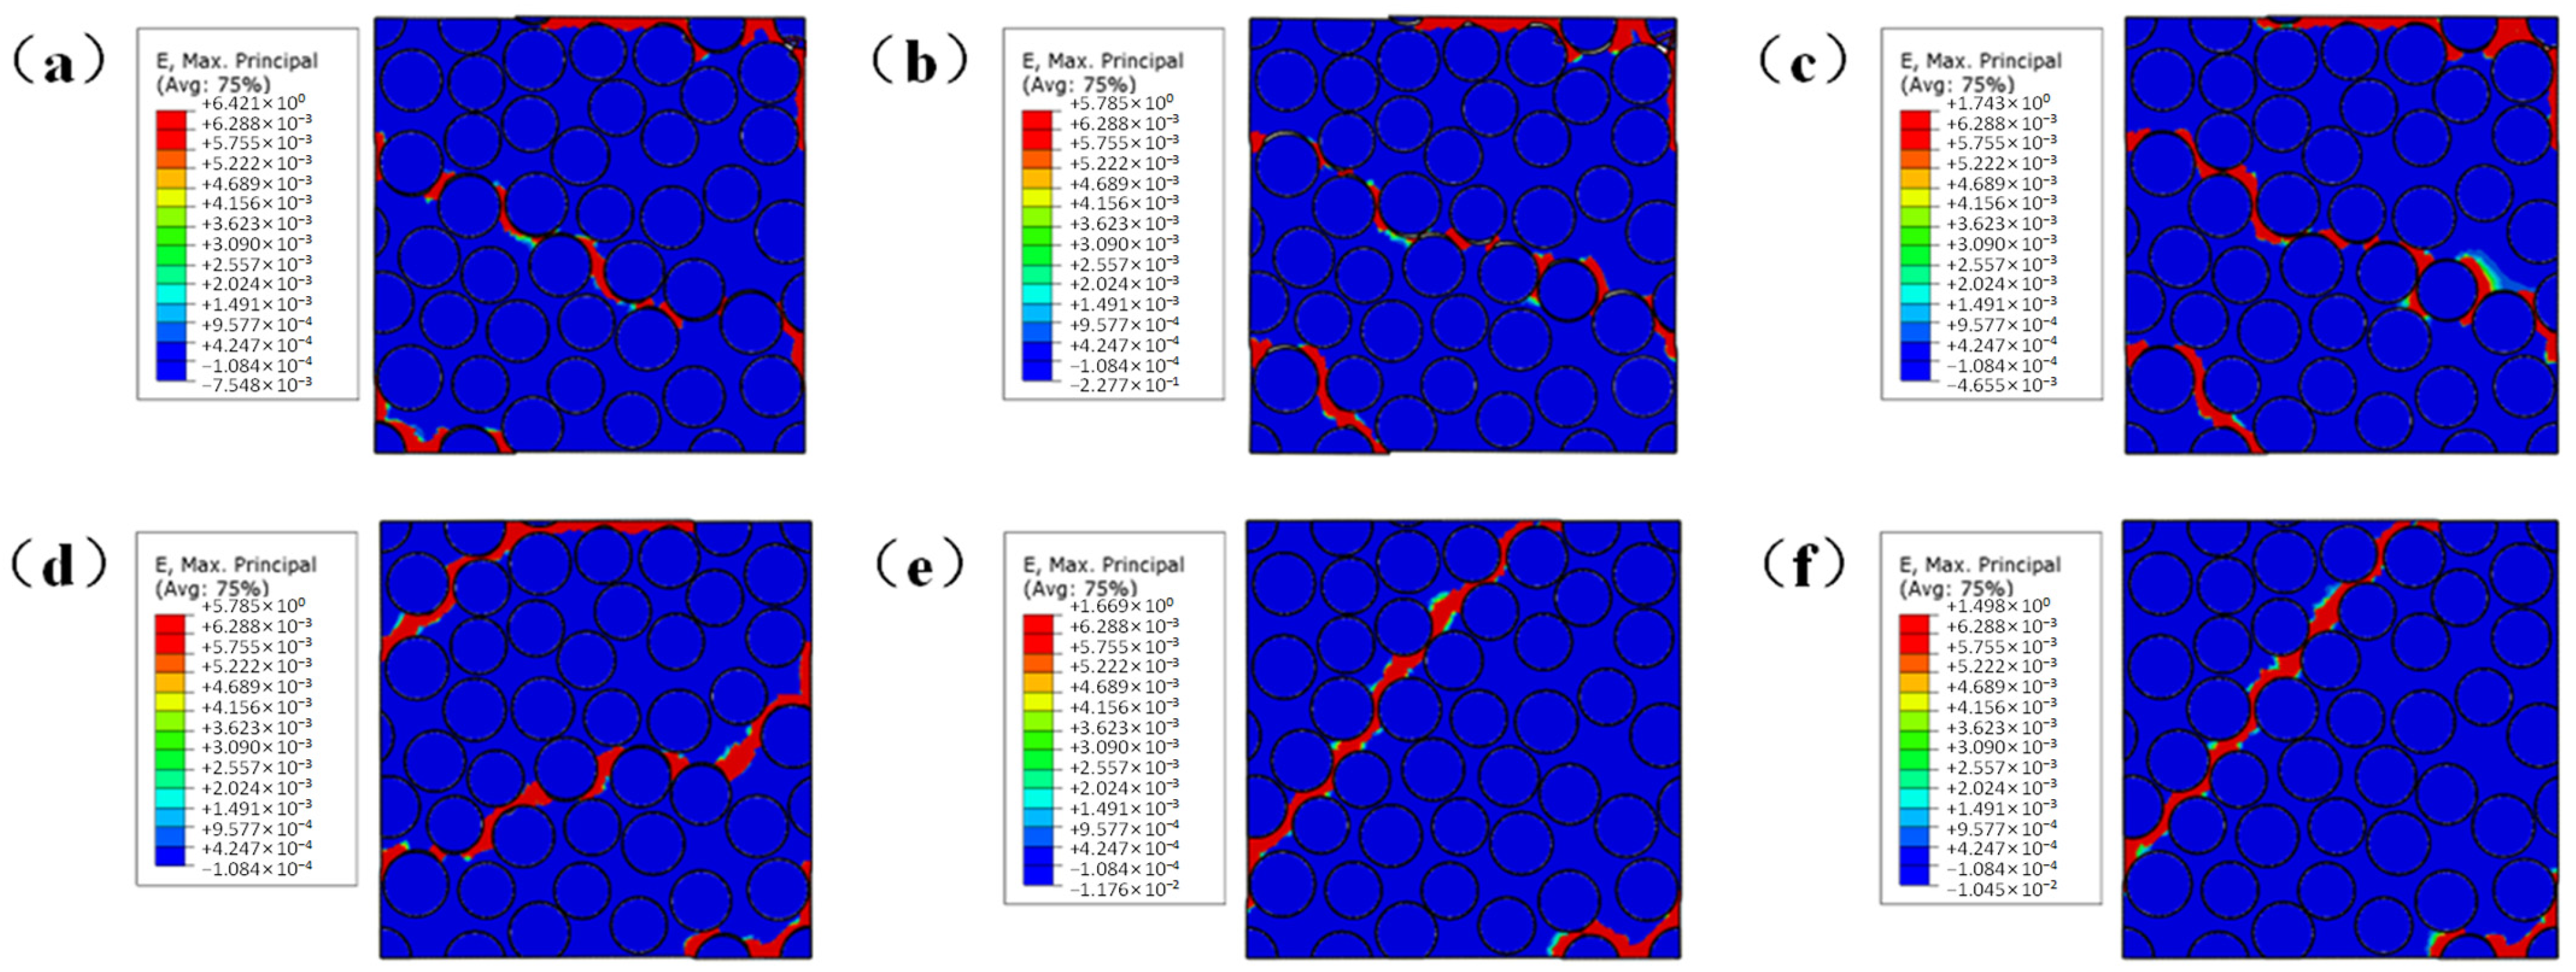
3.3. Impact of Interfacial Toughness on Mechanical Behavior under Uniaxial Loading

To delve deeper into the impact of mesoscopic parameters on the failure characteristics of UD-CMCs, this study developed three representative volume element (RVE) models incorporating different interface toughness values (2 J/m2, 20 J/m2, and 200 J/m2) across five distinct groups of interface strengths (50 MPa, 100 MPa, 200 MPa, 300 MPa, and 400 MPa). The UD-CMCs were subjected to transverse uniaxial tension, transverse uniaxial compression, transverse shear, and longitudinal shear loading conditions. The strength at failure was then extracted, as depicted in Figure 6. The increase in the interfacial fracture energy has a minimal impact on the transverse tensile, transverse shear, and longitudinal shear failure strength of the ceramic matrix composite at a consistent interfacial strength. The primary determinant of the mechanical strength in ceramic matrix composites is the interface strength, making it crucial for the overall performance. Even a weak interface with a strength of 50 MPa significantly influences the mechanical properties of the composite more than a high toughness interface. Therefore, under the same interface strength condition, increasing the interface toughness from low to high has nearly no effect on the failure strength of the transverse tensile, transverse shear, and longitudinal shear of the ceramic matrix composite.
Upon further analysis of Figure 6b, it becomes evident that the compressive strength during failure under transverse compressive loading is significantly influenced by the interface toughness. Under conditions of weak interfacial strength, increasing the interfacial toughness has a minimal effect on the ultimate failure stress of transverse compression of CMCS. In conditions of strong interface strength (300 MPa and 400 MPa), the transverse compression strength increases significantly with the rise in the interface toughness from 2 J/m2 to 20 J/m2. For instance, under the 400 MPa interface strength condition, when the interface toughness increases from 2 J/m2 to 20 J/m2, the compression strength increases by 28.49%. However, with further increases in the interfacial toughness from 20 J/m2 to 200 J/m2, the transverse compressive ultimate failure stress stabilizes. This observation suggests that strong bonding at the fiber/matrix interface increases the sensitivity of the ceramic matrix composite to changes in the interface toughness under transverse compression loading.
Figure 7 shows the equivalent strain cloud diagram of the RVE model under transverse compressive loading at final failure, highlighting the influence of the interface toughness for two different interfacial strength conditions (50 MPa and 400 MPa). From Figure 7a–c, it is evident that increasing the interface toughness has no discernible effect on the damage failure cloud diagram of the RVE model with a weak interface strength of 50 MPa under transverse compressive loading. The failure cloud maps corresponding to all the surface toughness values (2 J/m2, 20 J/m2, and 200 J/m2) exhibit similar damage morphology characteristics, where the main crack direction aligns at approximately a 30° angle relative to the direction of transverse loading. The observed phenomenon from the failure cloud diagram perspective suggests that increasing the interface toughness has no effect on the damage evolution process of transverse compression loading in the RVE model under weak interface conditions. Under strong interface conditions, increasing the interface toughness will indeed have an impact on the model’s failure strain cloud map under transverse compressive loading. In the failure strain cloud map under low interface toughness, three distinct failure cracks can be observed. These include an irregular-shaped main crack running through the center of the model, with the direction of this main crack roughly oriented at an angle of approximately 30° relative to the transverse loading direction. As the interface toughness increases to 20 J/m2 and 200 J/m2, the failure strain cloud map undergoes changes; however, the morphology of the failure cloud maps corresponding to 20 J/m2 and 200 J/m2 interface toughness is roughly similar. In the equivalent failure strain cloud images for both 20 J/m2 and 200 J/m2 interface toughness, two failure cracks are observed. These include a regular-shaped main crack that does not traverse the model, appearing consistently in the upper left corner of both cloud images at an approximate angle of 45° with the transverse loading direction. Additionally, an irregular small crack is present at the same position in the lower right corner of both cloud images. The observed phenomenon from the perspective of the failure cloud diagram indicates that increasing the interface toughness has a significant impact on the damage evolution and failure process of transverse compression loading in the RVE model with strong interface strength. However, the impact is relatively small in the models with weak interface strength.

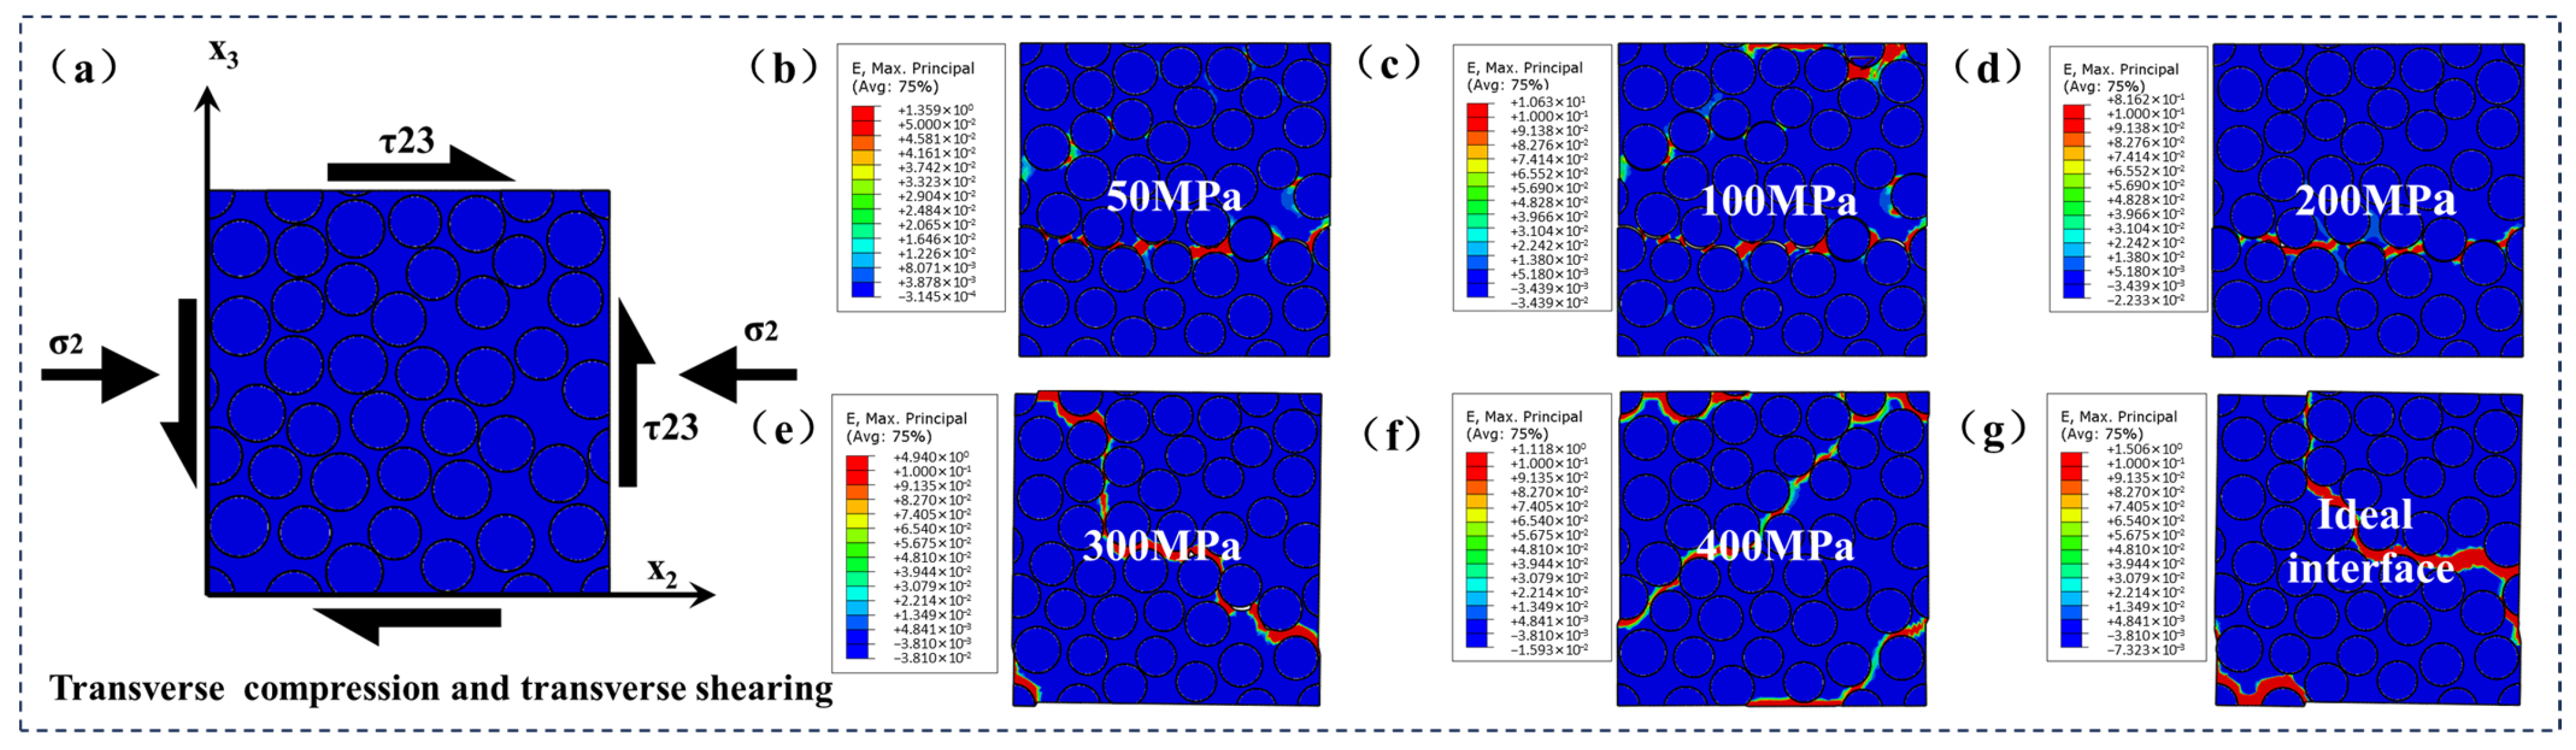
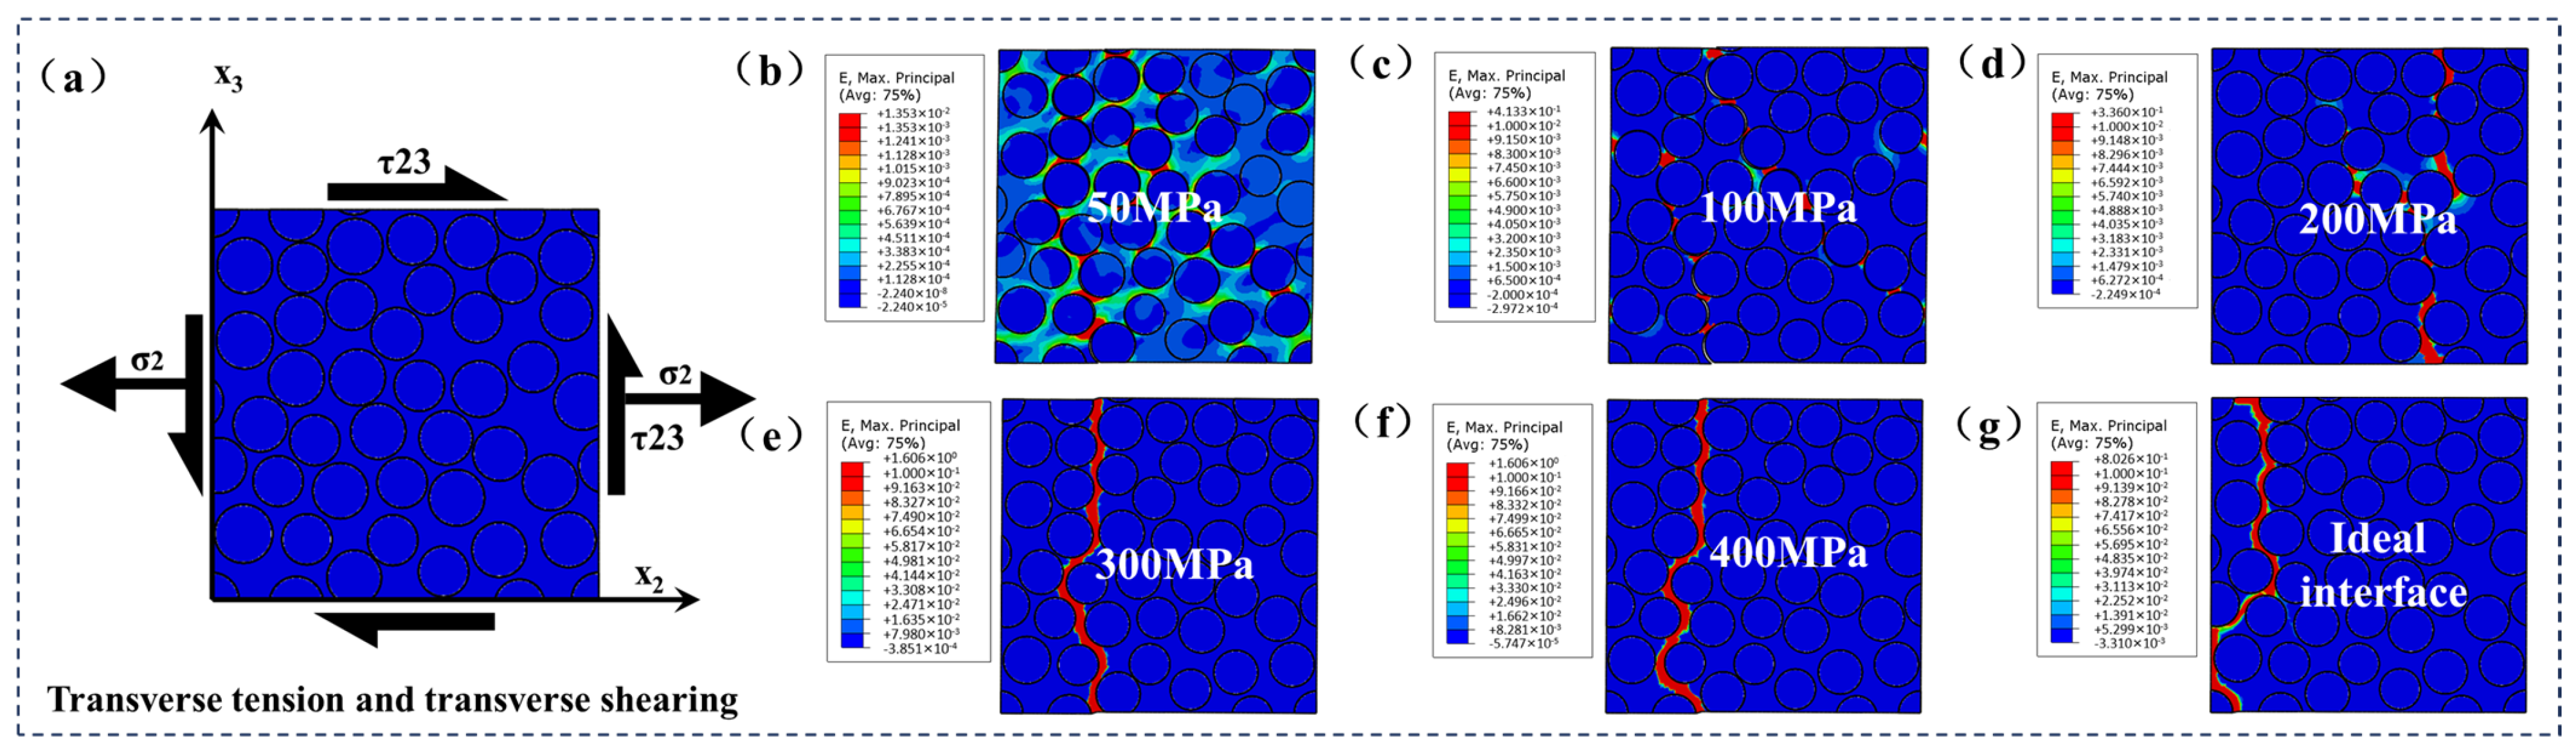
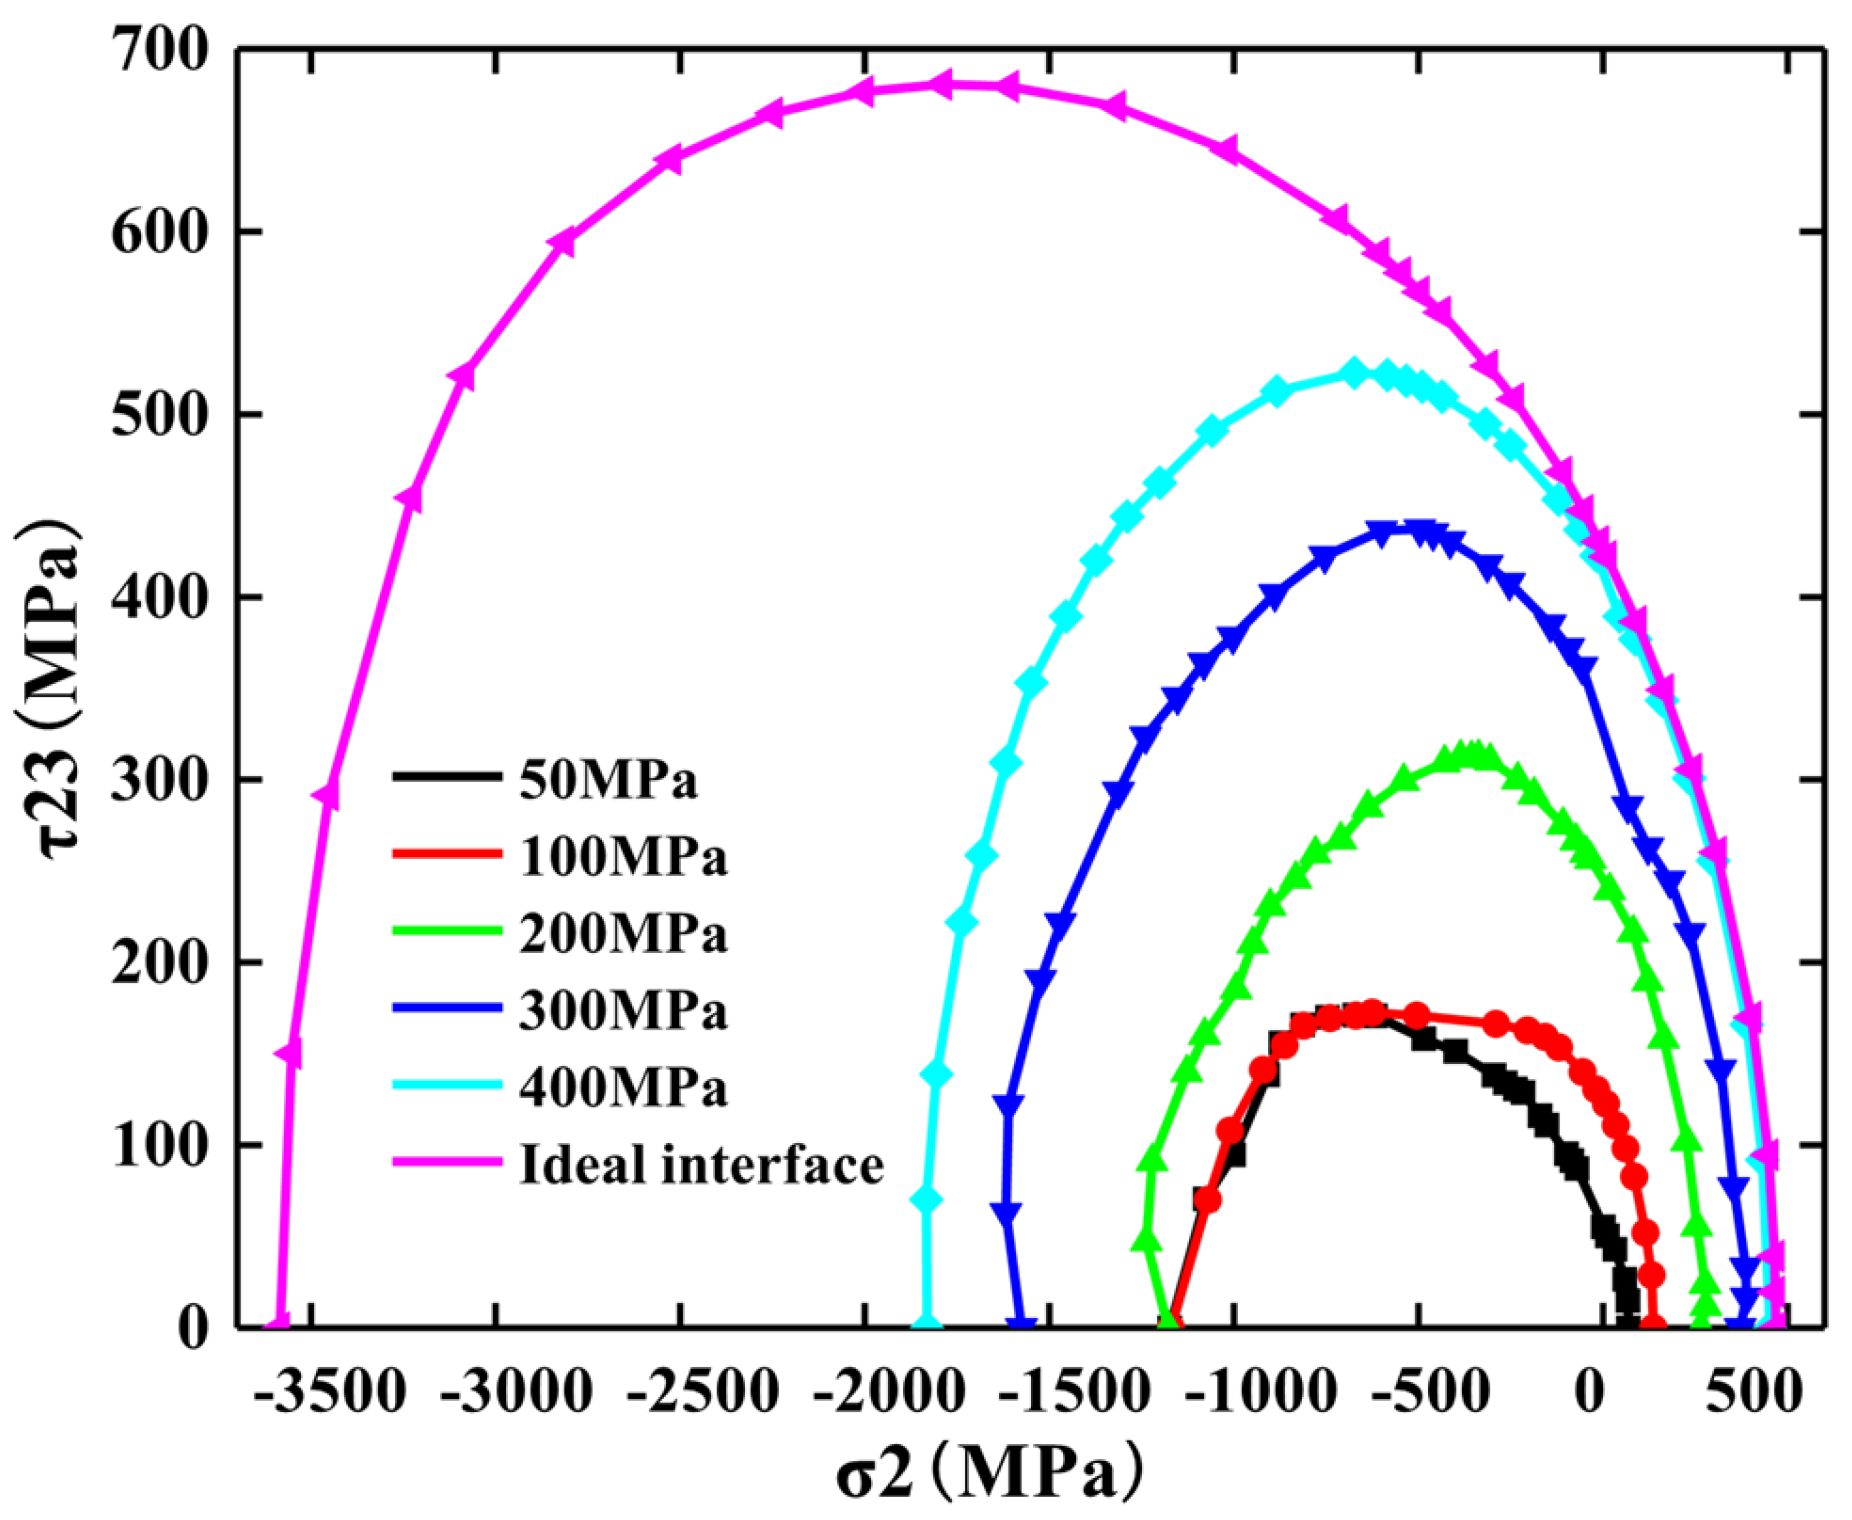
3.4. The Impact of the Interfacial Strength on the Failure Envelope under Biaxial Loading

Due to challenges in controlling the interfaces, the failure behavior of UD-CMCs is frequently studied by constructing a failure envelope. This involves extracting the shear, tensile, or compressive stresses at the point of failure to characterize the material’s behavior under different loading conditions. In this study, numerical simulations were conducted under biaxial loading conditions involving transverse tension/compression and transverse shear. The different loading modes were characterized by the ratio of transverse shear displacement (∆23) to transverse tension/compression displacement (∆2), where ∆2 represents displacement with positive and negative signs. Specifically, when the displacement corresponds to transverse tension, ∆2 is positive; when the displacement corresponds to transverse compression, ∆2 is negative. The loading conditions were defined based on the relative magnitudes and signs of these displacements, providing distinct scenarios for evaluating the mechanical response and behavior of the material under different biaxial loading configurations.
Figure 8 illustrates the equivalent strain contour map of the stress damage (σ2-τ23) in a two-dimensional space under the condition where the ratio of transverse shear displacement (ε23) to transverse compression displacement (ε2) is γ = −1. This contour map represents different strengths of the fiber/matrix interface (50 MPa, 100 MPa, 200 MPa, 300 MPa, 400 MPa, and a perfect interface) in the RVE model. From Figure 8, it is apparent that the failure strain cloud diagram of the weak interface model differs from that of the strong interface model. Under biaxial loading (σ2-τ23) conditions in the weak interface strength models, the fracture mode differs from pure transverse compression loading and transverse shear fracture modes under load. Specifically, in the weak interface models (50 MPa, 100 MPa, and 200 MPa), the model’s failure in the strain cloud diagram exhibits cracks that propagate throughout the model, with the crack directions parallel to the loading direction and transverse compression. The failure cloud image of the strong interface models (300 MPa, 400 MPa, and perfect interface) exhibits similarities to the failure cloud image observed under pure transverse compression loading. In these cases, the crack direction shows an angle of approximately 45° with the direction of transverse compression loading, and small cracks are visible at the edges of the model. This indicates consistent fracture behavior under biaxial loading conditions for the models with strong interface strengths. Therefore, it can be concluded that under biaxial loading (σ2-τ23) conditions with strong interface strength, damage primarily occurs within the matrix under external loading. This results in a damage model for strong interface strength that resembles pure transverse shear, exhibiting the typical brittle shear failure characteristics.
Figure 9 depicts the transverse shear displacement (ε23) and the ratio of transverse tensile displacement (ε2) with γ = 1 under various strengths of the fiber/matrix interface (50 MPa, 100 MPa, 200 MPa, 300 MPa, 400 MPa, and a perfect interface) in an RVE model. The equivalent strain contour map of the stress damage (σ2-τ23) is shown in the space for these different interface strength conditions. From the figure, it is evident that the failure strain cloud diagram of the weak interface model (50 MPa, 100 MPa, and 200 MPa) differs from that of the strong interface model. In the failure cloud images of the weak interface models, several irregular cracks are observed.
Under biaxial loading σ2-τ23 in a model with weak interface strength, the fracture characteristics and forms observed can be similar to those seen in a pure transverse tensile loading scenario. In the failure cloud images of the strong interface models (300 MPa, 400 MPa, and perfect interface), a distinct fracture behavior is observed where only one crack runs through the model. Importantly, the direction of this crack is perpendicular to the direction of transverse tensile loading. Therefore, it can be concluded that under biaxial loading σ2-τ23, the models characterized by a strong fiber/matrix interface bonding strength exhibit a brittle fracture form. In contrast, the weak interfacial strength model exhibits a form of “pseudo-plasticity” attributed to the weak bond strength between the fiber and matrix. In this scenario, the weak interface acts as a site for crack deflection and energy dissipation within the material. The low bond strength allows for greater deformation and energy absorption, leading to a more ductile response compared to the models with stronger interfaces.
The σ2-τ23 stress failure envelope is shown in Figure 10. The data points on the envelope are the maximum strength of UD-CMCs under a biaxial load (transverse tension or compression and transverse shear) when failure occurs, which is determined by the ultimate failure stress of UD-CMCs under transverse tension or compression and transverse shear loads at the same time. When the transverse tension or compression stress and the transverse shear stress begin to decrease with the increase in the transverse tension or compression displacement and the transverse shear displacement, this point is determined as the data point on the envelope. The specific conditions for identifying these data points occur when both the transverse tension or compression stress and the transverse shear stress start to decrease as the transverse tension or compression displacement and transverse shear displacement increase. This intersection, where stresses begin to decrease under increasing displacement, signifies a critical point of failure for the material under biaxial loading.
In the case where the abscissa value in Figure 10 exceeds zero, the transverse tensile stress and transverse shear stress combine under biaxial loading conditions. Specifically, when σ2 > 0, these stresses act synergistically to contribute to the material failure and destruction. It is evident that as the interface strength increases gradually from 50 MPa toward that of a perfect interface, the material’s failure envelope consistently approaches that of the perfect interface. Specifically, when the interface strength reaches 400 MPa, the failure envelope of the material closely aligns with that of the perfect interface, almost coinciding. The transverse tensile strength and transverse shear strength of the composite material approach equivalence within the range of interface strengths from 400 MPa up to a perfect interface. This suggests that once the interface between the fiber and matrix achieves a certain strength in the biaxial loading scenario of transverse tensile and transverse shear, further enhancements in the transverse mechanical properties through increased interface strength become unfeasible.
In Figure 10, the portion of the abscissa greater than zero represents biaxial loading with both transverse tension and transverse shear. When σ2 > 0, the combined effect of the transverse tension and transverse shear causes material failure. It can be observed that as the interface strength gradually increases from 50 MPa to the perfect interface, the failure envelope of the material continuously approaches the failure envelope of the perfect interface. When the interface strength is 400 MPa and at the perfect interface, the two failure envelopes almost coincide. The transverse tensile strength and transverse shear strength of the composite material within the range of 400 MPa interface strength and the perfect interface are nearly the same, indicating that when the interface strength between the fiber and matrix reaches a certain level in the biaxial loading space of transverse tension and transverse shear, it is not possible to further enhance the transverse mechanical properties of the material by increasing the interface strength. In Figure 10, the portion of the abscissa less than zero represents biaxial loading with both transverse compression and transverse shear. When σ2 < 0, transverse compression loading suppresses transverse shear failure, and the transverse shear stress at the material failure shows a trend of first increasing and then decreasing as the transverse compression stress gradually increases. It can be observed that with the increase in the interface strength, the failure envelope of UD-CMCs shows a continuously diverging state. The values of the failure envelope at 400 MPa are much smaller than those of the ideal failure envelope. This is mainly due to the dominance of the strength generated by the friction effect of transverse compression in the failure envelope of UD-CMCs under biaxial loading conditions of transverse compression and shear.
From Figure 10, it can be seen that as the interface strength gradually increases from 50 MPa to the perfect interface, the failure envelope ranges corresponding to each model show a gradual expansion phenomenon, indicating that ceramic matrix composites under strong interfaces have higher bearing capacity. Although the failure envelope spaces covered by each failure envelope line vary in size, all the lines exhibit a trend of increasing transverse shear stress followed by a decrease as the abscissa shifts from transverse compression stress to transverse tension stress. Additionally, the lines demonstrate good symmetry, and the transverse shear stress of each envelope line reaches its maximum when the ratio of transverse shear displacement ε23 to transverse tensile/compressive displacement ε2 is −1.

4. Conclusions

The mechanical behavior of UD-CMCs under uniaxial and biaxial loading conditions of tensile, compressive, and transverse/longitudinal shear, as influenced by the interface strength, was analyzed using computational micromechanics methods. Accordingly, a representative volume element (RVE) model with symmetric boundaries and random fiber distribution was constructed, incorporating composite material interfaces, to investigate the mechanical behavior of CMCs within a finite element framework while validating the model’s effectiveness based on the Chamis theory. The main research findings are as follows.
(1) By analyzing the influence of the interface strength on various loading conditions of the RVE model, it was found that the interface strength significantly increases the failure strength of the RVE model under multiple loads. However, compared to the compressive strength, increasing the interface strength does not consistently increase the strength under other loading conditions. Meanwhile, the increase in the interface strength tightens the bonding between the fibers and matrix, thereby suppressing the generation and propagation of cracks.
(2) By analyzing the effect of the interface toughness on various loading conditions of the RVE model, it was found that under strong interface conditions (400 MPa), the interface toughness significantly affects the transverse compressive strength of the material. As the interface toughness increases from 2 J/m2 to 20 J/m2, the transverse compressive strength shows an increase of 28.49%, while the angle between the cracks and the loading direction changes from 30° to 45°. As the interface toughness continues to increase to 200 J/m2, the growth plateaus, essentially stabilizing.
(3) Under biaxial combined loading, the increase in the interface strength significantly widens the failure envelope range in the σ2-τ23 stress space and can effectively predict the failure behavior of UD-CMCs under combined stresses. As the transverse compressive stress transitions to tensile stress, the transverse shear strength exhibits a trend of first increasing and then decreasing, and it reaches its maximum when the ratio of transverse shear displacement to transverse tensile/compressive displacement is −1.
This paper examines the influence of the interfacial properties on the mechanical behavior of ceramic matrix composites through the finite element method. However, it does not consider the impact of the interfacial properties on the mechanical behavior of ceramic matrix composites under high-temperature conditions. Given that ceramic matrix composites are utilized as high-temperature-resistant structural and functional materials, their interfaces undergo substantial alterations at extreme operating temperatures, consequently affecting their mechanical response. The subsequent phase of this research will entail investigating the interfacial properties of ceramic matrix composites under high-temperature conditions.

Author Contributions

Conceptualization, W.Y.; methodology, W.Y.; software, S.S.; validation, W.Y.; formal analysis, S.S.; investigation, X.L.; resources, L.X.; data curation, W.Y.; writing—original draft preparation, S.S.; writing—review and editing, L.X.; visualization, W.Y.; supervision, J.X.; project administration, J.X.; funding acquisition, J.X. All authors have read and agreed to the published version of the manuscript.

Funding

This work was supported by the National Natural Science Foundation of China (grant number 52075526); the “Ningbo 3315 Plan Innovation Team” (grant number 2017A-28-C); the National Natural Science Foundation of China (grant number 91860204); and the Fundamental Research Funds for the Central Universities (grant number DUT22LAB605).

Data Availability Statement

Data are contained within the article.

Conflicts of Interest

No conflicts of interest exist in the submission of this manuscript, and the manuscript is approved by all the authors for publication. We would like to declare on behalf of all the co-authors that the work described was original research that has not been published previously and is not under consideration for publication elsewhere, in whole or in part.

References

  1. Braun, J.; Sauder, C. Mechanical behavior of SiC/SiC composites reinforced with new Tyranno SA4 fibers: Effect of interphase thickness and comparison with Tyranno SA3 and Hi-Nicalon S reinforced composites. J. Nucl. Mater. 2022, 558, 153367. [Google Scholar] [CrossRef]
  2. Karadimas, G.; Salonitis, K. Ceramic matrix composites for aero engine applications—A review. Appl. Sci. 2023, 13, 3017. [Google Scholar] [CrossRef]
  3. Fang, G.; Gao, X.; Song, Y. A review on ceramic matrix composites and environmental barrier coatings for aero-engine: Material development and failure analysis. Coatings 2023, 13, 357. [Google Scholar] [CrossRef]
  4. Huang, R.; Deng, J.; Ma, X.; Mao, Y.; Fan, S. Modifying C/C–SiC brake pads with different Fe–Si alloy phases to improve the wear resistance of full-carbon/ceramic brake pair. Ceram. Int. 2024, 50, 10582–10592. [Google Scholar] [CrossRef]
  5. Detwiler, K.; Hunt, R.; Opila, E. In-situ observation of micro-cracking in a SiC/BN/SiC ceramic matrix composite under tension. Open Ceram. 2023, 14, 100366. [Google Scholar] [CrossRef]
  6. Chen, M.; Qiu, H.; Zhao, Y.; Zhang, B.; Liu, S.; Luo, W.; Ma, X.; Xie, W.; Chen, Y.; Zhang, Q.; et al. Effect of BN interfacial layer on the mechanical behavior of SiC fiber reinforced SiC ceramic matrix composites. Int. J. Appl. Ceram. Technol. 2024, 21, 1892–1904. [Google Scholar] [CrossRef]
  7. Hu, P.; Cheng, Y.; Xie, M.; Wang, H. Damage mechanism analysis to the carbon fiber and fiber-ceramic interface tailoring of Cf/ZrC-SiC using PyC coating. Ceram. Int. 2018, 44, 19038–19043. [Google Scholar] [CrossRef]
  8. Qin, L.; Luo, R. Influence of Pyrolytic Carbon on the Properties of Precursor-Impregnated and Pyrolyzed 3D-Cf/SiC Composites. China Ceram. Ind. 2018, 25, 1–6. [Google Scholar]
  9. Liu, H.T.; Yang, L.W.; Sun, X.; Cheng, H.F.; Wang, C.Y.; Mao, W.G.; Molina-Aldareguia, J.M. Enhancing the fracture resistance of carbon fiber reinforced SiC matrix composites by interface modification through a simple fiber heat-treatment process. Carbon 2016, 109, 435–443. [Google Scholar] [CrossRef]
  10. Spahn, J.; Andrä, H.; Kabel, M.; Müller, R. A multiscale approach for modeling progressive damage of composite materials using fast Fourier transforms. Comput. Methods Appl. Mech. Eng. 2014, 268, 871–883. [Google Scholar] [CrossRef]
  11. Patel, D.K.; Waas, A.M. Multiscale modeling of tensile fracture in fiber reinforced composites. Compos. Part C Open Access 2020, 2, 100016. [Google Scholar] [CrossRef]
  12. Sahu, S.K.; Rama Sreekanth, P.S. Multiscale RVE modeling for assessing effective elastic modulus of HDPE based polymer matrix nanocomposite reinforced with nanodiamond. Int. J. Interact. Des. Manuf. 2022, 1–10. [Google Scholar] [CrossRef]
  13. Wan, X.; Yang, G.; Zhao, M. Analysis of the Influence of Fiber Distribution and Interface Strength on the Transverse Compression Performance of Composite Materials. J. Northwestern Polytech. Univ. 2019, 37, 443–448. [Google Scholar] [CrossRef]
  14. Braginsky, M.; Przybyla, C.P. Simulation of crack propagation/deflection in ceramic matrix continuous fiber reinforced composites with weak interphase via the extended finite element method. Compos. Struct. 2016, 136, 538–545. [Google Scholar] [CrossRef]
  15. Tan, W.; Naya, F.; Yang, L.; Chang, T.; Falzon, B.; Zhan, L.; Molina-Aldareguía, J.; González, C.; Llorca, J. The role of interfacial properties on the intralaminar and interlaminar damage behaviour of unidirectional composite laminates: Experimental characterization and multiscale modelling. Compos. Part B Eng. 2018, 138, 206–221. [Google Scholar] [CrossRef]
  16. Vajari, D.A.; González, C.; Llorca, J.; Legarth, B.N. A numerical study of the influence of microvoids in the transverse mechanical response of unidirectional composites. Compos. Sci. Technol. 2014, 97, 46–54. [Google Scholar] [CrossRef]
  17. Feng, Y.; Wang, J.; Shang, N.; Zhao, G.; Zhang, C.; Tang, J.; Xin, S.; Hornig, A.; Gude, M.; Huang, Q.; et al. Multiscale Modeling of SiCf/SiC Nuclear Fuel Cladding Based on FE-Simulation of Braiding Process. Front. Mater. 2021, 7, 634112. [Google Scholar] [CrossRef]
  18. Brockenbrough, J.R.; Suresh, S.; Wienecke, H.A. Deformation of metal-matrix composites with continuous fibers: Geometrical effects of fiber distribution and shape. Acta Metall. Mater. 1991, 39, 735–752. [Google Scholar] [CrossRef]
  19. Naya, F.; González, C.; Lopes, C.; Van der Veen, S.; Pons, F. Computational micromechanics of the transverse and shear behavior of unidirectional fiber reinforced polymers including environmental effects. Compos. Part A Appl. Sci. Manuf. 2017, 92, 146–157. [Google Scholar] [CrossRef]
  20. Wang, L.; Zhang, Y. Interpreting correlations in stress-dependent permeability, porosity, and compressibility of rocks: A viewpoint from finite strain theory. Int. J. Numer. Anal. Methods Geomech. 2024, 48, 2000–2019. [Google Scholar] [CrossRef]
  21. Wan, L.; Ismail, Y.; Sheng, Y.; Ye, J. A review on micromechanical modelling of progressive failure in unidirectional fiber-reinforced composites. Compos. Part C Open Access 2023, 10, 100348. [Google Scholar] [CrossRef]
  22. Sauder, C. Ceramic matrix composites: Nuclear applications. In Ceramic Matrix Composites: Materials, Modeling and Technology; The American Ceramic Society: Columbus, OH, USA, 2014; pp. 609–646. [Google Scholar]
  23. Snead, L.L.; Nozawa, T.; Katoh, Y.; Byun, T.-S.; Kondo, S.; Petti, D.A. Handbook of SiC properties for fuel performance modeling. J. Nucl. Mater. 2007, 371, 329–377. [Google Scholar] [CrossRef]
  24. Zhang, D.; Zhao, L.G.; Roy, A. Mechanical behavior of silicon carbide under static and dynamic compression. J. Eng. Mater. Technol. 2019, 141, 011007. [Google Scholar] [CrossRef]
  25. Yang, L.W.; Liu, H.T.; Cheng, H.F. Processing-temperature dependent micro-and macro-mechanical properties of SiC fiber reinforced SiC matrix composites. Compos. Part B Eng. 2017, 129, 152–161. [Google Scholar] [CrossRef]
  26. Abdellahi, B.; Azhari, F.; Nguyen, P. Prediction of the failure behavior of pseudo-ductile composites using a multi-scale finite element model. Res. Sq. 2024. [Google Scholar] [CrossRef]
  27. Zhang, J.; Xie, J.; Zhao, X.; Chen, J.; Li, Z. Influence of void defects on impact properties of CFRP laminates based on multi-scale simulation method. Int. J. Impact Eng. 2023, 180, 104706. [Google Scholar] [CrossRef]
  28. Li, B.; Liao, J.; Chen, Z.; Liu, J.; Mao, B.; Huang, H.; Yuan, X. High-performance Cf/SiC composites with a novel needle-punched carbon fiber fabric fabricated by PIP process. Mater. Res. Express 2019, 6, 115622. [Google Scholar] [CrossRef]
  29. Konica, S.; Sain, T. Phase-field fracture modeling for unidirectional fiber-reinforced polymer composites. Eur. J. Mech.-A/Solids 2023, 100, 105035. [Google Scholar] [CrossRef]
  30. Feng, D.C.; Wu, J.Y. Phase-field regularized cohesive zone model (CZM) and size effect of concrete. Eng. Fract. Mech. 2018, 197, 66–79. [Google Scholar] [CrossRef]
  31. Yu, H.; Hao, L.; Shen, R.; Guo, L.; Shen, Z.; Li, Y. A phase field model with the mixed-mode driving force of power-law relation. Eng. Fract. Mech. 2022, 264, 108265. [Google Scholar] [CrossRef]
  32. Griffith, A.A. VI. The phenomena of rupture and flow in solids. Philos. Trans. R. Soc. London. Ser. A Contain. Pap. A Math. Or Phys. Character 1921, 221, 163–198. [Google Scholar]
  33. Wu, J.Y. A unified phase-field theory for the mechanics of damage and quasi-brittle failure. J. Mech. Phys. Solids 2017, 103, 72–99. [Google Scholar] [CrossRef]
  34. Wu, J.Y.; Nguyen, V.P. A length scale insensitive phase-field damage model for brittle fracture. J. Mech. Phys. Solids 2018, 119, 20–42. [Google Scholar] [CrossRef]
  35. Wu, J.Y.; Huang, Y.; Nguyen, V.P. On the BFGS monolithic algorithm for the unified phase field damage theory. Comput. Methods Appl. Mech. Eng. 2020, 360, 112704. [Google Scholar] [CrossRef]
  36. Barenblatt, G.I. Equilibrium cracks formed during brittle fracture rectilinear cracks in plane plates. J. Appl. Math. Mech. 1959, 23, 1009–1029. [Google Scholar] [CrossRef]
  37. Dugdale, D.S. Yielding of steel sheets containing slits. J. Mech. Phys. Solids 1960, 8, 100–104. [Google Scholar] [CrossRef]
  38. Linke, M.; Lammering, R. On the calibration of the cohesive strength for cohesive zone models in finite element analyses. Theor. Appl. Fract. Mech. 2023, 124, 103733. [Google Scholar] [CrossRef]
  39. Heidari-Rarani, M.; Sayedain, M. Finite element modeling strategies for 2D and 3D delamination propagation in composite DCB specimens using VCCT, CZM and XFEM approaches. Theor. Appl. Fract. Mech. 2019, 103, 102246. [Google Scholar] [CrossRef]
  40. Chamis, C.C. Mechanics of composite materials: Past, present and future. In Proceedings of the 21st Annual Meeting of the Society for Engineering Science, Blacksburg, VA, USA, 15–17 October 1984; p. E-3936. [Google Scholar]
  41. Yang, L. Study on the Damage and Failure Mechanisms of SiC/SiC Ceramic Matrix Composites; Harbin Institute of Technology: Harbin, China, 2019. [Google Scholar]
  42. Pu, J.; Wang, J.; Tang, J.; Shen, L. Multi-scale Progressive Damage and Failure Behavior Analysis of Three-Dimensional Winding SiC Fiber-Reinforced SiC Matrix Composite Tube. Appl. Compos. Mater. 2023, 30, 1605–1626. [Google Scholar] [CrossRef]
  43. Peng, P.; Zhao, M.; Wang, W. Study on Predicting Transverse Strength of Composites Using Micromechanical Models. Mech. Sci. Technol. 2017, 36, 1611–1618. [Google Scholar]
  44. Zhou, Q. Multiscale Mechanical Properties of 2D Braided Ceramic Matrix Composites; Harbin Institute of Technology: Harbin, China, 2020. [Google Scholar]
Figure 1. Flow chart of the numerical simulation: (a) RVE model component composition; (b) four loading conditions; and (c) parameter modification diagram.
Symmetry 16 00695 g001
Figure 2. Dimensions, loads and coordinate systems of the RVE model.
Symmetry 16 00695 g002
Figure 3. Phase-field damage model: (a) internal sharp cracks; and (b) geometrically regularized cracks.
Symmetry 16 00695 g003
Figure 4. The influence of different interface strengths on the transverse tensile and compressive behavior of the RVE models.(a) Stress-strain curve of the model under lateral tension; (b) Failure cloud map of 50MPa interface strength model under lateral tensile load (A: Initial destruction cloud map; B: Final destruction cloud map); (c) The failure cloud map of the ideal interface strength model under lateral tensile load (C: Final destruction cloud map); (d) Stress-strain curve of the model under lateral compression; (e) Failure Cloud Map of 50MPa Interface Strength Model under Lateral Compression Load (A: Initial destruction cloud map; B: Final destruction cloud map); (f) The failure cloud map of the ideal interface strength model under lateral compressive load (C: Final destruction cloud map).
Symmetry 16 00695 g004
Figure 5. The influence of different interface strengths on the transverse shearing and longitudinal shearing of the RVE models. (a) Stress-strain curve of the model under transverse shearing; (b) Failure cloud map of 50 MPa interface strength model under transverse shear load; (c) Failure cloud map of 200 MPa interface strength model under transverse shear load; (d) Failure cloud map of ideal interface strength model under transverse shear load; (e) Stress-strain curve of the model under longitudinal shearing; (f) Failure cloud map of 50 MPa interface strength model under longitudinal shear load; (g) Failure cloud map of 200 MPa interface strength model under longitudinal shear load; (h) Failure cloud map of ideal interface strength model under longitudinal shear load.
Symmetry 16 00695 g005
Figure 6. Effects of different interface toughness on the mechanical properties of the RVE model: (a) transverse tension; (b) transverse compression; (c) transverse shear; and (d) longitudinal shear.
Symmetry 16 00695 g006
Figure 7. The effect of interface toughness on the final equivalent strain cloud of the transverse compression of the RVE models with different interface strengths: (a) 50 MPa, τ0 = 2 J/m2; (b) 50 MPa, τ0 = 20 J/m2; (c) 50 MPa, τ0 = 200 J/m2; (d) 400 MPa, τ0 = 2 J/m2; (e) 400 MPa, τ0 = 20 J/m2; and (f) 400 MPa, τ0 = 200 J/m2.
Symmetry 16 00695 g007
Figure 8. The effect of different interface strengths on the failure strain cloud diagram of an RVE model under combined transverse compression and shear loading: (a) joint loading mode; (b) 50 MPa; (c) 100 MPa; (d) 200 MPa; (e) 300 MPa; (f) 400 MPa; and (g) perfect interface. The ratio of the transverse shear displacement ε23 to the transverse compression displacement ε2 is defined by γ = ε232 = −1.
Symmetry 16 00695 g008
Figure 9. The effect of different interface strengths on the failure strain cloud diagram of an RVE model under combined transverse tension and shear loading: (a) joint loading mode; (b) 50 MPa; (c) 100 MPa; (d) 200 MPa; (e) 300 MPa; (f) 400 MPa; and (g) ideal interface. The ratio of the transverse shear displacement ε23 to the transverse compression displacement ε2 is defined by γ = ε232 = 1.
Symmetry 16 00695 g009
Figure 10. Effect of different interfacial strengths on the failure envelope of the RVE model under combined transverse tensile/compressive and transverse shear loading.
Symmetry 16 00695 g010
Table 1. The mechanical parameters of the silicon carbide composite materials’ components [22,23,24,25].
ParameterSymbolValue
Young’s modulus of silicon carbide fibersEf380 GPa
Poisson’s ratio of silicon carbide fibersvf0.17
Young’s modulus of silicon carbide matrixEm460 GPa
Poisson’s ratio of silicon carbide matrixVm0.21
Tensile strength of silicon carbide fibers σ f T 2.8 GPa
Tensile strength of silicon carbide matrix σ m T 500 MPa
Compressive strength of silicon carbide matrix σ m C 4.2 GPa
Shear strength of silicon carbide matrix τ m 446.7 MPa
interfacial stiffnessK5 × 106 (N/mm)
Fracture toughness of silicon carbide matrixGm20 J/m2
Table 2. Comparison of the RVE model and Chamis model in the prediction of the elastic properties of single-layer composites.
E 1   G P a E 2   G P a G 12   G P a G 23   G P a v 12 v 23
Chamis model420.000395.504167.906167.9060.1860.178
RVE-1412.247404.780172.078170.9230.1840.184
RVE-2412.578404.905172.105171.0210.1840.184
RVE-3412.875404.897172.101171.0100.1840.184
Table 3. Comparison of the RVE model and Chamis model in the prediction of the strength properties of single-layer composites.
YT (MPa)YC (MPa)S23 (MPa)S12 (MPa)
Chamis model518.3794354.380459.993459.993
RVE-1468.5363584.020426.844427.388
RVE-2465.6123588.000428.288425.496
RVE-3468.8803589.940427.060426.856
Disclaimer/Publisher’s Note: The statements, opinions and data contained in all publications are solely those of the individual author(s) and contributor(s) and not of MDPI and/or the editor(s). MDPI and/or the editor(s) disclaim responsibility for any injury to people or property resulting from any ideas, methods, instructions or products referred to in the content.

