Article

A New Latin Hypercube Sampling with Maximum Diversity Factor for Reliability-Based Design Optimization of HLM

by
Pakin Phromphan
,
Jirachot Suvisuthikasame
,
Metas Kaewmongkol
,
Woravech Chanpichitwanich
and
Suwin Sleesongsom
*
Department of Aeronautical Engineering, International Academy of Aviation Industry, King Mongkut’s Institute of Technology Ladkrabang, Bangkok 10520, Thailand
*
Author to whom correspondence should be addressed.
Symmetry 2024, 16(7), 901; https://doi.org/10.3390/sym16070901
Submission received: 11 May 2024 / Revised: 19 June 2024 / Accepted: 9 July 2024 / Published: 15 July 2024
(This article belongs to the Section Engineering and Materials)

Abstract

:
This research paper presents a new Latin hypercube sampling method, aimed at enhancing its performance in quantifying uncertainty and reducing computation time. The new Latin hypercube sampling (LHS) method serves as a tool in reliability-based design optimization (RBDO). The quantification technique is termed LHSMDF (LHS with maximum diversity factor). The quantification techniques, such as Latin hypercube sampling (LHS), optimum Latin hypercube sampling (OLHS), and Latin hypercube sampling with maximum diversity factor (LHSMDF), are tested against mechanical components, including a circular shaft housing, a connecting rod, and a cantilever beam, to evaluate its comparative performance. Subsequently, the new method is employed as the basis of RBDO in the synthesis of a six-bar high-lift mechanism (HLM) example to enhance the reliability of the resulting mechanism compared to Monte Carlo simulation (MCS). The design problem of this mechanism is classified as a motion generation problem, incorporating angle and position of the flap as an objective function. The six-bar linkage is first adapted to be a high-lift mechanism (HLM), which is a symmetrical device of the aircraft. Furthermore, a deterministic design, without consideration of uncertainty, may lead to unacceptable performance during the manufacturing step due to link length tolerances. The techniques are combined with an efficient metaheuristic known as teaching–learning-based optimization with a diversity archive (ATLBO-DA) to identify a reliable HLM. Performance testing of the new LHSMDF reveals that it outperforms the original LHS and OLHS. The HLM problem test results demonstrate that achieving optimum HLM with high reliability necessitates precision without sacrificing accuracy in the manufacturing process. Moreover, it is suggested that the six-bar HLM could emerge as a viable option for developing a new high-lift device in aircraft mechanisms for the future.

1. Introduction

Reliability analysis is employed to assess the likelihood of a system functioning properly in light of inherent uncertainty or randomness in certain system parameters [1]. Such inherent uncertainty can lead to deviations in system behavior, rendering it unable to function properly [2]. To safeguard against the worst-case scenarios, uncertainty must be factored into the design analysis from the conceptual phase onwards [3]. Reliability-based design optimization (RBDO) is a combination of uncertainty quantification and optimization technique used to iteratively optimize the design of a system until it reaches a reliable state [1,2,3,4,5]. Generally, the objective is to optimize the objective function through predefined probabilistic constraints, such as failure probability or reliability index, as part of engineering workflows. In practical terms, reliability-based design optimization is invoked to improve the design process using probabilistic [6,7,8,9,10,11,12,13,14,15] or non-probabilistic quantification technique [3,4,5,16,17,18,19,20,21]. The worst-case scenario technique is an example of a non-probabilistic technique used to consider uncertainty due to link length tolerance of steering linkage design [5]. The rationale for studying uncertainty arising from link length, tolerance, backlash clearance, and other loads lies in the potential for greater disparities between actual performance and the optimum design. Probabilistic techniques have been utilized to determine the failure probability of aircraft wing design. One of the famous probabilistic techniques, called Monte Carlo simulation (MCS) [10,22,23,24], which is computationally intensive, is widely applied to deal with uncertainty in aircraft design [23]. Subsequently, the FORM first-order reliability method [15] and the SORM second-order reliability method were developed to improve the time consumption by approximating performance function to the first order and the second moment. Both work well for calculating the reliability index for a given design space at the most probable point (MPP) [11,25]. Therefore, Latin hypercube sampling (LHS) is proposed to increase the quality of the randomization [24,26]. The implementation of LHS aims to improve sampling design, with one of the most popular methods being conditional LHS (cLHS) [27]. This technique was further improved to autocorrelated conditioned LHS (acLHS) [28]. However, this tedious process requires thousands of calculations due to the generation of random variables. The combination with optimization is rather tedious; that is why it is a double-loop nested problem for the probabilistic and it is a triple-loop nested problem for non-probabilistic [3,4,5,16,17,18,19,20,21]. The disadvantages still need to be addressed with some adaptations such as optimum LHS, maximin Latin hypercube sampling (MLHS) [29], and Latin hypercube sampling with multidimensional uniformity (LHSMDU) [30]. Except, the new one adapts from MCS, it is called Projection Pursuit Multivariate Transform (PPMT) [31]. The space-filling efficiency of optimal LHS (OLHS) can increase by embedding it with an optimizer such as simulated annealing (SA) [32], evolutionary algorithm (EA), translational propagation algorithm (TPA), a successive local enumeration method (SLE) [33]. A very recent work has been proposed to improve computation efficiency in random sampling [34]. From the review, the new LHS is an alternative to improve the uncertainty quantification.
The mechanism is a movement used to transfer force in machines, including aircraft systems. Many applications worldwide use simple mechanisms like four-bar linkage as a part of machines [35]. The applications of the four-bar linkage include steering linkage [5], windshield wipers, high-lift mechanisms (HLM) [36], etc. However, many specific tasks require different kinds of mechanisms like the six-bar linkage, which is also useful in many works [37,38]. Currently, the kinematic analysis of the six-bar linkage has been analyzed by many researchers [39,40]. However, this model still lacks research for studying reliability. Thus, it becomes the purpose of this study. The different types of the six-bar linkage model may affect its reliability. There are two types of six-bar linkage, which are Watt chain and Stephenson chain. The model in this study is based on the Watt I mechanism [41]. Furthermore, the application of the mechanism for a HLM is a new challenge. As we know, the HLM is used to generate additional lift to aircraft during take-off and landing, which is a symmetrical device of the aircraft. It is an application of the four-bar linkage, which has been studied for reducing motion error [36]. The motion, meaning angle and position errors, is included in an objective function of the optimization problem. The problem needs a penalty technique or exterior penalty to handle the constraints including the crank sequence as present in work. The tasks of an exterior penalty to meta-heuristics (MHs) have been studied [42], which include improving a variant of teaching–learning-based optimization (TLBO) to self-adaptive population size teaching–learning-based optimization (SAP-TLBO) [42] and teaching–learning-based optimization with a diversity archive (TLBO-DA) [43]. The main improvement in the MHs is in regard to ineffective and inconsistent searching. The optimizer chosen for this study is called TLBO-DA, which has improved its performance to synthesize the dimension of the mechanism.
From the review of the literature, this research has three aims: (1) adaptations to LHS and performance testing are proposed, (2) the possibility to apply the six-bar linkage as the high-lift mechanism is proposed, and (3) a reliability-based design of HLM by using six-bar linkage is studied.
The remaining parts of this paper are separated into four sections: methodology, numerical experiments, design results, and conclusions. The methodology section presents a new LHSMDF technique, six-bar linkage model for HLM, deterministic optimization problem, and RBDO problem. Numerical experiments and results are presented in Section 3 and Section 4, respectively. The conclusions are drawn in the last section of this paper.

2. Latin Hypercube Sampling with Maximum Diversity Factor (LHSMDF)

This section provides theory and background to a new uncertainty quantification, six-bar high-lift mechanism model, motion generation problem, and reliability-based design optimization problem.

2.1. LHS

Monte Carlo simulation (MCS) requires a large number of random samplings, at least 104 for each variable, leading to inefficient computation. The issue has been addressed by an efficient technique called Latin hypercube sampling (LHS) [44]. Instead of using MCS sampling, LHS utilizes stratified random sampling. The main idea is to reduce spurious correlations, which can reduce unnecessary random variables [44]. Ten times the sampling number has been approved for the reduction. Furthermore, all portions of the sample space are adequately sampled, meaning that random variables are distributed evenly along portions. This technique starts by partitioning each cumulative distribution function (CDF) into N intervals for each of the l variables. Each Xil is sampled with an equal marginal probability of 1/N only once from each interval. The matrix P has a size of N × l where l columns represent a random permutation of the number 1 to N. The matrix R is an independent random number (0,1) that has a size of N × l. The sample plan S is then constructed using the matrices P and R [30,44,45] as follows:
S = 1 N ( P R )
According to the given CDF, each element of the matrix is then mapped:
xij = FXj−1(sij) j = 1, 2, …, l
where FXj−1 is the inverse of CDF of variable j. This process allows for the construction of a vector of random variables. An example of generated random variables of size 5 × 2 using this technique is presented in Figure 1, where Var represent a variable.
It is possible for random LHS to have as high as l!N−1 permutations, causing it to not be unique. Later, the reason becomes the researcher’s passion to solve the problem. One choice to tackle the problem is a combination with optimization technique, called optimum LHS. The quantification technique aims to optimize the Euclidean distance of each n random variable. The distance of all random variables in the design space is computed, ranking from minimum to maximum. Then, finding the maximum of the minimum distance is called Euclidean maximin distance (Mm) or L2 discrepancy. Unfortunately, this technique can increase computational load [46]. Euclidean maximum distance technique defines d = (d1, d2, …, dn(n−1)/2) in each set, where d is the Euclidean distance between n random variables as presented in Equation (3). The first ranking from minimum (min) to maximum (max) of the set is defined as d1 as shown in Equation (4). The definition of d is presented in Figure 2 and formulated as follows:
| d i | = var 1 2 + var 2 2   i   =   1 ,   ,   n ( n 1 ) / 2
The ranking from min to max for the first set can represented as follows:
d 1 1 = min ( d 1 , d 2 , , d n ( n 1 ) / 2 )
Comparing d between each set in such a way that the higher Mm is better,
Mm = max ( d 1 j ) ,   j   =   1 ,   ,   N
where N is the random sampling number.

2.2. LHSMDF

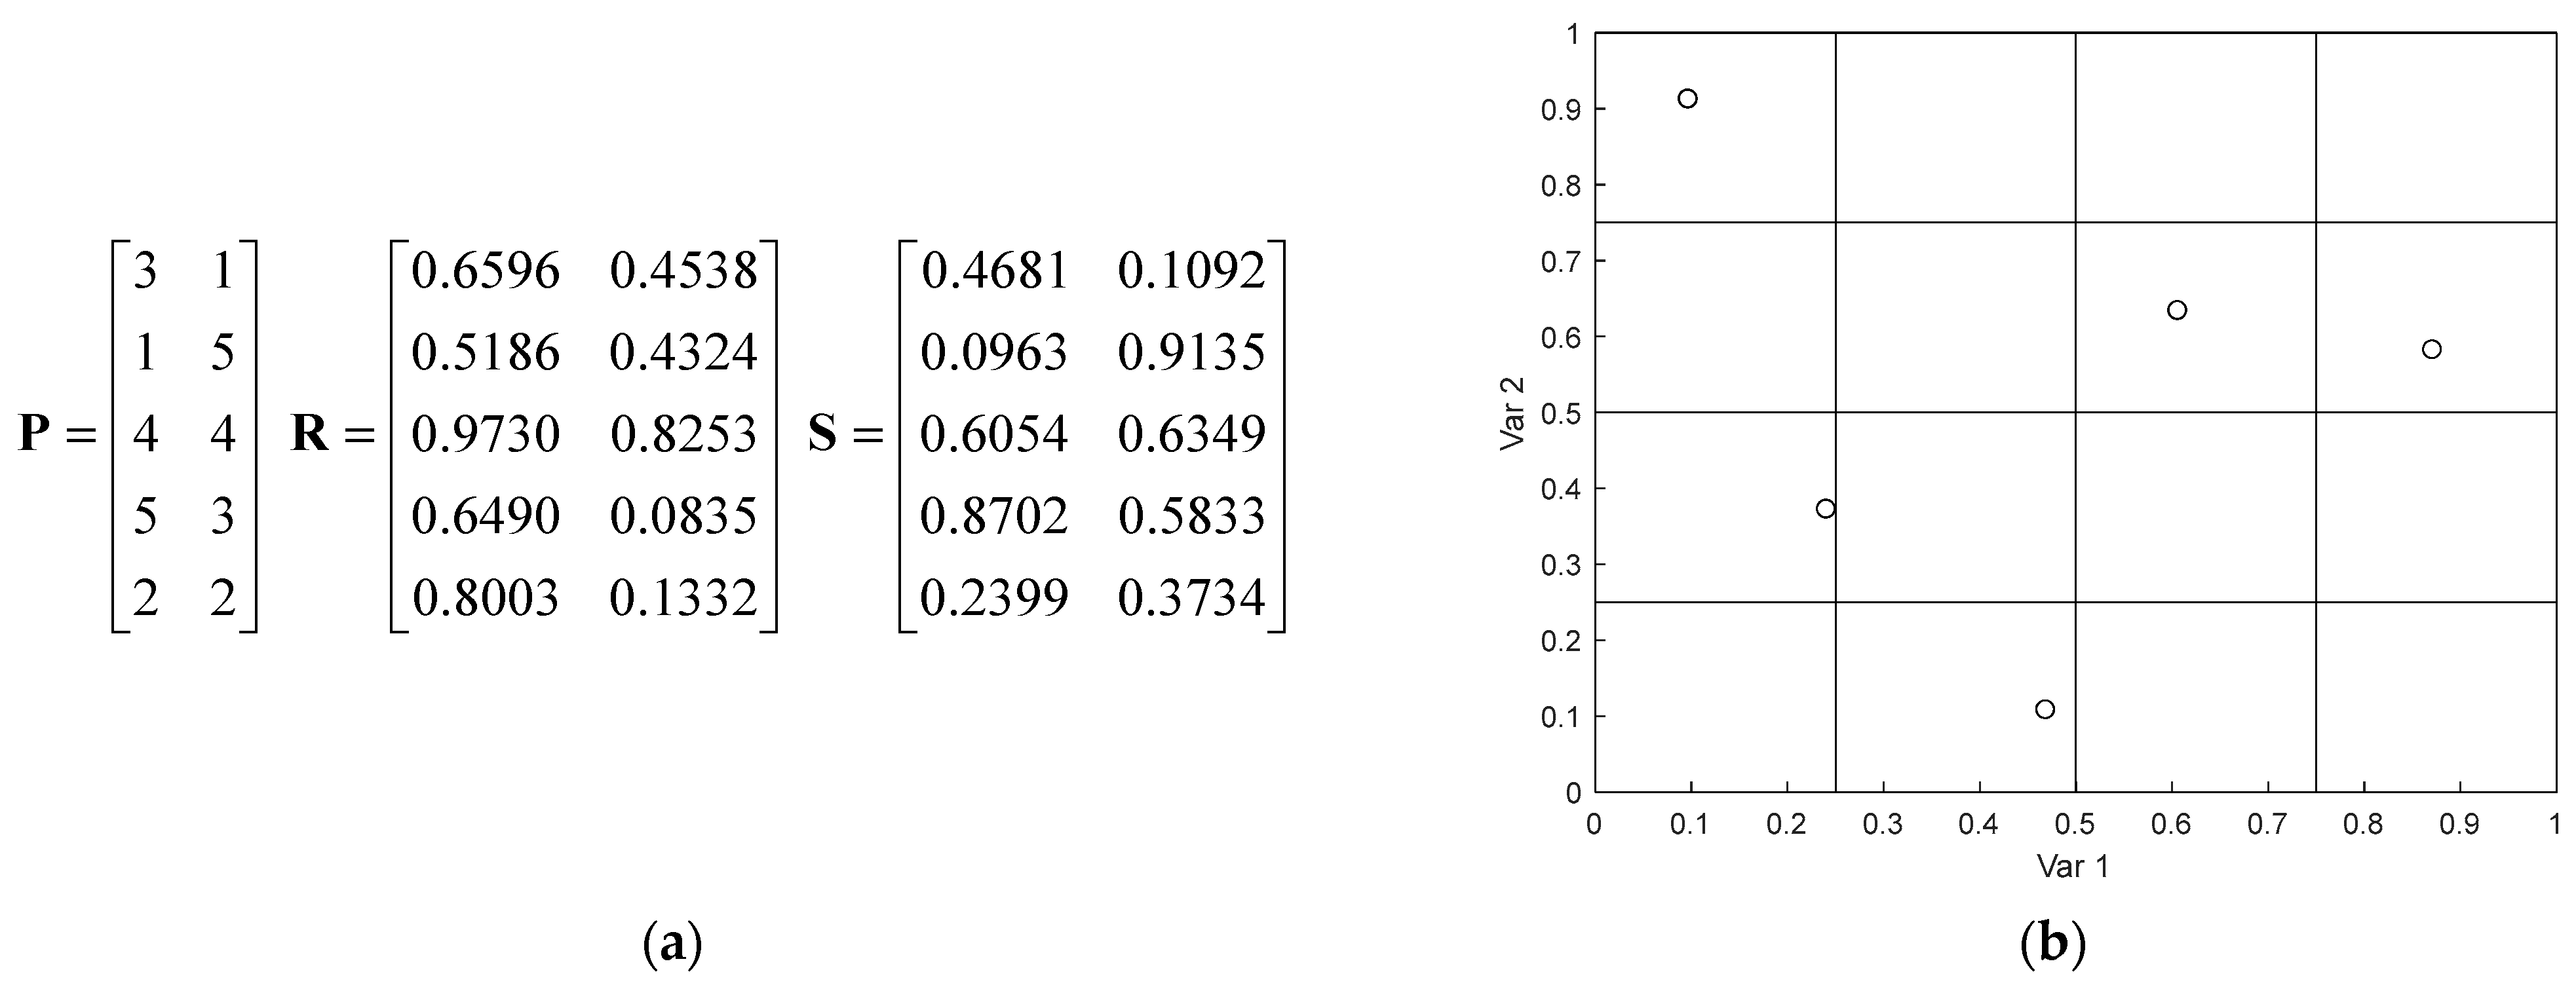
2.2.1. Improving of Euclidean Norm with k-Nearest

From the previous technique, Mm value can increase computation load in case of a high random variable. Optimum Mm has been used to improve space filling, but it causes computational time burden, and it is less efficient [47]. The use of only d1 cannot reflect the un-unique of all random variables using LHS. Previous studies have mentioned d = (d1, d2, …, dn(n−1)/2)), where d is the Euclidean distance between n points. One choice is made to represent the first ranking from minimum to maximum of the set, which is then defined for i = k (in general, k = 3) in a random space, to achieve better space-filling reflection. The formula for ranking from minimum to maximum for the first set in (4) can be defined as follows:
d 1 1 = 1 k i = 1 k d i   i   =   1 ,   ,   k
The Mm can be performed with (5) and rearranged to a new diversity factor (Df):
Df = 1/Mm
The meaning of the new parameter, the minimum value of Df, reflects better space filling.

2.2.2. LHS with Maximum Diversity Factor

The computational time consumption and un-unique of the solution set of the LHS method can be alleviated by generating more than one solution at a time. The space filling and the uniqueness can be measured by the diversity factor (Df), where a lower Df indicates better space filling. This technique, called maximum diversity factor (MDF) combined with the original LHS, is named LHS with maximum diversity factor (LHSMDF) and consists of the following four steps.
(1)
Sampling of random variables (X) multiple times.
(2)
Finding the minimum (Df), with the best minimum being selected from the random variable sets.
(3)
Conducting numerical experiments to find output Y.
(4)
Performing statistical analysis of output Y.
The performance of the new technique will be tested in Section 3.1 and applied to designing the HLM in the last part of the same section.

2.3. Motion Analysis of a High-Lift Mechanism

The objective function of this mechanism begins with the mathematical expression of the position and angle of the system. The six-bar mechanism model is created in the form of the Watt I model, adapted from the simple four-bar model. The second loop on top of the model is where the flap of the aircraft is installed at a target point P as shown in Figure 3. In this research, the mechanism is set to operate in the crank-rocker model to simplify the output from the optimizer, so the system should operate continuously driven by the crank. The outcome mechanism’s possibility varied in open and cross mode. To simplify the mechanism, the acceptable model in this research will be the open mode in both the first and second loops. The combination of those two loops results in one degree of freedom, meaning one input is needed to control it. The mechanism consists of six linkages and seven joints. Link 1(O2 O4) is designed to be the fixed frame and forms the first loop with the other link, like link 2 (O2B), link 3,1 (BC) and link 4,1 (O4C). The input link, which is expected to be driven by a motor or actuator, is link 2 ( O 2 B) while the second loop comprises link 3,2 (CG), link 4,2 (CE), Link 5 (EF) and link 6 (FG). The study will focus on the target point (P) attached to the upper part of link 6 (FG). The kinematic diagram of the follow mechanism is shown in Figure 3. The model is written in the global axis, which has angle θ1 with the fixed frame. The motion of the target point can be obtained by the calculation of the initial variable r1, r2, r3,1, r3,2, r4,1, r4,2, r5, r6, rpx, rpy and others. The position of the point of interest is expressed as follows:
x p = x 02 + r 2 cos ( θ 2 + θ 1 ) + ( r 3 , 1 + r 3 , 2 ) cos ( θ 3 + θ 1 ) + r p x cos ( π θ 6 + θ 1 ) + r p y sin ( π θ 6 + θ 1 ) y p = y 02 + r 2 sin ( θ 2 + θ 1 ) + ( r 3 , 1 + r 3 , 2 ) sin ( θ 3 + θ 1 ) + r p x cos ( π θ 6 + θ 1 ) r p y sin ( π θ 6 + θ 1 )
where xp and yp represent the location of the target point, and x02 and y02 denote the origin of the mechanism with respect to the coordinate axis. Additionally, the motion of the whole mechanism is obtained as follows:
The angle in the first loop (θ3 and γ) can be determined by the known values r1, r2, r3,1, r4,1, followed by the angle calculation in the second loop (θ3,2 and θ7), noting that all values correspond to changes in the driven crank angle from 0° to 360°. The equations are expressed below:
θ 3 , 2 = cos 1 z 2 2 + r 3 , 2 2 r 4 , 2 2 2 z 2 r 3 , 2
θ 7 = cos 1 z 2 2 + r 6 2 r 5 2 2 z 6 r 6
The angle of the point of interest (θ6) can be obtained by the equation as follows:
θ 6 = θ 3 , 2 + θ 7 θ 3

2.4. Motion Generation of Six-Bar Linkage

The performance of the model is measured by the difference between the motion of the created mechanism and the motion of the desired problem, which can be separated into two parameters: position Pp(xp,yp) and the angle θ6p. The problem is a constraint optimization problem in which the desired motion is also expressed in the variables Pp(xp,yp) and the angle θ6p. To form the objective function, both variables are written in the form of the sum of squared errors. The performance in synthesizing a mechanism depends on the constraint-handling techniques, which are the major factors for the success of the outcome. This research involves two kinds of constraints; the first constraint group is for the mechanism itself, while the second constraint group is applicable to the workplace. To ensure that the model is usable, the mechanism should follow Grashof’s criterion (13) and (14), except for the additional part of the model, which is the second loop. The criterion is expressed in an equation corresponding to a crank-rocker mechanism, which is also the major model in this study. The prescribed timing is neglected for convenience. The angle of the input link θ2 is set up before the calculation process (15). Since the output function relies on several parameters, the weighted sum technique is applied to each term of the function equally. The priority of the objective can be controlled by adjusting the weight. The average weight values have been selected following the previous study [37]. The optimization problem is express as follows:
Min f(x)
subject to
min(r1, r2, r3,1, r4,1) = crank (r2)
2 min(r1, r2, r3,1, r4,1) + 2 max(r1, r2, r3,1, r4,1) < (r1, r2, r3,1, r4,1)
θ 2 1 < θ 2 2 < θ 2 N
x L x < x U
where x = {r1, r2, r3,1, r3,2, r4,1, r4,2, r5, r6, rpx, rpy θ 2 i }T are the design variables. This group of values will be combined with the position analysis equation to create a mechanism. Note that the driven crank angle θ 2 i is setup using the technique in [42] by dividing a crank circle into 200 intervals starting from 0° to 360° (15). The limitation of the mechanism’s location is included in the constraint of design variables (16). The objective function is written as follows:
f ( x ) = i = 1 N min ( w 1 d i j 2 + w 2 θ i j 2 )
where d i j 2 = ( x d , i x p , j ) 2 + ( y d , i y p , j ) 2 and θ i j 2 = ( θ 6 d , i θ 6 p , j ) 2 for j =, …, N.
w 1   =   0.5
w 2 = 1 w 1
The motion generation of six-bar linkage is presented in (12–19), while the weighting factor is set as mentioned in [37]. The origin of the problem was explained in previous research [37,38].

2.5. Reliability-Based Design Optimization

Reliability-based design optimization (RBDO) is utilized in this study to address uncertainties in the manufacturing process, such as tolerances, which may affect the synthesis of high-lift mechanisms (HLMs) and the reliability of the mechanism. Probabilistic methods are employed to improve the accuracy of the mechanism, where probability values are obtained through statistical analysis of random variables representing uncertainties. LHSMDF is employed as the technique to generate random sample variables. The uncertainty samples are generated 1000 times for each 10, as detailed in Section 2.2. Subsequently, statistical analysis is conducted to calculate the reliability index ( β ). The statistic calculation is expressed below:
β = min m e a n ( g i ) s t d ( g i )   i   =   1 ,   ,   o
where o is number of constraint functions, mean is stand for the mean value, while std is the standard deviation value. To provide a more practical and simpler observation, the reliability value is calculated using the reliability index (β) as shown below:
R = 0.5 ( 1 + erf ( β 2 ) )
p f   = 1 R
where erf stands for the error function. The inverse of the reliability value is the probability of failure (pf), which is used as an additional constraint to the optimization problem. The limitation of the probability of failure is expressed in the form of the maximum probability of failure (pfmax), which means that the optimum results cannot have pf higher than the limit.

3. Numerical Experiment

3.1. Test Problems

The proposed problems in this section have been tested for uncertainty quantification [47]. Some of them are simple mechanical components, such as a circular rear shaft housing and a connecting rod, while a simple structure is a cantilever beam. These problems are appropriate for testing the new technique and for comparative performance testing with LHS and optimum LHS (OLHS). Furthermore, the reference solution from MCS has been presented in [47]. If the proposed technique works well with the test problems, it can efficiently solve the HLM problem. The problems can be formulated as follows:
The first problem is the rear axle housing, typically made of steel or cast iron. For steel material, it is manufactured through stamping or welding processes. The housing is designed for easy maintenance and consists of two symmetrical parts connected by bolts. The rear axle housing has circular cross-sections to provide more available space inside (Figure 4a). The housing needs to withstand transferring torsion and reaction force at the ends, resulting in shearing stress (τ) and bending stress (s), respectively. All stresses can be calculated as follows:
s = 32 D M π ( D 4 d 4 )
τ = 16 D T π ( D 4 d 4 )
where M represents the bending moment and T represents the torque. The inner and outer diameters of the rear housing are d and D, respectively. The equivalent stress is given by the following equation:
σ = s 2 + 3 τ 2
The random variables assigned to this example are σa~N (443, 27.5) MPa, M~N (6.3809 × 10⁶, 6.0319 × 10⁵) Nmm, T~N (4.4868 × 10⁶, 3.7442 × 10⁵) Nmm, D~N (84, 0.42) mm, and d~N (74, 0.37) mm (pf = 0.0023, reference solution using MCS [47]).
The second problem is a connecting rod, which is the main component that connects the piston and the crankshaft in a combustion engine. It transmits the combustion force to the crankshaft. The primary loads on the connecting rod are tensile and compression forces. The appropriate cross-section for the connecting rod is a symmetrical H shape (Figure 4b). In a simple design of the test problem, the connecting rod fails due to tensile stress (σ) caused by the maximum tensile force F. The stress can be calculated using the following equation:
σ = F a ( h 2 t ) + 2 b t
where the dimensions of the cross-section are represented by a, b, h, and t. To study the reliability of the connecting rod, the following random variables are assigned: σa~N (235, 12.92) MPa, F~N (14.01 × 10⁵, 3.11 × 10⁴) N, a~N (14, 0.23) mm, t~N (27.5, 0.28) mm, h~N (140, 0.53) mm, and b~N (96, 0.47) mm. (pf = 0.0926, reference solution using MCS [47]).
The last problem is a cantilever beam with two cross-section area variables and single applied forces as shown in Figure 4c [48]. The stress can be calculated using the following equation:
σ = 6 F x L t w 2
The cantilever beam made from aluminum has the following random variables assigned: σa~N (100, 20) MPa and Fx~N (2500, 500) N.
The performance function, g(X), for all test problems is given by:
g(X) = σaσ
where σa represents the allowable stress for each problem.

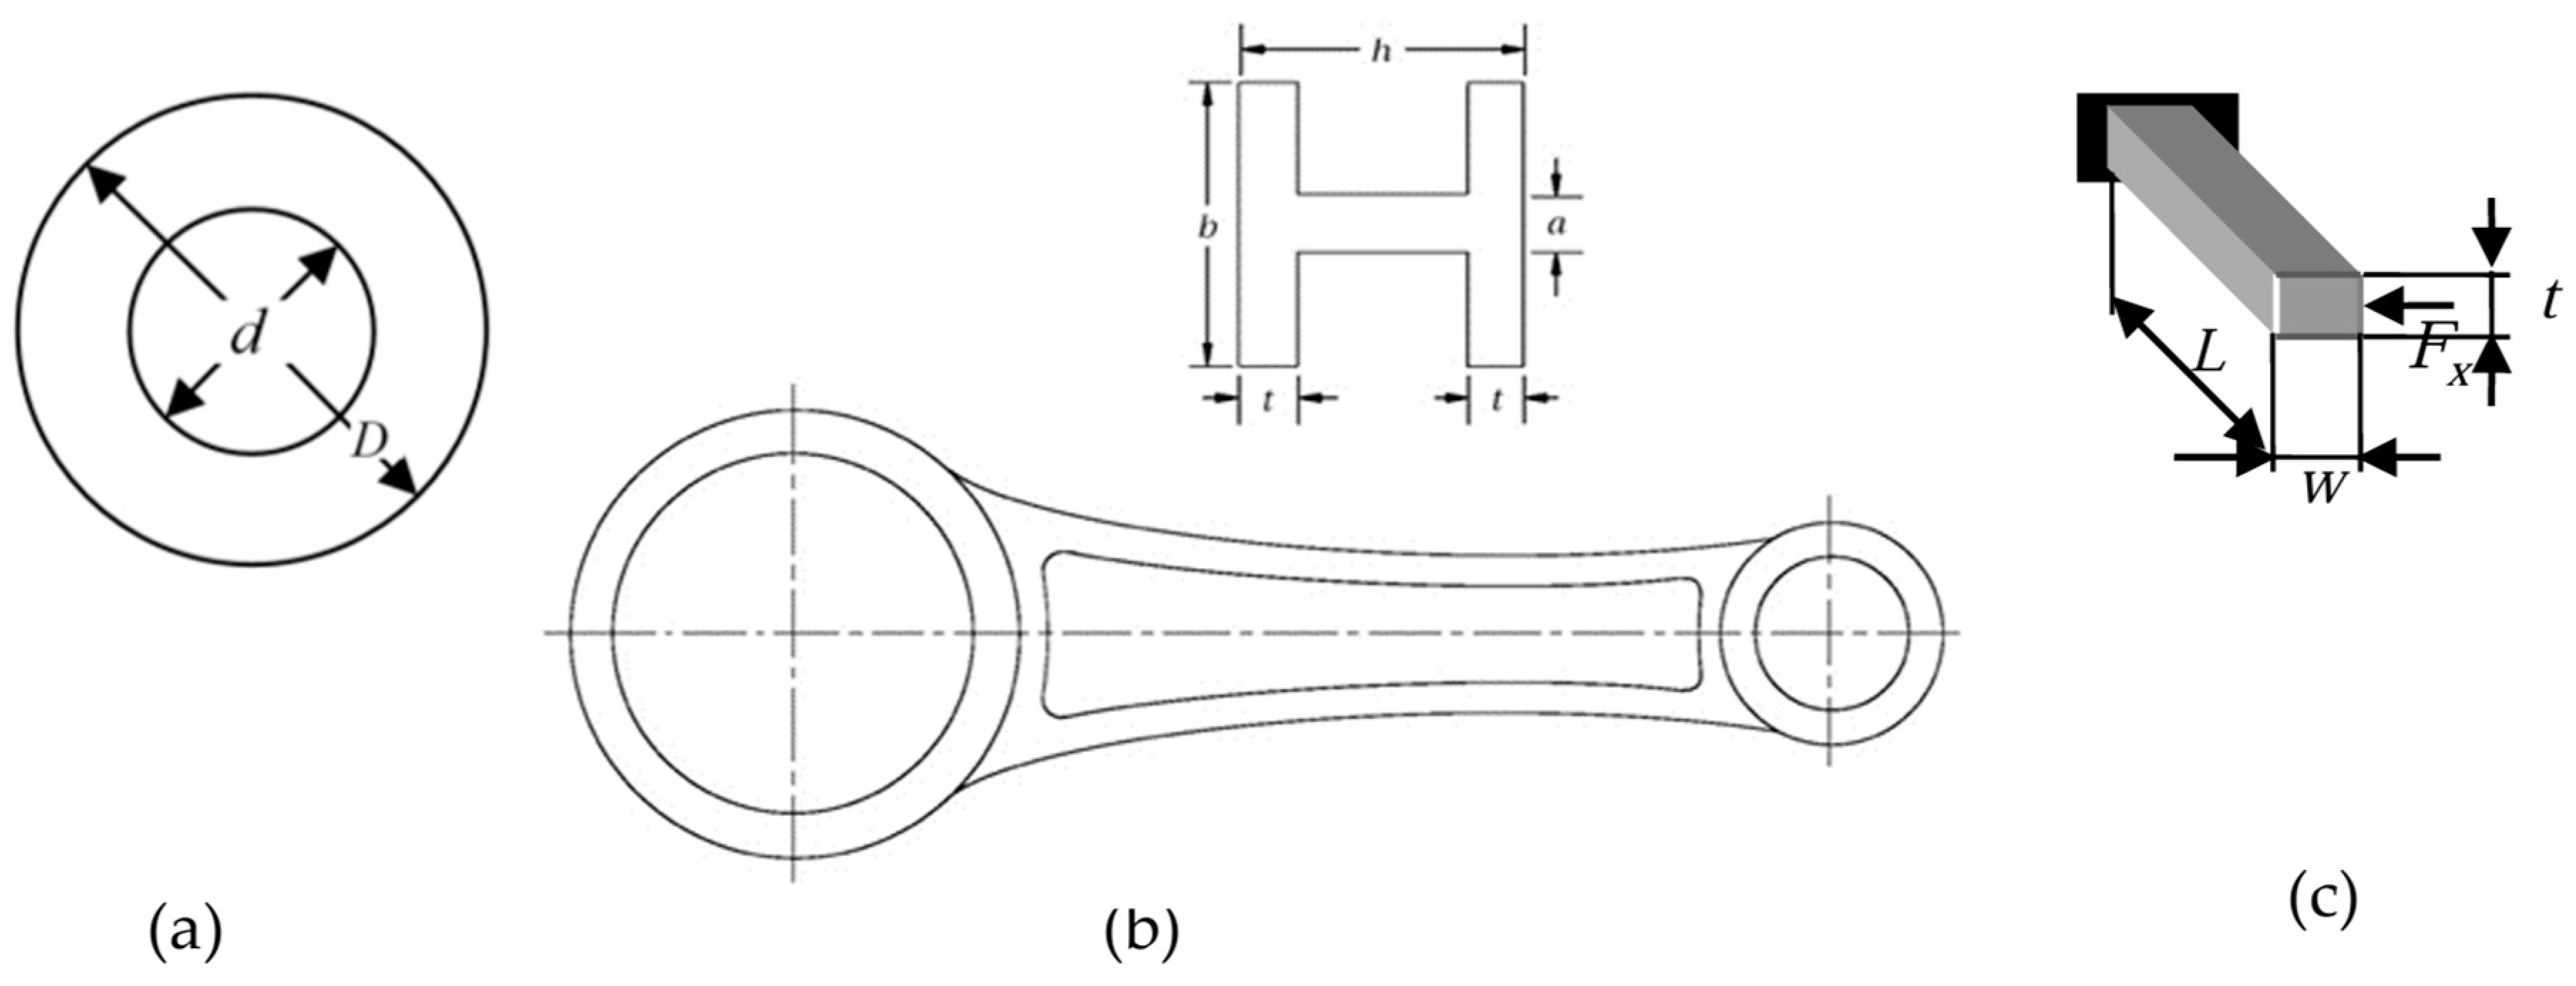
3.2. Reliability-Based Design of a High-Lift Mechanism

The optimization problem in this experiment is the idealized motion of the HLM as presented in (12)–(19). The target motion of the flap in the case of the take-off condition is set up from the optimum condition to gain both more lift and fuel consumption efficiency in [37], which concerns installation location practically as described below.
Target motions Pp(xp,yp) and angle (θ6d):
Pp = {(0.059, 0.0032), (0.0642, −0.0455)}c and θ6d = 0, 24.90°
where c = 1.1173 m.
Limitation of the design variable (side constraints):
0.01   r 1 , r 2 , r 3 , 1 , r 4 , 1 0.8 0.01 r 3 , 2 , r 4 , 2 , r 5 , r 6 0.3 0.1 r p x 0.5 0.01 r p y 0.5 0.1 x 0 0.1 0.2 y 0 0.1 0 θ 0 π / 2 0     θ 2 1 ,   θ 2 2   2 π
Probability of failure constraint:
Prob(g(x) > 0) ≤ pfmax
where g(x) is all constraints, and its probability (31) must be less than or equal to pfmax. The link’s length has a unit in meters, while the angle of crank has a unit in degrees. In this design pfmax is assigned 1, 0.01 and 0.001, where 1 represents a deterministic design and lesser pfmax means more reliability. The problem is RBDO considering the manufacturing tolerance’s uncertainty of the link length, which uses LHSMDF as a tool for uncertainty quantification. The link length tolerance in manufacturing is eL~N (0, 0.003) m. The numerical problem is solved by the metaheuristic algorithm called self-adaptive teaching–learning-based optimization with a diversity archive (ATLBO-DA) [43]. The parameters are defined as IReset = 20, IRange = 5, while δ = 1 with the population np = 100. The synthesis sets the iteration to 500 times, while the running number is 30 times. Repeating studies are used for statistical analysis of the proposed technique. The sampling number of LHSMDF is 103, while the MCS test uses 104 samples.

4. Design Results

4.1. Test Problem Results

The comparative study of LHS and LHSMDF is used to quantify uncertainty for all problems with different random sampling numbers, which are presented in Table 1, Table 2 and Table 3. The first problem LHSMDF, pf converse to 0.0027 with half the sampling number (n) compared to LHS (n = 5 × 10⁴), although its computation time is longer than that of LHS. OLHS failed to capture the uncertainty for this problem, having the longest computation time (due to random sampling and statistical testing) compared to LHSMDF and LHS. Clearer performance is presented in the second problem, with pf converging to 0.0920 with a fewer number of samplings number (n) compared with LHS. The sampling number used is 1/100 of the LHS. The experimental data show that LHSMDF achieves pf convergence at a lower sample number (n) than the LHS. Unfortunately, the time consumption by LHSMDF in the random sampling process is greater than the original LHS but still less than OLHS by more than five times. Increasing precision can compensate for the time spent. For this problem, OLHS still fails to capture pf despite the largest time spent. Similarly, for the third problem, the use of sampling points is 1/10 of the LHS and pf converges to 0.9310, but the computation time in the random sampling process is moderate compared to LHS and OLHS. In the same table, the conservative reliability value is predicted according to the probability of failure. From the comparative performance for uncertainty quantification using the new LHS, it is in accordance with the aim, stating that LHSMDF outperforms the original LHS and OLHS in terms of sampling number and time consumption, respectively. LHSMDF is ready to apply for solving HLM motion generation synthesis.

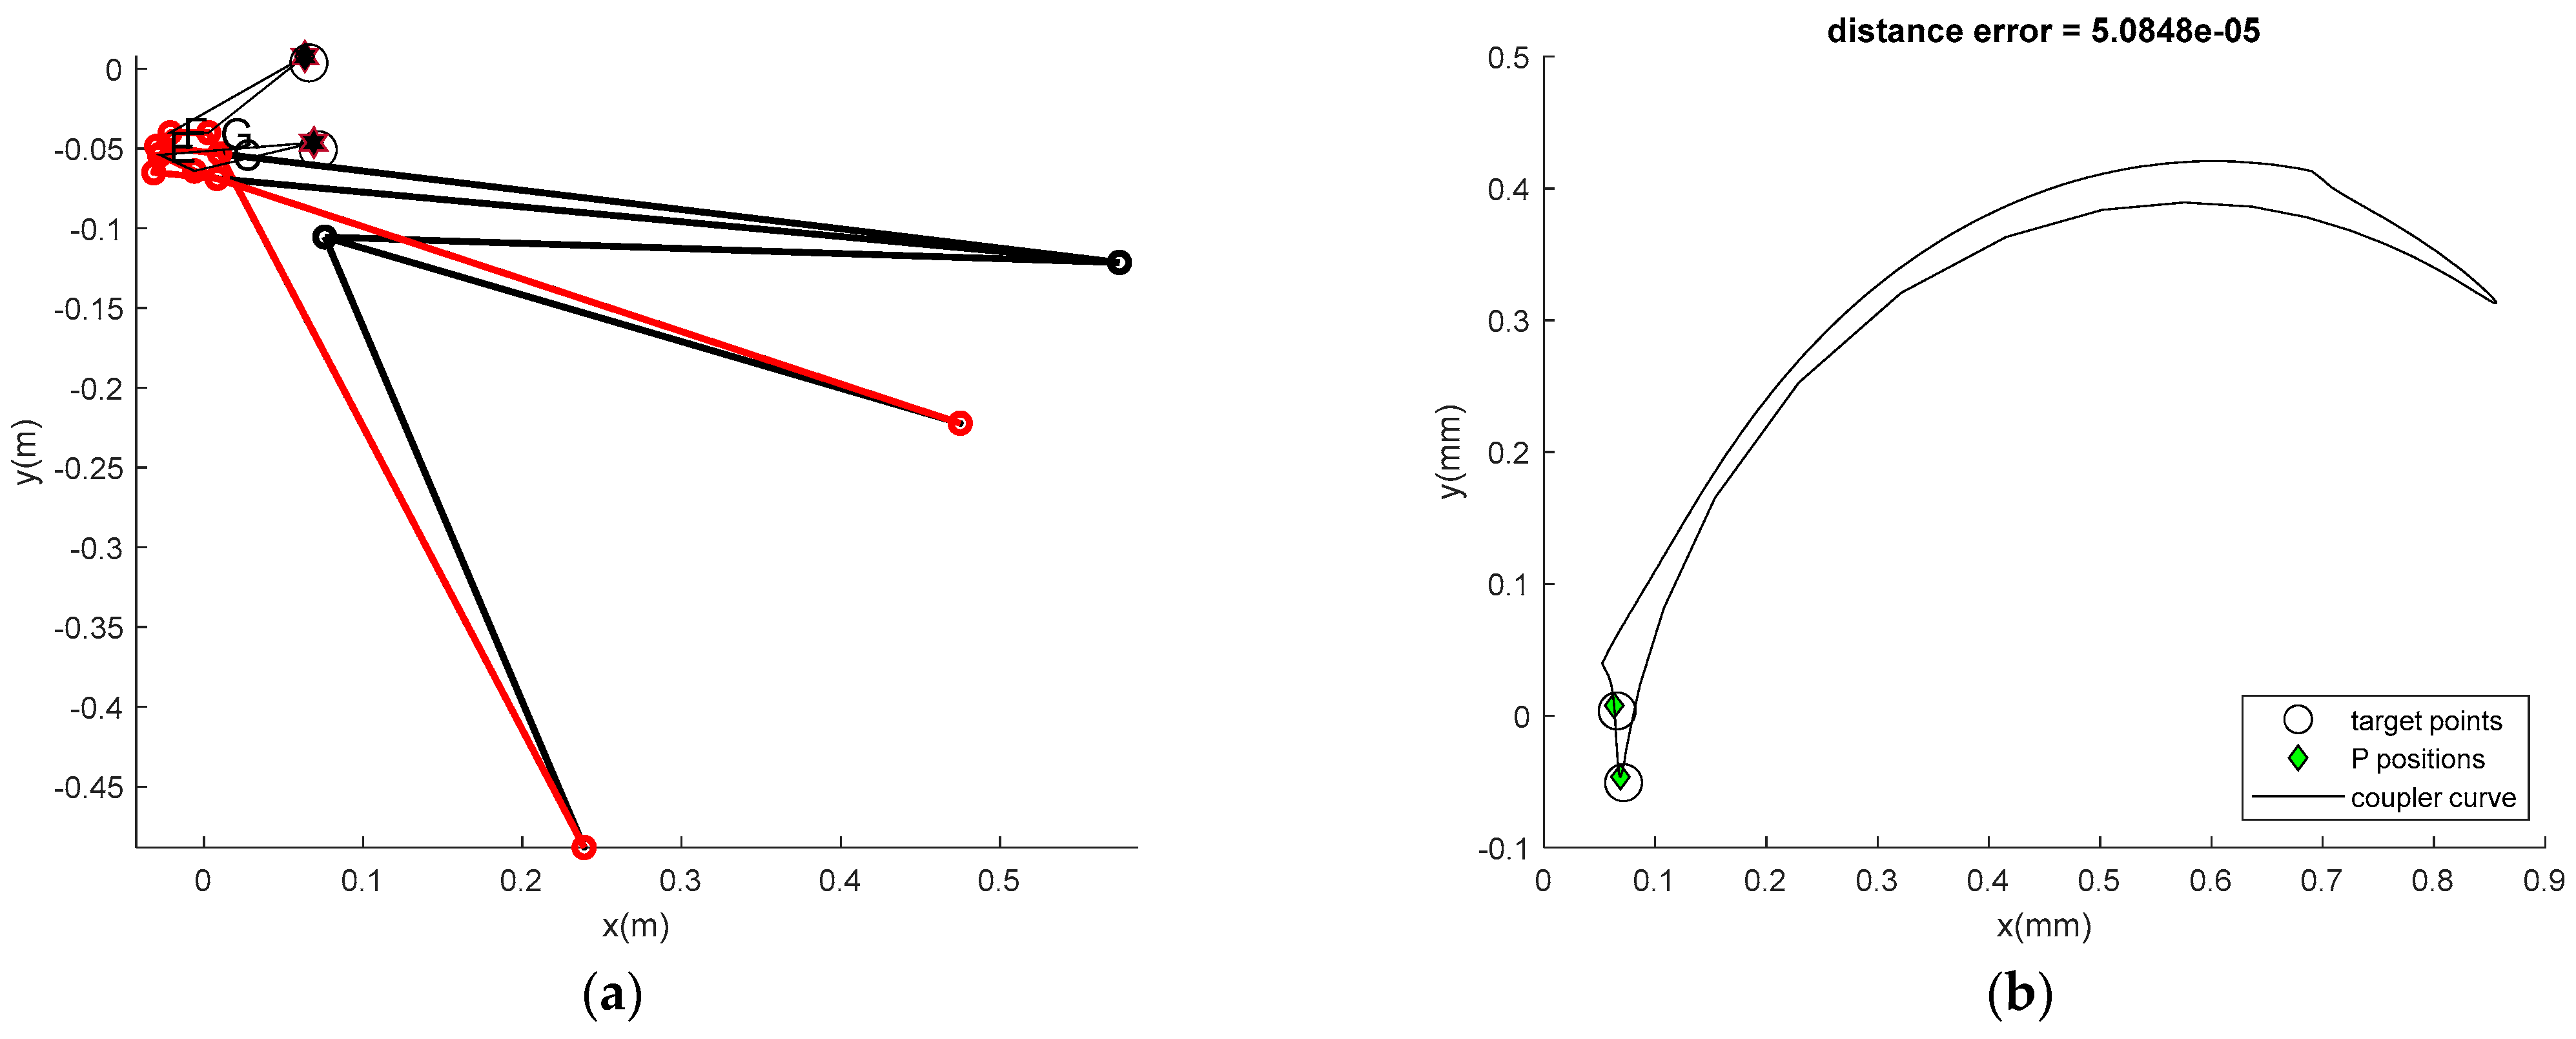
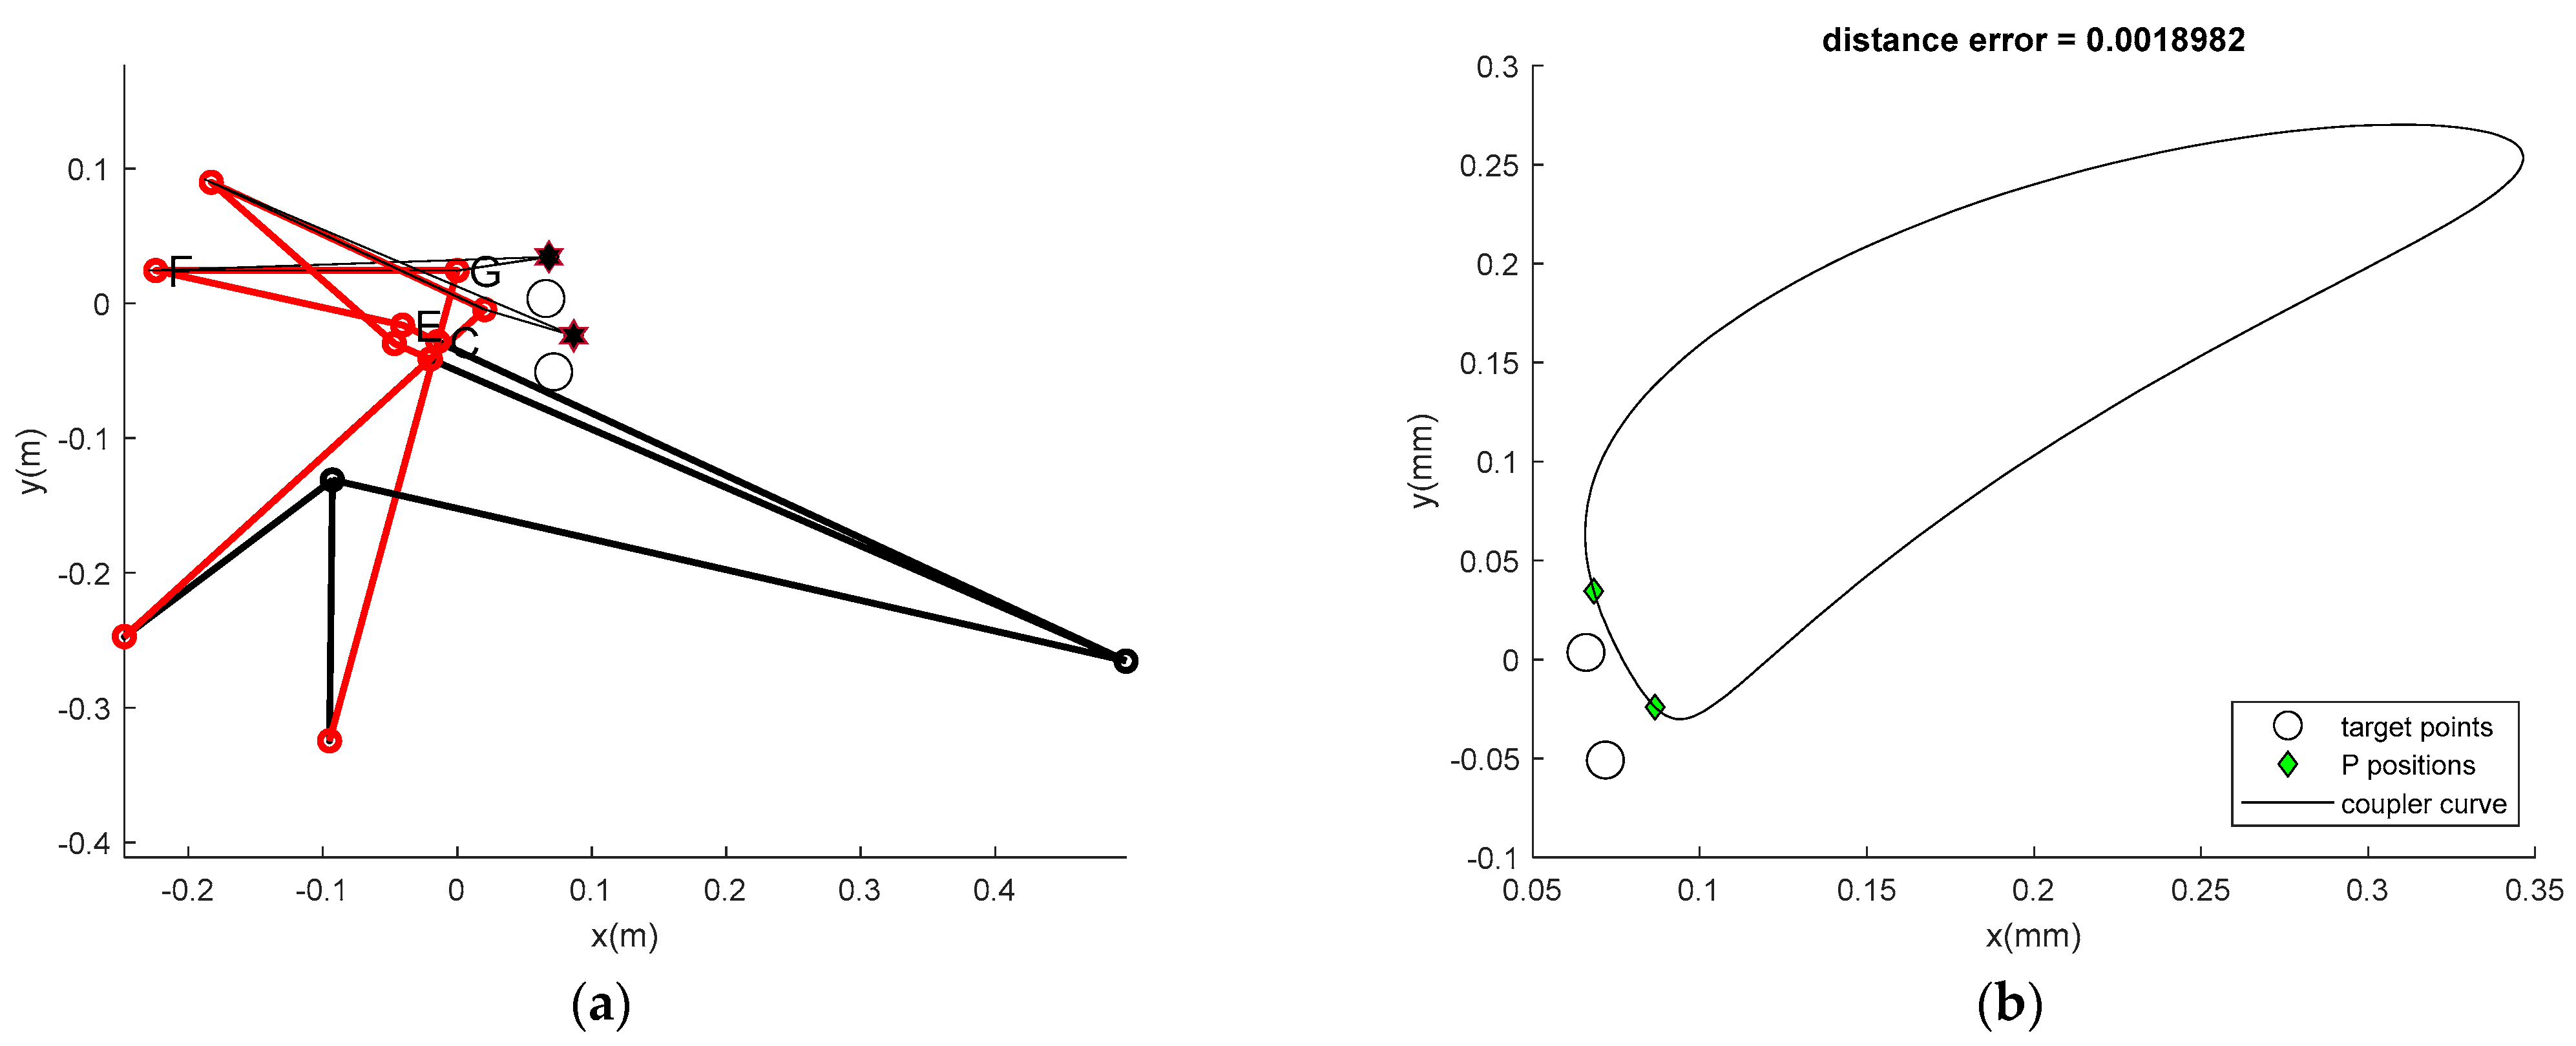
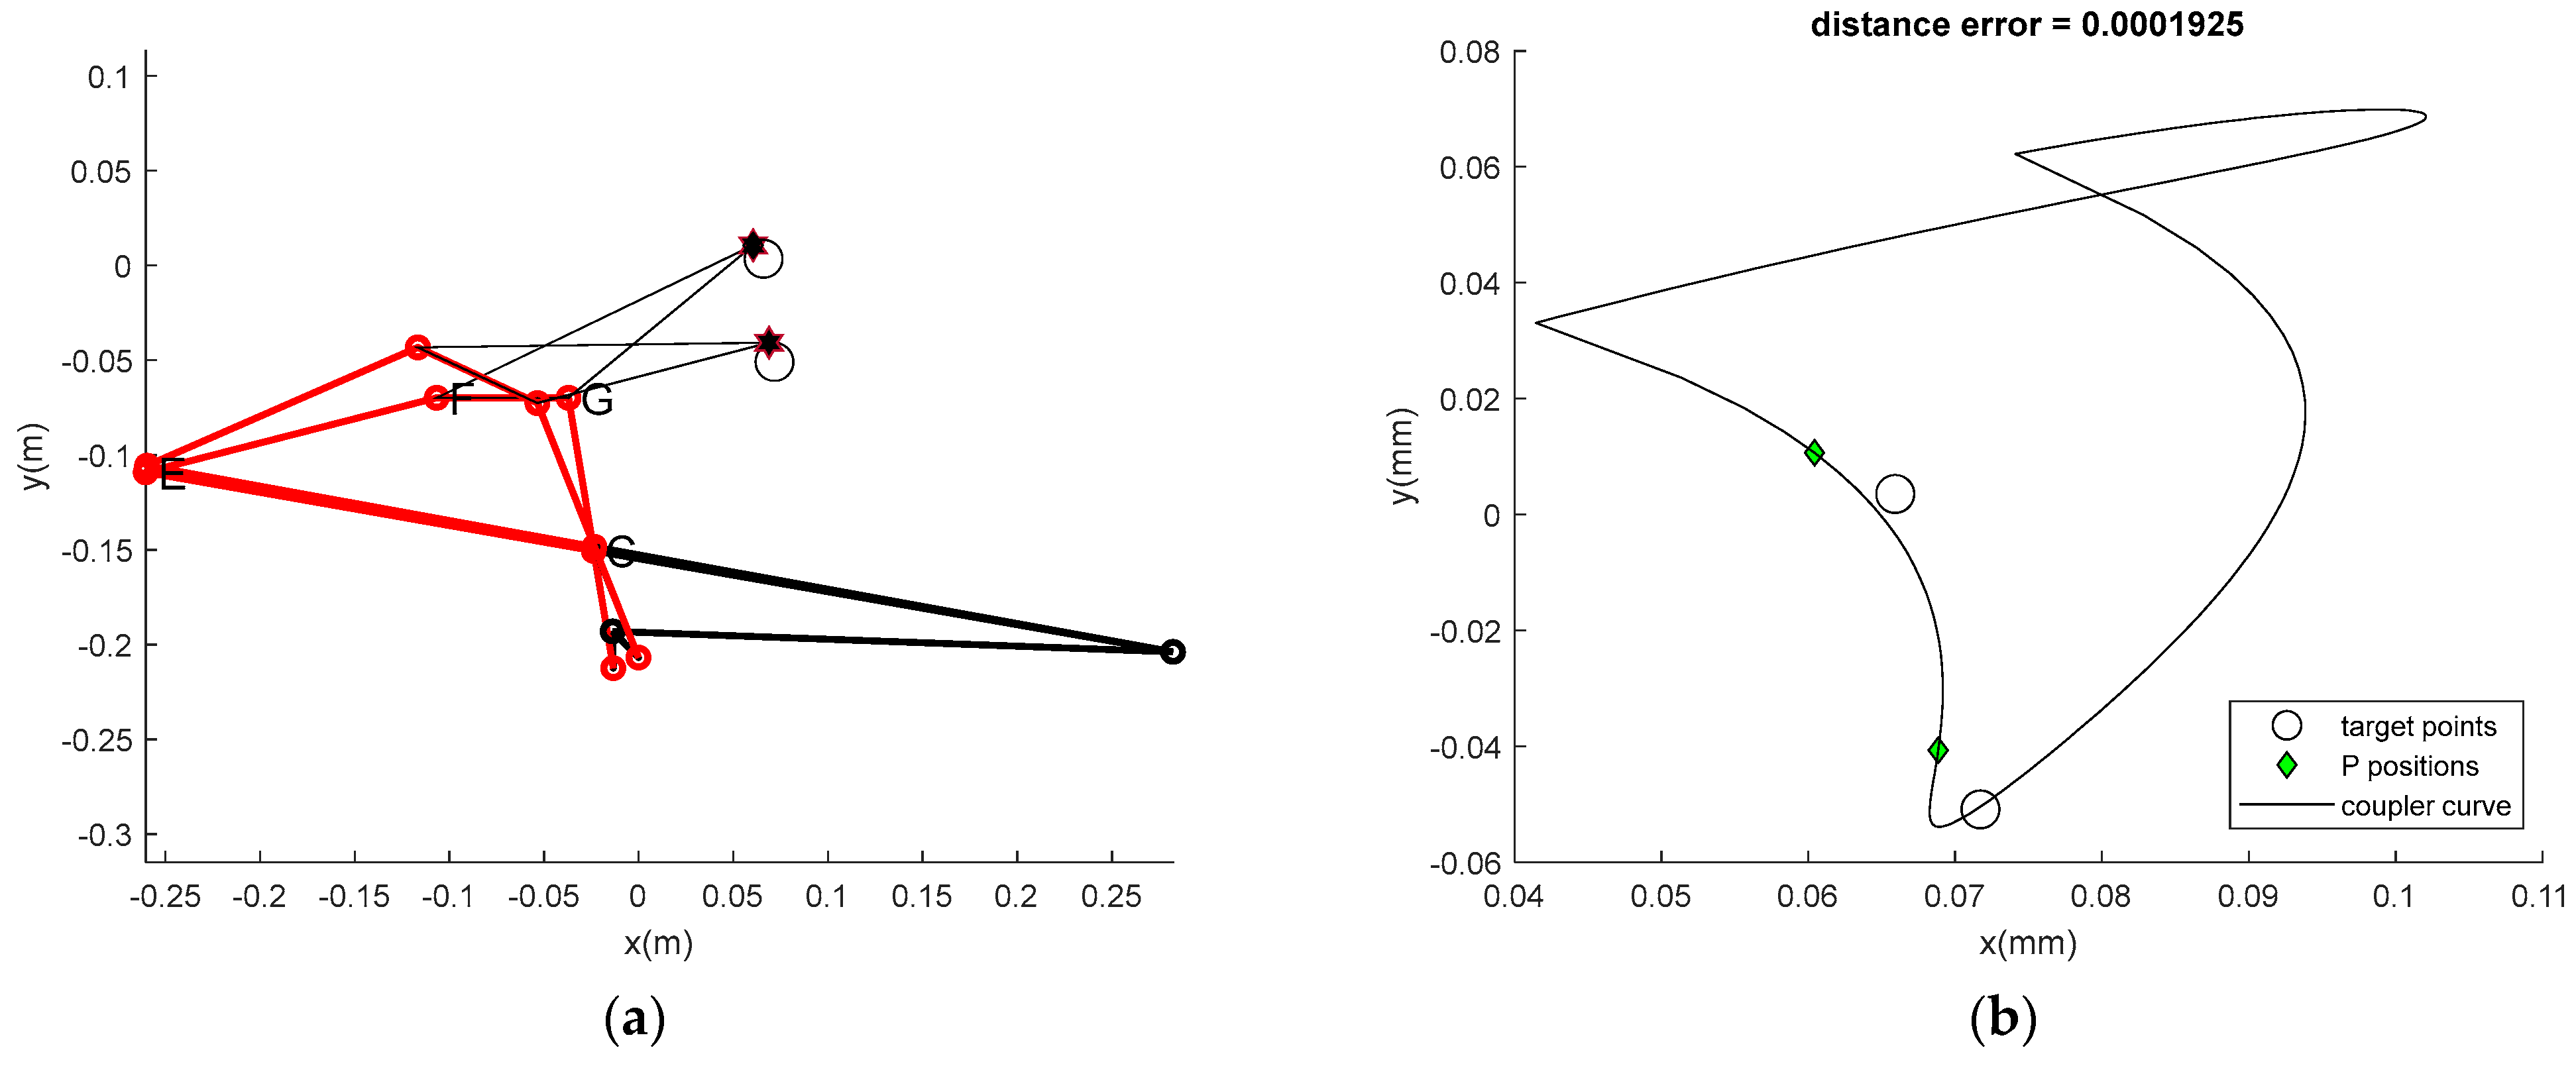
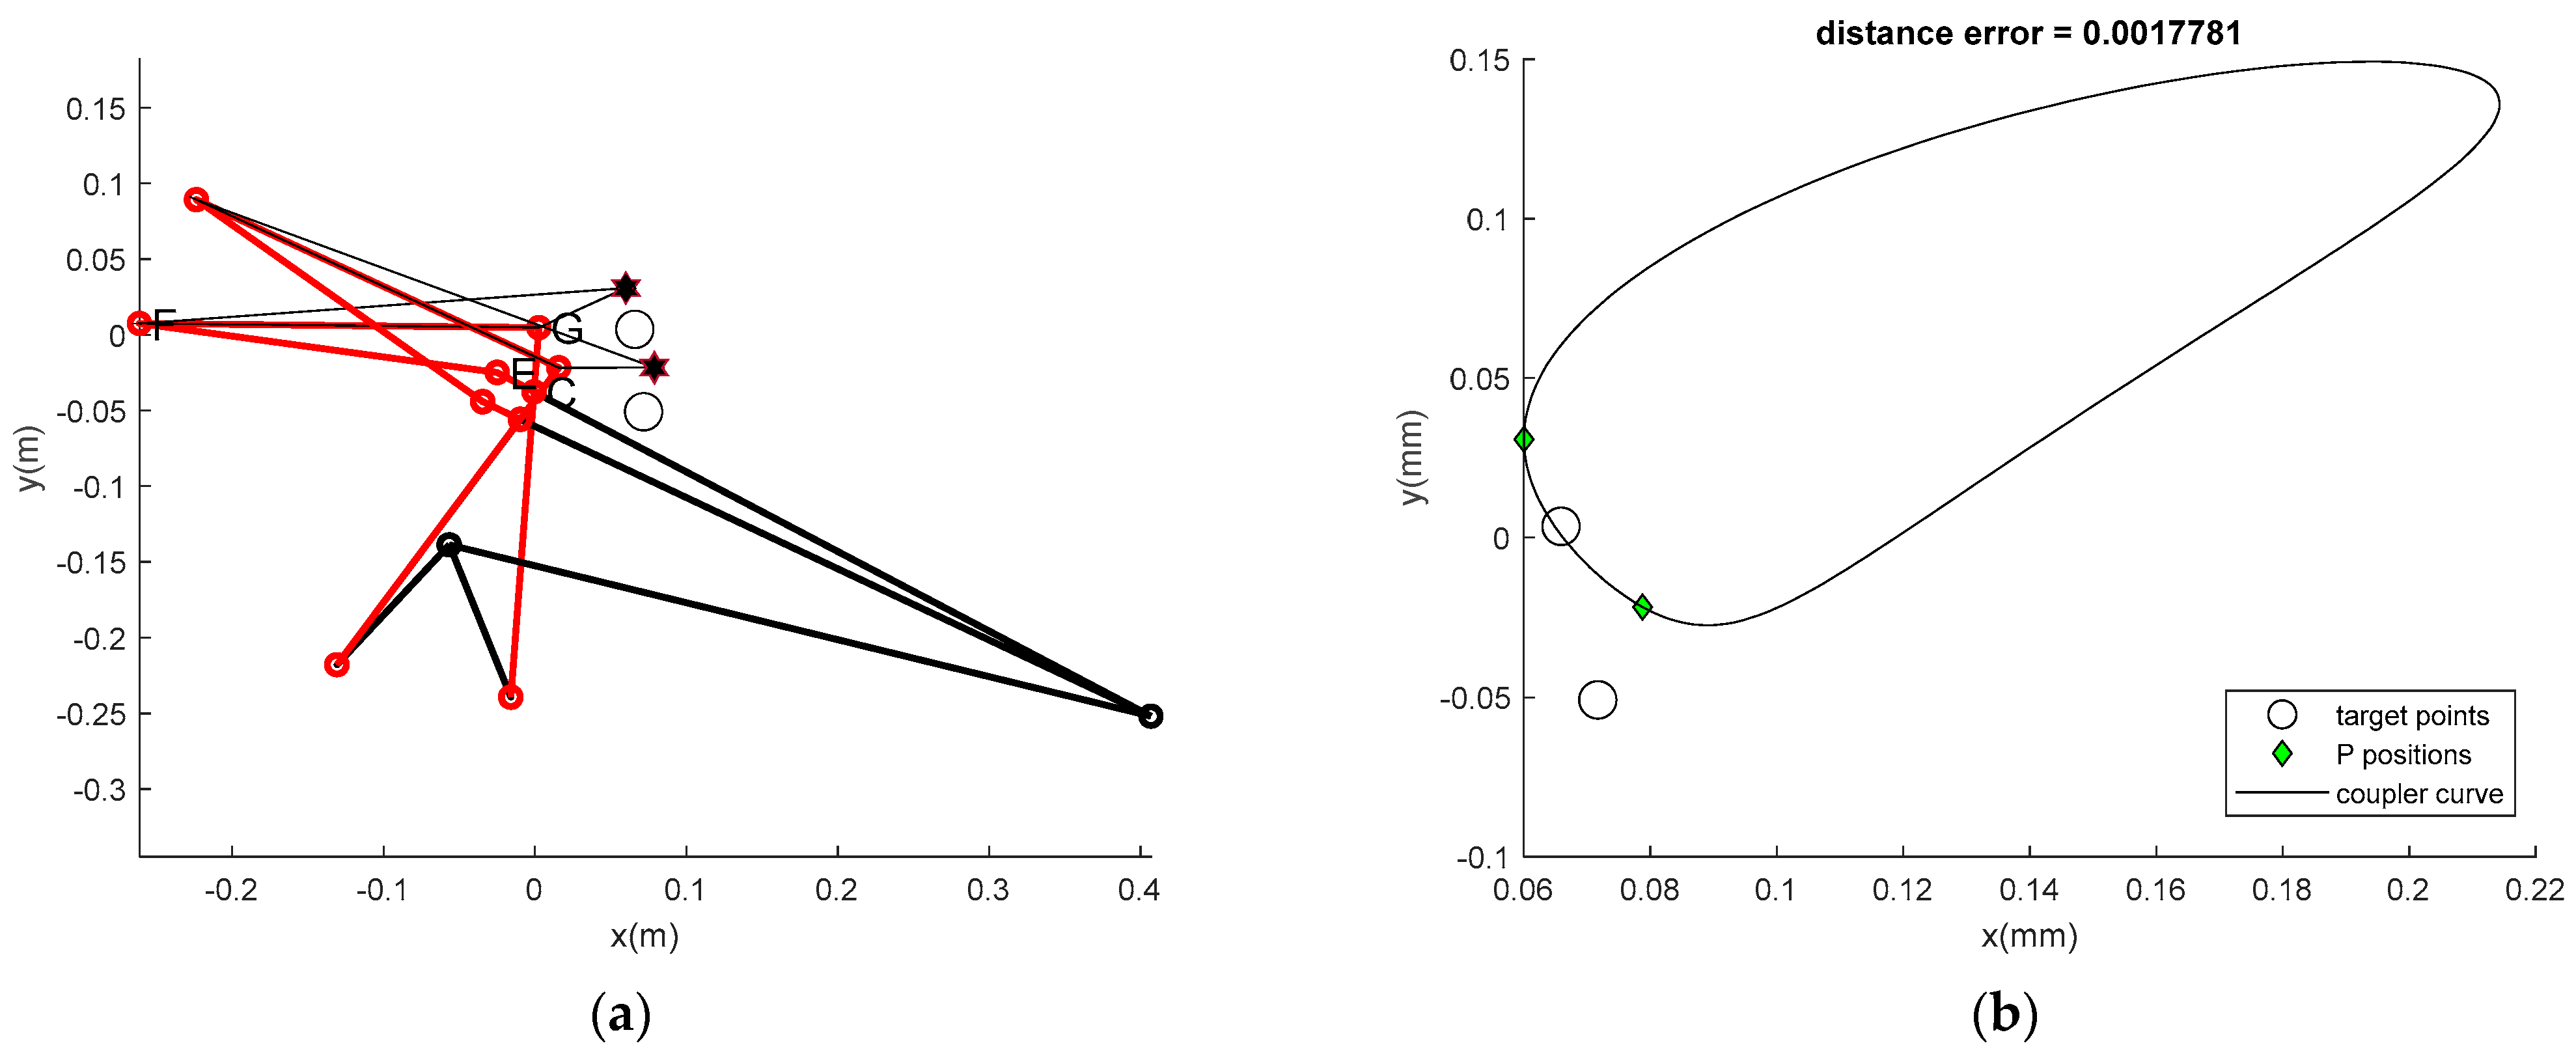
4.2. HLM Synthesis Results

The reliability-based design results of HLM using LHSMDF and ATLBO-DA are presented in Table 4. The design is compared with MCS and ATLBO-DA to confirm the results. The main parameters are the mean error value (Mean), probability of failure (pf), and reliability index (β). These variable values depend on an assigned maximum probability of failure (pfmax) in the design constraints. pfmax in this study consists of 1, 0.01 and 0.001, where 1 represents deterministic design (optimum design without reliability consideration). At pfmax = 0.01 and 0.001, the mean of the objective function error is 8.66 × 10⁻³ and 9.09 × 10⁻³, respectively. The direction of the mean is ascending, which aligns with the MCS results. The best minimum error values are 1.93 × 10⁻⁴, and 0.0018, respectively. The minimum error also follows an ascending trend similar to the mean. The β values for both LHSMDF and MCS increase with the pfmax values, while the pf value decreases. If we carefully observe the relationship among the three variables, they change inversely in such a way that pfmax decreases, while the mean objective function and β increase. This observation is confirmed by the MCS results. On the other hand, when observing the reliability index, it seems to trend towards an increase in the reliability of the mechanism. From the results it can be concluded that the new LHS used only a quarter of the computation time required by MCS. Comparative optimum mechanisms and paths for pfmax = 1, 0.01, and 0.001 of both LHSMDF and MCS are presented in Figure 5, Figure 6, Figure 7, Figure 8 and Figure 9, respectively. Figure 5 shows the optimum mechanism and path of the deterministic design (pfmax = 1). While the minimum error is greatly reduced, the pf is high. Indicating that the optimum design cannot withstand uncertainty due to manufacturing tolerances. The optimum mechanisms and paths based on MCS for pfmax = 0.01 and 0.001 are presented in Figure 6 and Figure 7, respectively. Figure 8 and Figure 9 show the optimum mechanisms and paths based on LHSMDF for the same pfmax values. Clearly, differences appear in Figure 6, Figure 7, Figure 8 and Figure 9 depending on the pfmax values. The best minimum error increases as the uncertainty of the tolerance is suppressed. The uncertainty effect can be alleviated by RBDO, thus allowing the tolerance of the link length in the manufacturing process to be accomplished with the proposed technique. Another observation from the results is that the best minimum error of the deterministic design for six-bar HLM is better than the previous study by the same author in the case of using a four-bar HLM as presented in [37]. Furthermore, the mean and the best min outperform the four-bar HLM.

5. Conclusions

In this research, a new LHSMDF is proposed. Its performance has been tested with mechanical components using other uncertainty quantification (UQ) methods such as LHS and OLHS. The results reveal that the new method outperforms the original LHS and OLHS in terms of sampling number and time consumption, respectively. Then, motion generation synthesis provides evidence of extending in design of high-lift mechanism using a six-bar linkage, which is a symmetrical device of the aircraft. Reliability-based design optimization (RBDO), based on a probabilistic model, uses the new Latin hypercube sampling with maximum diversity factor (LHSMDF) technique. This study focuses on the mechanism’s reliability, considering the manufacturing tolerance of the link length, which is crucial for the moving parts of aircraft necessary for generating additional lift. The RBDO problem is solved with the teaching–learning-based optimization with a diversity archive (ATLBO-DA). The reliability design results are quite good results when applying reliability techniques to the motion generation problem. Notably, an increase in the reliability index and mean error function results in a decreased probability of failure. This study succeeds in RBDO design of HLM using RBDO technique, which can address uncertainty due to link length tolerances. Furthermore, it reveals the six-bar linkage is an alternative for a high-lift device rather than a traditional four-bar linkage. In the upcoming study, the optimum motion, and aerodynamics of HLM using multi-disciplinary design techniques will be further investigated.

Author Contributions

Conceptualization, S.S.; methodology, S.S.; software, S.S.; validation, P.P., J.S., M.K., W.C. and S.S.; formal analysis, P.P., J.S., M.K., W.C. and S.S.; investigation, P.P., J.S., M.K., W.C. and S.S.; writing—original draft preparation, P.P., J.S., M.K., W.C. and S.S.; writing—review and editing, P.P., J.S., M.K., W.C. and S.S.; supervision, S.S. All authors have read and agreed to the published version of the manuscript.

Funding

The authors are grateful for the financial support provided by King Mongkut’s Institute of Technology Ladkrabang and the National Research Council Thailand (N42A650549).

Data Availability Statement

Data are contained within the article.

Conflicts of Interest

The authors declare no conflicts of interest. The funders had no role in the design of the study; in the collection, analyses, or interpretation of data; in the writing of the manuscript, or in the decision to publish the results.

References

  1. Li, L.; Wan, H.; Gao, W.; Tong, F.; Li, H. Reliability based multidisciplinary design optimization of cooling turbine blade considering uncertainty data statistics. Struct. Multidiscipl. Optim. 2019, 59, 659–673. [Google Scholar] [CrossRef]
  2. Elishakoff, I.; Colombi, P. Combination of probabilistic and convex models of uncertainty when scare knowledge is present on acoustic excitation parameters. Comput. Methods Appl. Mech. Eng. 1993, 104, 187–209. [Google Scholar] [CrossRef]
  3. Sleesongsom, S.; Bureerat, S. Multi-objective reliability-based topology Optimization of Structures Using a Fuzzy Set Model. J. Mech. Sci. Technol. 2020, 34, 3973–3980. [Google Scholar] [CrossRef]
  4. Kang, Z.; Luo, Y.; Li, A. On non-probabilistic reliability-based design optimization of structures with uncertain-but-bounded parameters. Struct. Saf. 2011, 33, 196–205. [Google Scholar] [CrossRef]
  5. Sleesongsom, S.; Bureerat, S. Multi-Objective, Reliability-Based Design Optimization of a Steering Linkage. Appl. Sci. 2020, 10, 5748. [Google Scholar] [CrossRef]
  6. Enevoldsen, I.; Sørensen, J. Reliability-based optimization in structural engineering. Struct. Saf. 1994, 15, 169–196. [Google Scholar] [CrossRef]
  7. Tu, J.; Choi, K.K.; Park, Y.H. A New Study on Reliability-Based Design Optimization. J. Mech. Des. 1999, 121, 557–564. [Google Scholar] [CrossRef]
  8. Youn, B.D.; Choi, K.K.; Park, Y.H. Hybrid Analysis Method for Reliability-Based Design Optimization. J. Mech. Des. 2003, 125, 221–232. [Google Scholar] [CrossRef]
  9. Du, X.; Chen, W. Sequential Optimization and Reliability Assessment Method for Efficient Probabilistic Design. J. Mech. Des. 2004, 126, 225–233. [Google Scholar] [CrossRef]
  10. Zou, T.; Mahadevan, S. A direct decoupling approach for efficient reliability-based design optimization. Struct. Multidiscip. Optim. 2006, 31, 190–200. [Google Scholar] [CrossRef]
  11. Shan, S.; Wang, G.G. Reliable design space and complete single-loop reliability-based design optimization. Reliab. Eng. Syst. Saf. 2008, 93, 1218–1230. [Google Scholar] [CrossRef]
  12. Nguyen, T.H.; Song, J.; Paulino, G.H. Single-Loop System Reliability-Based Design Optimization Using Matrix-Based System Reliability Method: Theory and Applications. J. Mech. Des. 2009, 132, 011005. [Google Scholar] [CrossRef]
  13. Chun, J.; Paulino, G.H.; Song, J. Reliability-based topology optimization by ground structure method employing a discrete filtering technique. Struct. Multidiscip. Optim. 2019, 60, 1035–1058. [Google Scholar] [CrossRef]
  14. Chun, J.; Song, J.; Paulino, G.H. System-reliability-based design and topology optimization of structures under constraints on first-passage probability. Struct. Saf. 2019, 76, 81–94. [Google Scholar] [CrossRef]
  15. Chun, J. Reliability-Based Design Optimization of Structures Using Complex-Step Approximation with Sensitivity Analysis. Appl. Sci. 2021, 11, 4708. [Google Scholar] [CrossRef]
  16. Fang, J.; Smith, S.M.; Elishakoffk, I. Combination of anti-optimization and fuzzy-set-based analyses for structural optimization under uncertainty. Math. Prob. Eng. 1998, 4, 187–200. [Google Scholar] [CrossRef]
  17. Moller, B.; Graf, W.; Beer, M. Fuzzy structural analysis using α-level optimization. Comput. Mech. 2000, 26, 547–565. [Google Scholar] [CrossRef]
  18. Tang, Z.C.; Lu, Z.Z.; Hu, J.X. An efficient approach for design optimization of structures involving fuzzy variables. Fuzzy Sets Syst. 2014, 255, 52–73. [Google Scholar] [CrossRef]
  19. Yin, H.; Yu, D.; Xia, R. Reliability-based topology optimization for structures using fuzzy set model. Comput. Methods Appl. Mech. Eng. 2018, 333, 197–217. [Google Scholar] [CrossRef]
  20. Luo, Y.; Zhan, J.; Xing, J.; Kang, Z. Non-probabilistic uncertainty quantification and response analysis of structures with a bounded field model. Comput. Methods Appl. Mech. Eng. 2019, 347, 663–678. [Google Scholar] [CrossRef]
  21. Zhang, L.; Qiu, Z. Multidisciplinary non-probabilistic reliability optimization based on collaborative optimization method. J. Nanjing Univ. Aeronaut. Astronaut. 2010, 42, 267–271. [Google Scholar]
  22. Mostafa, M.N.; Morteza, T. Robust data envelopment analysis with Monte Carlo simulation model for optimization the energy consumption in agriculture. Energy Sources Part A: Recovery Util. Environ. Eff. 2020, 42, 1–15. [Google Scholar]
  23. Peng, H.; Peng, Z. A Practical Method for Redesigning Statistical Tolerances Using Monte Carlo Simulation. In Proceedings of the 9th International Conference on Mechanical and Aerospace Engineering, Budapest, Hungary, 10–13 July 2018; pp. 213–218. [Google Scholar]
  24. Abyani, M.; Bahaari, R.M. A comparative reliability study of corroded pipelines based on Monte Carlo Simulation and Latin Hypercube Sampling methods. Int. J. Press. Vessel. Pip. 2020, 181, 104079. [Google Scholar] [CrossRef]
  25. Champasak, P.; Panagant, N.; Pholdee, N.; Vio, G.; Bureerat, S.; Yıldız, B.; Yıldız, A. Aircraft conceptual design using metaheuristic-based reliability optimization. Aerosp. Sci. Technol. 2022, 129, 107803. [Google Scholar] [CrossRef]
  26. Zhao, W.; Chen, Y.; Liu, J. Reliability sensitivity analysis using axis orthogonal importance Latin hypercube sampling method. Adv. Mech. Eng. 2019, 11, 1–13. [Google Scholar]
  27. Minasny, B.; McBratney, A.B. A conditioned latin hypercube method for sampling in the presence of ancillary information. Comput. Geosci. 2006, 32, 1378–1388. [Google Scholar] [CrossRef]
  28. Le, V.H.; Vargas, R. An autocorrelated conditioned Latin hypercube method for temporal or spatial sampling and predictions. Comput. Geosci. 2024, 184, 105539. [Google Scholar] [CrossRef]
  29. Johnson, M.E.; Moore, L.M.; Ylvisaker, D. Minimax and maximin distance designs. J. Stat. Plan. Inference 1990, 26, 131–148. [Google Scholar] [CrossRef]
  30. Deutsch, J.L.; Deutsch, C.V. Latin hypercube sampling with multidimensional uniformity. J. Stat. Plan. Inference 2012, 142, 763–772. [Google Scholar] [CrossRef]
  31. Erten, O.; Pereira, F.P.L.; Deutsch, C.V. Projection Pursuit Multivariate Sampling of Parameter Uncertainty. Appl. Sci. 2022, 12, 9668. [Google Scholar] [CrossRef]
  32. Morris, M.D.; Mitchell, T.J. Exploratory Designs for Computational Experiments. J. Stat. Plan. Inference 1995, 43, 381–402. [Google Scholar] [CrossRef]
  33. Zhu, H.G.; Liu, L.; Long, T.; Peng, L. A Novel Algorithm of Maximin Latin Hypercube Design Using Successive Local Enumeration. Eng. Optim. 2012, 44, 551–564. [Google Scholar] [CrossRef]
  34. Li, G.; Yang, J.; Wu, Z.; Zhang, W.; Okolo, P.; Zhang, D. A Sequential Optimal Latin Hypercube Design Method Using an Efficient Recursive Permutation Evolution Algorithm. Eng. Optim. 2022, 56, 179–198. [Google Scholar] [CrossRef]
  35. Liaw, H.C.; Shirinzadeh, B. Constrained Motion Tracking Control of Piezo-Actuated Flexure-Based Four-Bar Mechanisms for Micro/Nano Manipulation. IEEE Trans. Autom. Sci. Eng. 2010, 7, 699–705. [Google Scholar] [CrossRef]
  36. Sleesongsom, S.; Bureerat, S. Optimization of a High-Lift Mechanism Motion Generation Synthesis Using MHS. In Advances in Swarm Intelligence; Tan, Y., Shi, Y., Eds.; ICSI 2021; Lecture Notes in Computer Science; Springer: Berlin/Heidelberg, Germany, 2021; p. 12689. [Google Scholar]
  37. Promphan, P.; Suvisuthikasame, J.; Kaewmongkol, M.; Chanpichitwanich, W.; Sleesongsom, S. Optimal Synthesis of a Motion Generation Six-Bar Linkage. In Advances in Swarm Intelligence; Tan, Y., Shi, Y., Niu, B., Eds.; ICSI 2022; Lecture Notes in Computer Science; Springer: Berlin/Heidelberg, Germany, 2022; p. 13345. [Google Scholar]
  38. Promphan, P.; Suvisuthikasame, J.; Kaewmongkol, M.; Chanpichitwanich, W.; Sleesongsom, S. Optimal synthesis of a six-bar linkage. AIP Conf. Proc. 2023, 2601, 020029. [Google Scholar]
  39. Gordon, R.; Pennock, A. Kinematic analysis and synthesis of an adjustable six-bar linkage. Mech. Mach. Theory 2009, 44, 306–323. [Google Scholar]
  40. Erkin, G.; Pyung-Hun, C.; Ahmet, F.A. Synthesis of a Watt II six-bar linkage in the design of a hand rehabilitation robot. Mech. Mach. Theory 2016, 104, 177–189. [Google Scholar]
  41. Gogate, G.R.; Matekar, S.B. Unified synthesis of Watt-I six-link mechanisms using evolutionary optimization. J. Mech. Sci. Technol. 2014, 28, 3075–3086. [Google Scholar] [CrossRef]
  42. Sleesongsom, S.; Bureerat, S. Four-bar linkage path generation through self-adaptive population size teaching-learning based optimization. Knowl.-Based Syst. 2017, 135, 180–191. [Google Scholar] [CrossRef]
  43. Bureerat, S.; Sleesongsom, S. Constraint handling technique for four-bar linkage path generation using self-adaptive teaching–learning-based optimization with a diversity archive. Eng. Optim. 2020, 53, 513–530. [Google Scholar] [CrossRef]
  44. McKay, M.D.; Conover, W.J.; Beckman, R.J. A comparison of three methods for selecting values of input variables in the analysis of output from a computer code. Technometrics 1979, 21, 239–245. [Google Scholar]
  45. Olsson, A.; Sandberg, G.; Dahlblom, O. On Latin hypercube sampling for structural reliability analysis. Struct. Saf. 2003, 25, 47–68. [Google Scholar] [CrossRef]
  46. Cioppa, T.; Lucas, T. Efficient nearly orthogonal and space-filling Latin hypercubes. Technometrics 2007, 49, 45–55. [Google Scholar] [CrossRef]
  47. Chanu, S.; Wattanathorn, A.; Senpong, M.; Sleesongsom, S. Reliability analysis in design of mechanical components. AIP Conf. Proc. 2023, 2601, 020030. [Google Scholar]
  48. Sleesongsom, S.; Winyangkul, S.; Bureerat, S. Multiobjective reliability-based design of an aircraft wing using a fuzzy-based metaheuristic. In Proceedings of the ASME 2021 International Mechanical Engineering Congress and Exposition, Virtual, 1–5 November 2021; Volume 13: Safety Engineering, Risk, and Reliability Analysis, Research Posters, V013T14A016; ASME: New York, NY, USA, 2021. [Google Scholar]
Figure 1. LHS technique (a) generated random variables size 5 × 2 (b) sample space and sampling point.
Symmetry 16 00901 g001
Figure 2. Measuring Euclidean distance.
Symmetry 16 00901 g002
Figure 3. High-lift mechanism in global coordinate.
Symmetry 16 00901 g003
Figure 4. (a) The circular shaft housing, (b) the connecting rod, and (c) the cantilever beam.
Symmetry 16 00901 g004
Figure 5. (a) Optimum mechanism and (b) optimum path for pfmax = 1 (DTO).
Symmetry 16 00901 g005
Figure 6. (a) Optimum mechanism and (b) optimum path for pfmax = 0.01 (MCS).
Symmetry 16 00901 g006
Figure 7. (a) Optimum mechanism and (b) optimum path for pfmax = 0.001 (MCS).
Symmetry 16 00901 g007
Figure 8. (a) Optimum mechanism and (b) optimum path for pfmax = 0.01 (LHSMDF).
Symmetry 16 00901 g008
Figure 9. (a) Optimum mechanism and (b) optimum path for pfmax = 0.001 (LHSMDF).
Symmetry 16 00901 g009
Table 1. Sampling refinement test of LHS and LHSMDF for first problem.
Sampling Number (n)20103104105106
LHSpf00.00600.00300.00260.0023
R10.9940.9970.99740.9977
Rand. samp. (s)0.008120.010490.022100.042300.36420
Statistic test (s)0.002880.005960.011460.025270.21685
n201031042 × 1045 × 104
LHSMDFpf000.00100.00150.0027
R110.9990.99850.9973
Rand. samp. (s)0.085240.0703912.50720153.529242516.02090
Statistic test(s)0.005650.007350.015100.022310.06244
n201021032 × 1035 × 103
OLHSpf000.0070.00752.0 × 10−4
R110.9930.99250.9998
Rand. samp. (s)0.333516.15665590.780052193.5926110,215.09658
Statistic test(s)0.018230.003640.019570.014460.38352
Table 2. Sampling refinement test of LHS and LHSMDF for second problem.
Sampling Number (n)20103104105106
LHSpf0.05000.09100.09290.09280.0923
R0.95000.90900.90710.90720.9077
Rand. samp. (s)0.008090.010610.012740.057240.46319
Statistic test(s)0.005120.004970.006980.016070.09077
n201031042 × 1045 × 104
LHSMDFpf0.10000.08000.09200.09350.0947
R0.90000.92000.90800.90650.9053
Rand. samp. (s)0.037830.0676814.34204179.438323006.86080
Statistic test(s)0.005330.004330.006990.005350.00423
n201021032 × 1035 × 103
OLHSpf0.10000.18000.0830.080.0978
R0.90000.820000.9170.920.9022
Rand. samp. (s)0.27254.93440522.910801771.685309448.59657
Statistic test(s)0.045700.001940.005920.032910.00301
Table 3. Sampling refinement test of LHS and LHSMDF for third problem.
Sampling Number (n)20103104105106
LHSpf0.90000.92700.92040.92510.9246
R0.1000.07960.07960.07490.0754
Rand. samp. (s)0.006120.006610.007740.037630.16724
Statistic test (s)0.002110.002490.004260.019760.11857
n201031042 × 1045 × 104
LHSMDFpf0.90000.91000.93100.92160.9256
R0.10000.09000.06900.07840.0744
Rand. samp. (s)0.037160.041314.9939860.957961038.02087
Statistic test(s)0.003280.002740.005970.010410.02588
n201021032 × 1035 × 103
OLHSpf0.90000.86000.89200.87900.893
R0.10000.14000.10800.12100.106999
Rand. samp. (s)0.342236.12404624.309902197.045489804.15560
Statistic test(s)0.002460.002340.003490.006950.02253
Table 4. Design results of the high-lift mechanism.
ParametersFlap Take-Off Condition
pfmax10.010.001
DTMLHSMDFMCSLHSMDFMCS
r1 (m)0.49930.29630.36600.47710.6052
r2 (m)0.41570.01940.19490.10850.1935
r3 (m)0.49130.06280.28390.20230.3069
r3,2 (m)0.01500.08170.05190.04250.0547
r4 (m)0.56920.31060.30470.46040.5638
r4,2 (m)0.04000.24030.01760.02740.0290
r5 (m)0.01330.16020.10740.25640.2121
r6 (m)0.02400.06960.09850.26370.2242
rpx (m)−0.0604−0.09769.0807 × 10−4−0.0572−0.0682
rpy (m)0.04770.08040.01200.02660.0101
x0 (m)0.0759−0.0138−0.0692−0.0567−0.0929
y0 (m)−0.1056−0.1930−0.1119−0.1387−0.1310
θ0 (rad)−0.0318−0.0367−0.3662−0.2395−0.2240
Mean fobj3.90 × 10−28.66 × 10−31.77 × 10−29.09 × 10−31.91 × 10−2
β0.89815.11144.765213.596612.6165
pf0.18461.60 × 10−79.43 × 10−700
Best min5.0848× 10−51.93 × 10−41.51 × 10−40.00180.0019
Compt. (s)28.6467256.4276832.0085256.8591788.8039
Disclaimer/Publisher’s Note: The statements, opinions and data contained in all publications are solely those of the individual author(s) and contributor(s) and not of MDPI and/or the editor(s). MDPI and/or the editor(s) disclaim responsibility for any injury to people or property resulting from any ideas, methods, instructions or products referred to in the content.

