
Filter Cake Neural-Objective Data Modeling and Image Optimization

 , , , ,
  and
and
Abstract
:1. Introduction
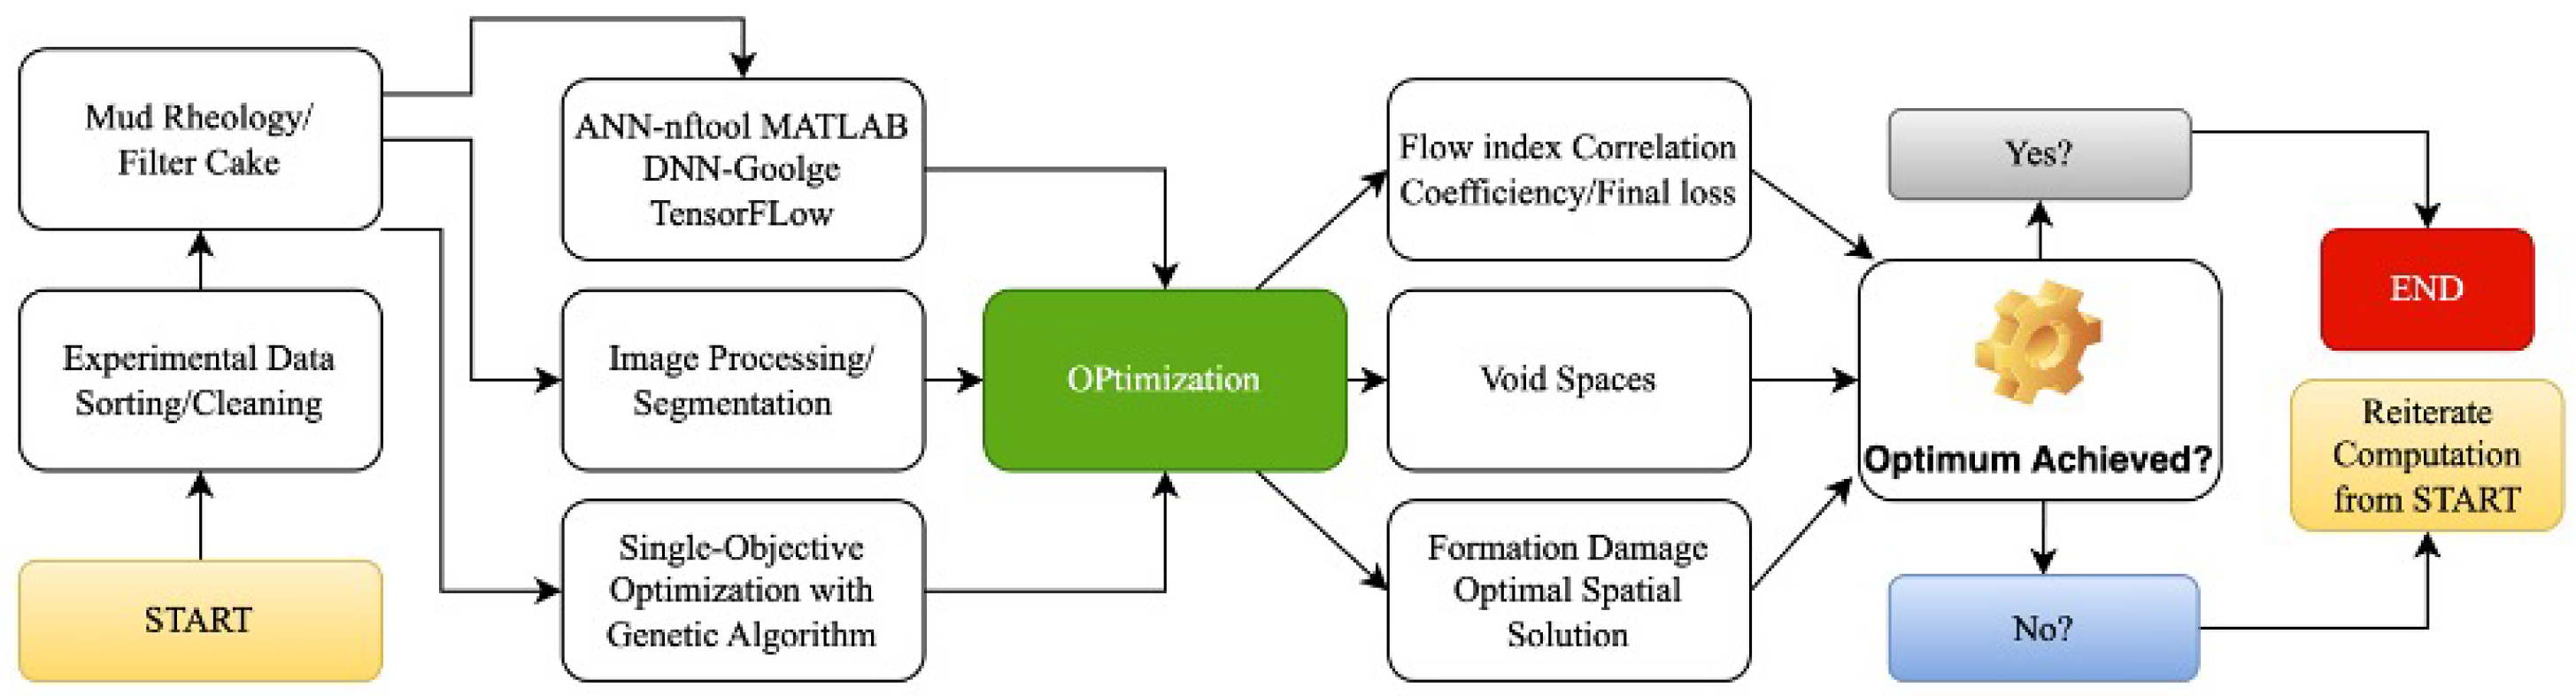
2. Methodology
2.1. Experimental Data
2.2. Neural Network Approach
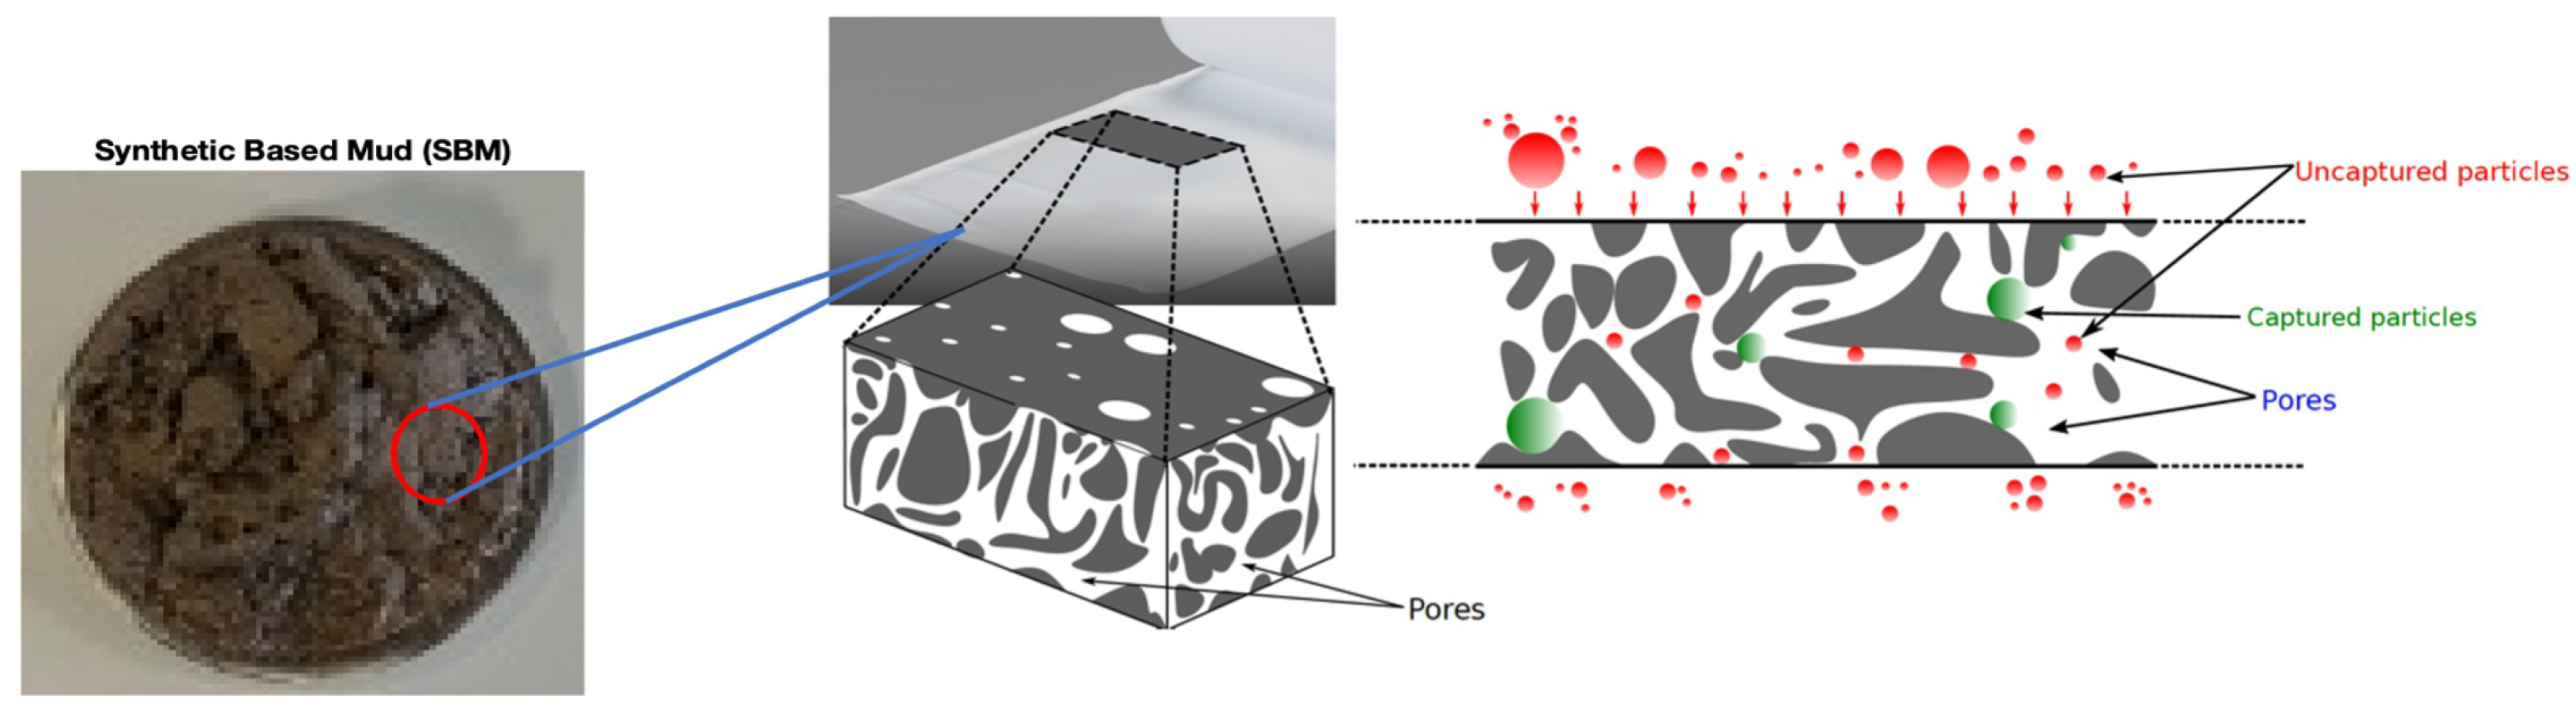
2.3. Filter Cake Image Processing
2.4. Flow Index Single-Objective Simulation
3. Results and Discussion
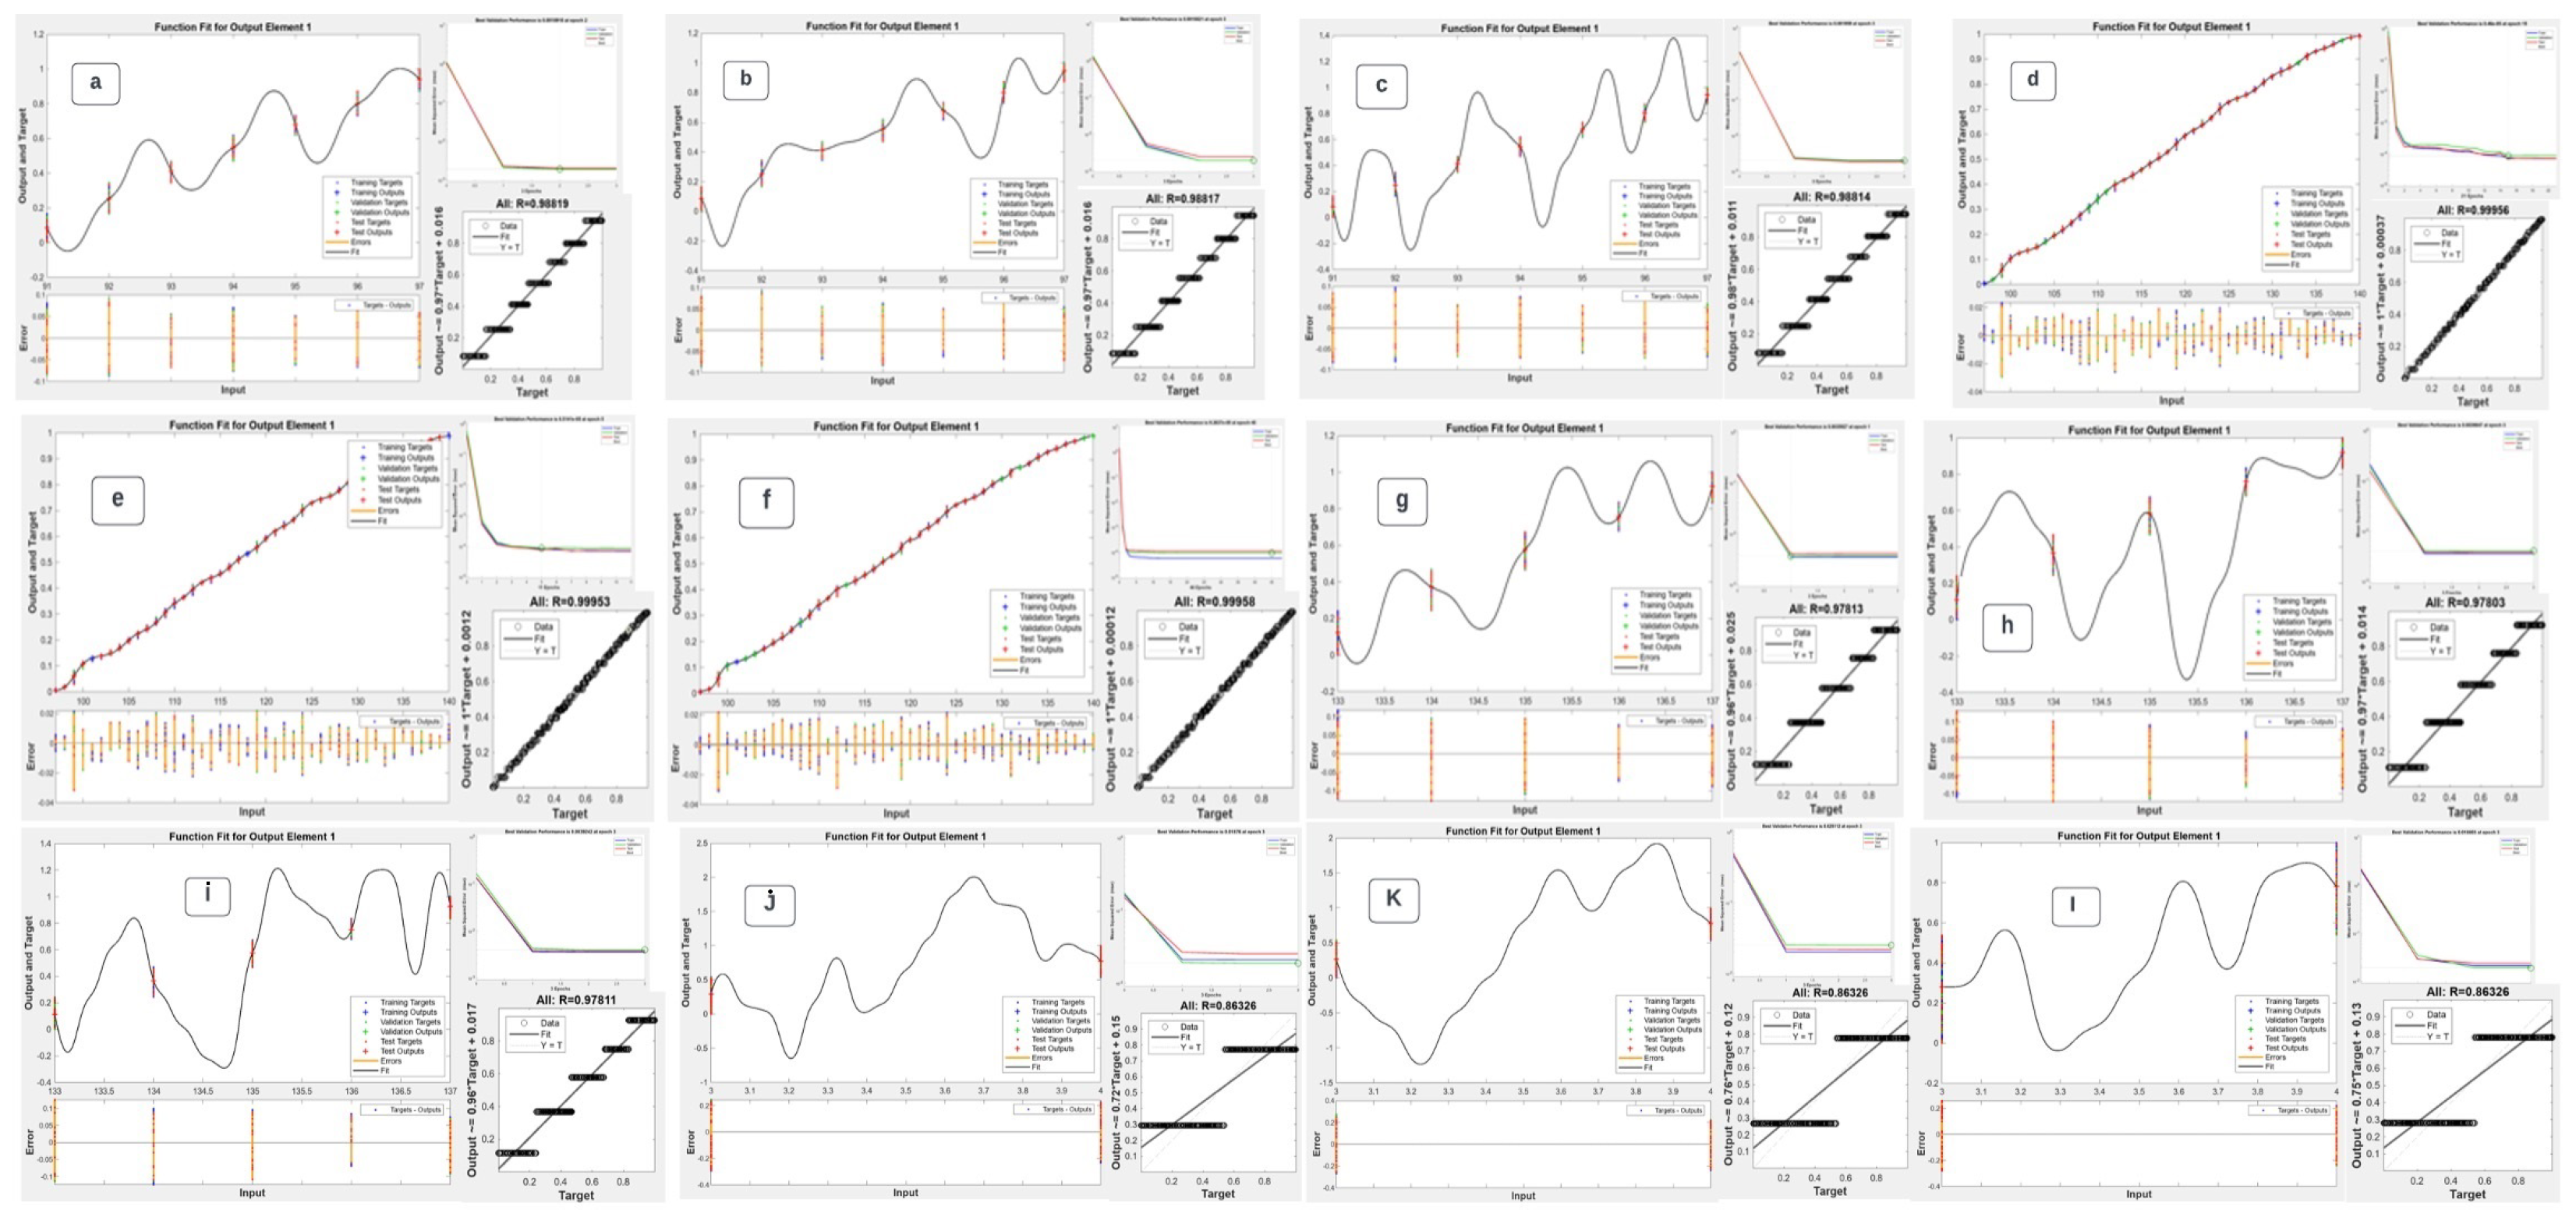
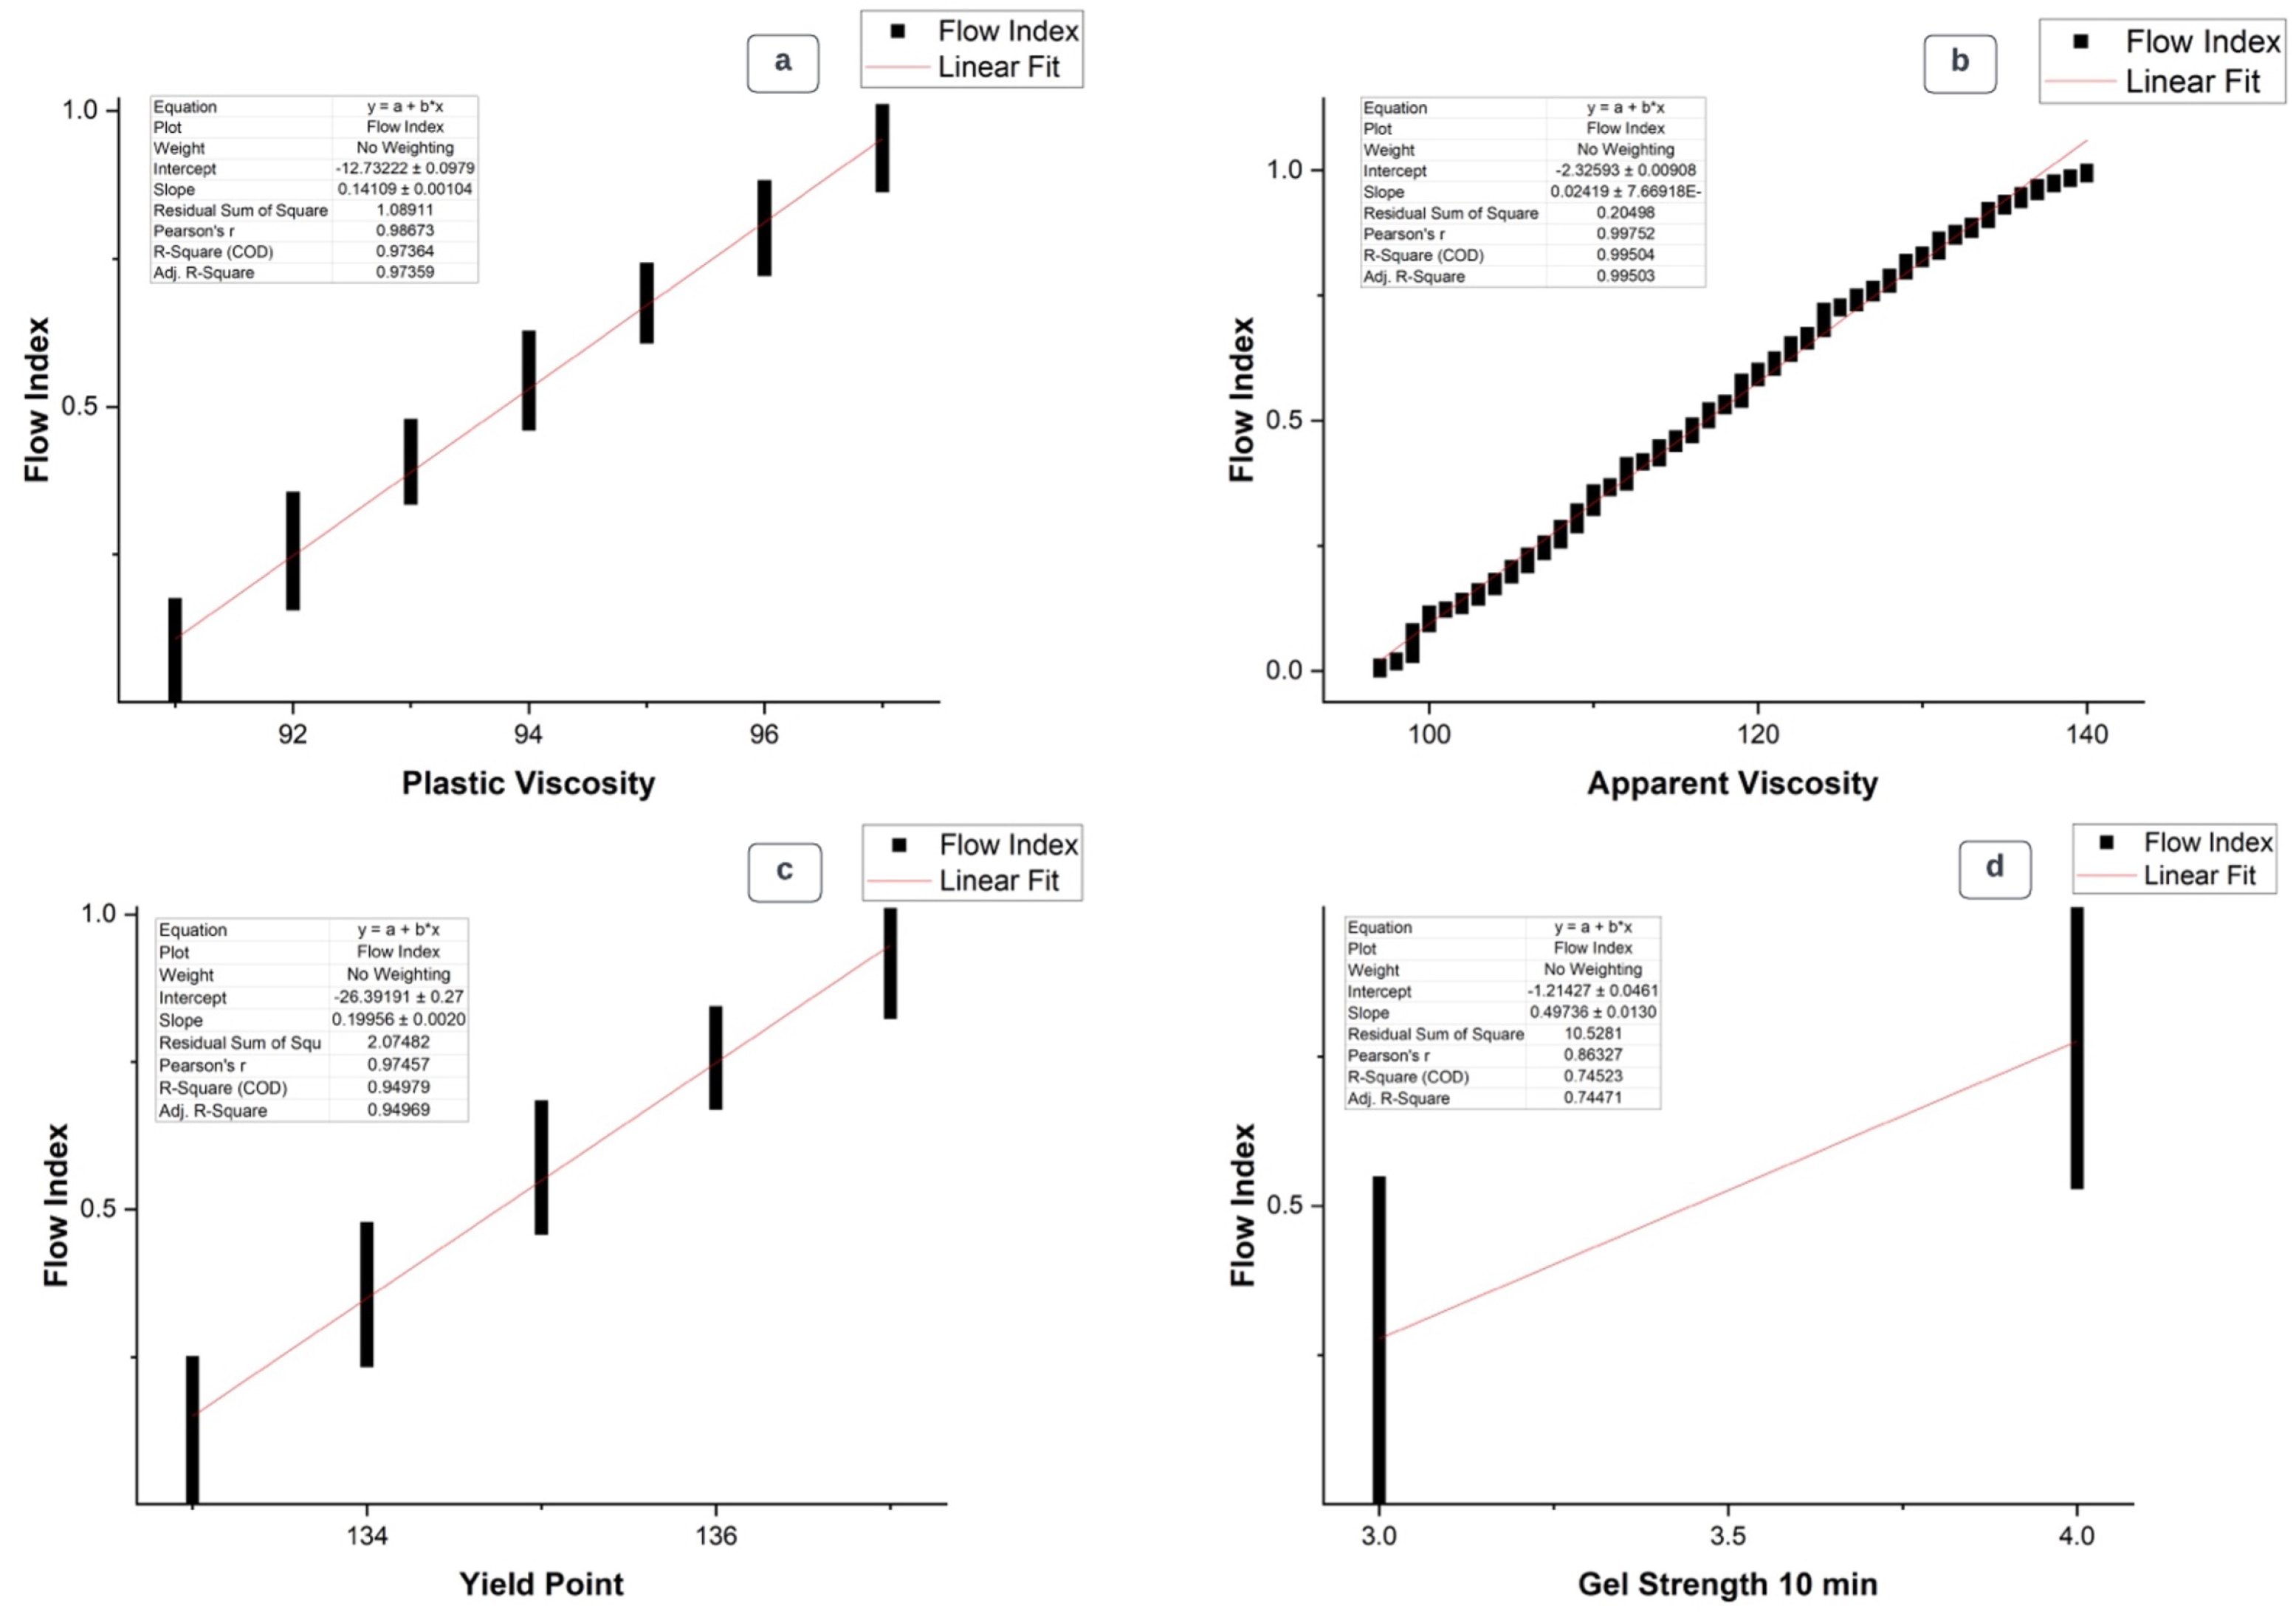
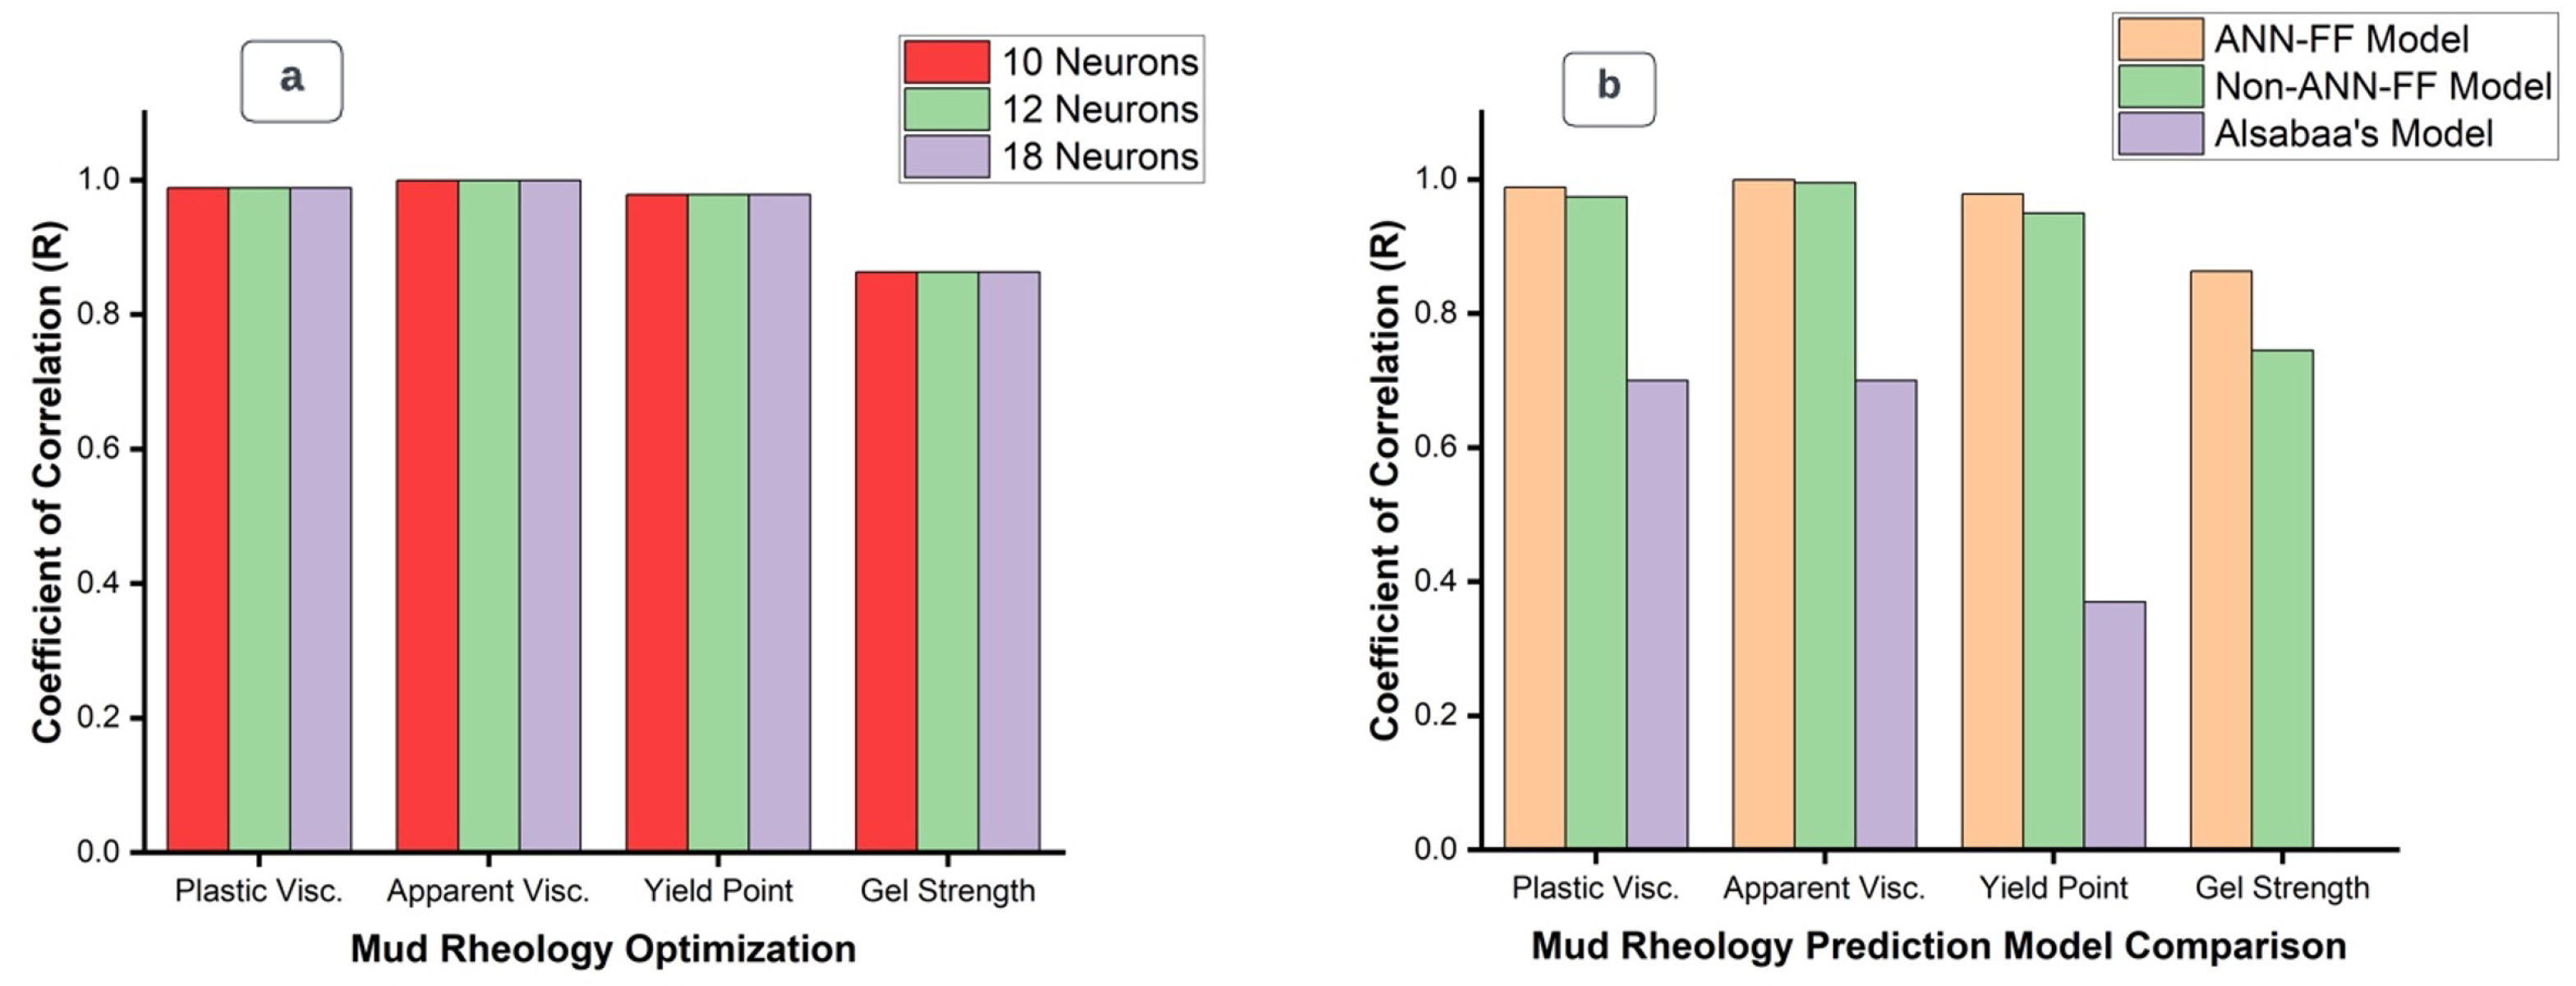
3.1. Rheology Prediction Optimization
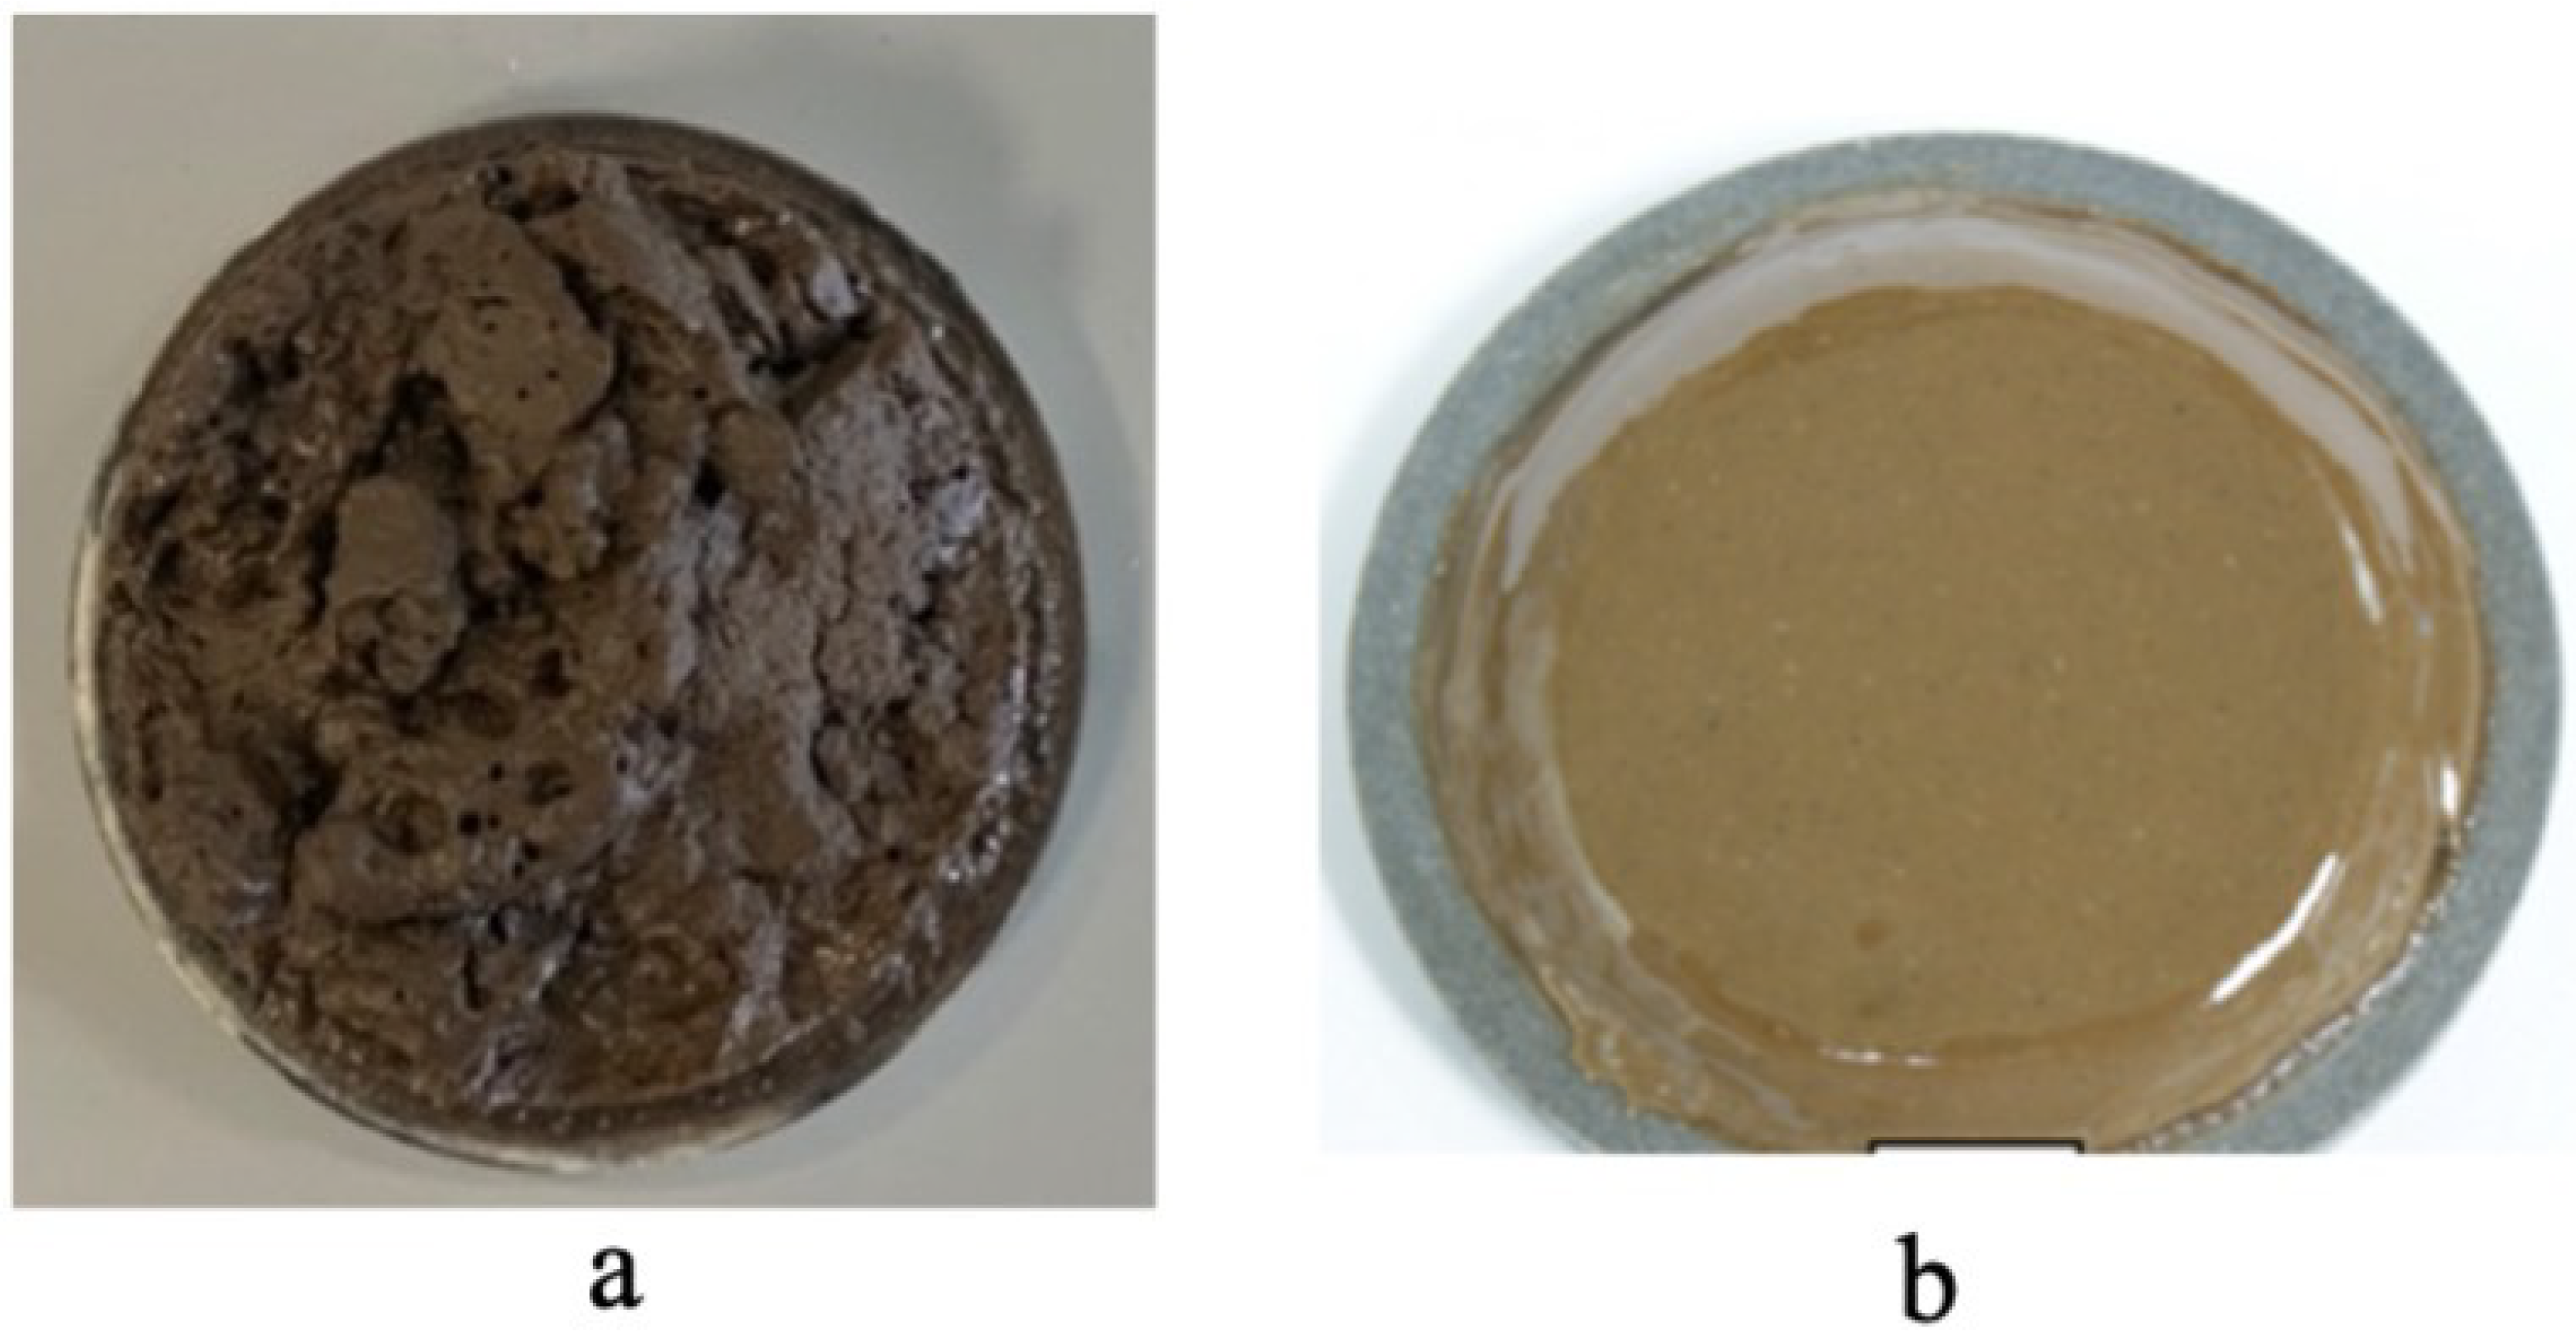
3.2. Cake Image Optimization
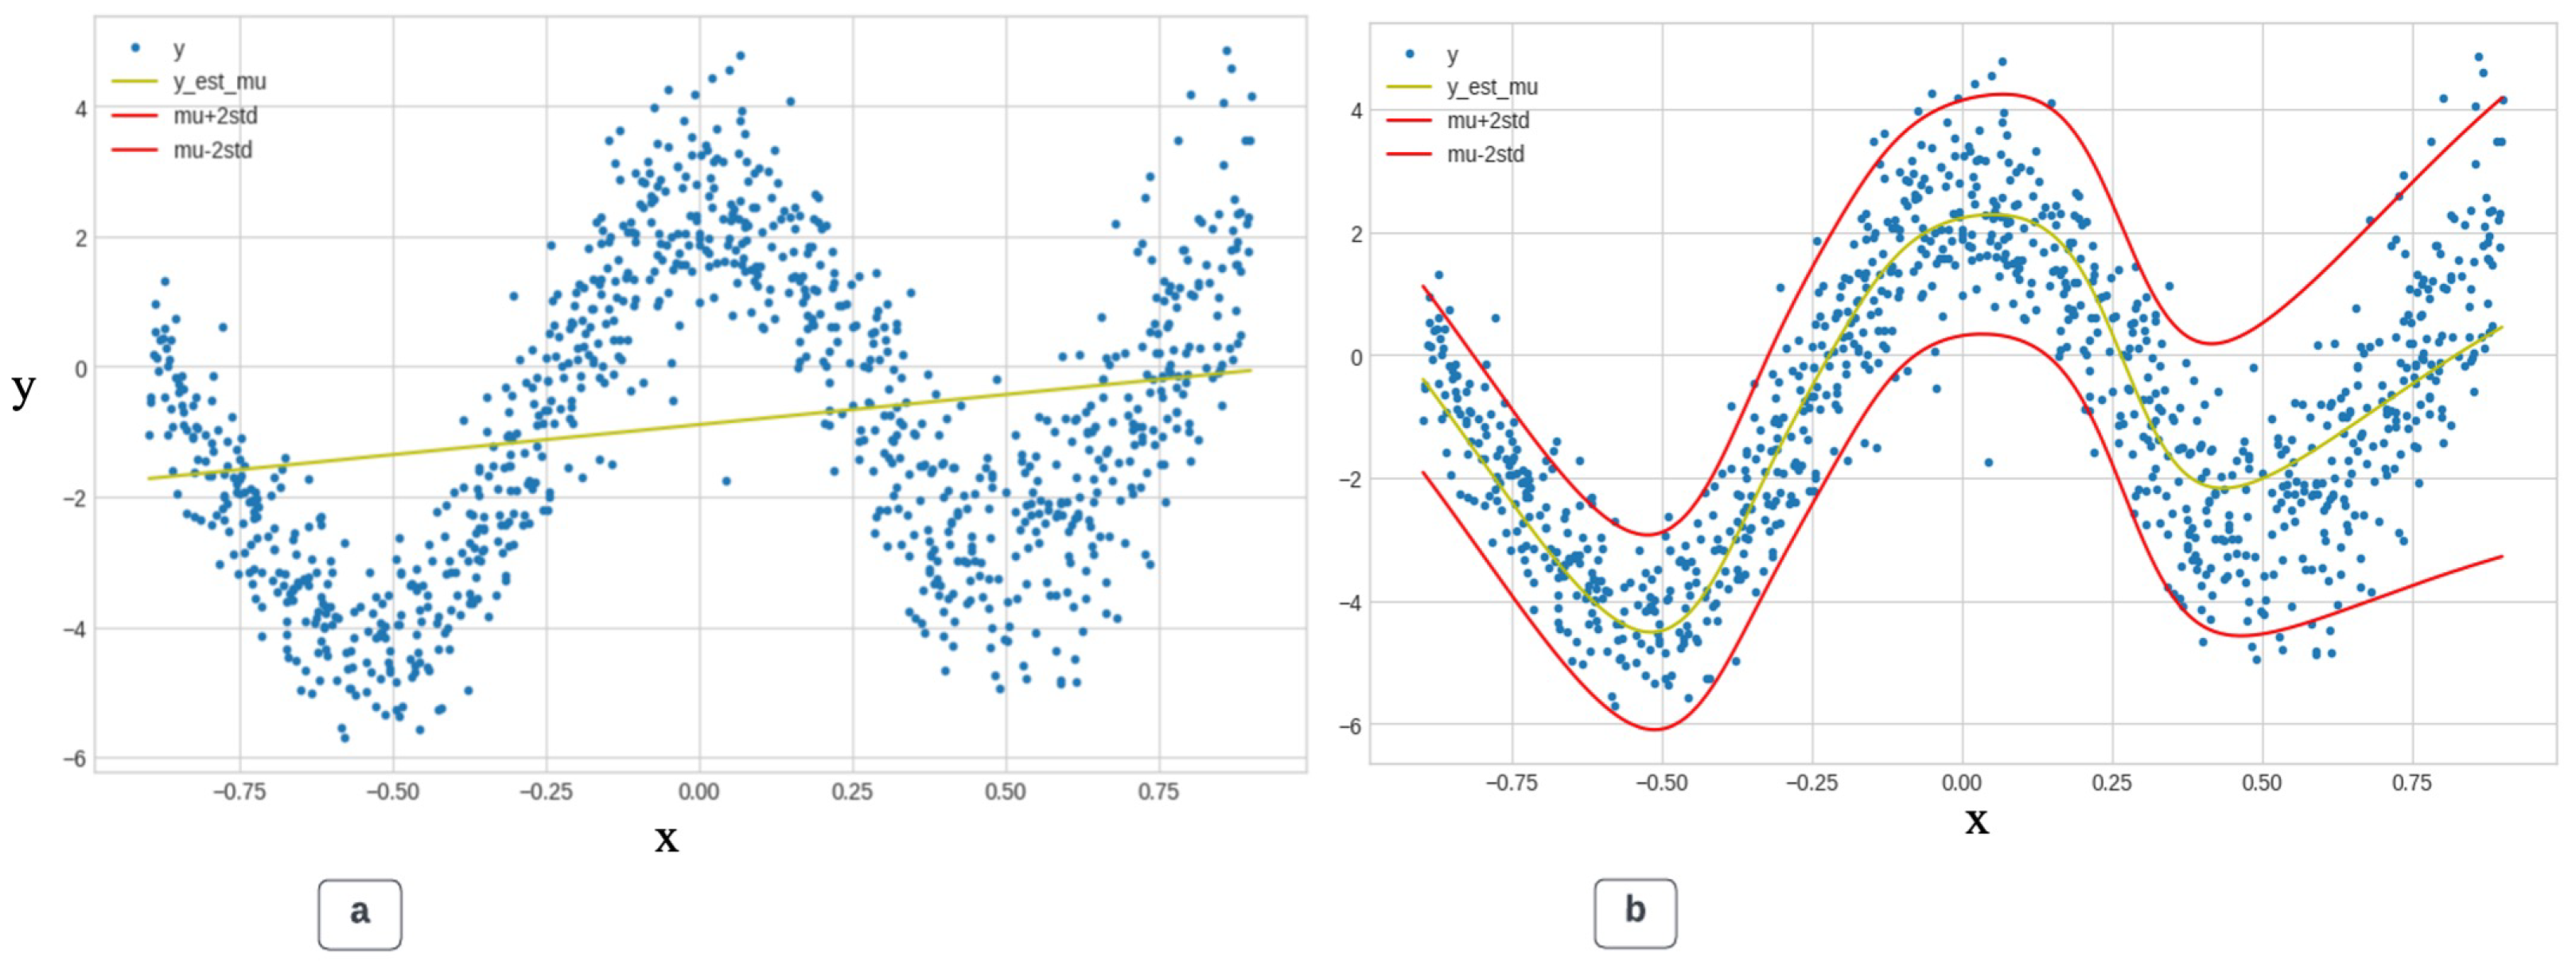
3.3. Flow Index Single-Objective Optimization
4. Conclusions
Author Contributions
Funding
Data Availability Statement
Acknowledgments
Conflicts of Interest
Nomenclature
| 2D | Two-dimensional |
| 3D | Three-dimensional |
| ANN | Artificial neural network |
| APIs | Application programming interfaces |
| API | American Petroleum Institute |
| AV | Apparent viscosity |
| CFD | Computation fluid dynamic |
| CC | Coefficient correlation |
| CV | Coefficient of variation interfaces |
| DNN | Deep neural network |
| DEM | Discrete element method |
| FI | Flow index |
| FF | Feed-forward function |
| GA | Genetic algorithm |
| GS | Gel strength |
| HSV | Hue saturation value |
| MSE | Mean square error |
| OBM | Oil-based mud |
| PV | Plastic viscosity |
| PSO | Particle swarm optimization |
| R | Coefficient correlation |
| ROI | Region of interest |
| RGB | Red, green, and blue |
| RPM | Revolution per minute |
| R300 | 300-rpm shear stress |
| R600 | 600-rpm shear stress |
| SBM | Synthetic-based mud |
| SOO | Single objective optimization |
| SQP | Sequential quadratic programming |
| STD | Standard deviation |
| YP | Yield point |
| Filter medium | |
| P | Pressure drop, Pa |
| Viscosity, cP | |
| A | Area, |
| Filtration volume, | |
| Filter cake resistance, m/kg | |
| Filtration constant | |
| t | Filtration time, s |
References
- Skenderija, J.; Koulidis, A.; Sanchez, D.L.; Shehab, A. Advanced Hole Cleaning in Horizontal Wells: Experimental Investigation Supported by a Downhole Clamp-On Tool. In Proceedings of the Middle East Oil, Gas and Geosciences Show, Manama, Bahrain, 4–6 February 2023. [Google Scholar] [CrossRef]
- AlAwad, M.N.J. A new approach for understanding the mechanism of wellbore strengthening theory. J. King Saud Uni. Eng. Sci. 2022, 34, 67–76. [Google Scholar] [CrossRef]
- Kizayev, T.; Irawan, S.; Khan, J.A.; Khan, S.M.; Cai, B.; Zeb, N.; Wayo, D.D.K. Factors affecting drilling incidents: Prediction of suck pipe by XGBoost model. Energy Rep. 2023, 9, 270–279. [Google Scholar] [CrossRef]
- Salehi, S.; Ghalambor, A.; Saleh, F.K.; Jabbari, H.; Hussmann, S. Study of filtrate and mud cake characterization in HPHT: Implications for formation damage control. In Proceedings of the SPE European Formation Damage Conference and Exhibition, Budapest, Hungary, 3–5 June 2015. [Google Scholar] [CrossRef]
- Elkatatny, S. One-Stage Calcium Carbonate Oil-Based Filter Cake Removal Using a New Biodegradable Acid System. Sustainability 2019, 11, 5715. [Google Scholar] [CrossRef]
- Feng, Y.; Li, X.; Gray, K.E. Mudcake effects on wellbore stress and fracture initiation pressure and implications for wellbore strengthening. Pet. Sci. 2018, 15, 319–334. [Google Scholar] [CrossRef]
- Amanullah, M.; Boyle, R. A Multifunctional Gel System to Mitigate Deepwater Drilling Challenges. In Proceedings of the International Oil & Gas Conference and Exhibition in China, Beijing, China, 8–10 December 2006. SPE-104080-MS. [Google Scholar] [CrossRef]
- Galkin, V.I.; Martyushev, D.A.; Ponomareva, I.N.; Chernykh, I.A. Developing features of the near-bottomhole zones in productive formations at fields with high gas saturation of formation oil. J. Min. Inst. 2021, 249, 386–392. [Google Scholar] [CrossRef]
- Aftab, A.; Ali, M.; Arif, M.; Chernykh, I.A. Influence of tailor-made TiO2/API bentonite nanocomposite on drilling mud performance: Towards enhanced drilling operations. App. Clay Sci. 2020, 199, 105862. [Google Scholar] [CrossRef]
- Liu, N.; Zhang, D.; Gao, H.; Hu, Y.; Duan, L. Real-time measurement of drilling fluid rheological properties: A review. Sensors 2021, 21, 3592. [Google Scholar] [CrossRef] [PubMed]
- Husin, H.; Elraies, K.A.; Choi, H.J.; Aman, Z. Influence of graphene nanoplatelet and silver nanoparticle on the rheological properties of water-based mud. App. Sci. 2018, 8, 1386. [Google Scholar] [CrossRef]
- Beg, M.; Kumar, P.; Choudhary, P.; Sharma, S. Effect of high temperature ageing on TiO2 nanoparticles enhanced drilling fluids: A rheological and filtration study. Upst. Oil Gas Tech. 2020, 5, 100019. [Google Scholar] [CrossRef]
- Murtaza, M.; Alarifi, S.A.; Kamal, M.S.; Onaizi, S.A.; Al-Ajmi, M.; Mahmoud, M. Experimental investigation of the rheological behavior of an oil-based drilling fluid with rheology modifier and oil wetter additives. Molecules 2021, 26.1, 4877. [Google Scholar] [CrossRef]
- Candler, J.E.; Rushing, J.H.; Leuterman, A.J.J. Synthetic-based mud systems offer environmental benefits over traditional mud systems. In Proceedings of the SPE/EPA Exploration and Production Environmental Conference, San Antonio, TX, USA, 7–10 March 1993. [Google Scholar] [CrossRef]
- Growcock, F.B.; Andrews, S.L.; Frederick, T.P. Physicochemical properties of synthetic drilling fluids. In Proceedings of the IADC/SPE Drilling Conference, Dallas, TX, USA, 15–18 February 1994. [Google Scholar] [CrossRef]
- Sayindla, S.; Lund, B.; Ytrehus, J.D.; Saasen, A. Hole-cleaning performance comparison of oil-based and water-based drilling fluids. J. Petro. Sci. Eng. 2017, 159, 49–57. [Google Scholar] [CrossRef]
- Ay, A.; Dogan, H.A.; Sonmez, A. Drilling Fluids Project Engineering Guidance and Most Common Fluids Related Challenges for Deepwater and HPHT Offshore Wells. In Proceedings of the Offshore Technology Conference, Virtual and Houston, TX, USA, 16–19 August 2021. [Google Scholar] [CrossRef]
- Fink, J. Water-Based Chemicals and Technology for Drilling, Completion, and Workover Fluids, 1st ed.; Gulf Prof. Pub.: Houston, TX, USA, 2015. [Google Scholar] [CrossRef]
- Caenn, R.; Chillingar, G.V. Drilling fluids: State of the Art. J. Petro. Sci. Eng. 1996, 14, 221–230. [Google Scholar] [CrossRef]
- Fadairo, A.; Ling, K.; Rasouli, V.; Adelakun, A.; Tomomewo, O. An improved hydraulics model for aerated fluid underbalanced drilling in vertical wells. Upst. Oil Gas Tech. 2020, 5, 100009. [Google Scholar] [CrossRef]
- Skenderija, J.; Koulidis, A.; Kelessidis, V.; Shehab, A. Application of a Drilling Simulator for Real-Time Drilling Hydraulics Training and Research. In Proceedings of the SPE Middle East Oil & Gas Show and Conference, Event Canceled, Sanabis, Bahrain, 28 November–1 December 2021. [Google Scholar] [CrossRef]
- Martyushev, D.A.; Govindarajan, S.K. Development and study of a visco-elastic gel with controlled destruction times for killing oil wells. J. King Saud Uni. Eng. Sci. 2022, 34, 408–415. [Google Scholar] [CrossRef]
- Alsabaa, A.; Gamal, H.; Elkatatny, S.; Abdelraouf, Y. Machine Learning Model for Monitoring Rheological Properties of Synthetic Oil-Based Mud. ACS Omega 2022, 7, 15603–15614. [Google Scholar] [CrossRef] [PubMed]
- Sedaghat, A.; Omar, M.A.A.; Damrah, S.; Gaith, M. Mathematical modelling of the Marsh Funnel for measuring rheological properties of drilling nanofluids for energy-efficient environment. In Proceedings of the International Conference on Ecological Vehicles and Renewable Energies (EVER), Monte Carlo, Monaco, 6–8 April 2016; Available online: https://ieeexplore.ieee.org/abstract/document/7476401/authors (accessed on 17 September 2023).
- Kumar, V.; Guria, C. An improved shear rate estimation using rotating coaxial cylinder Fann viscometer. J. Pet. Sci. Eng. 2013, 110, 162–168. [Google Scholar] [CrossRef]
- Oort, E.V.; Lee, J.; Friedheim, J.; Toups, B. New flat-rheology synthetic-based mud for improved deepwater drilling. In Proceedings of the SPE Annual Technical Conference and Exhibition, Houston, TX, USA, 26–29 September 2004. [Google Scholar] [CrossRef]
- Lyros, E.; Kostelecky, J.; Plicka, V.; Vratislav, F.; Sokos, E.; Nikolakopoulos, K. Detection of tectonic and crustal deformation using GNSS data processing: The case of ppgnet. Civ. Eng. J. 2021, 7, 14–23. [Google Scholar] [CrossRef]
- Goliatt, L.; Mohammad, R.S.; Abba, S.I.; Yaseen, Z.M. Development of hybrid computational data-intelligence model for flowing bottom-hole pressure of oil wells: New strategy for oil reservoir management and monitoring. Fuel 2023, 350, 128623. [Google Scholar] [CrossRef]
- Silva, R.O.; Saporetti, C.M.; Abba, S.I.; Yaseen, Z.M.; Pereira, E.; Goliatt, L. An approach for total organic carbon prediction using convolutional neural networks optimized by differential evolution. Neural Comp. App. 2023, 35, 20803–20817. [Google Scholar] [CrossRef]
- Balhoff, M.T.; Lake, L.W.; Bommer, P.M.; Lewis, R.E.; Weber, M.J.; Calderin, J.M. Rheological and yield stress measurements of non-Newtonian fluids using a Marsh Funnel. J. Pet. Sci. Eng. 2011, 77, 393–402. [Google Scholar] [CrossRef]
- Sedaghat, A. A novel and robust model for determining rheological properties of Newtonian and non-Newtonian fluids in a marsh funnel. J. Pet. Sci. Eng. 2017, 156, 896–916. [Google Scholar] [CrossRef]
- Qamar, A.; Kerdi, S.; Amin, N.; Zhang, X.; Vrouwenvelder, J.; Ghaffour, N. A deep neural networks framework for in-situ biofilm thickness detection and hydrodynamics tracing for filtration systems. Sep. Purif. Technol. 2022, 301, 121959. [Google Scholar] [CrossRef]
- Elkatatny, S. Real-time prediction of rheological parameters of KCL water-based drilling fluid using artificial neural networks. Arab. J. Sci. Eng. 2017, 42, 1655–1665. [Google Scholar] [CrossRef]
- Elkatatny, S. Real-time prediction of the rheological properties of water-based drill-in fluid using artificial neural networks. Sustainability 2019, 11, 5008. [Google Scholar] [CrossRef]
- Elkatatny, S. New approach to optimize the rate of penetration using artificial neural network. Arab. J. Sci. Eng. 2018, 43, 6297–6304. [Google Scholar] [CrossRef]
- Souza, D.P.; Martinho, A.D.; Rocha, C.C.; Christo, E.D.S.; Goliatt, L. Hybrid particle swarm optimization and group method of data handling for short-term prediction of natural daily streamflows. Model. Earth Syst. Environ. 2022, 8, 5743–5759. [Google Scholar] [CrossRef]
- Kabir, A.; Gamwo, I.K. Filter cake formation on the vertical well at high temperature and high pressure: Computational fluid dynamics modeling and simulations. J. Pet. Gas Eng. 2011, 2, 146–164. Available online: https://api.semanticscholar.org/CorpusID:110719727 (accessed on 2 November 2023).
- Falahati, N.; Chellappah, K.; Routh, A.F. Assessing filter cake strength via discrete element method simulations. Chem. Eng. Res. Design 2021, 173, 215–223. [Google Scholar] [CrossRef]
- Elmgerbi, A.; Thonhauser, G.; Fine, A.; Hincapie, R.E.; Borovina, A. Experimental approach for assessing filter-cake removability derived from reservoir drill-in fluids. J. Pet. Explor. Prod. Technol. 2021, 11, 4029–4045. [Google Scholar] [CrossRef]
- Aditama, P.; Mirza, M.; Iswachyono, T.; Anwar, Z.; Al Saadi, H.; Al Kalbani, M.; Qassabi, A.; Al Raqmi, M. Laboratory Testing Approach to Evaluate Drill-In-Fluid Damage and Wellbore Cleanup Effectivity in Open Hole Horizontal Producer Wells. In Proceedings of the SPE Asia Pacific Oil and Gas Conference and Exhibition, Jakarta, Indonesia, 22–24 October 2013. Abstract Number (SPE-166672-MS). [Google Scholar] [CrossRef]
- Yang, M.; Li, M.; Wu, Q.; Growcock, F.B.; Chen, Y. Experimental study of the impact of filter cakes on the evaluation of LCMs for improved lost circulation preventive treatments. J. Pet. Sci. Eng. 2020, 191, 107152. [Google Scholar] [CrossRef]
- Adebayo, A.R.; Bageri, B.S. A simple NMR methodology for evaluating filter cake properties and drilling fluid-induced formation damage. J. Pet. Explor. Prod. Technol. 2020, 10, 1643–1655. [Google Scholar] [CrossRef]
- Israil, M.; Ashraf, M.; Fahim, M.; Rehan, R.; Khan, S.W.; Hussain, S. Evaluation of bentonite mixed indigenous clays for development of clay liners. Civil Eng. J. 2020, 6, 24–32. [Google Scholar] [CrossRef]
- Wayo, D.D.K.; Irawan, S.; Satyanaga, A.; Kim, J. Data-Driven Fracture Morphology Prognosis from High Pressured Modified Proppants Based on Stochastic-Adam-RMSprop Optimizers; tf. NNR Study. Big Data Cogn. Comp. 2023, 7, 57. [Google Scholar] [CrossRef]
- Dias, R.C.C.; Santos, L.S. Analysis of single and multi-objective optimization of the pultrusion process. Mat. Today Com. 2023, 35, 105677. [Google Scholar] [CrossRef]
- Liu, J.; Benyahia, B. Single and Multi-Objective Superstructure Optimization of an Integrated Continuous Multistage Reaction-Crystallization-Filtration Process with Recycles. Comp. Aided Chem. Eng. 2023, 52, 667–672. [Google Scholar] [CrossRef]
- Wu, S.; Zhu, W.; Chen, Y.; Liu, J.; Shu, S. Pore characteristics of cake and its effect on cake filtration. Sep. Sci. Tech. 2021, 56, 789–799. [Google Scholar] [CrossRef]
- Kato, K.; Yamamoto, K.; Ogawa, N. Proposal for new image processing application for taste evaluation of sponge cake using 3D range sensor. Sep. Sci. Tech. 2008, 56, 63–67. [Google Scholar] [CrossRef]
- Rabbani, A.; Ayatollahi, S.; Kharrat, R.; Dashti, N. Estimation of 3-D pore network coordination number of rocks from watershed segmentation of a single 2-D image. Adv. Water Res. 2016, 94, 264–277. [Google Scholar] [CrossRef]
- Jahari, A.F.; Shafian, S.R.M.; Husin, H.; Razali, N.; Irawan, S. Quantification method of suspended solids in micromodel using image analysis. J. Pet. Exp. Prod. Tech. 2021, 11, 2271–2286. [Google Scholar] [CrossRef]
- Habib, S.; Khan, I.; Aladhadh, S.; Islam, M.; Khan, S. External Features-Based Approach to Date Grading and Analysis with Image Processing. Emerg. Sci. J. 2022, 6, 694–704. [Google Scholar] [CrossRef]
- Hernandez, M.; Quissak, F.; Córdova, M.; Torres, J. Synthetic Base Drilling Fluid Applications Under Extreme Pressure and Temperature Conditions in Gulf of Mexico. In Proceedings of the SPE Latin American and Caribbean Petroleum Engineering Conference, Virtual, 27–31 July 2020. [Google Scholar] [CrossRef]
- Young, S.; Friedheim, J.; Lee, J.; Prebensen, O.I. A new generation of flat rheology invert drilling fluids. In Proceedings of the SPE Oil and Gas India Conference and Exhibition, Mumbai, India, 28–30 March 2012. Abstract Number (SPE-154682-MS). [Google Scholar] [CrossRef]
- Herzhaft, B.; Peysson, Y.; Isambourg, P.; Delepoulle, A.; Toure, A. Rheological properties of drilling muds in deep offshore conditions. In Proceedings of the SPE/IADC Drilling Conference, Amsterdam, The Netherlands, 27 February–1 March 2001. Abstract Number (SPE-67736-MS). [Google Scholar]
- Primary Evaluation of Filter Cake Breaker in Biodegradable Synthetic-Based Drill-In-Fluid. Available online: https://nur.nu.edu.kz/handle/123456789/6132 (accessed on 23 January 2024).
- Wang, Y.; Salehi, S. Application of real-time field data to optimize drilling hydraulics using neural network approach. J. Energy Res. Tech. 2015, 137, 062903. [Google Scholar] [CrossRef]
- Pitt, M.J. The Marsh funnel and drilling fluid viscosity: A new equation for field use. SPE Dril. Comp. 2000, 15, 3–6. [Google Scholar] [CrossRef]
- Lippmann, R. An introduction to computing with neural nets. IEEE ASSP Mag. 1987, 4, 4–22. [Google Scholar] [CrossRef]
- Elmgerbi, A.; Chuykov, E.; Thonhauser, G.; Andreas, N. Machine Learning Techniques Application for Real-Time Drilling Hydraulic Optimization. In Proceedings of the International Petroleum Technology Conference, Riyadh, Saudi Arabia, 21–23 February 2022. [Google Scholar] [CrossRef]
- Agwu, O.E.; Akpabio, J.U.; Alabi, S.B.; Dosunmu, A. Artificial intelligence techniques and their applications in drilling fluid engineering: A review. J. Pet. Sci. Eng. 2018, 167, 300–315. [Google Scholar] [CrossRef]
- Okrajni, S.S.; Azar, J.J. The effects of mud rheology on annular hole cleaning in directional wells. SPE Drill. Eng. 1986, 1, 297–308. [Google Scholar] [CrossRef]
- Coussot, P.; Bertrand, F.; Herzhaft, B. Rheological behavior of drilling muds, characterization using MRI visualization. Oil Gas Sci. Tech. 2006, 59, 23–29. [Google Scholar] [CrossRef]
- Maglione, R.; Robotti, G.; Romagnoli, R. In-situ rheological characterization of drilling mud. SPE J. 2000, 5, 377–386. [Google Scholar] [CrossRef]
- Guria, C.; Kumar, R.; Mishra, P. Rheological analysis of drilling fluid using Marsh Funnel. J. Pet. Sci. Eng. 2013, 105, 62–69. [Google Scholar] [CrossRef]
- Al-Ibrahim, H.; AlMubarak, T.; Almubarak, M.; Osode, P.; Bataweel, M.; Al-Yami, A. Chelating agent for uniform filter cake removal in horizontal and multilateral wells: Laboratory analysis and formation damage diagnosis. In Proceedings of the SPE Saudi Arabia Section Annual Technical Symposium and Exhibition, Al-Khobar, Saudi Arabia, 21–24 April 2015. [Google Scholar] [CrossRef]
- Parmiggiani, F.; Moctezuma-Flores, M.; Wadhams, P.; Aulicino, G. Image processing for pancake ice detection and size distribution computation. Int. J. Remote Sens. 2019, 40, 3368–3383. [Google Scholar] [CrossRef]
- Yang, W. Finite element model of concrete material based on CT image processing technology. J. Vis. Com. Image Rep. 2019, 64, 102631. [Google Scholar] [CrossRef]
- Yu, F.; Sun, D.; Hu, M.; Wang, J. Study on the pores characteristics and permeability simulation of pervious concrete based on 2D/3D CT images. Const. Build. Mat. 2019, 200, 687–702. [Google Scholar] [CrossRef]
- Xu, S.; Chang, C.; Liu, Y. A novel image compression technology based on vector quantisation and linear regression prediction. Connect. Sci. 2021, 33, 219–236. [Google Scholar] [CrossRef]
- Yang, D.; Du, Y.; Yao, H.; Bao, L. Image semantic segmentation with hierarchical feature fusion based on deep neural network. Connect. Sci. 2022, 34, 1772–1784. [Google Scholar] [CrossRef]
- Russell, B.C.; Torralba, A.; Murphy, K.P.; Freeman, W.T. LabelMe: A database and web-based tool for image annotation. Int. J. Comput. Vis. 2008, 77, 157–173. [Google Scholar] [CrossRef]
- Xu, M.; Zhu, J.; Lv, P.; Zhou, B.; Tappen, M.F.; Ji, R. Learning-based shadow recognition and removal from monochromatic natural images. IEEE Trans. Image Process. 2017, 26, 5811–5824. [Google Scholar] [CrossRef] [PubMed]
- Xu, M.; Li, M.; Xu, W.; Deng, Z.; Yang, Y.; Zhou, K. Interactive mechanism modeling from multi-view images. ACM Trans. Graph. 2016, 35, 236. [Google Scholar] [CrossRef]
- Shen, X.; Maa, J.P. A camera and image processing system for floc size distributions of suspended particles. Mar. Geo. 2016, 376, 132–146. [Google Scholar] [CrossRef]
- Wayo, D.D.K.; Irawan, S.; Khan, J.A.; Fitrianti. Validation for Assessing the Repercussions of Filter Cake Breakers; EDTA and SiO2 on Filter Cake Return Permeability. App. Art. Intel. 2022, 36, 2112551. [Google Scholar] [CrossRef]
- Oxford Mathematical Institute. Available online: https://www.maths.ox.ac.uk/study-here/postgraduate-study/industrially-focused-mathematical-modelling-epsrc-cdt/infomm-resear-13/infomm-cohort-five/wey-mathematical-models-particle-filtration (accessed on 17 March 2024).
- Puderbach, V.; Schmidt, K.; Antonyuk, S. A coupled CFD-DEM model for resolved simulation of filter cake formation during solid-liquid separation. Processes 2021, 9, 826. [Google Scholar] [CrossRef]
- Ripperger, S.; Gösele, W.; Alt, C.; Loewe, T. Filtration, 1. Fundamentals. Ullmann’s 2013, 14, 678–709. [Google Scholar]
- Junk, M.; Yong, W. Rigorous Navier-Stokes limit of the lattice Boltzmann equation. Asymptot. Anal. 2003, 35, 165–185. Available online: https://content.iospress.com/articles/asymptotic-analysis/asy563 (accessed on 2 November 2023).
- Stieß, M. Mechanical Process Engineering—Particle Technology 1, 3rd ed.; Springer: Berlin/Heidelberg, Germany, 2008; pp. XI, 499. [Google Scholar] [CrossRef]
- Chu, C.P.; Lee, D.J.; Liu, Z.; Jin, W.H. Morphology of sludge cake at electroosmosis dewatering. Sep. Sci. Tech. 2005, 39, 1331–1346. [Google Scholar] [CrossRef]
- Chase, G.G.; Willis, M.S. Flow resistance in filter cakes due to air. Sep. Sci. Tech. 1991, 26, 117–126. [Google Scholar] [CrossRef]


| Density | R600 | R300 | PV | AV | YP | GS | FI | |
|---|---|---|---|---|---|---|---|---|
| Mean | 119.00 | 239.09 | 143.25 | 93.96 | 117.83 | 134.88 | 3.50 | 0.75 |
| Std | 0.83 | 24.74 | 24.94 | 2.02 | 11.89 | 1.41 | 0.50 | 0.10 |
| Min | 118.00 | 195.00 | 101.00 | 91.00 | 97.00 | 133.00 | 3.00 | 0.59 |
| Median | 119.00 | 240.00 | 143.00 | 94.00 | 118.00 | 135.00 | 3.00 | 0.75 |
| Max | 121.00 | 280.00 | 185.00 | 97.00 | 140.00 | 137.00 | 4.00 | 0.95 |
| Property | Variable | Function | No. of Neurons | R | No. of Neurons | R | No. of Neurons | R |
|---|---|---|---|---|---|---|---|---|
| Plastic Viscosity | PV | FF | 10 | 0.98819 | 12 | 0.98817 | 18 | 0.98814 |
| Apparent Viscosity | AV | FF | 10 | 0.99956 | 12 | 0.99953 | 18 | 0.99958 |
| Yield Point | YP | FF | 10 | 0.97813 | 12 | 0.97803 | 18 | 0.97811 |
| Gel Strength (10 mins) | GS | FF | 10 | 0.86326 | 12 | 0.86326 | 18 | 0.86326 |
| ANN-FF Model | Non-ANN-FF Model | ||
|---|---|---|---|
| Property | Variable | Average R | Adj. R2 |
| Plastic Viscosity | PV | 0.98816 | 0.97359 |
| Apparent Viscosity | AV | 0.99956 | 0.99503 |
| Yield Point | YP | 0.97809 | 0.94969 |
| Gel Strength (10mins) | GS | 0.86326 | 0.74471 |
| Model Architecture | Model Optimization |
|---|---|
| Artificial Neural Network (ANN-FF) | 0.99956 cc |
| Non-Artificial Neural Network (Non-ANN-FF) | 0.99503 cc |
| Image Processing (Synthetic-Based Muds) | 1790 M µm2 |
| Single-Objective () | 0.6940, 5.0536 × |
| Deep Neural Network (DNN)–Final Loss | 4.8 |
Disclaimer/Publisher’s Note: The statements, opinions and data contained in all publications are solely those of the individual author(s) and contributor(s) and not of MDPI and/or the editor(s). MDPI and/or the editor(s) disclaim responsibility for any injury to people or property resulting from any ideas, methods, instructions or products referred to in the content. |
© 2024 by the authors. Licensee MDPI, Basel, Switzerland. This article is an open access article distributed under the terms and conditions of the Creative Commons Attribution (CC BY) license (https://creativecommons.org/licenses/by/4.0/).
Share and Cite
Wayo, D.D.K.; Irawan, S.; Satyanaga, A.; Kim, J.; Bin Mohamad Noor, M.Z.; Rasouli, V. Filter Cake Neural-Objective Data Modeling and Image Optimization. Symmetry 2024, 16, 1072. https://doi.org/10.3390/sym16081072
Wayo DDK, Irawan S, Satyanaga A, Kim J, Bin Mohamad Noor MZ, Rasouli V. Filter Cake Neural-Objective Data Modeling and Image Optimization. Symmetry. 2024; 16(8):1072. https://doi.org/10.3390/sym16081072
Chicago/Turabian StyleWayo, Dennis Delali Kwesi, Sonny Irawan, Alfrendo Satyanaga, Jong Kim, Mohd Zulkifli Bin Mohamad Noor, and Vamegh Rasouli. 2024. "Filter Cake Neural-Objective Data Modeling and Image Optimization" Symmetry 16, no. 8: 1072. https://doi.org/10.3390/sym16081072