Article

Solvatochromic Analysis of Triton X-100 in Binary Mixtures

by
Ecaterina Ambrosi
1,
Alexandru Zara
1,2,
Dana Ortansa Dorohoi
1 and
Dan-Gheorghe Dimitriu
1,*
1
Faculty of Physics, Alexandru Ioan Cuza University, 11 Carol I. Blvd., 700506 Iasi, Romania
2
Department of Radiotherapy, Regional Institute of Oncology, 2-4 General Henri Mathias Berthelot Str., 700483 Iasi, Romania
*
Author to whom correspondence should be addressed.
Symmetry 2025, 17(2), 199; https://doi.org/10.3390/sym17020199
Submission received: 1 January 2025 / Revised: 22 January 2025 / Accepted: 25 January 2025 / Published: 27 January 2025
(This article belongs to the Special Issue Chemistry: Symmetry/Asymmetry—Feature Papers and Reviews)

Abstract

:
Binary solvent mixtures of the non-ionic surfactant Triton X-100 with water, methanol, ethanol, and 1-propanol, respectively, were investigated by solvatochromic studies. The absorption spectral bands of methyl red dye, used as a solvatochromic probe, were recorded in ternary solutions prepared with different mole ratios between Triton X-100 and water/alcohols. The Kamlet–Abboud–Taft model was applied to estimate the contribution of each type of intermolecular interaction to the total shift of the electronic absorption band of the solute. The composition of the solute molecule’s first solvation shell was comparatively estimated by using three models: the statistical cell model of ternary solutions, the Suppan model, and the Bosch–Rosés model. The statistical cell model allows the estimation of the difference between the interaction energies in the solute–solvent pairs of molecules. The Bosch–Rosés model provided important information on the 1:1 complex formed between Triton X-100 and water/alcohol molecules, as well as on the symmetry/asymmetry related to the binary mixtures in the cybotactic region of the solute’s molecule.

1. Introduction

Binary mixtures of a surfactant with an alcohol are often involved in the preparation of microemulsions [1], as well as in applications.
Polyethylene glycol p-(1,1,3,3-tetramethylbutyl)-phenyl ether (Triton X-100) (molecular structure in Figure 1) is a non-ionic surfactant with a rigid hydrophobic molecular segment and a flexible polar head, derived from polyoxyethylene and containing an alkylphenyl group. It is a fluorescent compound, emitting, in the UV region, 280–340 nm [2]. Also, Triton X-100 in aqueous solutions rotates the polarization plane of light [3]. Mixed with some other solvents, Triton X-100 forms spherical or oblate ellipsoidal micelles composed of ten to a few hundred molecules, organized with the hydrophobic tails in the core and the hydrophilic heads towards the outer shell, in contact with the other solvent [4]. The cloud point of Triton X-100 is 64 °C.
Triton X-100 is one of the most-used non-ionic surfactants for lysing cells. Therefore, it is widely used in biomedical applications, for example, nuclear protein isolation [5,6], the decellularization of human kidneys for the preparation of renal scaffolds [7], assisting the delivery of small interfering RNA (siRNA) to cancer cells for tumor growth inhibition [8], the solubilization of poorly soluble drugs [9], assisting antidiabetic drug delivery [10], the inhibition of insulin fibrillization [11], the development of a bacterial ghost cell vaccine [12], West Nile and Ebola virus inactivation [13], assisting genetic disorder diagnosis [14], enhancing the production of bacteria with potential antitumoral effects [15], and the decellularization of corneas to reduce immune response after transplantation [16] or of scaffolds with a role in tissue engineering [17,18]. Moreover, Triton X-100 improves the antimicrobial activity of some nanoparticles [19,20,21,22].
In chemistry and chemical engineering, Triton X-100 is used in gas chromatographic analysis [23], assisted atomic absorption analysis for increasing sensitivity [24], assisted copolymerization–carbonization [25], and catalysis [26]. In biotechnology, Triton X-100 is widely used for increasing the activity of some enzymes [27,28,29,30]. Also, Triton X-100 was found to be very useful in environmental protection as a collector of unburned carbon particles from fly ash [31], as an enhancer of poly(vinyl alcohol) (PVA) nanofiber production for the filtration of nanoparticles from the air [32], as a soil washing agent [33,34] and contaminated groundwater remediator [34], as a coal dust suppressor [35], as a wastewater treatment [36,37,38,39,40,41], in the bioremediation of contaminated marine sites [42], and in the regeneration of transformer insulation oil [43].
In optoelectronics, Triton X-100 was involved in the improvement in the efficiency of solar cells [44,45,46] and phosphorescent organic light emitting diodes (PhOLED) used in OLED displays [47], while in electronics, it was used for enhancing supercapacitor performance [48,49,50]. Triton X-100 is also often involved in assisting nanoparticle synthesis [51,52,53,54] and the development of sensors [55,56,57,58,59]. Other applications of Triton X-100 include enhancing the tribological properties of some materials [60], inhibiting the corrosion of steel and coatings on steel surfaces [61,62], enhancing the sensitivity of dosimeters [63], analyzing the heavy metals present in cosmetics [64], and as a reference liquid for hydrometer calibration [65].
The interactions in binary solvent mixtures are complex since the solute is preferentially surrounded by the component solvents but also the complex formed by the two solvents. To understand the role of solvation in the chemical processes, it is important to know what type of specific and/or nonspecific interactions take place in such systems and to estimate the strength of these interactions. In this regard, solvatochromism is a rather simple and efficient method to investigate the intermolecular interactions in solutions [66], giving very good results in the case of ternary solutions (binary solvents mixture) [67,68,69,70,71,72,73]. The dependence of the solute’s absorption spectral band position and shape on the nature of the solvent stays at the basis of this method. The shift of the solute’s absorption band strongly depends on the nature and strength of the interactions between the molecules of solute and solvent, respectively. Since the strength of the intermolecular interactions strongly decreases with the distance between the molecules, only the interactions between the solute’s molecule and the molecules of the solvent from its cybotactic region (first solvation shell) significantly contribute to the shift of the spectral bands. Thus, several theoretical models were developed for the estimation of the composition of the solute molecule’s cybotactic region in the case of binary solvent mixtures. Among these, the most used ones are the statistical cell model of ternary solutions [74], the Suppan model [75], and the Bosch–Rosés model [76,77,78,79], with the mention that this last one can be generalized for any number of solvents.
The first solvatochromic studies of Triton X-100’s binary mixtures with different solvents were reported by Kohantorabi et al. [80,81], who experimentally estimated the values of Kamlet–Abboud–Taft [82] solvatochromic parameters π*, β, and α for several mixtures. These values were used in the present article for analyzing the spectral data.
Here, we report on the solvatochromic investigation of ternary solutions in which the binary solvent was obtained by mixing Triton X-100 with water, methanol, ethanol, and 1-propanol, respectively. Methyl red dye (schematic of the molecule shown in Figure 2) was used as a solvatochromic probe, its absorption spectral bands being recorded in solutions prepared with different mole ratios between Triton X-100 and water/alcohols. The Kamlet–Abboud–Taft model [82] was employed to estimate the contribution of each type of intermolecular interaction to the total spectral shift of the electronic absorption band of the solute. The composition of the cybotactic region of the solute’s molecule was comparatively estimated by using the three above-mentioned models. The statistical cell model of ternary solutions allowed the calculation of the difference between the interaction energies of two molecules in pairs of the type of solute–solvent. The Bosch–Rosés model provided important information on the 1:1 complex formed between Triton X-100 and the other solvent molecules. It also allowed the estimation of the composition of the cybotactic region of the solute’s molecules, emphasizing the symmetry/asymmetry related to the binary mixture of solvents in this region.

2. Materials and Methods
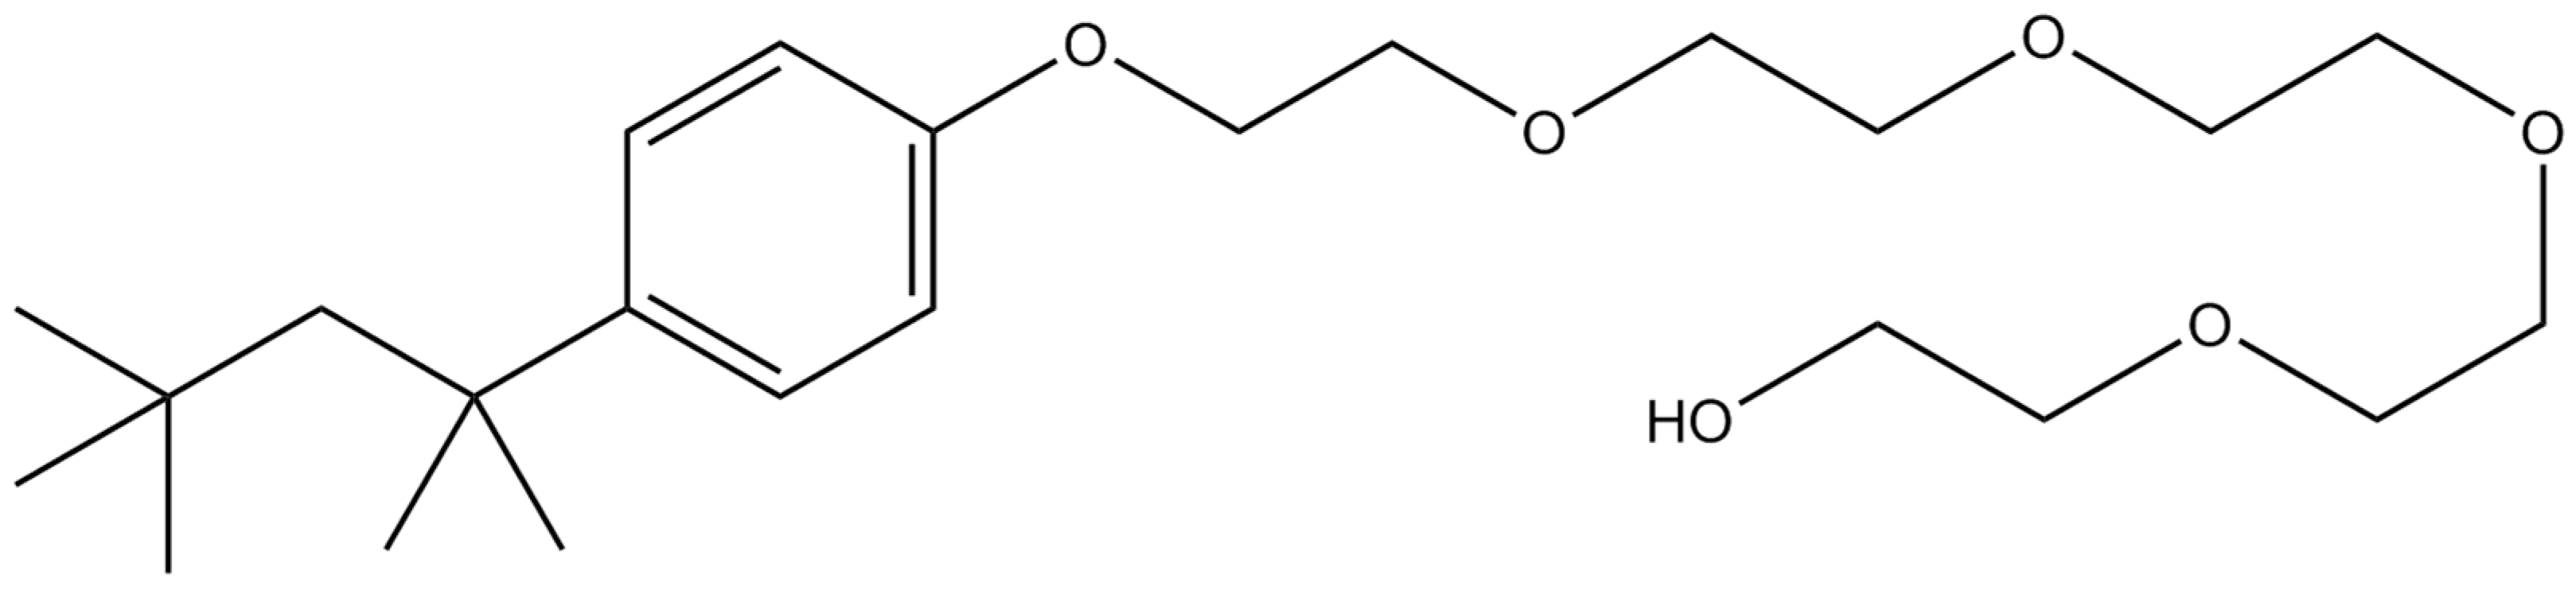
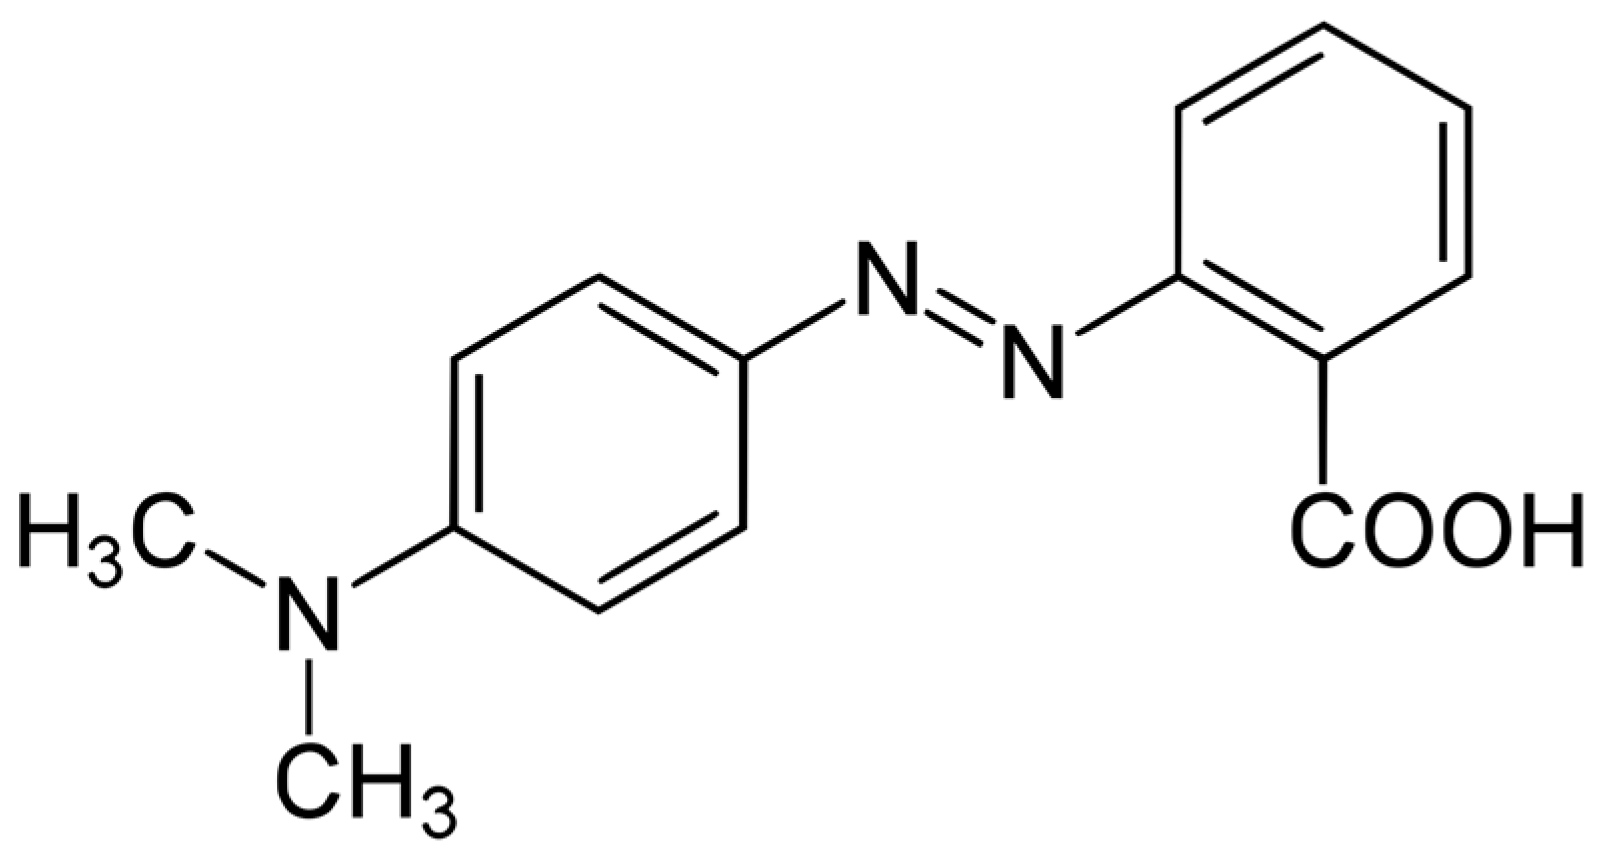
2.1. Materials

All chemical compounds were bought from Sigma Aldrich (now Merck), St. Louis, MO, USA. The double distilled water was prepared in our laboratory. The purity of the used chemical compounds is as follows: Triton X-100—for analysis; methanol—ACS reagent, ≥99.8%; ethanol—puriss. p.a. absolute, ≥99.8%; 1-propanol—ACS reagent, ≥99.5%; methyl red—pH indicator, ACS reagent Ph. Eur. The ternary solutions of methyl red were prepared with a concentration of 10−4 mol/L. The methyl red powder was weighed with a Mettler balance XSR105 (Mettler Toledo, Columbus, OH, USA). The binary solvents were prepared by measuring the volumes of the liquid solvents with micropipettes.

2.2. Spectral Measurements

The spectra were recorded at room temperature with a QE65000 Ocean Optics spectrometer (Ocean Insight, Orlando, FL, USA) with a resolution of 0.76 nm. The illumination of the samples was performed through an optical fiber with a deuterium–tungsten–halogen source with a spectral range of 200–1100 nm.

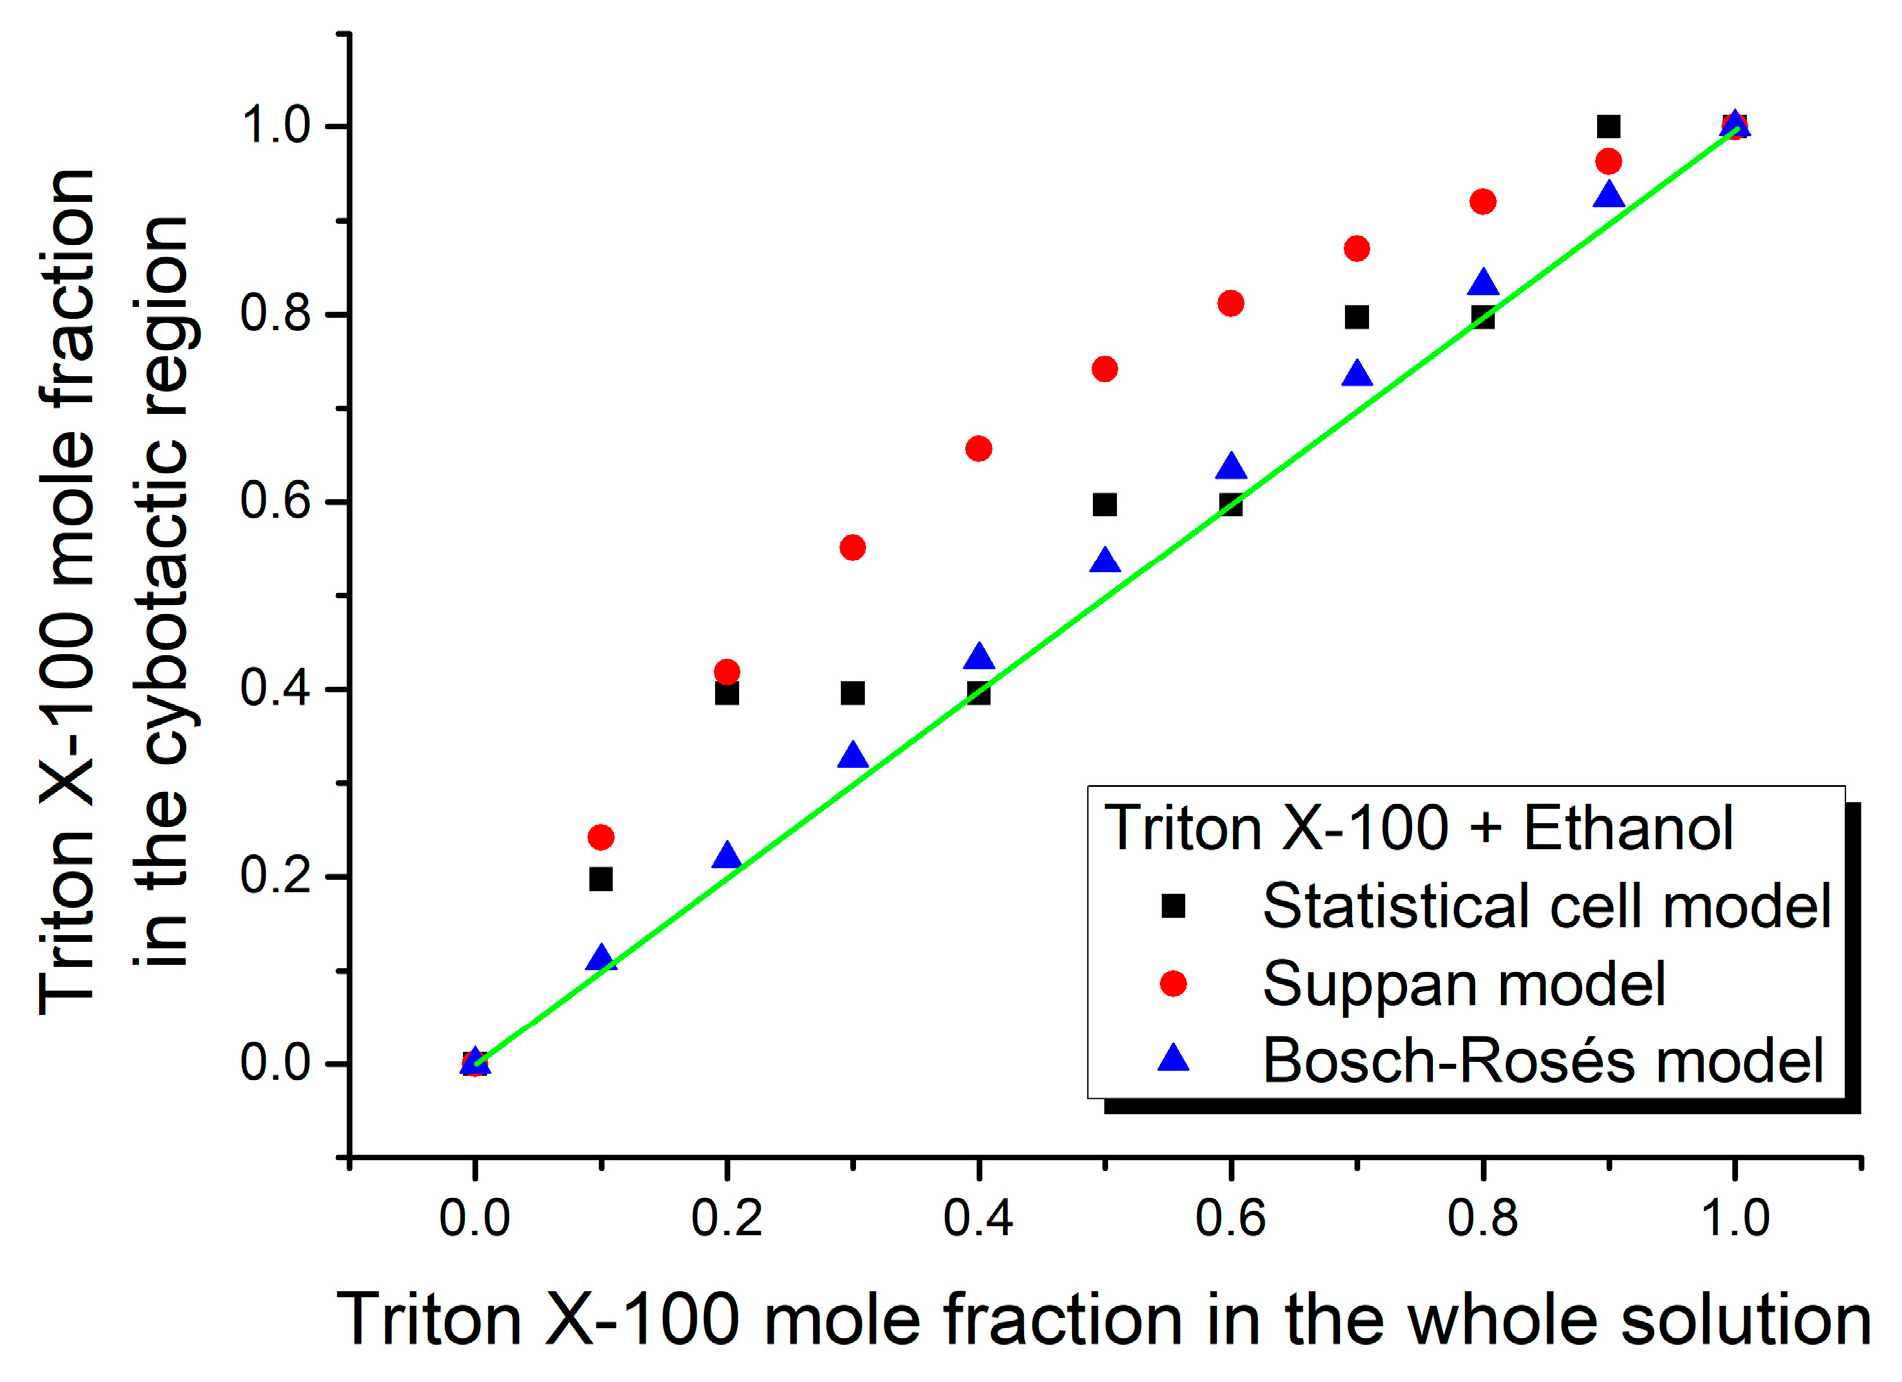
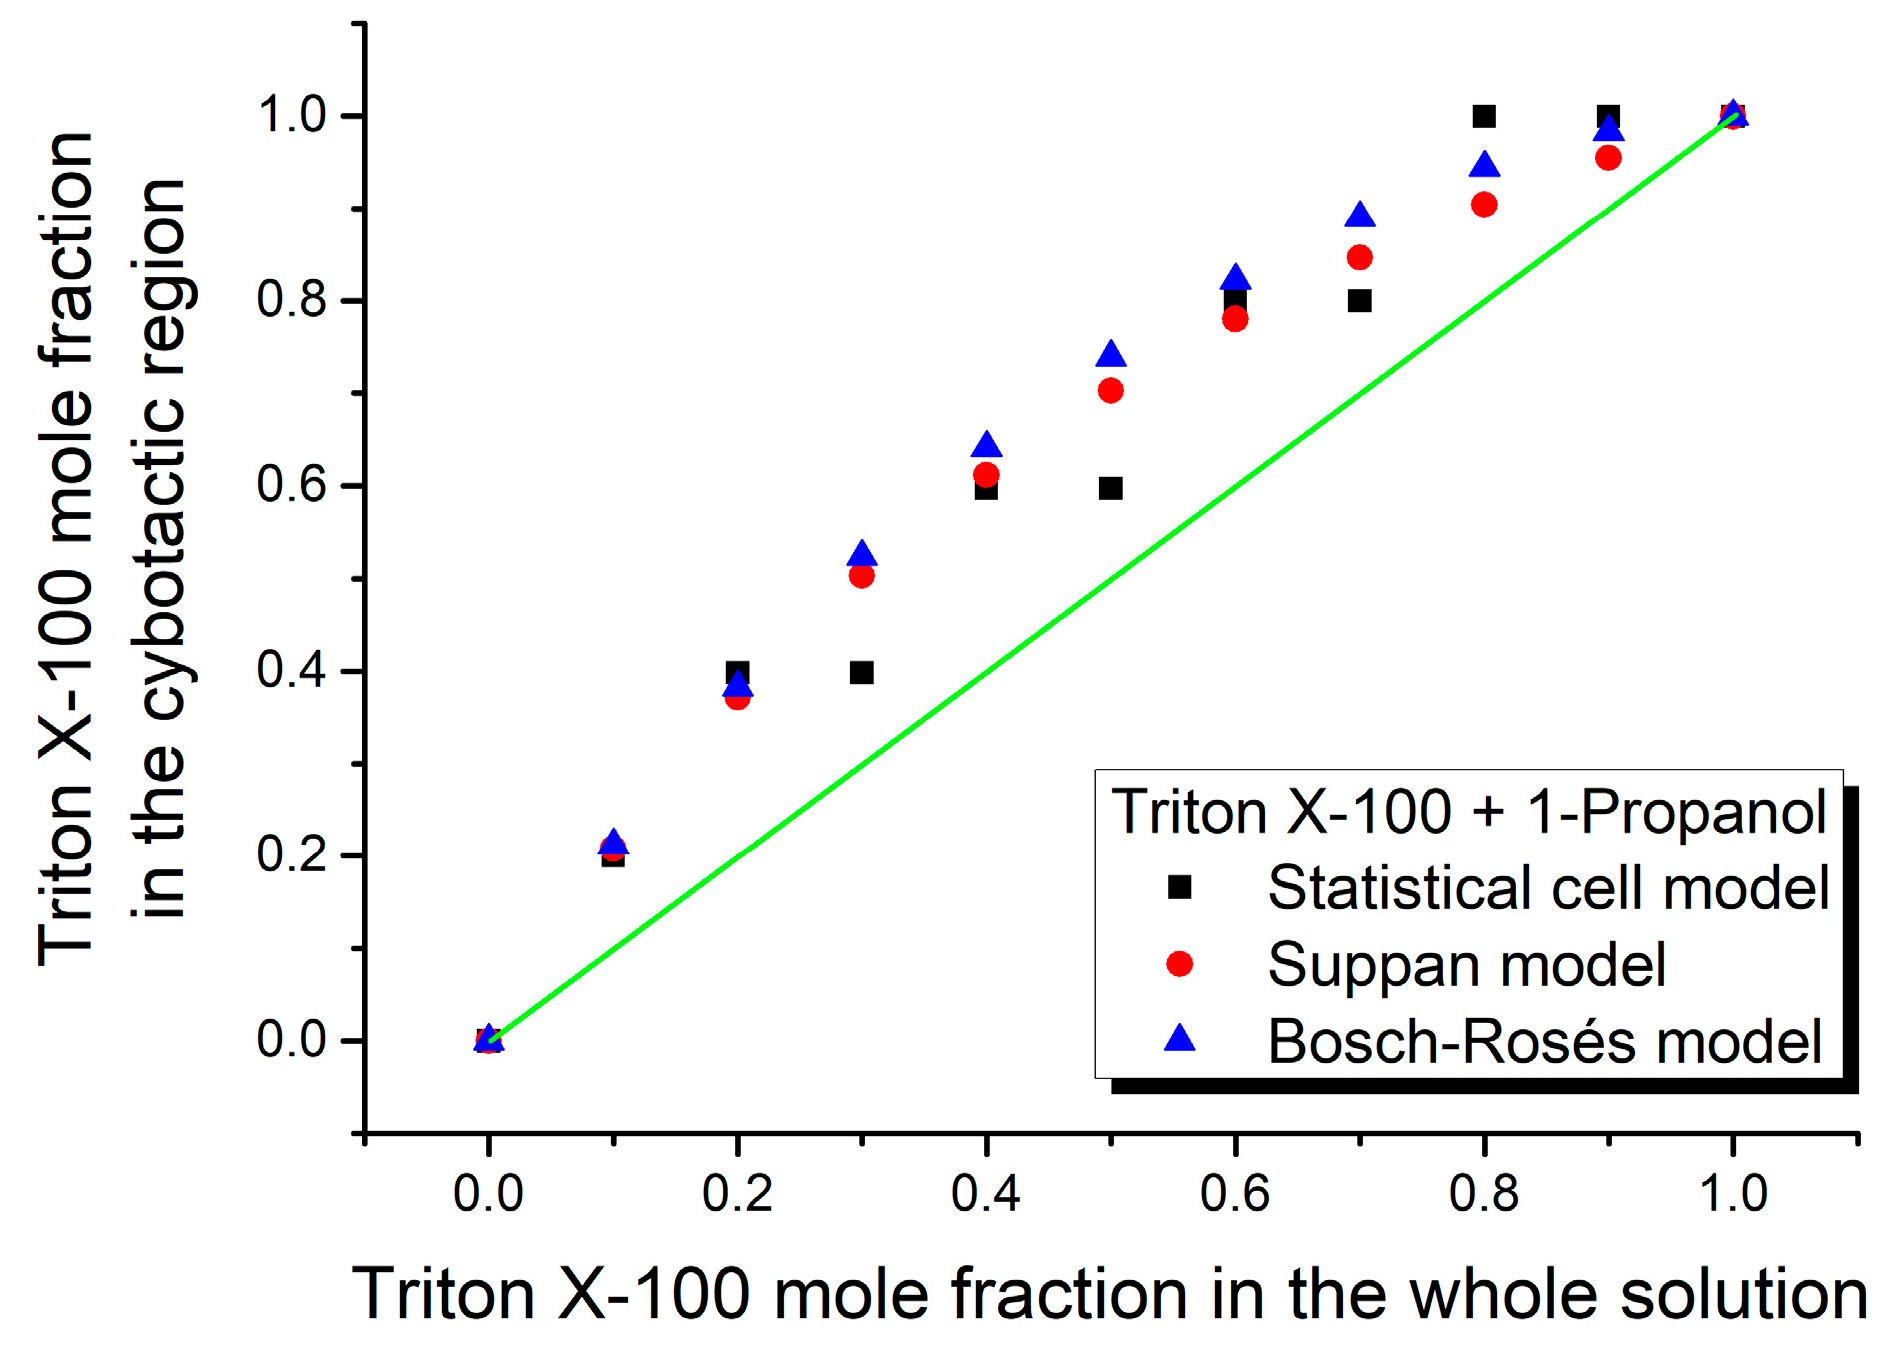
2.3. Theoretical Models

The contributions of each type of intermolecular interaction to the total spectral shift of the methyl red absorption spectral band were estimated by the Kamlet–Abboud–Taft model [82]. This model considers three parameters, which describe the non-specific (universal) interactions (orientation, induction, and dispersion), π* [83], the specific interactions of the type of hydrogen bond donor, α [84], and the specific interactions of the type of hydrogen bond acceptor, β [85], respectively. It proposes the next linear solvation–energy relationship (LSER) [82]:
ν ¯ = ν ¯ 0 + C 1 π * + C 2 β + C 3 α ,
where ν ¯ and ν ¯ 0 are the wavenumbers corresponding to the maximum of the electronic absorption spectral band in solution and for isolated molecules (gas state), respectively, while C1C3 are correlation coefficients, which can be determined by the multiple linear regression of Equation (1).
For the ternary solution data analysis, three theoretical models were approached: the statistical cell model [74], the Suppan model [75], and the Bosch–Rosés model [76,77,78,79]. These models estimate the mole fractions of the two solvents in the cybotactic region of the solute’s molecule, which usually differ from those in the whole solutions due to the interactions between the solute and solvent molecules.
The statistical cell model considers the first solvation shell (cybotactic region) of the solute’s molecule as a statistical grand canonical ensemble [86], changing particles with the whole solution [74]. The statistical average weights of the two solvent molecules in the first solvation shell of the solute’s molecule are calculated with the next equations (for details, see [73]):
p 1 = ν ¯ t ν ¯ 2 ν ¯ 1 ν ¯ 2 ,
p 2 = ν ¯ 1 ν ¯ t ν ¯ 1 ν ¯ 2 ,
where ν ¯ is the wavenumber corresponding to the maximum of the analyzed spectral band of the solute, while the indices 1, 2, and t refer to the binary solutions of the type of solute + solvent 1, solute + solvent 2, and the ternary solution, respectively. The model also establishes a linear dependence:
ln p 1 p 2 = ln x 1 x 2 + w 2 w 1 k T ,
where x1 and x2 are the mole fractions of the two solvents, respectively, in the whole ternary solution; k and T are the Boltzmann constant and temperature; and w1 and w2 are the interaction energies in the pairs of molecules of the type of solute–solvent 1 and solute–solvent 2, respectively. By the linear regression of the above equation, the difference w1w2 can be estimated.
The basic hypothesis of the Suppan model [75] is that the solute will be preferentially solvated by the most polar solvent, i.e., the solvent with the largest electrical dipole moment. The next equation is established between the mole fraction of the two solvents in the cybotactic region of the solute’s molecule (y2/y1) and the corresponding mole fraction of the two solvents in the whole solution (x2/x1):
y 2 y 1 = e Z x 2 x 1 .
In the above equation, Z is the index of preferential solvation, introduced by Van and Hammond [87]. Its value can be estimated from the spectral data [88].
The statistical cell model and the Suppan model neglect the specific interactions between the molecules. Unlike these, the Bosch–Rosés model takes into account the specific interactions between the molecules (solute–solvent and solvent–solvent) and also the formation of the 1:1 complex between the molecules of the two solvents. The model defines two preferential solvation parameters, which describe the tendency of the solvatochromic indicator to be solvated by the second solvent (f2/1) and the complex of the two solvents (f12/1), respectively, by comparison to the first solvent:
f 2 / 1 = y 2 / y 1 x 2 / x 1 2 ,
f 12 / 1 = y 12 / y 1 x 2 / x 1 ,
where x1, x2, y1, and y2 have the same meaning as in the Suppan model.
With these notations, the transition energy corresponding to the maximum of the electronic absorption band in the ternary solution can be written as:
E t = y 1 E 1 + y 2 E 2 + y 12 E 12 ,
where E1, E2, and E12 are the transition energies corresponding to the maximum of the absorption spectral band in the binary solution with solvent 1, solvent 2, and their complex, respectively.
From Equations (6)–(8), replacing y1 + y2 + y12 = 1 and x1 + x2 = 1 results in:
E t = E 1 x 1 2 + E 2 f 2 / 1 1 x 1 2 + E 12 f 12 / 1 x 1 1 x 1 x 1 2 + f 2 / 1 1 x 1 2 + f 12 / 1 x 1 1 x 1 .
By applying the nonlinear regression of the above equation, the parameters E12, f2/1, and f12/1 are estimated. Further, the compositions of the cybotactic region can be calculated:
y 1 = x 1 2 x 1 2 + f 2 / 1 x 2 2 + f 12 / 1 x 1 x 2 ,
y 2 = f 2 / 1 x 2 2 x 1 2 + f 2 / 1 x 2 2 + f 12 / 1 x 1 x 2 ,
y 12 = f 12 / 1 x 1 x 2 x 1 2 + f 2 / 1 x 2 2 + f 12 / 1 x 1 x 2 .

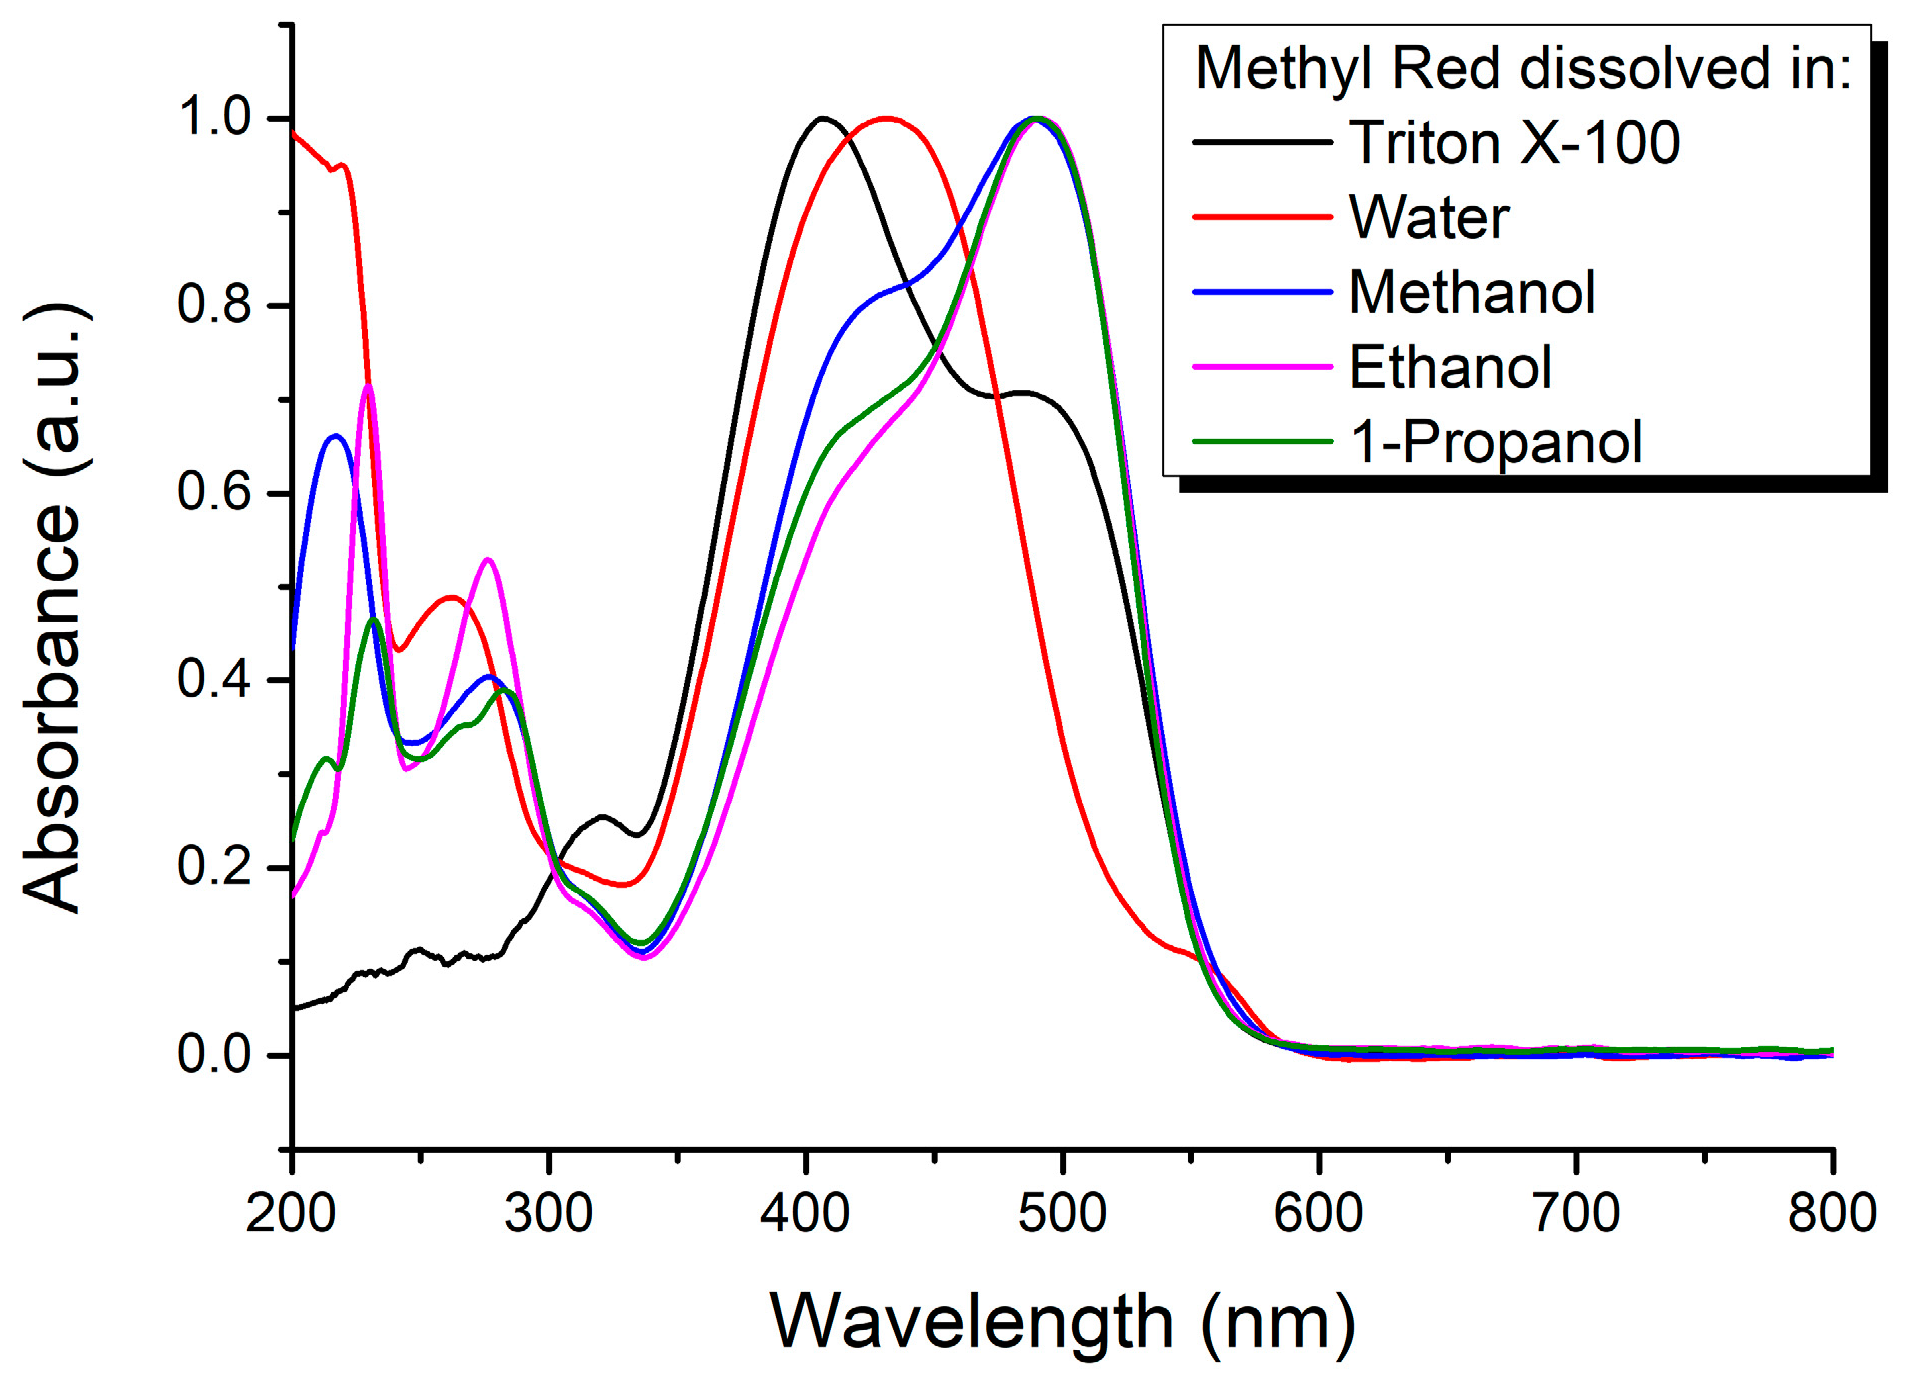
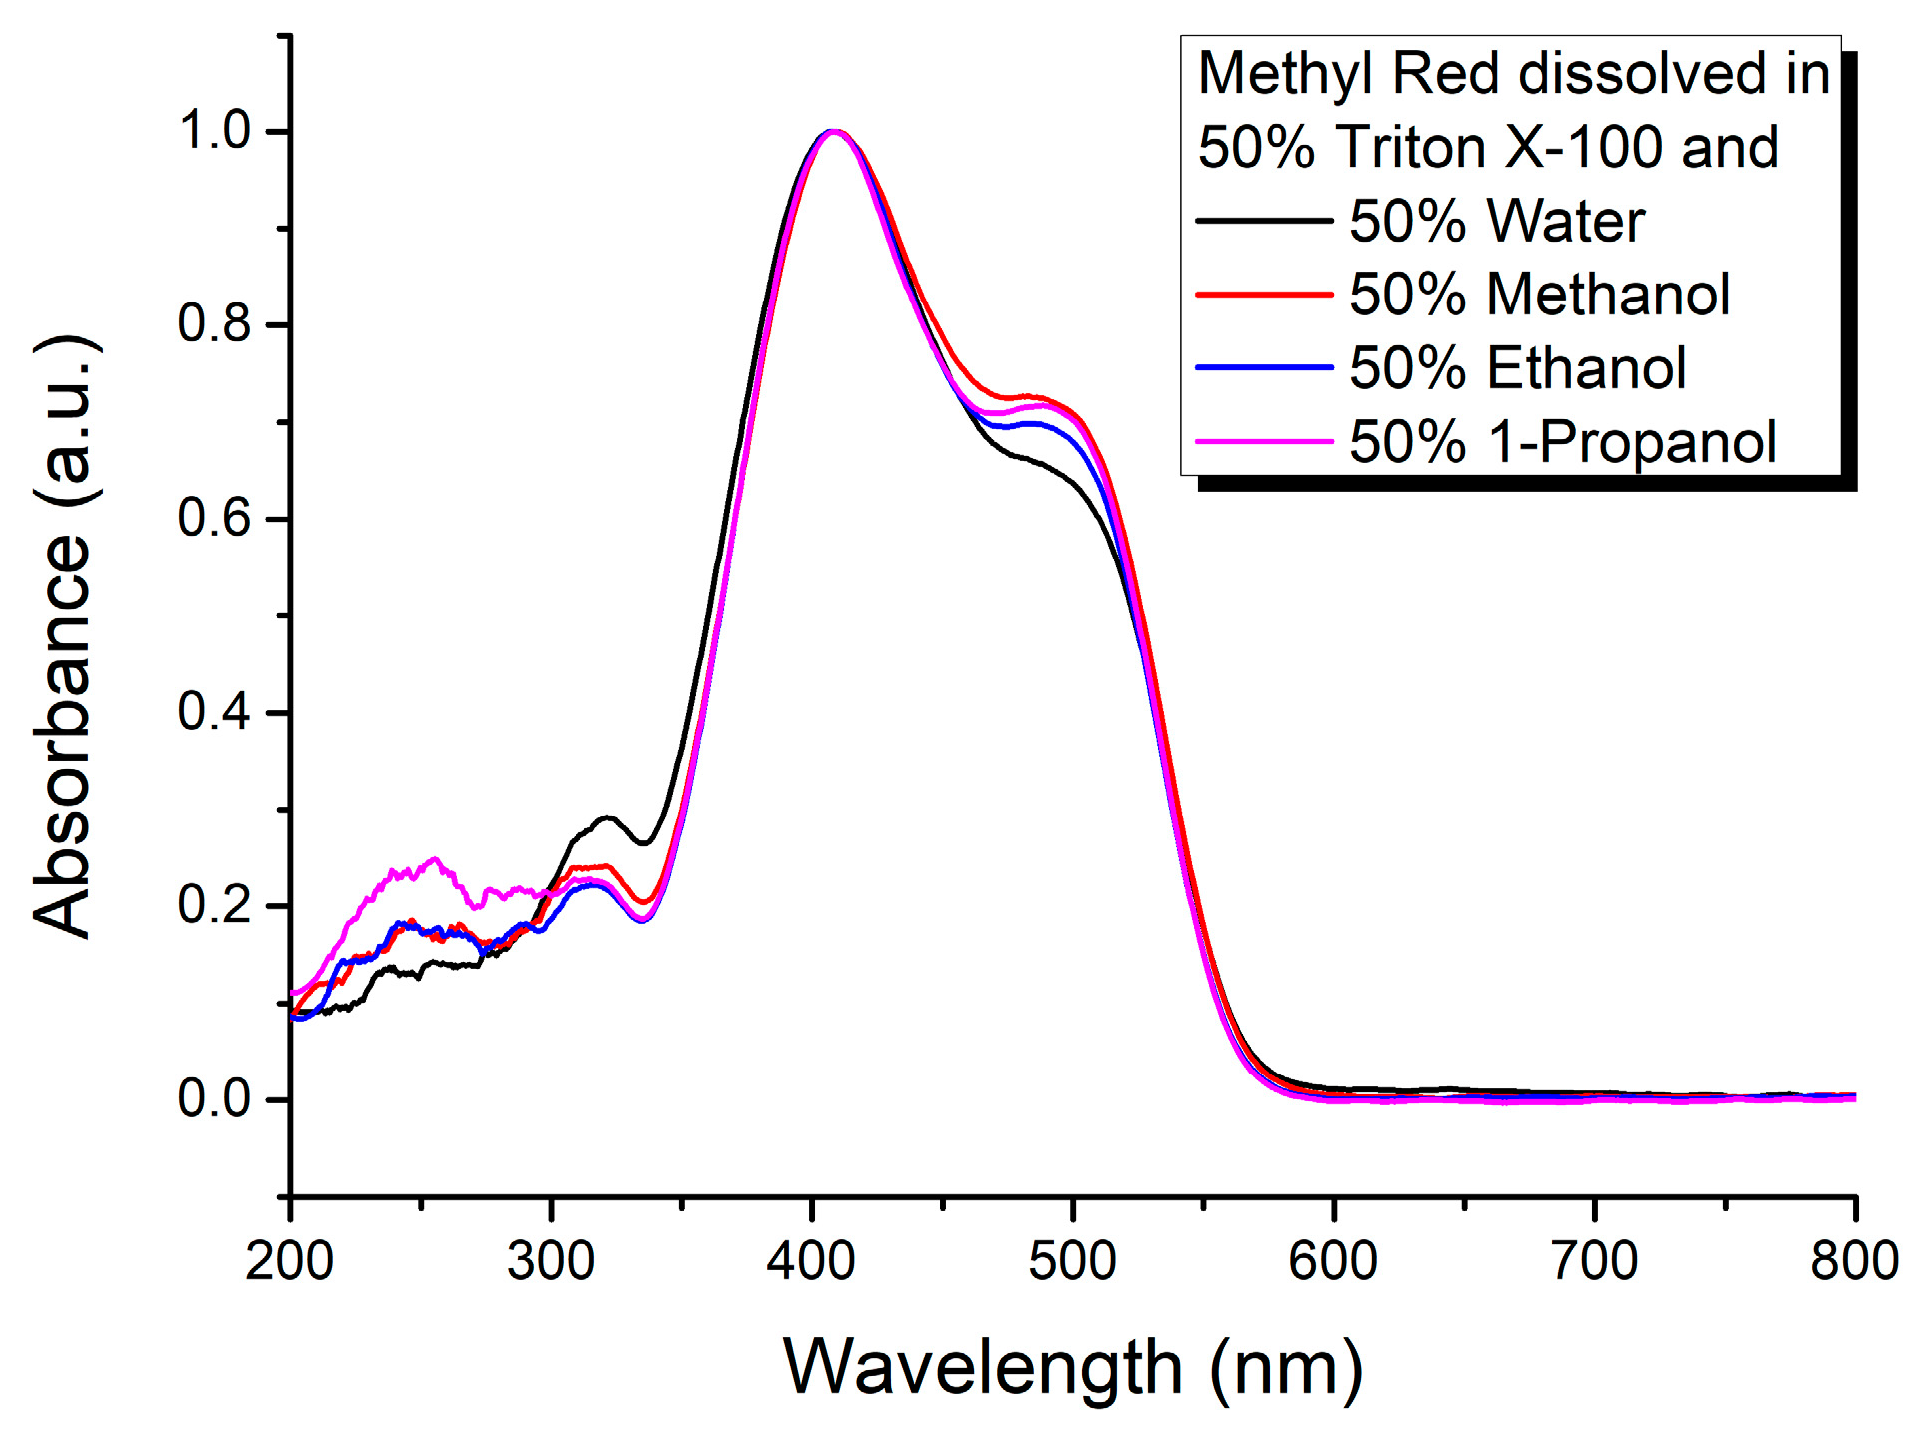
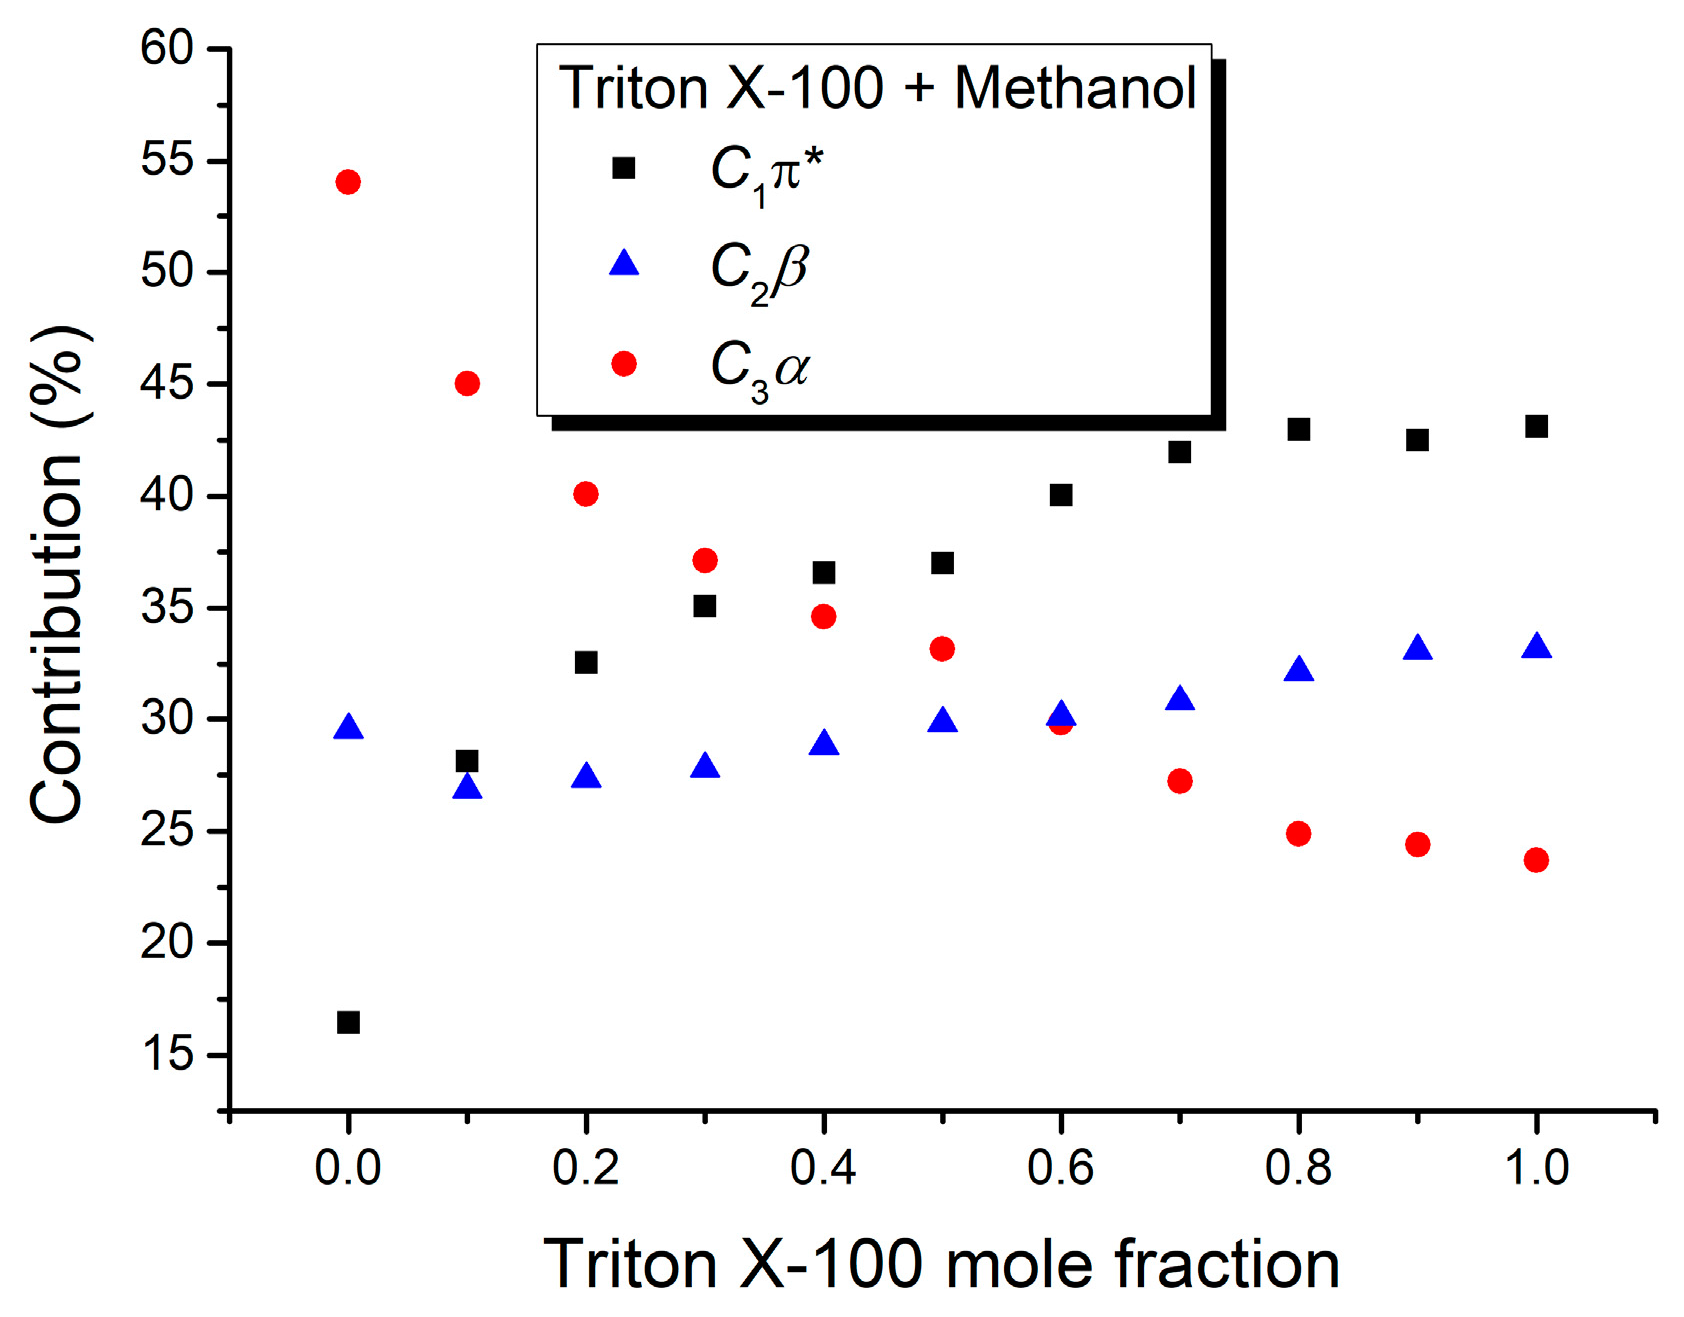
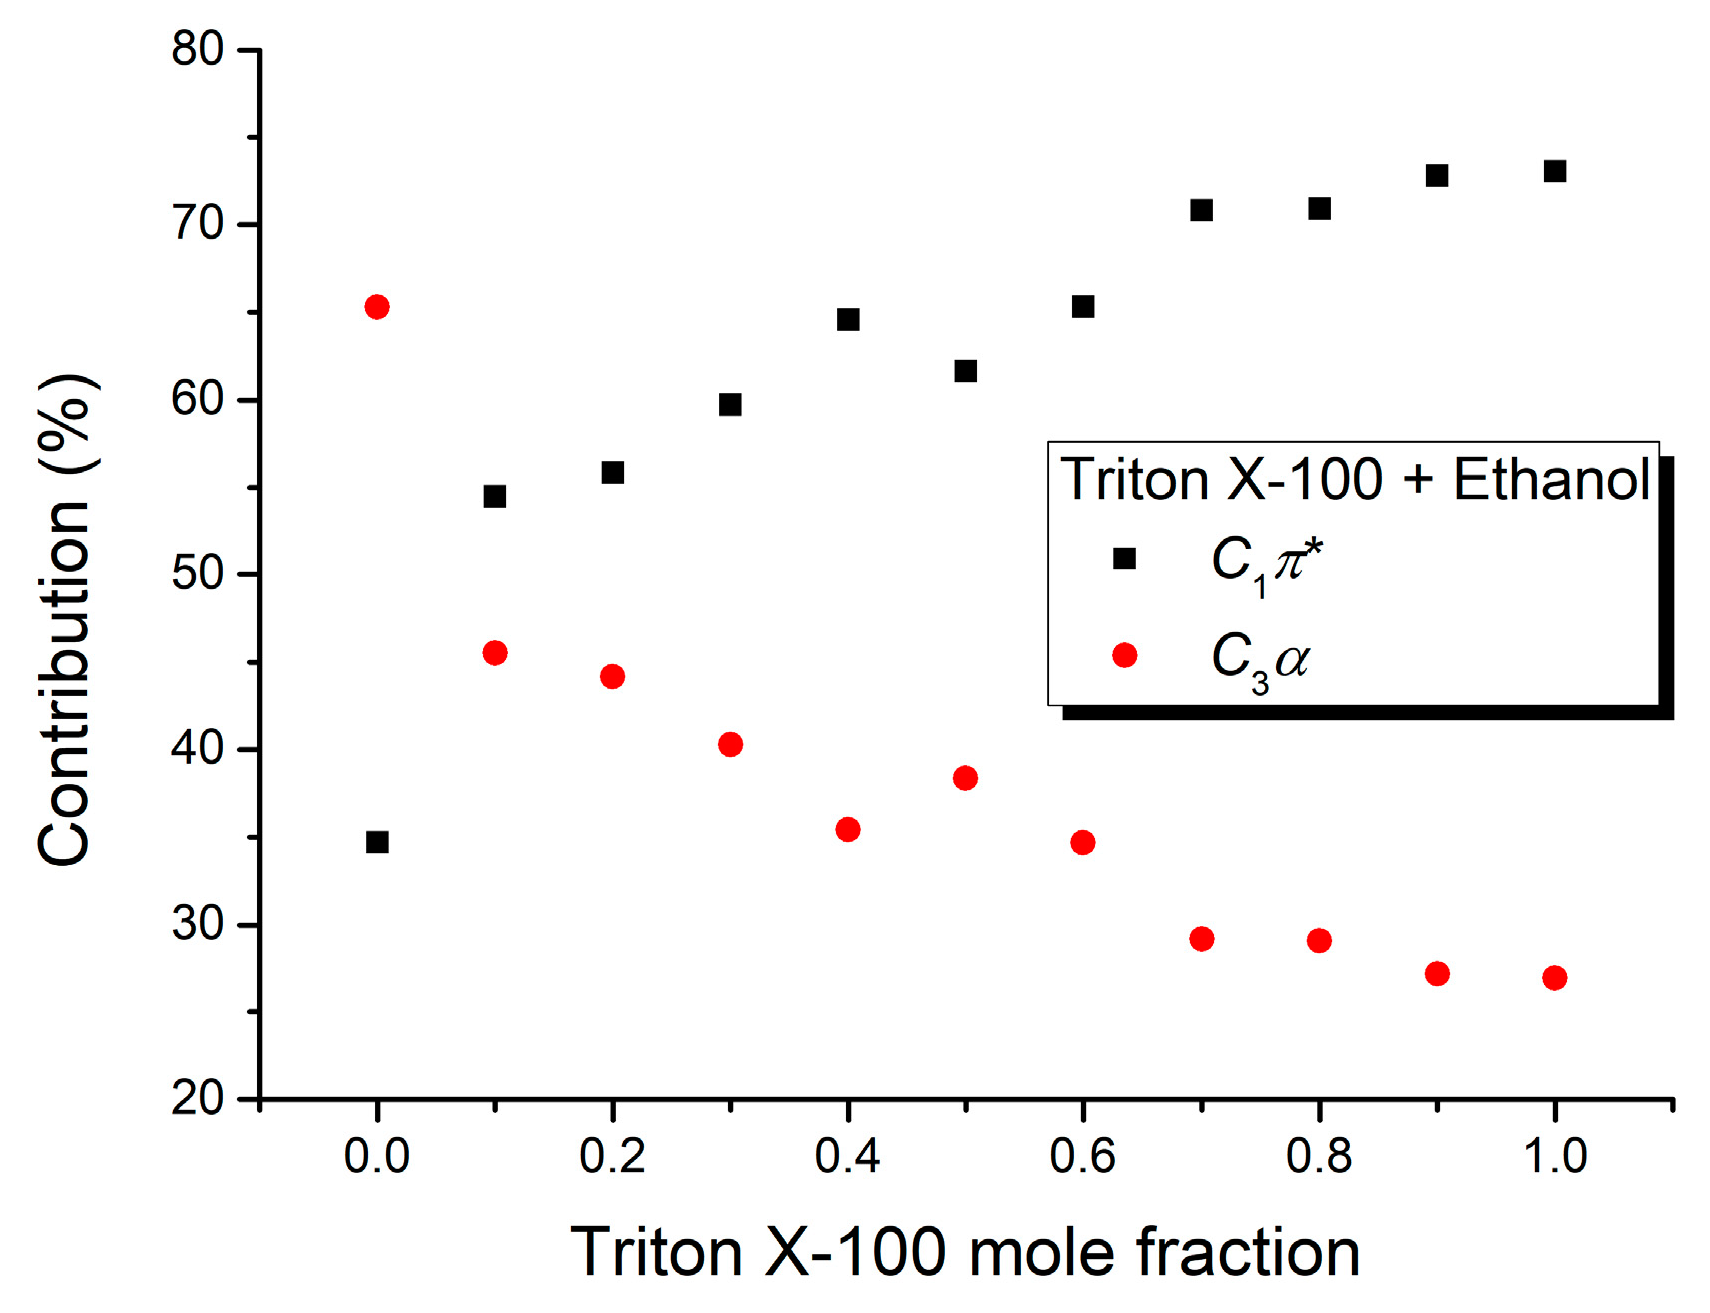
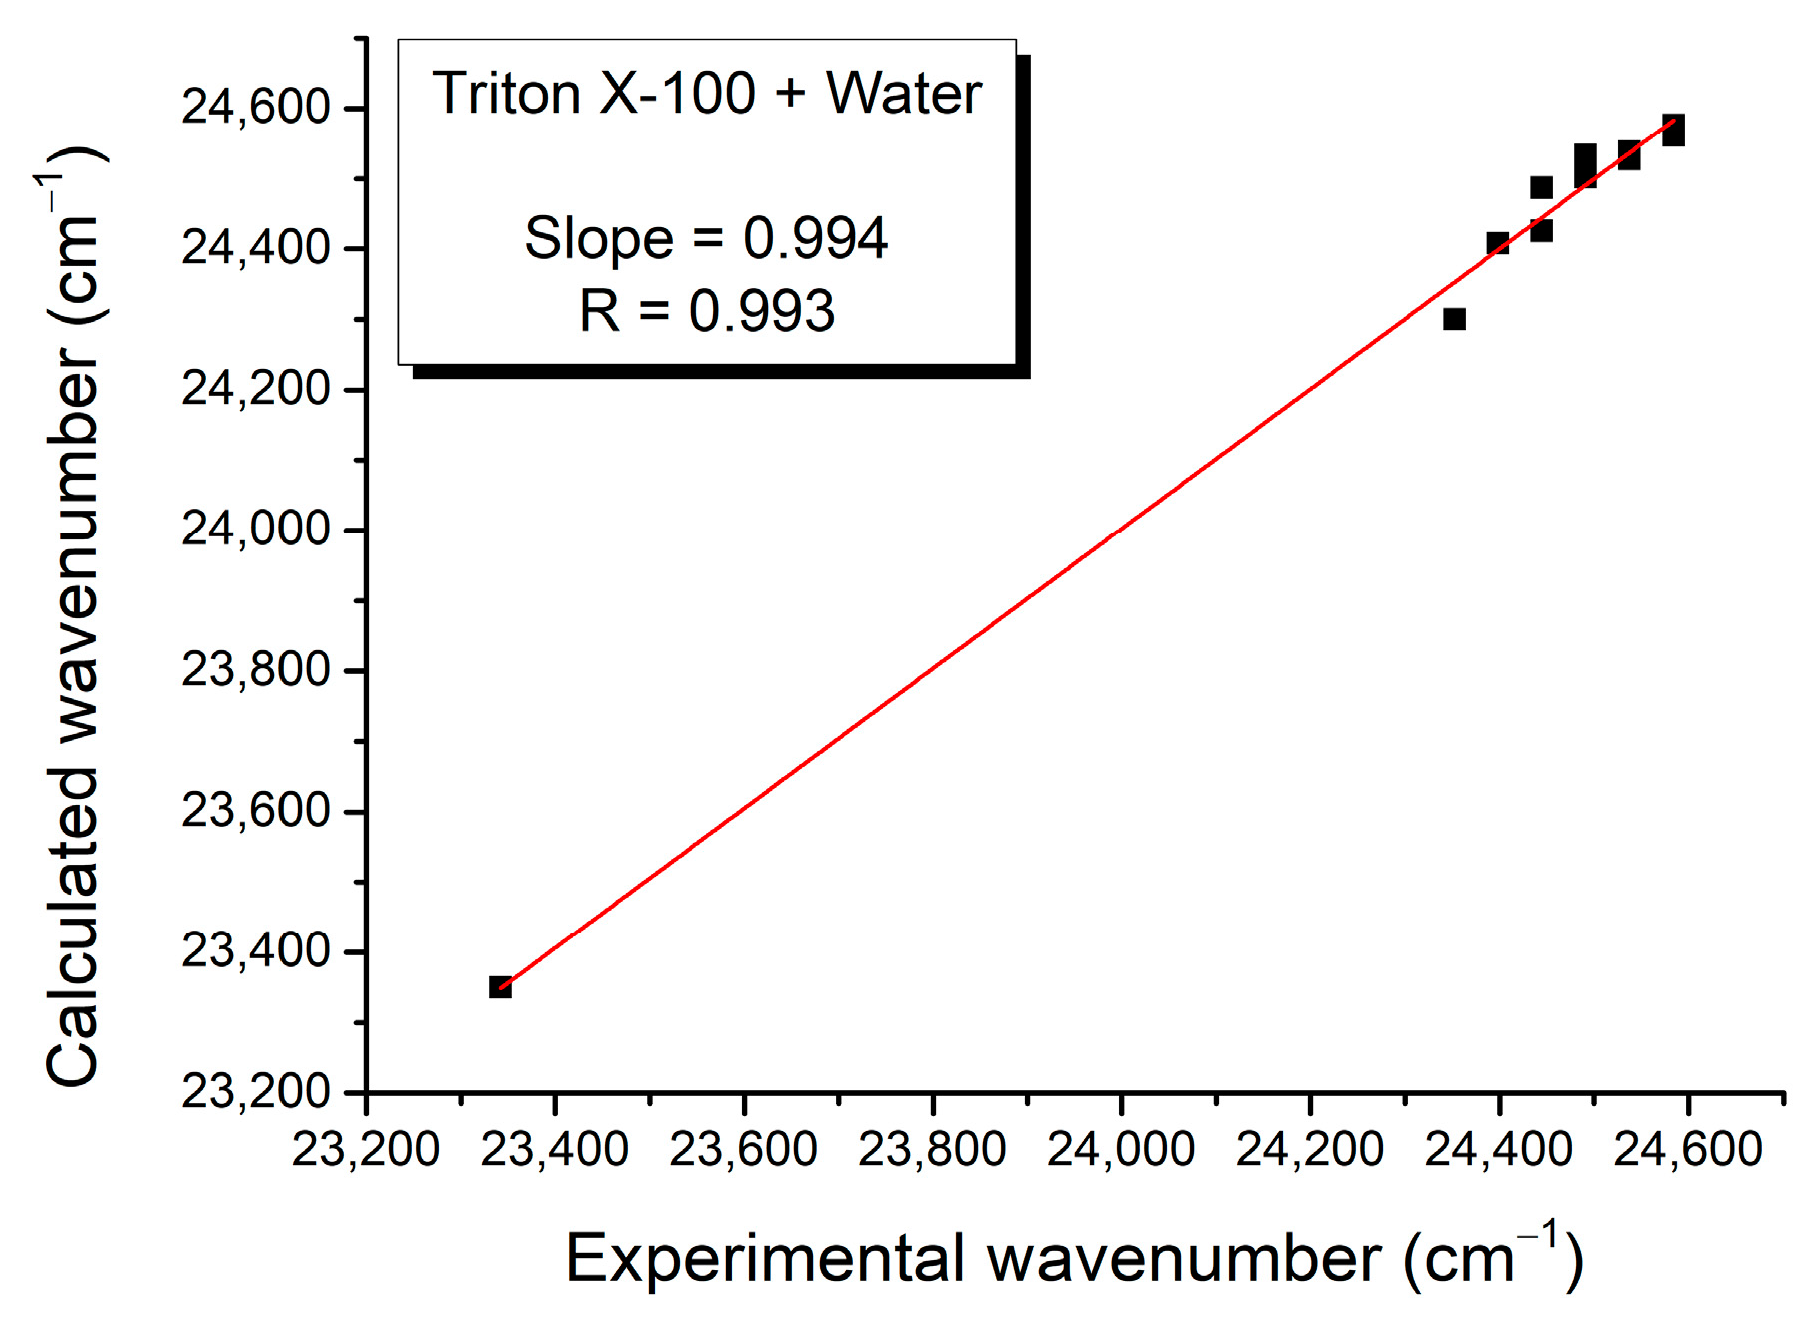
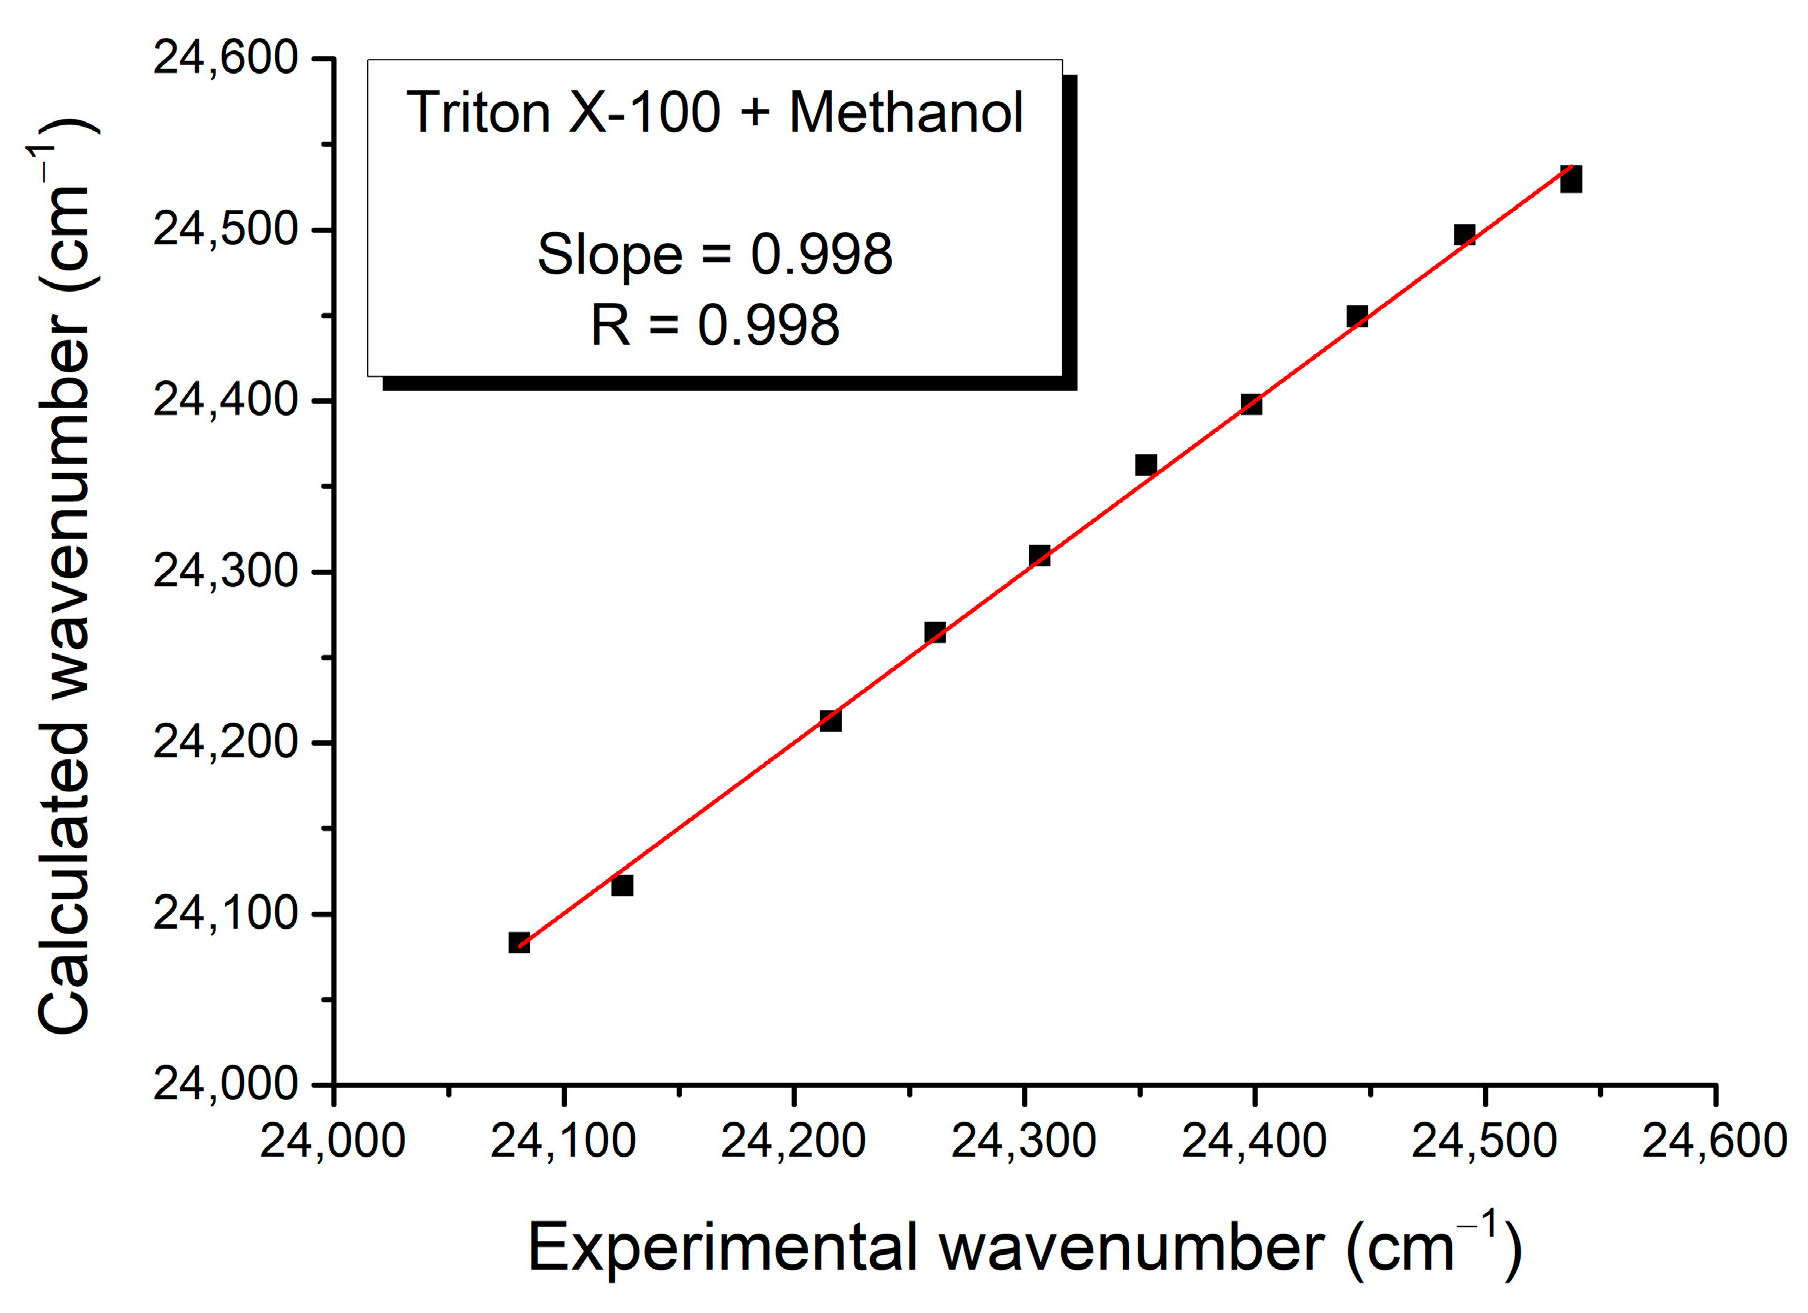
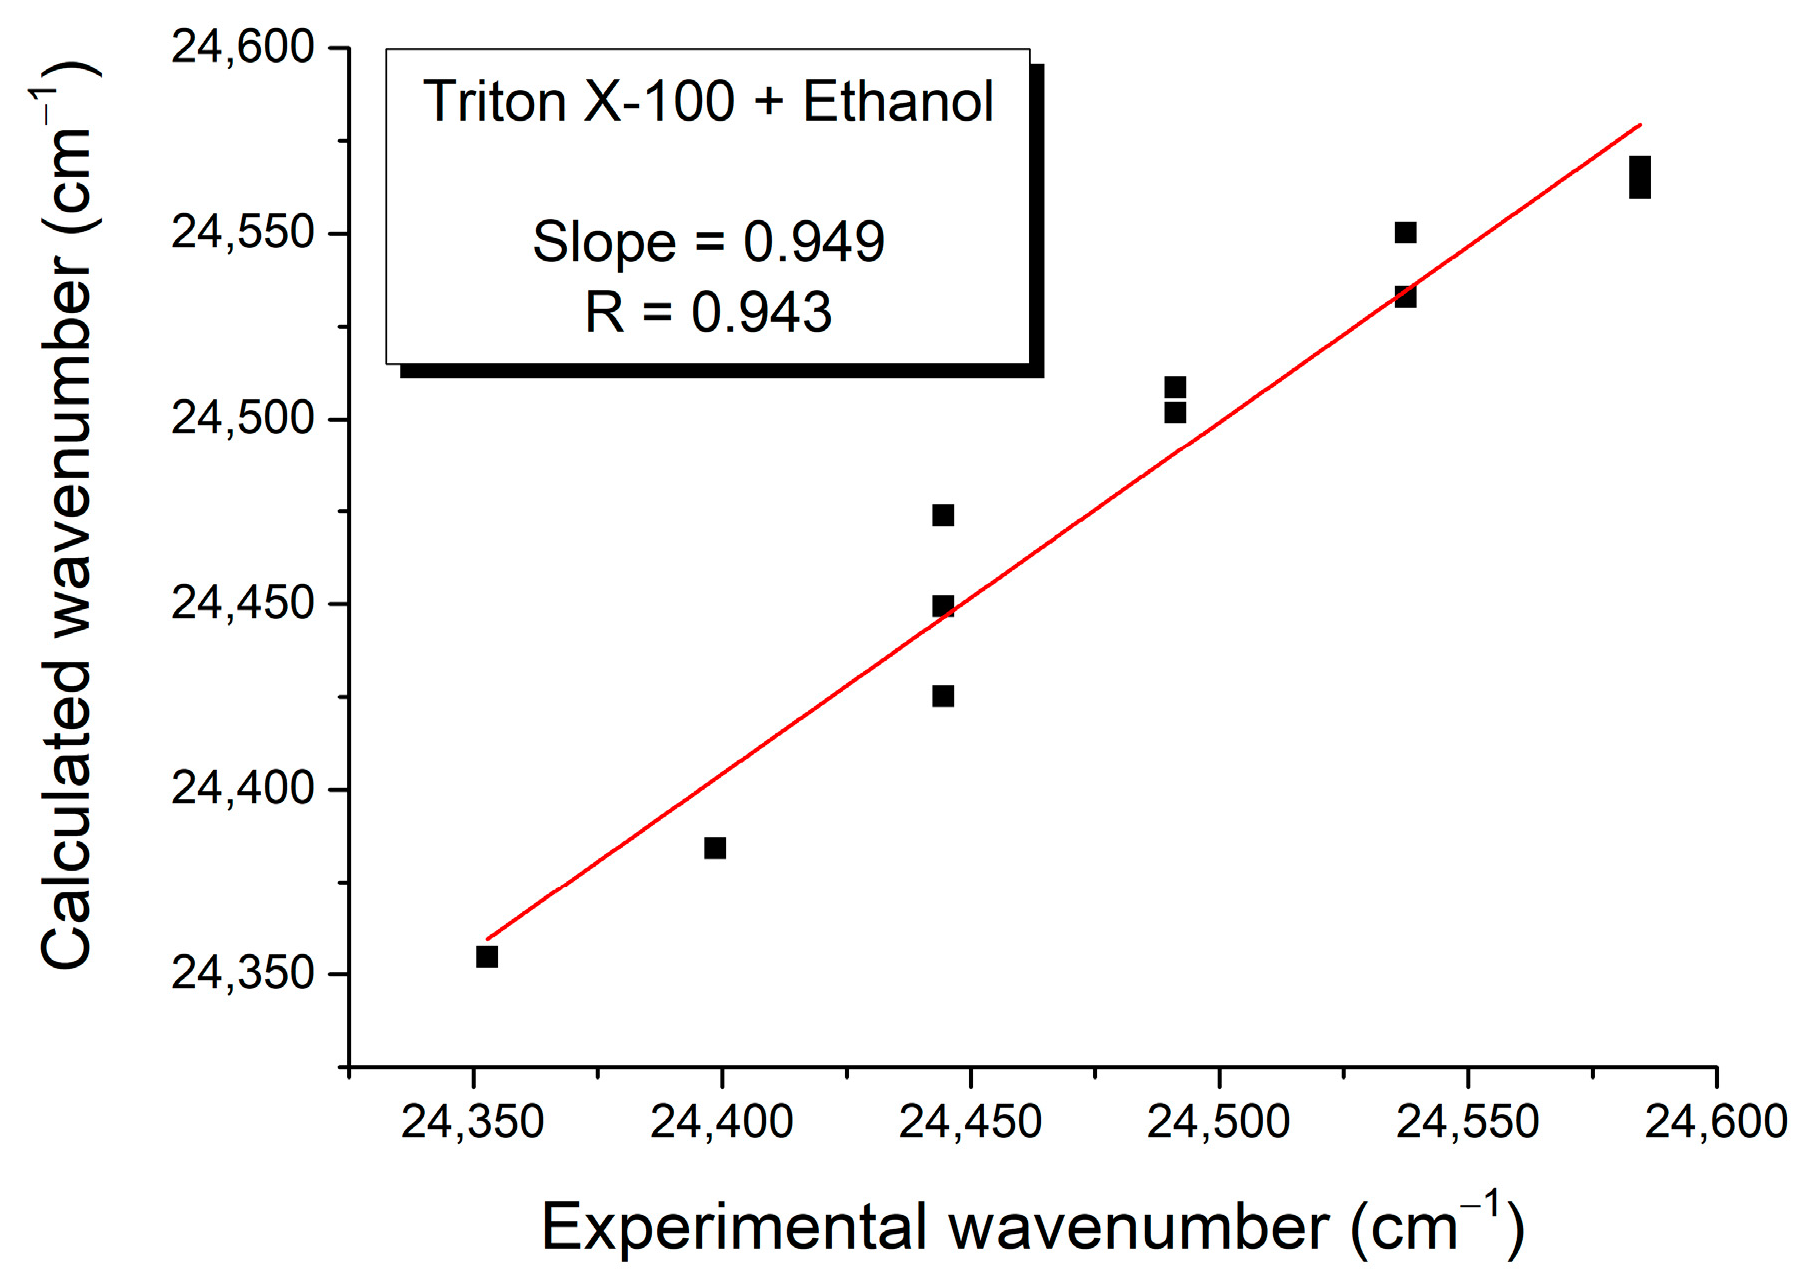
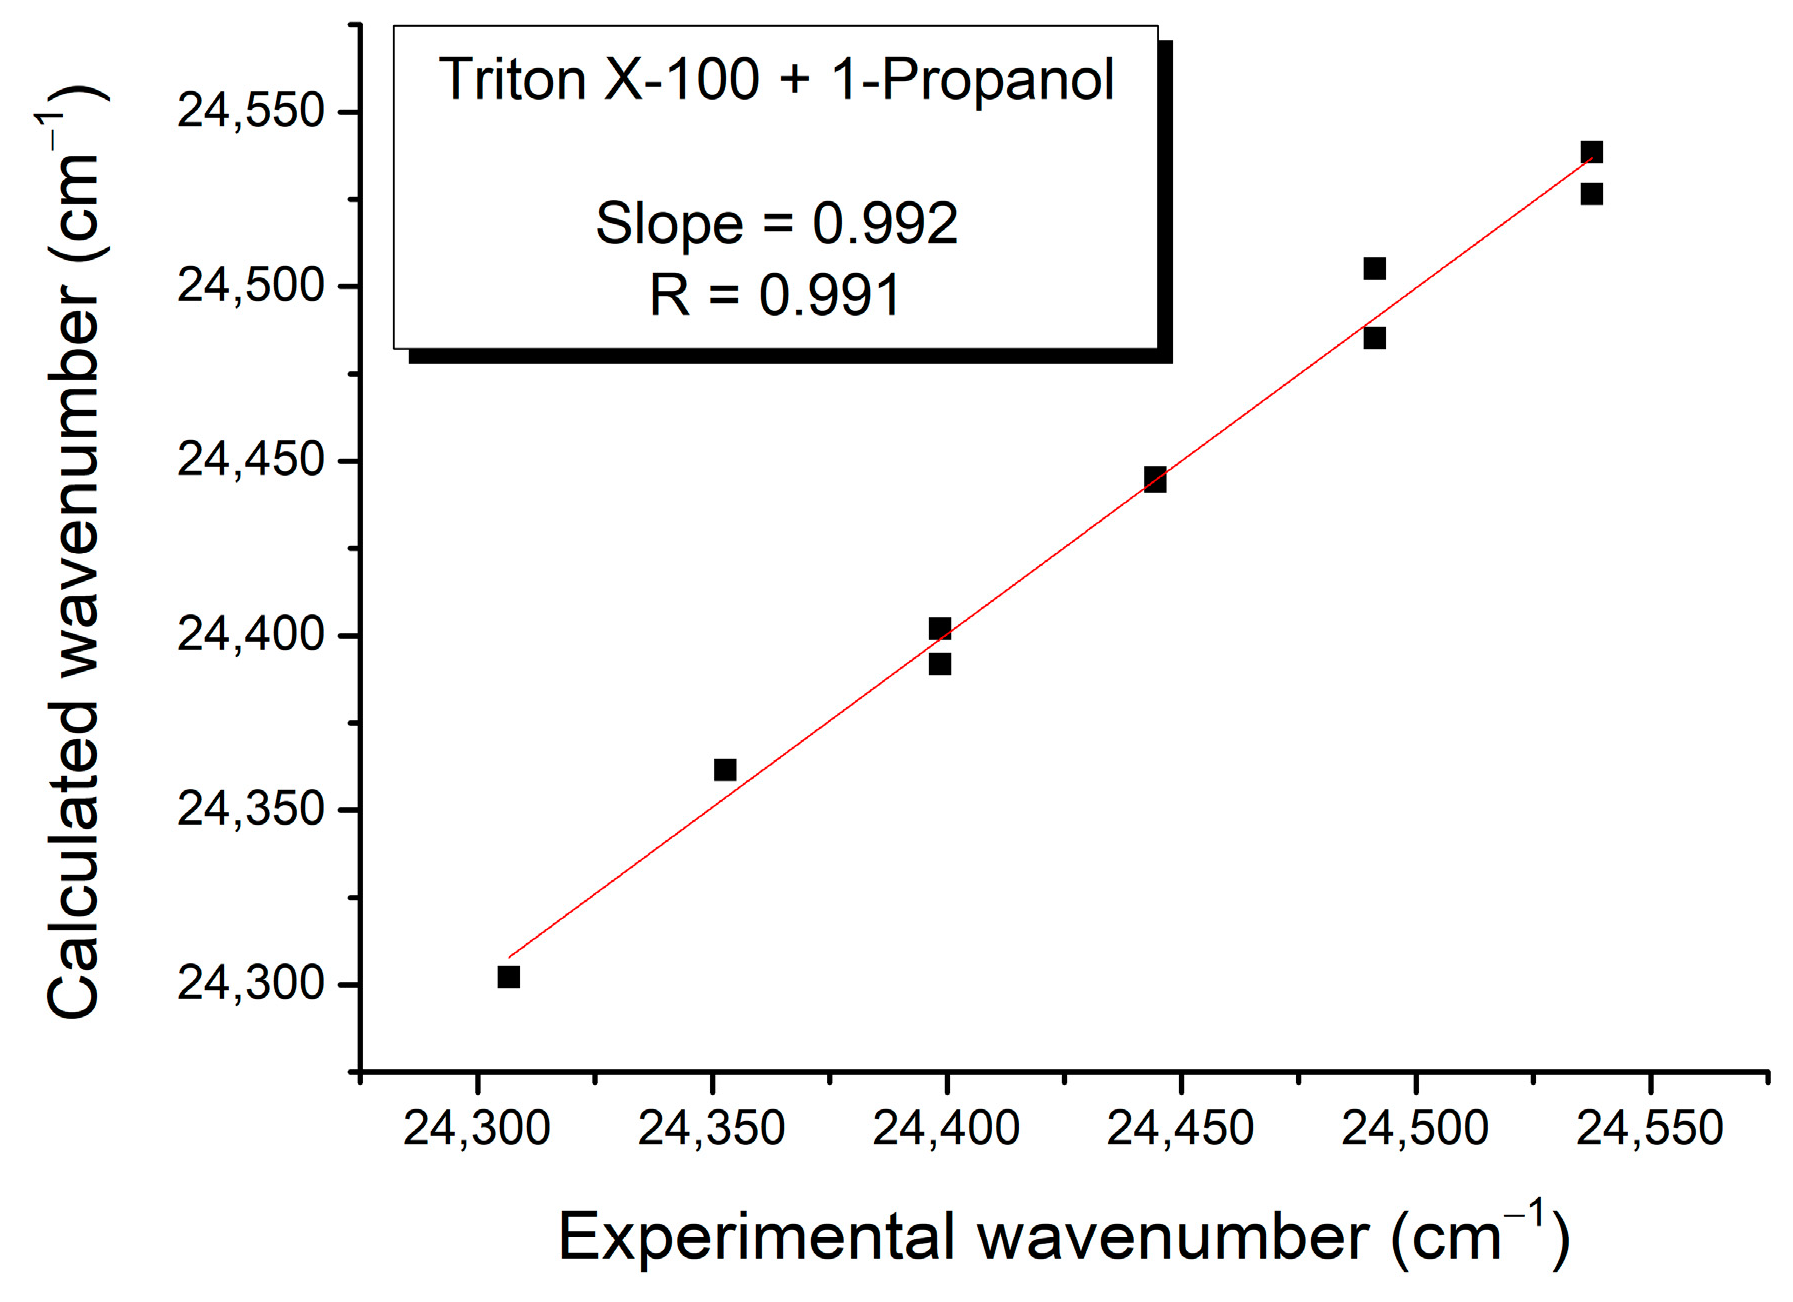
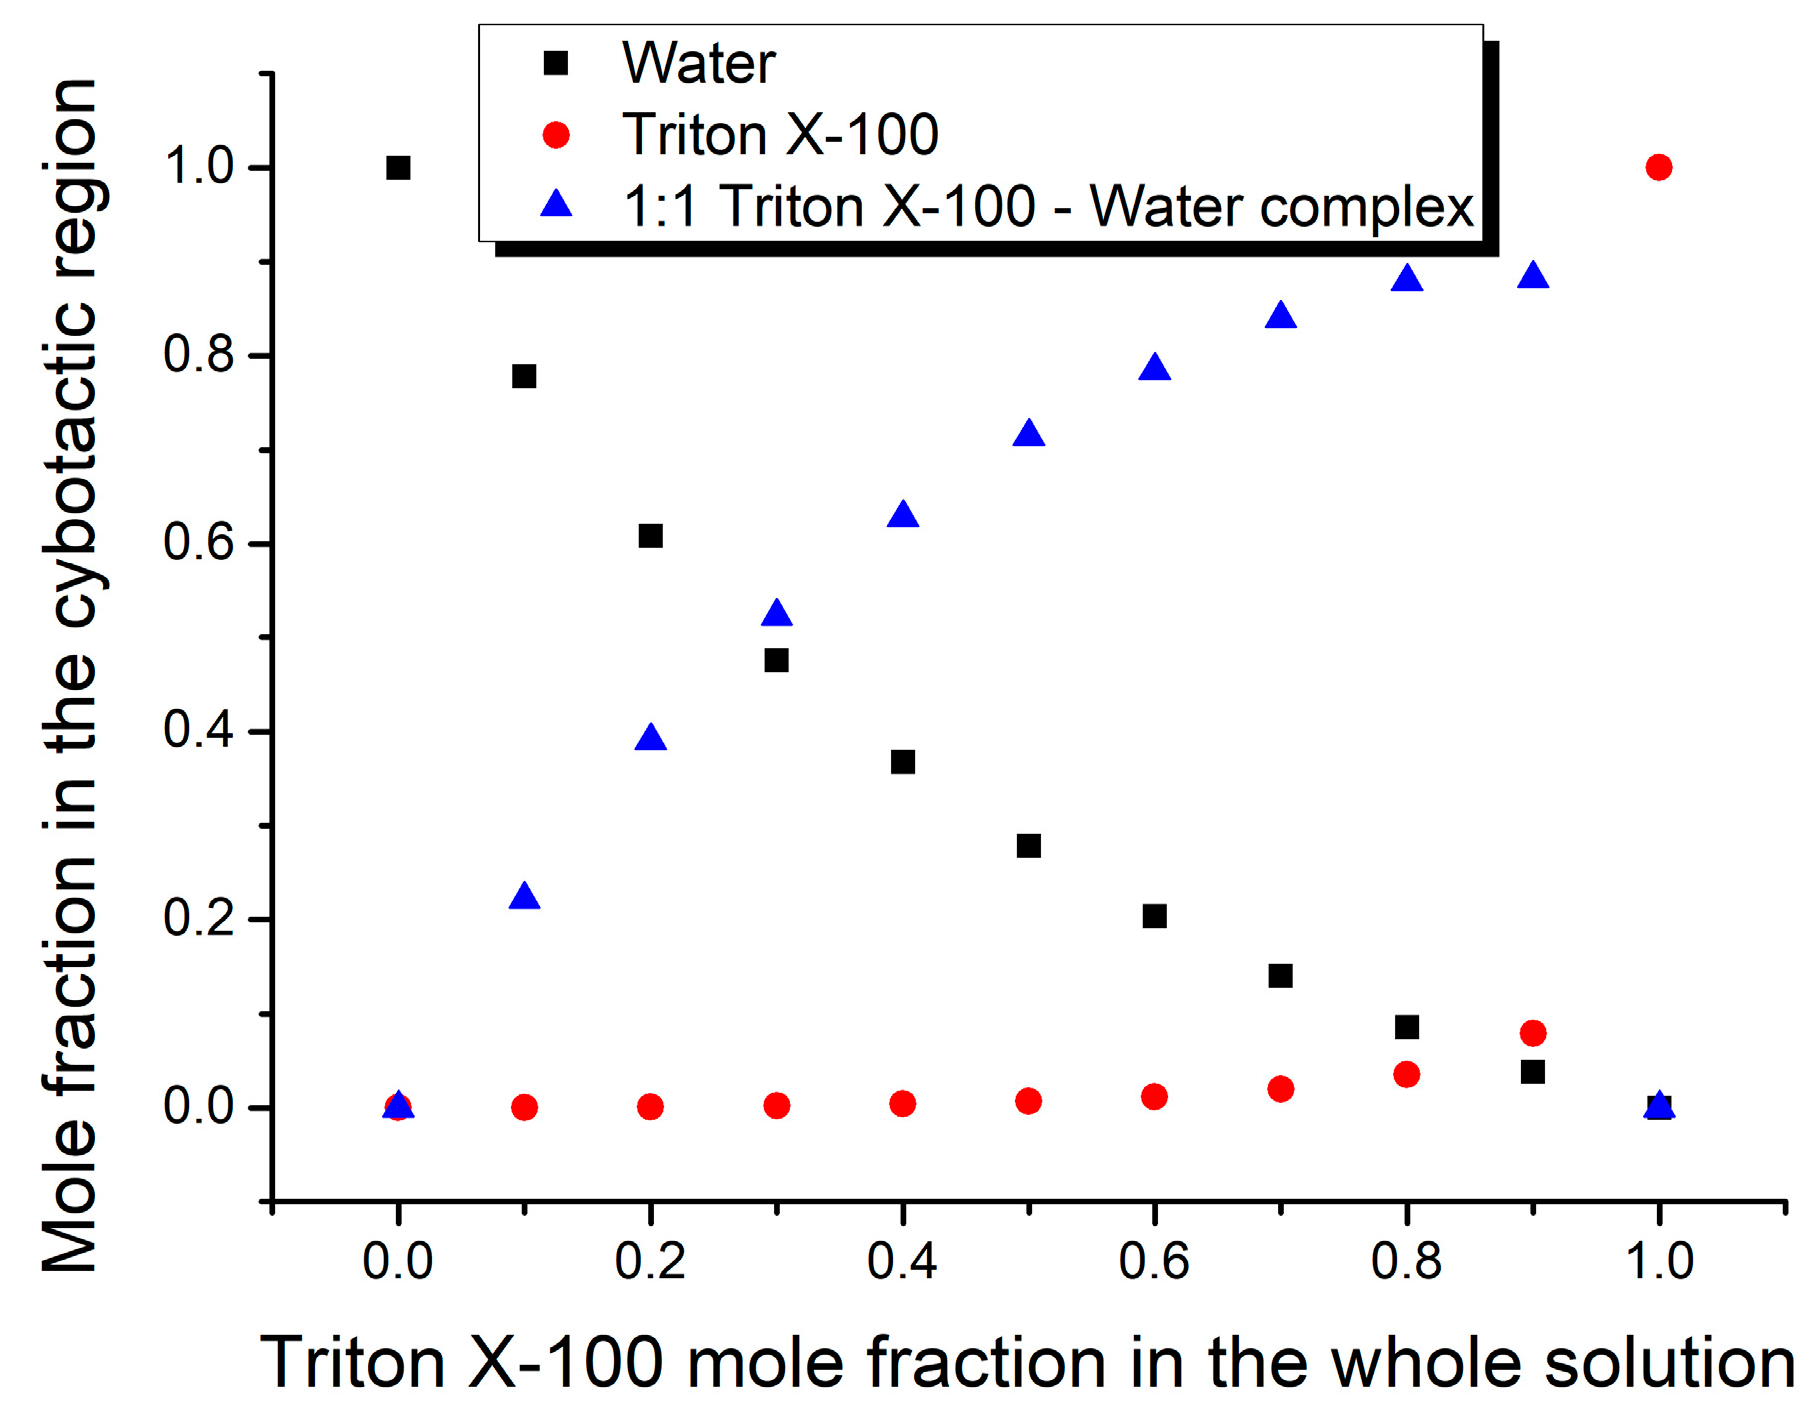
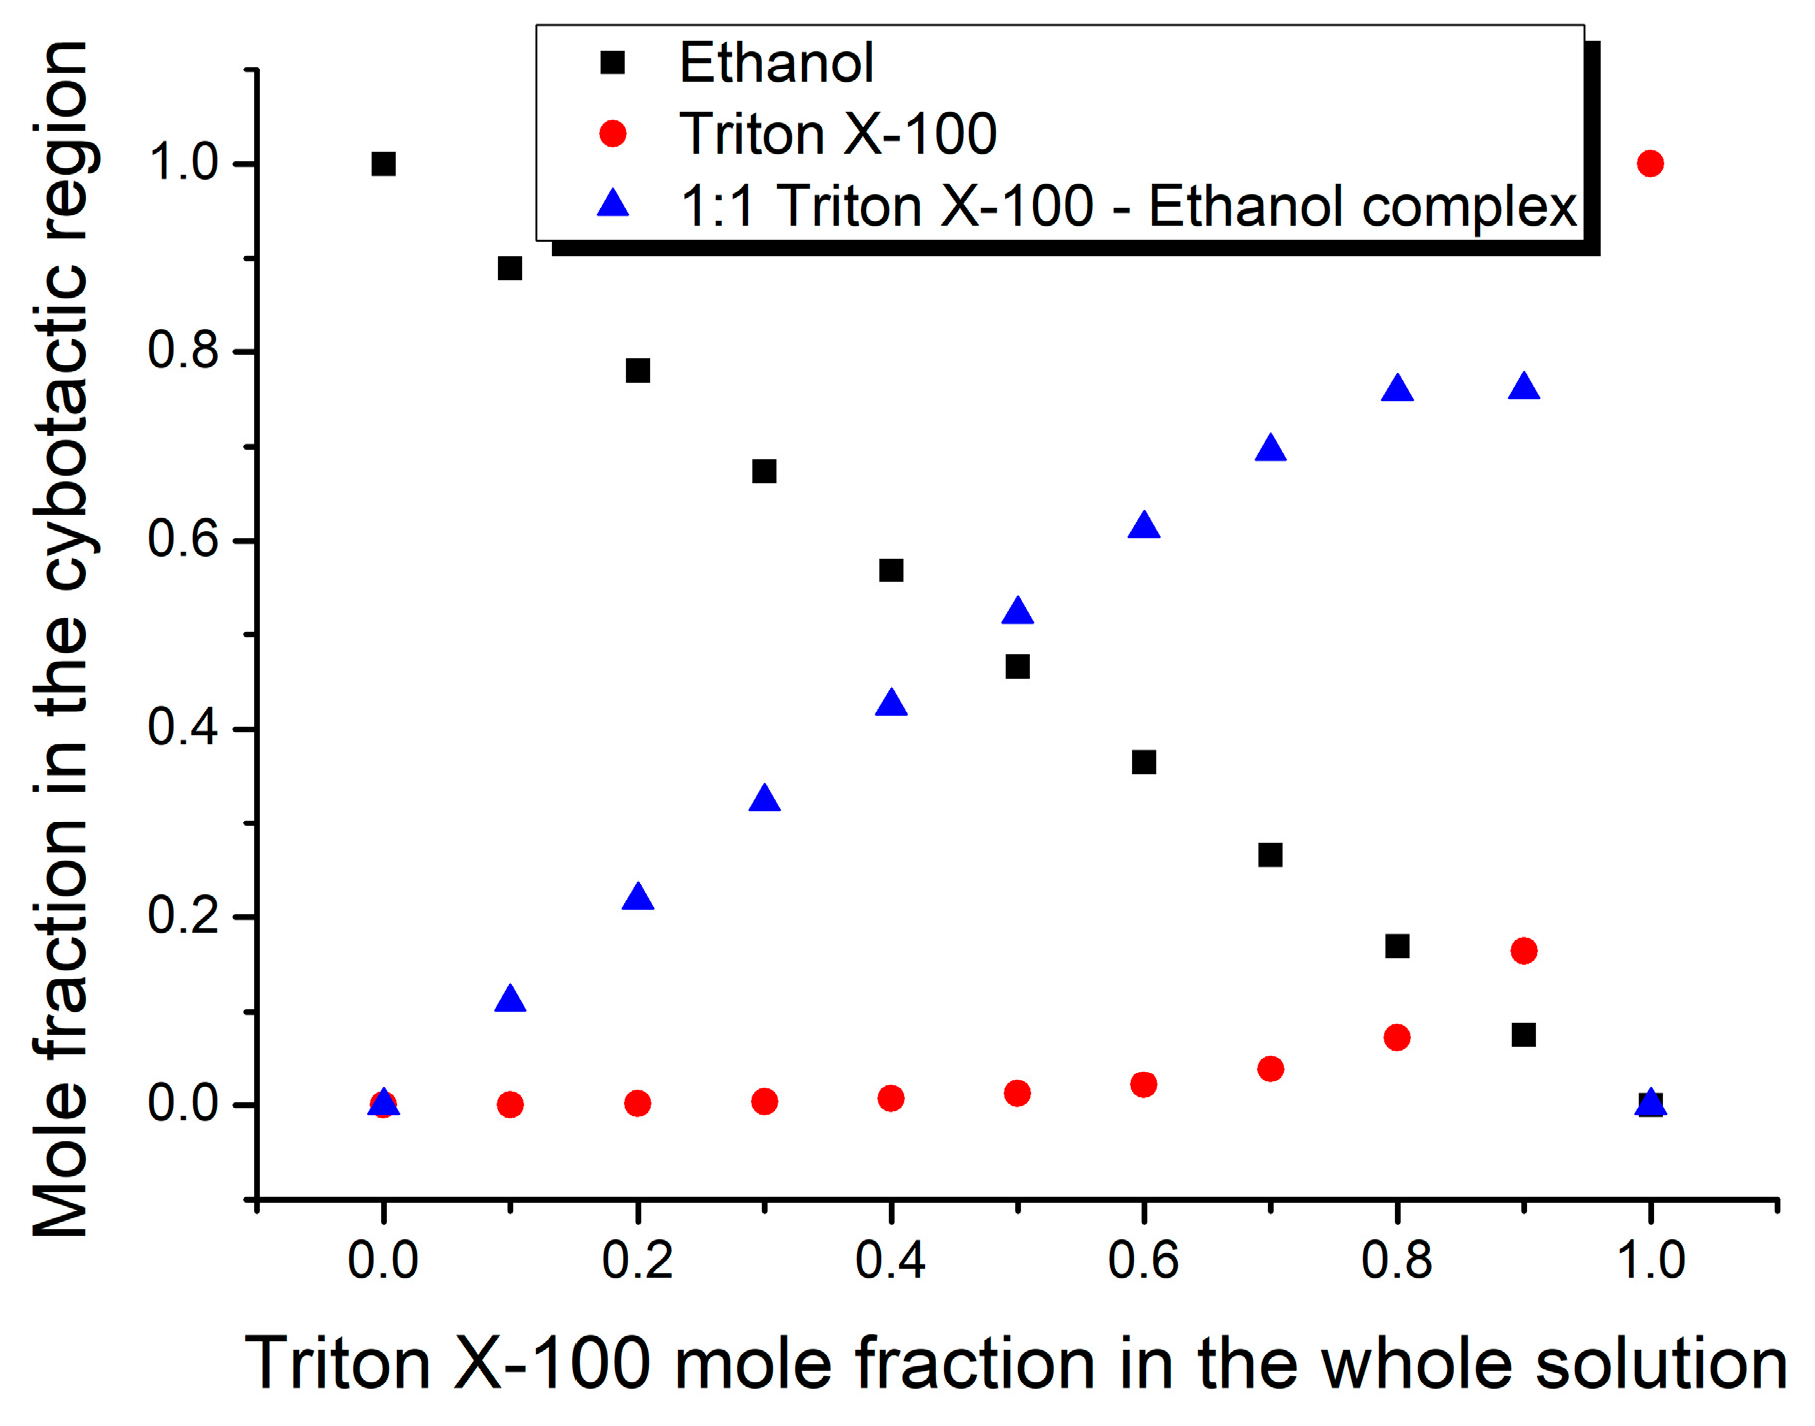
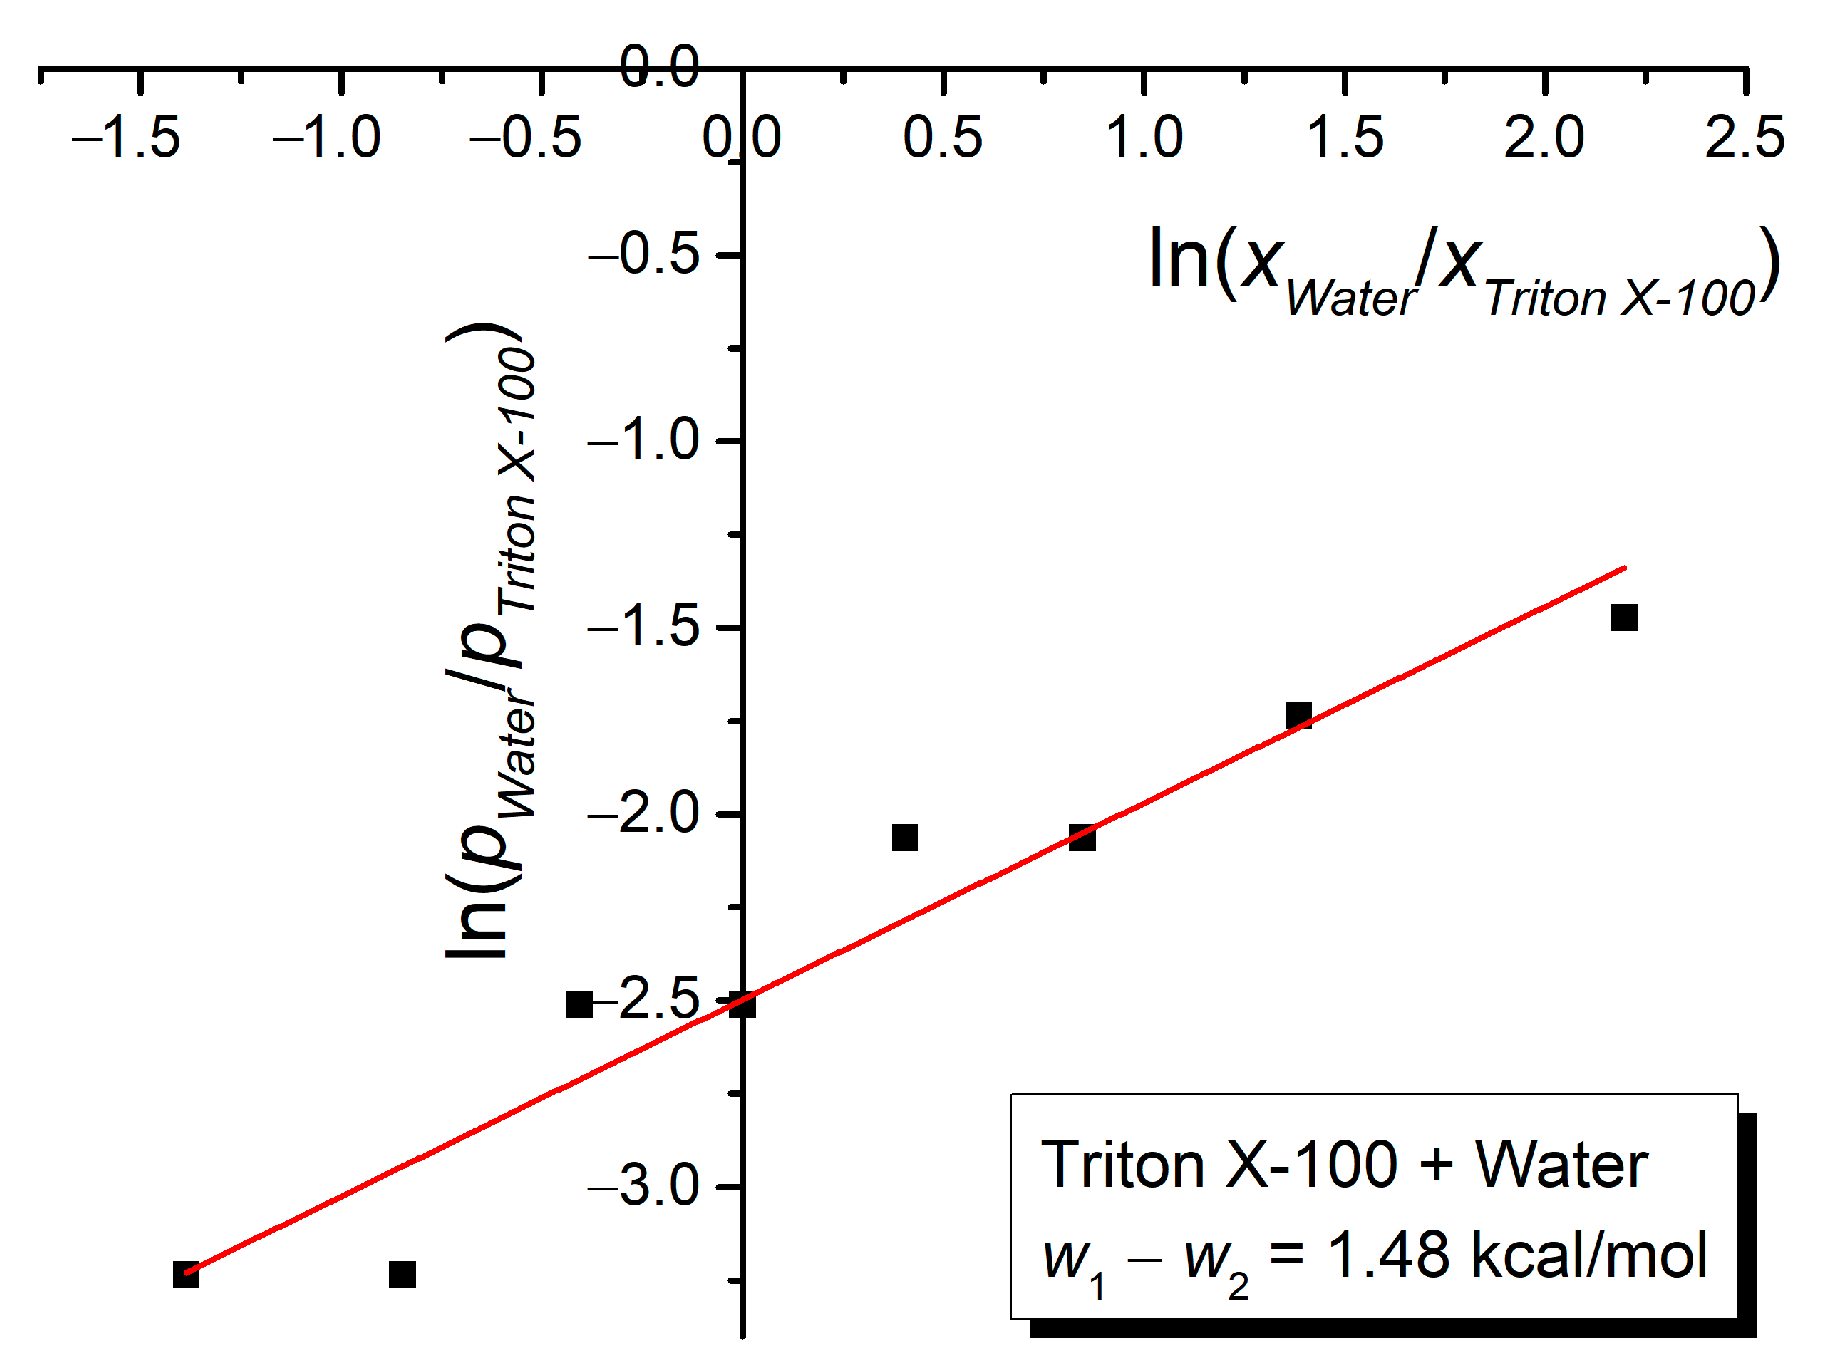
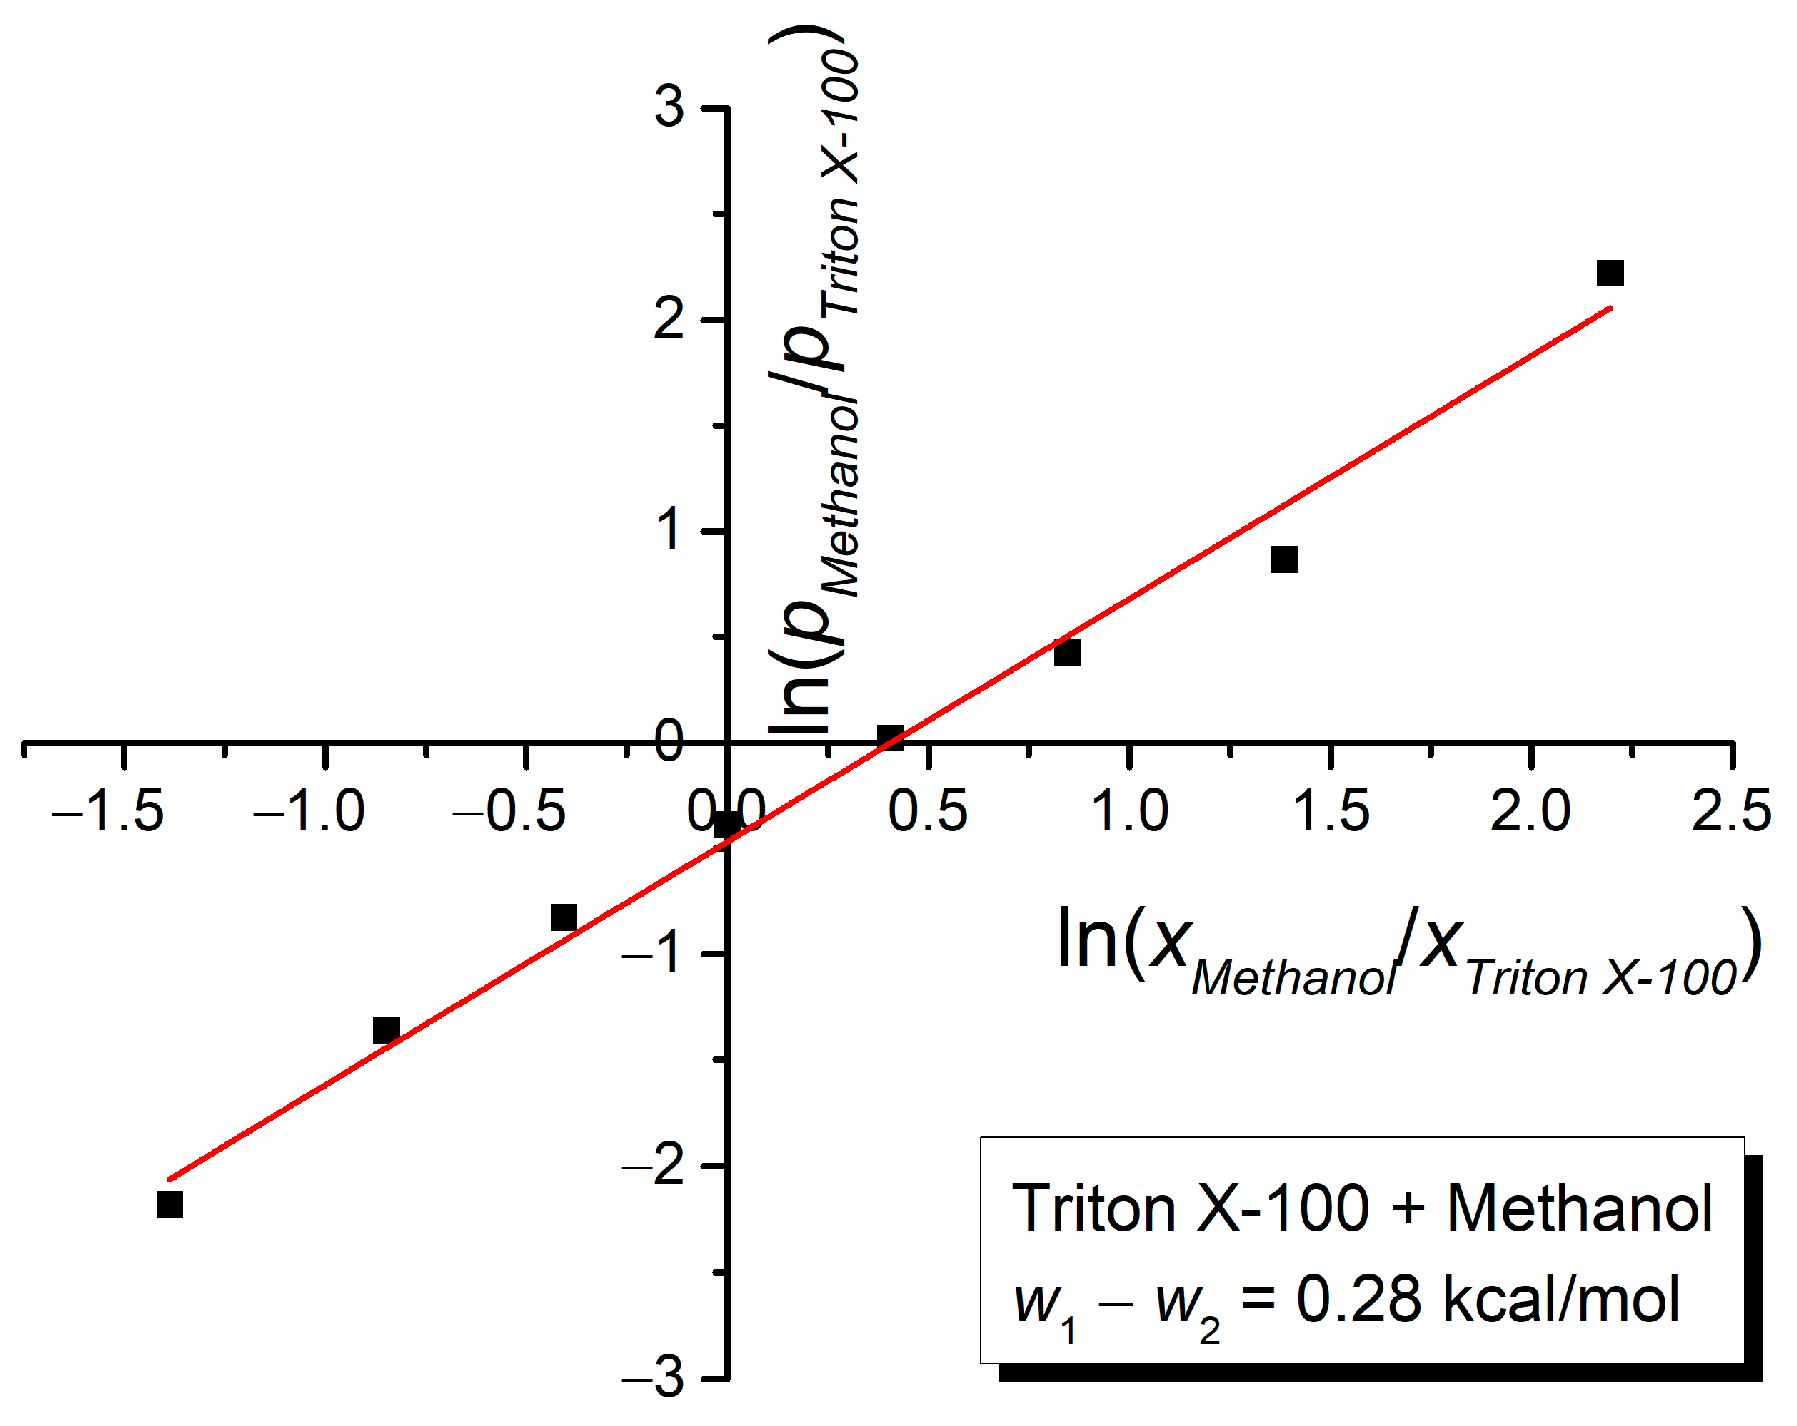
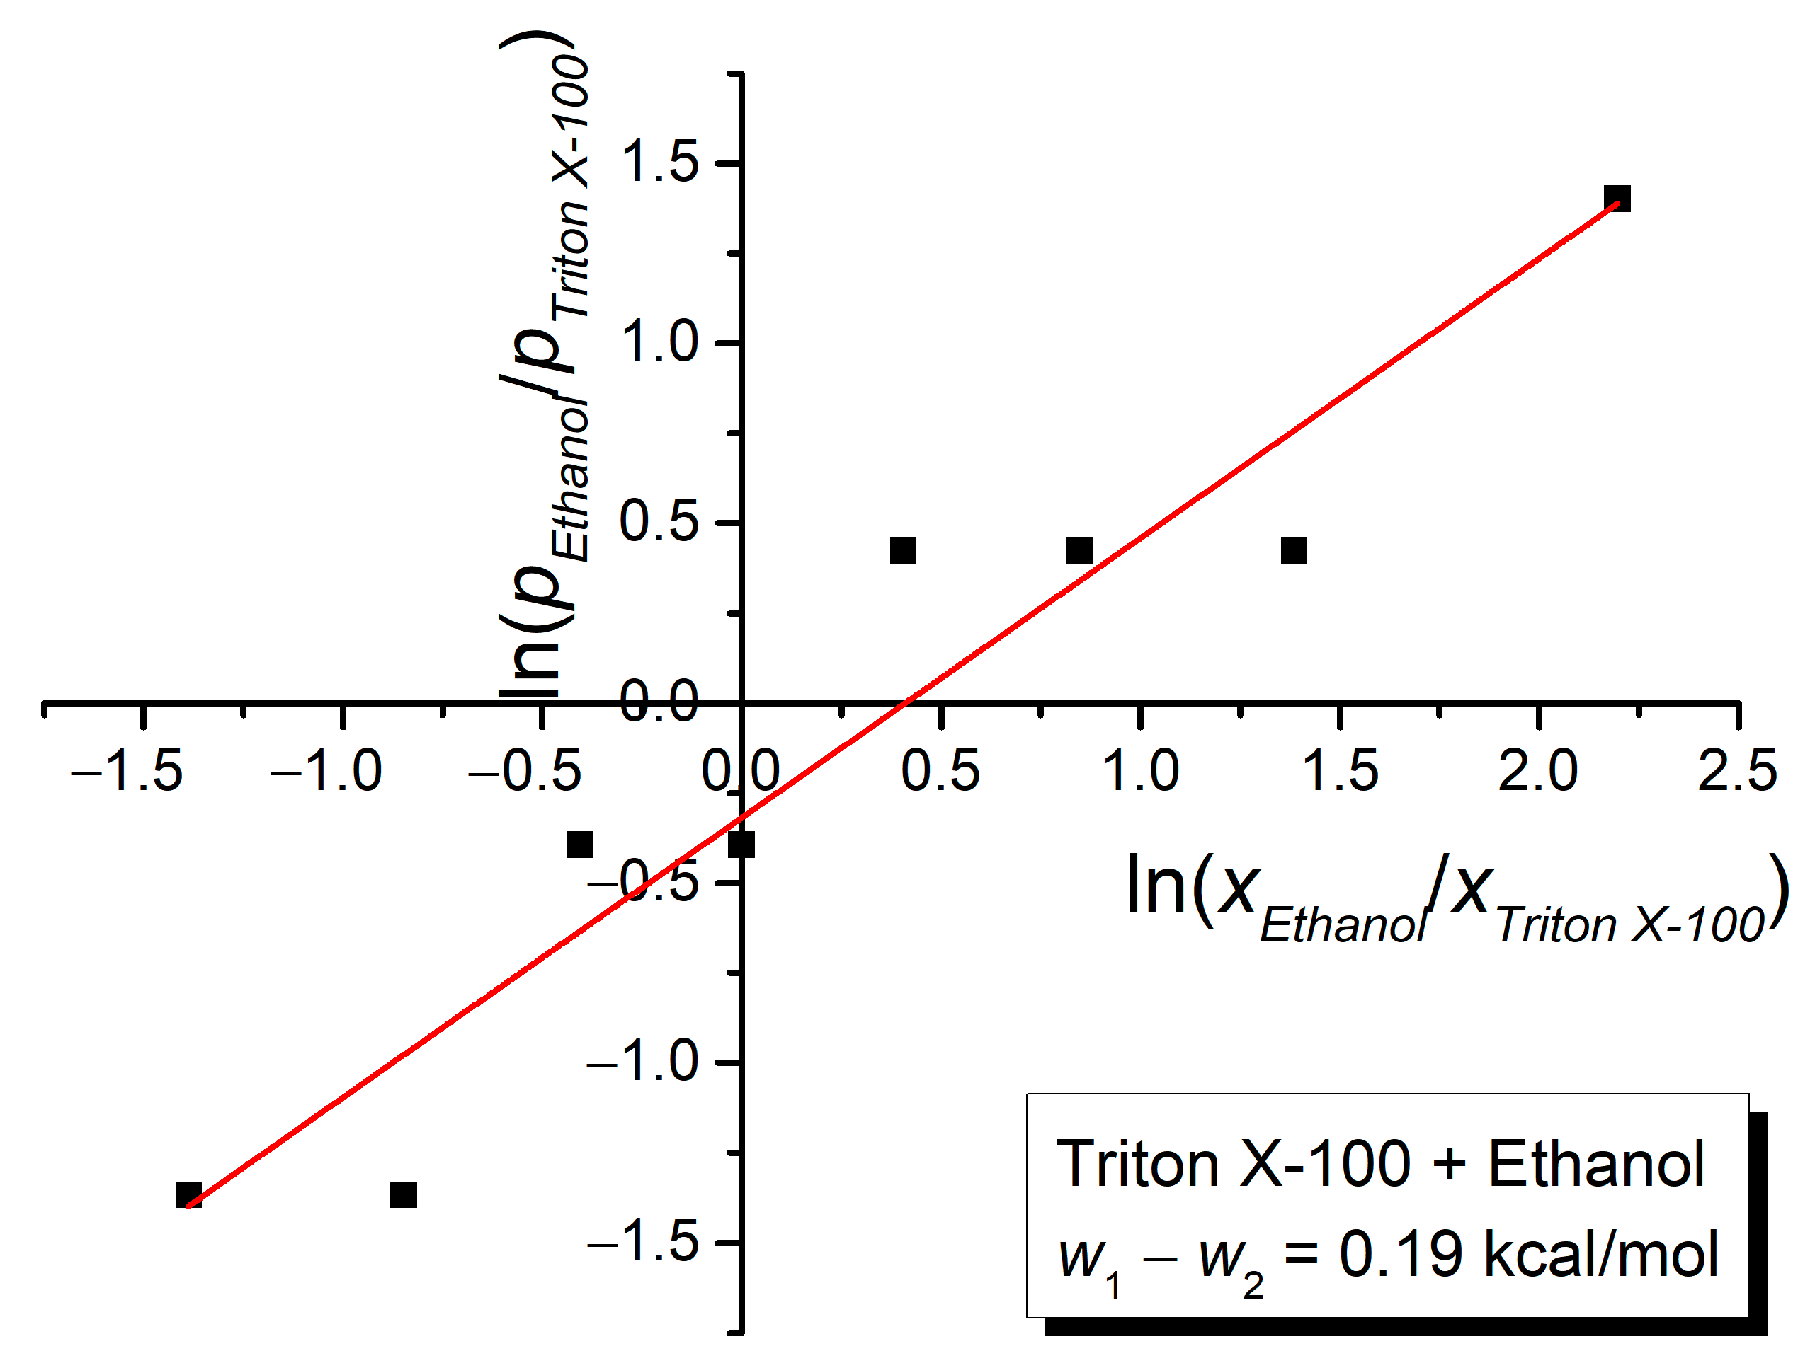
3. Results and Discussion

The spectra of methyl red dissolved in the binary solvent mixtures Triton X-100/water, Triton X-100/methanol, Triton X-100/ethanol, and Triton X-100/1-propanol were recorded for different ratios between the mole fractions of the solvents composing the mixtures. Figure 3 and Figure 4 show two examples of methyl red’s electronic absorption spectral bands, recorded in each of the five used solvents (Figure 3), respectively, in the four used binary mixtures, for equal mole ratios between the two solvents (Figure 4).
Two spectral bands can be distinguished in the visible range of the spectra from Figure 3 and Figure 4, one with a maximum corresponding to around 410 nm and another one with a maximum corresponding to around 490 nm. These bands correspond to the acid–base resonance forms of methyl red, schematically shown in Figure 5 (see also [89,90,91]). The first band corresponds to the base form of methyl red [92], and it is predominantly in the presence of Triton X-100 and water, respectively (see Figure 3), while the second band corresponds to its acid form, being predominantly in the presence of alcohols (Figure 3). In the case of the mixtures, the presence of Triton X-100 determines a decrease in the second band amplitude, with the first spectral band remaining predominant (Figure 4). This happens because the Triton X-100 molecule has a rather high HBA (hydrogen bonding acceptor) count of 6, being able to make hydrogen bonds with the protons of the alcohols’ hydroxylic group. Methyl red has an HBA count of 4 and an HBD (hydrogen bonding donor) count of 1, also being involved in hydrogen bonding with the molecules of solvents, as schematically shown in Figure 6. However, neither Triton X-100 molecules nor water/alcohol molecules can exclusively solvate methyl red. Consequently, concerted interactions among all molecules must be considered, as described in [93]. An example of such possible concerted interactions is shown in Figure 7.
To estimate the contribution of each type of intermolecular interaction to the total spectral shift of the electronic absorption spectral band on methyl red, the Kamlet–Abboud–Taft model was approached. Table 1, Table 2, Table 3 and Table 4 show the parameters involved in Equation (1), as well as the wavenumbers corresponding to the maximum of the electronic absorption spectral band of methyl red for the studied binary solvent mixtures.
The coefficients C1C3 from Equation (1) were obtained by applying multiple linear regression to the data in Table 1, Table 2, Table 3 and Table 4. Fisher’s test of significance [94] was applied to the multiple linear regression data and the results are given in Table 5, Table 6, Table 7 and Table 8.
The highest F value was obtained for the multiple linear regression function of all parameters for the binary solvent Triton X-100 + methanol. In the case of the binary solvents Triton X-100 + water and Triton X-100 + ethanol, the highest F values were obtained for the multiple linear regression function of only π* and α, so that the term C2β can be neglected. For the binary solvent Triton X-100 + 1-propanol, the highest F value was obtained for the multiple linear regression of β and α, while the term C1π* can be neglected. The next equations give the results for the binary solvents investigated:
ν ¯ T + W = 26 , 113.36782 1434.42074 π * 933.5958 α ,
ν ¯ T + M = 24 , 972.13348 649.93719 π * + 763.61986 β 1002.43939 α ,
ν ¯ T + E = 25 , 240.40436 569.06789 π * 590.24541 α ,
ν ¯ W + P = 24 , 604.19756 + 208.01557 β 594.72577 α .
The contributions of each type of intermolecular interaction (in cm−1 and %) to the total spectral shift ( ν ¯ ν ¯ 0 ) of the electronic absorption spectral band of Triton X-100 are listed in Table 9, Table 10, Table 11 and Table 12 and shown in Figure 8, Figure 9, Figure 10 and Figure 11, respectively. The calculated wavenumbers corresponding to the maximum of the electronic absorption spectral band according to Equations (13)–(16) are also listed in Table 9, Table 10, Table 11 and Table 12, respectively, and the correlations between the calculated and the experimental wavenumbers corresponding to the maximum of the electronic absorption spectral band are illustrated in Figure 12, Figure 13, Figure 14 and Figure 15, respectively.
The non-specific interactions (described by the term C1π*) are dominant in the binary mixtures Triton X-100 + water, Triton X-100 + ethanol (except the binary solution of methyl red in ethanol, corresponding to the null value of the Triton X-100 mole fraction), and Triton X-100 + methanol above the value of the Triton X-100 mole fraction equal to 0.4. However, in the case of the binary mixture Triton X-100 + 1-propanol, the contribution of the non-specific interactions can be neglected. Also, the contribution of the non-specific interactions increases with the increase in the Triton X-100 mole fraction.
The contribution of the specific interactions of the type of hydrogen bond acceptor (described by the term C2β) can be neglected for the binary mixtures Triton X-100 + water and Triton X-100 + ethanol, while for the other two binary mixtures, it slowly increases with the increase in the Triton X-100 mole fraction.
The contribution of the specific interactions of the type of hydrogen bond donor (described by the term C3α) is important, being present in all investigated binary mixtures. It is dominant in the case of binary mixtures Triton X-100 + 1-propanol and Triton X-100 + methanol up to the value 0.3 of the Triton X-100 mole fraction. The contribution of this type of interaction generally decreases with the increase in the Triton X-100 mole fraction.
The Kamlet–Abboud–Taft model gives very good correlations between the calculated and experimental values of the wavenumbers corresponding to the maximum of the electronic absorption spectral band of methyl red for all investigated binary mixtures, the values of the slope and Adj. R-Square being close to 1, respectively (see Figure 12, Figure 13, Figure 14 and Figure 15).
To estimate the composition of the cybotactic region (first solvation shell) of the solute’s molecule, three models were applied: the statistical cell model of ternary solutions [74], the Suppan model [75], and the Bosch–Rosés model [76,77,78,79]. The comparative results obtained by approaching these models are shown in Figure 16, Figure 17, Figure 18 and Figure 19.
As a first observation in the above figures, Triton X-100 behaves as the active solvent (its molecules interact more strongly with the methyl red molecule by comparison with the other solvent molecules) in all investigated binary mixtures, its mole fractions in the cybotactic region of the methyl red molecules being higher than the corresponding ones in the whole solutions.
Generally, there is a good agreement between the estimations made by the three models. For the binary mixture Triton X-100 + water, the Bosch–Rosés model slightly underestimates the mole fractions of Triton X-100 in the cybotactic region of the solute’s molecule, while for the binary mixture Triton X-100 + methanol, the same model slightly overestimates it.
The Bosch–Rosés model considers the formation of the 1:1 complex between the two solvents’ molecules. Figure 20, Figure 21, Figure 22 and Figure 23 show the composition of the cybotactic region of the methyl red molecule, as estimated by this model.
Important information on the symmetry/asymmetry related to the binary mixtures of solvents in the cybotactic region of the solute’s molecules can be extracted from the above Figure 20, Figure 21, Figure 22 and Figure 23. Thus, a very interesting behavior can be observed in Figure 20 and Figure 22, where the molecules of Triton X-100 from the cybotactic region are almost totally replaced with the molecules’ complex. This determines a strong asymmetry of the variation curves of the two solvents’ mole fractions in the cybotactic region of the solute’s molecule with an increasing Triton X-100 mole fraction in the whole solution. On the other hand, for the binary mixtures Triton X-100 + methanol and Triton X-100 + 1-propanol, in Figure 21 and Figure 23, a symmetry can be observed between the variation curves of the two solvents’ mole fractions in the cybotactic region of the solute molecules, the mole fractions of the 1:1 complex reaching maximum values around the value 0.5 of the Triton X-100 mole fraction in the whole solution. It seems that the presence of the specific intermolecular interactions of the type of hydrogen bond acceptor (see Figure 8, Figure 9, Figure 10 and Figure 11) is important for the symmetry of the two solvents’ mole fractions in the cybotactic region of the solute’s molecule. Further investigation is necessary in this direction.
By the linear regression of Equation (4), the statistical cell model allows the estimation of the difference of w2w1 between the interaction energies in pairs of molecules of the type of solute–solvent 1 and solute–solvent 2, respectively. Figure 24, Figure 25, Figure 26 and Figure 27 show the dependences ln(p1/p2) versus ln(x1/x2), according to Equation (4).
For all investigated binary mixtures of Triton X-100, the difference w1w2 is positive, meaning that Triton X-100 molecules interact with methyl red molecules more strongly than water, methanol, ethanol, and 1-propanol molecules, respectively. This confirms the previous results obtained from the Bosch–Rosés model (Figure 16, Figure 17, Figure 18 and Figure 19) that Triton X-100 is the active solvent in the investigated binary mixtures. For the binary mixture Triton X-100 + water, the value w1w2 = 1.48 kcal/mol is higher than the lowest value of the hydrogen bond energy (considered to be 1 kcal/mol).

4. Conclusions

Binary solvent mixtures of Triton X-100 with water, methanol, ethanol, and 1-propanol, respectively, were comprehensively investigated by solvatochromism.
The contributions of each type of intermolecular interaction to the total spectral shift of the solute’s electronic absorption spectral bands were estimated by the Kamlet–Abboud–Taft linear solvation energy relationships model, finding a very good correlation between the calculated and the experimental values of the wavenumber corresponding to the maximum of the electronic absorption spectral band of the solute.
Three theoretical models (the statistical cell model, Suppan model, and Bosch–Rosés model) were utilized for the analysis of the experimental data. A good correlation was found between the estimations of the solute molecule’s cybotactic region made by these models. Triton X-100 was found to be the active solvent in all binary mixtures investigated.
The Bosch–Rosés model establishes that the mole fraction of the 1:1 complex formed by the molecules of the solvents has important values in the cybotactic region of the solute’s molecule. A strong asymmetry was found for the binary mixtures Triton X-100 + water and Triton X-100 + ethanol in the cybotactic region of the solute’s molecule, the molecules of Triton X-100 being almost completely replaced by the 1:1 complex formed by the two solvent molecules. For the binary mixtures Triton X-100 + methanol and Triton X-100 + 1-propanol, symmetric compositions were observed in the cybotactic region of the solute’s molecule.
Further investigations of the behavior of Triton X-100 in solvent mixtures are necessary to increase the knowledge of this compound and to develop new applications.

Author Contributions

Conceptualization, D.O.D. and D.-G.D.; methodology, E.A. and D.-G.D.; software, E.A., A.Z. and D.-G.D.; validation, E.A., A.Z. and D.-G.D.; formal analysis, E.A., A.Z. and D.-G.D.; investigation, E.A., A.Z. and D.-G.D.; resources, D.O.D. and D.-G.D.; data curation, E.A. and D.-G.D.; writing—original draft preparation, D.-G.D.; writing—review and editing, D.O.D. and D.-G.D.; visualization, E.A. and A.Z.; supervision, D.O.D. and D.-G.D.; project administration, D.O.D. and D.-G.D. All authors have read and agreed to the published version of the manuscript.

Funding

This research received no external funding.

Data Availability Statement

The data presented in this study are available upon reasonable request to the corresponding author.

Conflicts of Interest

The authors declare no conflicts of interest.

References

  1. Zana, R. Aqueous surfactant-alcohol systems: A review. Adv. Colloid Interface Sci. 1995, 57, 1–64. [Google Scholar] [CrossRef]
  2. Zhong, X.; Chen, L.; Xu, J.; Cheng, K.; Wu, B. Two-photon and three photon fluorescence of Triton X-100 in the ultraviolet region. J. Fluoresc. 2021, 31, 1779–1785. [Google Scholar] [CrossRef] [PubMed]
  3. Fedyaeva, O.A.; Poshelyuzhnaya, E.G. Optical activity of Triton X-100 micelles in aqueous solutions. Russ. J. Phys. Chem A 2020, 94, 1957–1958. [Google Scholar] [CrossRef]
  4. Robson, R.J.; Dennis, E.A. The size, shape, and hydration of nonionic surfactant micelles. Triton X-100. J. Phys. Chem. 1977, 81, 1075–1078. [Google Scholar] [CrossRef]
  5. Qin, Y.; Zhou, Y.; Wang, K.; Gu, J.; Xiong, Z.; Zhang, W.; Chen, Y. In situ isolation of nuclei or nuclear proteins from adherent cells: A simple, effective method with less cytoplasmic contamination. Biol. Res. 2023, 56, 18. [Google Scholar] [CrossRef] [PubMed]
  6. Ma, J.; Su, C.; Hu, S.; Chen, Y.; Shu, Y.; Yue, D.; Zhang, B.; Qi, Z.; Li, S.; Wang, X.; et al. The effect of residual Triton X-100 on structural stability and infection activity of adenovirus particles. Mol. Ther. Methods Clin. Dev. 2020, 19, 35–46. [Google Scholar] [CrossRef]
  7. Shahraki, S.; Bideskan, A.E.; Aslzare, M.; Tavakkoli, M.; Bahrami, A.R.; Hosseinian, S.; Matin, M.M.; Rad, A.K. Decellularization with Triton X-100 provides a suitable model for human kidney bioengineering using human mesenchymal stem cells. Life Sci. 2022, 295, 120167. [Google Scholar] [CrossRef] [PubMed]
  8. Fan, X.; Zhao, X.; Su, W.; Tang, X. Triton X-100 modified ATP-responsive siRNA delivery agent for antitumor therapy. Mol. Pharm. 2021, 17, 3696–3708. [Google Scholar] [CrossRef]
  9. Mavani, A.; Ray, D.; Aswal, V.K.; Bhattacharyya, J. Application of drug aggregation to solubilize antimicrobial compound and enhancing its bioavailability. Appl. Biochem. Biotechnol. 2023, 195, 3206–3216. [Google Scholar] [CrossRef]
  10. Maya, S.A.; Shumon, M.A.H.; Islam, M.R.; Khan, J.M.; Khan, S.A.; Rana, S.; Hoque, M.A.; Rahman, M.M. Investigation of the impact of several diols on the phase behavior and physico-chemical quantities associated with the Triton X-100 and antidiabetic drug mixture. J. Indian Chem. Soc. 2024, 101, 101295. [Google Scholar] [CrossRef]
  11. Siposova, K.; Sedlak, E.; Kozar, T.; Nemergut, M.; Musatov, A. Dual effect of non-ionic detergent Triton X-100 on insulin amyloid formation. Colloids Surf. B Biointerfaces 2019, 173, 709–718. [Google Scholar] [CrossRef] [PubMed]
  12. Abdelfattah, A.; Samir, R.; Amin, H.M. Production of highly immunogenic and safe Triton X-100 produced bacterial ghost vaccine against Shigella flexneri 2b serotype. Gut Pathog. 2023, 15, 41. [Google Scholar] [CrossRef] [PubMed]
  13. Colavita, F.; Quartu, S.; Lalle, E.; Bordi, L.; Lapa, D.; Meschi, S.; Vulcano, A.; Toffoletti, A.; Bordi, E.; Paglia, M.G.; et al. Evaluation of inactivation effect of Triton X-100 on Ebola virus infectivity. J. Clin. Virol. 2017, 86, 27–30. [Google Scholar] [CrossRef] [PubMed]
  14. Chong, R.; Rho, J.-E.R.; Yoon, H.-J.; Park, P.S.; Rho, T.-H.D.; Park, J.Y.; Park, L.; Kim, Y.-H.; Lee, J.H. Role of Triton X-100 in chemiluminescent enzyme immunoassays capable of diagnosing genetic disorders. Talanta 2013, 116, 403–408. [Google Scholar] [CrossRef] [PubMed]
  15. Unver, Y.; Yildiz, S.; Acar, M. Extracellular production of azurin from Pseudomonas aeruginosa in the presence of Triton X-100 or Tween 80. Bioprocess Biosyst. Eng. 2022, 45, 553–561. [Google Scholar] [CrossRef] [PubMed]
  16. Chakraborty, J.; Roy, S.; Pandey, P.; Mohanty, S.; Tandon, R.; Ghosh, S. Macrophage plasticity and differentiation on the decellularized human cornea. J. Mater. Res. 2023, 38, 4625–4640. [Google Scholar] [CrossRef]
  17. Asgari, F.; Asgari, H.R.; Najafi, M.; Eftekhari, B.S.; Vardiani, M.; Gholipourmalekabadi, M.; Koruji, M. Optimization of decellularized human placental macroporous scaffolds for spermatogonial stem cells homing. J. Mater. Sci. Mater. Med. 2021, 32, 47. [Google Scholar] [CrossRef] [PubMed]
  18. Zhang, J.; Jiang, D.; Zhang, J.; Lin, Q.; Huang, Z. Synthesis of organized hydroxyapatite (HA) using triton X-100. Ceram. Int. 2010, 36, 2441–2447. [Google Scholar] [CrossRef]
  19. Liu, P.; Luo, Y.; Liu, R.; Fan, W.; Fan, B. Triton X-100 enhanced antibacterial effect of photodynamic therapy against Enterococcus faecalis infection: An in vitro study. Colloids Surf. B Biointerfaces 2024, 240, 113978. [Google Scholar] [CrossRef]
  20. Muthusamy, P.; Antony, S.A.; Palani, G.; Saravanan, D.; Chithambaram, V. Synergistic in vitro antimicrobial activity of caffeine/AgNPs-triton X-100. Appl. Phys. A 2023, 129, 611. [Google Scholar] [CrossRef]
  21. Duan, M.; Sun, Q.; Fan, W.; Fan, B. Enhanced antibacterial effect against Enterococcus faecalis by silver ions plus Triton X-100 with low concentrations and cytotoxicity. Braz. J. Microbiol. 2022, 53, 161–169. [Google Scholar] [CrossRef] [PubMed]
  22. Rajabathar, J.R.; Arunachalam, P.; Al-Lohedan, H.A.; Thankappan, R.; Appaturi, J.N.; Pulingam, T.; Dahan, W.M. Polymer surfactant (Triton-100) assisted low cost method for preparing silver and graphene oxide modified Bi-MnOx nanocomposite for enhanced sensor and anti-microbial health care applications. J. Sol-Gel Sci. Technol. 2021, 97, 638–650. [Google Scholar] [CrossRef]
  23. Hristozova, A.D.; Simitchiev, K.K.; Kmetov, V.J.; Rosenberg, E. Compatibility of cloud point extraction with gas chromatography: Matrix effects of Triton X-100 on GC-MS and GC-MS/MS analysis of organochlorine and organophosphorus pesticides. Talanta 2024, 269, 125445. [Google Scholar] [CrossRef] [PubMed]
  24. Yurchenko, O.I.; Cherozhuk, T.V.; Kravchenko, O.A.; Baklanov, O.M. Determination of Zn, Mn, and Cd in strata water. J. Water Chem. Technol. 2022, 44, 26–30. [Google Scholar] [CrossRef]
  25. Yu, Q.; Mou, X.; Guo, L.; Chen, Z.; Lin, R.; Ding, Y. Triton X-100-directed synthesis of carbon nitride and nitrogen-doped carbon for ethylene dichloride dehydrochlorination. Carbon 2022, 196, 110–119. [Google Scholar] [CrossRef]
  26. Reddy, N.B.; Sundar, C.S.; Rani, C.R.; Rao, K.U.M.; Nayak, S.K.; Reddy, C.S. Triton X-100 catalyzed synthesis of α-aminophosphonates. Arab. J. Chem. 2016, 9, S685–S690. [Google Scholar] [CrossRef]
  27. Babbar, N.; Sharma, G.; Arya, S.K. Effective degradation of chicken feather waste by keratinase enzyme with Triton X-100 additive. Biocatal. Agric. Biotechnol. 2022, 44, 102447. [Google Scholar] [CrossRef]
  28. Wang, G.-L.; Din, A.U.; Qiu, Y.-S.; Wang, C.-L.; Wang, D.-H.; Wei, G.-Y. Triton X-100 improves co-production of β-1,3-D-glucan and pullulan by Aureobasidium pullulans. Appl. Microbiol. Biotechnol. 2020, 104, 10685–10696. [Google Scholar] [CrossRef] [PubMed]
  29. Trinh, T.H.T.; Kim, J.; Lee, C.-H.; Ryou, C. Non-ionic detergents Nonidet P-40 and Triton X-100 increase enzymatic activity of plasmin. Biochem. Biophys. Res. Commun. 2019, 512, 314–318. [Google Scholar] [CrossRef] [PubMed]
  30. Duan, X.; Zou, C.; Wu, J. Triton X-100 enhances the solubility and secretion ratio of aggregation-prone pullulanase produced in Escherichia coli. Bioresour. Technol. 2015, 194, 137–143. [Google Scholar] [CrossRef]
  31. Zheng, K.; Xia, W.; Wang, R.; Li, Y.; Zhang, W. Synergistic effect of Triton X-100 and kerosene on the flotation removal of unburned carbon from fly ash. Colloids Surf. A Physicochem. Eng. Asp. 2021, 622, 126668. [Google Scholar] [CrossRef]
  32. de Oliveira, A.E.; Ahuiar, M.L.; Guerra, V.G. Improved filter media with PVA/citric acid/Triton X-100 nanofibers for filtration of nanoparticles from air. Polym. Bull. 2021, 78, 6387–6408. [Google Scholar] [CrossRef]
  33. Feng, Y.; Tao, Y.; Qu, J.; Zhang, Y. Remediation of PAHs-contaminated soil by coupling Triton X-100 assisted washing and BiOBr/g-C3N4 photocatalytic process: Insights to the degradation mechanism and soil washing recycling. Chem. Eng. J. 2024, 497, 154285. [Google Scholar] [CrossRef]
  34. Shen, W.; Xu, J.; Zhu, L. Triton X-100 improves the reactivity and selectivity of sulfidized nanoscale zerovalent iron toward tetrabromobisphenol A: Implications for groundwater and soil remediation. J. Hazard. Mater. 2021, 416, 126119. [Google Scholar] [CrossRef] [PubMed]
  35. Du, C.; Huang, H.; Yi, F.; Wang, M.; Cheng, C.W. Inhibitory effect of calcium carbonate precipitation induced by Triton X-100 and microorganisms on coal dust. Constr. Build. Mater. 2024, 444, 137887. [Google Scholar] [CrossRef]
  36. Mahdi, W.A.; Hussain, A.; Bukhari, S.I.; Alshehri, S.; Singh, B.; Ali, N. Removal of clarithromycin from aqueous solution using water/Triton X-100/ethanol/olive oil green nanoemulsion method. J. Water Process Eng. 2021, 40, 101973. [Google Scholar] [CrossRef]
  37. Steevensz, A.; Madur, S.; Feng, W.; Taylor, K.E.; Bewtra, J.K.; Biswas, N. Crude soybean hull peroxidase treatment of phenol in synthetic and real wastewater: Enzyme economy enhanced by Triton X-100. Enzyme Microb. Technol. 2014, 55, 65–71. [Google Scholar] [CrossRef] [PubMed]
  38. Benderrag, A.; Haddou, B.; Daaou, M.; Benkhedja, H.; Bounaceur, B.; Kameche, M. Experimental and modeling studies on Cd (II) ions extraction by emulsion liquid membrane using Triton X-100 as biodegradable surfactant. J. Environ. Chem. Eng. 2019, 7, 103166. [Google Scholar] [CrossRef]
  39. Suwanchawalit, C.; Buddee, S.; Wongnawa, S. Triton X-100 induced cuboid-like BiVO4 microsphere with high photocatalytic performance. J. Environ. Sci. 2017, 55, 257–265. [Google Scholar] [CrossRef] [PubMed]
  40. Chen, X.; Gao, X.; Ai, L.; Fan, H. Triton X-100-assisted synthesis of layered nanosheet-assembled flower-like BiOBr nanostructures with enhanced visible-light photocatalytic degradation of ciprofloxacin. J. Nanopart. Res. 2022, 24, 103. [Google Scholar] [CrossRef]
  41. Cong, R.P.; Guo, Y.H.; Zhou, J.Q.; Wang, J.W. Effect of Triton X-100 on Shiraia laccase production and its application in triclosan biodegradation. Sustain. Chem. Pharm. 2023, 35, 101209. [Google Scholar] [CrossRef]
  42. Dave, B.P.; Ghevariya, C.M.; Bhatt, J.K.; Dudhagara, D.R.; Rajpara, R.K. Enhanced biodegradation of total polycyclic aromatic hydrocarbons (TPAHs) by marine halotolerant Achromobacter xylosoxidans using Triton X-100 and β-cyclodextrin—A microcosm approach. Mar. Pollut. Bull. 2014, 79, 123–129. [Google Scholar] [CrossRef]
  43. Soares, M.E.; Araujo, A.J.; Silva, F.S.; Silva, M.R.A.; Barbosa, N.V. Regeneration of transformer oil using a microemulsion with Triton X-100. Braz. J. Chem. Eng. 2023, 40, 901–911. [Google Scholar] [CrossRef]
  44. Sardar, R.H.; Bera, A.; Chattopadhyay, S.; Mahato, J.C.; Sarraf, S.; Basu, A.K. Effect of dopants in the HTL layer on photovoltaic properties in hybrid perovskite solar cells. J. Mater. Sci. Mater. Electron. 2023, 34, 2138. [Google Scholar] [CrossRef]
  45. Rahman, M.F.; Hossain, J.; Kuddus, A.; Moon, M.M.A.; Ismail, A.B.M. Effect of Triton X-100 surfactant on thiol-amine cosolvents assisted facile synthesized CdS thin films on glass substrate by spin coating method. SN Appl. Sci. 2020, 2, 590. [Google Scholar] [CrossRef]
  46. Jung, Y.-S.; Yoo, B.; Lim, M.K.; Lee, S.Y.; Kim, K.-J. Effect of Triton X-100 in water-added electrolytes on the performance of dye-sensitized solar cells. Electrochim. Acta 2009, 54, 6286–6291. [Google Scholar] [CrossRef]
  47. Yeoh, C.H.; Chua, C.L.; Woon, K.L. Effects of nanoscale surface modification and triplet energy shielding of a single layer solution processed blue phosphorescent organic light emitting diode by using Triton X-100. Synth. Met. 2013, 172, 44–48. [Google Scholar] [CrossRef]
  48. Shinde, S.K.; Fulari, V.J.; Kim, D.-Y.; Maile, N.C.; Koli, R.R.; Dhaygude, H.D.; Ghodake, G.S. Chemical synthesis of flower-like hybrid Cu(OH)2/CuO electrode: Application of polyvinyl alcohol and Triton X-100 to enhance supercapacitor performance. Colloids Surf. B Biointerfaces 2017, 156, 165–174. [Google Scholar] [CrossRef] [PubMed]
  49. Dissanayake, S.M.B.; Wimalasena, I.G.K.J.; Keppetipola, N.M.; Karunarathne, B.C.; Madagedara, A.D.T.; Cojocaru, L.; Uchida, S.; Rajapakse, R.M.G.; Tennakone, K.; Yoshimura, M.; et al. Effect of Triton X-100 surfactant concentration on the wettability of polyethylene-based separators used in supercapacitors. J. Sci. Adv. Mater. Devices 2024, 9, 100801. [Google Scholar] [CrossRef]
  50. Tevi, T.; Birch, S.W.S.; Thomas, S.W.; Takshi, A. Effect of Triton X-100 on the double layer capacitance and conductivity of poly(3,4-ethylenedioxythiophene):poly(styrenesulfonate) (PEDOT:PSS) films. Synth. Met. 2014, 191, 59–65. [Google Scholar] [CrossRef]
  51. Iyyappan, E.; Wilson, P. Synthesis of nanoscale hydroxyapatite particles using Triton X-100 as an organic modifier. Ceram. Int. 2013, 39, 771–777. [Google Scholar] [CrossRef]
  52. Kimura, K.; Gibo, M.; Nerome, C.; Kura, T.; Ooshiro, S.; Tamaki, Y. Nanoparticle formation by laser ablation of perylene microcrystals in an aqueous solution of Triton X-100. Chem. Phys. Lett. 2018, 691, 271–275. [Google Scholar] [CrossRef]
  53. Ramakanth, I.; Kolenčík, M.; Rao, M.S.; Sunil, B.R.; Vijayasree, U.; Durgababu, G.; Devi, S.A.; Šebesta, M.; Siva, T. Tuning the morphology and state of aggregation of fullerene C60 using non-ionic surfactants. Colloid J. 2021, 83, 474–482. [Google Scholar] [CrossRef]
  54. Daniele, V.; Taglieri, G. Synthesis of Ca(OH)2 nanoparticles with the addition of Triton X-100. Protective treatments on natural stones: Preliminary results. J. Cult. Herit. 2012, 13, 40–46. [Google Scholar] [CrossRef]
  55. Memon, A.F.; Ameen, S.; Qambrani, N.; Buledi, J.A.; Khand, N.H.; Solangi, A.R.; Taqvi, S.I.H.; Karaman, C.; Karimi, F.; Afsharmanesh, E. An improved electrochemical sensor based on Triton X-100 functionalized SnO2 nanoparticles for ultrasensitive determination of cadmium. Chemosphere 2022, 300, 134634. [Google Scholar] [CrossRef] [PubMed]
  56. Yang, Y.; Zhang, G.; Song, L.; Kuang, G.; Ding, Y.; Bu, S.; Chai, Y.; Fu, Y. Ultra-sensitive electrochemiluminescence monitoring of microRNA via Triton X-100 functionalized carbon dots-based nanocomposites. Sens. Actuators B Chem. 2024, 405, 135314. [Google Scholar] [CrossRef]
  57. Fonseca, L.P.; Pedrini, L.F.K.; Lima, J.V.M.; Escaliante, L.C.; Santos, S.B.O.; Scalvi, L.V.A. Enhancement of surface properties of sol gel tin dioxide thin films with addition of surfactant in the precursor solution. Appl. Phys. A 2021, 127, 503. [Google Scholar] [CrossRef]
  58. Li, F.; Li, H.; Jiang, H.; Zhang, K.; Chang, K.; Jia, S.; Jiang, W.; Shang, Y.; Lu, W.; Deng, S.; et al. Polypyrrole nanoparticles fabricated via Triton X-100 micelles template approach and their acetone gas sensing property. Appl. Surf. Sci. 2013, 280, 212–218. [Google Scholar] [CrossRef]
  59. Mukdasai, K.; Mukdasai, S. The fabrication of in situ Triton X-100 on multi-walled carbon nanotubes modified gold electrode for sensitive determination of caffeine. Int. J. Electrochem. Sci. 2018, 13, 58–70. [Google Scholar] [CrossRef]
  60. Pandey, P.; Somers, A.E.; Hait, S.K.; Forsyth, M.; Ramakumar, S.S.V. Short chain imidazolium ionic liquids: Synthesis and oil miscibility in various base oil by use of surfactant as high performance friction and antiwear lubricant additive. Tribol. Lett. 2021, 69, 95. [Google Scholar] [CrossRef]
  61. Attia, A.; Abdel-Fatah, H.T.M. Triton X-100 as a non-ionic surfactant for corrosion inhibition of mild steel during acid cleaning. Met. Mater. Int. 2020, 26, 1715–1724. [Google Scholar] [CrossRef]
  62. Abd-El-Nabey, B.A.; El-Housseiny, S.; Abd-El-Fatah, M.A. Improved corrosion resistance of permanganate-phosphate conversion coat on steel surface by surfactants. Sci. Rep. 2023, 13, 15781. [Google Scholar] [CrossRef] [PubMed]
  63. Rabaeh, K.A.; Basfar, A.A.; Moussa, A.A. Enhancement in sensitivity of nitro blue tetrazolium polyvinyl alcohol film dosimeters by sodium formate and Triton X-100. Radiat. Phys. Chem. 2012, 81, 479–483. [Google Scholar] [CrossRef]
  64. Maharaj, D.; Mohammed, T.; Mohammed, A.; Addison, L. Enhanced digestion of complex cosmetic matrices for analysis of As, Hg, Cd, Cr, Ni, and Pb using Triton X-100. MethodsX 2021, 8, 101241. [Google Scholar] [CrossRef]
  65. Robinson, J.E.; Sutton, C.M.; Reid, G.F. Dilute Triton X-100 in water as a reference liquid for hydrometer calibration using Cuckow’s method. Measurement 2014, 57, 132–137. [Google Scholar] [CrossRef]
  66. Nigam, S.; Rutan, S. Principles and applications of solvatochromism. Appl. Spectrosc. 2001, 55, 362A–370A. [Google Scholar] [CrossRef]
  67. Dorohoi, D.O.; Creanga, D.E.; Dimitriu, D.G.; Morosanu, A.C.; Gritco-Todirascu, A.; Mariciuc, G.G.; Puica Melniciuc, N.; Ardelean, E.; Cheptea, C. Computational and spectral means for characterizing the intermolecular interactions in solutions and for estimating excited state dipole moment of solute. Symmetry 2020, 12, 1299. [Google Scholar] [CrossRef]
  68. Dorohoi, D.O.; Gosav, S.; Morosanu, A.C.; Dimitriu, D.G.; Apreotesei, G.; Gosav, T. Molecular descriptors—Spectral properties relations for characterizing molecular interactions in binary and ternary solutions, excited state dipole moment estimation. Symmetry 2023, 15, 2075. [Google Scholar] [CrossRef]
  69. Babusca, D.; Benchea, A.C.; Dimitriu, D.G.; Dorohoi, D.O. Solvatochromic characterization of Sudan derivatives in binary and ternary solutions. Anal. Lett. 2016, 49, 2615–2626. [Google Scholar] [CrossRef]
  70. Dulcescu-Oprea, M.M.; Morosanu, A.C.; Dimitriu, D.G.; Gritco-Todirascu, A.; Dorohoi, D.O.; Cheptea, C. Solvatochromic study of pyridinium-acetyl-benzoyl methylid (PABM) in ternary protic solutions. J. Mol. Struct. 2021, 1227, 129539. [Google Scholar] [CrossRef]
  71. Dorohoi, D.O.; Dimitriu, D.G.; Morosanu, A.C.; Puica Melniciuc, N.; Hurjui, I.; Miron, M.; Mariciuc, G.G.; Closca, V.; Cheptea, C. Some aryl-1,2,4-triazol-1-ium phenacylids in binary hydroxyl solvent mixtures. Computational and spectral study. Symmetry 2021, 13, 1656. [Google Scholar] [CrossRef]
  72. Pavel, C.M.; Ambrosi, E.; Dimitriu, D.G.; Dorohoi, D.O. Complex formation and microheterogeneity in water-alcohol binary mixtures investigated by solvatochromic study. Eur. Phys. J. Spec. Top. 2023, 232, 415–425. [Google Scholar] [CrossRef]
  73. Cheptea, C.; Zara, A.; Ambrosi, E.; Morosanu, A.C.; Diaconu, M.; Miron, M.; Dorohoi, D.O.; Dimitriu, D.G. On the solvatochromism of fluorescein sodium. Symmetry 2024, 16, 673. [Google Scholar] [CrossRef]
  74. Pop, V.; Dorohoi, D.O.; Delibas, M. Considerations on the statistical model of intermolecular interactions in ternary solutions. An. St. Univ. Al. I. Cuza s. Ib 1986, 32, 79–84. [Google Scholar]
  75. Suppan, P. Local polarity of solvent mixtures in the field of electronically excited molecules and exciplexes. J. Chem. Soc. Faraday Trans 1 1987, 83, 495–509. [Google Scholar] [CrossRef]
  76. Bosch, E.; Rosés, M. Relationships between ET polarity and composition in binary solvent mixtures. J. Chem. Soc. Faraday Trans. 1992, 88, 3541–3546. [Google Scholar] [CrossRef]
  77. Rosés, M.; Ràfols, C.; Ortega, J.; Bosch, E. Solute-solvent and solvent-solvent interactions in binary solvent mixtures. Part 1. A comparison of several preferential solvation models for describing ET(30) polarity of dipolar hydrogen bond acceptor-cosolvent mixtures. J. Chem. Soc. Perkin Trans. 2 1995, 1995, 1607–1615. [Google Scholar] [CrossRef]
  78. Bosch, E.; Rosés, M.; Herodes, K.; Koppel, I.; Leito, I.; Koppel, I.; Taal, V. Solute-solvent and solvent-solvent interactions in binary solvent mixtures. Part 2. Effect of temperature on the ET(30) polarity parameter of dipolar hydrogen bond acceptor-hydrogen bond donor mixtures. J. Phys. Org. Chem. 1996, 9, 403–410. [Google Scholar] [CrossRef]
  79. Ortega, J.; Ràfols, C.; Bosch, E.; Rosés, M. Solute-solvent and solvent-solvent interactions in binary solvent mixtures. Part 3. The ET(30) polarity of binary mixtures of hydroxylic solvents. J. Chem. Soc. Perkin Trans. 2 1996, 1996, 1497–1503. [Google Scholar] [CrossRef]
  80. Kohantorabi, M.; Salari, H.; Fakhraee, M.; Gholami, M.R. Surfactant binary systems: Ab initio calculations, preferential solvation, and investigation of solvatochromic parameters. J. Chem. Eng. Data 2016, 61, 255–263. [Google Scholar] [CrossRef]
  81. Kohantorabi, M.; Fakhraee, M.; Salari, H.; Gholami, M.R. Probing solvent-solvent and solute-solvent interactions in surfactant binary mixtures: Solvatochromic parameters, preferential solvation, and quantum theory of atoms in molecules analysis. RSC Adv. 2016, 6, 18515. [Google Scholar] [CrossRef]
  82. Kamlet, M.J.; Abboud, J.L.M.; Taft, R.W. An examination of linear solvation energy relationships. In Progress in Physical Organic Chemistry; Taft, R.W., Ed.; Wiley Interscience: New York, NY, USA, 1981; Volume 13, pp. 485–630. [Google Scholar]
  83. Kamlet, M.J.; Abboud, J.L.; Taft, R.W. The solvatochromic comparison method. 6. The π* scale of solvent polarities. J. Am. Chem. Soc. 1977, 99, 6027–6038. [Google Scholar] [CrossRef]
  84. Taft, R.W.; Kamlet, M.J. The solvatochromic comparison method. 2. The α-scale of solvent hydrogen-bond donor (HBD) acidities. J. Am. Chem. Soc. 1976, 98, 2886–2894. [Google Scholar] [CrossRef]
  85. Kamlet, M.J.; Taft, R.W. The solvatochromic comparison method. I. The β-scale of solvent hydrogen-bond acceptor (HBA) basicities. J. Am. Chem. Soc. 1976, 98, 377–383. [Google Scholar] [CrossRef]
  86. Sator, N.; Pavloff, N.; Couëdel, L. Statistical Physics; CRC Press, Taylor & Francis Group: Boca Raton, FL, USA, 2024; pp. 138–147. [Google Scholar]
  87. Van, S.-P.; Hammond, G.S. Amine quenching of aromatic fluorescence and fluorescent exciplexes. J. Am. Chem. Soc. 1978, 100, 3895–3902. [Google Scholar] [CrossRef]
  88. Papadakis, R. Preferential solvation of a highly medium responsive pentacyanoferrate (II) complex in binary solvent mixtures: Understanding the role of dielectric enrichment and the specificity of solute-solvent interactions. J. Phys. Chem. B 2016, 120, 9422–9433. [Google Scholar] [CrossRef] [PubMed]
  89. Yadav, S.N.; Rai, S.; Bhattarai, A.; Sinha, B. Interaction between methyl red and cetyltrimethylammonium bromide under the influence of sodium polystyrene sulphonate in ethanol-water binary solvent systems: A spectrophotometric investigation. Heliyon 2024, 10, e33014. [Google Scholar] [CrossRef] [PubMed]
  90. Minisy, I.M.; Bober, P.; Šeděnková, I.; Stejskal, J. Methyl red dye in the tuning of polypyrrole conductivity. Polymer 2020, 207, 122854. [Google Scholar] [CrossRef]
  91. Khadka, B.; Bhattarai, A. UV-Vis studies on interaction between sodium dioctylsulfosuccinate (AOT) and methyl red. Rev. Roum. Chim. 2020, 65, 989–996. [Google Scholar] [CrossRef]
  92. Zhang, J.-H.; Liu, Q.; Chen, Y.-M.; Liu, Z.-Q.; Xu, C.-W. Determination of acid dissociation constant of methyl red by multi-peaks Gaussian fitting method based on UV-Visible absorption spectrum. Acta Phys. Chim. Sin. 2012, 28, 1030–1036. [Google Scholar] [CrossRef]
  93. Poblete, T.; Millán, D.; Rezende, M.C. Synergism in the solvation of solvatochromic probes in binary mixtures with ionic liquids. J. Mol. Liq. 2023, 391, 123227. [Google Scholar] [CrossRef]
  94. Fisher, R.A. On the interpretation of χ2 from contingency tables, and the calculation of P. J. R. Stat. Soc. 1922, 85, 87–94. [Google Scholar] [CrossRef]
Figure 1. Schematic of a Triton X-100 molecule.
Symmetry 17 00199 g001
Figure 2. Schematic of methyl red molecule.
Symmetry 17 00199 g002
Figure 3. Electronic absorption spectral bands of methyl red dissolved in Triton X-100, water, methanol, ethanol, and 1-propanol, respectively.
Symmetry 17 00199 g003
Figure 4. Electronic absorption spectral bands of methyl red dissolved in the binary mixtures of Triton X-100 with water, methanol, ethanol, and 1-propanol, respectively, for equal mole ratios.
Symmetry 17 00199 g004
Figure 5. Base and acid forms of methyl red.
Symmetry 17 00199 g005
Figure 6. Illustration of different types of interactions between methyl red, Triton X-100, and methanol molecules.
Symmetry 17 00199 g006
Figure 7. Concerted interactions among methyl red, Triton X-100, and methanol molecules.
Symmetry 17 00199 g007
Figure 8. Contributions of each type of intermolecular interaction to the total spectral shift of the electronic absorption spectral band of methyl red dissolved in Triton X-100 + water.
Symmetry 17 00199 g008
Figure 9. Contributions of each type of intermolecular interaction to the total spectral shift of the electronic absorption spectral band of methyl red dissolved in Triton X-100 + methanol.
Symmetry 17 00199 g009
Figure 10. Contributions of each type of intermolecular interaction to the total spectral shift of the electronic absorption spectral band of methyl red dissolved in Triton X-100 + ethanol.
Symmetry 17 00199 g010
Figure 11. Contributions of each type of intermolecular interaction to the total spectral shift of the electronic absorption spectral band of methyl red dissolved in Triton X-100 + 1-propanol.
Symmetry 17 00199 g011
Figure 12. Calculated (with Equation (13)) versus experimental wavenumbers corresponding to the maximum of the electronic absorption spectral band of methyl red dissolved in Triton X-100 + water. The red line represents the linear regression of the data.
Symmetry 17 00199 g012
Figure 13. Calculated (with Equation (14)) versus experimental wavenumbers corresponding to the maximum of the electronic absorption spectral band of methyl red dissolved in Triton X-100 + methanol. The red line represents the linear regression of the data.
Symmetry 17 00199 g013
Figure 14. Calculated (with Equation (15)) versus experimental wavenumbers corresponding to the maximum of the electronic absorption spectral band of methyl red dissolved in Triton X-100 + ethanol. The red line represents the linear regression of the data.
Symmetry 17 00199 g014
Figure 15. Calculated (with Equation (16)) versus experimental wavenumbers corresponding to the maximum of the electronic absorption spectral band of methyl red dissolved in Triton X-100 + 1-propanol. The red line represents the linear regression of the data.
Symmetry 17 00199 g015
Figure 16. Comparative estimation of the methyl red molecule cybotactic region’s composition by statistical cell model, Suppan model, and Bosch–Rosés model for the binary mixture Triton X-100 + water. The green line represents the first bisector.
Symmetry 17 00199 g016
Figure 17. Comparative estimation of the methyl red molecule cybotactic region’s composition by statistical cell model, Suppan model, and Bosch–Rosés model for the binary mixture Triton X-100 + methanol. The green line represents the first bisector.
Symmetry 17 00199 g017
Figure 18. Comparative estimation of the methyl red molecule cybotactic region’s composition by statistical cell model, Suppan model, and Bosch–Rosés model for the binary mixture Triton X-100 + ethanol. The green line represents the first bisector.
Symmetry 17 00199 g018
Figure 19. Comparative estimation of the methyl red molecule cybotactic region’s composition by statistical cell model, Suppan model, and Bosch–Rosés model for the binary mixture Triton X-100 + 1-propanol. The green line represents the first bisector.
Symmetry 17 00199 g019
Figure 20. Bosch–Rosés model estimation of the methyl red molecule cybotactic region’s composition for the binary mixture Triton X-100 + water.
Symmetry 17 00199 g020
Figure 21. Bosch–Rosés model estimation of the methyl red molecule cybotactic region’s composition for the binary mixture Triton X-100 + methanol.
Symmetry 17 00199 g021
Figure 22. Bosch–Rosés model estimation of the methyl red molecule cybotactic region’s composition for the binary mixture Triton X-100 + ethanol.
Symmetry 17 00199 g022
Figure 23. Bosch–Rosés model estimation of the methyl red molecule cybotactic region’s composition for the binary mixture Triton X-100 + 1-propanol.
Symmetry 17 00199 g023
Figure 24. ln(p1/p2) versus ln(x1/x2) according to Equation (4) for the binary mixture Triton X-100 + water. The red line represents the linear regression of the data.
Symmetry 17 00199 g024
Figure 25. ln(p1/p2) versus ln(x1/x2) according to Equation (4) for the binary mixture Triton X-100 + methanol. The red line represents the linear regression of the data.
Symmetry 17 00199 g025
Figure 26. ln(p1/p2) versus ln(x1/x2) according to Equation (4) for the binary mixture Triton X-100 + ethanol. The red line represents the linear regression of the data.
Symmetry 17 00199 g026
Figure 27. ln(p1/p2) versus ln(x1/x2) according to Equation (4) for the binary mixture Triton X-100 + 1-propanol. The red line represents the linear regression of the data.
Symmetry 17 00199 g027
Table 1. Mole fractions of Triton X-100 and the parameters involved in Equation (1), as well as the experimentally recorded wavenumbers corresponding to the maximum of the electronic absorption spectral band of methyl red for the binary solvent Triton X-100 + water.
Mole Fraction of Triton X-100π*βα ν ¯ e x p (cm−1)
0.01.080.491.3023,342
0.10.880.630.5924,353
0.20.870.670.4924,399
0.30.910.590.4124,444
0.40.880.620.3924,444
0.50.870.650.3924,491
0.60.880.600.3424,491
0.70.870.620.3524,537
0.80.930.520.2724,537
0.90.900.550.2824,585
1.00.870.570.3124,585
Table 2. Mole fractions of Triton X-100 and the parameters involved in Equation (1), as well as the experimentally recorded wavenumbers corresponding to the maximum of the electronic absorption spectral band of methyl red for the binary solvent Triton X-100 + methanol.
Mole Fraction of Triton X-100π*βα ν ¯ e x p (cm−1)
0.00.550.841.1724,081
0.10.800.650.8324,125
0.20.840.600.6724,216
0.30.860.580.5924,261
0.40.880.590.5424,307
0.50.860.590.5024,353
0.60.890.570.4324,399
0.70.880.550.3724,444
0.80.880.560.3324,491
0.90.860.570.3224,537
1.00.870.570.3124,585
Table 3. Mole fractions of Triton X-100 and the parameters involved in Equation (1), as well as the experimentally recorded wavenumbers corresponding to the maximum of the electronic absorption spectral band of methyl red for the binary solvent Triton X-100 + ethanol.
Mole Fraction of Triton X-100π*βα ν ¯ e x p (cm−1)
0.00.540.900.9824,353
0.10.820.620.6624,399
0.20.800.620.6124,444
0.30.830.600.5424,444
0.40.870.560.4624,444
0.50.800.660.4824,491
0.60.840.620.4324,491
0.70.880.570.3524,537
0.80.860.580.3424,537
0.90.860.570.3124,585
1.00.870.570.3124,585
Table 4. Mole fractions of Triton X-100 and the parameters involved in Equation (1), as well as the experimentally recorded wavenumbers corresponding to the maximum of the electronic absorption spectral band of methyl red for the binary solvent Triton X-100 + 1-propanol.
Mole Fraction of Triton X-100π*βα ν ¯ e x p (cm−1)
0.00.590.950.8424,307
0.10.710.720.6624,353
0.20.880.580.5624,399
0.30.850.600.5524,399
0.40.860.580.4724,444
0.50.830.660.5024,444
0.60.860.600.4124,491
0.70.850.610.3824,491
0.80.880.570.3324,537
0.90.880.570.3124,537
1.00.870.570.3124,585
Table 5. Results of the multiple linear regression analysis of the data in Table 1 (Triton X-100 + water) according to Equation (1).
ν ¯ 0 (cm−1)C1C2C3Adj. R-SquareF Value
29,115 (694) 1−5237 (766) 0.82146.735
22,525 (1105) 3138 (1860) 0.1562.846
24,938 (33) −1194 (60)0.975389.796
33,321 (986)−7625 (668)−3460 (747) 0.94587.149
26,113 (257)−1434 (313) −934 (66)0.992639.740
24,471 (165) 746 (260)−1138 (49)0.986355.108
27,068 (958)−2204 (807)−518 (501)−833 (118)0.992430.510
1 Number in the brackets is the standard deviation.
Table 6. Results of the multiple linear regression analysis of the data in Table 2 (Triton X-100 + methanol) according to Equation (1).
ν ¯ 0 (cm−1)C1C2C3Adj. R-SquareF Value
23,423 (336) 11101 (400) 0.3967.566
25,210 (265) −1434 (434) 0.49810.929
24,655 (41) −569 (68)0.87369.116
31,423 (3307)−4019 (2134)−6154 (2535) 0.6098.785
25,829 (74)−1158 (72) −949 (27)0.9961160.524
23,910 (53) 1663 (117)−1048 (37)0.995912.471
24,972 (308)−650 (187)764 (270)−1002 (27)0.9981454.548
1 Number in the brackets is the standard deviation.
Table 7. Results of the multiple linear regression analysis of the data in Table 3 (Triton X-100 + ethanol) according to Equation (1).
ν ¯ 0 (cm−1)C1C2C3Adj. R-SquareF Value
24,041 (152) 1542 (186) 0.4298.511
24,806 (120) −517 (190) 0.3907.395
24,654 (26) −344 (48)0.83350.907
22,783 (2103)1416 (1469)873 (1456) 0.3854.132
25,240 (150)−569 (145) −590 (69)0.93673.950
24,467 (65) 453 (150)−536 (73)0.91252.958
26,028 (780)−1128 (780)−511 (497)−615 (73)0.93650.010
1 Number in the brackets is the standard deviation.
Table 8. Results of the multiple linear regression analysis of the data in Table 4 (Triton X-100 + 1-propanol) according to Equation (1).
ν ¯ 0 (cm−1)C1C2C3Adj. R-SquareF Value
23,890 (146) 1679 (176) 0.58114.849
24,786 (96) −529 (149) 0.53812.643
24,677 (15) −471 (29)0.964271.791
23,664 (1218)847 (916)138 (737) 0.5306.646
24,905 (83)−216 (78) −575 (43)0.980241.716
24,604 (17) 208 (43)−595 (30)0.990486.496
24,365 (174)183 (132)339 (103)−585 (29)0.991361.996
1 Number in the brackets is the standard deviation.
Table 9. Contributions of each type of intermolecular interaction (in cm−1 and %) to the total spectral shift of the electronic absorption spectral band of methyl red dissolved in Triton X-100 + water and the calculated wavenumbers corresponding to the maximum of the electronic absorption spectral band according to Equation (13).
Mole Fraction of Triton X-100C1π*
(cm−1)
C1π*
(%)
C3α
(cm−1)
C3α
(%)
ν ¯ c a l c
(cm−1)
0.0−1549.1756.07−1213.6743.9323,351
0.1−1262.2969.62−550.8230.3824,300
0.2−1247.9573.18−457.4626.8224,408
0.3−1305.3277.33−382.7722.6724,425
0.4−1262.2977.61−364.1022.3924,487
0.5−1247.9577.41−364.1022.5924,501
0.6−1262.2979.91−317.4220.0924,534
0.7−1247.9579.25−326.7620.7524,539
0.8−1334.0184.11−252.0715.8924,527
0.9−1290.9883.16−261.4116.8424,561
1.0−1247.9581.17−289.4118.8324,576
Table 10. Contributions of each type of intermolecular interaction (in cm−1 and %) to the total spectral shift of the electronic absorption spectral band of methyl red dissolved in Triton X-100 + methanol and the calculated wavenumbers corresponding to the maximum of the electronic absorption spectral band according to Equation (14).
Mole Fraction of Triton X-100C1π*
(cm−1)
C1π*
(%)
C2β
(cm−1)
C2β
(%)
C3α
(cm−1)
C3α
(%)
ν ¯ c a l c
(cm−1)
0.0−357.4716.46641.4429.54−1172.8554.0024,083
0.1−519.9528.13496.3526.85−832.0245.0224,117
0.2−545.9532.58458.1727.34−671.6340.0824,213
0.3−558.9535.08442.9027.80−591.4437.1224,265
0.4−571.9436.57450.5428.81−541.3234.6224,309
0.5−558.9537.00450.5429.82−501.2233.1824,363
0.6−578.4440.04435.2630.13−431.0529.8424,398
0.7−571.9441.97420.0030.82−370.9027.2224,449
0.8−571.9442.99427.6332.14−330.8024.8724,497
0.9−558.9542.51435.2633.10−320.7824.3924,528
1.0−565.4543.12435.2633.19−310.7623.7024,531
Table 11. Contributions of each type of intermolecular interaction (in cm−1 and %) to the total spectral shift of the electronic absorption spectral band of methyl red dissolved in Triton X-100 + ethanol and the calculated wavenumbers corresponding to the maximum of the electronic absorption spectral band according to Equation (15).
Mole Fraction of Triton X-100C1π*
(cm−1)
C1π*
(%)
C3α
(cm−1)
C3α
(%)
ν ¯ c a l c
(cm−1)
0.0−307.3034.69−578.4465.3124,355
0.1−466.6454.50−389.5645.5024,384
0.2−455.2555.84−360.0544.1624,425
0.3−472.3359.71−318.7340.2924,449
0.4−495.0964.58−271.5135.4224,474
0.5−455.2561.64−283.3238.3624,502
0.6−478.0265.32−253.8134.6824,509
0.7−500.7870.80−206.5929.2024,533
0.8−489.4070.92−200.6829.0824,550
0.9−489.4072.79−182.9827.2124,568
1.0−495.0973.01−182.9826.9924,562
Table 12. Contributions of each type of intermolecular interaction (in cm−1 and %) to the total spectral shift of the electronic absorption spectral band of methyl red dissolved in Triton X-100 + 1-propanol and the calculated wavenumbers corresponding to the maximum of the electronic absorption spectral band according to Equation (16).
Mole Fraction of Triton X-100C2β
(cm−1)
C2β
(%)
C3α
(cm−1)
C3α
(%)
ν ¯ c a l c
(cm−1)
0.0197.6128.34−499.5771.6624,302
0.1149.7727.62−392.5272.3824,361
0.2120.6526.59−333.0573.4124,392
0.3124.8127.62−327.1072.3824,402
0.4120.6530.15−279.5269.8524,445
0.5137.2931.59−297.3668.4124,444
0.6124.8133.86−243.8466.1424,485
0.7126.8935.96−226.0064.0424,505
0.8118.5737.66−196.2662.3424,527
0.9118.5739.14−184.3660.8624,538
1.0118.5739.14−184.3660.8624,538
Disclaimer/Publisher’s Note: The statements, opinions and data contained in all publications are solely those of the individual author(s) and contributor(s) and not of MDPI and/or the editor(s). MDPI and/or the editor(s) disclaim responsibility for any injury to people or property resulting from any ideas, methods, instructions or products referred to in the content.

