Abstract
Human-centric and sustainable cities have become one of the most popular research areas today. They are based on a holistic approach that aims to both improve people’s quality of life and ensure environmental sustainability. The weighting of numerous tangible and intangible criteria used in the performance evaluation of these cities has emerged as an important problem. The symmetrical representation of vague and imprecise data using fuzzy set theory is an absolute necessity for a successful weighting process. In this study, symmetrical representation of especially intangible criteria is carried out with proportional spherical fuzzy sets. Proportional spherical fuzzy sets provide significant convenience to the expert in determining the membership, non-membership and hesitancy degrees and ensure that the assigned values are more accurate and consistent. In the study, five main human centric and sustainable city (HCSC) criteria and 26 HCSC sub-criteria determined from the literature were weighted. In addition, criteria weights were obtained by classical spherical fuzzy analytic hierarchy process (AHP) for comparison purpose. The first four most important HCSC criteria were determined as water management and conservation, employment/unemployment rate, carbon emission reduction strategies and economic sustainability, respectively.
1. Introduction
In the modern era, urbanization has accelerated at an unprecedented rate, creating significant challenges and opportunities for sustainable development. As centers of economic activity, innovation, and cultural change, cities have increasingly needed to address complex societal demands while ensuring environmental resilience and human well-being [1]. In this context, the concept of Human-Centric and Sustainable Cities has emerged as a holistic framework that emphasizes inclusiveness, sustainability, and technological integration to balance urban growth with the desires and needs of its residents [2]. These cities have come to be envisioned as inclusive, resilient, and technologically advanced ecosystems where human needs and environmental considerations are at the core of urban planning. This paradigm shift has required prioritizing key criteria that guide urban planners, stakeholders, and policymakers in designing efficient, equitable, and future-ready cities [3].
These cities offer healthier, safer, and more accessible living spaces by prioritizing the physical, social, and psychological needs of individuals. At the same time, in these cities, attention is paid to keeping together pedestrian-friendly roads, accessible public transportation and user-friendly designs such as infrastructures suitable for the elderly and disabled, public spaces and parks that increase social interactions in cities [4]. In addition, environmental sustainability strategies such as reducing carbon emissions, using renewable energy, waste management and protecting nature are also at the center of this approach. With smart city applications supported by technology, data-based decision-making processes are prioritized in these cities, while also optimizing resource use [5]. Therefore, designing such cities requires addressing a large number of criteria such as environmental protection, energy efficiency, economic development, social equality and technological innovation. In this context, multi-criteria decision-making (MCDM) methods have emerged as effective tools to cope with such complexities by allowing decision-makers to systematically evaluate and prioritize criteria [6,7,8,9].
MCDM provides a structured framework for analyzing and prioritizing conflicting criteria, enabling policy-makers and planners to make informed decisions that reflect both immediate needs and long-term goals. In the literature, many different MCDM methods such as AHP, analytic network process (ANP), best worst method (BWM) have been developed by various researchers with different perspectives for solving multi-criteria decision-making problems [10,11,12,13,14]. Among the various MCDM methods, the AHP method is widely recognized for its capacity to separate complex problems into hierarchical structures consisting of criteria and sub-criteria, and makes a systematic evaluation process easier [15,16,17]. However, traditional AHP methods are often inadequate in handling the uncertainty and ambiguity found in urban planning, especially when dealing with subjective judgments or qualitative data and considering the complex environment and real-life conditions. To overcome these limitations, advanced fuzzy set theories have been integrated into decision-making frameworks in the literature [18]. Ordinary fuzzy sets were introduced by Zadeh [19] in 1965 to deal with the ambiguity found in uncertain information. Since ordinary fuzzy sets represented only by membership degrees cannot fully eliminate the uncertainty in real-world decision-making problems, they have been extended to various fuzzy set extensions by many different researchers in the following processes. As a direct extension of ordinary fuzzy sets, with the development of intuitionistic fuzzy sets (IFSs) by Atanassov [20], a new dimension has been added to fuzzy set extensions and a more flexible handling of uncertain information has been provided. Due to its advantage in modeling uncertainty information, IFSs have attracted great attention by many researchers and have been used in various fields [10,21,22,23,24]. With the new dimension added to the field of fuzzy sets under the leadership of Atanassov, fuzzy set extensions have been addressed by various researchers from different perspectives in the literature. One of the latest extensions of fuzzy sets has been proportional spherical fuzzy sets (PSFSs) developed by Kahraman [25]. PSFSs are represented on a global surface by three basic dimensions, namely membership, non-membership and hesitation, and establish proportional relationships between the degrees of membership, non-membership and hesitation. Spherical fuzzy sets include symmetrical data around the hesitancy information with membership on the left and non-membership information on the right. This global representation provides a more holistic view of uncertainty and captures not only the degree of membership and non-membership, but also the level of uncertainty or hesitation that may be present in a decision-making scenario, and also includes the uncertainty definition of proportional relationships between parameters [25].
In the process of evaluating a comprehensive set of factors reflecting various dimensions of urban sustainability, PSFSs provide a powerful tool in analyzing and selecting factors under conditions of uncertainty [25]. In this context, by integrating the structured evaluation capabilities of AHP with the flexibility of PSFSs logic, the proportional spherical fuzzy AHP (PSF-AHP) method was developed to address the complexity and uncertainty of urban planning. In the study, the PSF-AHP method has been applied to prioritize the criteria for Human-Centered and Sustainable Cities. This approach ensures that decision makers’ subjective preferences, incomplete information, and nuanced criteria assessments are included, resulting in more robust and reliable prioritization results. In this way, the PSF-AHP method ensures that the prioritization process is reflected by considering the diverse needs and desires of urban stakeholders. In addition, the study provides actionable insights for policy makers, urban planners, and stakeholders who are trying to create urban environments that are not only sustainable but also responsive to human needs. The results directly contribute to global initiatives such as the United Nations Sustainable Development Goals (SDGs), especially Goal 11, which emphasizes the creation of inclusive, safe, resilient, and sustainable cities.
The study contributes to the literature by addressing the following key objectives:
- It identifies and categorizes the criteria that define the essence of Human-Centric and Sustainable Cities. A comprehensive framework is presented to evaluate the criteria required for Human-Centric and Sustainable Cities, integrating various perspectives from environmental science, social equity, and technological innovation.
- It applies the PSF-AHP method to evaluate and rank the criteria, considering expert opinions and real-world applications. In this context, it demonstrates the application of the PSF-AHP method in a complex, real-world decision-making context.
- It provides actionable insights for urban planners and policy makers to focus on the most effective aspects of sustainable urban development. In this context, it offers practical guidance for urban development by highlighting priority criteria that can inform strategic investments, policy decisions and future research. The study aligns with global initiatives such as the United Nations Sustainable Development Goals (SDGs), especially Goal 11, which focuses on making cities inclusive, safe, resilient and sustainable.
As cities continue to grow and develop, understanding and addressing priorities for sustainable development will continue to be an urgent challenge [26]. This study offers a way to overcome this complexity, bridging the gap between theoretical developments in the field of fuzzy sets and their practical application in creating better cities for all.
The remainder of this study is organized as follows. Section 2 explains the concept of human-centric and sustainable cities and details it through a literature review and presents the performance criteria of human-centric and sustainable cities and their explanations. The theoretical principles and mathematical operators of the PSFs are provided in Section 3. The extension of the PSF to the AHP method is shown in Section 4. In Section 5, the proposed PSF-AHP method is applied to prioritize the criteria for human-centric and sustainable cities. Comprehensive sensitivity and comparative analyses are conducted in Section 6 to demonstrate the validity of the results obtained from the PSF-AHP method. Finally, the study concludes in Section 7 with results, limitations of the study, and recommendations for further research.
2. Human-Centric and Sustainable Cities (HCSC)
2.1. Literature Review on HCSC
Social sustainability, which is assumed to be an inseparable part of urban development, emphasizes the need to prioritize social priorities in urban development. In this context, Dempsey et al. [27], Kohon [28], Sharifi [1], Kitchin et al. [29], Shirazi and Keivani [30], Malek et al. [31] and many other studies have contributed to the further spread of the human-centered social sustainability approach by emphasizing the need to emphasize human-centered social priorities in urban developments in order to recognize and prioritize human needs. The spread and adoption of this idea has reached the highest global level through targets such as social inclusion, eradication of extreme poverty, reduction of inequalities and inclusive and participatory decision-making in specific programs such as the UN’s Sustainable Development Goals and UNESCO’s Management of Social Transformations [32].
Human-centered and sustainable cities represent an integrated approach that shapes the future of modern urbanization. These cities aim for a comprehensive transformation by focusing on people’s quality of life [33], social ties [29,31], physical health and environmental impacts [26,33] as well as technological and economic growth [34,35,36]. Human-centeredness in city design manifests itself in the creation of safe, healthy and accessible spaces that facilitate the daily lives of individuals. Pedestrian-friendly streets, barrier-free public transportation, parks and public spaces that encourage social interaction are indispensable for these cities [33,35,37]. Cities strengthen the social ties that bring individuals together by taking into account not only their physical needs but also their social and psychological needs. Public and social areas, cultural events increase the interaction of city residents with each other, creating more vibrant and connected communities [38]. At the same time, smart city technologies make people’s daily lives more efficient and enable data-based decisions to be made in city management.
Environmental sustainability is a critical element at the heart of these cities. In order to provide solutions to global environmental problems such as climate change and the rapid depletion of natural resources, sustainable cities are built on energy efficiency, the use of renewable energy sources and infrastructures that minimize carbon emissions. While green buildings, environmentally friendly technologies such as solar and wind energy reduce the ecological footprint of cities, recycling systems and the circular economy approach support the sustainability of city ecosystems by minimizing resource waste. When all these are taken into consideration, human-centered and sustainable cities include a holistic approach that improves the quality of life of individuals, does not harm the environment, strengthens social solidarity and aims to leave a more livable world for future generations [1,39]. Cities built on such a foundation are pioneering the transformation of modern urban life as cities of the future where technology and nature are in harmony. Economic development prioritizes human well-being, and environmentally sensitive policies are adopted [26]. In parallel with this trend, the concept of human-centered sustainable cities has attracted the attention of many researchers in the literature, and many researchers have conducted various studies in this important field. For instance, research by Roggema [40] suggests that cities designed to be both sustainable and human-centric can simultaneously promote environmental health and social well-being. Compact, walkable cities that reduce car dependency not only cause lower carbon emissions but also encourage more active, healthier lifestyles for residents. Furthermore, cities that prioritize social inclusivity and equitable access to green spaces contribute to the creation of resilient urban communities. Clarke et al. [33] emphasized the role of cultural resilience, which is important in improving urban development in an inclusive way in sustainable smart cities. Alizadeh and Sharifi [37] based a comprehensive perspective that encompasses social rights, democratic values and social justice to advance the idea of a human-centered approach further. In this context, they explained the aspects of social justice by addressing the dimensions of the concept of a social smart city in their studies. Sugandha et al. [41] presented a conceptual framework with a comprehensive literature review on the social sustainability of smart cities. Alizadeh and Sharifi [35] discussed how and why the concept of social smart city should be prioritized by addressing its different dimensions in the post-pandemic period. Vallance et al. [26] considered the concepts of ’development sustainability’, ’bridge sustainability’ and ’care sustainability’ based on literature review in order to explain the concept of social sustainability and to highlight the different ways it contributes to sustainable development more generally. In their study, they investigated the contradictions among the three social sustainability concepts they considered and how their complementarities hinder or support sustainable development. Dempsey et al. [27] examined the concept of urban social sustainability as the social dimension of sustainable development in detail. In their studies, two main dimensions of sustainability are determined, namely equal access and the sustainability of the community itself, on the relationship between urban form and social sustainability. Sepasgozar et al. [5] proposed a new model called the urban services technology acceptance model based on the structural equation modeling method for the application of citizen-centered technology in the development of smart cities. The proposed model guided the selection of appropriate technologies for cities and determined that it could be useful for cities with different cultural identities and characteristics that want to initiate smart city strategies. Su and Fan [42] focused on the configurational theorization of the smart-sustainable city nexus to resolve the uncertainty of how sustainable development can achieve its multifaceted goals. In their study, they present a classification of smart city configurations while revealing the causal complexity of building smart cities to achieve urban sustainability using fuzzy set qualitative comparative analysis. Adel and HS Alani [2] examined the critical role of Industry 5.0 and Society 5.0 disruptive technologies in driving sustainable development. They aimed to guide industrialists, policymakers and researchers for sustainable development goals by evaluating the approach they addressed in their studies using SWOT analysis. Zhao et al. [43] developed a set of performance indicators to evaluate the social sustainability of urban renewal initiatives in China’s historical urban areas. He et al. [44] analyzed the coordination relationship between urban development and urban life satisfaction in China through sentiment analysis. Li et al. [45] aimed to examine the level of social sustainability of smart city infrastructure and to reveal the basic contents and ways to improve this level. In the study, the internal mechanisms of smart cities have been summarized at a theoretical level, the dimension of social sustainable development has been analyzed and suggestions on how to realize digital public participation have been presented. Torkayesh et al. [46] presented a multi-criteria decision-making approach to identify the most effective countries with entrepreneurial activities that contribute to social sustainable development goals. Heide et al. [47] presented a methodological framework for the assessment of social sustainability indicators based on a life cycle perspective. Marvi et al. [48] aimed to define social sustainability principles for Smart Cities in Tehran. In the study, they focused on the development of smart city indicators and the evaluation of implementation principles for smart cities, citizens and civil society organizations. Skubis et al. [49] presented a comparative analysis by examining the integration of Artificial Intelligence and human-centered approaches in the management of smart cities in two different regions. With the analysis conducted, they emphasized the importance of a human-centered approach in smart city development and also showed how artificial intelligence technologies can transform urban environments. Lee et al. [50] emphasized the importance of the heterogeneous individual tendencies of smart cities by taking the human dimension of smart cities as a basis. The study acknowledged the essential role of the human dimension in the design of smart cities by embracing the multifaceted and personalized qualities of citizens. Gelbukh et al. [51] presented a review based on literature research on how explain ability of machine learning algorithms can be provided in case of using machine learning algorithms in smart city applications. Chen et al. [52] proposed a community planning based on optimization strategy guided by environmental hygiene and public health to ensure the physical and mental health of residents living in the smart city. Allam and Allam [53] investigated the current and future challenges and opportunities that the metaverse presents to cities and the quality of life of their residents. They explained through literature review how the metaverse could change cities in physical and virtual environments and its impact on the lives of residents living in these environments. Wang [54] highlighted the achievements and limitations of human-centered management on institutionalization, organizational transformation, and public participation by Considering the sustainable smart city example of Fujisawa, Japan.
2.2. Performance Criteria of HCSC
Human-centric and sustainable city criteria encompass a broad range of factors that aim to balance the well-being of residents with environmental sustainability. Human-centric and sustainable cities need to be evaluated broadly within the scope of environmental indicators, economic indicators, mobility & infrastructures indicators, living & services indicators and people indicators.
Environmental (EN) Indicators
Air quality (EN1): Poor air quality is linked to various health problems, such as respiratory diseases and cardiovascular issues. It includes measures to reduce air pollutants and improve air quality in urban environments [55,56,57].
Pollution Control (EN2): Effective pollution control ensures healthier living conditions, contributing to the overall quality of life in the city [1,38].
Renewable Energy Production: Renewable energy production is essential for cities aiming to reduce carbon emissions, enhance energy security, and promote sustainability. By investing in renewable energy infrastructure, such as solar panels on buildings, wind farms, and bioenergy facilities, cities can decrease their reliance on non-renewable resources and mitigate the environmental impact of energy consumption. Renewable energy reduces air pollution, improves public health, and contributes to climate change mitigation by lowering greenhouse gas emissions [3,38,55,56,57].
Energy consumption: It refers the total amount of energy used by a city’s residential, commercial, industrial, and transportation sectors, including electricity, heating, and fuel consumption. Managing and optimizing energy consumption is critical for achieving a sustainable city. High energy demand contributes to pollution and greenhouse gas emissions, affecting both the environment and residents’ health [1,3,55,56,57].
Water Management and Conservation: It includes the strategies for managing water resources, including stormwater management, water recycling, and efficient water use. Water is a critical resource in cities, and proper management ensures that it is used sustainably. Techniques like rainwater harvesting and graywater recycling can help cities cope with water scarcity and reduce the risk of flooding [1,56,57].
Waste Management and Recycling: It includes the strategies employed for reducing waste generation, increasing recycling rates, and properly disposing of waste materials. Efficient waste management systems minimize the environmental impact of waste, reduce landfill usage, and promote resource recovery through recycling and composting [1,3,38,55,57].
Carbon Emission Reduction Strategies: It includes the policies and strategies implemented by the city to reduce its carbon footprint. Reducing carbon emissions plays a crucial role in combating climate change. Implementations such as the use of renewable energy sources, energy-efficient buildings, and low-carbon transportation options enhance the city’s environmental sustainability [56,57].
Economic (EC) Indicators
Economic Sustainability: It defines the efforts to create sustainable economic opportunities, including green jobs and support for local businesses. Economic sustainability involves creating resilient and diverse local economies that can withstand economic downturns. It also supports social equity by providing job opportunities and reducing poverty [1,58,59].
Employment/unemployment rate: The percentage of the labor force currently employed or unemployed in a city, reflects the economic health and job market conditions. The employment/unemployment rate is a critical indicator of a city’s economic vitality and its ability to provide sustainable livelihoods for its residents. A high employment rate signifies robust economic activity, thriving industries, and effective workforce policies, contributing to social stability and quality of life. Conversely, high unemployment rates can indicate economic challenges, skill mismatches, or insufficient job opportunities, leading to increased social inequality and reduced economic output [1,55,56,57].
Innovation and entrepreneurship: It defines the ability of a city to foster innovation, support entrepreneurial activities, and integrate advanced technologies into its economic and social systems to drive sustainable growth and competitiveness. Innovation and entrepreneurship are fundamental for the development of smart, sustainable, and human-centric cities [1,38,55,56,57,59].
Technology Integration and Smart City Solutions: It refers to the use of digital technologies and data-driven solutions to optimize urban services such as transportation, energy management and waste collection. Smart city initiatives improve efficiency, reduce costs, and enhance the quality of urban services. For example, smart traffic lights can reduce congestion, while smart grids optimize energy consumption [1,38,57,58,59].
Science and R&D Capacity: It indicates the city’s ability to support scientific research, technological development, and innovation through investments in research and development (R&D) and collaboration with educational institutions, research centers, and private industry. A strong science and R&D capacity fosters a culture of innovation and technological advancement, which can significantly contribute to a city’s sustainable development and competitiveness. Additionally, a robust R&D environment attracts talent and investment, creating high-quality job opportunities and driving economic growth [3,57].
City internationalization activities: It includes the initiatives and strategies undertaken by a city to enhance its global presence, foster international partnerships, and attract foreign investment, talent, and tourism. City internationalization activities are integral to positioning a city as a globally connected and competitive hub. These activities include establishing sister-city agreements, participating in international networks or organizations, hosting global events, and promoting the city as a destination for business, education, and culture. Such efforts help cities attract foreign direct investment, boost tourism, and create opportunities for knowledge exchange and innovation [57].
Mobility & Infrastructures (MI) Indicators
Quality of public transport: It refers the reliability, efficiency, accessibility, and environmental impact of a city’s public transportation systems, including buses, trains, trams, and subways [3,55,57].
Quality of transportation infrastructure: It defines the effectiveness, accessibility, safety, and sustainability of the city’s transportation systems, including roads, public transit, pedestrian pathways, and cycling networks. High-quality transportation infrastructure is fundamental to urban mobility, enabling residents to travel efficiently, safely, and affordably. A well-developed infrastructure includes a mix of accessible public transit options—such as buses, trams, subways, and trains—that reduce traffic congestion and provide alternatives to private car use. Prioritizing the quality of transportation infrastructure not only supports a more livable, human-centric city but also aligns with sustainability goals by encouraging eco-friendly transit options and reducing the city’s overall environmental footprint [1,3,4,55,57].
ICT infrastructure: It defines the foundational systems and technologies that support information and communication services within a city, including broadband networks, data centers, cloud computing, and digital platforms. ICT (Information and Communication Technology) infrastructure is a cornerstone of smart, human-centric, and sustainable cities. It enables efficient communication, data management, and the integration of digital technologies across various urban systems. Robust ICT infrastructure supports e-governance, smart utilities, real-time traffic management, and innovative solutions in healthcare, education, and public safety [1,38,56,57,59].
ICT accessibility: It refers the ease with which residents can access and use information and communication technologies, such as the internet, mobile networks, and digital services, regardless of their socioeconomic status, geographic location, or physical abilities. ICT accessibility is a critical factor in creating inclusive, human-centric, and sustainable cities. It ensures that all residents, including marginalized and vulnerable groups, have equitable access to digital tools and services that enhance their quality of life [1,38,56,57].
Quality of internet services: It defines the reliability, speed, accessibility, and affordability of internet connectivity provided to residents, businesses, and institutions within a city. The quality of internet services is a crucial aspect of a city’s digital ecosystem, directly influencing its capacity to function as a human-centric and sustainable urban environment. High-quality internet services ensure seamless communication, efficient access to digital tools, and the integration of smart city technologies. Reliable and fast internet connectivity supports essential activities such as remote work, online education, telehealth, and civic engagement. In addition, high-quality internet enables smart infrastructure like IoT devices, smart grids, and intelligent transportation systems, reducing energy consumption and optimizing resource utilization [55,57].
Living & Services (LS) Indicators
Green Spaces and Urban Parks: It refers to the existence of parks, gardens and green areas within the urban landscape. Green spaces contribute to the physical and mental well-being of residents, providing areas for recreation and relaxation. They also enhance urban biodiversity, improve air quality, and mitigate the urban heat island effect [55,57,58].
Quality of cultural activities and facilities: It indicates the richness and accessibility of cultural activities, events, and facilities, such as museums, theaters, galleries, music venues, and festivals, that contribute to a city’s cultural vibrancy and residents’ quality of life. High-quality cultural activities and facilities are vital for fostering a vibrant, inclusive, and attractive city. These cultural offerings provide spaces for creativity, expression, and community gathering, enriching the daily lives of residents and enhancing social cohesion [4,55,56,57].
Social Inclusivity and Accessibility: It defines the degree to which urban environments accommodate all demographic groups, including people with disabilities, the elderly, and marginalized communities. Inclusive cities ensure that all residents have access to services, public spaces, and transportation, regardless of physical, social, or economic status. Social inclusivity fosters a sense of belonging and supports social equity [1,4,35,38,56,57,58].
Urban Resilience and Climate Adaptation: It defines the ability of a city to withstand and recover from natural disasters, such as floods, heat waves, and storms. Urban resilience measures, such as flood barriers and heatwave shelters, prepare cities for the impacts of climate change. Adaptation strategies also involve updating building codes and infrastructure to withstand extreme weather events [58].
Access to Health and Well-being Services: It defines the availability and accessibility of healthcare services, sports facilities, and other well-being services. Easy access to healthcare directly impacts the quality of life and enhances the overall well-being of city residents. It also helps create a fairer city structure, especially for low-income or disadvantaged communities [1,3,4,35,38,55,56,57,59].
Educational and Cultural Services: It includes the quality, diversity, and accessibility of educational institutions and cultural facilities. Education and cultural services support community development and social cohesion. Cultural events and educational opportunities promote personal development and social participation among city residents [1,3,35,55,56,57,59].
Social security: It indicates the level of safety in the city and the effectiveness of crime prevention measures. A safe living environment enhances the well-being of city residents and supports social stability. It also contributes to the more effective and widespread use of public spaces [1,4,35,38,55,56,57,59].
People (P) Indicators
ICT Skills: It indicates the level of proficiency and access to Information and Communication Technology (ICT) skills among the city’s residents, workforce, and institutions. ICT skills are crucial for driving digital transformation and supporting the growth of a knowledge-based economy. A city with a high level of ICT skills enables its population to effectively use digital tools and technologies, contributing to innovation, productivity, and overall economic development [1,38,55,57].
Availability and penetration of e-learning and distance (remote) education systems: It indicates the extent to which digital platforms and technologies for e-learning and remote education are accessible, effective, and widely used by residents of a city. The availability and penetration of e-learning and distance education systems are vital indicators of a city’s commitment to human-centric and sustainable development. These systems enable individuals to access educational resources and opportunities regardless of their location, socioeconomic status, or personal circumstances, fostering lifelong learning and skill development [1,38,55].
IT training and raising awareness about smart city: It refers the initiatives and programs designed to educate residents, businesses, and institutions on using information technology (IT) effectively and increasing awareness of smart city concepts and their benefits. IT training and awareness programs about smart cities are critical for ensuring that all stakeholders can actively participate in and benefit from the digital transformation of urban areas. These initiatives enhance technological literacy, foster digital inclusion, and build a collective understanding of how smart city technologies improve urban living [38,55].
3. Proportional Spherical Fuzzy Sets (PSFS)
Consider the spherical fuzzy set where , , and is the membership degree of x, respectively. Suppose that the expert evaluates the proportions between and as in Equations (1)–(3) [25]:
and
and
Satisfying
where is the refusal degree; is the proportion between refusal degree and membership degree; is the proportion between refusal degree and hesitancy degree; and is the proportion between refusal degree and non-membership degree.
The refusal degree can be given by Equation (4):
Then, each element in the set can be defined by
Let and be two SFSs. Addition and multiplication operations are described as in Equations (6) and (7), respectively.
The multiplication by a constant and power operation are presented by Equations (8) and (9), respectively.
Definition 1
([7]). Let be a collection of PSFNs. The proportional spherical fuzzy weighted averaging (PSFWA) operator is a mapping such that
where is the weight vector of and . Then
Definition 2
([7]).
Let be PSF numbers. The proportional spherical fuzzy weighted geometric (PSFWG) operator is defined as in Equation (12):
where is the weight vector of and . Then
Definition 3.
Let a full PSFN be . The score and accuracy functions are described as in Equations (14) and (15), respectively.
Definition 4
([7]).
Let x ∈ X be a universe set and
and
be two SF numbers. Then Euclidean distance is defined as in Equation (16).
4. PSF-AHP
Pairwise comparison matrices are used to divide a large problem into small problems in the analytic hierarchy process (AHP). The solutions of small problems are then combined in order to achieve the overall solution of the large problem. A pairwise comparison matrix of criteria can be written by using the proportion pairs as given in Equation (17) [60].
where there is a relation between reciprocal values such that , and . VBN is a very big number such as .
Table 1 presents the linguistic terms and the corresponding PSF proportions and their corresponding spherical fuzzy sets (SFS) including membership, non-membership, and hesitancy degrees when refusal degree is zero or any other number. Any value between two successive terms can be assigned when an expert is undecided when selecting one of these terms. For instance, if the expert is between Very High (VH) and Certainly High (CH), then he/she can assign a PSF value such as (8.5, 1.5) or (8, 1). In Table 1, SS is the squared sum of μ, v, and π.

Table 1.
Linguistic PSF Scale.
Equation (17) is transformed to Equation (18) by Equation (5):
where .
Then, by computing the score function as in Equation (19), we obtain the crisp pairwise comparison matrix in Equation (20). In Equation (18), if the second row produces a positive value, go on with the second row; but if it produces a negative value, go on with the third row. Equation (19) involves crisp values any more.
Consistency of a crisp decision matrix is measured by Equation (20) and the matrix is corrected if the consistency ratio () is larger than 0.10.
where is the maximum eigenvalue; is the dimension of the square matrix; and is the random index for the considered square matrix.
If there are more than one decision-maker, an aggregation operator is used to aggregate these pairwise comparison matrices in order to obtain a unique pairwise comparison matrix. The above computation is applied to the whole hierarchy of the considered problem. After the priority sets of all pairwise comparison matrices are obtained, they are combined to determine the best alternative as in the classical AHP.
5. Prioritization of Performance Criteria of HCSC
Human-centric and sustainable cities represent a forward-thinking urban development paradigm, balancing environmental sustainability, social equity, and economic resilience. These cities prioritize the well-being of their inhabitants by integrating green spaces, efficient public transportation systems, affordable housing, and innovative technologies that enhance quality of life. Sustainability is achieved by reducing carbon footprints, managing natural resources responsibly, and incorporating renewable energy solutions into urban planning. Moreover, such cities focus on inclusivity, ensuring equitable access to services like education, healthcare, and cultural activities. Human-centric approaches emphasize community involvement in decision-making processes, fostering a sense of ownership and accountability among citizens. The overarching goal of these cities is to create environments that are not only livable but also adaptive to future challenges, such as climate change, urbanization, and technological disruptions. By combining sustainability with human-centric values, these cities set the foundation for long-term socio-environmental harmony and economic vitality.
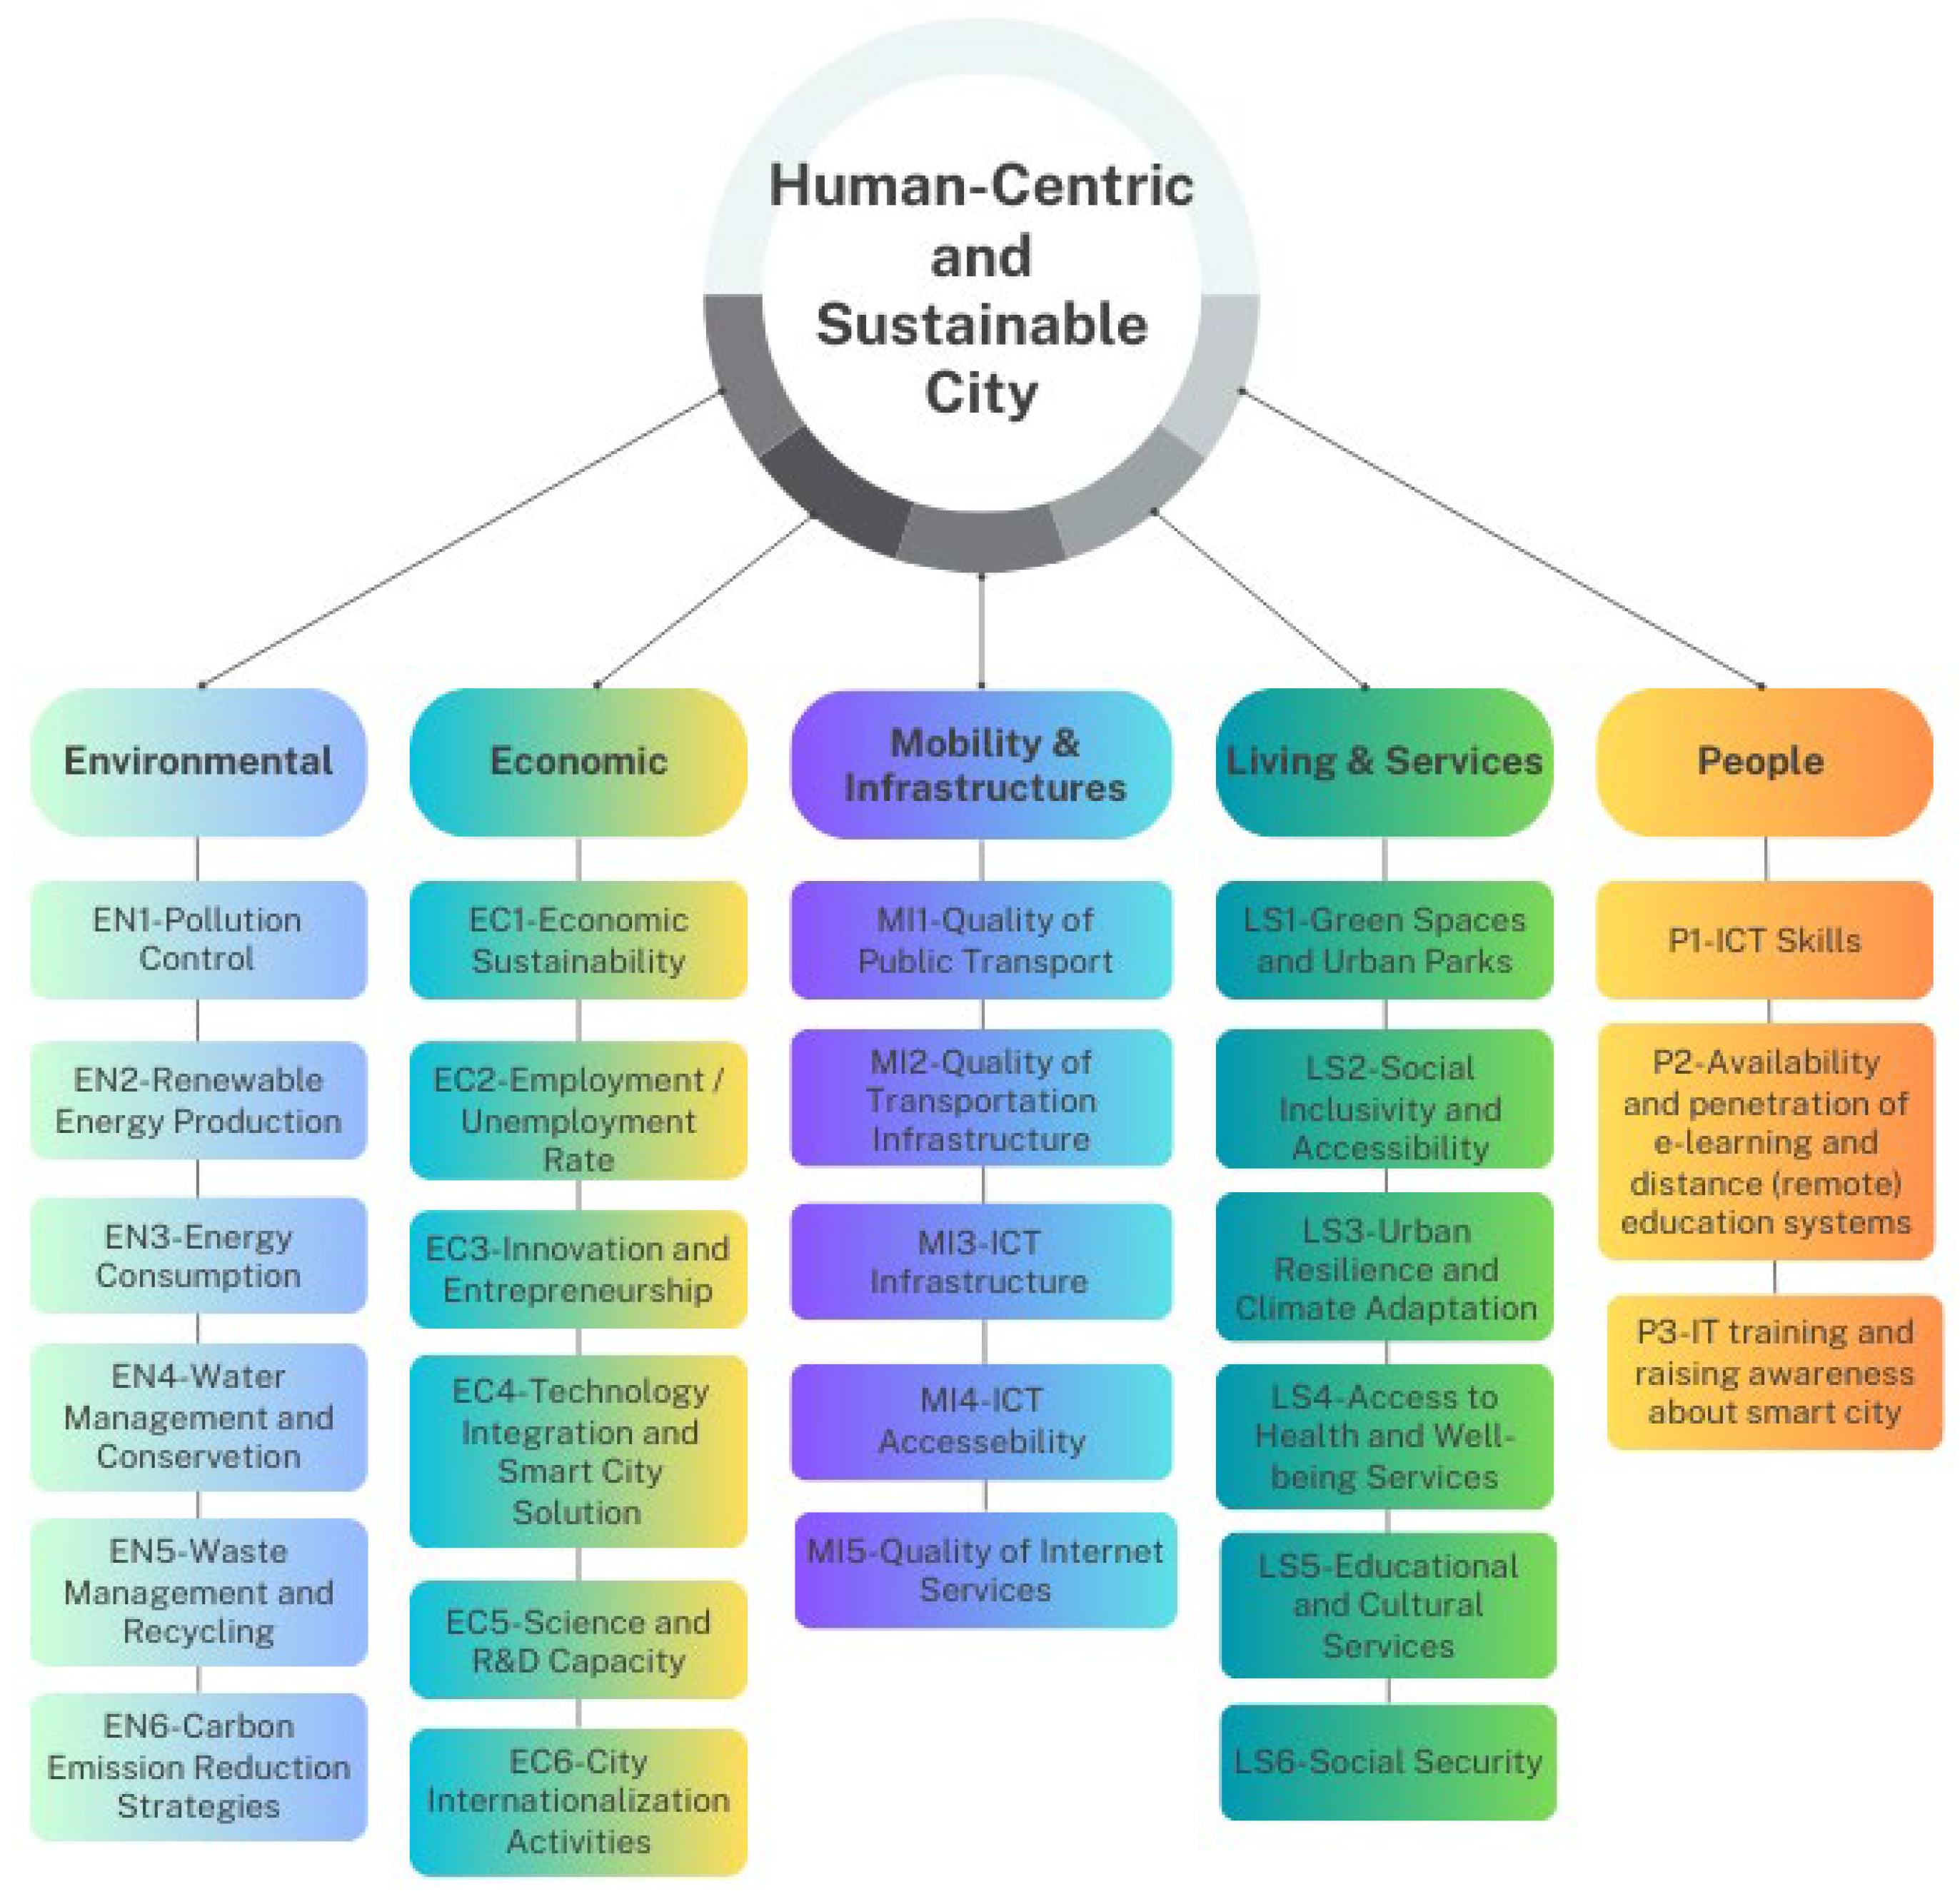
The complexity of designing human-centric and sustainable cities necessitates robust decision-making frameworks capable of addressing diverse and often conflicting priorities. The Proportional Spherical Fuzzy AHP (PSF-AHP) method provides a powerful tool for tackling this multifaceted challenge. Therefore, in this section, the steps of the proposed PSF-AHP method are applied for the prioritization of human-centric and sustainable city criteria. In this context, a hierarchical structure has been constructed as shown in Figure 1 by considering human-centric and sustainable city criteria presented in Section 3. By leveraging the proportional spherical fuzzy sets, this method incorporates the inherent uncertainty and vagueness in decision-making processes, which are prevalent when evaluating subjective and diverse criteria.
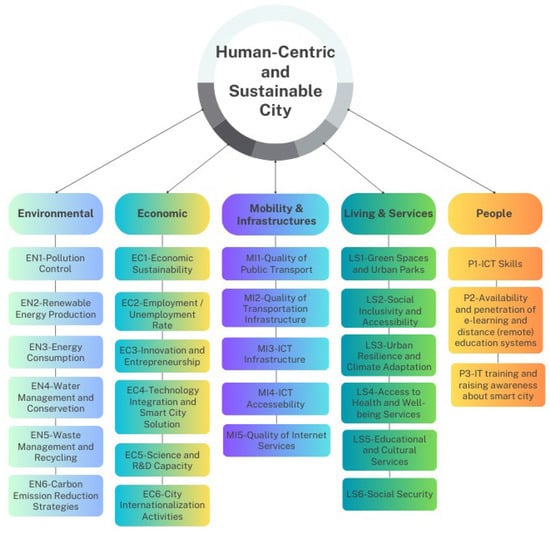
Figure 1.
Hierarchical structure of the problem.
- Step 1. Prioritization of human-centered and sustainable city criteria is based on 5 main criteria and 26 sub-criteria as presented in Section 3. Three experts have been determined for the prioritization of the criteria, who are three professors from the Department of Environmental Engineering at ITU. The weights of experts (E1, E2, E3) have been determined as 0.40, 0.25 and 0.35, respectively, based on their past experience on human-centric and sustainable cities.
- Step 2. Experts’ linguistic judgments are given in Table 2, Table 3, Table 4, Table 5, Table 6 and Table 7 for the pairwise comparisons of main criteria and sub-criteria, respectively. Then, experts’ linguistic judgments are converted into proportions of the relevant PSFSs by using Table 1. The corresponding proportional data of the three experts are given in Table 8 for only the main criteria because of the space constraints.
 Table 2. Linguistic judgments for main criteria of the experts.
 Table 3. Linguistic judgments for environmental criteria of the experts.
 Table 4. Linguistic judgments for economic criteria of the experts.
 Table 5. Linguistic judgments for mobility & infrastructure criteria of the experts.
 Table 6. Linguistic judgments for living & services criteria of the experts.
 Table 7. Linguistic judgments for people indicators criteria of the experts.
 Table 8. Proportions for the main criteria assigned by three experts.
- Step 3. The proportions assigned by each expert have been defuzzified using Equation (19) and the crisp pairwise comparison matrix for each decision maker as in Equation (20) has been obtained. Then, the consistency ratios of the pairwise comparison matrices consisting of each expert’s proportions have been calculated according to Saaty’s classical consistency process and all pairwise comparison matrices of experts have been ensured to be consistent.
- Step 4. The pairwise comparison matrices consisting of proportions for each criterion for each expert are aggregated into a single pairwise comparison matrix by using PSFWG operator presented in Equation (13) and, thus the aggregated spherical fuzzy matrix consisting of spherical fuzzy numbers for each main criterion and sub-criteria is obtained as in Table 9, Table 10, Table 11, Table 12, Table 13 and Table 14, respectively.
 Table 9. Aggregated PSF pairwise comparison matrix based on the main criteria.
 Table 10. Aggregated PSF pairwise comparison matrix based on the environmental criteria.
 Table 11. Aggregated PSF pairwise comparison matrix based on the economic criteria.
 Table 12. Aggregated PSF pairwise comparison matrix based on the mobility & infrastructure criteria.
 Table 13. Aggregated PSF pairwise comparison matrix based on the living & services criteria.
 Table 14. Aggregated PSF pairwise comparison matrix based on the people indicators criteria.
- Step 5. The aggregated pairwise comparison matrices of the main criteria and sub-criteria are defuzzified as in Table 15, Table 16, Table 17, Table 18, Table 19 and Table 20 by using the score function given in Equation (19).
 Table 15. Crisp aggregated pairwise comparison matrix based on the main criteria.
 Table 16. Crisp aggregated pairwise comparison matrix based on the environmental criteria.
 Table 17. Crisp aggregated pairwise comparison matrix based on the economic criteria.
 Table 18. Crisp aggregated pairwise comparison matrix based on the mobility & infrastructure criteria.
 Table 19. Crisp aggregated pairwise comparison matrix based on the living & services criteria.
 Table 20. Crisp aggregated pairwise comparison matrix based on the people indicators criteria.
- Step 6. After obtaining the crisp aggregated pairwise comparison matrices of each criterion, the priority weights of each criterion and the final general criterion weights are presented in Table 21. The general criterion weights are obtained by multiplying the weights of the relevant main criterion and sub-criteria.
 Table 21. Priority weights and final weights of criteria.
6. Comparative and Sensitivity Analyses
In fuzzy MCDM models, it is essential to address whether slight variations in input parameter values impact the model’s results and to evaluate the outcomes produced by applying other multi-criteria decision-making techniques. Consequently, assessing the robustness of the developed model and analyzing the sensitivity of the results to changes in input variables are crucial steps. In this context, this section of the study is structured into three parts to present validity and sensitivity analyses. The first part validates the results obtained from the proposed CINFU-based MCDM model by comparing them with those generated using spherical fuzzy AHP method. The second part investigates how changes in the criteria weights influence the ranking results. Lastly, the third part evaluates the impact of variations in decision-makers’ weight assignments on the rankings.
6.1. Comparative Analysis
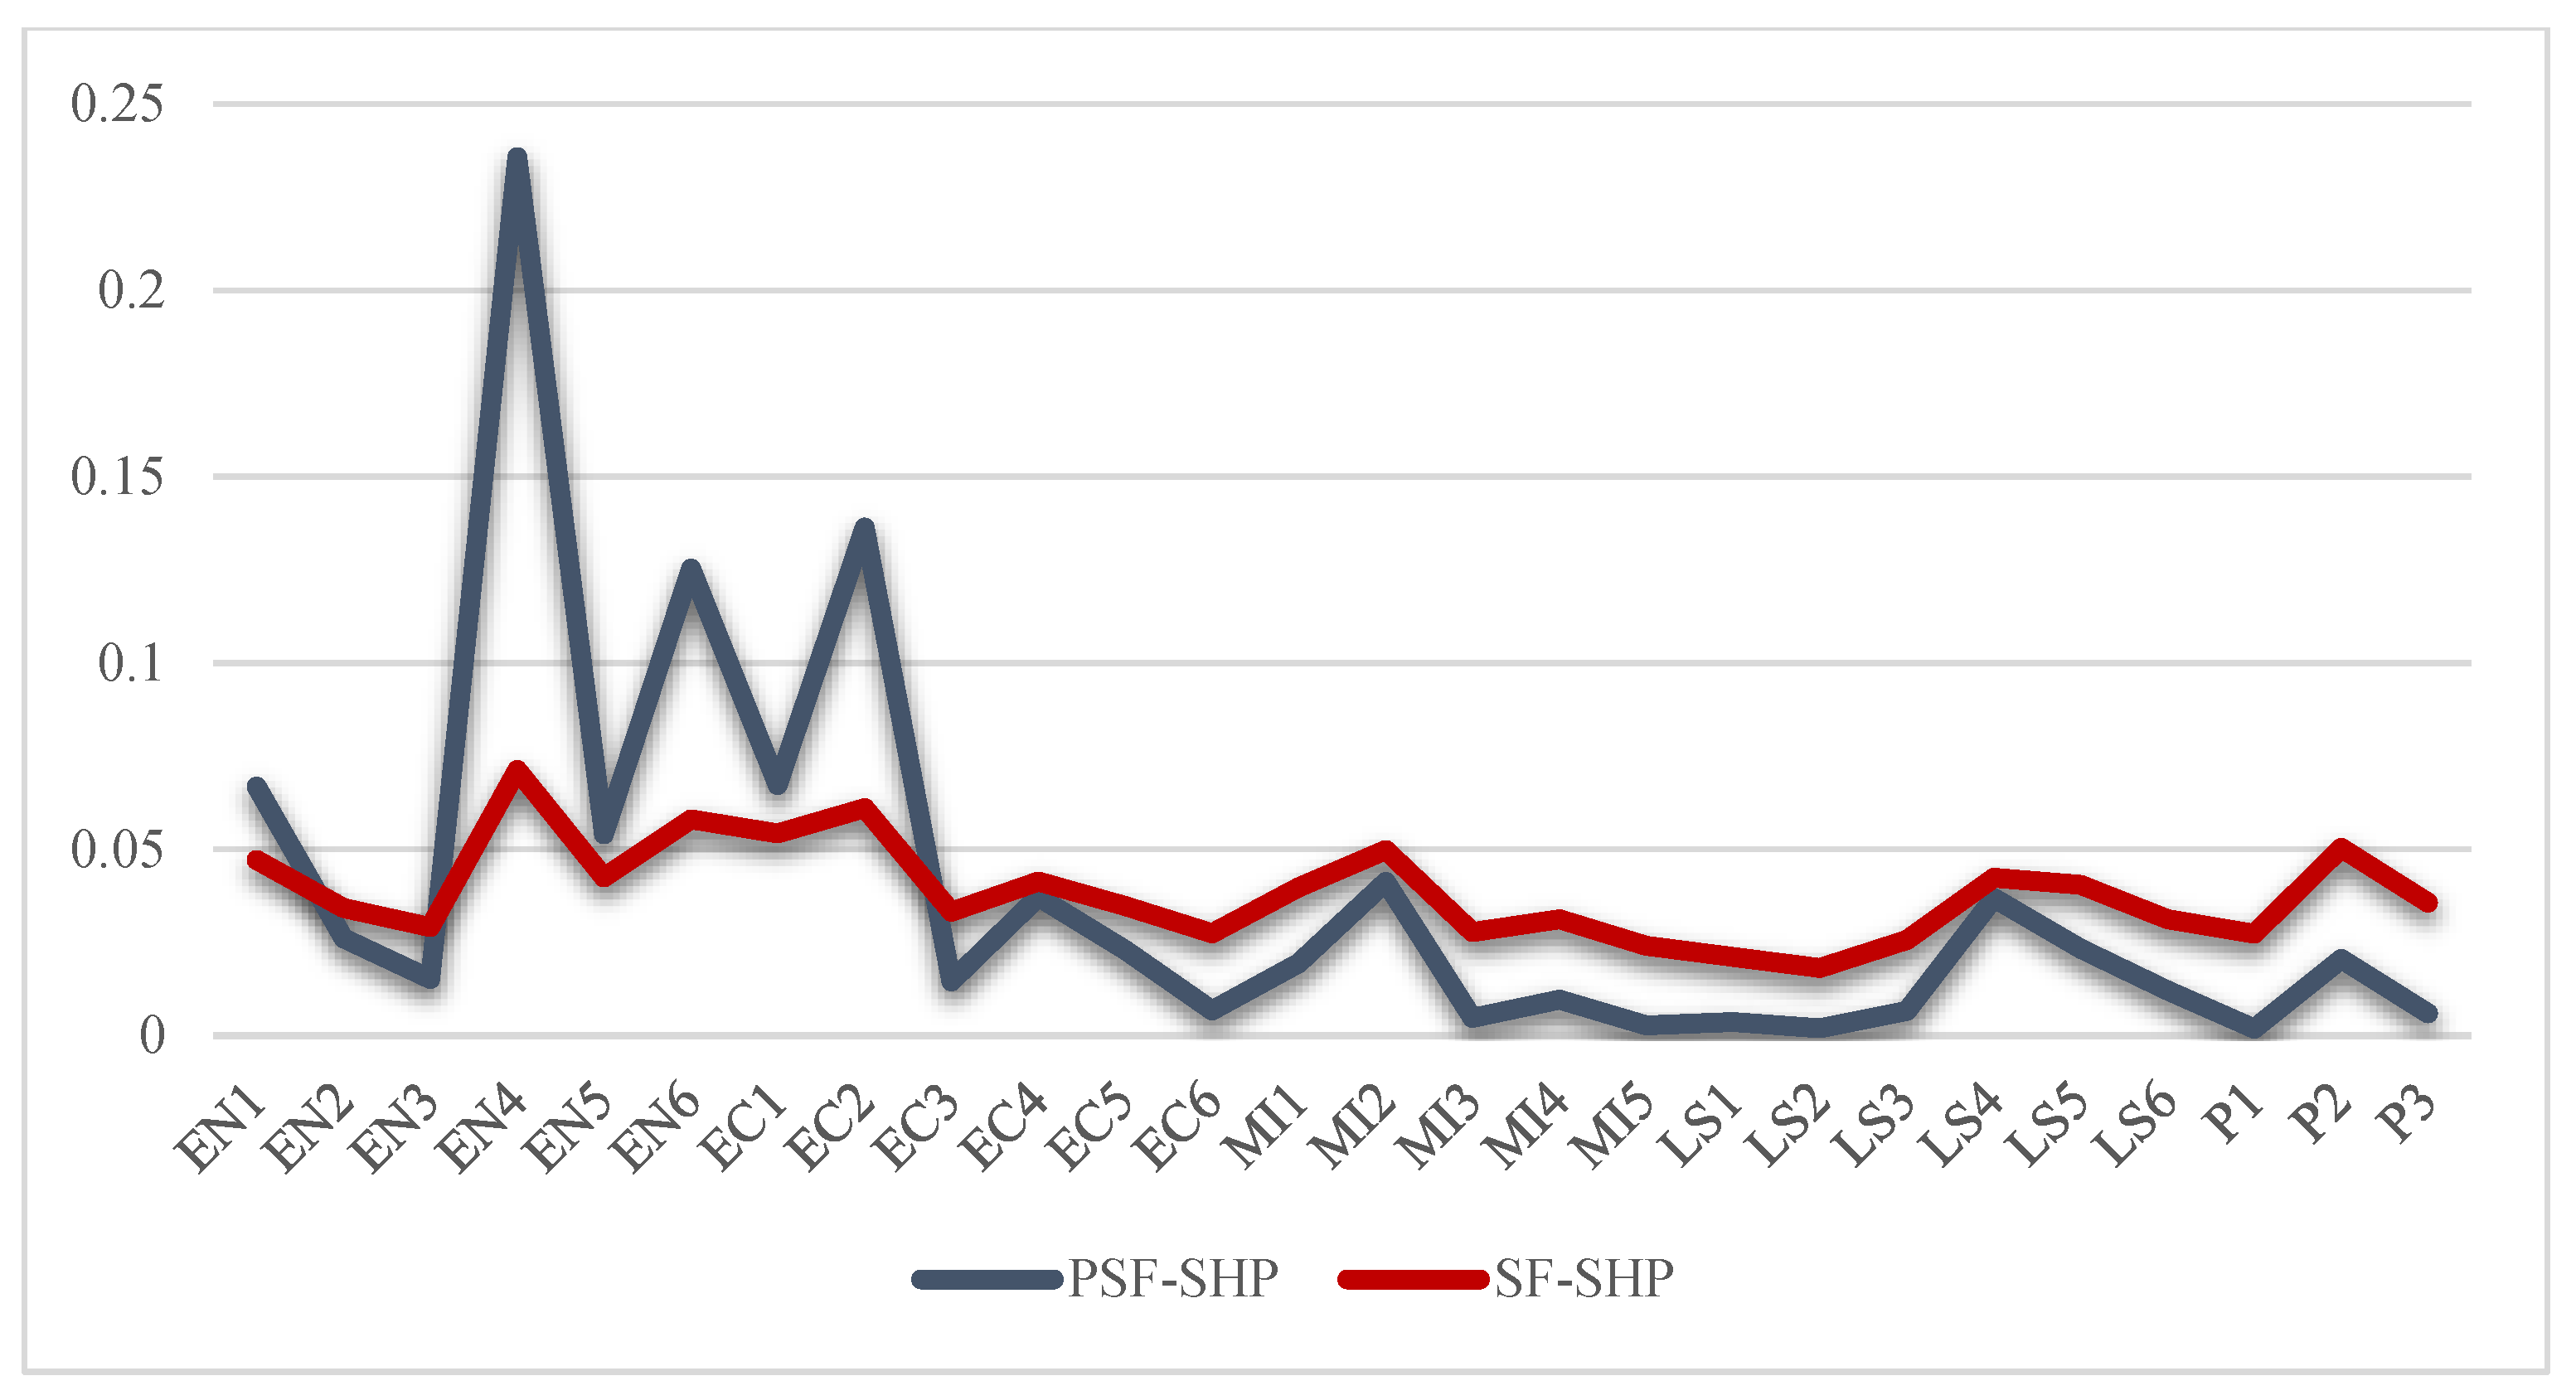
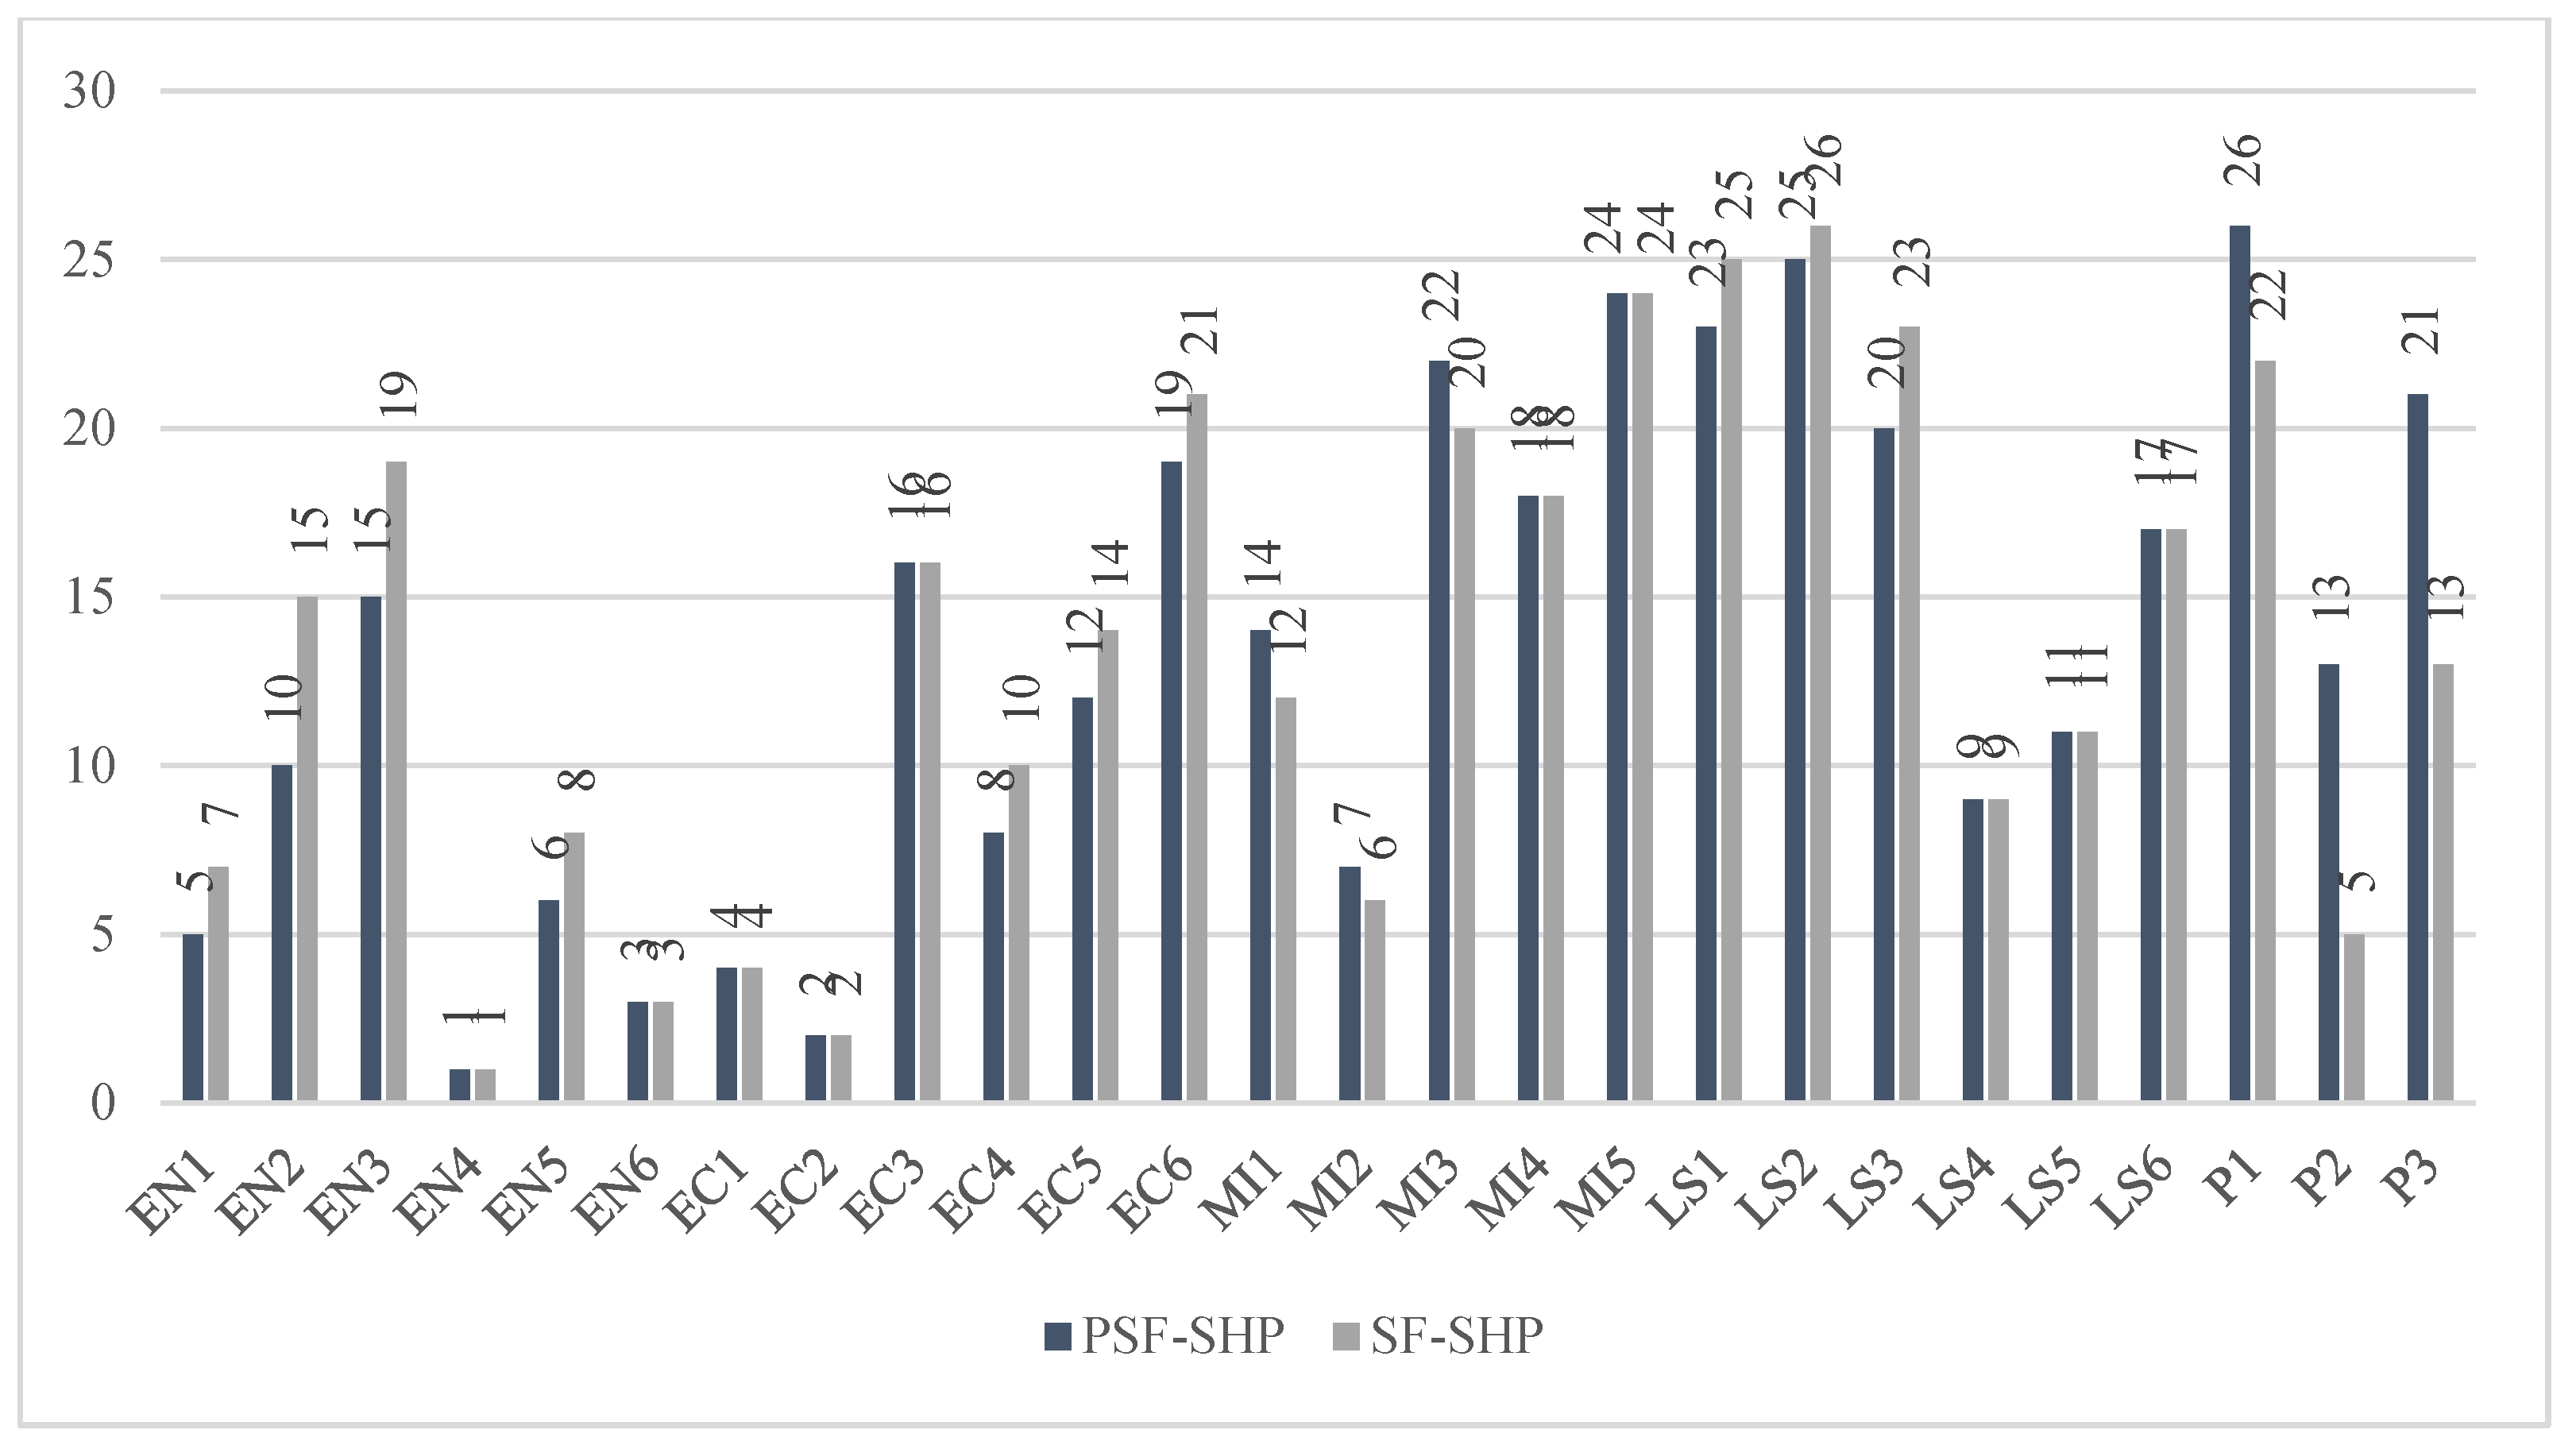
PSF AHP s based on the proportions between the parameters of a SF set. This provides a more consistent, flexible, and correct assignment of degrees in the multi-criteria evaluation of human-centric and sustainable cities with respect to the other MCDM methods. To validate the effectiveness and accuracy of the PSF-AHP method, a comparative analysis has been conducted against widely recognized MCDM method, spherical fuzzy AHP (SF-AHP). The considering method has been applied to the same dataset under identical conditions, ensuring a consistent and unbiased comparison framework by taking into account the spherical fuzzy numbers corresponding to the linguistic terms based on the spherical fuzzy sets given in Table 22. The weights of the criteria and the ranking results obtained in the comparison analysis have been presented in Figure 2 and Figure 3, respectively.

Table 22.
Linguistic spherical fuzzy scale.
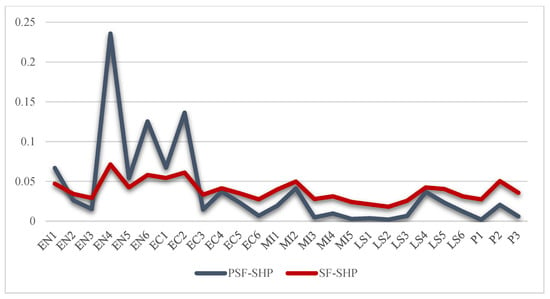
Figure 2.
Criteria weights of compared methods.
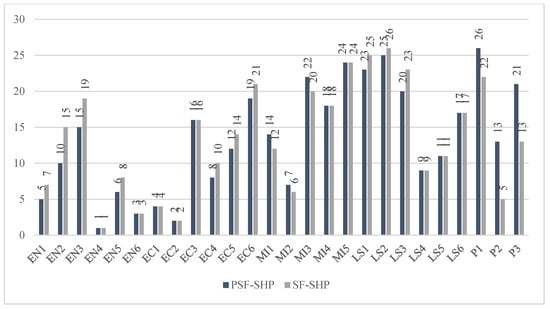
Figure 3.
Ranking results of compared methods.
Spearman’s rank correlation coefficient was employed to determine whether there exists a statistically significant relationship between the rankings derived from the developed model and those obtained from the compared methods. The analysis revealed a strong correlation, with correlation value 0.922. These findings indicate that the rank differences between the developed model and the compared method are statistically insignificant, demonstrating that the developed model aligns closely with the results of the alternative methods. Based on this analysis, it can be concluded that the developed method produces reliable results, with the criterion EN4—Water Management and Conservation—emerging as the most appropriate criterion among human-centric and sustainable city criteria. The PSF-AHP method has demonstrated superior capability in handling uncertainty and proportional relationships in decision-making, which has been reflected in higher ranking consistency. Another significant outcome of the comparative analysis is that the PSF-AHP method demonstrates an enhanced ability to deliver more accurate prioritizations due to its proportional approach, particularly in cases where the criteria involve conflicting human-centric and sustainability factors. Thus, the comparative findings highlight the versatility and reliability of the PSF-AHP method, not only in producing robust rankings, but also in its adaptability to various multi-criteria decision-making scenarios.
6.2. Sensitivity Analyses
Sensitivity analysis is a critical step in validating the robustness of decision-making models, particularly in the context of Fuzzy MCDM methods. In this study, the sensitivity of the model’s outcomes to variations in key input parameters is analyzed comprehensively. The analysis has been considered in two dimensions.
6.2.1. Effect of Changes in Main Criteria Weights
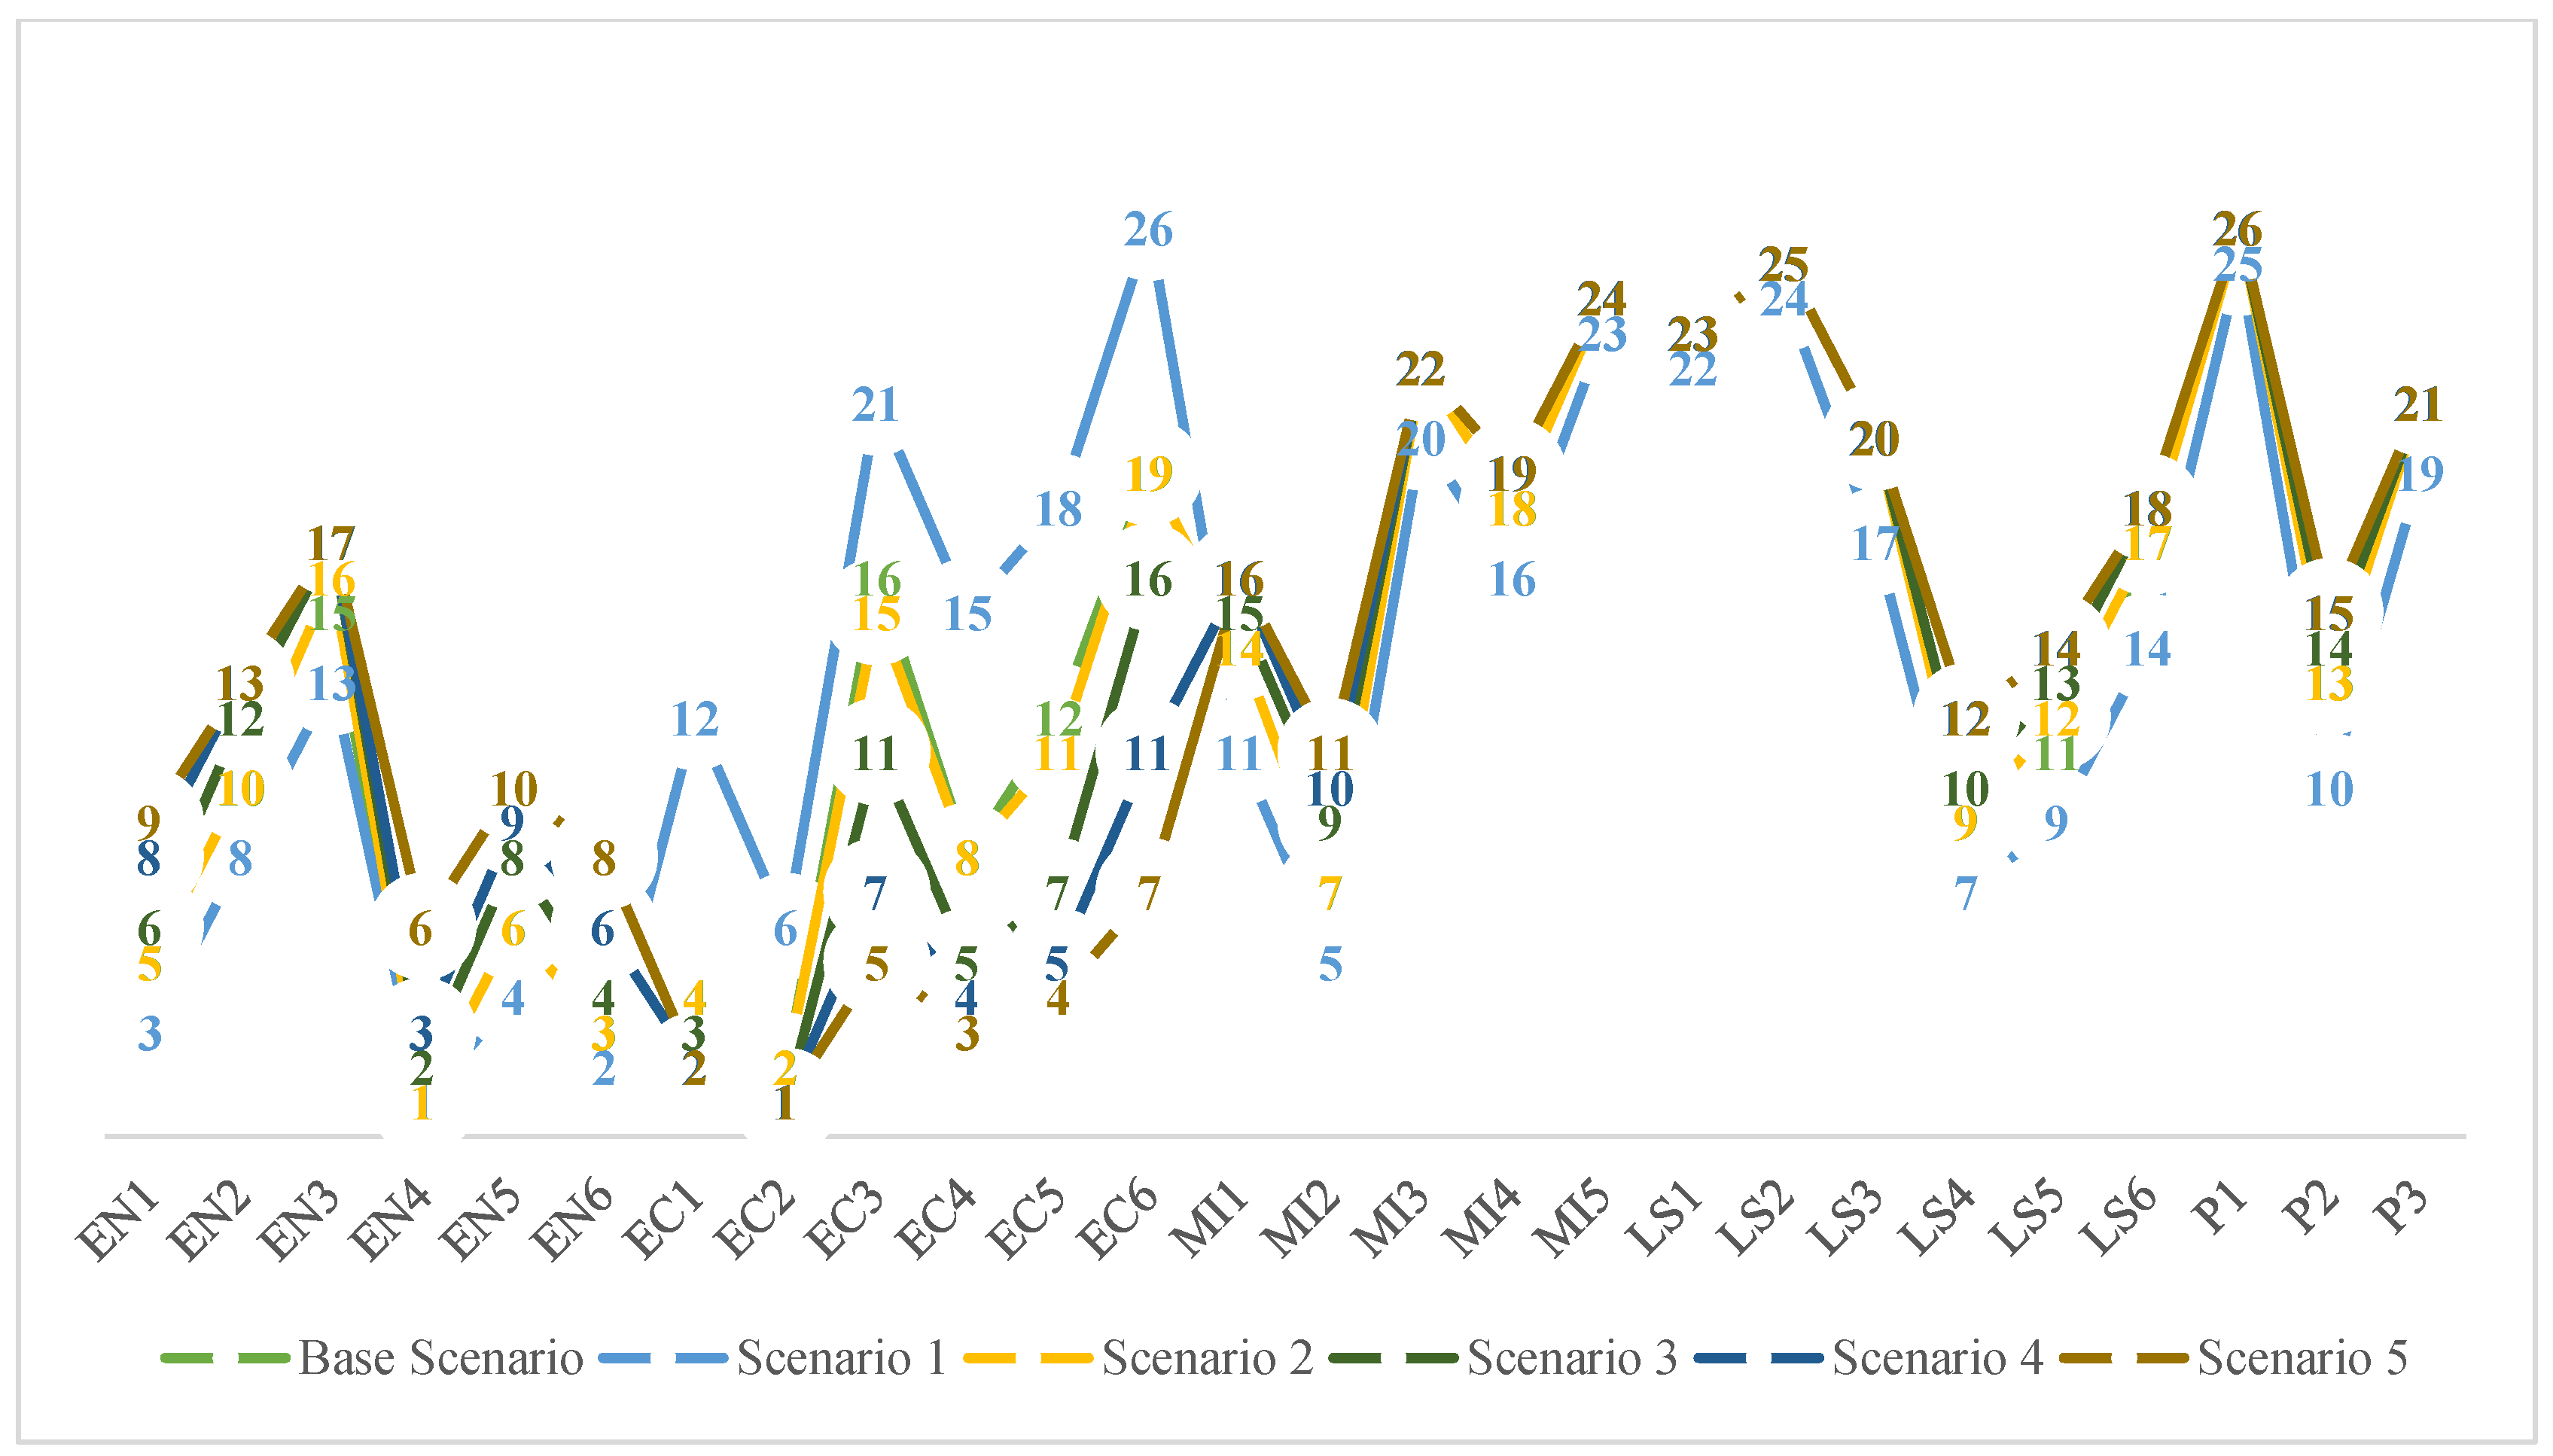
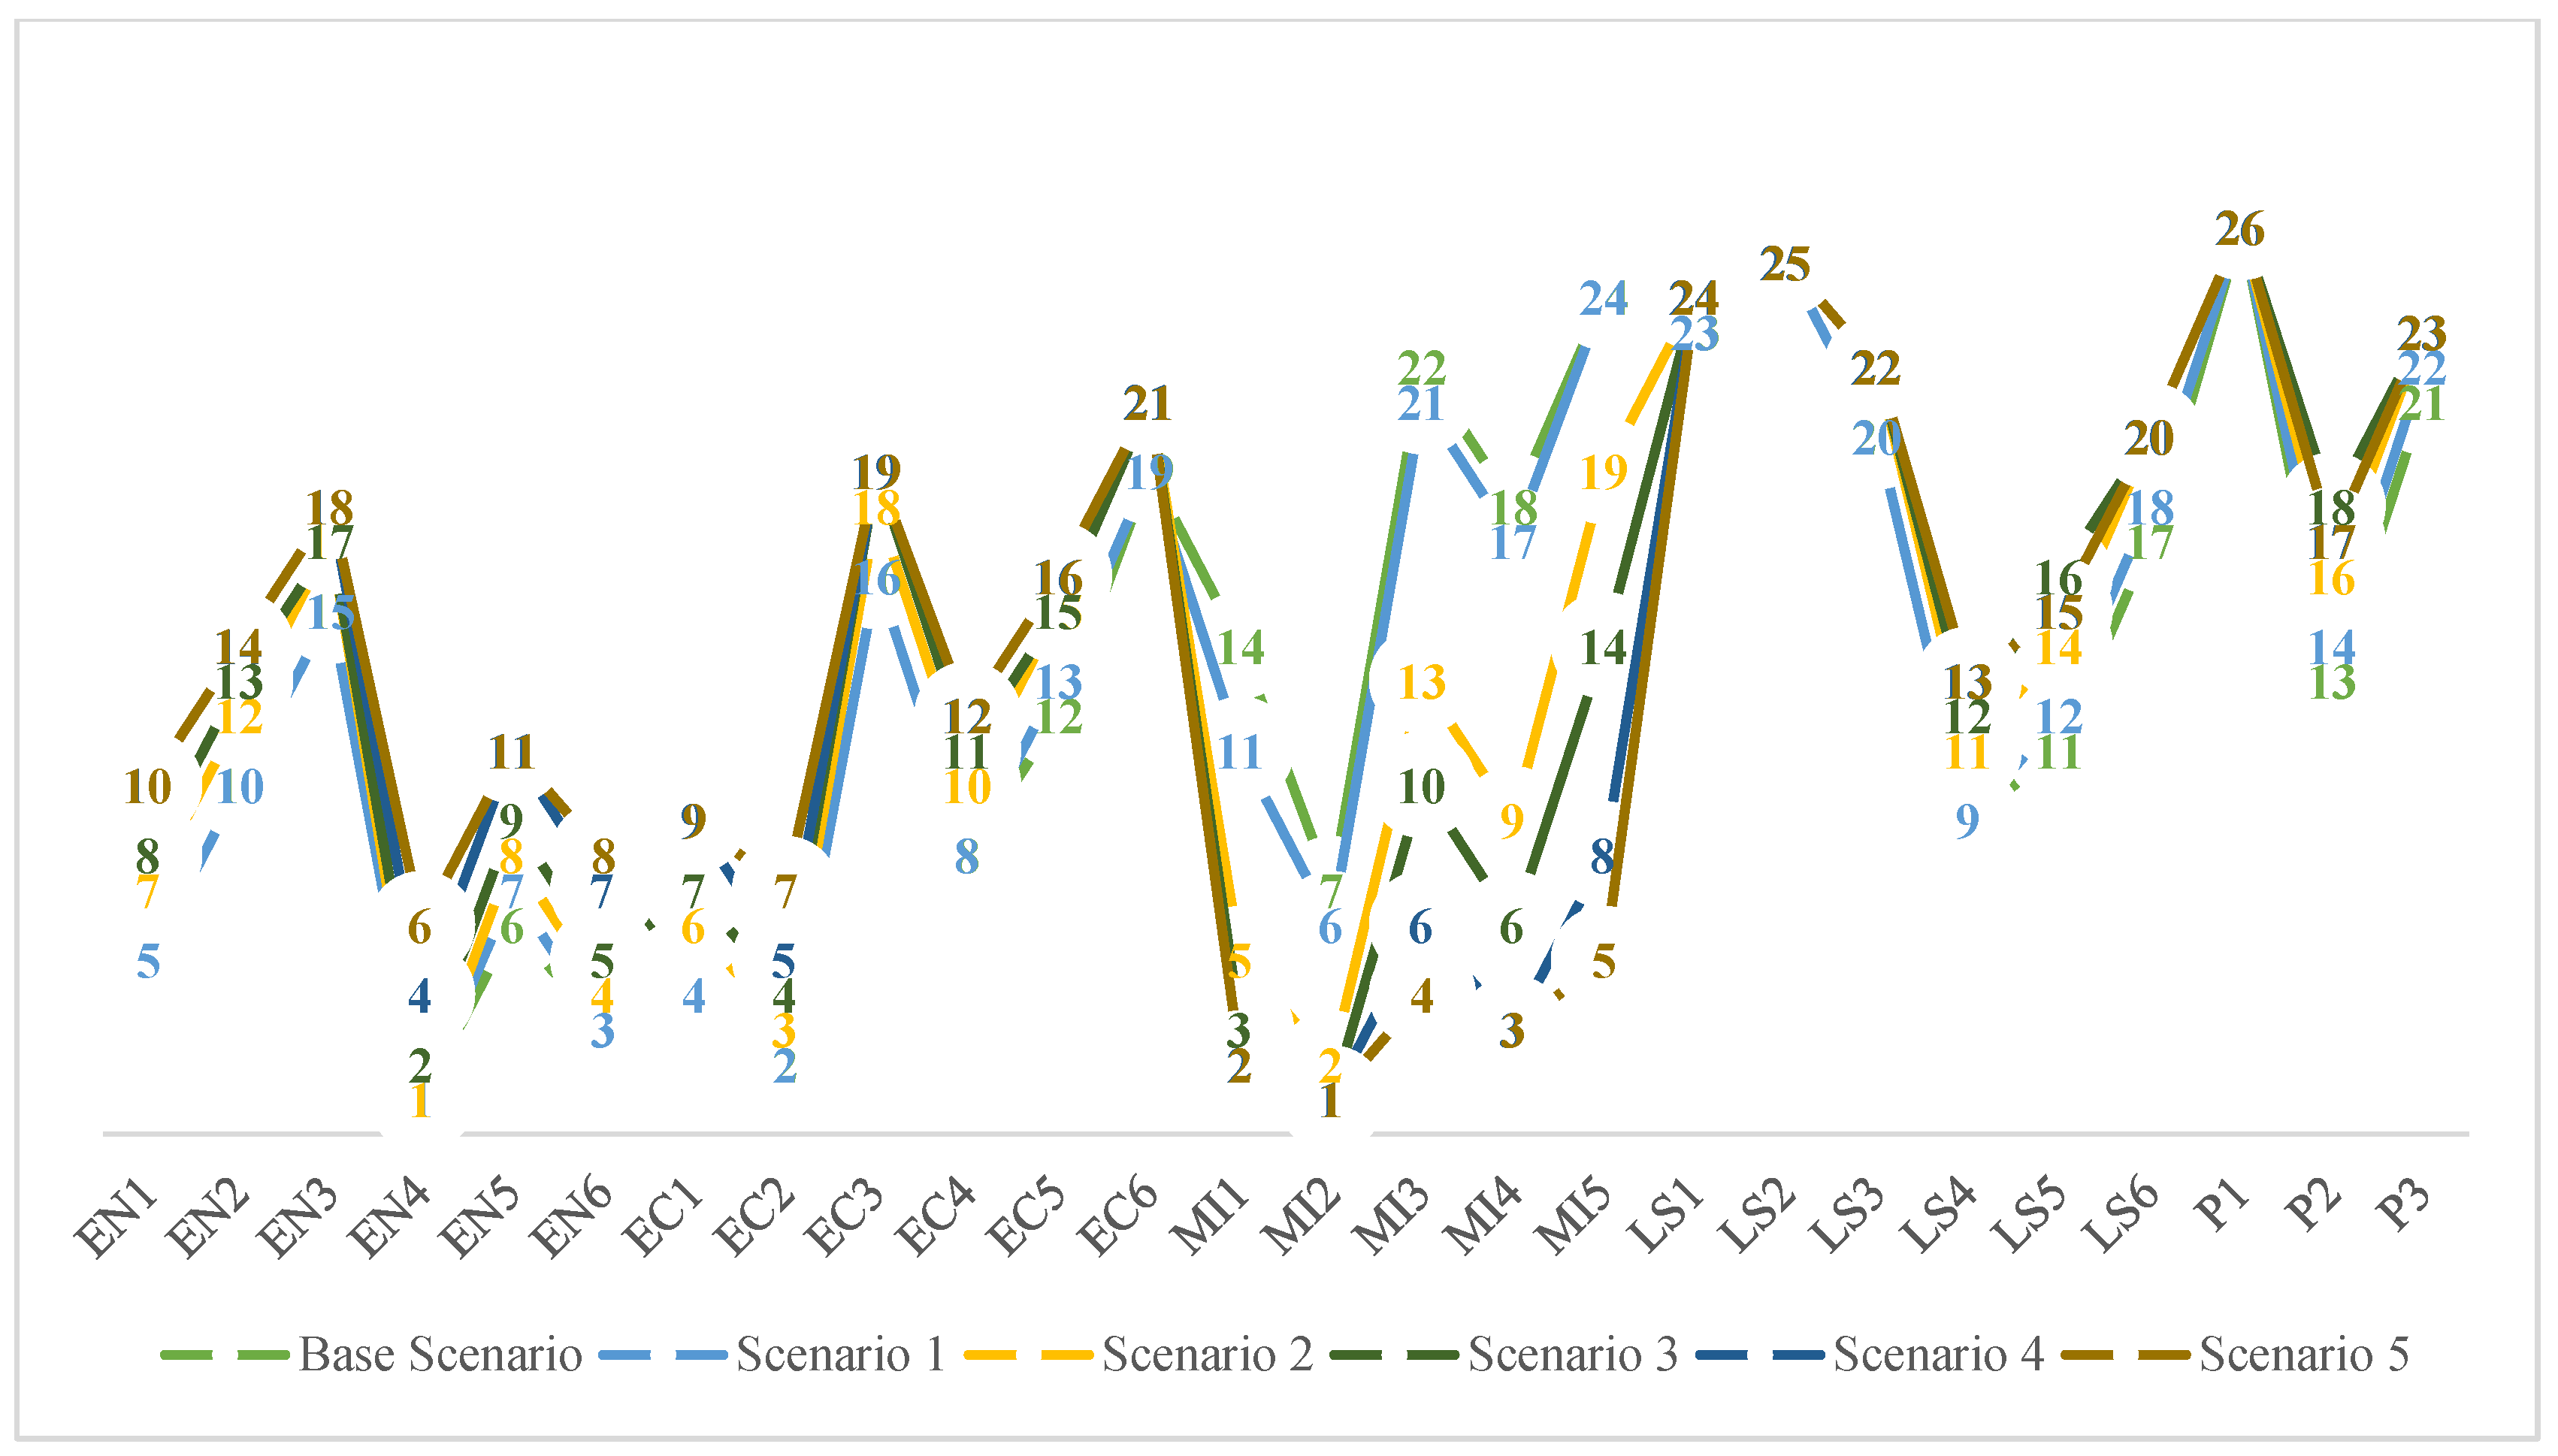
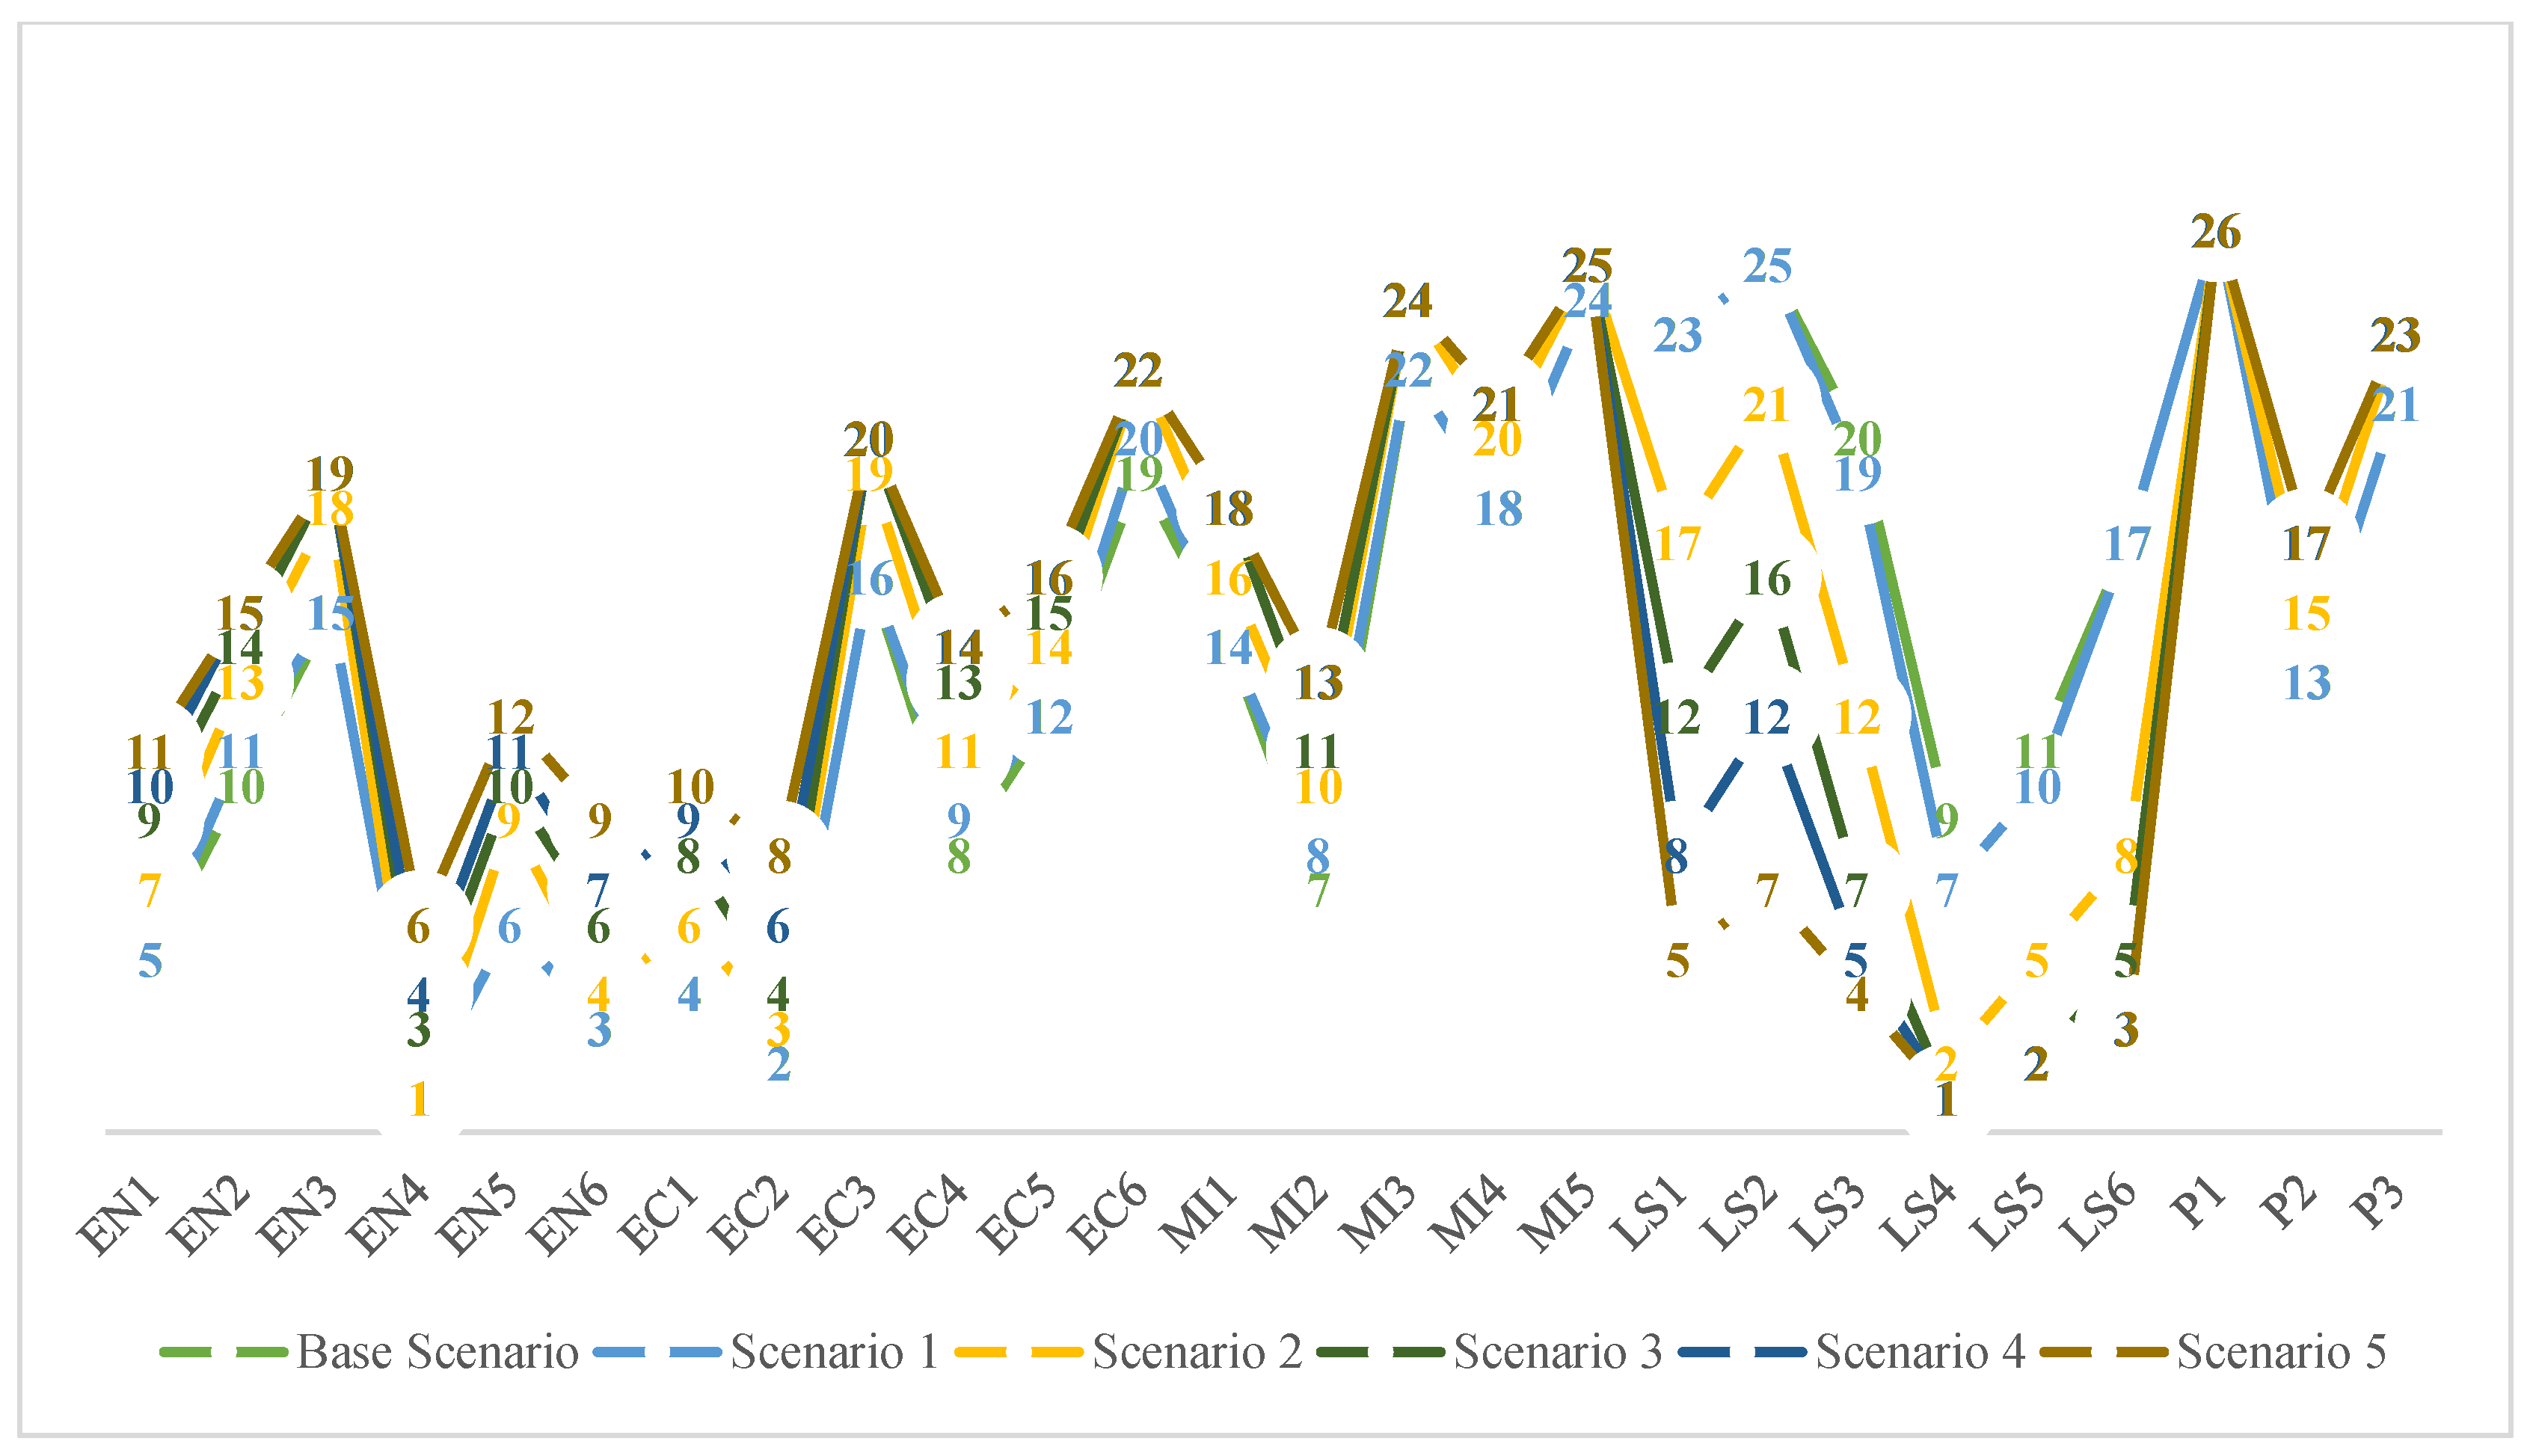
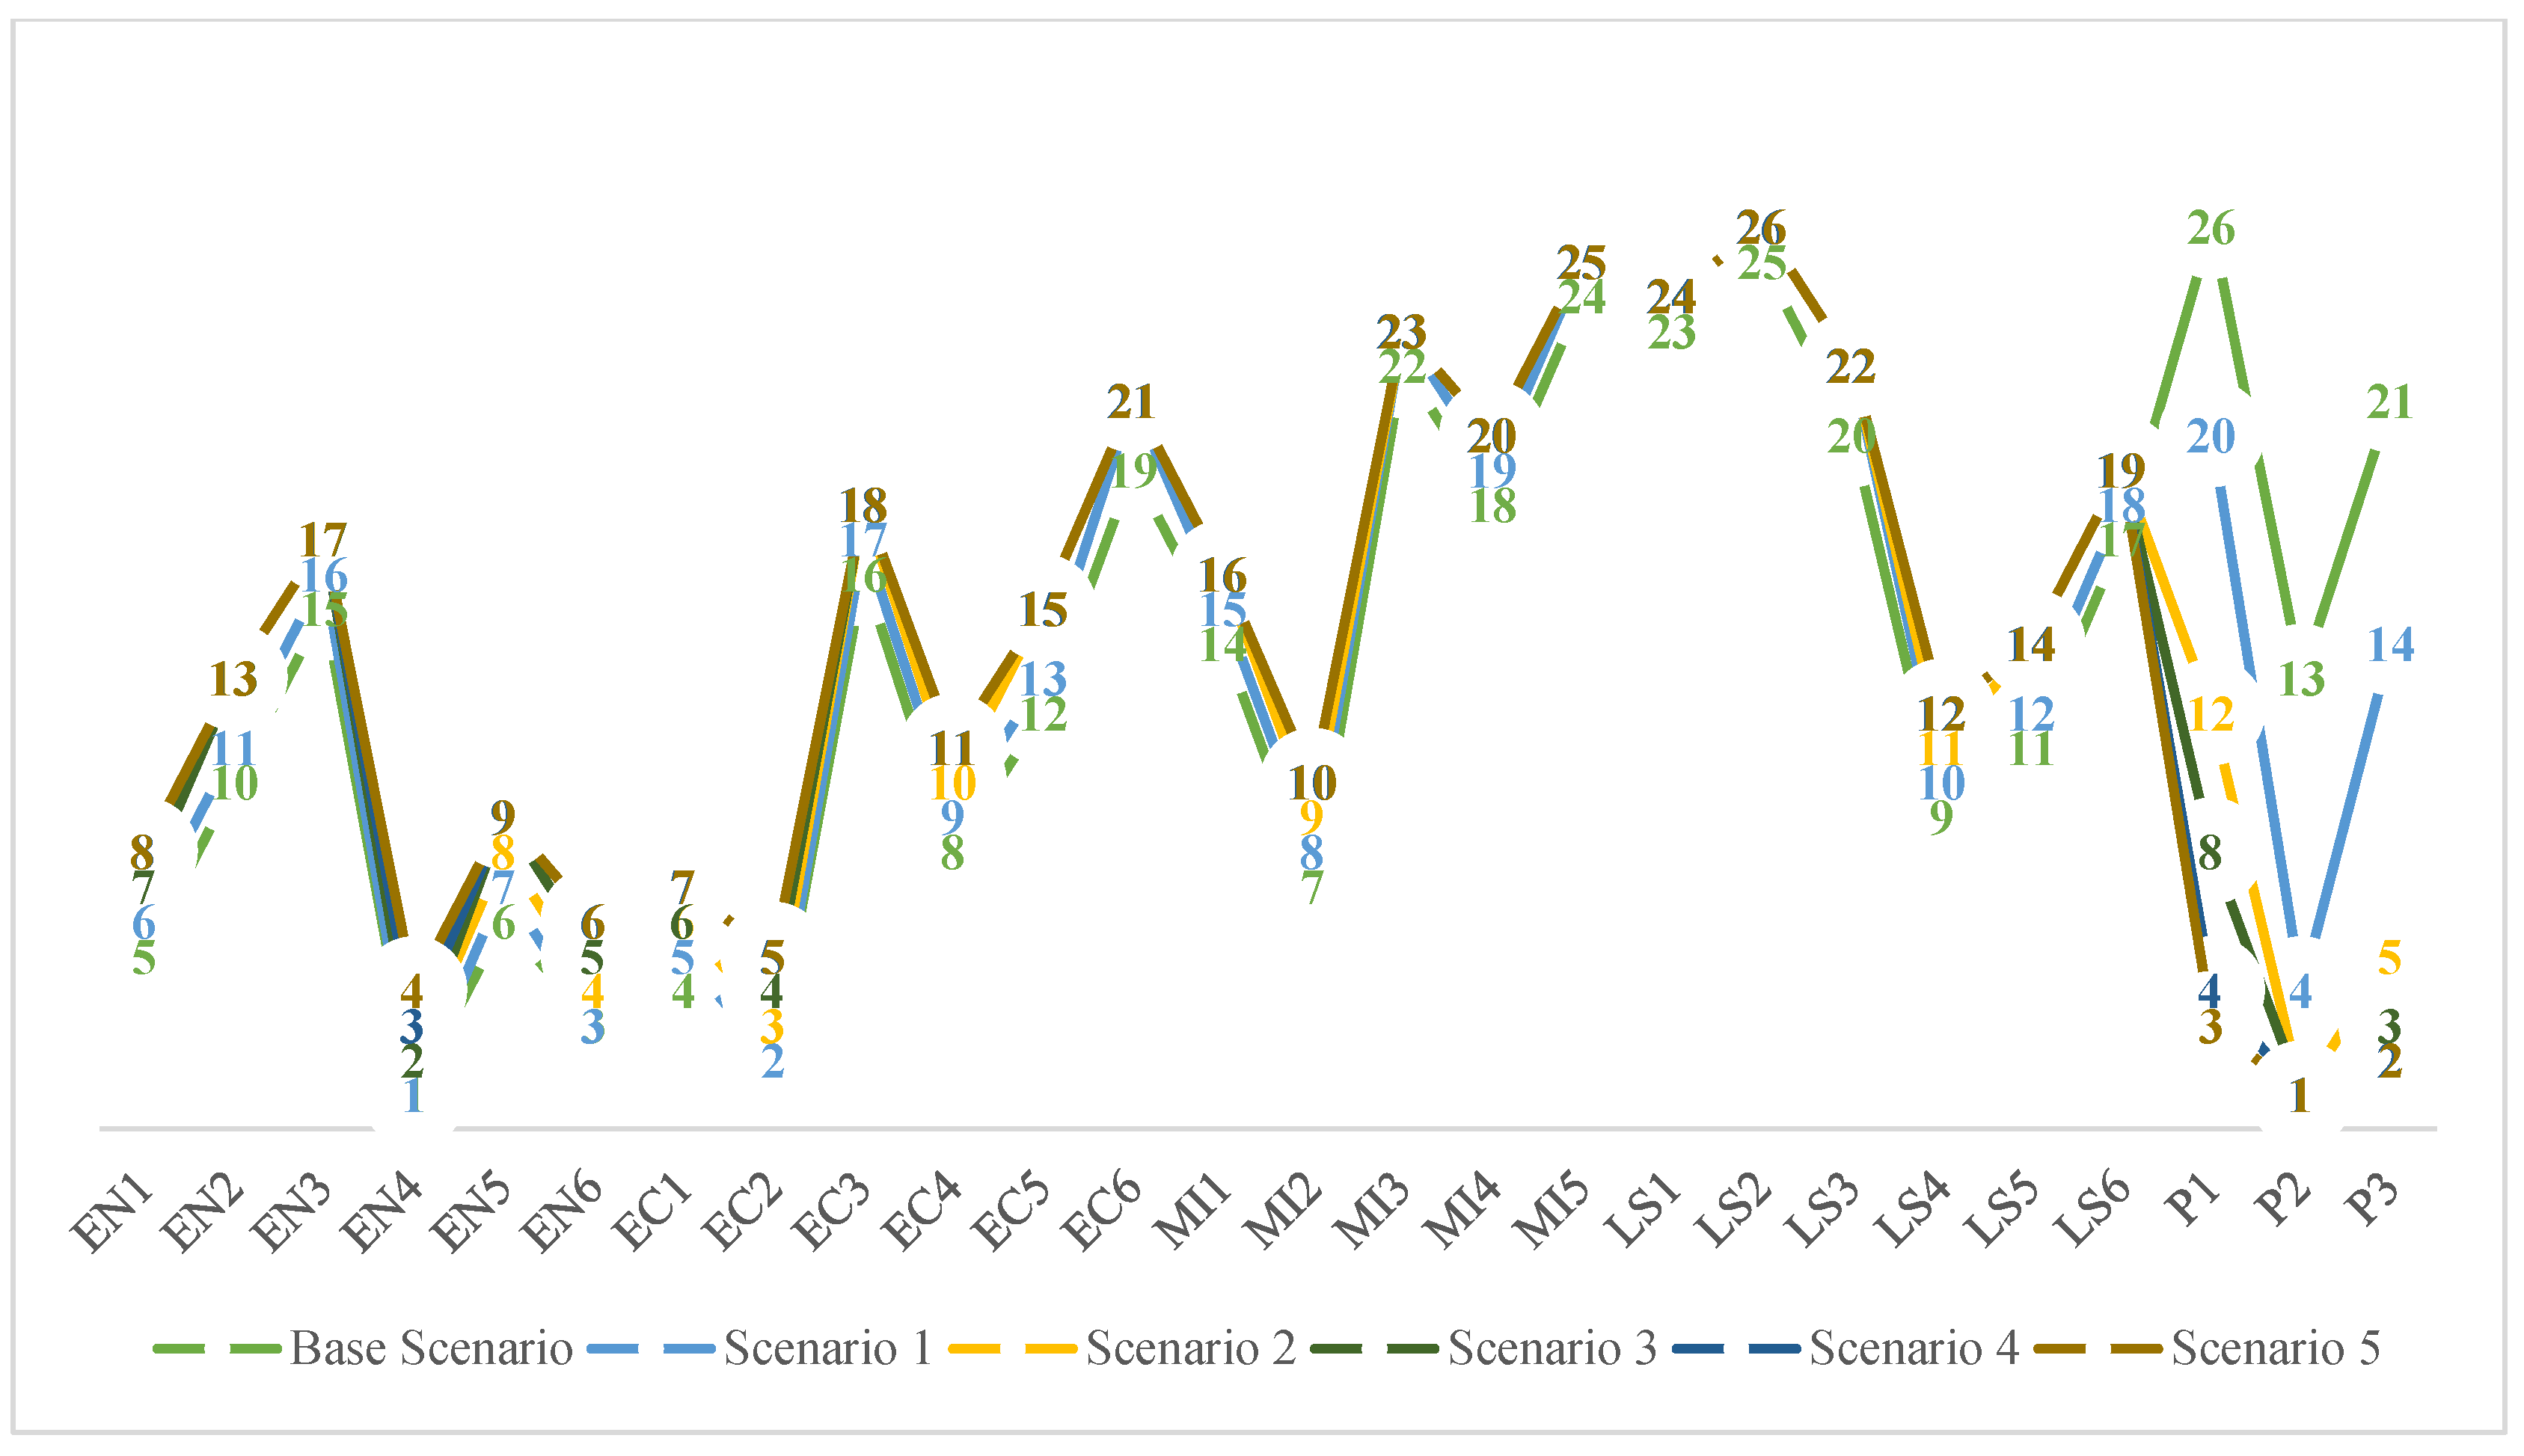
Since even small deviations in main criteria weights can potentially alter the ranking outcomes of the criteria, it is essential to consider such variations. To address this, the sensitivity analysis in this section evaluates the impact on the final scores and ranking performance of the criteria of changes in main criteria weights. A comprehensive sensitivity analysis involving 25 distinct scenarios has been carried out to assess how alterations in each main criterion’s weight influence the final outcomes. Specifically, five different weight adjustments have been applied to each criterion, incrementally increasing its weight: 0.1, 0.3, 0.5, 0.7 and 0.9. In each scenario, as the weight of a particular criterion was varied, the weights of the remaining criteria were adjusted to maintain consistency by using Equation (22) as shown in Table 23, Table 24, Table 25, Table 26 and Table 27 for main criteria, respectively.
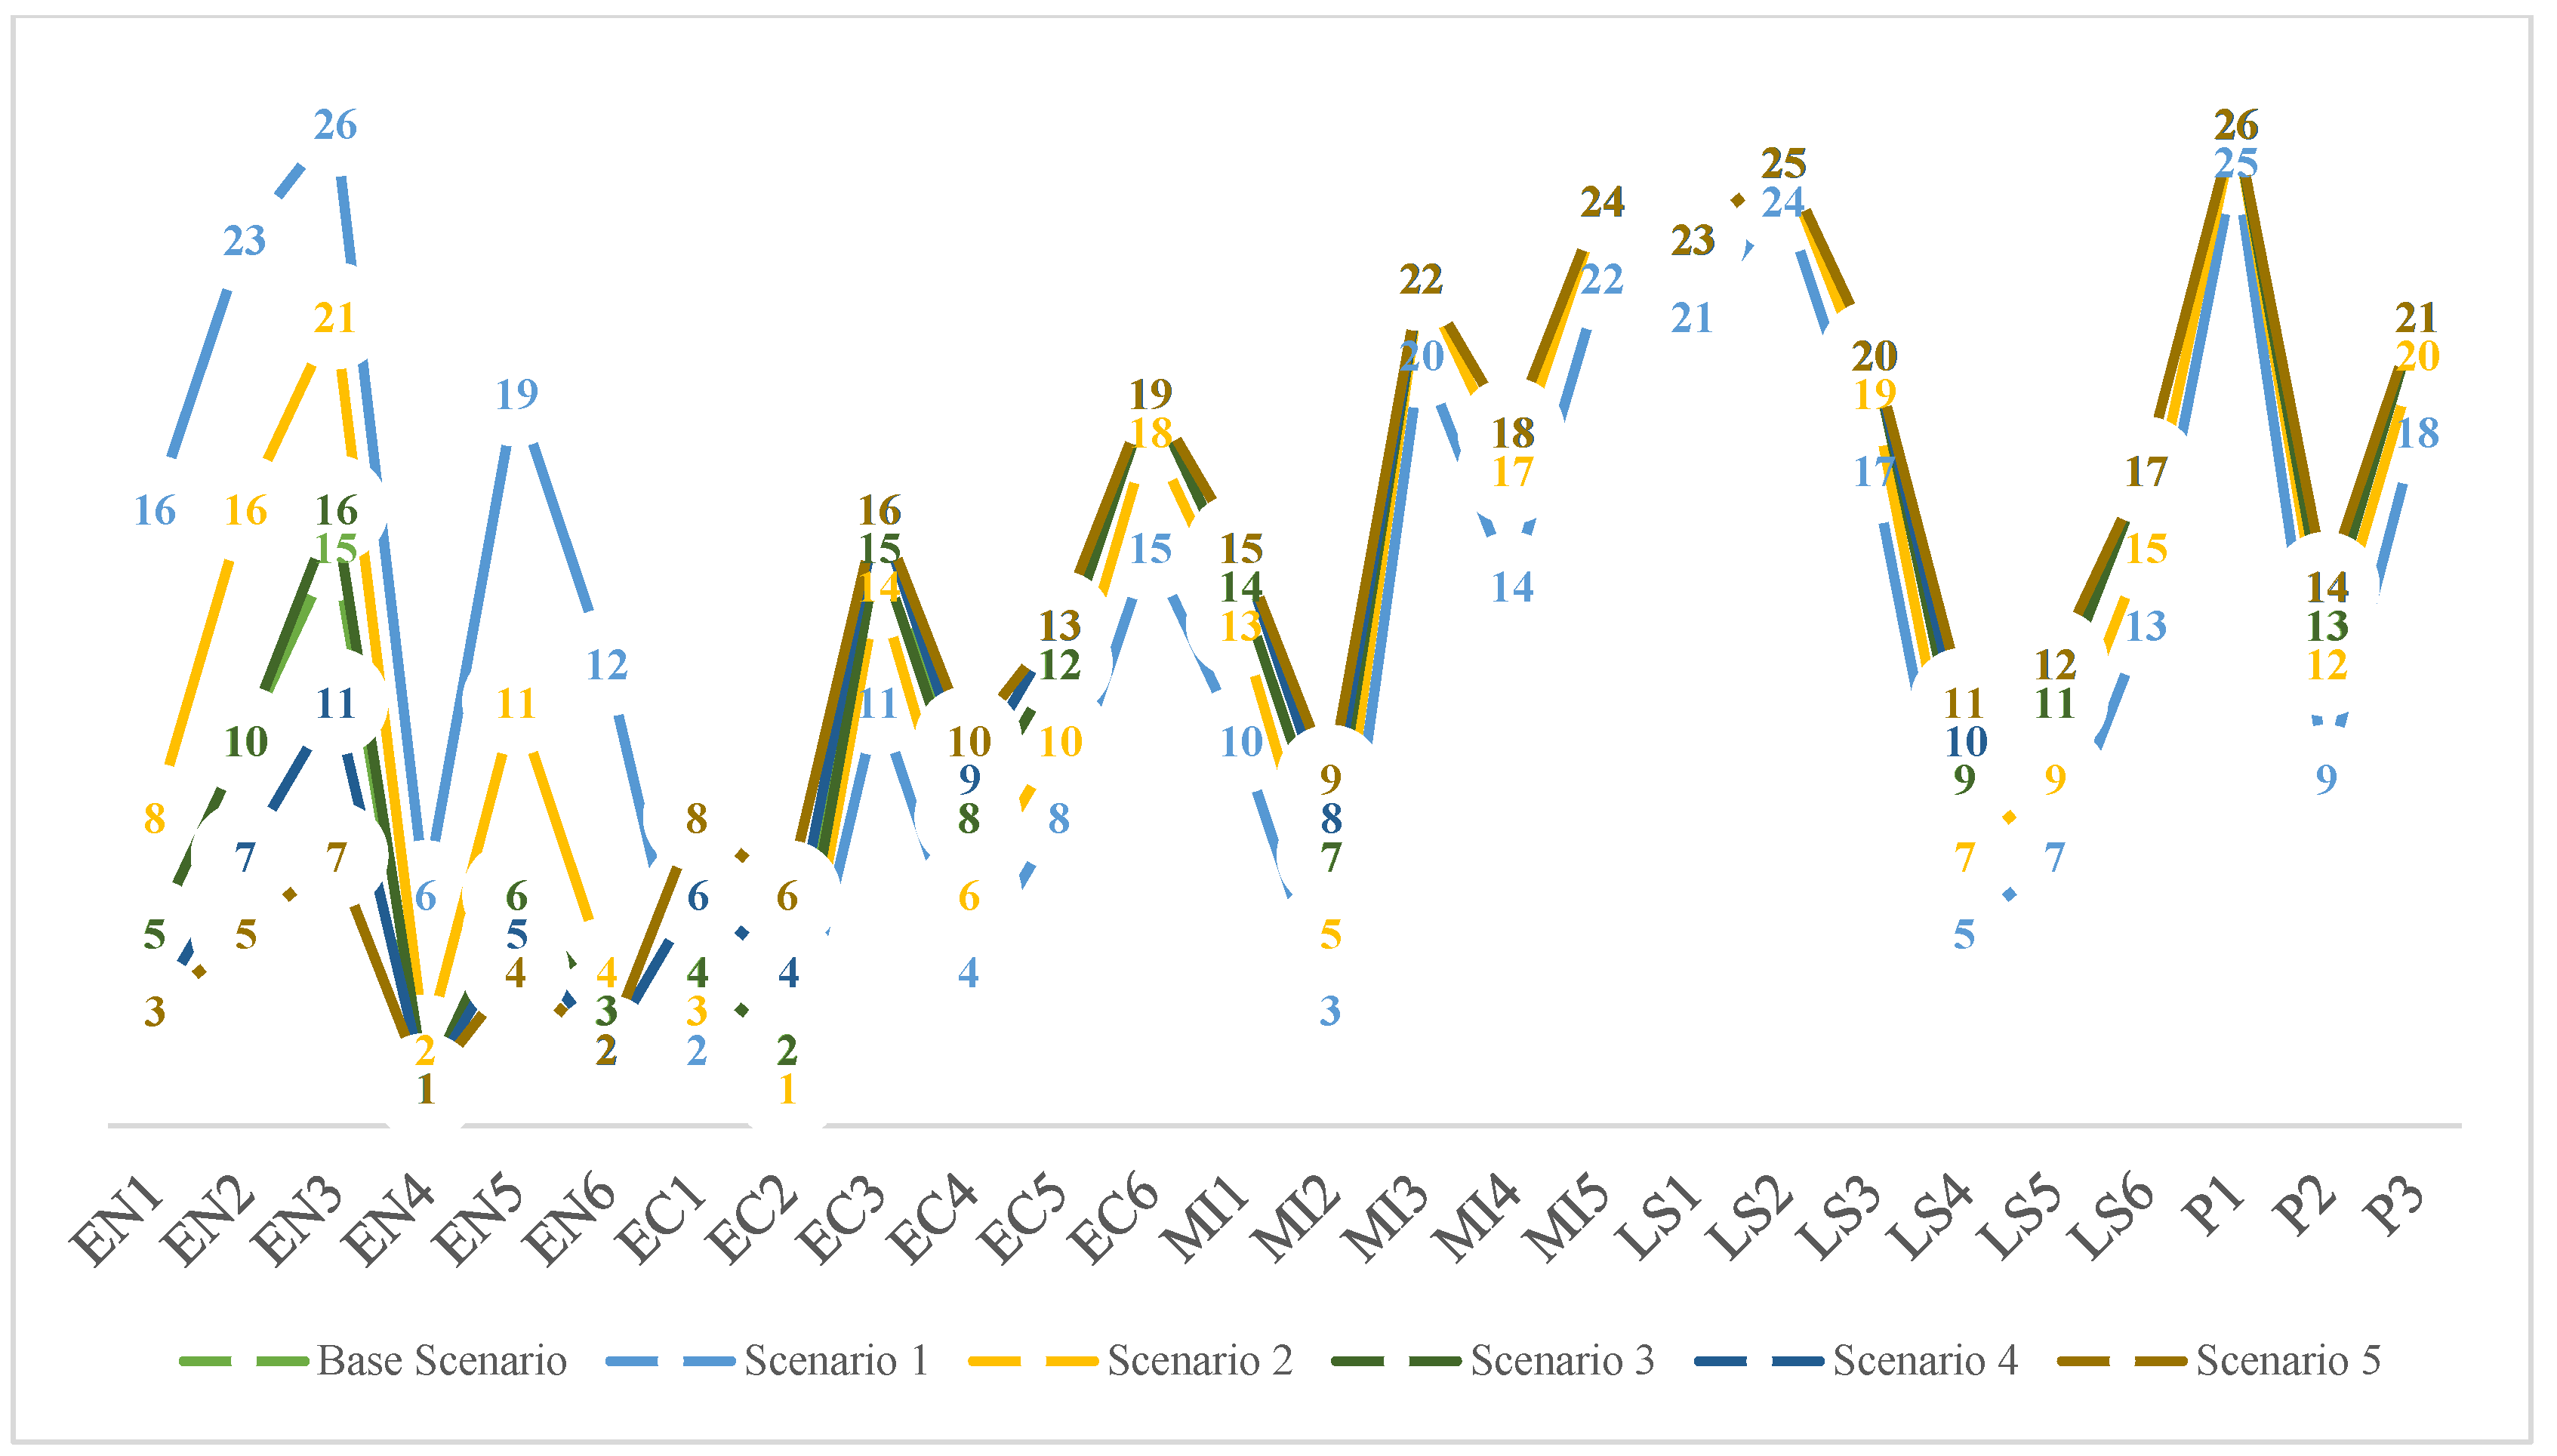
where represents the adjusted value of the criterion under consideration; indicates the changed value of the criterion whose weight was changed; indicates the original value of the considered criterion and defines the original value of criterion whose weight was changed. The effects of changes in the weights of the main criteria on the final ranking of the criteria have been presented in Figure 4, Figure 5, Figure 6, Figure 7 and Figure 8, respectively. Moreover, the relationship between the rankings of the criteria in the scenarios created based on the changes in the weight of each main criterion and the rankings obtained according to the basic scenario has been checked with Spearman’s rank correlation coefficient as presented in Table 28.

Table 23.
Scenarios based on changes in EN main criterion weight.

Table 24.
Scenarios based on changes in EC main criterion weight.

Table 25.
Scenarios based on changes in MI main criterion weight.

Table 26.
Scenarios based on changes in LS main criterion weight.

Table 27.
Scenarios based on changes in P main criterion weight.
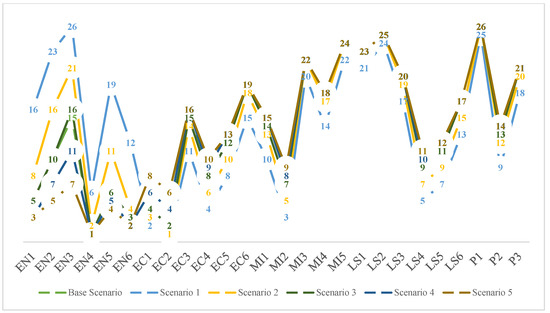
Figure 4.
Ranking effect on the criteria of the change in the weight of criterion EN.
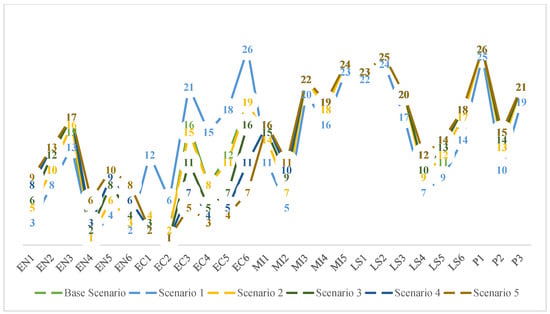
Figure 5.
Ranking effect on the criteria of the change in the weight of criterion EC.
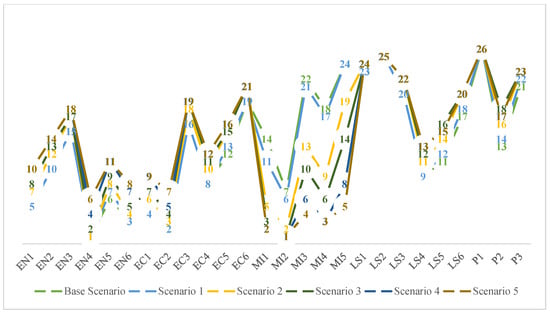
Figure 6.
Ranking effect on the criteria of the change in the weight of criterion MI.
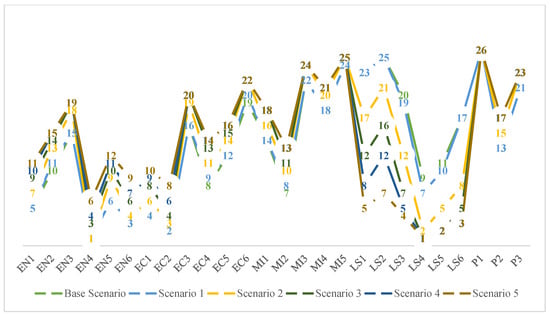
Figure 7.
Ranking effect on the criteria of the change in the weight of criterion LS.
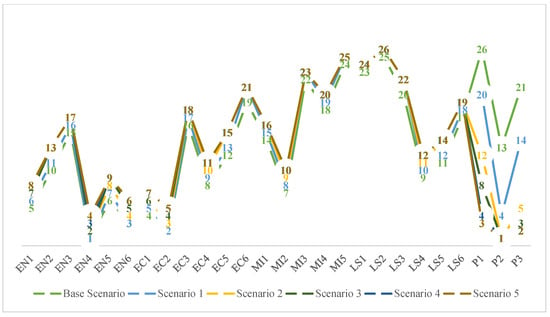
Figure 8.
Ranking effect on the criteria of the change in the weight of criterion P.

Table 28.
Correlations between the ranking orders of the base scenario and each scenario.
According to the results obtained, when the weight of the EN main criterion was reduced to 0.1 and 0.3, it was seen that the most important criterion EN4 was ranked sixth and second, respectively. Additionally, it was observed that when the weight of the EN main criterion was reduced to 0.1, the lowest-ranked criterion was EN3, whereas reducing it to 0.3 did not change the ranking position of P1 as the lowest-ranked criterion. When the weight of the EN main criterion was increased, no changes have been observed in the rankings of EN4 as the most important criterion and P1 as the lowest-ranked criterion. For the other criteria, only minor variations have been identified in their rankings depending on the changes in the weight of the EN main criterion. These findings have been confirmed by the high correlation results, as shown in Table 28.
When the weight of the EC main criterion was increased to 0.5, 0.7, and 0.9, EN4, which was initially the most important criterion, ranked second, third, and sixth, respectively, while EC2 has emerged as the most important criterion. Conversely, when the weight of the EC main criterion was decreased, no changes have been observed in the ranking of the most important criterion. Regarding the lowest-ranked criterion, P1, it has been noted that its ranking changed only when the weight of the EC main criterion was reduced to 0.1, with no changes occurring for other weights. Furthermore, for the remaining criteria, only minor variations have been observed in their rankings due to changes in the weight of the EC main criterion. These findings have been confirmed by the high correlation results, as shown in Table 28.
As shown in Figure 6, when the weight of the MI main criterion was increased to 0.5, 0.7, and 0.9, EN4, which was initially the most important criterion, ranked second, fourth, and sixth, respectively, with MI2 being identified as the most important criterion at these weights. It has been observed that all weight changes of the MI main criterion had no effect on the ranking of the lowest-ranked criterion, P1, which remained constant. For the other criteria, only minor variations have been observed in their rankings at lower weights of the MI main criterion, with no significant changes. These findings have been confirmed by the high correlation results obtained in Table 28. Additionally, as the weight of the MI main criterion increased, the differences became relatively more noticeable, as reflected in the correlation results presented in Table 28.
As shown in Figure 7, when the weight of the LS main criterion was adjusted to 0.5, 0.7, and 0.9, EN4, which was initially the most important criterion, ranked third, fourth, and sixth, respectively, with LS4 emerging as the most important criterion at these weights. It has been observed that all weight changes in the LS main criterion did not affect the ranking of the lowest-ranked criterion, P1, which remained constant. For the other criteria, only minor variations were noted in their rankings at lower weights of the LS main criterion, with no significant changes. These findings were confirmed by the high correlation results obtained in Table 28. Besides, as the weight of the LS main criterion increased, the differences became relatively more pronounced, as evidenced by the correlation results in Table 28.
When the weight of the P main criterion was adjusted to 0.3, 0.5, 0.7, and 0.9, it has been observed that the ranking of EN4, initially the most important criterion, changed, with P2 emerging as the most important criterion. In the base scenario, the lowest-ranked criterion, P1, has exhibited significant changes in its ranking depending on the variations in the weight of the P main criterion. Across all weight adjustments of the P main criterion, LS2 consistently has remained the lowest-ranked criterion. For the other criteria, only minor variations have been observed in their rankings at lower weights of the P main criterion, with no significant changes. These findings have been validated by the high correlation results presented in Table 28. Additionally, as the weight of the P main criterion increased, the differences became relatively more pronounced, as reflected in the correlation results shown in Table 28.
The results of the sensitivity analysis indicate that, despite significant changes in the weights of the criteria, criterion Energy Consumption (EN4) continued to dominate as the most influential criterion, while criterion ICT Skills (P1) remained the least effective, with no alterations in their rankings. The changes in the weights of the main criteria EC, MI, LS, and P have almost no impact on the ranking of the other criteria. The policy makers should give the largest importance to environmental issues of the human-centric and sustainable cities, and then to economic issues. Energy consumption among environmental issues should be given the maximum priority. Employment/unemployment rates under economic issues and carbon emission reduction strategies under environmental issues are the other two sub-criteria that the maximum priority should be given by the policy makers.
6.2.2. Effect of Changes in Weights of Experts
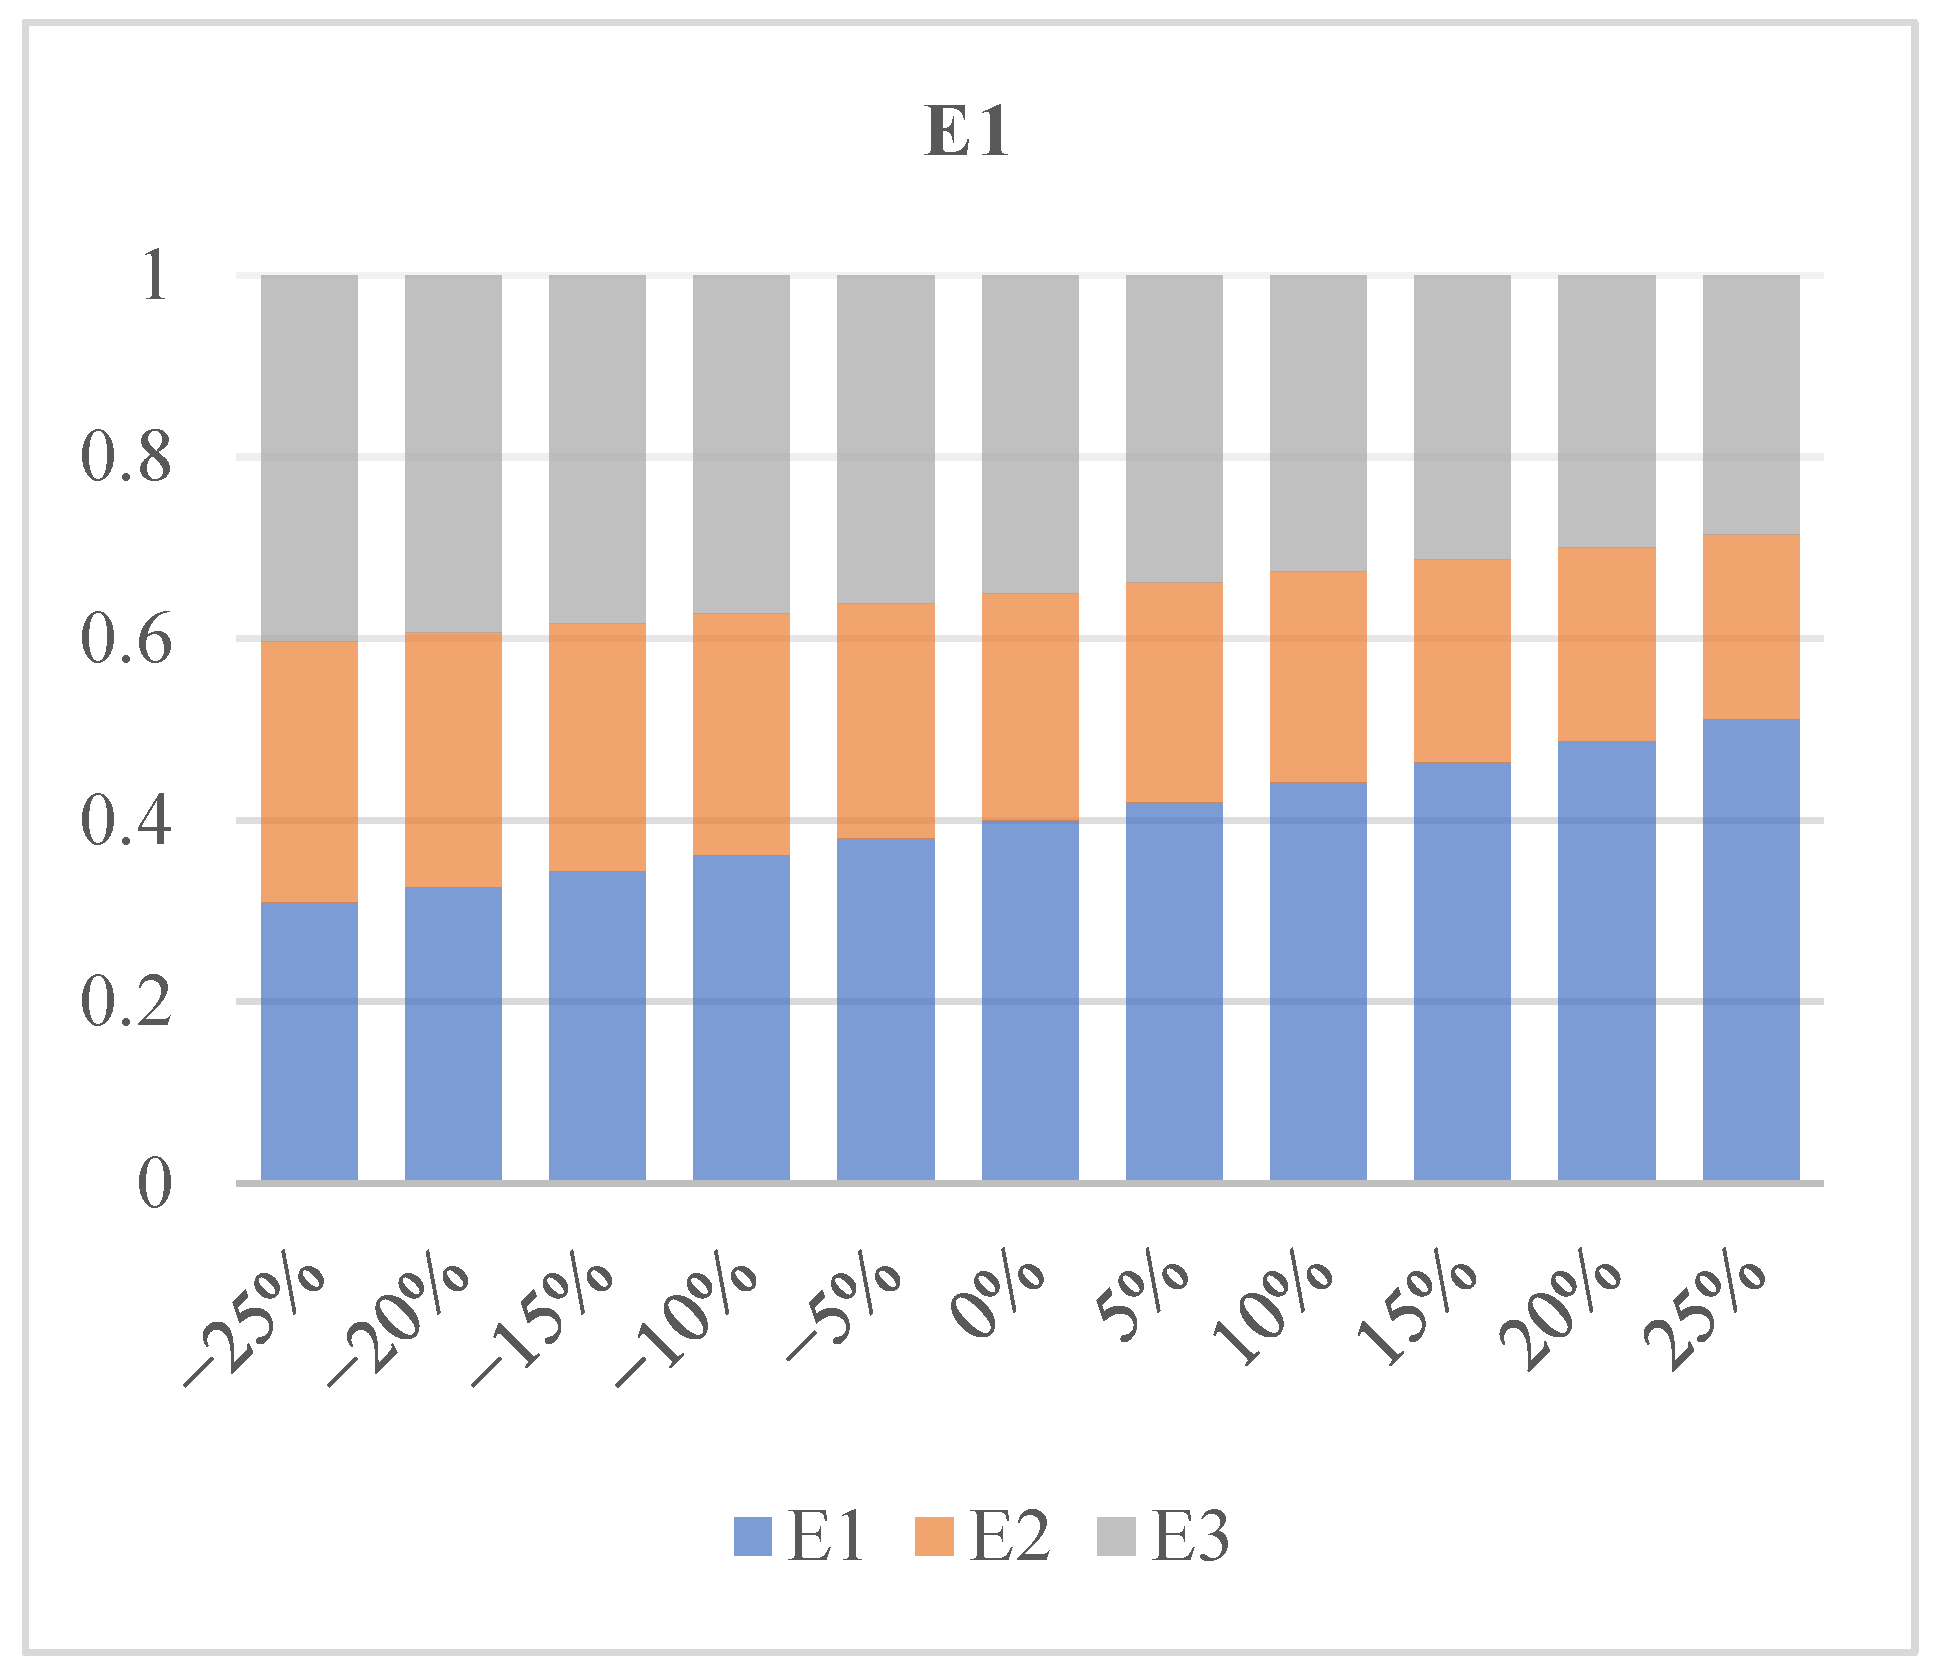
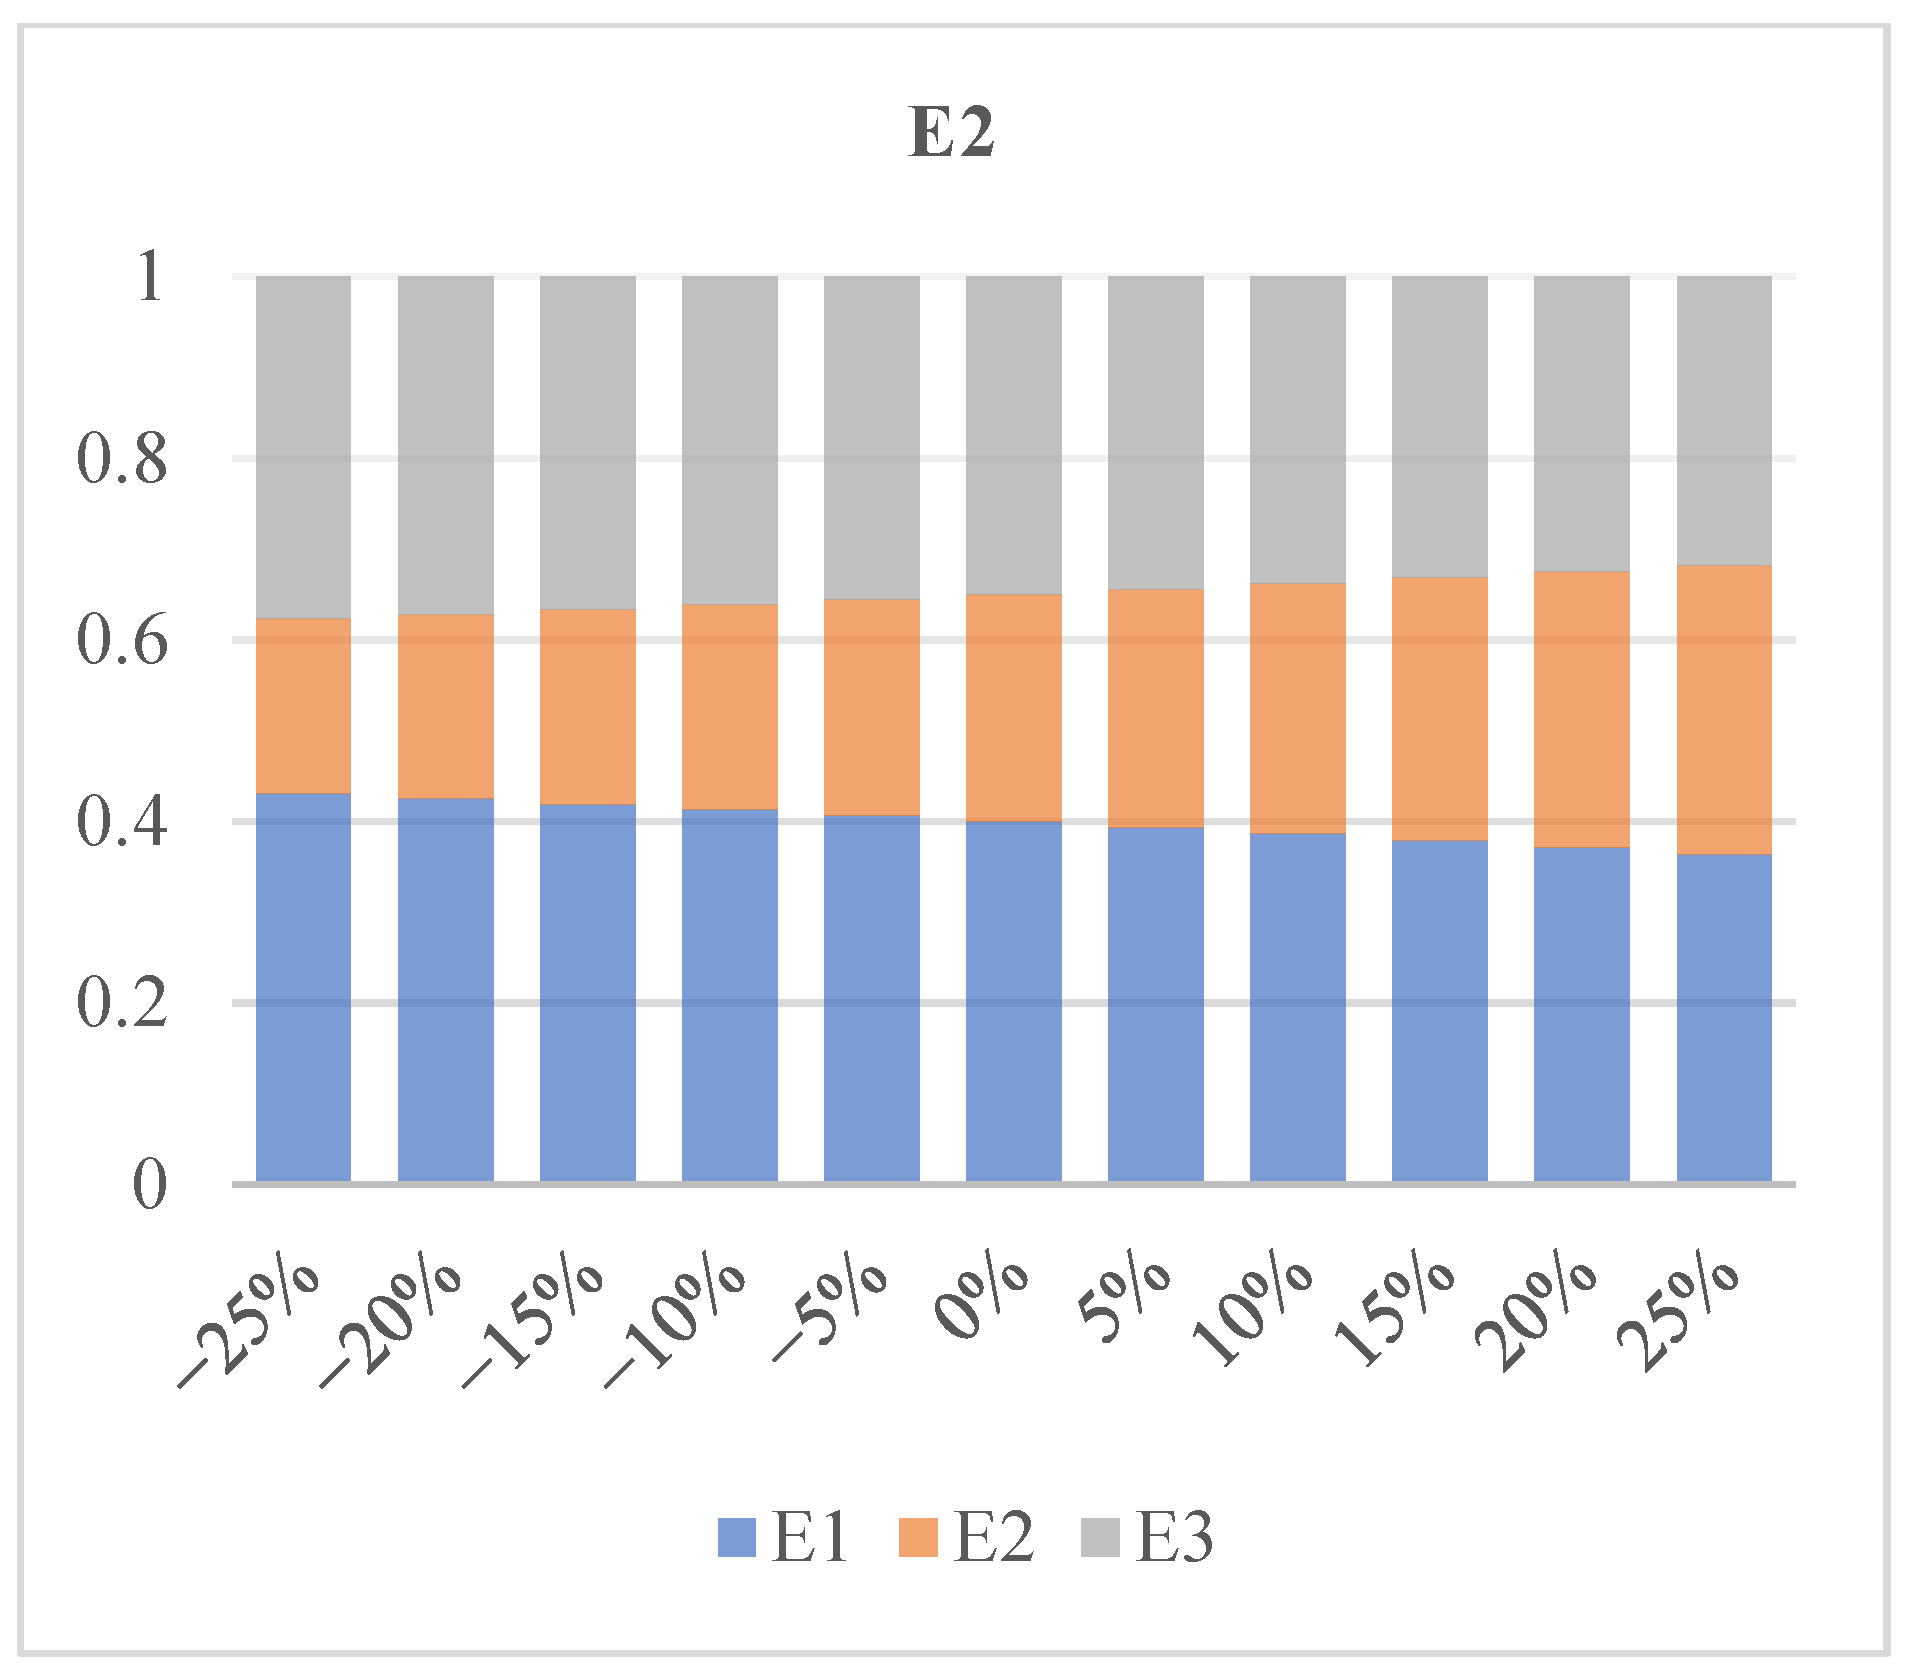
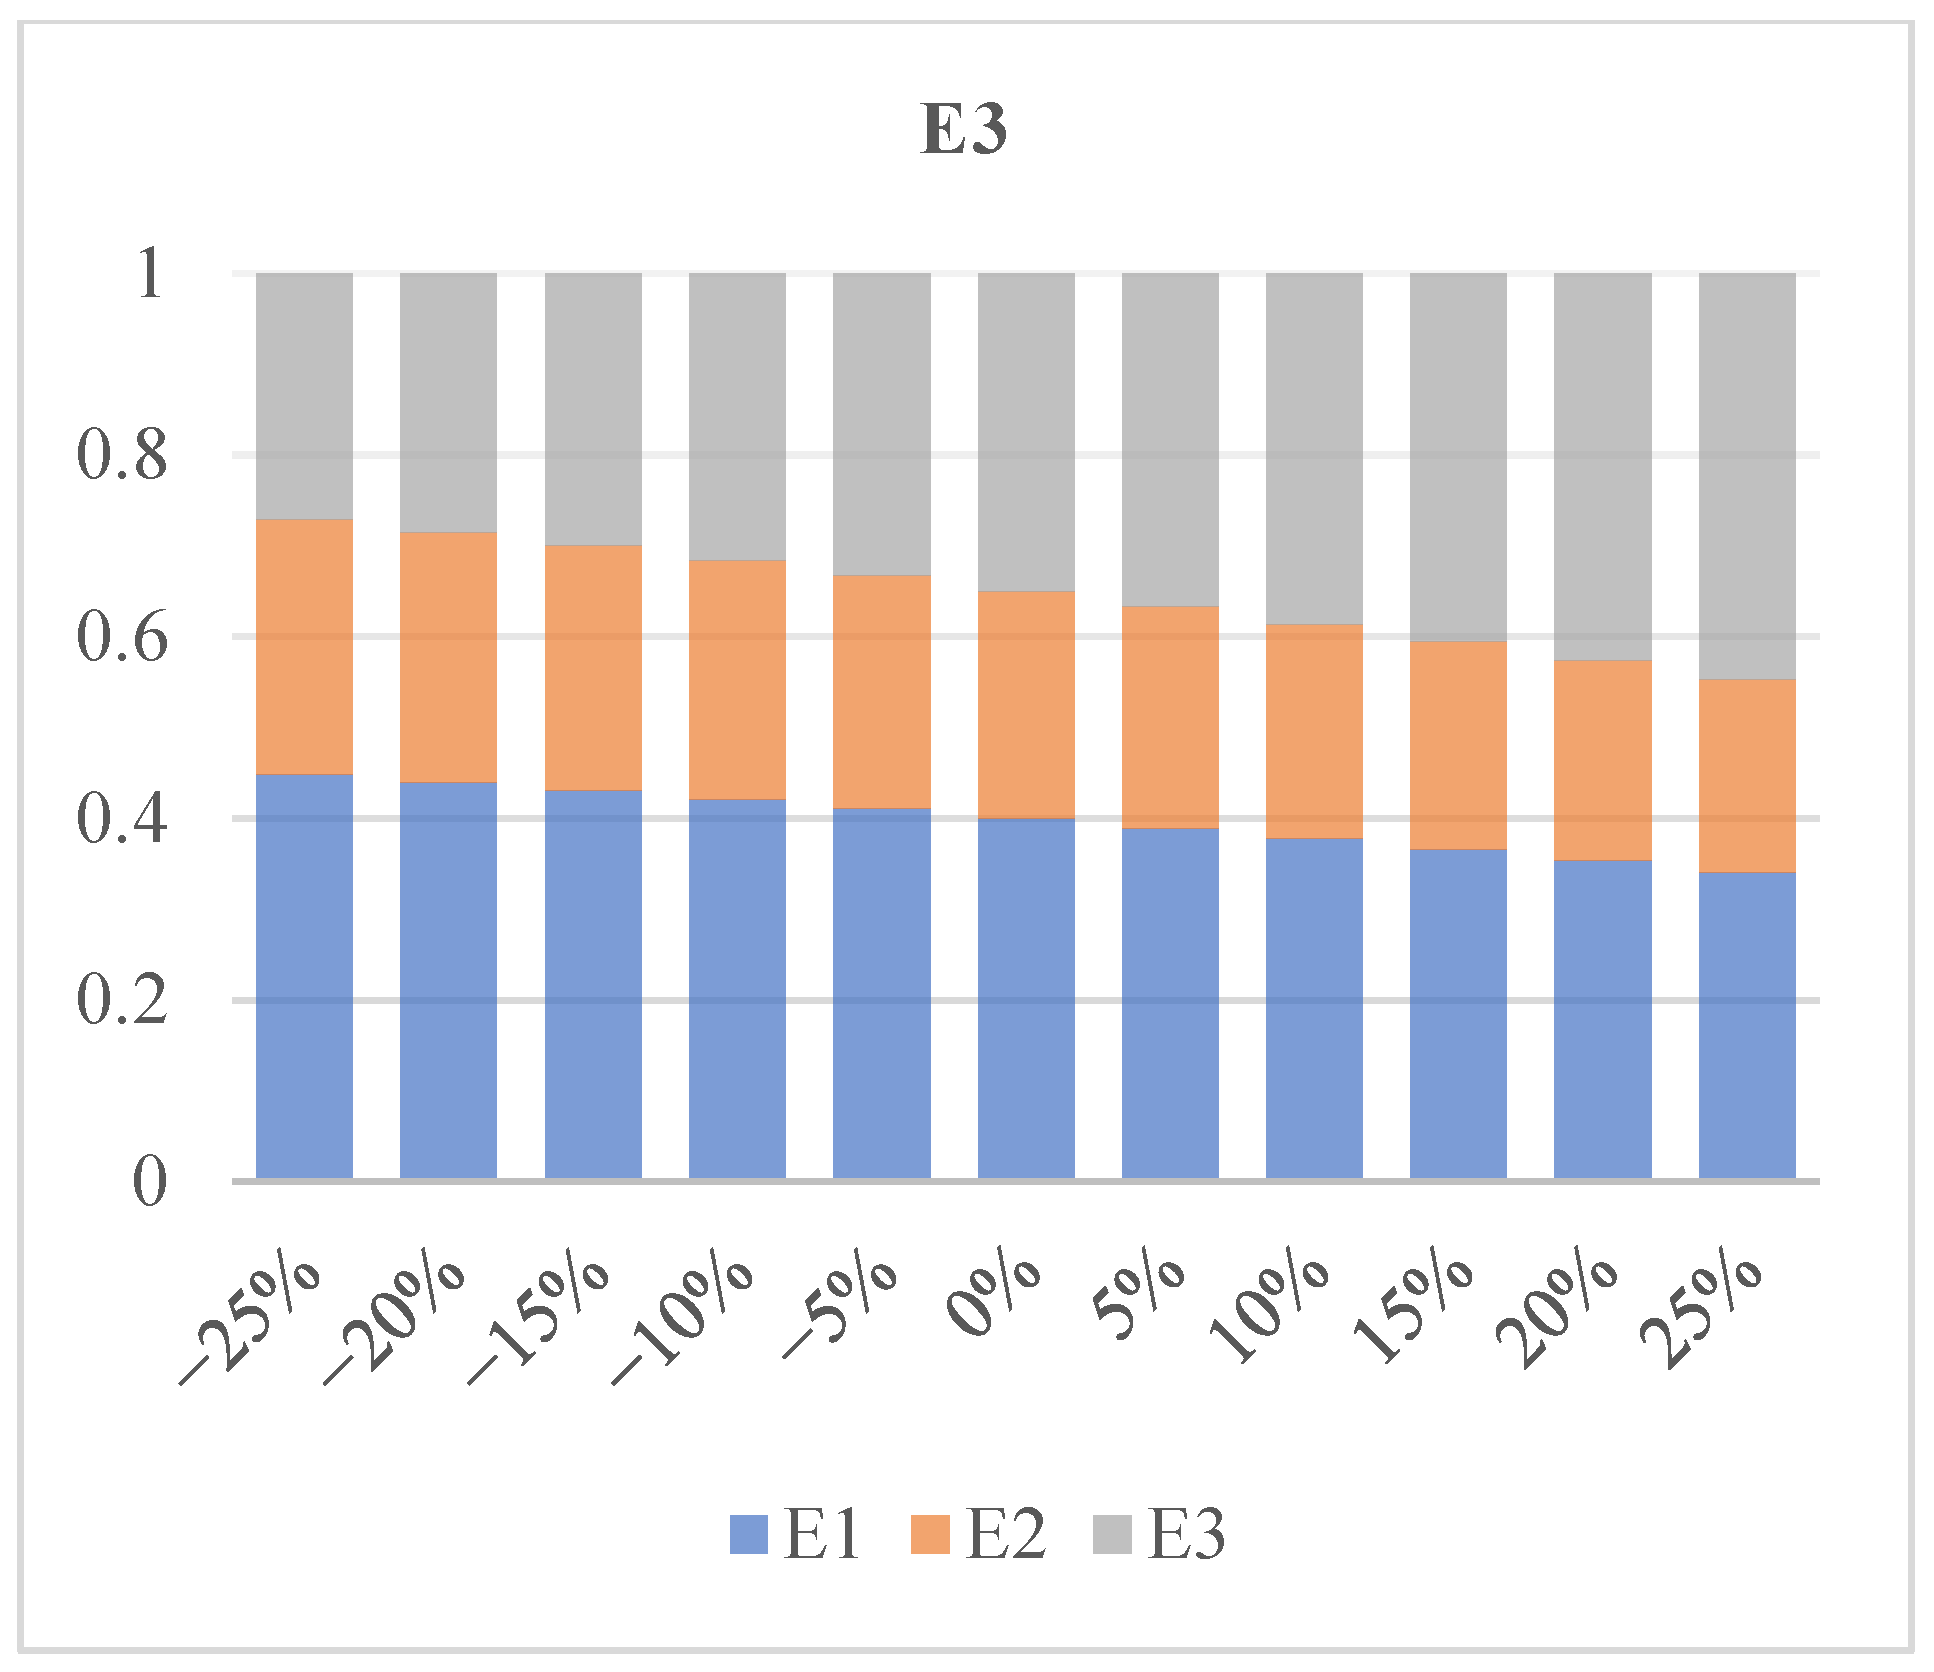
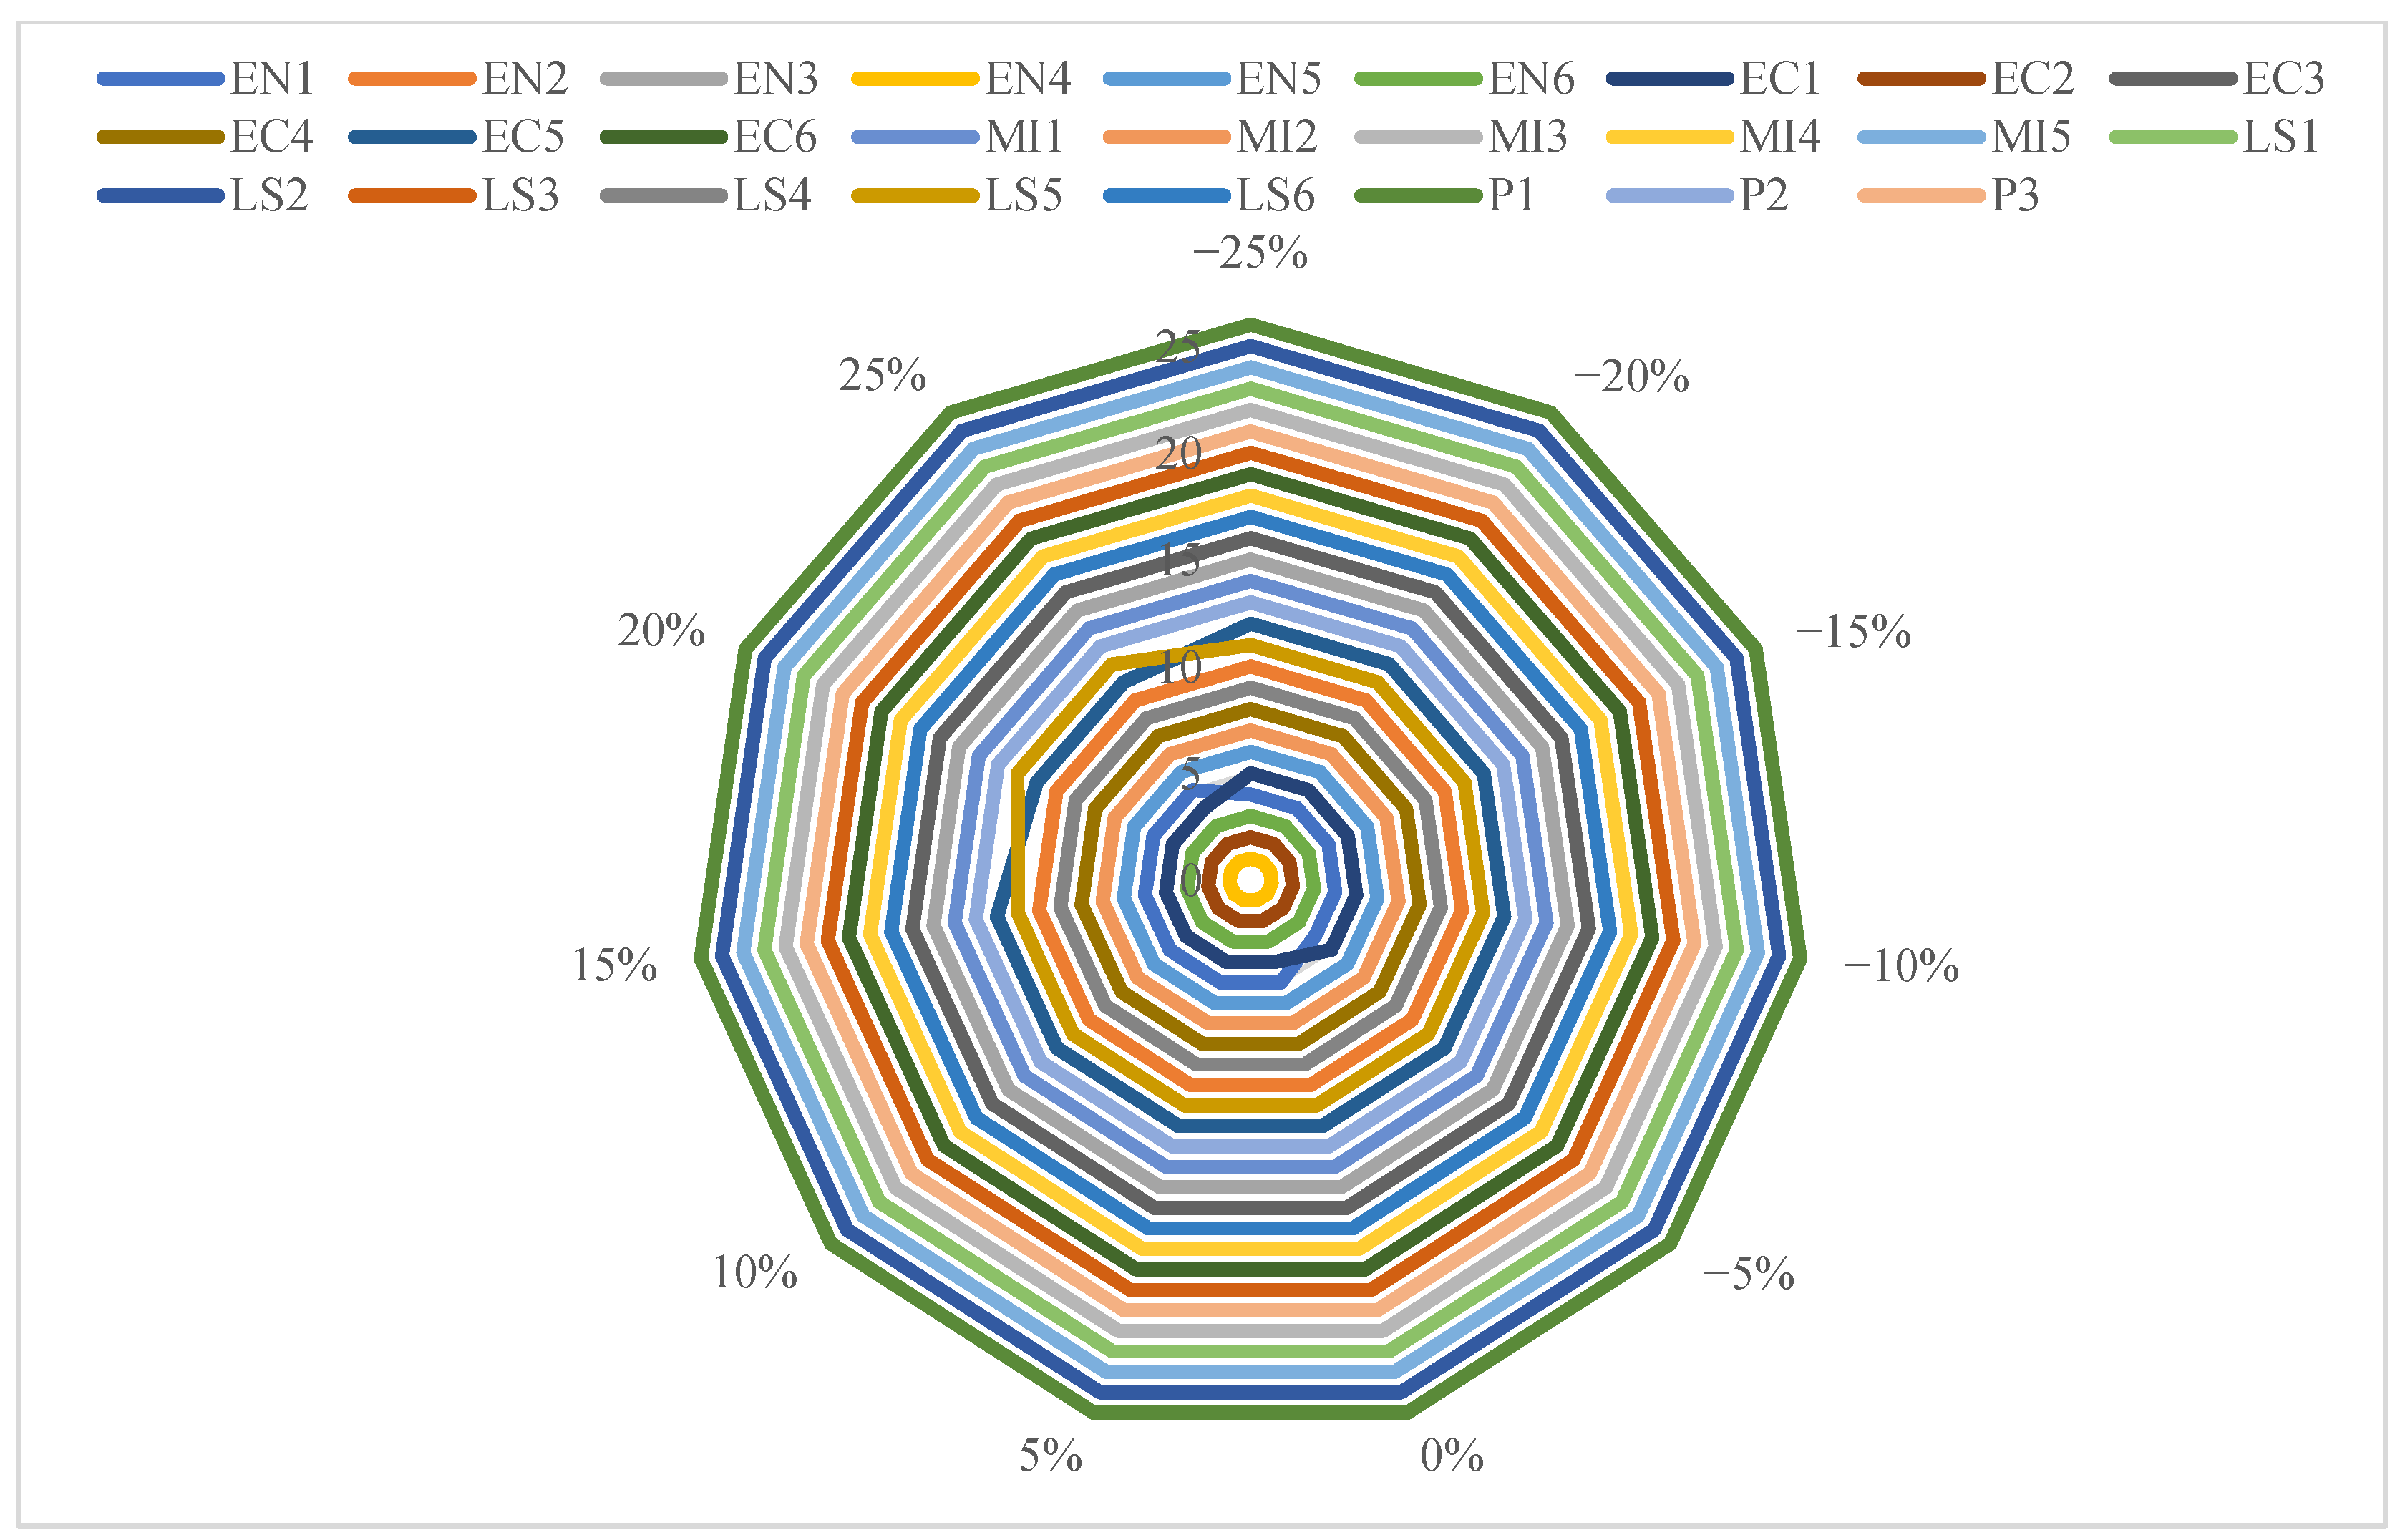
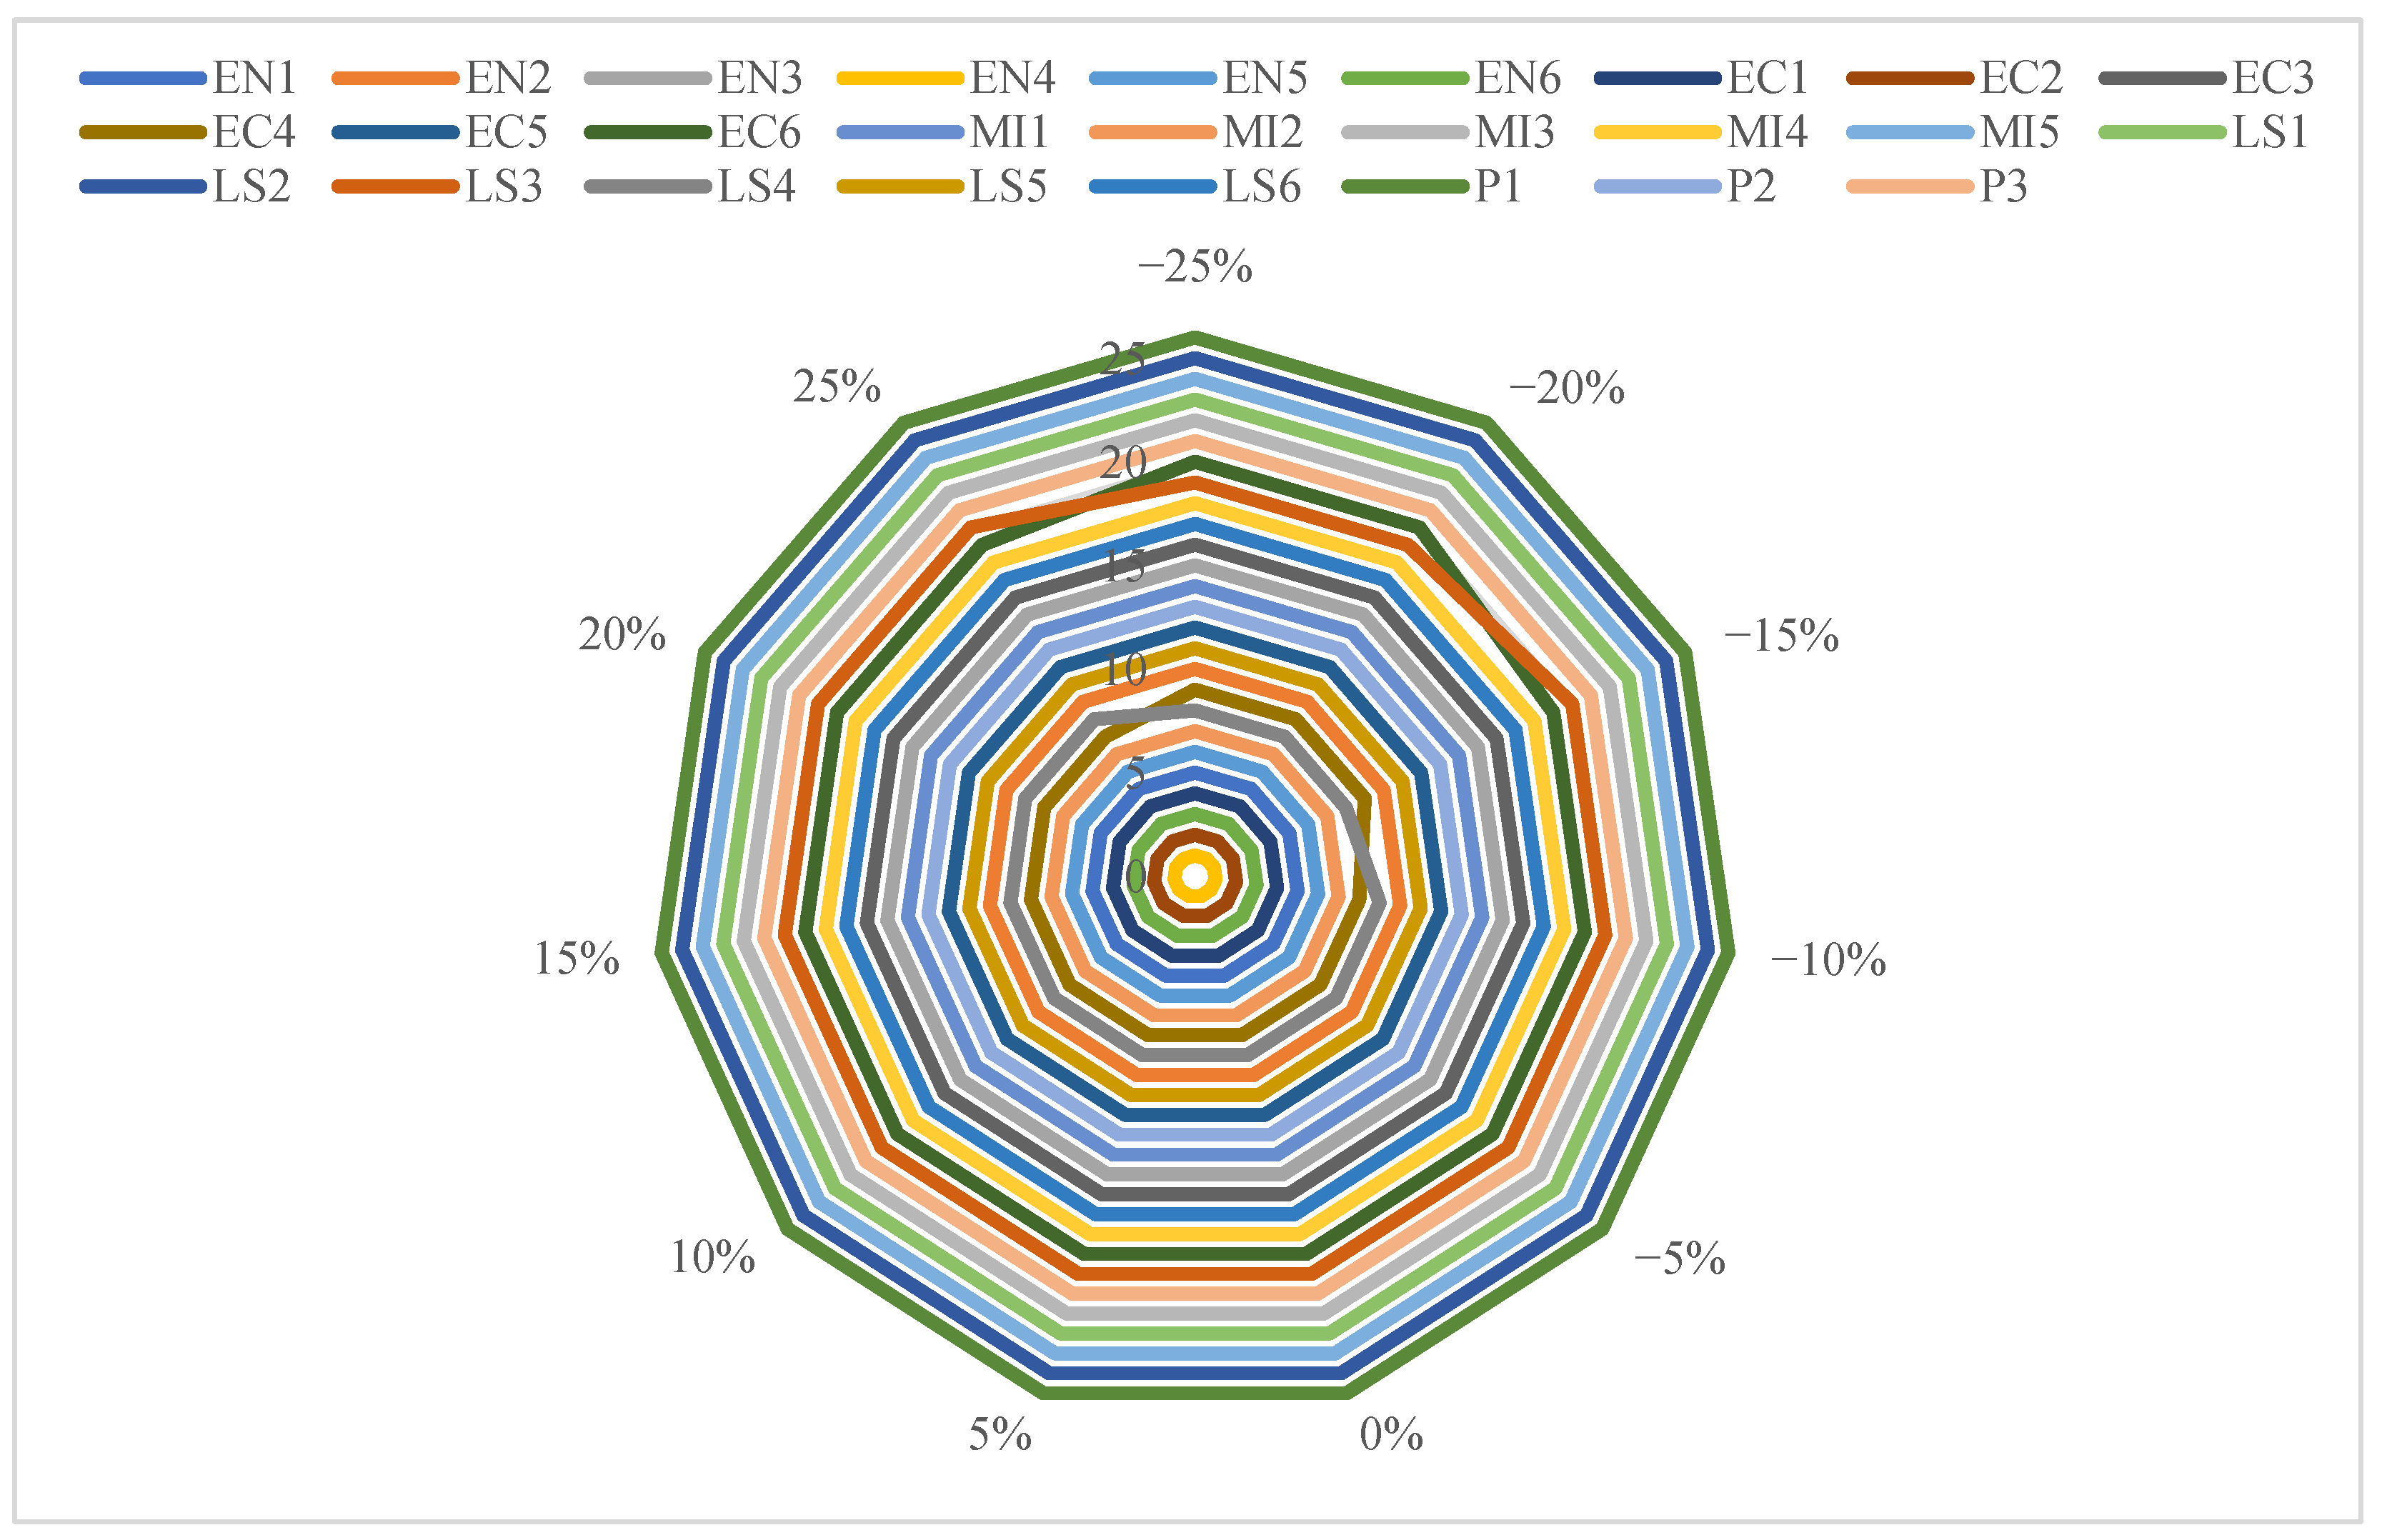
The weights assigned to experts play a critical role in the outcomes of fuzzy-based MCDM methods where experts are involved. Accordingly, this section presents a sensitivity analysis to evaluate the impact of varying weighting coefficients of experts on the final ranking results. A one-at-a-time sensitivity analysis, comprising 30 distinct scenarios, has been performed to assess the influence of changes in the weight of each expert on the rankings. In the analysis, a total of 10 adjustments have been made to the weights of the three experts considered in the study, with increments and decrements of ±5%, ±10%, ±15%, ±20%, and ±25%. The rankings have been evaluated for each change.
In these scenarios, when the weight of one expert was modified, the weights of the remaining experts have been adjusted to satisfy the Equation (22). For example, if the initial weight of E1 was decreased by 5%, its new value became 0.38. In this case, the weight of E2 was recalculated using the formula . Conversely, if the weight of E1 was increased by 5%, its updated value became 0.42, and the weights of E2 and E3 are adjusted using the same formula. The changes in the weights of the experts are illustrated in Figure 9, Figure 10, and Figure 11, respectively.
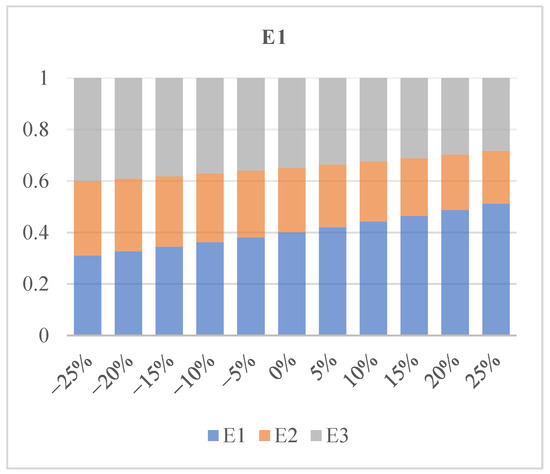
Figure 9.
Changes in weight of E1.
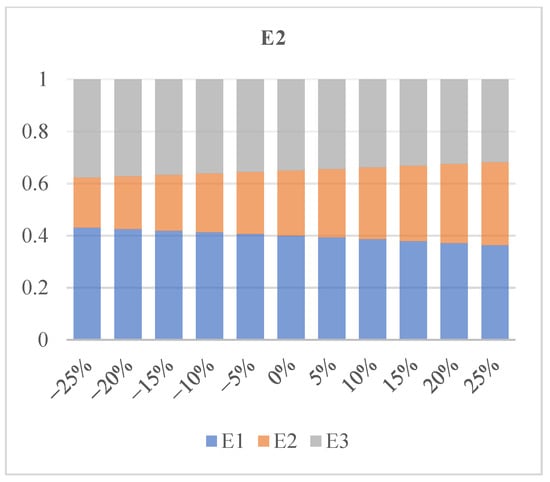
Figure 10.
Changes in weight of E2.
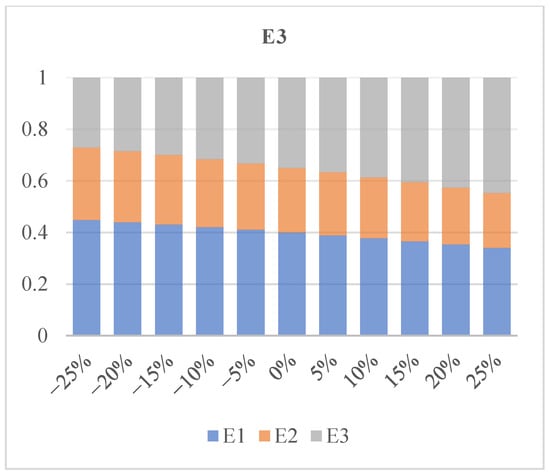
Figure 11.
Changes in weight of E3.
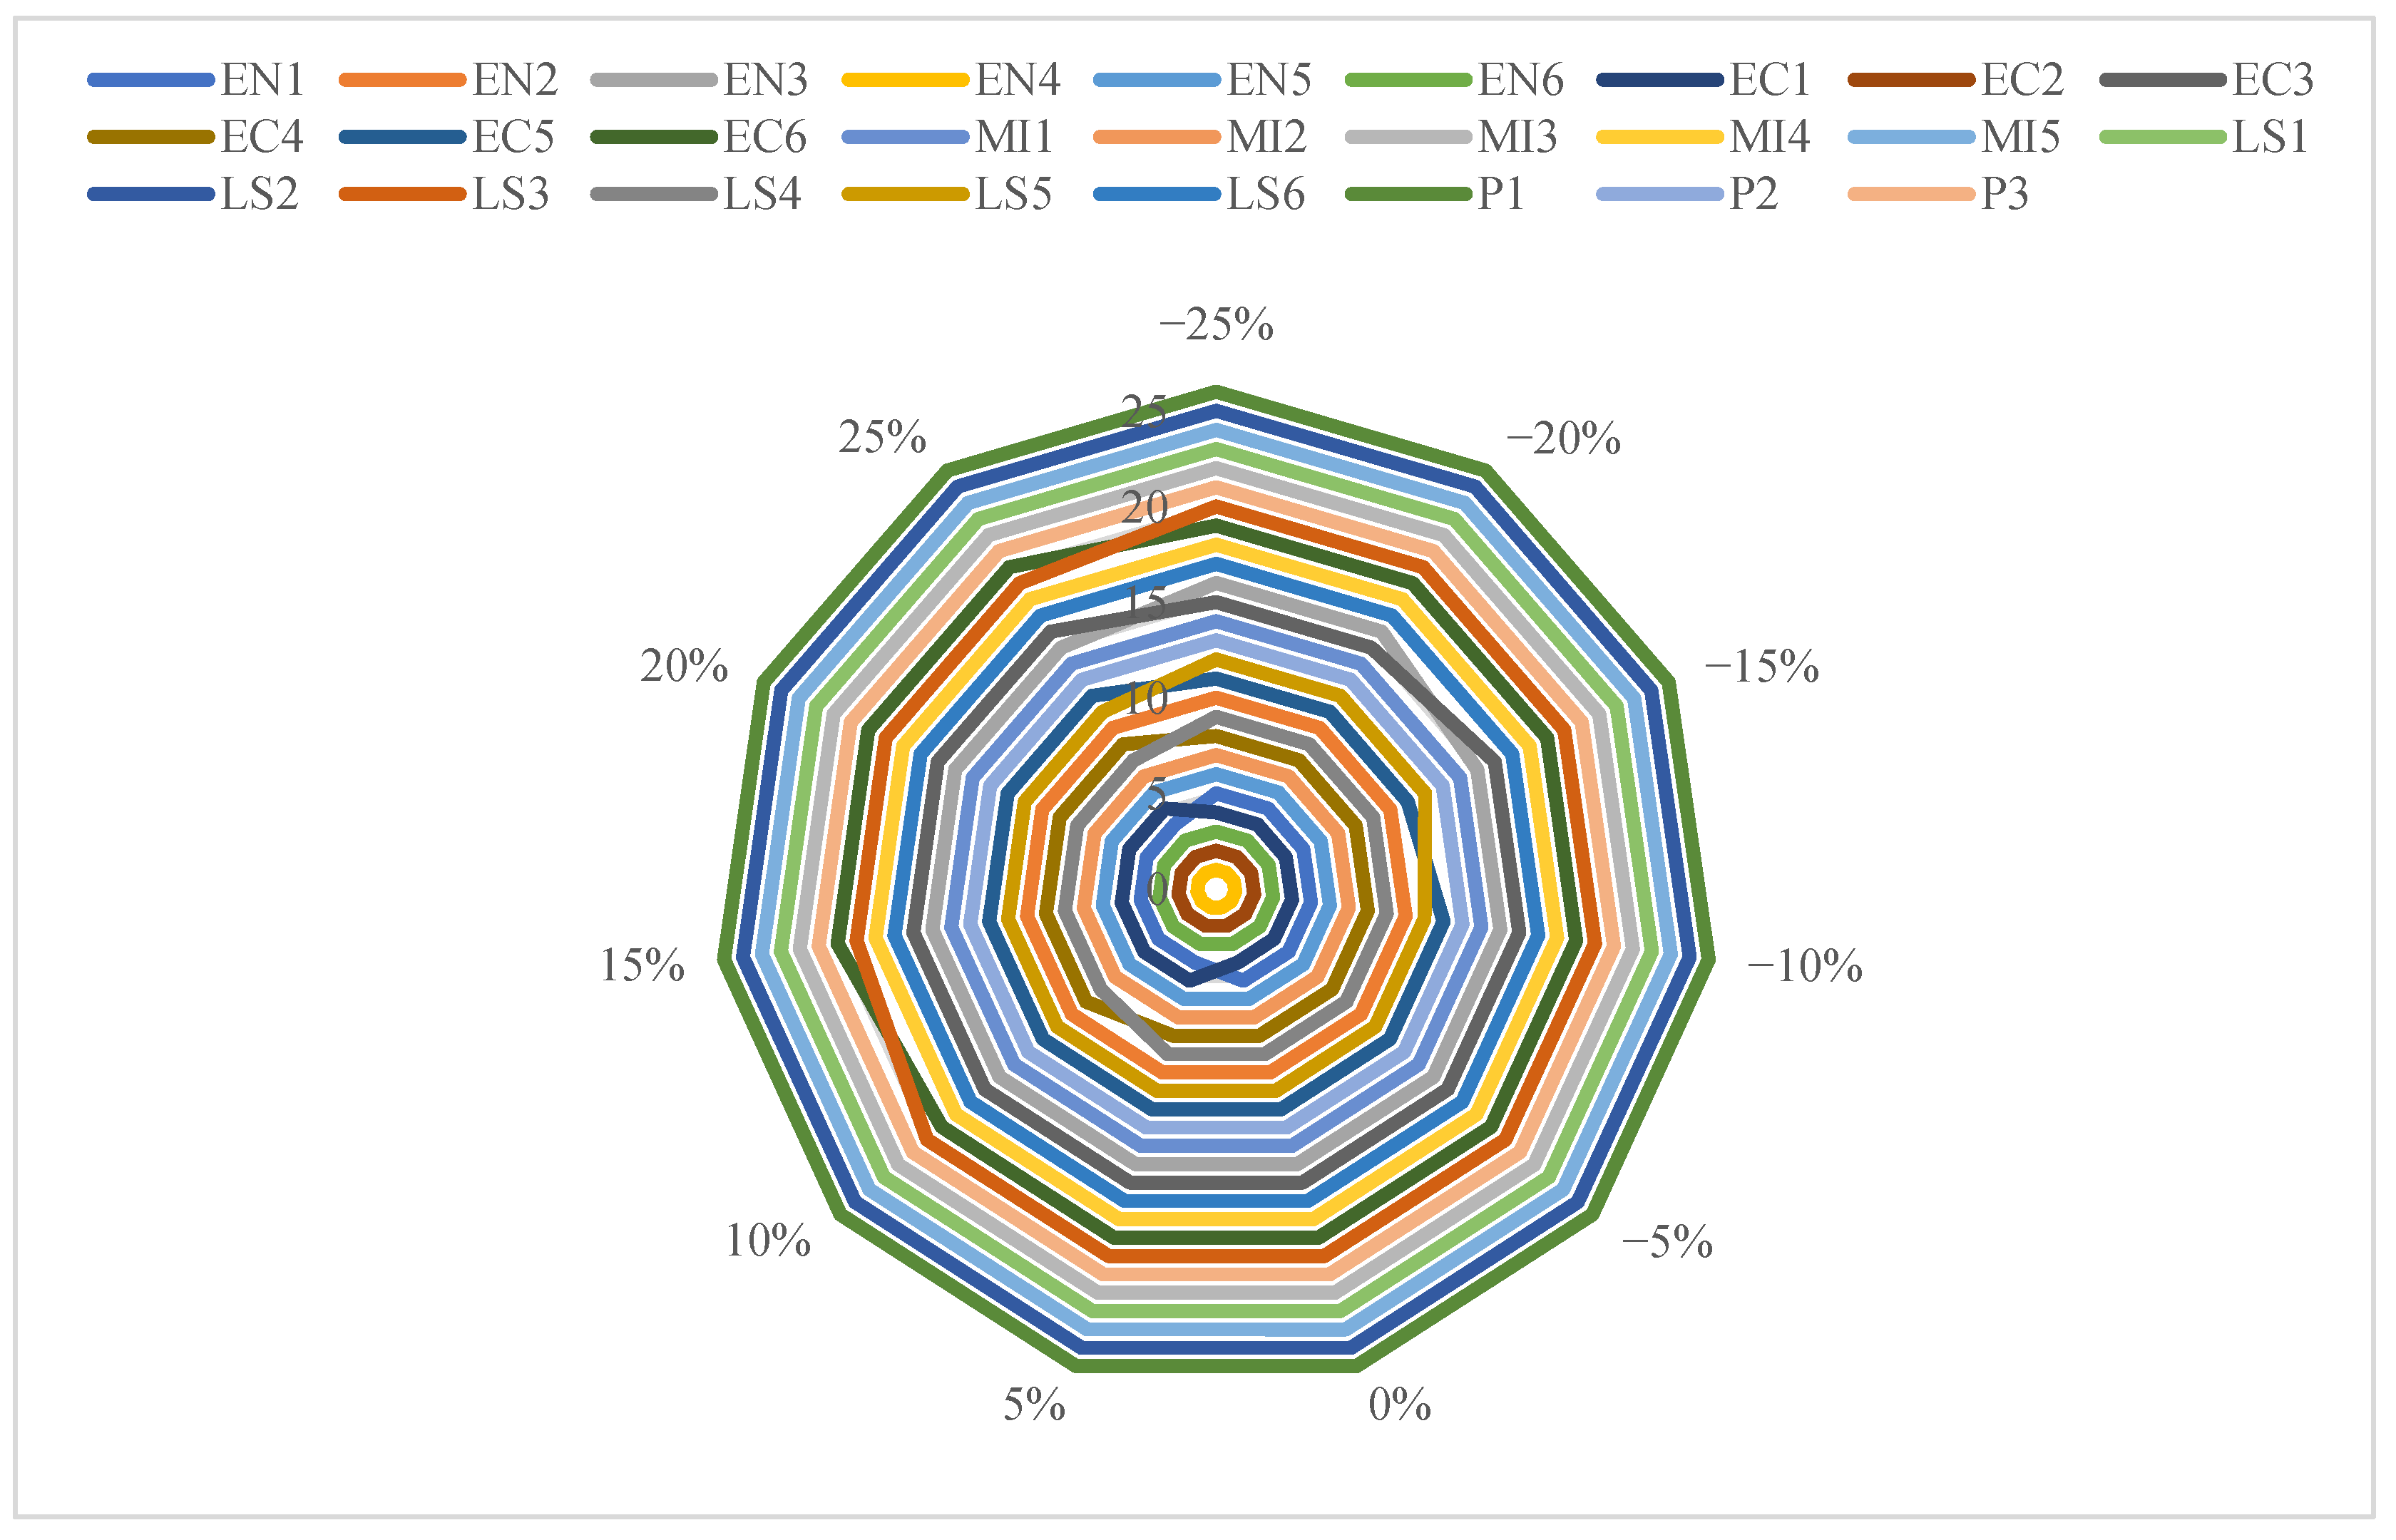
The effects of changes in the weights of each expert on the ranking results of the criteria are presented in Figure 12, Figure 13, and Figure 14, respectively. Based on the 10 scenarios conducted for each expert, it has been observed that the rankings of the top three most important criteria and the lowest-ranked criterion unchanged and retained their positions. The results indicate that, despite significant changes in the weights of the experts, criterion EN4 continued to dominate as the most influential criterion, while criterion P1 remained the least effective, with no alterations in their rankings. For the remaining criteria, only minimal changes have been observed in the rankings across all experts.
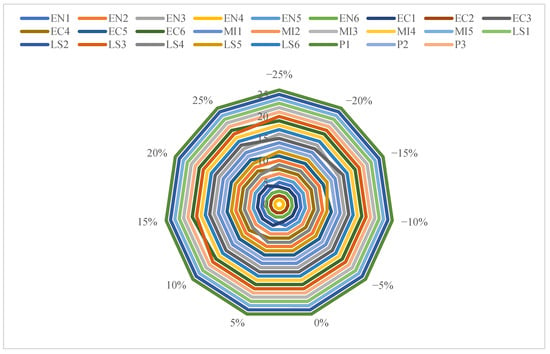
Figure 12.
Sensitivity analysis with respect to E1’s weight.
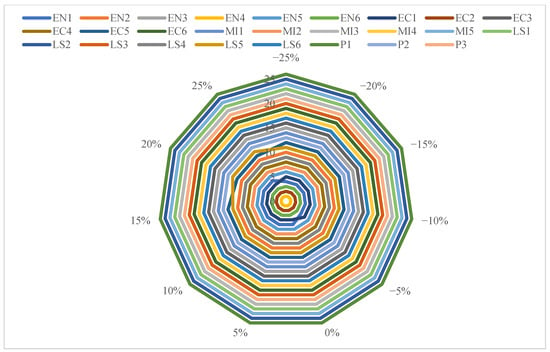
Figure 13.
Sensitivity analysis with respect to E2’s weight.
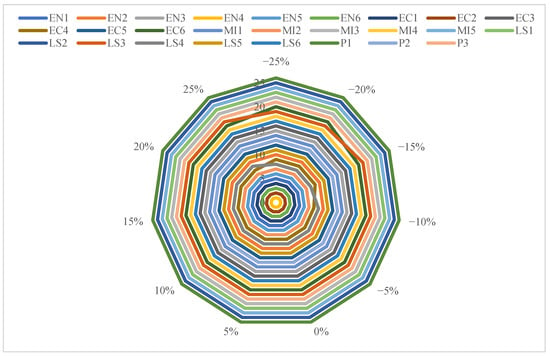
Figure 14.
Sensitivity analysis with respect to E3’s weight.
Based on the analysis presented, it can be concluded that changes in the weights of the experts have little to no impact on the final ranking results of the criteria, apart from very minor variations. This demonstrates that the developed method is stable, robust, and reliable, exhibiting low sensitivity to changes in the weights of the experts.
From the managerial point of view, we need carefully follow the implications of our decisions through the proposed PSF AHP method. These decisions will have potential consequences that can impact the firms’ operations and it is very important to ensure that we are making the best decision for human-centric and sustainable cities. When making decisions for human-centric and sustainable cities, it is important to consider the financial costs, living services, mobility & infrastructures, people’s satisfaction, and other impacts on the cities. It is also important to think about the long-term implications of the human-centric and sustainable cities decisions. Will the decision benefit the city in the long-term or will it have a negative impact? Will it create any new risks or costs that need to be managed on the cities? Our fuzzy method tries to weigh the evaluation criteria of human-centric and sustainable cities for this purpose.
7. Conclusions
In recent years, urbanization has rapidly intensified, leading to an urgent necessity to reshape our understanding of city planning and development. The maximization of human-centric design and sustainable practices has become pivotal in addressing the multifaceted challenges posed by urban growth. This study, which emphasizes the prioritization of human-centric and sustainable city criteria through the Proportional Spherical Fuzzy Analytic Hierarchy Process (PSF-AHP), provides a comprehensive methodology for integrating the critical components into the urban planning process. By leveraging the Proportional Spherical Fuzzy AHP method, the research bridges the gap between theoretical advancements in multi-criteria decision-making and the practical demands of sustainable city planning.
The study’s findings reinforce the notion that cities should prioritize their inhabitants’ quality of life while simultaneously adhering to the principles of sustainability. The proportional spherical fuzzy set theory defined with PSF-AHP method allows decision-makers to capture diverse stakeholder perspectives, leading to a more inclusive and representative framework for urban planning.
The results underscore the multifaceted nature of sustainable urban development, where criteria such as environmental quality, social equity, accessibility, economic resilience, and smart infrastructure play indispensable roles. In the study, 26 sub-criteria have been evaluated according to five main criteria determined by a comprehensive literature review and expert opinions. The findings indicate that the most critical factor in the priorization of HCSC criteria is EN4-water management and conservation, followed by EC2-employment/unemployment rate, EN6-carbon emission reduction strategies and EC1-economic sustainability as the second, third and fourth most important factors, respectively. These criteria not only reflect the aspirations of contemporary societies but also resonate with global objectives, such as the United Nations’ Sustainable Development Goals (SDGs). Moreover, the interplay among these criteria emphasizes the interdependence of social, economic, and environmental factors, reinforcing the need for an integrated approach in urban planning. Furthermore, the study underlines the importance of stakeholder involvement throughout the evaluation process. Engaging with residents, local businesses, and various interest groups not only enriches the data collection but also empowers communities, fostering a sense of ownership and responsibility for sustainable development. This participatory approach is also crucial in establishing trust and facilitating collaborative governance.
In the study, a comparison analysis has been conducted by using the SF-AHP method, and the results have been compared. As a result of the comparison analysis, the criterion EN4 has been identified as the most important criterion, and it has been observed that the ranking of the first four criteria remained the same. Moreover, it has been also noted that there were no significant differences in the ranking order of the other criteria, which produced similar results. Additionally, with the high Spearman’s rank correlation coefficient obtained from the comparison analysis, it has been demonstrated that there is a statistically significant relationship between the rankings obtained from the developed model and the rankings obtained from the method being compared. Thus, as a result of the compared method, it has been confirmed that the results obtained from the study are robust, and this was further supported by the high correlation obtained from Spearman’s rank correlation. In the study, a sensitivity analysis has been conducted on the weights of the criteria and the weights of the decision-makers, and it has been proven that the developed methodology is valid and reliable with slight differences in the ranking results of the criteria. The small differences in the ranking results obtained from the sensitivity analysis have also demonstrated the reliability of the applied approach through the high correlation obtained from Spearman’s rank correlation coefficient.
The application of the PSF-AHP framework in the study provides urban planners, policymakers, and stakeholders with a robust tool for evaluating alternative urban design strategies. This approach streamlines the decision-making process by facilitating clearer comparisons among various projects and policies, ultimately leading to more informed choices that support human well-being and environmental integrity. Additionally, the versatility of the PSF-AHP model implies that it can be adapted to various contexts and scales, making it a valuable instrument for cities at different stages of development. The proposed framework not only advances theoretical understanding but also serves as a practical tool for shaping cities that are livable, equitable, and resilient.
This study provides a significant methodological contribution while also bringing certain limitations. The selection of criteria and their hierarchical structuring, despite being rigorously obtained, can be influenced by expert opinions that may reflect subjective biases. Future studies could expand the criteria set, incorporate broader stakeholder input, or utilize machine learning tools to further improve the prioritization process. Additionally, although the proportional spherical fuzzy AHP method has demonstrated effectiveness, its computational complexity may pose challenges for widespread adoption. Simplification or the development of user-friendly decision support systems could address this barrier and facilitate its use by practitioners without technical expertise. A real-world implementation and/or comparison of the results with the existing sustainable city initiatives to demonstrate the framework’s utility is another future research suggestion.
Author Contributions
Conceptualization, C.K.; methodology, C.K.; formal analysis, N.A.; writing—original draft preparation, N.A.; investigation, N.A.; supervision, C.K.; data curation, N.A. All authors have read and agreed to the published version of the manuscript.
Funding
This research received no specific grant from any funding agency in the public, commercial, or not-for-profit sectors.
Data Availability Statement
The original contributions presented in this study are included in the article. Further inquiries can be directed to the corresponding author.
Conflicts of Interest
The authors declare no conflict of interest.
References
- Sharifi, A. A critical review of selected smart city assessment tools and indicator sets. J. Clean. Prod. 2019, 233, 1269–1283. [Google Scholar] [CrossRef]
- Adel, A.; Alani, N.H.S. Human-Centric Collaboration and Industry 5.0 Framework in Smart Cities and Communities: Fostering Sustainable Development Goals 3, 4, 9, and 11 in Society 5.0. Smart Cities 2024, 7, 1723–1775. [Google Scholar] [CrossRef]
- Kusakci, S.; Yilmaz, M.K.; Kusakci, A.O.; Sowe, S.; Nantembelele, F.A. Towards sustainable cities: A sustainability assessment study for metropolitan cities in Turkey via a hybridized IT2F-AHP and COPRAS approach. Sustain. Cities Soc. 2022, 78, 103655. [Google Scholar] [CrossRef]
- Freestone, R.; Favaro, P. The social sustainability of smart cities: A conceptual framework. City Cult. Soc. 2022, 29, 100460. [Google Scholar] [CrossRef]
- Sepasgozar, S.M.E.; Hawken, S.; Sargolzaei, S.; Foroozanfa, M. Implementing citizen centric technology in developing smart cities: A model for predicting the acceptance of urban technologies. Technol. Forecast. Soc. Chang. 2019, 142, 105–116. [Google Scholar] [CrossRef]
- Karagoz, S.; Deveci, M.; Simic, V.; Aydin, N.; Bolukbas, U. A novel intuitionistic fuzzy MCDM-based CODAS approach for locating an authorized dismantling center: A case study of Istanbul. Waste Manag. Res. J. A Sustain. Circ. Econ. 2020, 38, 660–672. [Google Scholar] [CrossRef] [PubMed]
- Kahraman, C. Proportional picture fuzzy sets and their AHP extension: Application to waste disposal site selection. Expert. Syst. Appl. 2024, 238, 122354. [Google Scholar] [CrossRef]
- Seker, S.; Kahraman, C. Socio-economic evaluation model for sustainable solar PV panels using a novel integrated MCDM methodology: A case in Turkey. Socio-Econ. Plan. Sci. 2021, 77, 100998. [Google Scholar] [CrossRef]
- Tüysüz, N.; Kahraman, C. An integrated picture fuzzy Z-AHP & TOPSIS methodology: Application to solar panel selection. Appl. Soft Comput. 2023, 149, 110951. [Google Scholar] [CrossRef]
- Alkan, N.; Kahraman, C. An intuitionistic fuzzy multi-distance based evaluation for aggregated dynamic decision analysis (IF-DEVADA): Its application to waste disposal location selection. Eng. Appl. Artif. Intell. 2022, 111, 104809. [Google Scholar] [CrossRef]
- Alkan, N. Intuitionistic Fuzzy Multi-Period Dynamic Assessment (MP-DAS) Method: Renewable Energy Selection Application. J. Mult.-Valued Log. Soft Comput. 2024, 43, 271. [Google Scholar]
- Ali, J. A novel score function based CRITIC-MARCOS method with spherical fuzzy information. Comput. Appl. Math. 2021, 40, 280. [Google Scholar] [CrossRef]
- Peng, X.; Dai, J. Approaches to single-valued neutrosophic MADM based on MABAC, TOPSIS and new similarity measure with score function. Neural Comput. Appl. 2018, 29, 939–954. [Google Scholar] [CrossRef]
- Pamučar, D.; Mihajlović, M.; Obradović, R.; Atanasković, P. Novel approach to group multi-criteria decision making based on interval rough numbers: Hybrid DEMATEL-ANP-MAIRCA model. Expert. Syst. Appl. 2017, 88, 58–80. [Google Scholar] [CrossRef]
- Karayalcin, I.I. The analytic hierarchy process: Planning, priority setting, resource allocation: Thomas L. SAATY McGraw-Hill, New York, 1980, xiii + 287 pages, £15.65. Eur. J. Oper. Res. 1982, 9, 97–98. [Google Scholar] [CrossRef]
- Alkan, N.; Kahraman, C. Fuzzy Analytic Hierarchy Process Using Spherical Z-Numbers: Supplier Selection Application. In Lecture Notes in Networks and Systems; Springer: Cham, Switzerland, 2022; Volume 504 LNNS, pp. 702–713. [Google Scholar] [CrossRef]
- Alkan, N.; Kahraman, C. Continuous intuitionistic fuzzy sets (CINFUS) and their AHP&TOPSIS extension: Research proposals evaluation for grant funding. Appl. Soft Comput. 2023, 145, 110579. [Google Scholar] [CrossRef]
- Alkan, N. Risk Analysis For Digitalization Oriented Sustainable Supply Chain Using Interval-Valued Pythagorean Fuzzy AHP. In Advances in Intelligent Systems and Computing; Springer: Cham, Switzerland, 2021; Volume 1197 AISC, pp. 1373–1381. [Google Scholar] [CrossRef]
- Zadeh, L.A. Fuzzy sets. Inf. Control 1965, 8, 338–353. [Google Scholar] [CrossRef]
- Atanassov, K.T. Intuitionistic fuzzy sets. Fuzzy Sets Syst. 1986, 20, 87–96. [Google Scholar] [CrossRef]
- Zhou, H.; Gu, H. A Novel Dynamic Intuitionistic Fuzzy MADM Approach. IOP Conf. Ser. Mater. Sci. Eng. 2019, 563, 052047. [Google Scholar] [CrossRef]
- Wang, W.; Liu, X. Intuitionistic fuzzy information aggregation using einstein operations. IEEE Trans. Fuzzy Syst. 2012, 20, 923–938. [Google Scholar] [CrossRef]
- Alkan, N.; Kahraman, C. Continuous Intuitionistic Fuzzy CRITIC & WASPAS: Smart City Evaluation. In Lecture Notes in Networks and Systems; Springer: Cham, Switzerland, 2024; Volume 1088 LNNS, pp. 725–734. [Google Scholar] [CrossRef]
- Kahraman, C.; Ghorabaee, M.K.; Zavadskas, E.K.; Onar, S.C.; Yazdani, M.; Oztaysi, B. Intuitionistic fuzzy EDAS method: An application to solid waste disposal site selection. J. Environ. Eng. Landsc. Manag. 2017, 25, 1–12. [Google Scholar] [CrossRef]
- Kahraman, C. Proportional Fuzzy Set Extensions and Imprecise Proportions. Informatica 2024, 35, 311–339. [Google Scholar] [CrossRef]
- Vallance, S.; Perkins, H.C.; Dixon, J.E. What is social sustainability? A clarification of concepts. Geoforum 2011, 42, 342–348. [Google Scholar] [CrossRef]
- Dempsey, N.; Bramley, G.; Power, S.; Brown, C. The social dimension of sustainable development: Defining urban social sustainability. Sustain. Dev. 2011, 19, 289–300. [Google Scholar] [CrossRef]
- Kohon, J. Social inclusion in the sustainable neighborhood? Idealism of urban social sustainability theory complicated by realities of community planning practice. City Cult. Soc. 2018, 15, 14–22. [Google Scholar] [CrossRef]
- Kitchin, R.; Cardullo, P.; Di Feliciantonio, C. Citizenship, justice, and the right to the smart city. In The Right to the Smart City; Emerald Publishing Limited: Leeds, UK, 2019; pp. 1–24. [Google Scholar] [CrossRef]
- Shirazi, M.R.; Keivani, R. Social sustainability as an urban agenda: Towards a comprehensive image. In Urban Social Sustainability: Theory, Policy and Practicepolicy; Routledge: England, UK, 2019; pp. 216–230. [Google Scholar]
- Malek, J.A.; Lim, S.B.; Yigitcanlar, T. Social Inclusion Indicators for Building Citizen-Centric Smart Cities: A Systematic Literature Review. Sustainability 2021, 13, 376. [Google Scholar] [CrossRef]
- MOST Action Plan 2016–2021. In Proceedings of the 13th Intergovernmental Council of the Management of Social Transformations Programme, Kuala Lumpur, Malaysia, 16–17 March 2017; Available online: https://unesdoc.unesco.org/ark:/48223/pf0000247282/ (accessed on 15 October 2024).
- Clarke, N.J.; Kuipers, M.C.; Roos, J. Cultural resilience and the Smart and Sustainable City: Exploring changing concepts on built heritage and urban redevelopment. Smart Sustain. Built Environ. 2020, 9, 144–155. [Google Scholar] [CrossRef]
- Rosol, M.; Blue, G. From the smart city to urban justice in a digital age. City 2022, 26, 684–705. [Google Scholar] [CrossRef]
- Alizadeh, H.; Sharifi, A. Societal smart city: Definition and principles for post-pandemic urban policy and practice. Cities 2023, 134, 104207. [Google Scholar] [CrossRef]
- Masucci, M.; Pearsall, H.; Wiig, A. The Smart City Conundrum For Social Justice: Youth Perspectives On Digital Technologies And Urban Transformations. In Smart Spaces and Places; Routledge: England, UK, 2021; pp. 145–153. [Google Scholar] [CrossRef]
- Alizadeh, H.; Sharifi, A. Toward a societal smart city: Clarifying the social justice dimension of smart cities. Sustain. Cities Soc. 2023, 95, 104612. [Google Scholar] [CrossRef]
- Marsal-Llacuna, M.-L. Building Universal Socio-cultural Indicators for Standardizing the Safeguarding of Citizens’ Rights in Smart Cities. Soc. Indic. Res. 2017, 130, 563–579. [Google Scholar] [CrossRef]
- Stratigea, A.; Leka, A.; Panagiotopoulou, M. In search of indicators for assessing smart and sustainable cities and communities’ performance. In Smart Cities and Smart Spaces: Concepts, Methodologies, Tools, and Applications; IGI Global: Hershey, PA, USA, 2019; pp. 265–295. [Google Scholar] [CrossRef]
- Roggema, R. The Design Charrette. In The Design Charrette: Ways to Envision Sustainable Futures; Springer: Berlin/Heidelberg, Germany, 2014. [Google Scholar] [CrossRef]
- Cortés-Cediel, M.E.; Cantador, I.; Bolívar, M.P.R. Analyzing Citizen Participation and Engagement in European Smart Cities. Soc. Sci. Comput. Rev. 2019, 39, 592–626. [Google Scholar] [CrossRef]
- Su, Y.; Fan, D. Smart cities and sustainable development. Reg. Stud. 2023, 57, 722–738. [Google Scholar] [CrossRef]
- Zhao, P.; Ali, Z.M.; Hashim, N.H.N.; Ahmad, Y.; Wang, H. Evaluating social sustainability of urban regeneration in historic urban areas in China: The case of Xi’an. J. Environ. Manag. 2024, 370, 122520. [Google Scholar] [CrossRef]
- He, X.; Zhou, Y.; Yuan, X.; Zhu, M. The coordination relationship between urban development and urban life satisfaction in Chinese cities—An empirical analysis based on multi-source data. Cities 2024, 150, 105016. [Google Scholar] [CrossRef]
- Li, H.; Xue, A.; Zheng, J.; Skitmore, M.; Moorhead, M. Public participation in the social sustainability evaluation of smart city infrastructure in the context of big data: A critical review. Open House Int. 2024, 49, 718–735. [Google Scholar] [CrossRef]
- Torkayesh, A.E.; Alizadeh, R.; Soltanisehat, L. Assessing Entrepreneurial Performance of G7 Countries Under Context of Social Sustainable Development Goals: A Multicriteria Decision Analysis Approach. IEEE Trans. Eng. Manag. 2024, 71, 4918–4929. [Google Scholar] [CrossRef]
- Heide, M.; Skrøder, N.K.P.; Steffen, S.F.; Hauschild, M.; Ryberg, M. Framework for selecting and setting boundaries for social sustainability indicators in a life cycle perspective. IOP Conf. Ser. Earth Environ. Sci. 2023, 1196, 012080. [Google Scholar] [CrossRef]
- Marvi, L.T.; Behzadfar, M.; Shemirani, S.M.M. Defining the social-sustainable framework for smart cities. Int. J. Hum. Capital. Urban. Manag. 2023, 8, 95–110. [Google Scholar] [CrossRef]
- Skubis, I.; Wolniak, R.; Grebski, W.W. AI and Human-Centric Approach in Smart Cities Management: Case Studies from Silesian and Lesser Poland Voivodships. Sustainability 2024, 16, 8279. [Google Scholar] [CrossRef]
- Lee, D.; Kang, M.M.; Kim, H.J. The human dimension of smart cities: Examining antecedents of citizens’ smart city policy literacy. Int. Rev. Adm. Sci. 2024. [Google Scholar] [CrossRef]
- Gelbukh, A.; Zamir, M.T.; Ullah, F.; Ali, M.; Taiba, T.; Usman, M.; Hafeez, N.; Dudaeva, L.; Fasoldt, C. State-of-the-Art Review in Explainable Machine Learning for Smart-Cities Applications. Data-Driven Innov. Intell. Technol. 2024, 148, 67–76. [Google Scholar] [CrossRef]
- Chen, F.; She, W.; Zeng, F.; Gao, M.; Wen, C.; Liu, G.; Wu, L.; Wu, Y.; Zhang, C. Optimization strategy of community planning for environmental health and public health in smart city under multi-objectives. Front. Public Health 2024, 12, 1347122. [Google Scholar] [CrossRef]
- Allam, Z.; Allam, Z. The Metaverse and Smart Cities: Urban Environments in the Age of Digital Connectivity; Elsevier: Amsterdam, The Netherlands, 2024; pp. 1–228. [Google Scholar] [CrossRef]
- Wang, Z. Road to human-centric smart city governance in Japan: The case of Fujisawa sustainable smart town. Glob. Policy 2024, 15, 84–91. [Google Scholar] [CrossRef]
- Mokarrari, K.R.; Torabi, S.A. Ranking cities based on their smartness level using MADM methods. Sustain. Cities Soc. 2021, 72, 103030. [Google Scholar] [CrossRef]
- Akande, A.; Cabral, P.; Gomes, P.; Casteleyn, S. The Lisbon ranking for smart sustainable cities in Europe. Sustain. Cities Soc. 2019, 44, 475–487. [Google Scholar] [CrossRef]
- Sharifi, A. A typology of smart city assessment tools and indicator sets. Sustain. Cities Soc. 2020, 53, 101936. [Google Scholar] [CrossRef]
- Fernandez-Anez, V.; Fernández-Güell, J.M.; Giffinger, R. Smart City implementation and discourses: An integrated conceptual model. Case Vienna. Cities 2018, 78, 4–16. [Google Scholar] [CrossRef]
- Vidiasova, L.; Kachurina, P.; Cronemberger, F. Smart Cities Prospects from the Results of the World Practice Expert Benchmarking. Procedia Comput. Sci. 2017, 119, 269–277. [Google Scholar] [CrossRef]
- Cebi, S.; Ucal Sari, I.; Kahraman, C.; Oztaysi, B.; Cevik Onar, S.; Tolga, C. Proportional Pythagorean Fuzzy AHP & TOPSIS Methodology for the Evaluation of Industry 5.0 Projects. J. Multi-Valued Log. Soft Comput. 2024, 43, 523–548. [Google Scholar]
Disclaimer/Publisher’s Note: The statements, opinions and data contained in all publications are solely those of the individual author(s) and contributor(s) and not of MDPI and/or the editor(s). MDPI and/or the editor(s) disclaim responsibility for any injury to people or property resulting from any ideas, methods, instructions or products referred to in the content. |
© 2025 by the authors. Licensee MDPI, Basel, Switzerland. This article is an open access article distributed under the terms and conditions of the Creative Commons Attribution (CC BY) license (https://creativecommons.org/licenses/by/4.0/).

