Abstract
Conventional numerical models frequently neglect the effects of strain softening and the spatial variability of surrounding rock when addressing the design and construction of deep tunnels in complex geological settings, which leads to a large deviation from the actual situation and potential security risks. In this case, symmetrical and asymmetric failure of surrounding rock usually occurs. In this paper, a numerical model considering strain softening and spatial variability is established for deep tunnel excavation based on the constitutive theory and probability distribution functions, and their effects on the mechanical behavior of tunnel excavation are systematically examined using FLAC3D software. The findings indicate that symmetrical failure will occur in strain-softening rock mass, and spatial variability will lead to asymmetric failure of surrounding rock. The strain-softening behavior of the internal friction angle has a pronounced impact on the plastic zone radius and post-excavation displacement. The distribution of stress and displacement in the surrounding rock is notably influenced by the spatial variability of the elastic modulus, while the variability in the internal friction angle can cause localized stress concentrations within the tunnel, potentially triggering partial collapse and instability. The coupling effect of strain softening and the spatial variability of surrounding rock properties will aggravate the mechanical response during tunnel excavation, resulting in greater displacement and more severe stress redistribution. Based on these findings, disaster prevention and control strategies are proposed for tunnels in complex geological regions, offering valuable guidance for engineering applications.
1. Introduction
As highway construction in China progressively extends into the mountainous regions of the southwest, many tunnel construction projects will face various complex geological conditions [1,2,3]. The karst cave, as a typical geological hazard, not only destroys the integrity of the surrounding rock but also significantly changes its mechanical properties. Dissolution and stress redistribution lead to a reduction in strength parameters, such as cohesion and friction angle, which manifests as typical strain-softening behavior [4]. Meanwhile, the presence of karst caves alters the physical and mechanical properties of the surrounding rock locally, exacerbating spatial heterogeneity, referred to as spatial variability [5]. The strain-softening behavior and spatial variability of the surrounding rock impart pronounced nonlinear and complex characteristics to the mechanical response during the tunnel excavation process, thereby increasing the challenges in support design and elevating construction risks [6,7]. Investigating the impact of these two factors on mechanical response during tunnel excavation holds substantial engineering significance and theoretical value.
Strain softening in surrounding rock refers to the gradual reduction in strength parameters, such as cohesion and friction angles, as plastic strain increases after the rock mass reaches its peak bearing capacity [8]. Rock masses with strain-softening characteristics may lead to extensive plastic failure or localized instability following tunnel excavation, directly impacting the tunnel’s failure mode and support design [9]. At present, studies on the strain-softening behavior of rock mass mainly focus on experimental research, theoretical modeling, and numerical simulation [10,11,12,13,14,15,16,17,18,19]. Furthermore, some studies have analyzed the mechanical behavior of surrounding rock by incorporating the strain-softening behavior of rock mass into the mathematical model of tunnel excavation [20,21]. With advancements in computational technology, numerical simulation has emerged as a vital tool for investigating the mechanical behavior of tunnels [22,23,24,25,26]. Despite substantial advancements in understanding the strain-softening behavior of rock masses, several challenges remain unresolved. One of the more important points is that existing research mostly regards surrounding rock as homogeneous material, ignoring the impact of spatial variability. The spatial variability includes uneven distribution of parameters such as internal strength, stiffness, and deformation characteristics, which is crucial to account for the spatial variability of surrounding rock alongside strain-softening behavior [27,28,29]. To accurately represent the spatial variability of surrounding rock, various statistical and probabilistic approaches are utilized to model and analyze the spatial distribution of rock mass parameters. Common techniques include statistical analysis, random field theory, Kriging interpolation, and stochastic finite element methods [30,31,32]. Random field theories are integrated with numerical approaches, such as the finite element method (FEM), finite difference method (FDM), and discrete element method (DEM), to investigate the effects of spatial variability in surrounding rock.
While existing studies have started to address the impact of strain softening and the spatial variability of rock masses on the mechanical behavior of surrounding rock, the numerical simulation of rock mass strain softening remains inadequately explored. Research on the spatial variability of surrounding rock has predominantly focused on shallow tunnels, with comparatively limited studies addressing deep tunnels. In addition, most studies have analyzed the strain softening or the spatial variability characteristics of rock mass as independent factors, with relatively few studies on the coupling effect of the two. In fact, in deep, complex geological environments, both characteristics of rock masses often coexist [33,34,35]. Based on the above limitations, this study used a karst tunnel project to characterize the strain-softening behavior and spatial variability of surrounding rock through numerical modeling. Subsequently, numerical simulations were conducted to assess the impact of strain softening and spatial variability on the mechanical response during tunnel excavation. The findings of this study offer theoretical insights and practical guidance for the design and construction of tunnels in complex geological settings, including karst environments.
2. Numerical Modeling of Strain Softening and Spatial Variability
2.1. Strain—Softening Model
In underground rock mass engineering, mechanical models are classified into three categories according to the form of the stress–strain curve during rock mass yielding and failure: ideal elastic–plastic, elastic–brittle–plastic, and elastic–plastic strain–softening models, as shown in Figure 1. In the strain-softening model, a softening parameter (η) is typically introduced to characterize the transition process and pattern of strength degradation [36]. When the rock mass undergoes purely elastic deformation, the softening parameter η = 0. When η > 0, the rock mass exhibits strain-softening behavior until stabilizing at its residual strength. The slope of the softening stage () indicates the rate of strength reduction, with the slope angle represented by . When the slope approaches infinity, the rock mass displays purely brittle characteristics. In contrast, as the slope nears zero, the behavior approximates an ideal elastic–plastic state. These two extremes can be considered special cases within the strain–softening model.
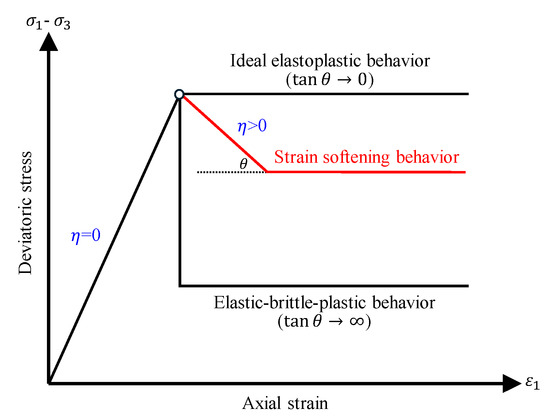
Figure 1.
Stress–strain relationships for three mechanical models of rock mass.
Describing the strain–softening process in rock masses is particularly challenging. Generally, the softening parameter () is defined as a function of incremental plastic strain or as an internal variable. Plastic shear strain () is the most frequently used parameter to represent strain softening, calculated as follows:
where and represent the maximum and minimum principal plastic strains, respectively.
Additionally, the incremental plastic parameter () can be expressed as follows:
where represents the intermediate principal plastic strain.
The strain-softening model based on Mohr–Coulomb can be implemented in the version 6.0 of FLAC3D software. In this model, the incremental plastic parameter () serves as a measure of plastic shear strain, expressed as follows:
where
The correlation between the incremental plastic parameter () and plastic shear strain () can be formulated as follows [35]:
where represents the angle of dilatancy.
In the traditional Mohr–Coulomb model, cohesion and internal friction angle are treated as constant values. Adversely, the strain–softening model accounts for these shear strength parameters, such as cohesion and friction angle, as functions of plastic shear strain () once the material enters the plastic state, as depicted in Figure 2. This relationship can be represented by multiple connected linear segments in FLAC3D software, and the variations in cohesion and internal friction angle corresponding to different plastic shear strains can be specified using the “table” command.
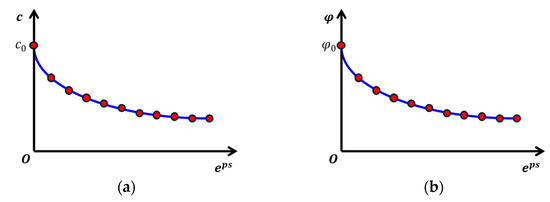
Figure 2.
Variation of cohesion and internal friction angle with respect to plastic shear strain: (a) cohesion, (b) internal friction angle.
In the numerical simulation process, once a model element reaches the yield state, its shear strength parameters are updated at each calculation step based on the plastic strain value. This nonlinear relationship between plastic strain and shear strength parameters enables continuous updates to the rock mass’s strength properties. This method enables the simulation to precisely capture the strain–softening behavior of the rock mass during the entire deformation process.
2.2. Numerical Realization of Spatial Variability
This study describes the heterogeneity of mechanical characteristics in rock materials using the Weibull distribution within the probability density function. Material property variability is generally modeled utilizing the Weibull distribution, a continuous probability distribution. The following is an ordinary formula for its probability density function:
where represents the random variable, is the scale parameter, and denotes the shape parameter.
According to Formula (6), the cumulative distribution function (CDF) of the Weibull distribution is as follows:
Furthermore, the expression for the random variable can be obtained through the inverse transformation of the cumulative distribution function. This inverse transformation is expressed as follows:
where the represents a uniformly distributed random number between 0 and 1.
Consequently, the target parameters can be stochastically assigned within a predefined range using the Weibull distribution, effectively capturing the spatial variability of the mechanical properties. The random characterization of the surrounding rock’s mechanical properties, corresponding to the Weibull distribution, is formulated as follows by rearranging Formula (8):
where is the parameter that follows the Weibull distribution, represents the mean value of the parameter, is a random number within the probability distribution range of 0 to 1, and defines the homogeneity of the surrounding rock parameters.
Using the internal friction angle as an example, when the mean internal friction angle is set to 30°, the Weibull probability density distributions under varying homogeneity conditions are illustrated in Figure 3. The spatial variability of the surrounding rock’s mechanical properties can be effectively characterized by adjusting the mean value and homogeneity parameter ().
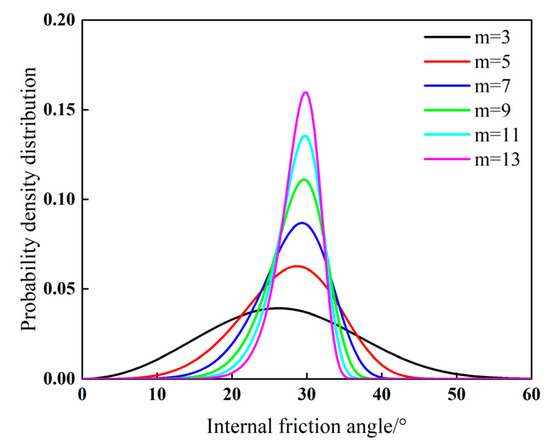
Figure 3.
The distribution of internal friction angles under different homogeneity values.
During numerical calculations, the model elements can be randomly assigned values using the “math.random.uniform” function in FLAC3D software, combined with custom scripts written in FISH language. Parameters are calculated according to Formula (9) and then randomly distributed following the Weibull distribution, achieving a heterogeneous distribution of the mechanical parameters.
3. Numerical Analysis During Deep Tunnel Excavation
3.1. Numerical Model Establishment
In establishing the numerical model, tunnel excavation was regarded as a plane strain problem, and considering the underground depth of the tunnel, the tunnel cross section was modeled as a circle with a radius = 5 m. The surrounding rock was assumed to experience a hydrostatic pressure of = 10 Mpa to reduce boundary effects; the model dimensions were set to 80 m × 80 m, containing 25,690 mesh elements; and appropriate boundary constraints were applied, as shown in Figure 4. The FLAC3D software was employed to simulate the numerical model of tunnel excavation, with the simulation process carried out in two steps: (1) initial stress application, where vertical stress () and horizontal stress () were applied, with plane strain constraints imposed to simulate the initial stress state of the surrounding rock, and (2) tunnel excavation and support, where tunnel elements were removed, and a support pressure = 2.5 MPa was applied to the surrounding rock to replicate the excavation and support process.
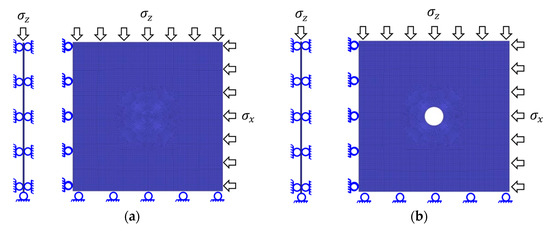
Figure 4.
Numerical model of deep tunnel excavation: (a) apply the initial stress field, (b) tunnel excavation.
The physical and mechanical parameters derived from laboratory tests and field measurements are detailed in Table 1. Identifying the evolution of surrounding rock strength parameters with plastic shear strain is a key aspect of the strain-softening model. Four distinct modifications were developed to illustrate changes in the variation of cohesion and internal friction angles with plastic shear strain to make it easier to analyze the strain-softening effect on the mechanical response, as shown in Figure 5. It should be specified that when = 0, the shear strength corresponds to the initial peak strength; when ≥ 2.5%, the shear strength reaches its residual value. In the figure, represents the residual cohesion, and denotes the residual internal friction angle at the same ≥ 2.5%. Based on this relationship, the cohesion and internal friction angle values at various plastic shear strains () were determined and integrated into the numerical calculation model.

Table 1.
Physical and mechanical parameters of surrounding rock.
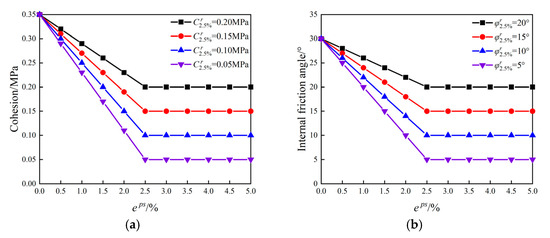
Figure 5.
The relationship between cohesion and internal friction angle with plastic shear strains: (a) cohesion, (b) internal friction angle.
As for the numerical realization of spatial variability, refs. [37,38] suggests that variations in the elastic modulus and internal friction angle significantly impact the mechanical response of the surrounding rock. Consequently, this study investigated the impact of the spatial variability of these two parameters. The homogeneity parameter () was set to values of 3, 5, 9, and 25; the initial mechanical parameter values are listed in Table 1. Figure 6 and Figure 7 show the distributions of the elastic modulus and internal friction angle for varying m-values. As can be seen, when the -value is smaller, the spatial variability of mechanical parameters is stronger, indicating that greater homogeneity leads to more uniform mechanical properties in the surrounding rock.
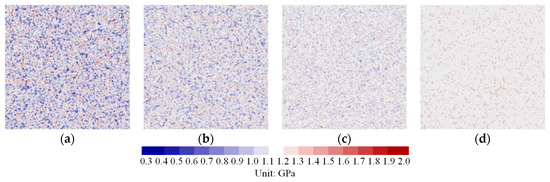
Figure 6.
Spatial variability distribution of elastic modulus: (a) = 3, (b) = 5, (c) = 9, (d) = 25.
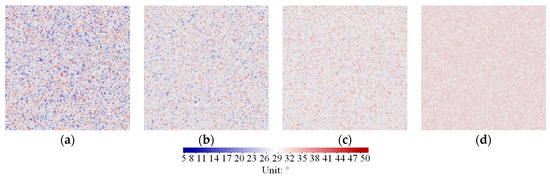
Figure 7.
Spatial variability distribution of internal friction angle: (a) = 3, (b) = 5, (c) = 9, (d) = 25.
3.2. Analysis of Numerical Simulation Results
3.2.1. Simulation Results Based on Ideal Elastic–Plastic Model
To evaluate the impact of strain softening and spatial variability on the mechanical behavior of deep tunnel excavation, a numerical simulation was performed using the ideal elastic–plastic model with the assumption of homogeneous surrounding rock. Figure 8 presents radial and tangential stress distributions. After tunnel excavation, the radial stress near the tunnel decreases, whereas tangential stress accumulates at a specific distance from the tunnel wall. The maximum tangential stress reaches 14.88 MPa, with a stress concentration factor of 1.488. The simulated stress distribution pattern is in good agreement with the real situation.
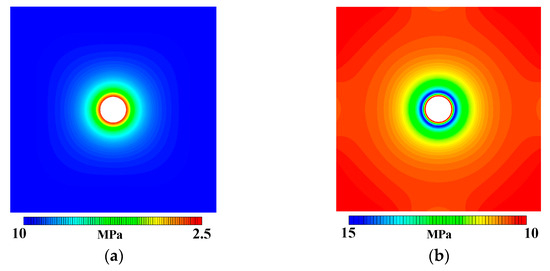
Figure 8.
Stresses distribution around the tunnel based on an ideal elastic–plastic model: (a) radial stress, (b) tangential stress.
The numerical data for stress and displacement around the tunnel were further extracted, as demonstrated in Figure 9. The plastic zone radius, calculated using the ideal elastic–plastic model, is approximately 1.89 m, with a maximum displacement of 55.4 mm. These simulation results offer valuable reference data for subsequent analyses and further studies.
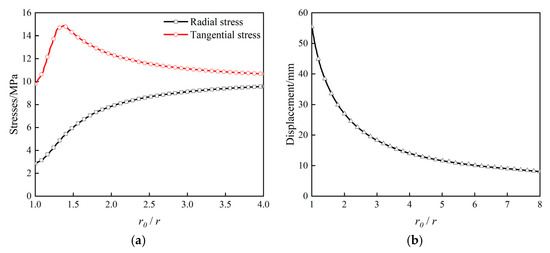
Figure 9.
Stresses and displacement around the tunnel based on an ideal elastic–plastic model: (a) stresses, (b) displacement.
3.2.2. Simulation Results Based on Strain Softening Model
Considering the variation of cohesion with plastic shear strain (), Figure 10 and Figure 11 depict the radial and tangential stress distributions, respectively. When residual cohesion changes, the overall stress distribution remains like that observed in the ideal elastic–plastic model. Although cohesion decreases to different extents with increasing plastic shear strain, the radial and tangential stress distributions show no significant changes, indicating that cohesion degradation has a minimal impact on stress redistribution in the surrounding rock.
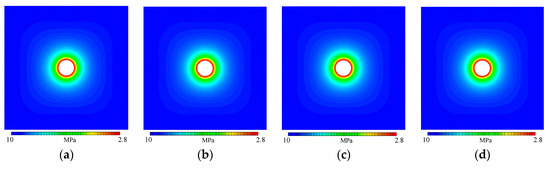
Figure 10.
Radial stress distribution around the tunnel considering the change of : (a) = 0.20 MPa, (b) = 0.15 MPa, (c) = 0.10 MPa, (d) = 0.05 MPa.
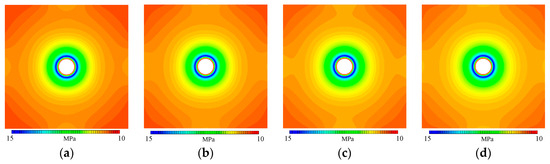
Figure 11.
Tangential stress distribution around the tunnel considering the change of : (a) = 0.20 MPa, (b) = 0.15 MPa, (c) = 0.10 MPa, (d) = 0.05 MPa.
The numerical data for stress and displacement around the tunnel were further analyzed, as shown in Figure 12. The distributions of radial and tangential stress, as well as the maximum displacement of the surrounding rock, exhibit minimal variation with varies. This phenomenon may be attributed to the low initial cohesion, which is only 0.35 MPa, resulting in a limited impact on the mechanical response. Consequently, even as cohesion degrades due to the strain–softening effect, its impact on the mechanical behavior remains negligible.
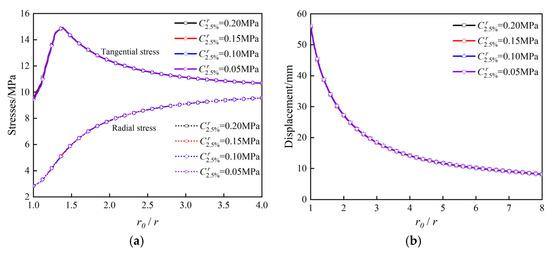
Figure 12.
Stresses and displacement distributions considering the change of : (a) stresses, (b) displacement.
Another possible reason is that cohesion in this study reaches its residual value when the = 2.5%. However, in certain instances, may not attain this value, resulting in a minimal effect on the simulation outcomes. Based on this observation, additional simulations were performed to evaluate the mechanical response under varying plastic shear strains, each reaching the same residual cohesion. As illustrated in Figure 13, the results indicate that the distributions of radial stress, tangential stress, and maximum displacement remain consistent. This suggests that for weak surrounding rock with low initial cohesion, the strain–softening effect due to cohesion degradation with plastic shear strain has a negligible impact on the mechanical response.
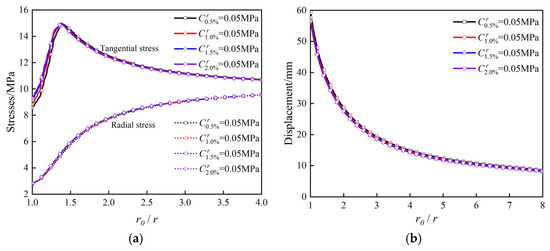
Figure 13.
Stresses and displacement distributions considering the same residual cohesion: (a) stresses, (b) displacement.
Figure 14 and Figure 15 illustrate the radial and tangential stress distributions, respectively, considering the variation of the internal friction angle with plastic shear strain. It is evident that as decreases, the extent of the excavation disturbance increases. The radial stress around the tunnel gradually decreases, while the peak value of tangential stress remains largely unaffected. These findings indicate that while changes in the internal friction angle have a minimal impact on the peak tangential stress around the tunnel, they do influence the extent of surrounding rock disturbance.
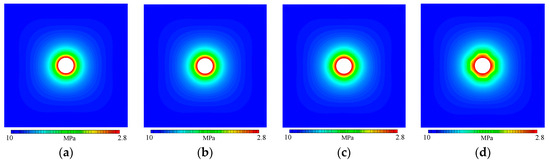
Figure 14.
Radial stress distribution around the tunnel considering the change of : (a) = 20°, (b) = 15°, (c) = 10°, (d) = 5°.
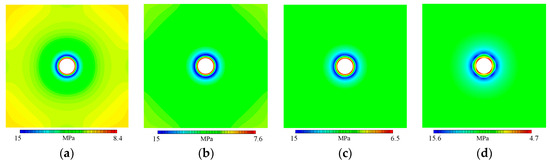
Figure 15.
Tangential stress distribution around the tunnel considering the change of : (a) = 20°, (b) = 15°, (c) = 10°, (d) = 5°.
Numerical results for stress and displacement around the tunnel, incorporating the variation of the internal friction angle as a function of plastic shear strain (), are presented in Figure 16. The analysis reveals that as the residual internal friction angle decreases, both the plastic zone radius and the tunnel wall displacement increase markedly. For residual internal friction angles of 20°, 15°, 10°, and 5°, the plastic zone radii are 1.93 m, 2.37 m, 2.45 m, and 3.33 m, respectively, while the corresponding displacements are 59.2 mm, 62.6 mm, 66.7 mm, and 77.1 mm. These findings underscore the significant impact of the strain-softening behavior of the internal friction angle on the plastic zone radius and displacement around the tunnel.
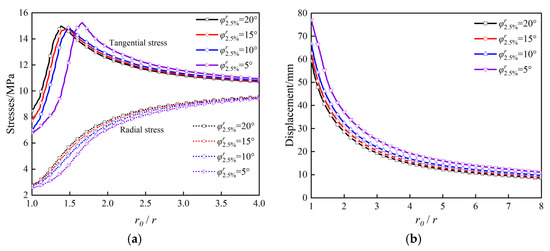
Figure 16.
Stresses and displacement distributions considering the change of : (a) stresses, (b) displacement.
3.2.3. Simulation Results Considering the Spatial Variability Effect
Figure 17 and Figure 18 illustrate the simulation results for radial and tangential stress distributions, considering the elastic modulus distribution of the surrounding rock under different homogeneity conditions (). When -value is smaller, the spatial distributions of radial and tangential stresses reveal clear local stress concentrations in the surrounding rock. Compared to the ideal elastic–plastic model, the stress distribution is significantly uneven, with radial stress displaying a divergent pattern and tangential stress forming a circular pattern. These findings indicate that the stress distribution in the surrounding rock is strongly influenced by the spatial variability of the elastic modulus, with greater variability resulting in more pronounced local stress concentrations.
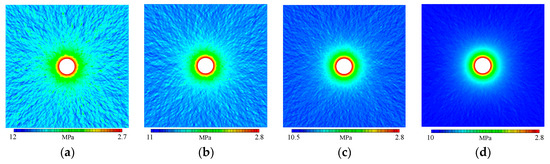
Figure 17.
Radial stress distribution around the tunnel considering the spatial variability of elastic modulus: (a) = 3, (b) = 5, (c) = 9, (d) = 25.
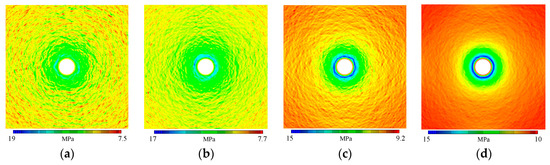
Figure 18.
Tangential stress distribution around the tunnel considering the spatial variability of elastic modulus: (a) = 3, (b) = 5, (c) = 9, (d) = 25.
Figure 19 and Figure 20 present the simulation results for radial and tangential stress distributions, considering the internal friction angle distribution of the surrounding rock under different homogeneity conditions (m), while the simulation results for radial and tangential stress distributions are displayed in Figure 20 and Figure 21. Differences in the internal friction angle due to spatial variability exert a more pronounced effect on the stress distribution near the tunnel wall. When m is smaller, significant local stress concentrations occur in the rock surrounding the tunnel wall. This increased stress concentration could potentially lead to localized collapse and instability, underscoring the crucial role of internal friction angle variability in tunnel stability.
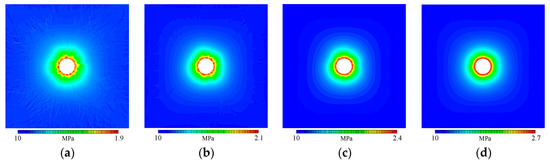
Figure 19.
Radial stress distribution around the tunnels considering the spatial variability of internal friction angles: (a) = 3, (b) = 5, (c) = 9, (d) = 25.
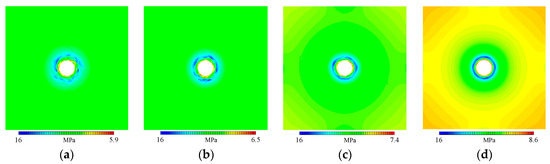
Figure 20.
Tangential stress distribution around the tunnels considering the spatial variability of internal friction angles: (a) = 3, (b) = 5, (c) = 9, (d) = 25.
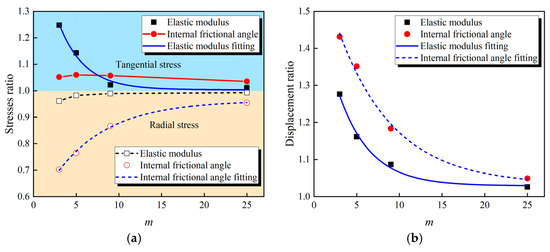
Figure 21.
Ratio of peak stress and displacement distributions with the change of : (a) stresses, (b) displacement.
It is crucial to both qualitatively and quantitatively evaluate the influence of spatial variability on the mechanical response during tunnel excavation. For the tunnel’s support design and construction, key parameters include radial stress, displacement, and plastic zone configuration. Figure 21 summarizes the ratio of peak stress and displacement distributions under various homogeneity conditions compared to homogeneous conditions. The figure indicates that the spatial variability of the elastic modulus significantly affects tangential stress distribution but has limited influence on radial stress. Conversely, the spatial variability of the internal friction angle strongly impacts radial stress distribution, with minimal effect on tangential stress. Additionally, variability in both the elastic modules and internal friction angles substantially affects displacement, with the internal friction angle exerting a more pronounced influence than the elastic modulus. The relationship between these mechanical responses and the homogeneity parameter () shows a strong exponential correlation, which can be expressed as follows:
where represents the homogeneity; , , and are the fitting parameters; and and denote the mechanical response results under heterogeneous and homogeneous conditions, respectively.
Based on Formula (10), when the mechanical response results under homogeneous surrounding rock conditions and the corresponding homogeneity parameter () are obtained, the mechanical response results accounting for the spatial variability of mechanical parameters can be effectively estimated. This approach enables a more realistic analysis of the stress, displacement, and stability of tunnel excavation by incorporating the spatial variability of the surrounding rock.
3.2.4. Coupling Effect of Strain Softening and Spatial Variability
The above analysis demonstrates that both strain softening and spatial variability significantly affect the mechanical response during tunnel excavation, with the internal friction angle and elastic modulus playing especially critical roles. Consequently, the coupling effect between the strain softening of the internal friction angle and the spatial variability of the elastic modulus on the excavation response of deep-buried tunnels was further examined. The method to realize the coupling effect of strain softening and the spatial variability of surrounding rock was as follows. For numerical simulation, the strain-softening constitutive model was selected as the constitutive model. According to the above research, it was found that the change of internal friction angle has a great influence on the mechanical response of surrounding rock. Therefore, the internal friction angle was selected as the softening variable. At the same time, the elastic modulus was used as a random distribution variable to randomly assign the element. Through this operation, the coupling effect analysis of strain softening and the spatial variability of surrounding rock was realized.
The radial and tangential stress distributions under extreme coupling conditions are shown in Figure 22 and Figure 23. Compared to single-factor influences, the coupling effect of strain softening and spatial variability exerts a more substantial impact on the mechanical behavior of the surrounding rock. As the internal friction angle decreases and the homogeneity parameter of the elastic modulus remains small, the radial stress distribution shifts from a symmetrical divergent pattern to an asymmetric one, with a progressive decrease in peak radial stress. The asymmetry in tangential stress distribution becomes more pronounced, resulting in increased radial stress. This result ultimately leads to the tunnel failure mode shifting from a generally asymmetric pattern to a localized asymmetric failure.
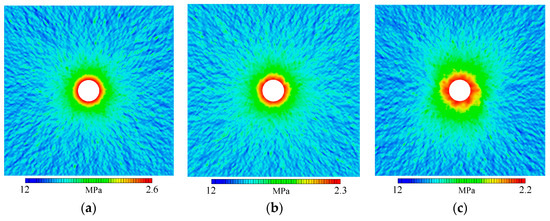
Figure 22.
Radial stress distribution considers the coupling effect of strain softening and spatial variability: (a) = 20°, = 3; (b) = 15°, = 3; (c) = 5°, = 3.
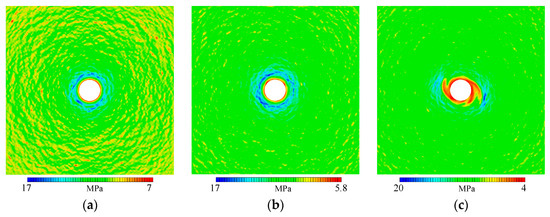
Figure 23.
Tangential stress distribution considers the coupling effect of strain softening and spatial variability: (a) = 20°, = 3; (b) = 15°, = 3; (c) = 5°, = 3.
Similarly, Figure 24 summarizes the ratio of peak stress and displacement distribution under the coupling effect to those under homogeneous conditions. The coupling effect produces a pronounced amplification effect on both stress and displacement. Under extreme conditions, the peak tangential stress can reach 1.4 times that of the ideal model, while peak displacement may be up to 4 times greater. Correspondingly, the plastic zone radius in the surrounding rock also increases. These findings highlight the critical need to account for the coupled effects of strain softening and spatial variability in tunnel stability analyses as well as their amplifying impact on the mechanical response during tunnel excavation. In designing and constructing tunnels in complex environments, neglecting these effects could reduce the accuracy of stability assessments and compromise engineering safety.
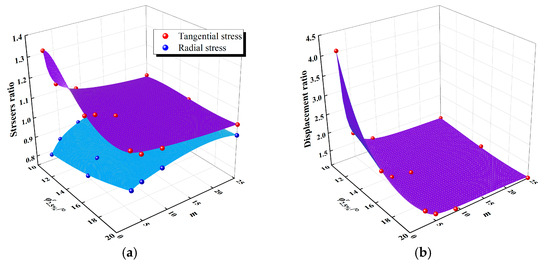
Figure 24.
Ratio of peak stresses and displacement distributions under the coupled effect of strain softening and spatial variability: (a) stresses, (b) displacement.
In deep-buried karst tunnels, the strain softening behavior and spatial variability of the surrounding rock are especially significant, necessitating careful consideration of both factors in disaster prevention strategies during tunnel construction. Based on the above analysis, prevention and control strategies should emphasize two primary aspects. First, the occurrence of plastic shear strain in the surrounding rock should be reduced to mitigate the strain-softening effect. Second, the homogeneity of the surrounding rock should be enhanced to decrease its spatial variability. The following disaster prevention and control measures are proposed for deep-buried karst tunnels:
(1) Strengthen the support system and optimize the excavation method by choosing suitable support types, providing timely reinforcement, and employing step-by-step and layered excavation techniques to prevent large-scale plastic deformation in the surrounding rock.
(2) Implement pre-reinforcement measures by applying grouting reinforcement, including deep-hole grouting, to improve the overall mechanical properties and homogeneity.
4. Conclusions
This paper introduces a numerical calculation method for deep-buried tunnels, established through modeling and simulation of the strain-softening behavior and spatial variability of the surrounding rock, and analyzes the effects of these two factors on the mechanical response on tunnel excavation. Construction recommendations are proposed for effectively managing strain softening and spatial variability in surrounding rock based on the simulation-based findings. The primary conclusions are as follows:
- (a)
- The strain softening behavior of the internal friction angle significantly affects the plastic zone radius and tunnel displacement. In contrast, for weak surrounding rock with low initial cohesion, its influence on the mechanical response is relatively negligible.
- (b)
- Spatial variability of elastic modulus primarily influences tangential stress distribution, and the internal friction angle exerts a greater influence on radial stress and displacement. Near the tunnel wall, the internal friction angle’s variability leads to pronounced localized stress concentrations, surpassing those caused by the elastic modulus and increasing the risk of localized collapse or instability. Furthermore, analysis reveals that the peak value ratio of stress and displacement between spatial variability and homogeneous models exhibits a strong exponential correlation with the homogeneity parameter. This underscores the importance of incorporating spatial variability of geotechnical parameters in tunnel stability evaluations to accurately predict mechanical behavior and maintain structural safety.
- (c)
- The coupling effect of strain softening and spatial variability exerts a more significant impact on the mechanical response compared to individual effects. Under extreme coupling conditions, the tunnel’s failure mode shifts from a general asymmetric failure to localized asymmetric failure. The peak value of tangential stress and displacement reaches 1.4 times and 4 times that of the ideal model, respectively. These findings highlight the significant amplification impact of strain softening and spatial variability on tunnel excavation, underscoring that it cannot be disregarded.
- (d)
- Based on the numerical simulation results, a construction management approach is proposed, focusing on regulating plastic shear strain and improving the homogeneity of the surrounding rock. Disaster prevention measures include optimizing excavation methods and sequences, reinforcing the support system, and applying pre-reinforcement strategies. The results provide a scientific basis and practical recommendations for disaster prevention and mitigation in tunnel construction within complex geological settings.
Author Contributions
Conceptualization, Y.Z. (Yu Zeng); methodology, Y.Z. (Yu Zeng); software, Y.Z. (Yu Zeng); validation, Y.Z. (Yao Zhang); investigation, Y.Z. (Yao Zhang); data curation, Y.Z. (Yao Zhang); writing—original draft preparation, Y.Z. (Yu Zeng); writing—review and editing, Y.Z. (Yao Zhang); visualization, Y.Z. (Yu Zeng); supervision, Y.Z. (Yu Zeng). All authors have read and agreed to the published version of the manuscript.
Funding
This research received no external funding.
Data Availability Statement
Data are contained within the article.
Conflicts of Interest
Author Yao Zhang was employed by the company Honghui No. 1 coal mine branch of Gansu Jingmei Energy Co., Ltd. The remaining author declares that the research was conducted in the absence of any commercial or financial relationships that could be construed as a potential conflict of interest.
References
- Li, L.; Tu, W.; Shi, S.; Chen, J.; Zhang, Y. Mechanism of water inrush in tunnel construction in karst area. Geomatics. Nat. Hazards Risk 2016, 7, 35–46. [Google Scholar] [CrossRef]
- Kaufmann, G.; Romanov, D. Modelling long-term and short-term evolution of karst in the vicinity of tunnels. J. Hydrol. 2020, 581, 124282. [Google Scholar] [CrossRef]
- Wang, F.; Zhao, Y.; Li, C.; Li, C.; Lan, T.; Ping, S.; Cao, Y. An experimental study on the corrosion characteristics of the karst tunnel engineering area in Southwest China. Bull. Eng. Geol. Environ. 2019, 78, 4047–4061. [Google Scholar] [CrossRef]
- Xu, C.; Zhou, X.; Wang, H.; Gao, X.; Li, X. A case study of thaumasite sulfate attack in tunnel engineering. Adv. Civ. Eng. 2021, 2021, 8787757. [Google Scholar] [CrossRef]
- Yau, K.; Paraskevopoulou, C.; Konstantis, S. Spatial variability of karst and effect on tunnel lining and water inflow: A probabilistic approach. Tunn. Undergr. Space Technol. 2020, 97, 103248. [Google Scholar] [CrossRef]
- Zhang, L.W.; Fu, H.; Wu, J.; Zhang, X.Y.; Zhao, D.K. Effects of karst cave shape on the stability and minimum safety thickness of tunnel surrounding rock. Int. J. Geomech. 2021, 21, 04021150. [Google Scholar] [CrossRef]
- Alija, S.; Torrijo, F.J.; Quinta-Ferreira, M. Geological engineering problems associated with tunnel construction in karst rock masses: The case of Gavarres Tunnel (Spain). Eng. Geol. 2013, 157, 103–111. [Google Scholar] [CrossRef]
- Read, H.E.; Hegemier, G.A. Strain-softening of rock, soil and concrete: A review article. Mech. Mater. 1984, 3, 271–294. [Google Scholar] [CrossRef]
- Pan, Q.; Dias, D. Three-dimensional static and seismic stability analysis of a tunnel face driven in weak rock masses. Int. J. Geomech. 2018, 18, 04018055. [Google Scholar] [CrossRef]
- Lu, W.; Zhu, Z.; He, Y.; Que, X. Strength characteristics and failure mechanism of a columnar jointed rock mass under uniaxial, triaxial, and true triaxial confinement. Rock Mech. Rock Eng. 2021, 54, 2425–2439. [Google Scholar] [CrossRef]
- Wang, Y.N.; Wang, L.C.; Zhou, H.Z. An experimental investigation and mechanical modeling of the combined action of confining stress and plastic strain in a rock mass. Bull. Eng. Geol. Environ. 2022, 81, 204. [Google Scholar] [CrossRef]
- Rong, P.; Zuo, Y.; Lin, J.; Chen, Q.; Zheng, L.; Jin, K. Study of mechanical properties and failure characteristics of combined rock mass with weak interlayer. Geomech. Geophys. Geo-Energy Geo-Resour. 2022, 8, 89. [Google Scholar] [CrossRef]
- Renani, R.H.; Martin, D.C. Cohesion degradation and friction mobilization in brittle failure of rocks. Int. J. Rock Mech. Min. Sci. 2018, 106, 1–13. [Google Scholar] [CrossRef]
- Xiong, L.; Wu, S.; Zhang, S. Mechanical behavior of a granite from Wuyi Mountain: Insights from strain-based approaches. Rock Mech. Rock Eng. 2019, 52, 719–736. [Google Scholar] [CrossRef]
- Li, Y.; Zhang, Q.; Gu, Q.; Wu, P.; Jiang, B. An improved strain-softening constitutive model of granite considering the effect of crack deformation. J. Rock Mech. Geotech. Eng. 2024, 16, 1202–1215. [Google Scholar] [CrossRef]
- Zhang, F.; Yashima, A.; Ye, G.L.; Adachi, T.; Oka, F. An elastoplastic strain-hardening and strain-softening constitutive model for soft rock considering the influence of intermediate stress. Soils Found. 2003, 43, 107–117. [Google Scholar] [CrossRef][Green Version]
- Shen, P.; Tang, H.; Ning, Y.; Xia, D. A damage mechanics based on the constitutive model for strain-softening rocks. Eng. Fract. Mech. 2019, 216, 106521. [Google Scholar] [CrossRef]
- Xiao, Y.; Qiao, Y.; He, M.; Li, H.; Cheng, T.; Tang, J. A unified strain-hardening and strain-softening elastoplastic constitutive model for intact rocks. Comput. Geotech. 2022, 148, 104772. [Google Scholar] [CrossRef]
- Wang, T.; Ma, Z. Research on strain-softening constitutive model of coal-rock combined body with damage threshold. Int. J. Damage Mech. 2022, 31, 22–42. [Google Scholar] [CrossRef]
- Zhang, Q.; Wang, X.F.; Jiang, B.S.; Liu, R.C.; Li, G.M. A finite strain solution for strain-softening rock mass around circular roadways. Tunn. Undergr. Space Technol. 2021, 111, 103873. [Google Scholar] [CrossRef]
- Chu, Z.; Wu, Z.; Liu, Q.; Weng, L.; Xu, X.; Wu, K.; Sun, Z. Visco-elastic-plastic solution for deep buried tunnels considering tunnel face effect and sequential installation of double linings. Comput. Geotech. 2024, 165, 105930. [Google Scholar] [CrossRef]
- Zhang, Q.; Wang, H.-Y.; Jiang, Y.-J.; Lu, M.-M.; Jiang, B.-S. A numerical large strain solution for circular tunnels excavated in strain-softening rock masses. Comput. Geotech. 2019, 114, 103142. [Google Scholar] [CrossRef]
- Zhang, Q.; Quan, X.-W.; Wang, H.-Y.; Jiang, B.-S.; Liu, R.-C. A numerical solution of a circular tunnel in a confining pressure-dependent strain-softening rock mass. Comput. Geotech. 2020, 121, 103473. [Google Scholar] [CrossRef]
- Wu, P.; Zhang, Q.; Li, S.; Liu, R.; Wang, H.; Han, G. A numerical strain-softening solution of a circular opening in nonlinear yield rock masses. Tunn. Undergr. Space Technol. 2024, 153, 106035. [Google Scholar] [CrossRef]
- Fei, S.; Alfonso, R. Numerical solutions for tunnels excavated in strain-softening rock masses considering a combined support system. Appl. Math. Modell. 2021, 92, 905–930. [Google Scholar] [CrossRef]
- Guan, K.; Zhu, W.; Wei, J.; Liu, X.; Niu, L.; Wang, X. A finite strain numerical procedure for a circular tunnel in strain-softening rock mass with large deformation. Int. J. Rock Mech. Min. Sci. 2018, 112, 266–280. [Google Scholar] [CrossRef]
- Guo, X.; Du, D.; Dias, D. Reliability analysis of tunnel lining stability based on strain-softening characteristics. Eng. Struct. 2019, 192, 305–321. [Google Scholar] [CrossRef]
- Zhang, S.; Wang, Y.; Gao, Q.; Ma, X.; Zhou, H.; Wang, Z. Probabilistic analysis of ground settlement induced by tunnel excavation in multilayered soil considering spatial variability. Comput. Geotech. 2024, 165, 105951. [Google Scholar] [CrossRef]
- Zhang, Z.; Ji, J.; Guo, X.; Goh, S.H. Inverse reliability analysis and design for tunnel face stability considering soil spatial variability. J. Rock Mech. Geotech. Eng. 2024, 16, 1552–1564. [Google Scholar] [CrossRef]
- Miranda, T.; Viana, A.; Martins, F.F.; Guo, X.; Cristelo, N.; Dias, D. Numerical analysis of a tunnel behaviour considering the spatial variability of the geotechnical parameters. Proc. Inst. Civ. Eng.-Geotech. Eng. 2024, 177, 392–404. [Google Scholar] [CrossRef]
- Zhang, Y.; Liu, X.; Yuan, S.; Zhang, T.; Song, J.; Chen, W. Probabilistic stability analysis of qanat tunnels in c-φ soil considering soil spatial variability. Eur. J. Environ. Civ. Eng. 2022, 27, 3763–3783. [Google Scholar] [CrossRef]
- Liu, Y.; Chen, X.; Hu, M. Three-dimensional large deformation modeling of landslides in spatially variable and strain-softening soils subjected to seismic loads. Can. Geotech. J. 2023, 60, 426–437. [Google Scholar] [CrossRef]
- Cai, W.; Dou, L.; Ju, Y.; Cao, W.; Yuan, S.; Si, G. A plastic strain-based damage model for heterogeneous coal using cohesion and dilation angle. Int. J. Rock Mech. Min. Sci. 2018, 110, 151–160. [Google Scholar] [CrossRef]
- Zhou, X. Analysis of the localization of deformation and the complete stress-strain relation for mesoscopic heterogeneous brittle rock under dynamic uniaxial tensile loading. Int. J. Solids Struct. 2003, 41, 1725–1738. [Google Scholar] [CrossRef]
- Alonso, E.; Alejano, L.R.; Varas, F.; Fdez-Manin, G.; Carranza-Torres, C. Ground response curves for rock masses exhibiting strain-softening behaviour. Int. J. Numer. Anal. Methods Geomech. 2003, 27, 1153–1185. [Google Scholar] [CrossRef]
- Sun, M.; Yan, Q.; Zhang, J.; Wang, E.; Yao, C.; Wang, X. A practical method for considering soil strain softening effect in the tunnel face stability analysis by numerical modeling. B Eng. Geol. Environ. 2022, 8, 486. [Google Scholar] [CrossRef]
- Cheng, H.; Chen, J.; Chen, R.; Huang, J.; Li, J. Three-dimensional analysis of tunnel face stability in spatially variable soils. Comput. Geotech. 2019, 111, 76–88. [Google Scholar] [CrossRef]
- Cheng, H.-Z.; Chen, J.; Chen, R.-P.; Chen, G.-L. Reliability study on shield tunnel face using a random limit analysis method in multilayered soils. Tunn. Undergr. Space Technol. 2019, 84, 353–363. [Google Scholar] [CrossRef]


Disclaimer/Publisher’s Note: The statements, opinions and data contained in all publications are solely those of the individual author(s) and contributor(s) and not of MDPI and/or the editor(s). MDPI and/or the editor(s) disclaim responsibility for any injury to people or property resulting from any ideas, methods, instructions or products referred to in the content. |
© 2025 by the authors. Licensee MDPI, Basel, Switzerland. This article is an open access article distributed under the terms and conditions of the Creative Commons Attribution (CC BY) license (https://creativecommons.org/licenses/by/4.0/).