Article

Quantitative Optimization of the Heating Element for Enhanced Temperature Uniformity in an Embryo Chamber

Suzhou Institute of Biomedical Engineering and Technology, Chinese Academy of Sciences, Suzhou 215163, China
*
Authors to whom correspondence should be addressed.
Symmetry 2025, 17(4), 478; https://doi.org/10.3390/sym17040478
Submission received: 12 February 2025 / Revised: 14 March 2025 / Accepted: 20 March 2025 / Published: 22 March 2025
(This article belongs to the Section Engineering and Materials)

Abstract

:
In assisted reproductive technology (ART), maintaining a uniform and stable temperature field within the culture space is critical for ensuring consistent embryo development quality. Traditional heating methods often overlook the inherent heat transfer characteristics of the system, resulting in significant temperature gradients across the culture space. This study introduces a quantitative optimization approach for the heating element, focusing on metal foil as a case study, to enhance temperature uniformity in the embryo chamber. We employ numerical simulation techniques to analyze the temperature distribution of the cultivation chamber based on the layout of the heating elements. After the chamber achieves heat transfer equilibrium, we segment the culture chamber structure into multiple isothermal regions and apply the law of energy conservation to establish a mathematical relationship between the changes in heating element resistance and temperature within each region. By iteratively adjusting the length or width of the metal foil in different areas, we optimize the temperature distribution of the overall structure, thereby improving the uniformity of the temperature field within the embryo chamber. The experimental results indicate that the optimized heating element reduces the temperature gradient within the culture chamber from 0.5 °C to less than 0.1 °C, providing robust technical support for enhancing embryo development quality and consistency.

1. Introduction

In the study of cellular tissues, the temperature and gas concentration are key factors in the cell environment [1,2]. Temperature, in particular, plays a crucial role. For embryos, even a slight change of 0.5 °C can have a significant impact on embryonic development [3]. Inappropriate temperatures during oocyte development can directly damage the spindle [4]. Heat stress during the critical stage of early embryo development significantly increases the incidence of early embryonic mortality [5]. Changes in temperature resulting from opening the incubator for a period can delay embryo morphokinetics [6]. Therefore, maintaining temperature stability during embryonic development is essential [7].
The cultivation of embryos is commonly conducted in a closed chamber. In order to ensure consistent embryonic development within the culture area, it is important to maintain both temperature stability and uniformity [8]. While a control device can correct any deviation between the measured temperature and the set point, it cannot address the issue of temperature uniformity within the chamber, which mainly depends on the inherent characteristics of the structure itself. However, to meet specific requirements, such as real-time observation [9], gas supply, and media delivery, the chamber usually needs a complex structural design [10,11,12]. This increases the complexity of the solid, gas, and liquid coupling field [13,14], making it challenging for the chamber to achieve high temperature uniformity. Therefore, enhancing the temperature uniformity within the culture chamber becomes a crucial step in establishing an ideal temperature environment for embryonic development.
Several studies have reported on the improvement of temperature uniformity in various applications. Antti-Juhana et al. [15] used an ITO (Indium Tin Oxide) plate as a heating element, which provided not only electrical conductivity but also optical transparency. This choice improved the local temperature distribution of the observing window, and the cell culture system effectively maintained a temperature of 37 ± 0.3 °C. Chikahiro Imashiro et al. [16] used Peltier to adjust the temperature of small metal culture dishes in a timely manner during cancer cell culture, achieving higher temperature response speed and temperature control accuracy than polymer culture dishes. Kuo-Hung et al. [17] improved the temperature uniformity on the susceptor surface by changing the thermal conductivity material, shape, and structure, achieving a 45% enhancement. Ling et al. [18] applied a gradual thermal conductivity design to the PCR reaction module to increase the temperature uniformity and found that the best temperature uniformity was achieved when the inner and outer layers of the reaction module were made of copper and aluminum alloys, respectively. Yu-Tong et al. [19] investigated the effects of fluid velocity, heating area, and substrate thickness on temperature uniformity, showing potential for optimizing temperature distribution in a flow field environment. Additionally, finite element simulation has proven effective in addressing complex heat transfer problems [20,21]. However, the above methods mainly focus on modifying materials and structure, overlooking the heating approach. In our previous research, metal foil was used to heat both the lid and base of the chamber to enhance temperature uniformity within the internal space. Nevertheless, as the structure becomes more complex, conventional heating element layouts can result in significant temperature gradients, making it imperative to optimize the heating element considering the structural characteristics.
In this study, we propose a quantitative optimization method for the heating element to improve the temperature uniformity within the culture chamber. By adjusting the length or width of the metal foil covered on the surface in different areas, we can modify the heating electric resistance and optimize the distribution of surface heating power. The method can effectively reduce the temperature gradient on the surface of the chamber. Furthermore, a stable and ideal thermal environment within the chamber is realized for embryonic development.

2. Materials and Methods

2.1. Heat Transfer System for Embryo Chamber

To meet the requirements of long-term continuous cultivation and observation of embryos, we have designed a culture chamber that supports temperature regulation, humidity control, gas supply, and microscopic observation. The heat transfer system and internal structure of the culture chamber are illustrated in Figure 1. The size of the culture chamber is 180 × 89 × 36 mm. The embryo chamber consists of a base and a lid, each equipped with windows that facilitate the illumination and observation of the embryos. Both components feature separate heating elements and temperature sensors on their surfaces to regulate temperature. To reduce the heat loss, the top of the lid and the bottom of the base are covered with insulation cotton to reduce external heat dissipation, while both the sides are not. To maintain the gas environment crucial for embryo development, fresh gas is introduced at a slow flow rate of 30 mL/min while ensuring a proper seal of the chamber. There is a humidifier vessel installed in the room, which regulates the environmental humidity by guiding gas into the water and controlling the gas flow rate. The culture dish is positioned in the central area of the chamber, where the embryos are cultured in the micro spaces. Heat transfer within the chamber occurs through three mechanisms [22]: heat conduction through the solid materials of the base and lid, as indicated by the yellow arrows; heat convection between the chamber’s surface and the surrounding gas, as shown by the black arrows; and radiative heat transfer between the chamber’s surface and the dish, represented by the red wavy lines. These three modes of heat transfer are governed by Fourier’s law, Newton’s cooling law, and the Stefan–Boltzmann law, respectively [23]. Notably, the surface heating elements play a crucial role in the overall system, and their geometric layout directly influences the temperature distribution within the chamber.

2.2. Quantitative Optimization of Heating Element

In this study, metal foil was chosen as the heating element. The layout of the metal foil on the outer surface of the chamber is usually determined through practical experience. Once the chamber reaches thermal equilibrium, it attains a specific heating load and dissipation conditions, which often results in a noticeable temperature gradient within the chamber. To tackle this problem, we propose modifying the layout of the metal foil to optimize the distribution of heating power. This optimization is expected to enhance the temperature uniformity of the structure.
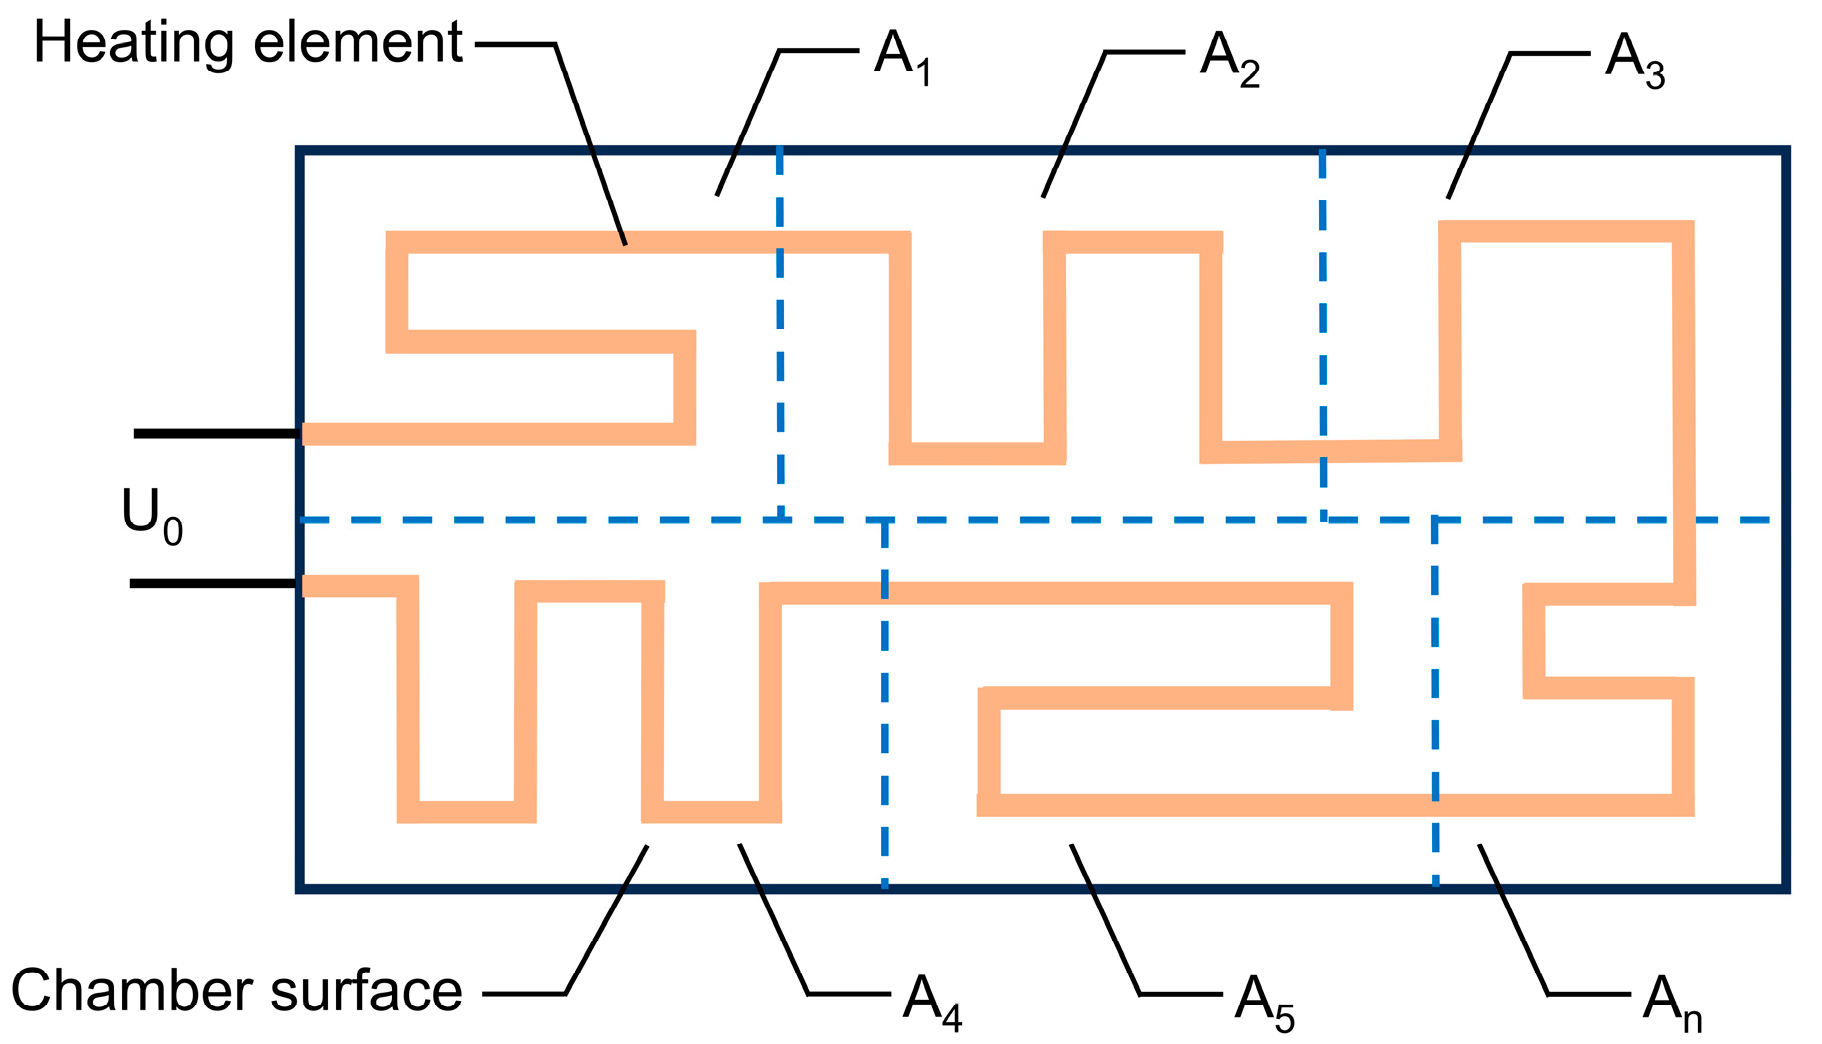
When a system reaches thermal equilibrium, the heated object can be divided into several nearly isothermal regions, as illustrated in Figure 2. It is important to note that at this stage, even a small addition of heating power to a specific area will further increase the temperature within that region. Assuming there is no heat transfer coupling between different regions, after time t, the average volume temperature of the region is described as T(t), and the increased heat Q(t) can be calculated as follows:
Q ( t ) = c m Δ T = c ρ V ( T ( t ) T 0 )
where m is the mass of the region, c is the specific heat capacity of the material, ρ is the density of the material, V is the volume of the region, and T0 is the average volume temperature, which is below the target value under initial equilibrium of the region.
To increase heating power, it is most effective to increase the electric resistance of the metal foil in the region. Modifying the resistance in a local region has a negligible impact on the total resistance and the input power of the metal foil, so it can be disregarded. Therefore, the increase in heating power q1 resulting from the alteration of resistance in the region is calculated as follows:
q 1 = I 2 R = U 0 R a 2 R
where I is the current through the metal foil, R′ is the increase in resistance on the surface of the region, Ra is the total resistance of the metal foil, and U0 is the input effective voltage of the metal foil for generating Joule heat.
The newly added heat dissipation power of the external surface area of the region is described as q2(t), and can be calculated as follows [23]:
q 2 ( t ) = A h ( T ( t ) T 0 )
where A is the external heat dissipation area of the area, and h is the surface convective heat transfer coefficient.
The following equation is obtained based on the energy conservation law:
Q ( t ) = 0 t ( q 1 q 2 ( t ) ) d t
Substitute Q(t), q1 and q2(t) into the above equation:
c ρ V ( T ( t ) T 0 ) = 0 t U 0 R a 2 R A h ( T ( t ) T 0 ) d t
By taking differentiation on both sides of the equal sign in the above equation, the derivative of temperature relative to time can be obtained.
d T d t = U 0 R a 2 R A h ( T ( t ) T 0 ) c ρ V
According to the equation above, when dT/dt = 0, the temperature within the specific region will no longer increase. This indicates the attainment of a new thermal equilibrium.
U 0 R a 2 R = A h ( T ( t n ) T 0 )
where T(tn) is the temperature of the region under new equilibrium. Consequently, the increase in resistance R′ of the region can be solved as follows:
R = A h Δ T R a U 0 2
where Δ T = T ( t n ) T 0 . The equation above indicates that the difference between the target temperature and the average volume temperature under initial equilibrium in the region can be utilized as a correction value for calculating the required increase in resistance.
Furthermore, considering the heat transfer coupling between different regions, the calculation of the actual increase in resistance in the region can be multiplied by an appropriate acceleration factor k.
R = k A h Δ T R a U 0 2
In the manufacturing process of metal foil, the thickness is typically uniform. Therefore, the only methods to increase the electrical resistance are to either extend the length or reduce the cross-sectional width.
The formula for calculating the new heating resistance of the region after modifying is as follows:
R n = R 0 + R = μ l 0 z w 0 + R = μ ( l 0 + l ) z ( w 0 w )
where R0 is the initial resistance value of the area, μ is the resistivity of the heating material, and l0 and w0 are the initial length and width of the metal foil, respectively. l′ is the increase in length of the metal foil, w′ is the decrease in width of the metal foil, and z is the cross-sectional height of the metal foil.
The values of l′ and w′ can be adjusted to achieve the desired resistance, with typically only one parameter needing modification. If only the length of the metal foil is modified, the l′ is as follows:
l = z w 0 R μ
If only the width is modified, the w′ is as follows:
w = z w 0 2 μ l 0 + z w 0 R R
Given a known input effective voltage U0 and the total resistance of the metal foil Ra, the structure will ultimately reach heat transfer equilibrium and can be divided into n regions based on the temperature distribution. Within each region, the heat dissipation area Ai, surface convective heat transfer coefficient hi, temperature correction value Δ T i , and the geometric parameters of the heating element l0i and w0i can be determined. This information constitutes the parameter matrix of the initial equilibrium state of the structure.
M = A 1 A 2 A n h 1 h 2 h n Δ T 1 Δ T 2 Δ T n l 01 l 01 l 0 n w 01 w 02 w 0 n
The total resistance Ra is the linear superposition of the resistance in different regions.
R a = i = 1 n μ l 0 i z w 0 i

2.3. Temperature Simulation of Chamber Surface

Based on the methodology described above, the dimensions of the metal foil can be adjusted to optimize the distribution of temperature on the heated surface. The temperature field post-optimization can be assessed using simulation results. Accurate simulation models and parameters are crucial for obtaining outcomes that closely mirror real-world conditions. Initially, the metal foil is placed approximately evenly on the outer surface of the lid and base based on the available heating area. For this study, COMSOL Multiphysics 6.2 is employed as the simulation software, which incorporates solid heat transfer [24,25] and current distribution in multi-layer shells [26]. To simplify the computational complexity, the metal foil in the model is defined as a multi-layer shell with a specific thickness.
The temperature simulation of the chamber surface involves multiple parameters, including the material of the chamber components (which determines the thermal conductivity), the resistivity and geometric parameters of the metal foil, ambient temperature, surface emissivity, and the gas flow rate. Once the system design is finalized, these parameters become inherent to the system and will be determined accordingly.
The surface convective heat transfer coefficient of the chamber is a key parameter that can be calculated as follows [23]:
h = N u k L
where Nu is the Nusselt number, k is thermal conductivity of air, and L is the characteristic length. Table 1 presents the parameters used for the temperature simulation of the lid and the base.

2.4. Temperature Simulation of Assembled Chamber

The complete temperature field simulation of the assembled chamber is conducted by the fluid–solid coupling model [27]. The assembly of the chamber consists of the lid and base, air layers, sealing rings, metal foils, and glasses. The simulation process involves solid and fluid heat transfer, current in multi-layer shells, and laminar flow modules in COMSOL Multiphysics. The simulation parameters are shown in Table 1.
To simulate the culture situation, a culture dish with water was placed inside the chamber as the embryo culture medium. The simulation parameters remained unchanged from before. By obtaining the temperature distribution within the water, it can be determined whether the temperature of the medium falls within a reasonable range, which directly affects embryo culture.

2.5. Temperature Experiment on the Fabricated Chamber

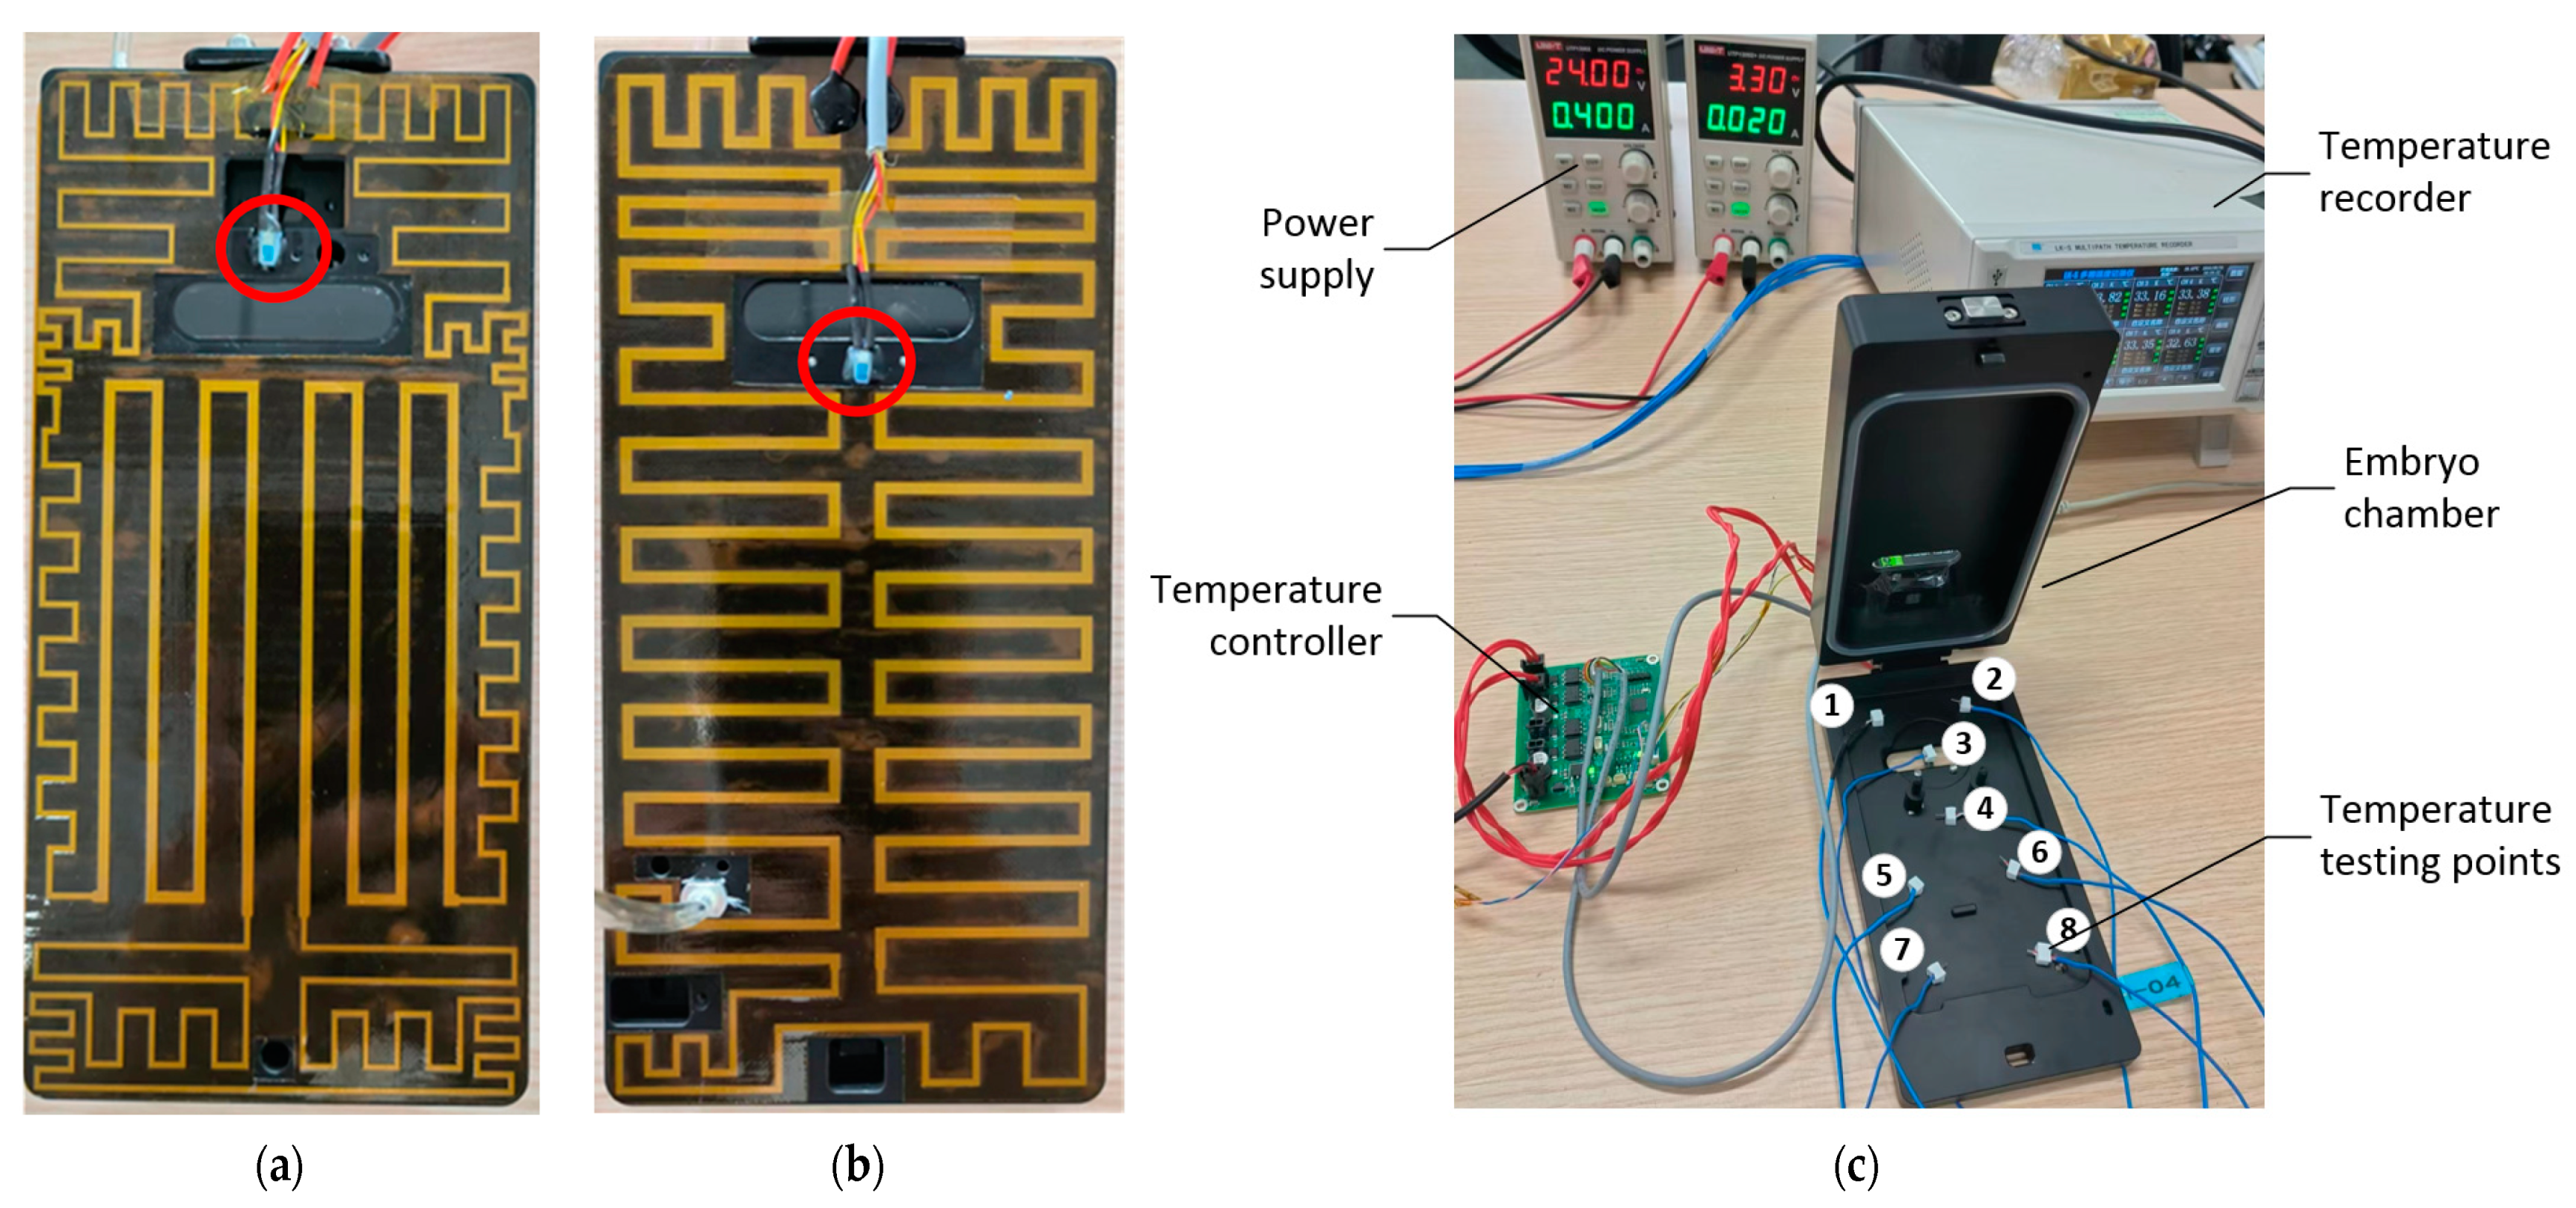
The heating elements are fabricated and covered on the surface of the chamber using polyimide film with 3 M adhesive, following the optimized layout. For high-precision temperature detection, PT1000 temperature sensors are positioned on the two surfaces and serve as the temperature feedback parts for a dual-channel temperature controller. The lid and base temperatures are controlled individually. To monitor temperature fluctuations within the chamber, a temperature recorder with a resolution of 0.01 °C was used. Prior to testing, the instrument was calibrated with a detection accuracy within ±0.1 °C. Assuming that the measurement results follow a normal distribution with a confidence level of 99%, the standard uncertainty of the measurement is 0.04 °C. The distribution of the heating element and experimental system with the testing points can be seen in Figure 3.
To simulate practical application scenarios, a gas supply of 30 mL/min is maintained in the chamber during temperature testing. The ambient temperature is 24 °C, while the target temperature is set at 37 °C. The temperature of the medium that the embryos come into direct contact with during embryo development is crucial. In addition to eight testing points in the inner space, four random testing points are positioned in the culture dish.

3. Results

3.1. Optimization of Temperature Uniformity on the Chamber Surface

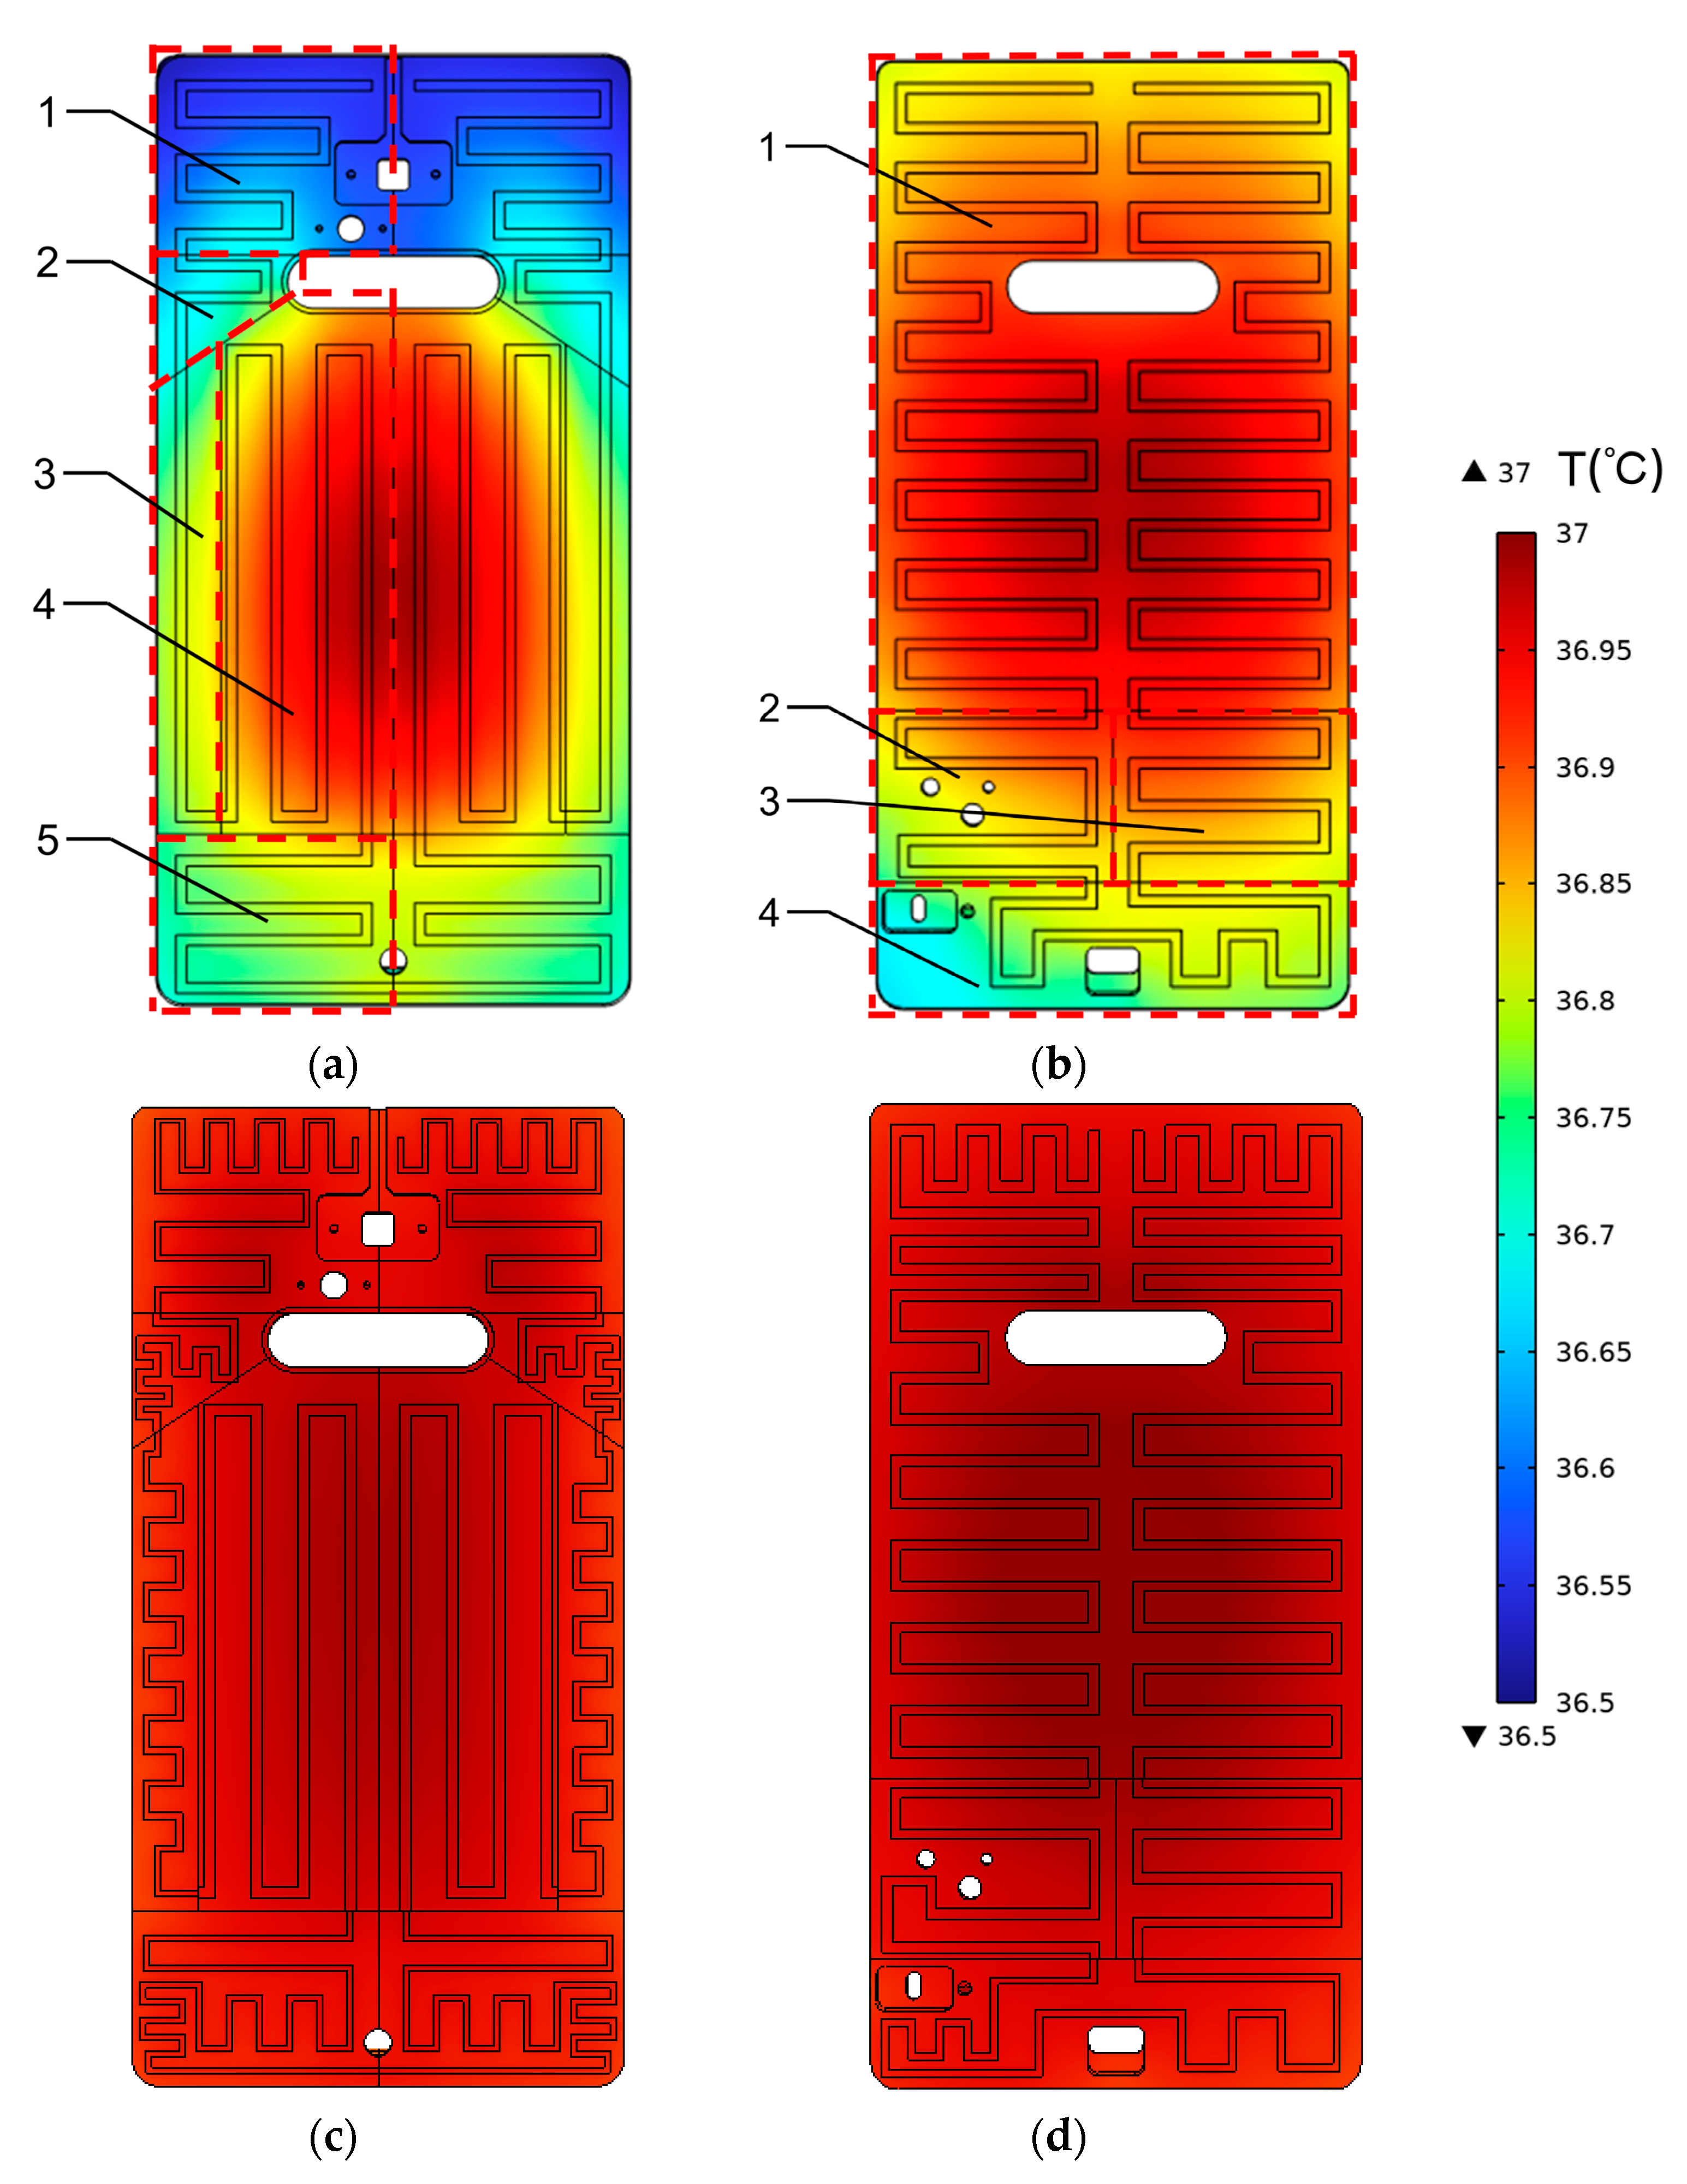
By adjusting the input effective voltage, the maximum temperature on the chamber surface can be limited to 37 °C. The lid and base are divided into 10 and 8 individual regions, respectively, based on the temperature distribution obtained from heat transfer simulation. Each region has a temperature gradient of no more than 0.2 °C, as shown in Figure 4a,b.
The lid structure is symmetrical, and the regions on one side are numbered for simplicity in calculation. As the temperature in the fourth region is already close to the target temperature, no further optimization is performed on it. After the first iteration calculation, the parameter matrix M is obtained.
After a single iteration, the changes in electric resistance and temperature are slight. We then decided to modify the width or length of the metal foil to increase the electric resistance in regions where the temperature is below 37 °C. The optimized parameters during the first iteration are listed in Table 2, where hi denotes the equivalent convective heat transfer coefficient for the i-th region surface, which physically represents an area-weighted average of convective heat transfer coefficients from constituent sub-surfaces. The lid underwent multiple iterations using this method, and the modified values for each iteration are listed in Table 3.
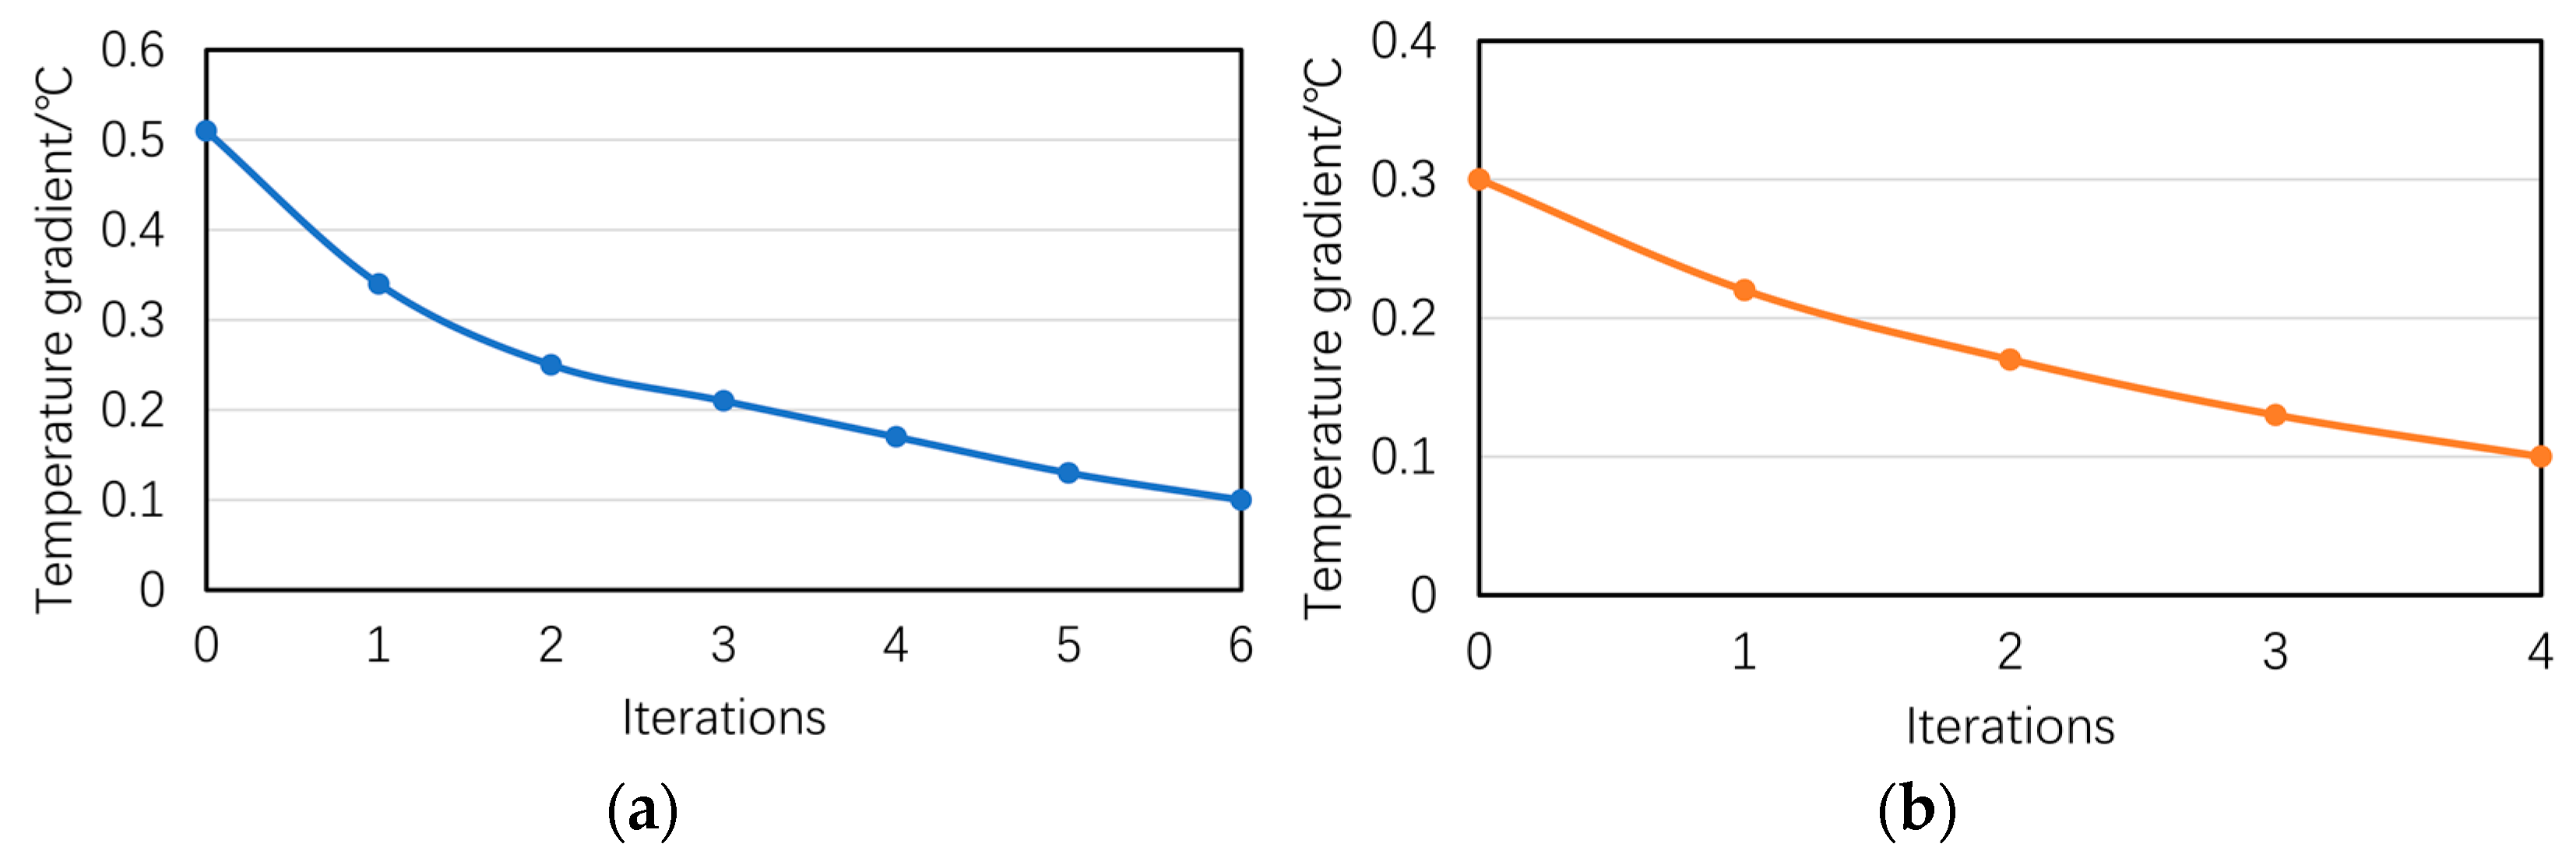
The temperature distribution of the lid after six iterations is shown in Figure 4c. The maximum temperature gradient within the lid is 0.1 °C, falling within an acceptable range. Similar to the lid, the temperature distribution of the base under the initial layout of metal foil is shown in Figure 4b, with the surface divided into four regions. The modified values for each iteration are listed in Table 4. The temperature distribution of the base after four iterations is shown in Figure 4d. The maximum temperature gradient within the base is 0.1 °C, which also falls within an acceptable range. Figure 5 illustrates a gradual decrease in the temperature gradient with each iteration. The results of both the lid and base demonstrate the effectiveness of the optimization method in significantly reducing the temperature gradient on the surface.

3.2. Temperature Field of Assembled Chamber

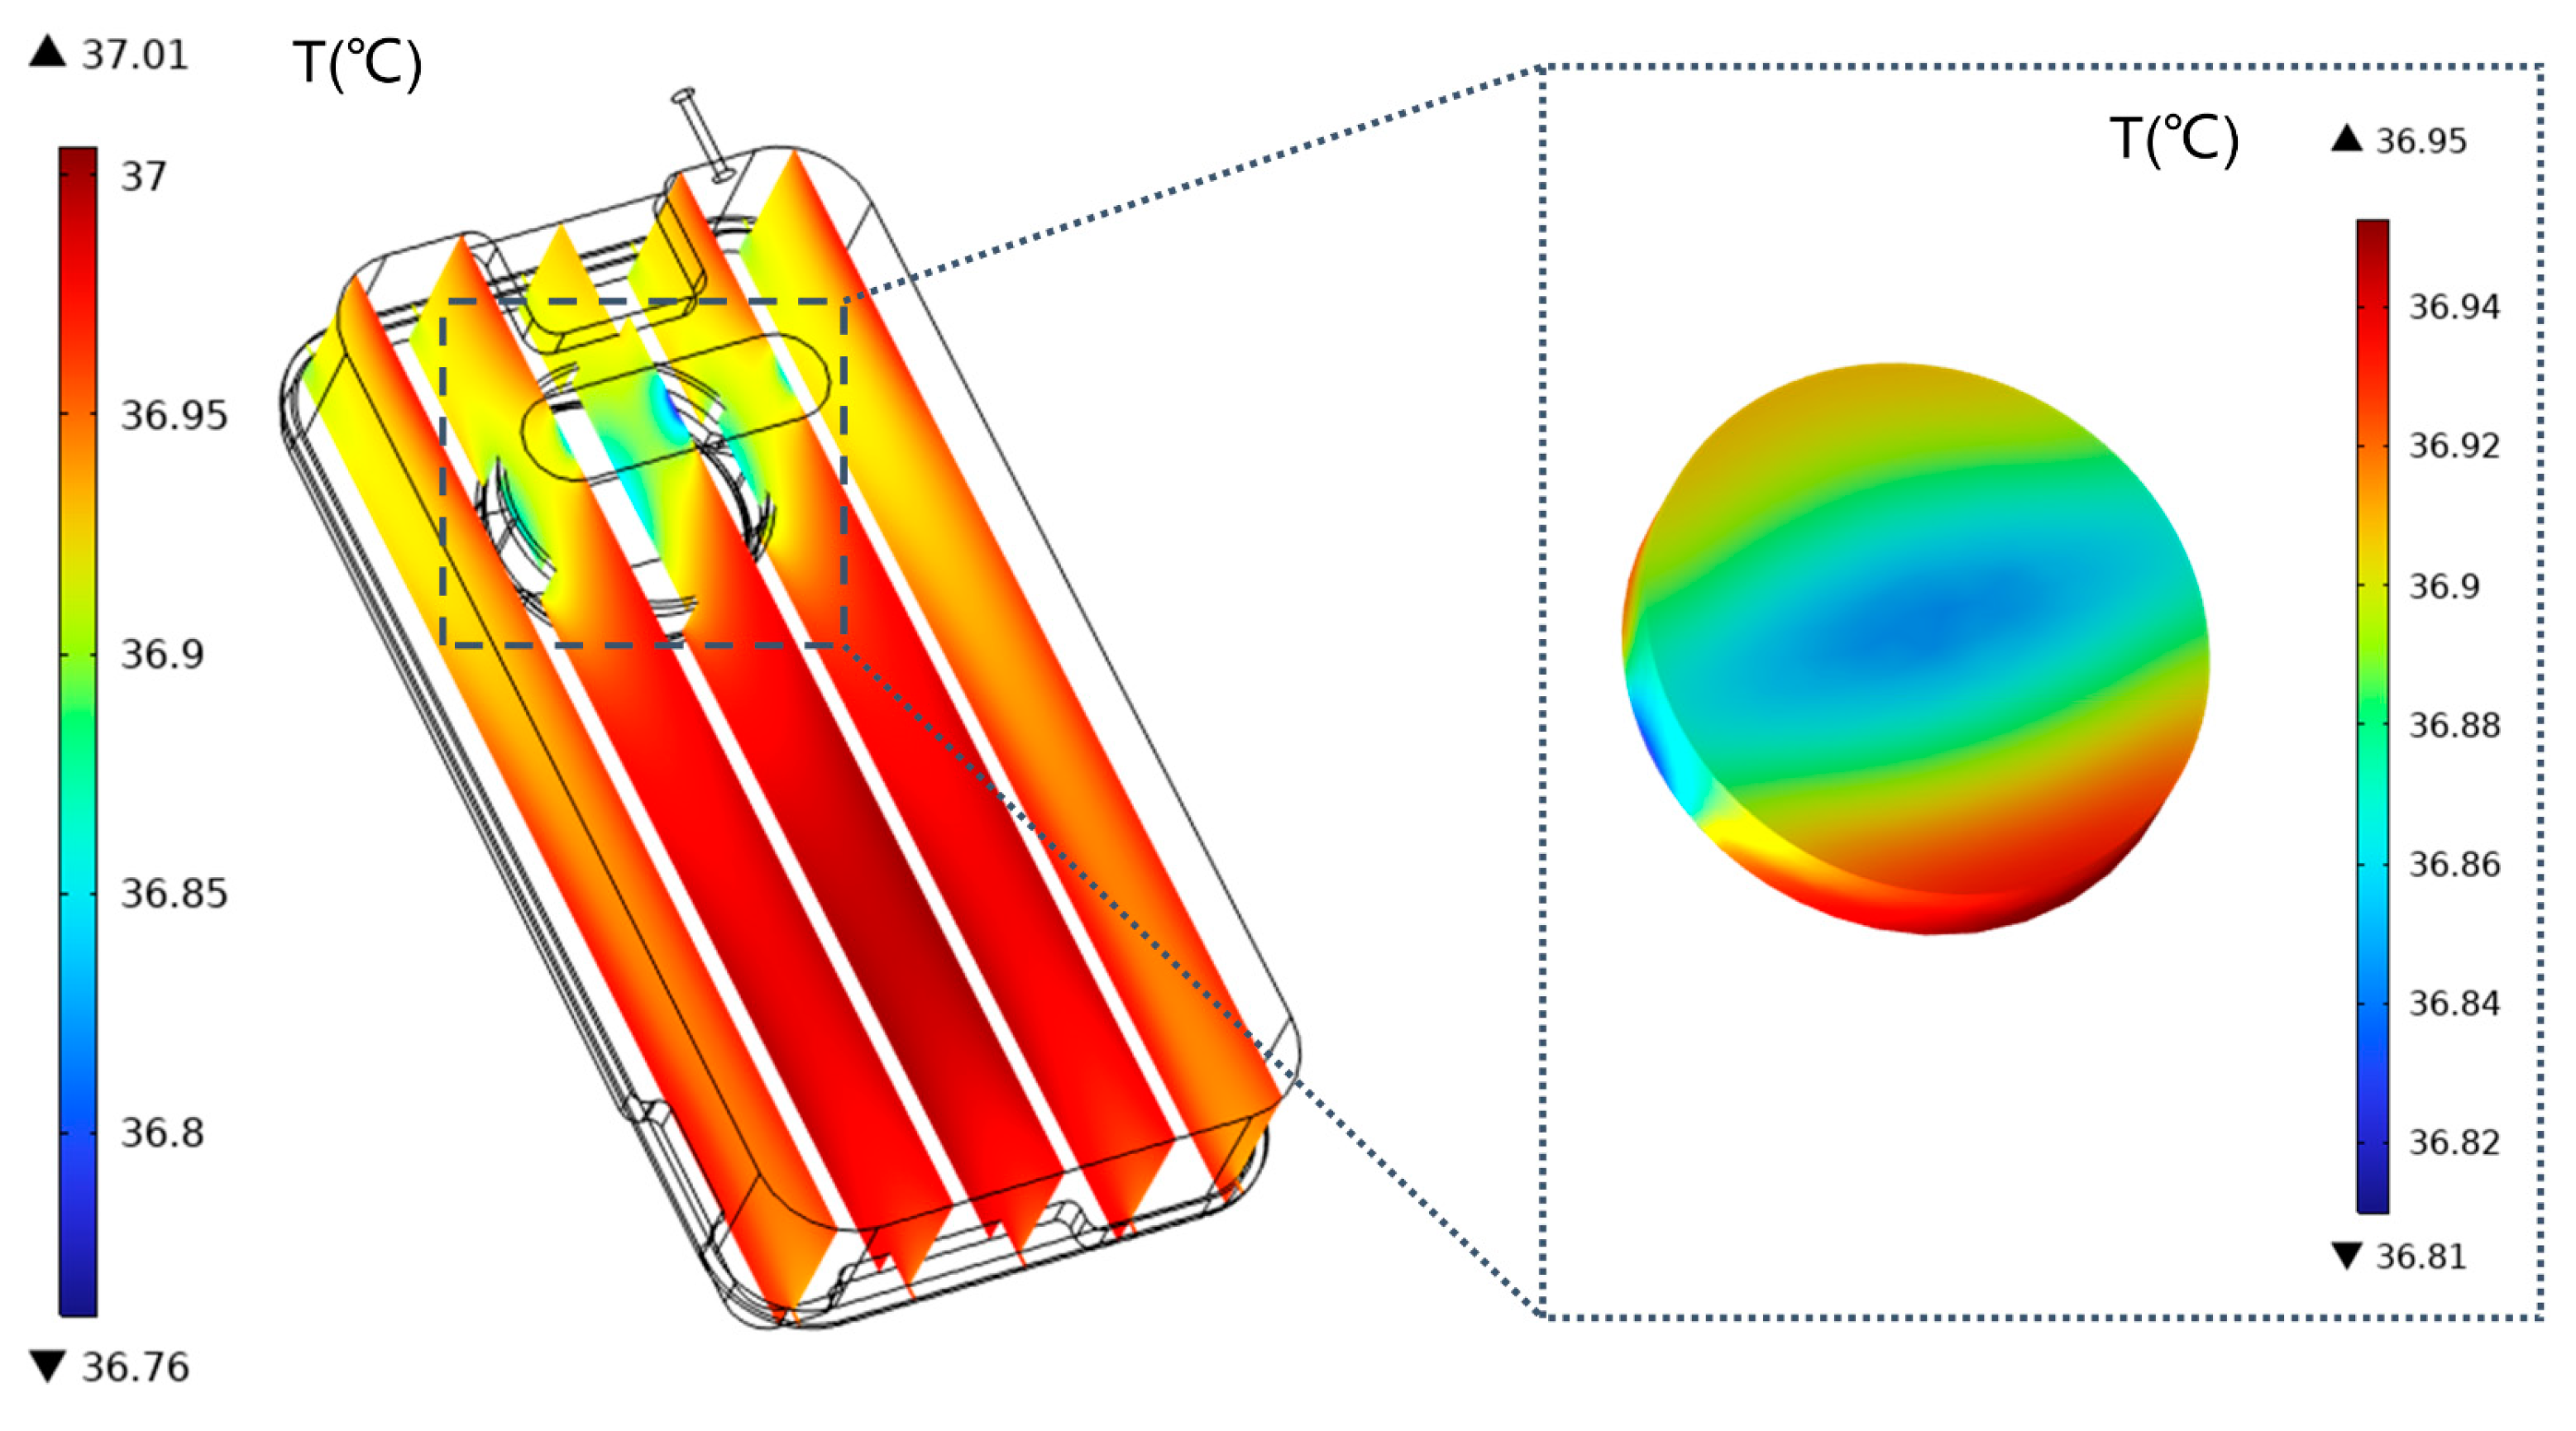
The results from the simulation of the assembled chamber using the optimized heating element are presented in Figure 6. The surface of the chamber exhibits maximum temperature gradients of 0.11 °C and 0.14 °C, respectively. Comparing the assembly simulation with individual simulations of the lid and the base, it is found that the maximum temperature gradient is close, indicating that optimizing the temperature distribution individually for the lid and base is a viable approach. Within the chamber, under a cold gas flow rate of 30 mL/min, the lowest temperature point is located where the gas enters, as shown in Figure 7. Furthermore, the maximum temperature gradient inside the water is 0.14 °C, and the lowest temperature point is above the observation window. The maximum temperature gradient between the water and the optimal temperature of 37 °C is 0.19 °C, which falls within an acceptable range. These findings indicate that the optimization method employed in this study can effectively establish a precise and suitable temperature environment for embryo culture.

3.3. Temperature Distribution Within the Fabricated Chamber

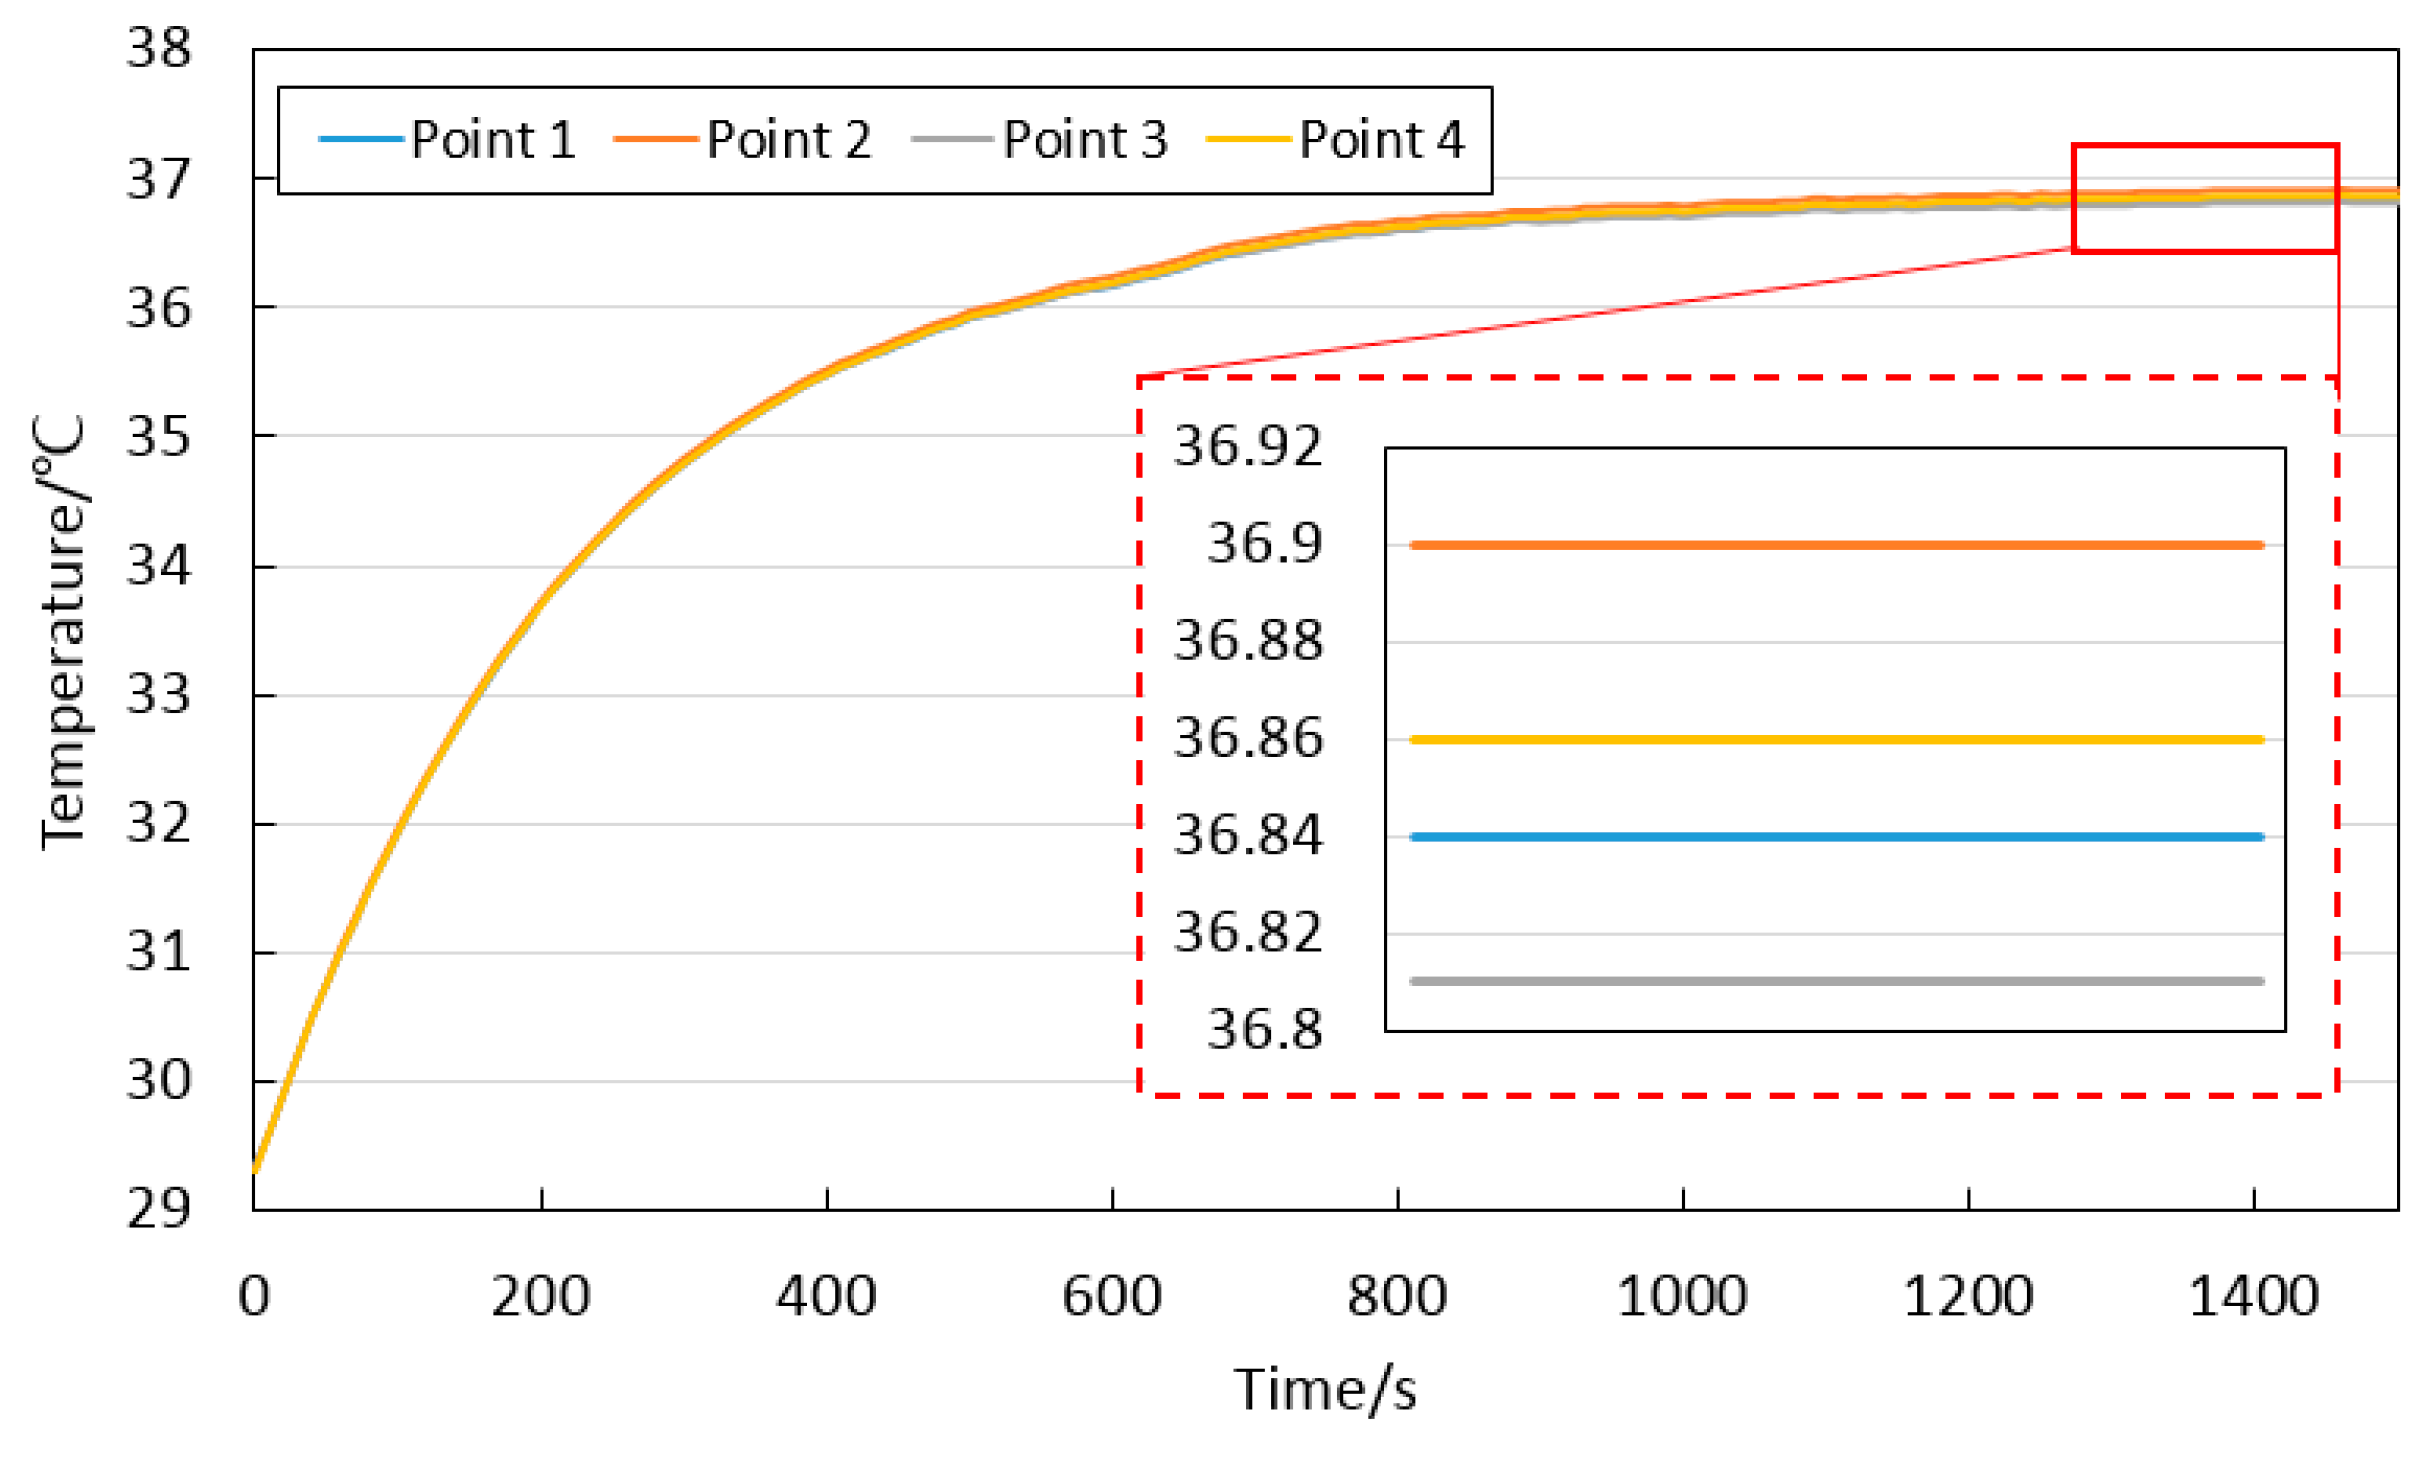
The temperature variation of the eight testing points is depicted in Figure 8, showing the actual temperature distribution within the chamber. Once the lid is closed, the temperature uniformly increases at each point until it stabilizes. The point above the observation window exhibits the lowest temperature, with a temperature gradient of 0.3 °C compared to the highest point in the stable state. Except for point 3 above the observation window, the maximum temperature gradient is less than 0.2 °C. These experimental results are consistent with the simulation results, validating the simulation’s effectiveness. In Figure 9, the internal temperature of the water in the culture dish is displayed throughout the experiment. The maximum water temperature remains constant at 36.9 °C, with a temperature gradient of 0.1 °C.

4. Discussion

In order to enhance the temperature uniformity within the chamber and establish an optimal culture environment for embryos, we propose a quantitative optimized method for the heating element. In practical operation, we first optimize the heating element of the individual lid and base to achieve uniform surface temperatures and then assess the temperature field after assembly. The simulation results indicate that, with accurate simulation models and parameters, when in a state of heat transfer equilibrium, the temperature distribution on the surface of the enclosed chamber assembly closely resembles the results obtained through individual simulations of the lid and base (Figure 4 and Figure 6). This implies that a lower surface temperature gradient in closed cavity structures can promote temperature uniformity within the cavity. Therefore, the optimization process primarily focuses on the heat transfer calculation of the surface structure, greatly reducing the computational workload of the fluid structure coupling model and shortening the optimization cycle.
The design of cell incubators and other enclosed structures often considers diverse requirements, resulting in complex configurations characterized by curved surfaces, varying thicknesses, and material differences. Unlike other methods, this study emphasizes the heating element and optimizes its size and arrangement. The approach employs quantitative optimization techniques to globally enhance the temperature field, moving away from the traditional trial-and-error method of adjusting electric resistance based on empirical design. Specifically, the heating element utilizes metal foil, allowing for adjustments in both length and width, as well as its placement on a curved surface. To elevate the overall temperature of the area, the width of the metal foil can be adjusted. Conversely, to increase the local temperature within the area, the local length of the metal foil should be extended. The dimensions of width and length can be calculated using the formula proposed in this study, facilitating the convergence of the final temperature gradient. Furthermore, while previous research has primarily focused on minimizing surface temperature gradients, less attention has been directed towards the enclosed space. To address this gap, we implement a ‘sandwich’ heating approach that ensures both the surface and internal spaces achieve a highly consistent temperature. Consequently, this method offers enhanced versatility, particularly in dealing with complex structures such as small closed incubators. It can replace the uniform heating methods of water jackets or air jackets, resulting in a more compact and lightweight heating system. This provides a rapid and efficient solution for devices requiring high temperature stability and uniformity, thus eliminating the need for complex and time-consuming structural optimization and verification.
When optimizing the heating element of the lid and base, we observed that the temperature gradient did not decrease significantly after a single iteration. This can be attributed to the presence of heat transfer coupling between different calculation regions. The method we propose is based on the assumption that each region is independent, and the relationship between the parameter correction of the heating element and the corresponding temperature change is derived. However, in reality, there is heat transfer coupling between different regions. To address this issue, we handle it in two aspects. Firstly, during the initial division of the calculation area, we strive to minimize the temperature gradient within each area, ensuring a relatively stable temperature increase in each area after each iteration. Secondly, we have appropriately increased the iteration acceleration factor (Table 3 and Table 4). Based on thorough simulation and calculation results, it is recommended to select an acceleration factor between 5 and 10. Choosing a low acceleration factor will lead to minimal acceleration effect, whereas opting for a high coefficient will cause the temperature in the low temperature region to increase rapidly, turning it into a high-temperature area and ultimately elevating the overall temperature gradient. Despite the presence of heat transfer coupling, convergence is eventually achieved because the heating power generated by the increased electric resistance in each region has a greater impact on itself than on adjacent regions. By introducing the appropriate acceleration factor, we can effectively enhance the optimization efficiency. For the heat transfer coupling problem across various regions, investigating decoupling strategies may potentially decrease the number of iterations required and further improve optimization efficiency.
The focus of this study is the heat transfer system of the embryo culture chamber. Although a uniform temperature field is achieved through the optimization of heating elements, variations in external boundary conditions can affect the results to some extent. During the culture tests, it was determined that the optimal gas flow rate for culture is 30 mL/min. The experimental results indicate that while the flow rate does not significantly influence the internal temperature field, it does reduce the temperature in the gas entry area to some extent (Figure 7). Further investigations could enhance temperature uniformity by preheating the gas or adjusting the gas flow path. Furthermore, the simulations in this study were conducted under conditions of natural gas convection disturbance at an ambient temperature of 25 °C. The actual temperature field distribution may be influenced by significant changes in ambient temperature or external airflow disturbances, which should be minimized in the laboratory setting. Due to the necessity of observation, the heating element cannot be applied to the glass surface, resulting in a considerable temperature difference in local areas. To further improve the local temperature gradient at the window, the glass area could be minimized to include only the essential observation region; however, the optimal solution would be to utilize transparent materials with high thermal conductivity. Transparent materials with high thermal conductivity include transparent AlN ceramics and sapphire (single-crystal α-Al2O3). Additionally, laminating graphene or indium tin oxide (ITO) [28] on the surface or incorporating carbon black [29] within transparent polymer materials can enhance the thermal conductivity of these transparent materials.
CO2 incubators are the most widely used equipment for embryo culture applications [30]. As a universal and standardized piece of equipment, the CO2 incubator offers a spacious interior; however, it suffers from uneven temperature distribution. To ensure temperature consistency, embryologists often position embryos in specific areas that have been calibrated for temperature when using this equipment, which significantly underutilizes the available space. Additionally, CO2 incubators are limited to basic cultivation functions and do not support real-time observation of embryos. Consequently, in the field of embryo research, small-capacity customized chambers are becoming increasingly preferred. These specialized chambers not only facilitate in situ observation but also allow for online fluid exchange and detection. Our technology is designed to provide superior temperature stability for enclosed small-capacity spaces, tailored to the structure of various chambers. However, the superiority of this approach is somewhat constrained when the cultivation space is excessively large or when the heating area is limited, such as in the case of observation windows.

5. Conclusions

In this study, we propose a novel method to improve the temperature uniformity of embryo chambers by quantitatively optimizing the layout of the heating element. We have derived the relationship between modifying the electric resistance of a single region and the resulting temperature change. We utilize metal foil to heat the outer surface of the chamber and enable a flexible selection of length and width to change the heating element. The temperature field within the chamber is improved by optimization of the surface temperature distribution. We conducted fluid-structure coupling heat transfer simulations and temperature experiments on the chamber with an optimized heating element, showing a maximum temperature gradient below 0.2 °C within the chamber, which confirms the effectiveness of our method.
The method exhibits superior universality and can be applied to various objects heated by surface heating elements, particularly complex structures with an enclosed cavity. This provides a fast and efficient solution for devices that require high temperature stability and uniformity, eliminating the need for complex and time-consuming optimization and verification of the structure.

Author Contributions

Conceptualization, Y.S. and W.Z.; methodology, W.Z.; validation, Y.S. and W.Z.; formal analysis, Y.S.; investigation, Y.S.; resources, W.Z.; data curation, Z.Z.; writing—original draft preparation, Y.S.; writing—review and editing, W.Z.; visualization, D.X.; supervision, H.S.; project administration, H.S.; funding acquisition, H.S. All authors have read and agreed to the published version of the manuscript.

Funding

This research was funded by the Strategic Priority Research Program of the Chinese Academy of Science, grant number XDB0990000, and the National Key R&D Program of China, grant numbers 2023YFC2415000, 2022YFA1104800.

Data Availability Statement

The data presented in this study are available on request from the corresponding author due to the simulation file occupying a large amount of space.

Conflicts of Interest

The authors declare that there are no conflicts of interest.

Abbreviations

The following abbreviations are used in this manuscript:
ARTAssisted reproductive technology

References

  1. Brown, J.D.; Dillon, H.E.; Kaweesa, D.V.; Harada, A.M. The impact of transient heat transfer on tissue culture cell distribution. Biosyst. Eng. 2017, 163, 28–36. [Google Scholar] [CrossRef]
  2. Phelan, K.; May, K.M. Basic techniques in mammalian cell tissue culture. Curr. Protoc. Cell Biol. 2015, 66, 1.1.1–1.1.22. [Google Scholar]
  3. Walters, E.A.; Brown, J.L.; Krisher, R.; Voelkel, S.; Swain, J.E. Impact of a controlled culture temperature gradient on mouse embryo development and morphokinetics. Reprod. BioMed. Online 2020, 40, 494–499. [Google Scholar]
  4. Almeida, P.A.; Bolton, V.N. The effect of temperature fluctuations on the cytoskeletal organisation and chromosomal constitution of the human oocyte. Zygote 1995, 3, 357–365. [Google Scholar]
  5. Sugiyama, S.; Mcgowan, M.; Kafi, M.; Phillips, N.; Young, M. Effects of increased ambient temperature on the development of in vitro derived bovine zygotes. Theriogenology 2003, 60, 1039–1047. [Google Scholar]
  6. Nguyen, Q.; Sommer, S.; Greene, B.; Wrenzycki, C.; Wagner, U.; Ziller, V. Effects of opening the incubator on morphokinetics in mouse embryos. Eur. J. Obstet. Gynecol. Reprod. Biol. 2018, 229, 64–69. [Google Scholar] [PubMed]
  7. Swain, J.E. Optimal human embryo culture. Semin. Reprod. Med. 2015, 33, 103–117. [Google Scholar]
  8. Anifandis, G. Temperature variations inside commercial IVF incubators. J. Assist. Reprod. Genet. 2013, 30, 1587–1588. [Google Scholar] [CrossRef]
  9. Braga, P.C. A variable-thickness, multipurpose culture chamber for high-magnification observation. J. Microsc. 1990, 159, 285–288. [Google Scholar]
  10. Imashiro, C.; Jin, Y.; Hayama, M.; Yamada, T.G.; Funahashi, A.; Sakaguchi, K.; Umezu, S.; Komotori, J. Titanium Culture Vessel Presenting Temperature Gradation for the Thermotolerance Estimation of Cells. Cyborg Bionic Syst. 2023, 4, 0049. [Google Scholar] [CrossRef]
  11. Soreide, E.; Denbeigh, J.M.; Lewallen, E.A.; Thaler, R.; Samsonraj, R.M.; Jones, D.L.; Xu, W.; Larson, D.; Nordsletten, L.; Kakar, S.; et al. A multi-chamber tissue culture device for load-dependent parallel evaluation of tendon explants. BMC Musculoskelet. Disord. 2019, 20, 549. [Google Scholar] [CrossRef] [PubMed]
  12. Saalfrank, D.; Konduri, A.K.; Latifi, S.; Habibey, R.; Golabchi, A.; Martiniuc, A.V.; Knoll, A.; Ingebrandt, S.; Blau, A. Incubator-independent cell-culture perfusion platform for continuous long-term microelectrode array electrophysiology and time-lapse imaging. R. Soc. Open Sci. 2015, 2, 150031. [Google Scholar] [CrossRef] [PubMed]
  13. Hu, J.M.; Jin, J.S.; Yan, Z.T. Fluid-solid coupling numerical simulation of charge process in variable-mass thermodynamic system. J. Cent. South Univ. 2012, 19, 1063–1072. [Google Scholar] [CrossRef]
  14. Morville, S.; Carin, M.; Peyre, P.; Gharbi, M.; Carron, D.; Le Masson, P.; Fabbro, R. 2D longitudinal modeling of heat transfer and fluid flow during multilayered direct laser metal deposition process. J. Laser Appl. 2012, 24, 032008. [Google Scholar] [CrossRef]
  15. Mäki, A.J.; Verho, J.; Kreutzer, J.; Ryynänen, T.; Rajan, D.; Pekkanen-Mattila, M.; Ahola, A.; Hyttinen, J.; Aalto-Setälä, K.; Lekkala, J.; et al. A portable microscale cell culture system with indirect temperature control. SLAS Technol. Transl. Life Sci. Innov. 2018, 23, 566–579. [Google Scholar] [CrossRef]
  16. Imashiro, C.; Takeshita, H.; Morikura, T.; Miyata, S.; Takemura, K.; Komotori, J. Development of accurate temperature regulation culture system with metallic culture vessel demonstrates different thermal cytotoxicity in cancer and normal cells. Sci. Rep. 2021, 11, 21466. [Google Scholar] [CrossRef] [PubMed]
  17. Ho, K.H.; Hu, C.K.; Li, T.T. Numerical analysis for thermal field of susceptor in MOCVD reactor. In Proceedings of the 2015 China Semiconductor Technology International Conference, Shanghai, China, 15–16 March 2015; IEEE: Piscataway, NJ, USA, 2015; pp. 1–3. [Google Scholar]
  18. Ling, W.; Zhou, W.; Cui, J.; Shen, Z.; Wei, Q.; Chu, X. Experimental study on the heating/cooling and temperature uniformity performance of the microchannel temperature control device for nucleic acid PCR amplification reaction of COVID-19. Appl. Therm. Eng. 2023, 226, 120342. [Google Scholar] [CrossRef]
  19. Mu, Y.T.; Chen, L.; He, Y.L.; Tao, W.Q. Numerical study on temperature uniformity in a novel mini-channel heat sink with different flow field configurations. Int. J. Heat Mass Transf. 2015, 85, 147–157. [Google Scholar] [CrossRef]
  20. Bergheau, J.M.; Fortunier, R. Finite Element Simulation of Heat Transfer; John Wiley & Sons: Hoboken, NJ, USA, 2013. [Google Scholar]
  21. Blomfield, S.; Redding, G.P.; Bronlund, J.E.; Stewart, B.; Peek, J. A Model for Characterisation of the Thermal Environment of Embryos in a Petri Dish During In Vitro Culture. Cell. Mol. Bioeng. 2016, 9, 546–555. [Google Scholar] [CrossRef]
  22. Benyahia, N.; Aksouh, M.; Mataoui, A.; Oztop, H.F. Coupling turbulent natural convection-radiation-conduction in differentially heated cavity with high aspect ratio. Int. J. Therm. Sci. 2020, 158, 106518. [Google Scholar] [CrossRef]
  23. Incropera, F.P. Fundamentals of Heat and Mass Transfer; Wiley: Hoboken, NJ, USA, 2018. [Google Scholar]
  24. Allué Hoyos, C. Applicability of COMSOL Multiphysics to Combined Heat, Air and Moisture Transfer Modelling in Building Envelopes. Master’s Thesis, Tampere University of Technology, Tampere, Finland, 2014. [Google Scholar]
  25. Salvi, D.; Boldor, D.; Aita, G.M.; Sabliov, C.M. COMSOL Multiphysics model for continuous flow microwave heating of liquids. J. Food Eng. 2011, 104, 422–429. [Google Scholar] [CrossRef]
  26. Li, P.; Hebibul, R.; Zhao, L.; Li, Z.; Zhao, Y.; Jiang, Z. Vibration and large deformation simulation analysis of graphene membrane for nanomechanical applications. In Proceedings of the 2016 IEEE 11th Annual International Conference on Nano/Micro Engineered and Molecular Systems (NEMS), Sendai, Japan, 17–20 April 2016; IEEE: Piscataway, NJ, USA, 2016; pp. 209–212. [Google Scholar]
  27. Wang, C.; Pei, Y.; Mu, Z.; Fan, L.; Kong, J.; Tian, G.; Miao, S.; Meng, X.; Qiu, H. Simulation Analysis of 3-D Airflow and Temperature Uniformity of Paddy in a Laboratory Drying Oven. Foods 2024, 13, 3466. [Google Scholar] [CrossRef] [PubMed]
  28. Liu, J.; Yi, Y.; Zhou, Y.; Cai, H. Highly stretchable and flexible graphene/ito hybrid transparent electrode. Nanoscale Res. Lett. 2016, 11, 108. [Google Scholar] [CrossRef] [PubMed]
  29. Lee, S.M.; Jung, J.W.; Kim, Y.J. Design and evaluation of thermally conductive sheet structure to enhance the thermal stability of transparent oled displays. J. Opt. Soc. Am. B Opt. Phys. 2022, 39, 3216–3222. [Google Scholar]
  30. Lee, M.; Grazi, R.; Seifer, D. Incorporation of the Cook K-Minc incubator and media system into the IVF lab: The future of IVF. J. Clin. Embryol. 2010, 13, 21–32. [Google Scholar]
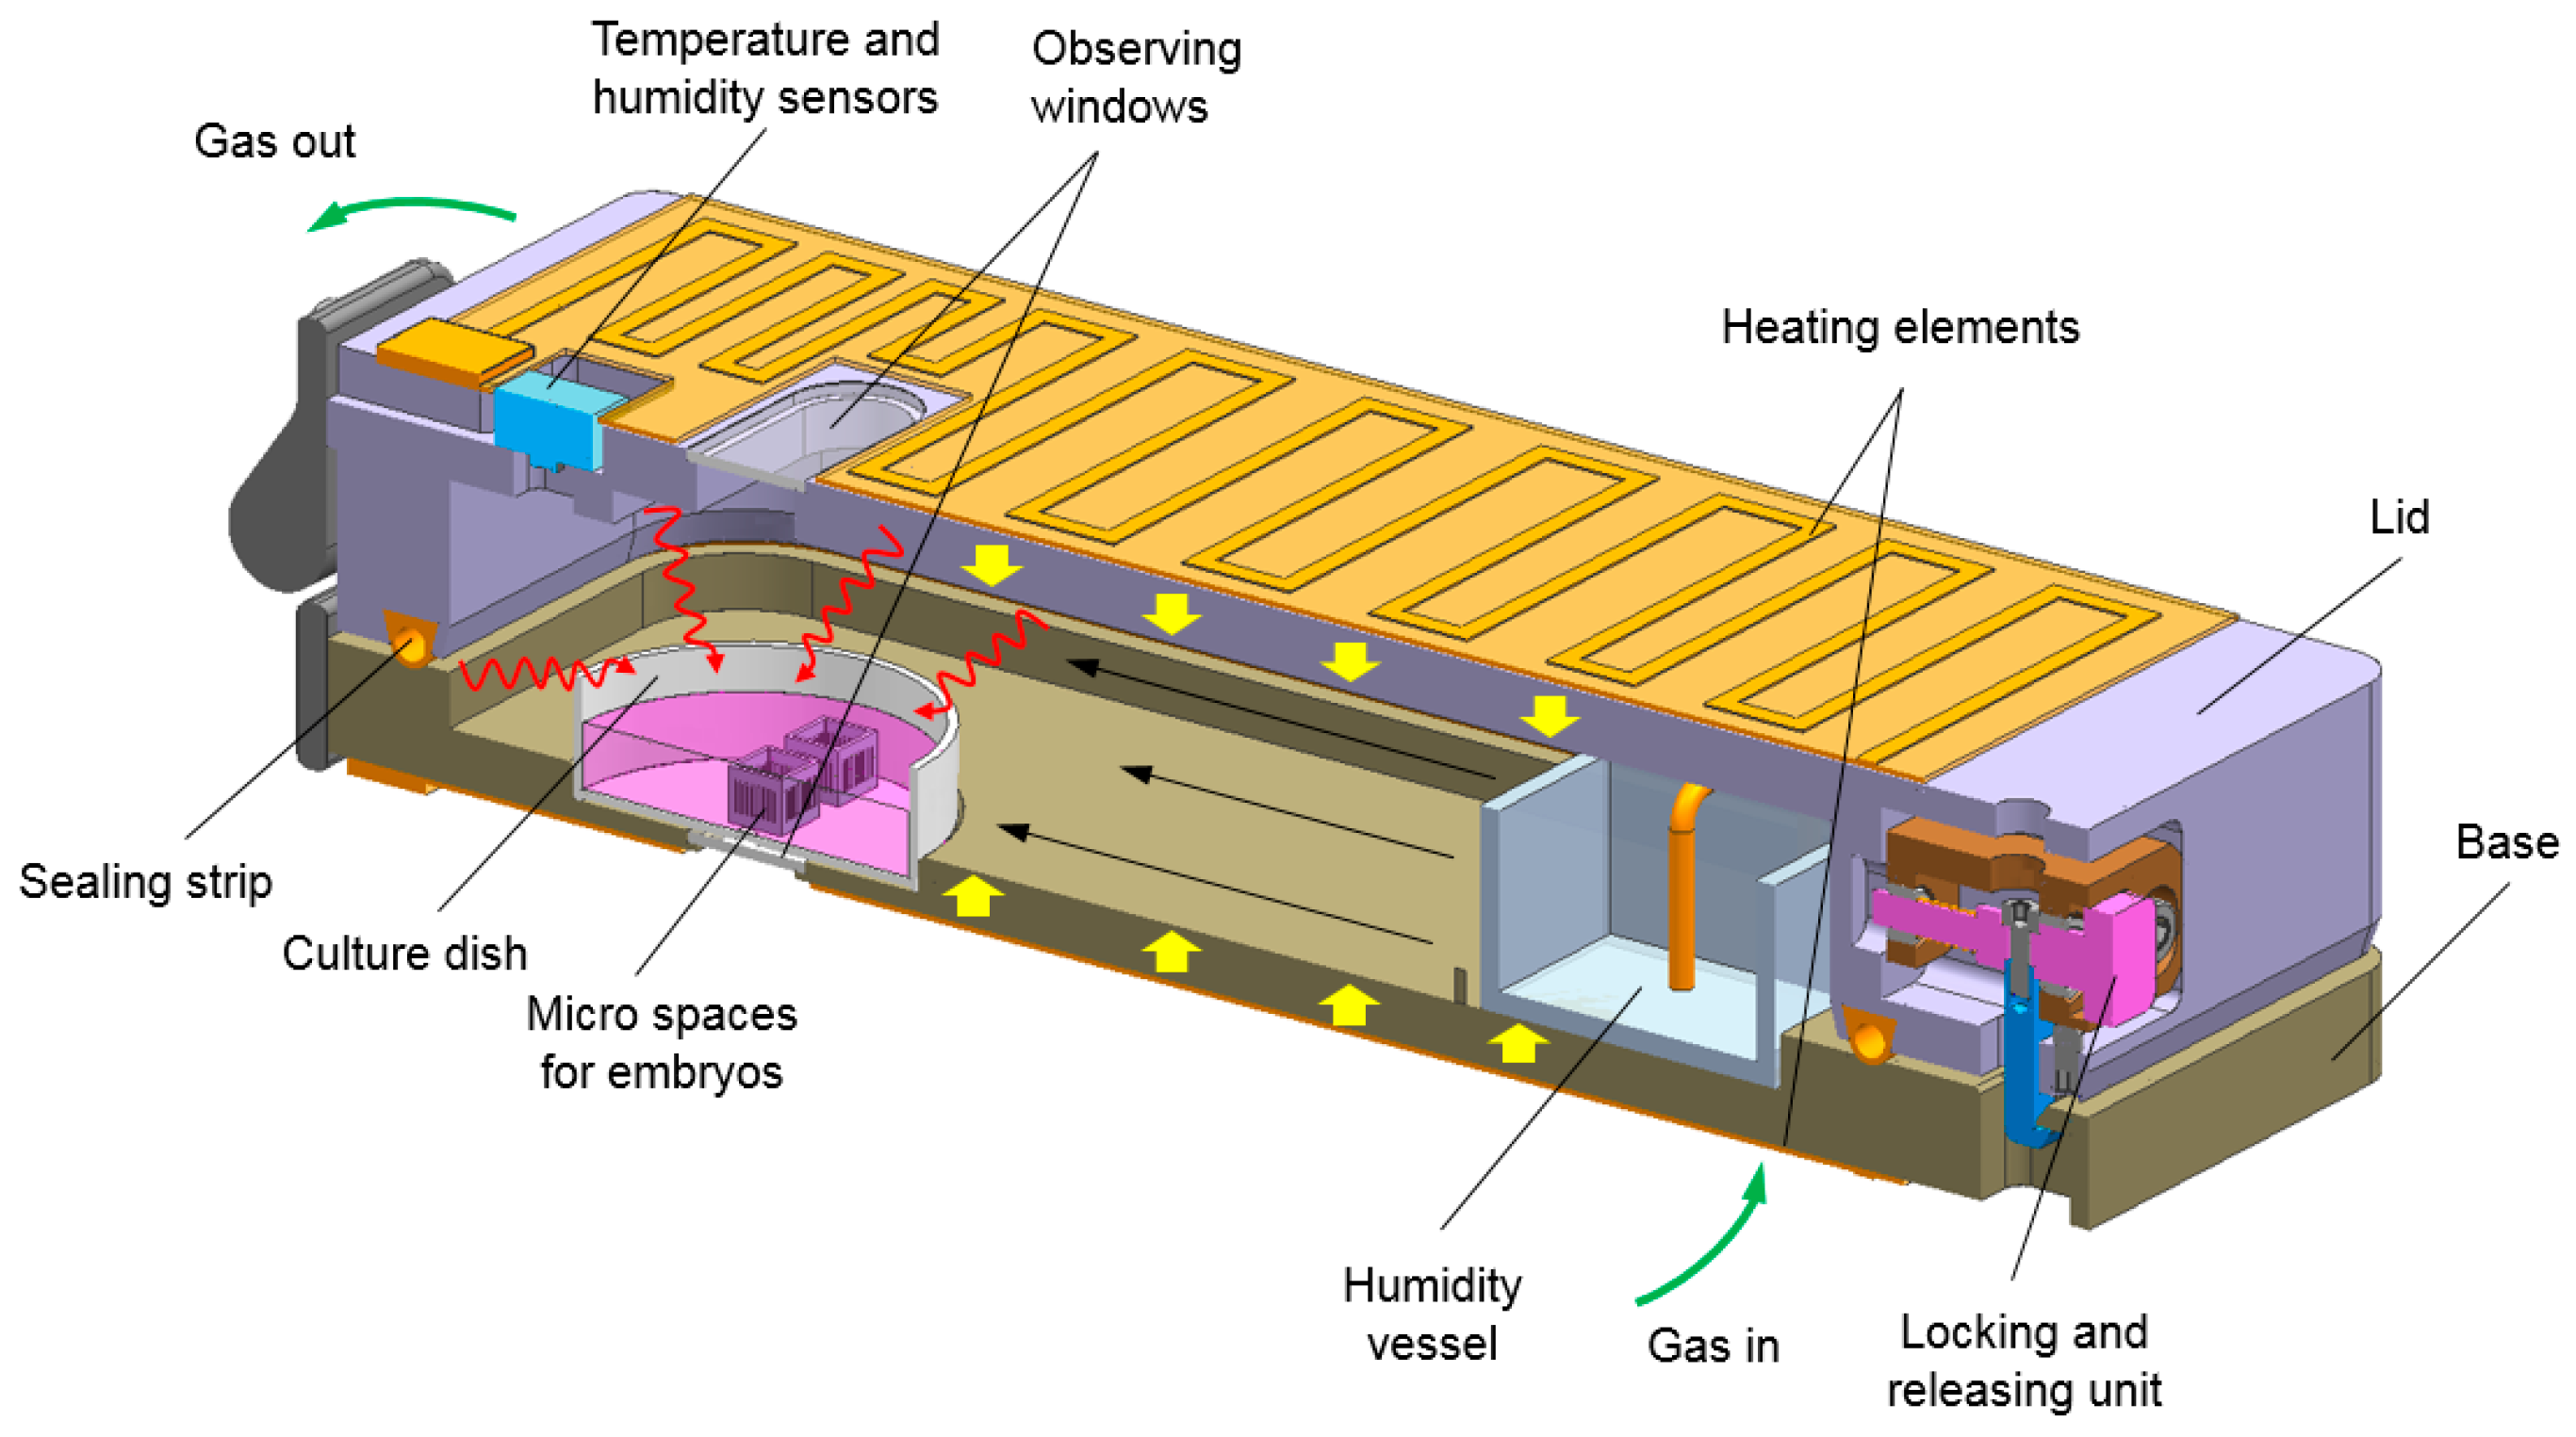
Figure 1. Heat transfer system and internal structure of the culture chamber.
Symmetry 17 00478 g001
Figure 2. Layout of a heating element on the surface. The heated surface can be divided into several nearly isothermal regions after achieving heat transfer equilibrium.
Symmetry 17 00478 g002
Figure 3. Temperature experimental system. (a) Layout of metal foil on lid. (b) Layout of metal foil on base. (c) Distribution of temperature testing points. The temperature sensors on the lid and base are circled in red. Eight white-marked test points (numbered 1–8) are used to measure real-time temperature changes inside the chamber.
Symmetry 17 00478 g003
Figure 4. Temperature distribution and region division. (a) Initial temperature distribution and division of lid. The maximum temperature gradient is 0.5 °C. (b) Initial temperature distribution and division of base. The maximum temperature gradient is 0.31 °C. (c) Temperature distribution of lid after optimization. The maximum temperature gradient is 0.1 °C. (d) Temperature distribution of base after optimization. The maximum temperature gradient is 0.1 °C.
Symmetry 17 00478 g004
Figure 5. Convergence curve of the maximum temperature gradient of (a) the lid and (b) the base.
Symmetry 17 00478 g005
Figure 6. Temperature field of the assembled chamber. (a) Temperature distribution of the lid. (b) Temperature distribution of the base.
Symmetry 17 00478 g006
Figure 7. Temperature distribution within the chamber. The left side displays the global temperature distribution inside the chamber, while the right side displays the water temperature distribution in the culture dish.
Symmetry 17 00478 g007
Figure 8. Temperature variation of each testing point. The enlarged figure shows the temperature at each point in the stable state.
Symmetry 17 00478 g008
Figure 9. Water temperature at different testing points. The enlarged figure shows the temperature at each point in the stable state.
Symmetry 17 00478 g009
Table 1. Temperature simulation parameters for the chamber surface.
ProjectParameters
Lid and base material6061 alloy
Sealing strip materialnylon
Glass materialSiO2
Metal foil resistivity1.4 × 10−6 Ω·m
Ambient temperature293.15 K
Upper surface convective heat transfer coefficient of the lid4.1 W/(m2·K)
Bottom surface convective heat transfer coefficient of the base2.1 W/(m2·K)
Side surface convective heat transfer coefficient5.9 W/(m2·K)
Lid surface emissivity0.2
Insulation cotton surface emissivity0.8
Glass surface emissivity0.9
Thickness of the metal foil0.05 mm
Initial width of the metal foil2 mm
Gas flow rate30 mL/min
Table 2. First calculated process value.
ParameterRegion No.
1235
k5
Ai0.0026 m20.00073 m20.00236 m20.003 m2
hi5.1 W/(m2·K)5.2 W/(m2·K)5.3 W/(m2·K)5.1 W/(m2·K)
ΔTi0.331 °C0.251 °C0.187 °C0.182 °C
l0i162 mm54 mm91.5 mm174 mm
w0i2 mm2 mm2 mm2 mm
Ra24.2 Ω
U07.46 V
Table 3. Modified values for each iteration of the lid.
IterationModified
Parameter
Acceleration
Factor
Region No.
1235
1w′50.4 mm0.25 mm0.35 mm0.25 mm
The rate of change of w′20%12.5%17.5%12.5%
2w′100.4 mm0.3 mm0.5 mm0.3 mm
The rate of change of w′25%17%30%17%
3l′1030 mm10 mm26 mm35 mm
The rate of change of l′18.5%18.5%28.4%20%
4w′100.1 mm0.1 mm0.2 mm0.1 mm
The rate of change of w′8.3%6.9%19%6.9%
5w′100.15 mm000.2 mm
The rate of change of w′13.6%0014.8%
6l′1020 mm10 mm20 mm25 mm
The rate of change of l′10.4%15.4%17%12%
Table 4. Modified values for each iteration of the base.
IterationModified
Parameter
Acceleration
Factor
Region No.
1234
1w′1000.15 mm0.15 mm0.8 mm
The rate of change of w′07.5%7.5%40%
2l′1007 mm017 mm
The rate of change of l′04%013.5%
3l′1005 mm013 mm
The rate of change of l′02.7%09.1%
4l′1080 mm0020 mm
The rate of change of l′6.1%0012.9%
Disclaimer/Publisher’s Note: The statements, opinions and data contained in all publications are solely those of the individual author(s) and contributor(s) and not of MDPI and/or the editor(s). MDPI and/or the editor(s) disclaim responsibility for any injury to people or property resulting from any ideas, methods, instructions or products referred to in the content.