

Dual-Motor Symmetric Configuration and Powertrain Matching for Pure Electric Mining Dump Trucks


Abstract
1. Introduction
2. Symmetry Design and Static Characteristics Analysis of Electric Vehicle Battery Pack
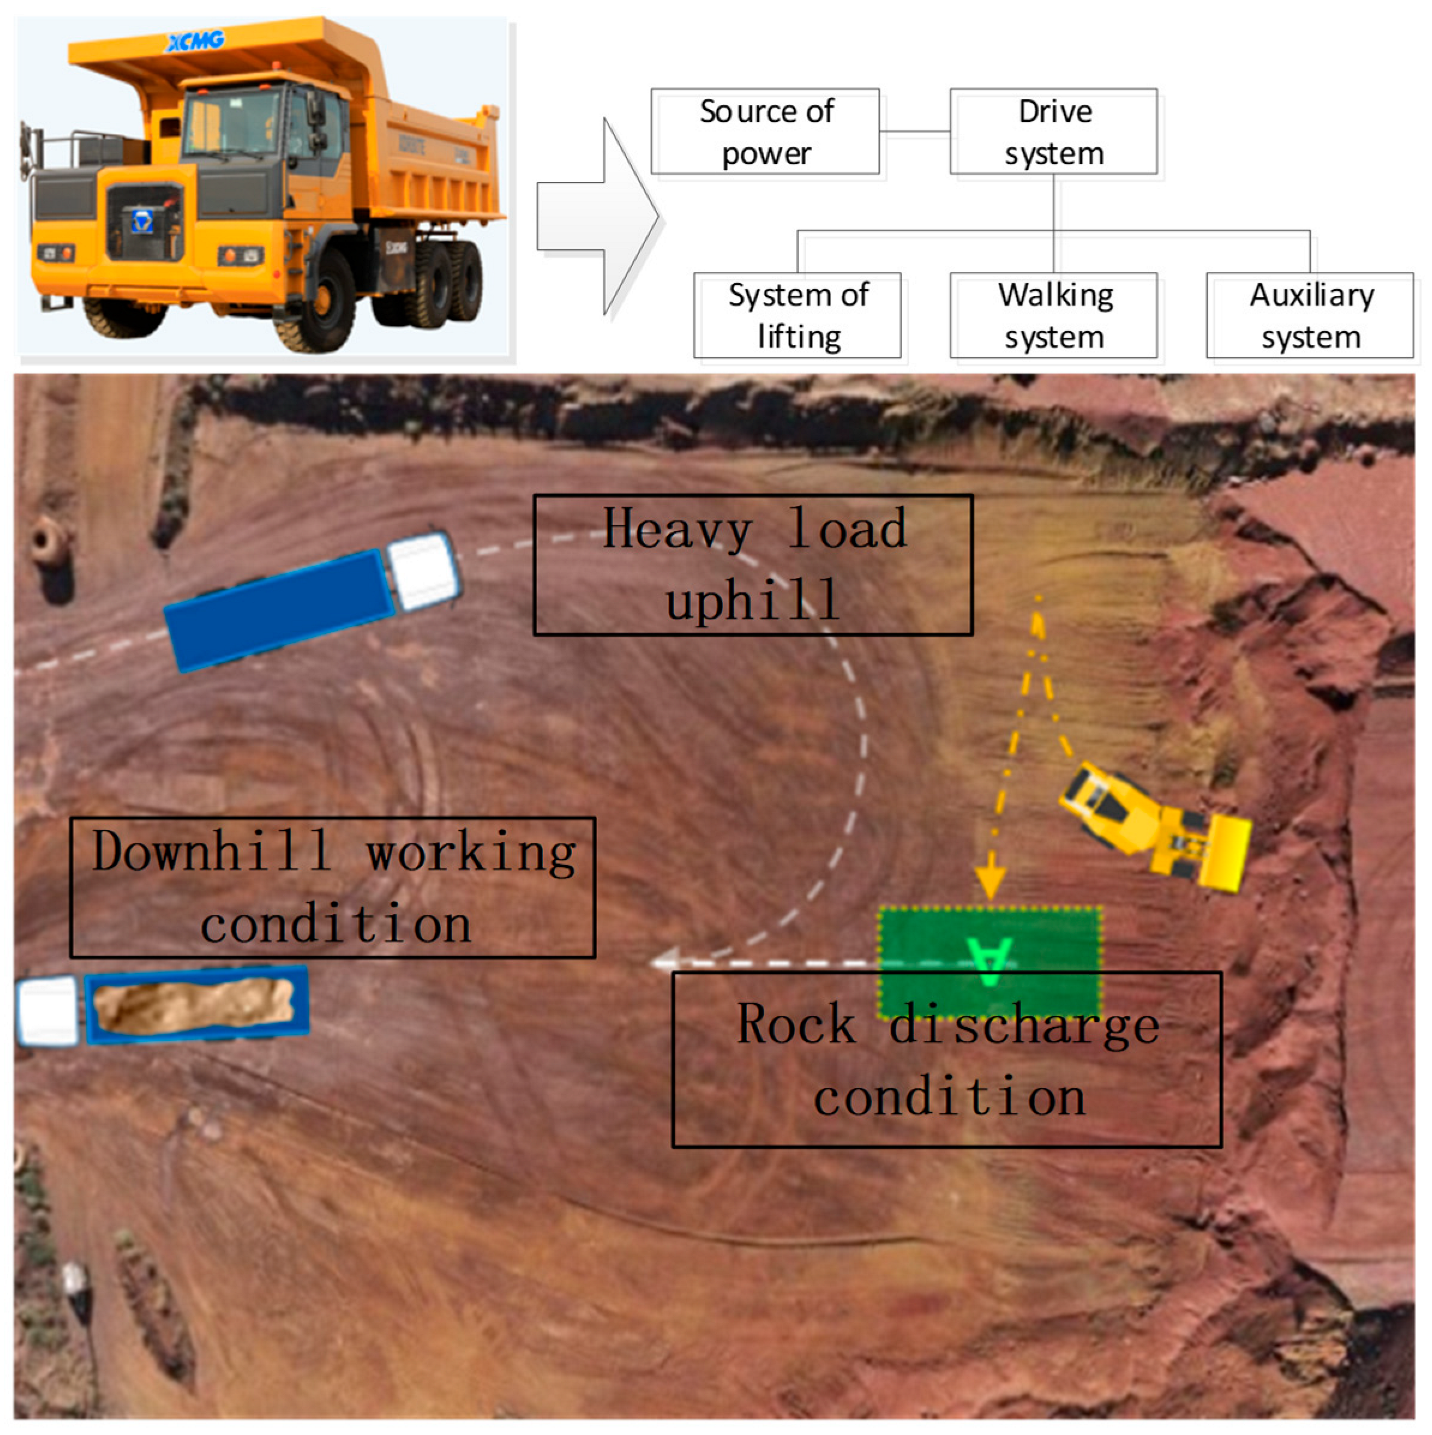
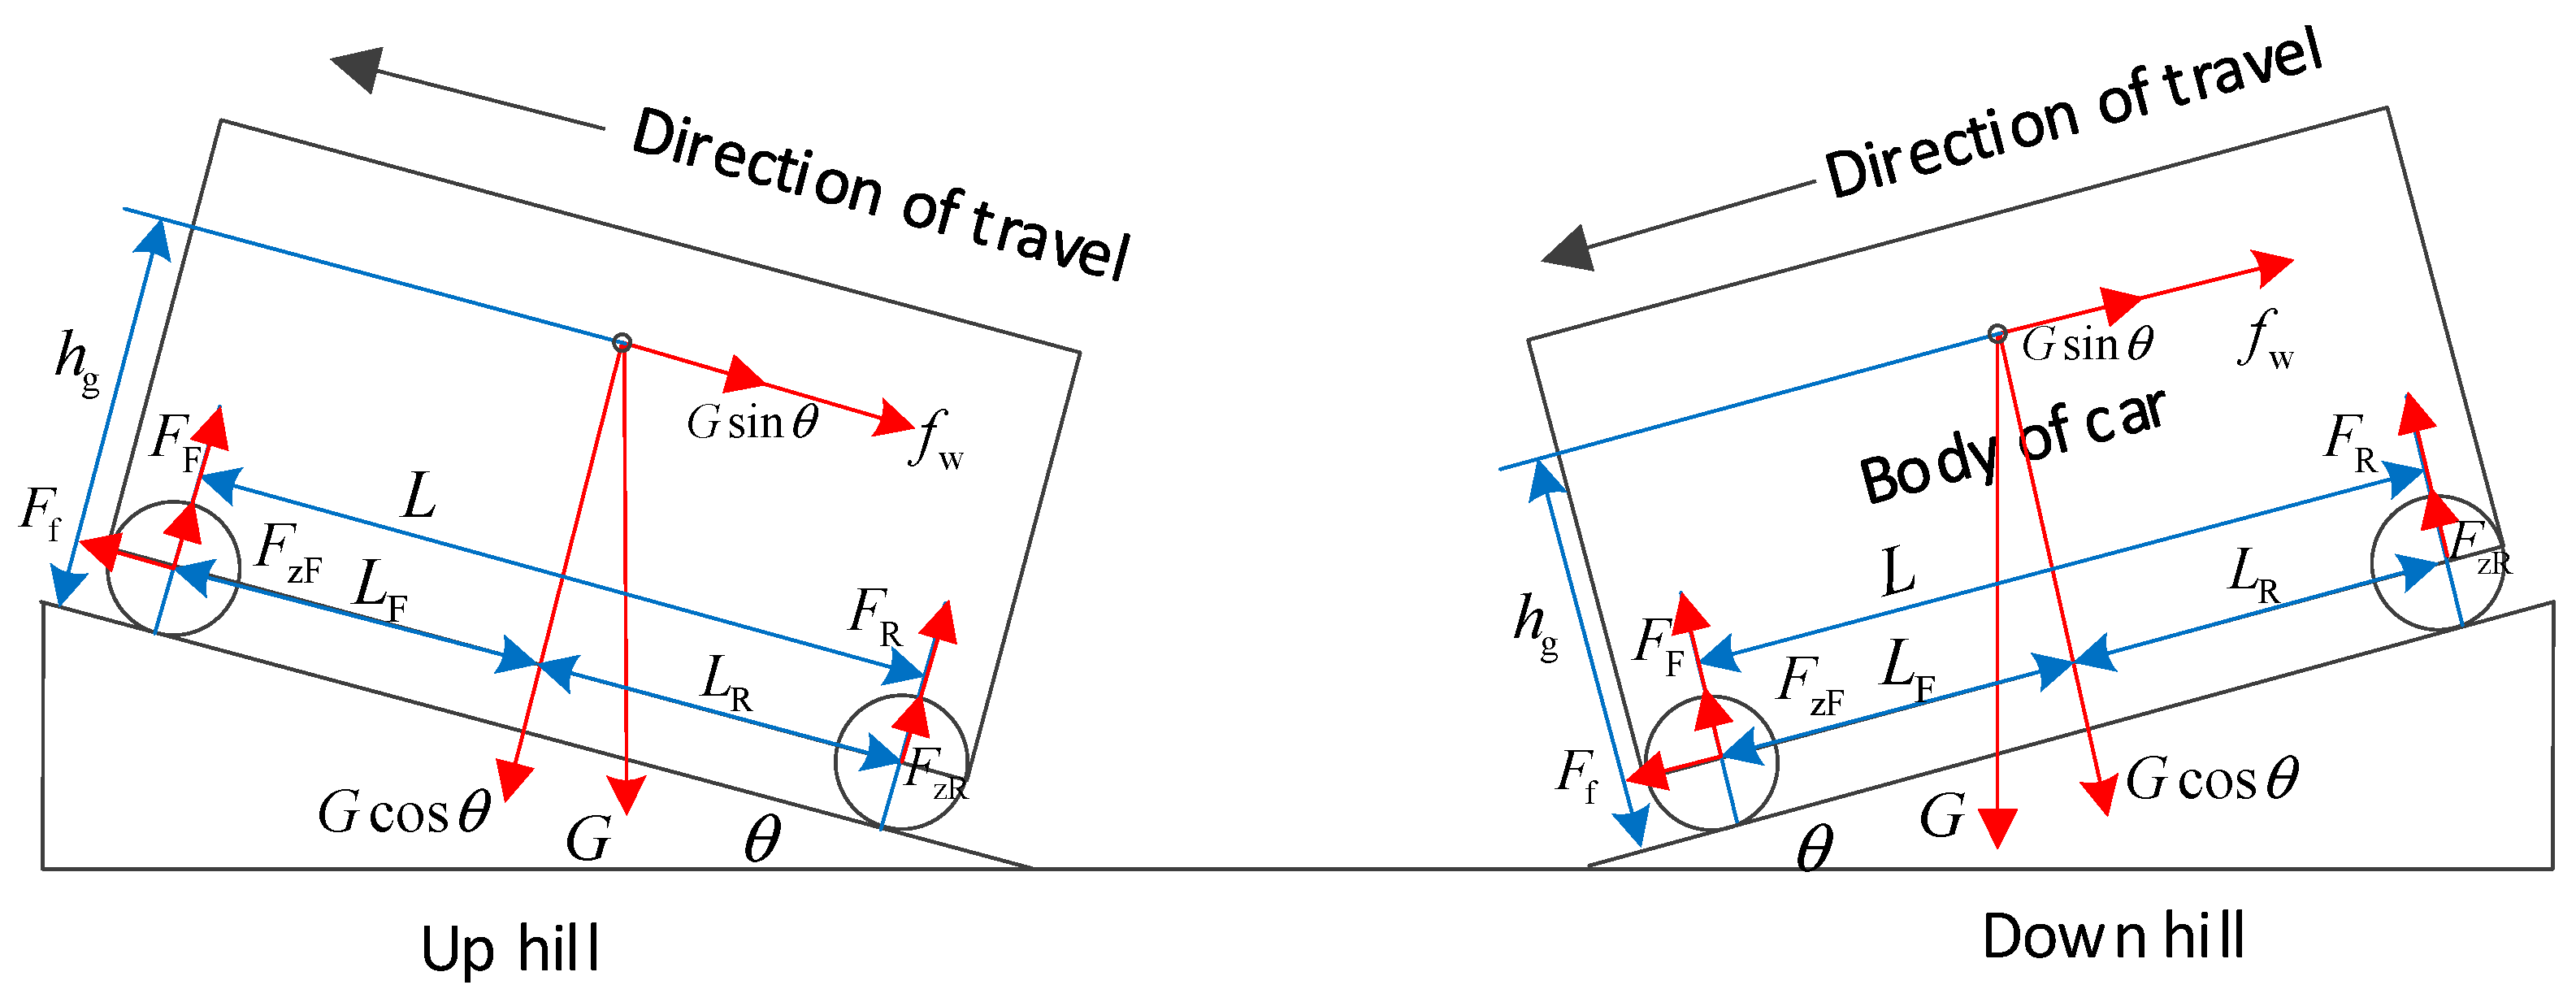
2.1. Vehicle Dynamic Model
2.1.1. Walking Actuation
- (1)
- Vehicle traction
- (2)
- Driving power
- (3)
- Speed analysis
- (4)
- Torque analysis
2.1.2. Walking Braking
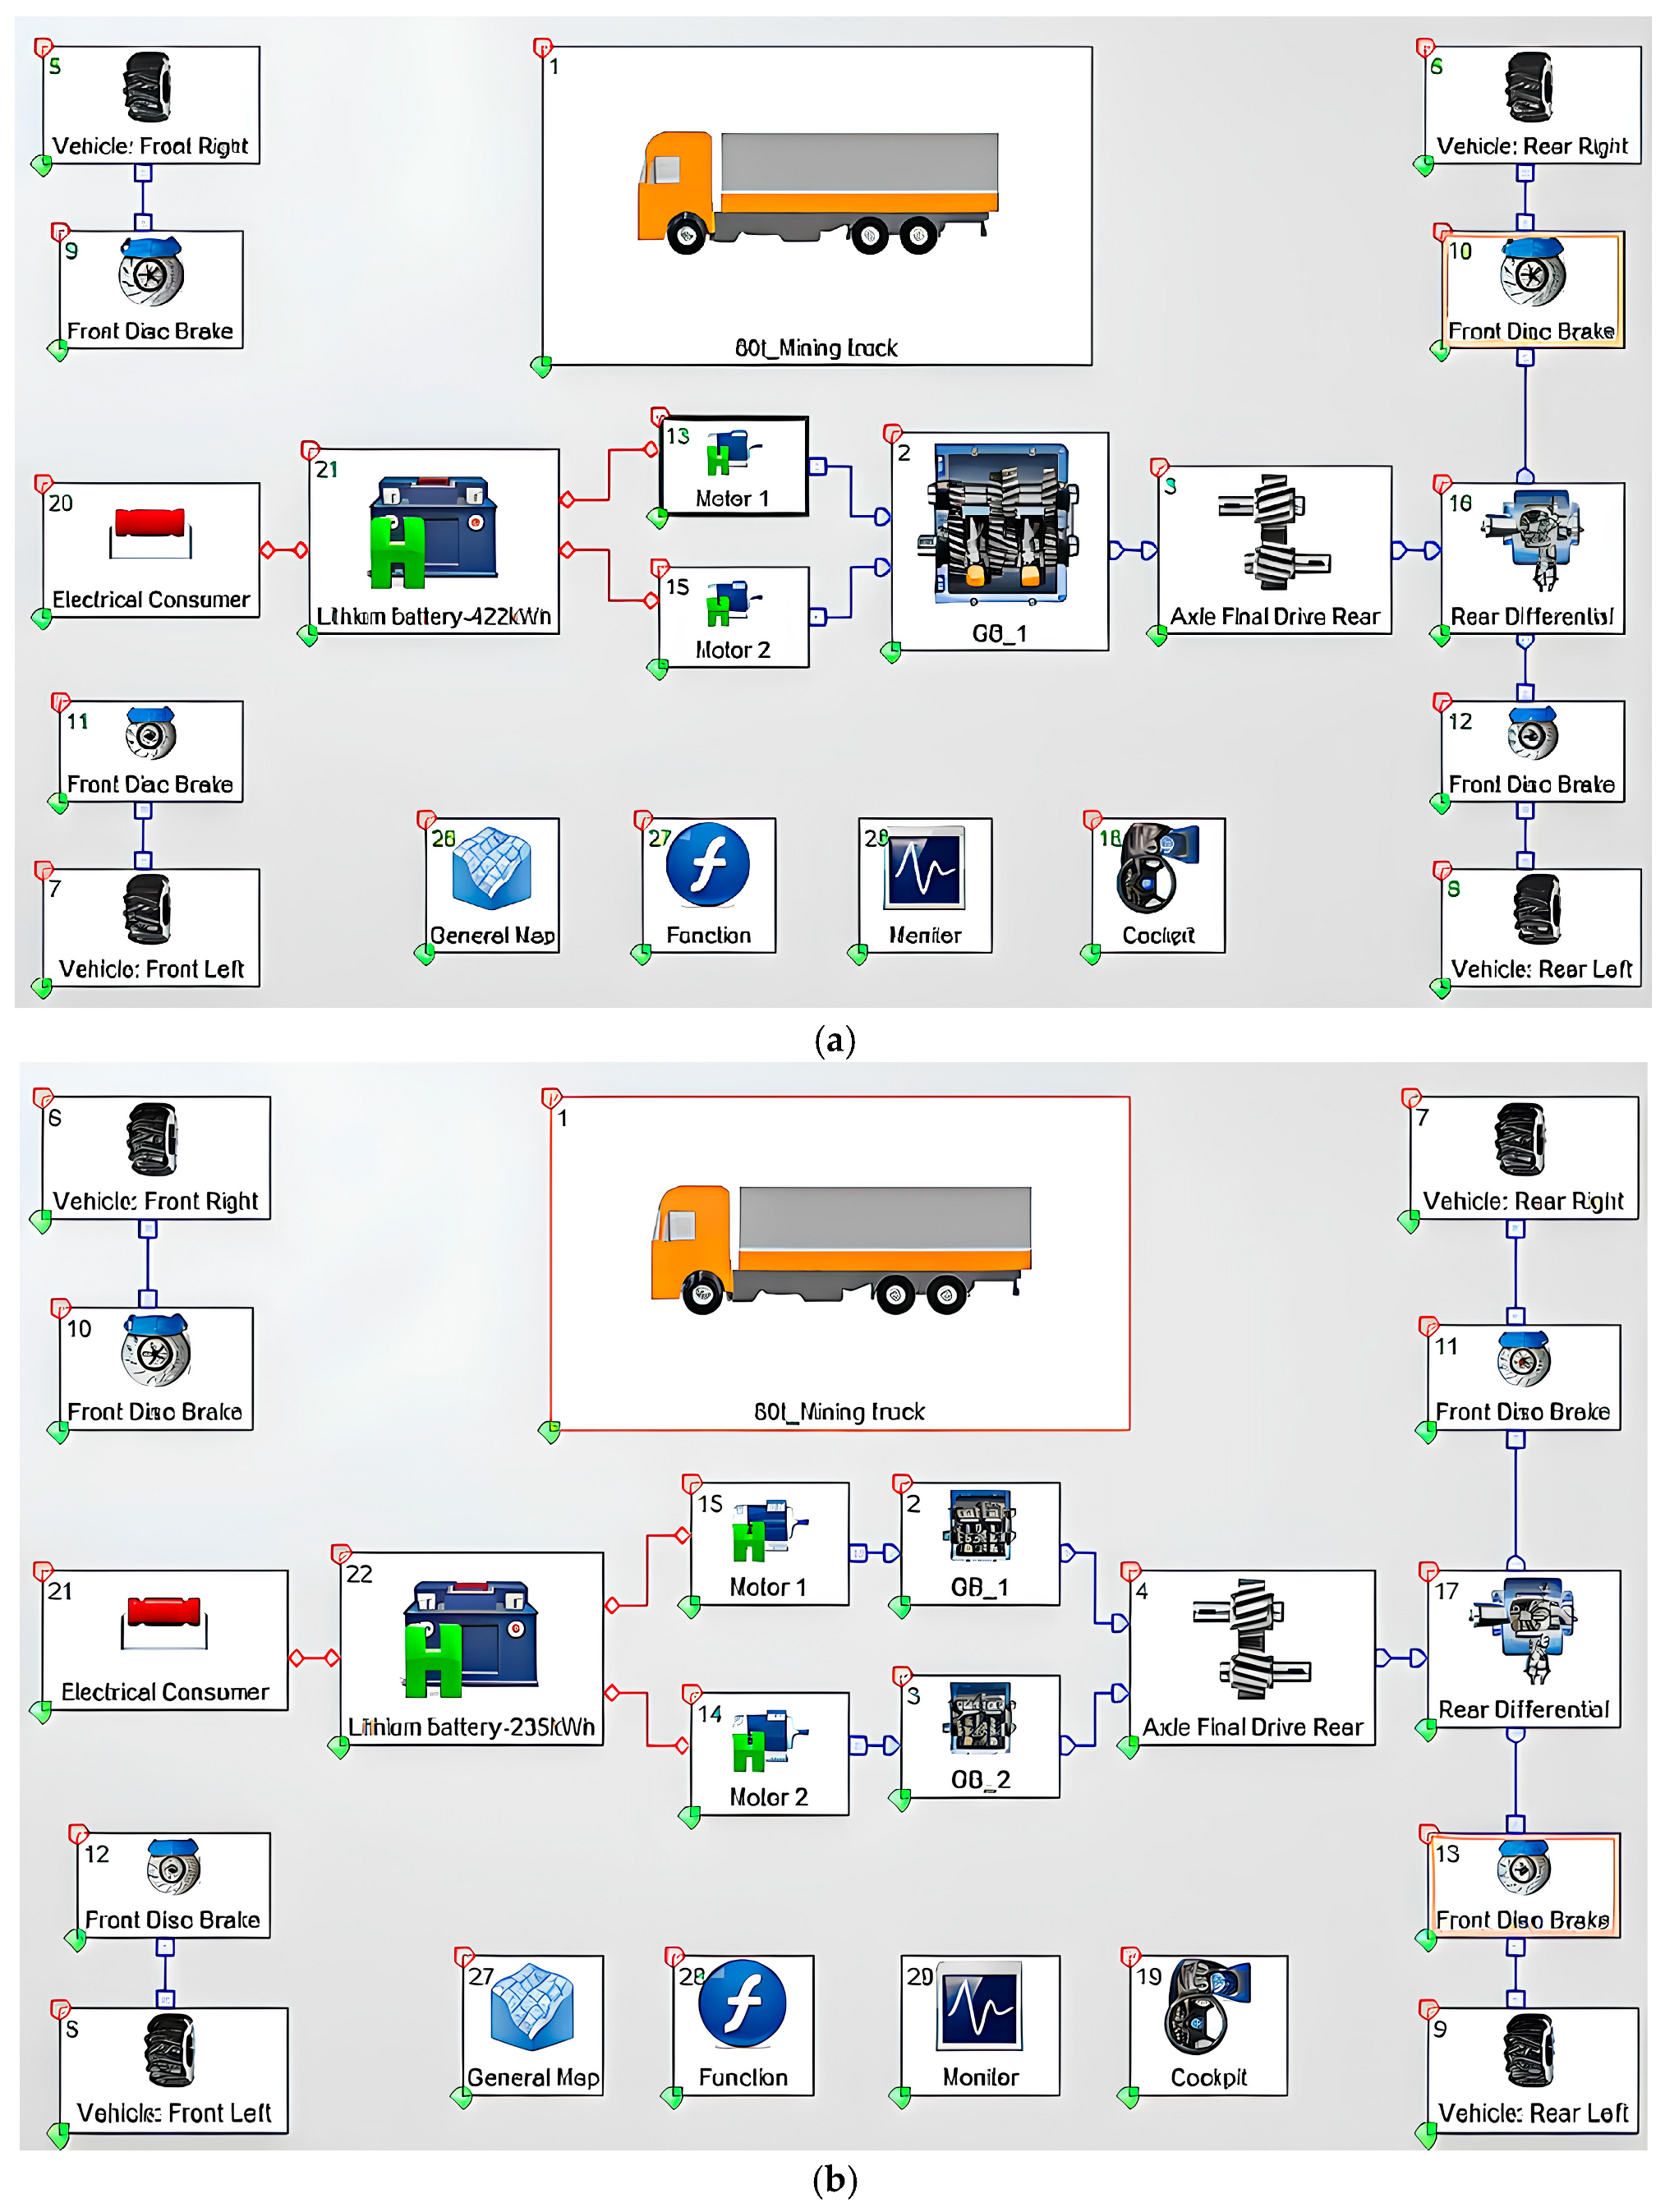
2.2. Symmetrical Drive Configuration of Motor and Gearbox Type
Driver Configuration Topology
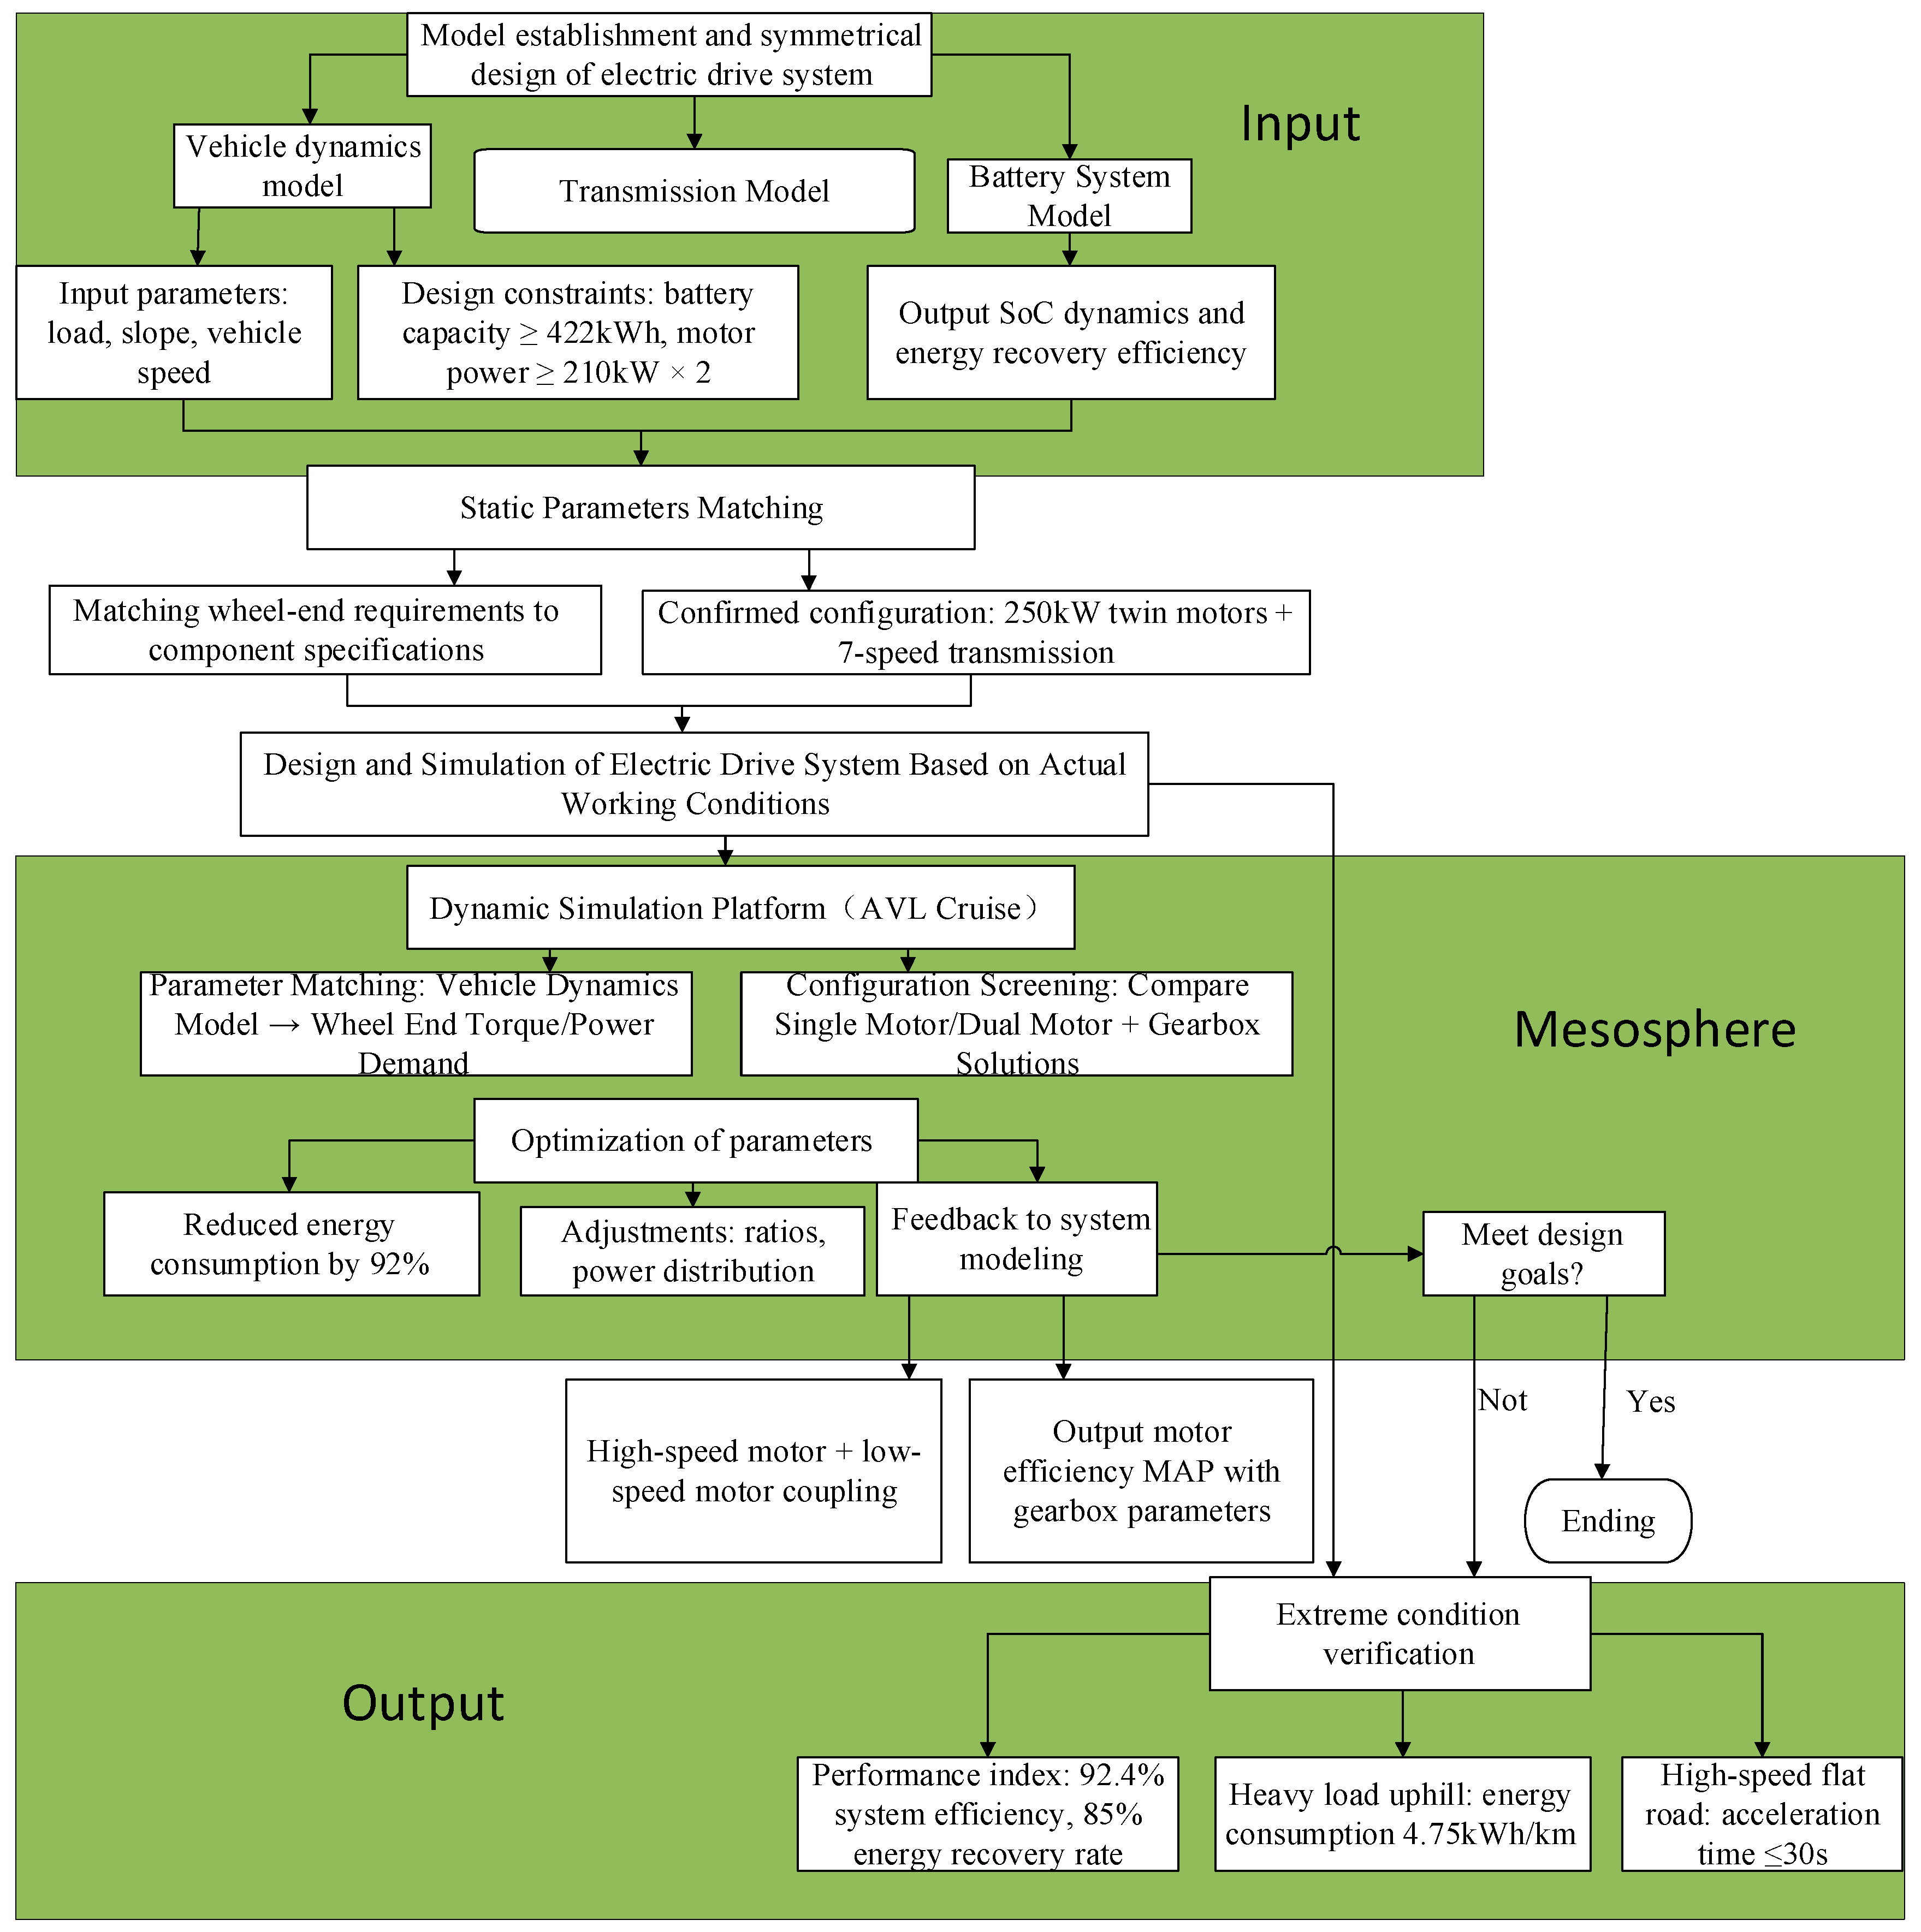
3. Model Establishment and Symmetrical Design of Electric Drive System
3.1. Modeling of Electric Drive System
- (1)
- Motor model
- (2)
- Gearbox model
- (3)
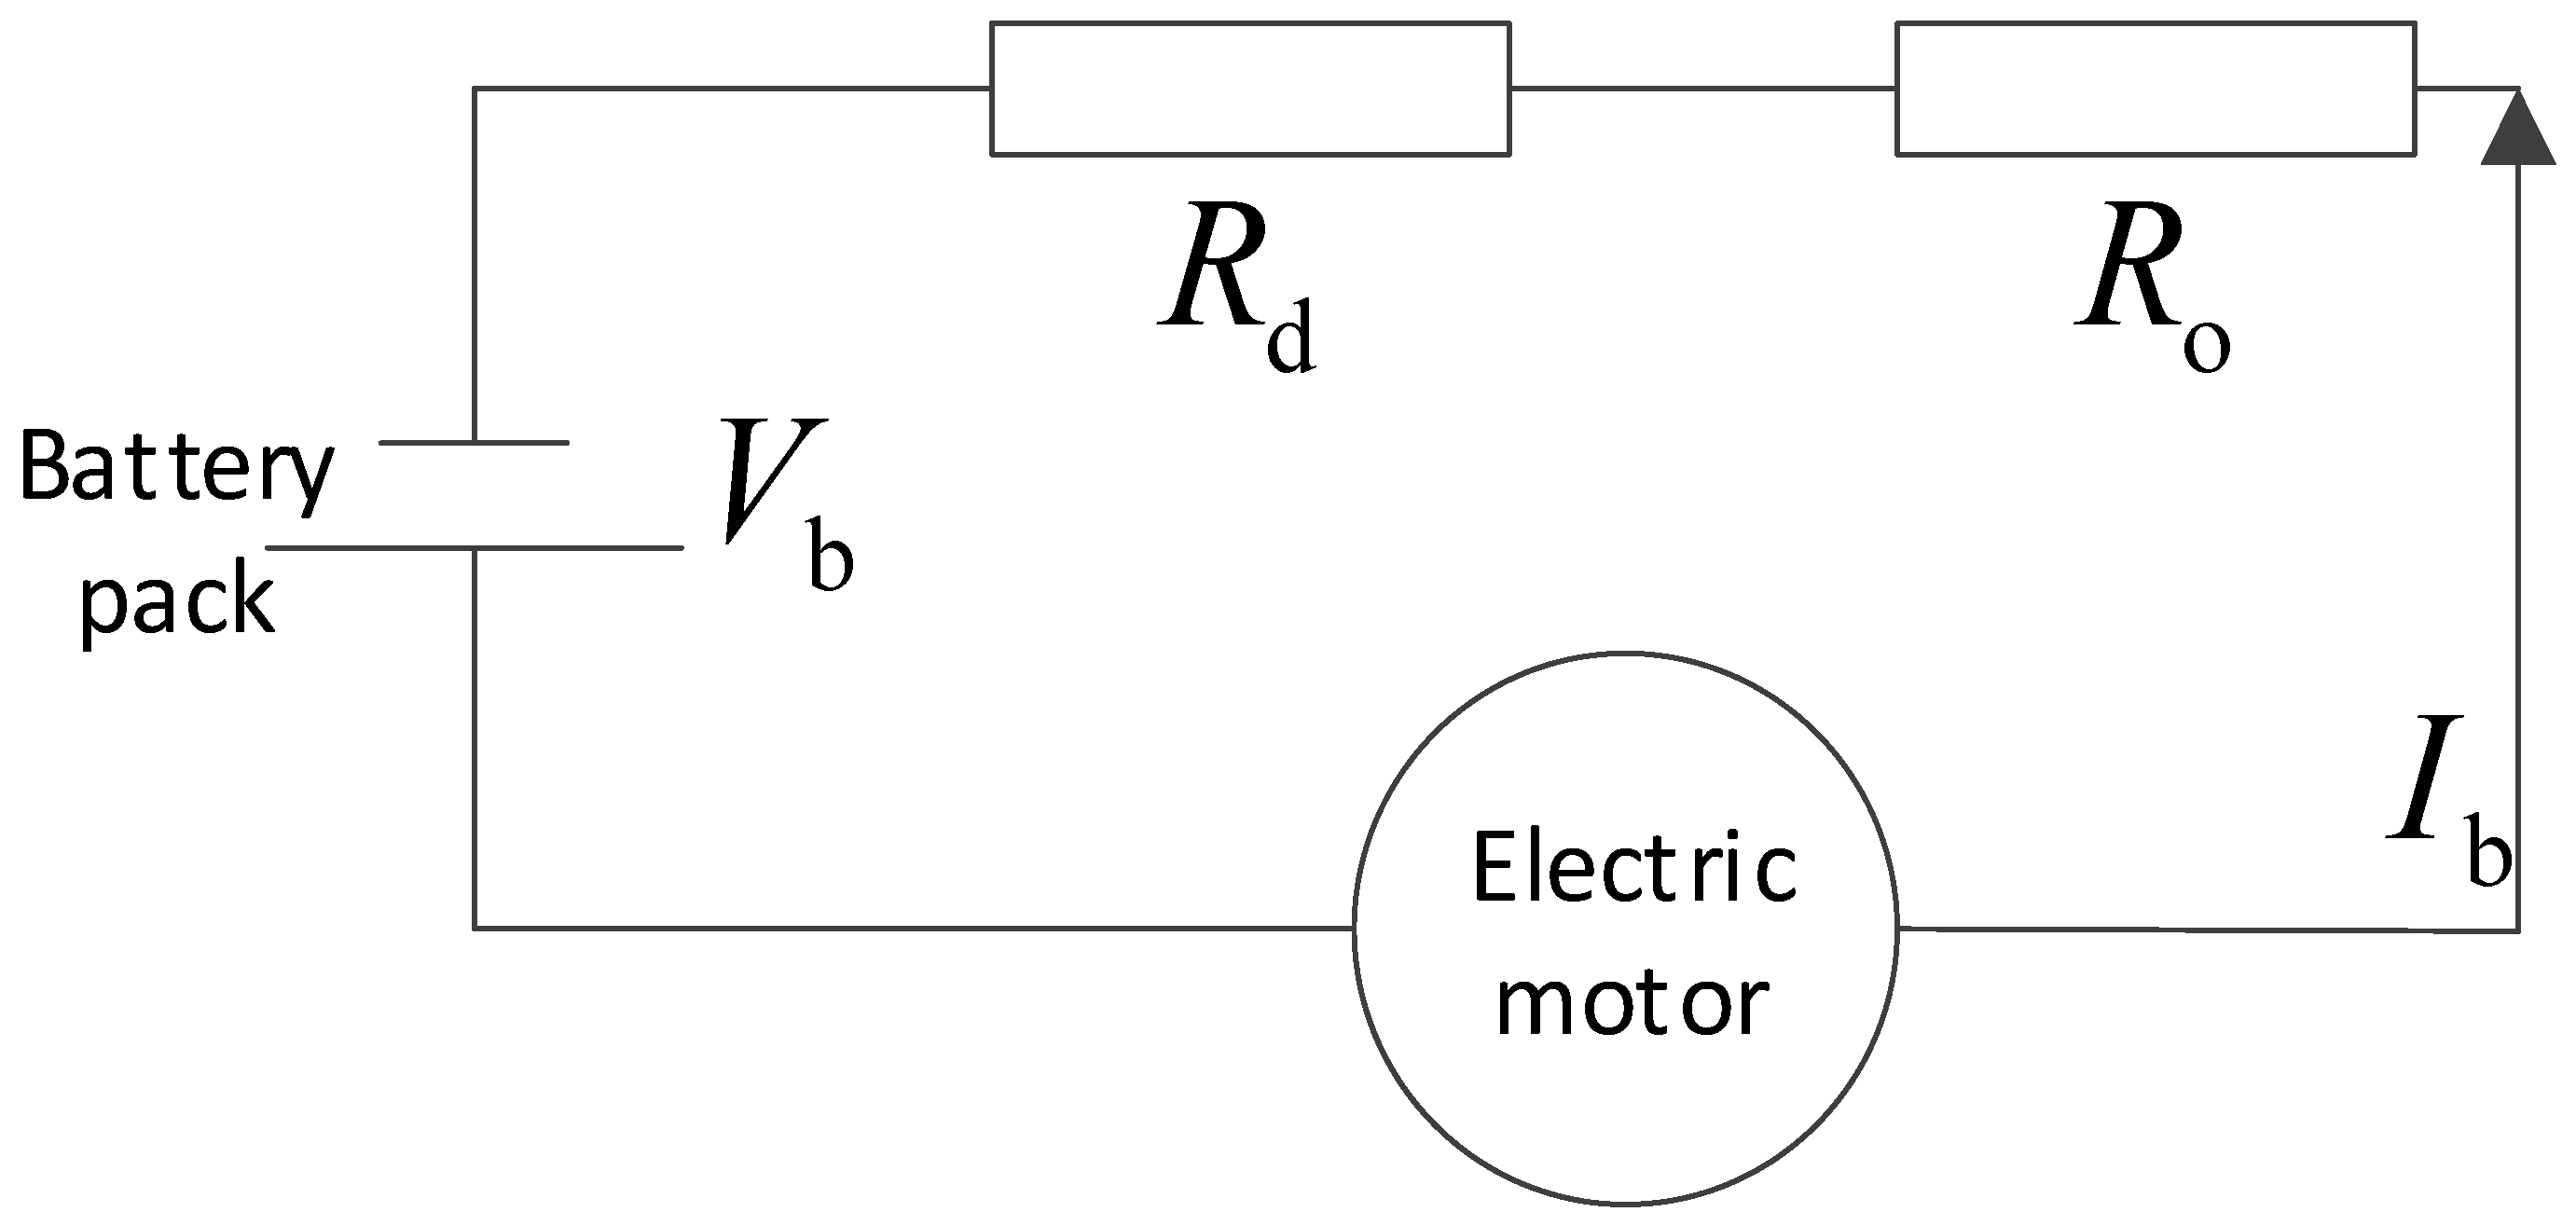
- Battery model
3.2. Verification of Driving Configuration Matching and Calculation of Static Parameter Matching
3.3. Selection and Symmetry Design of Motor Integrated Transmission Configuration Components
4. Design and Simulation of Electric Drive System Based on Actual Working Conditions
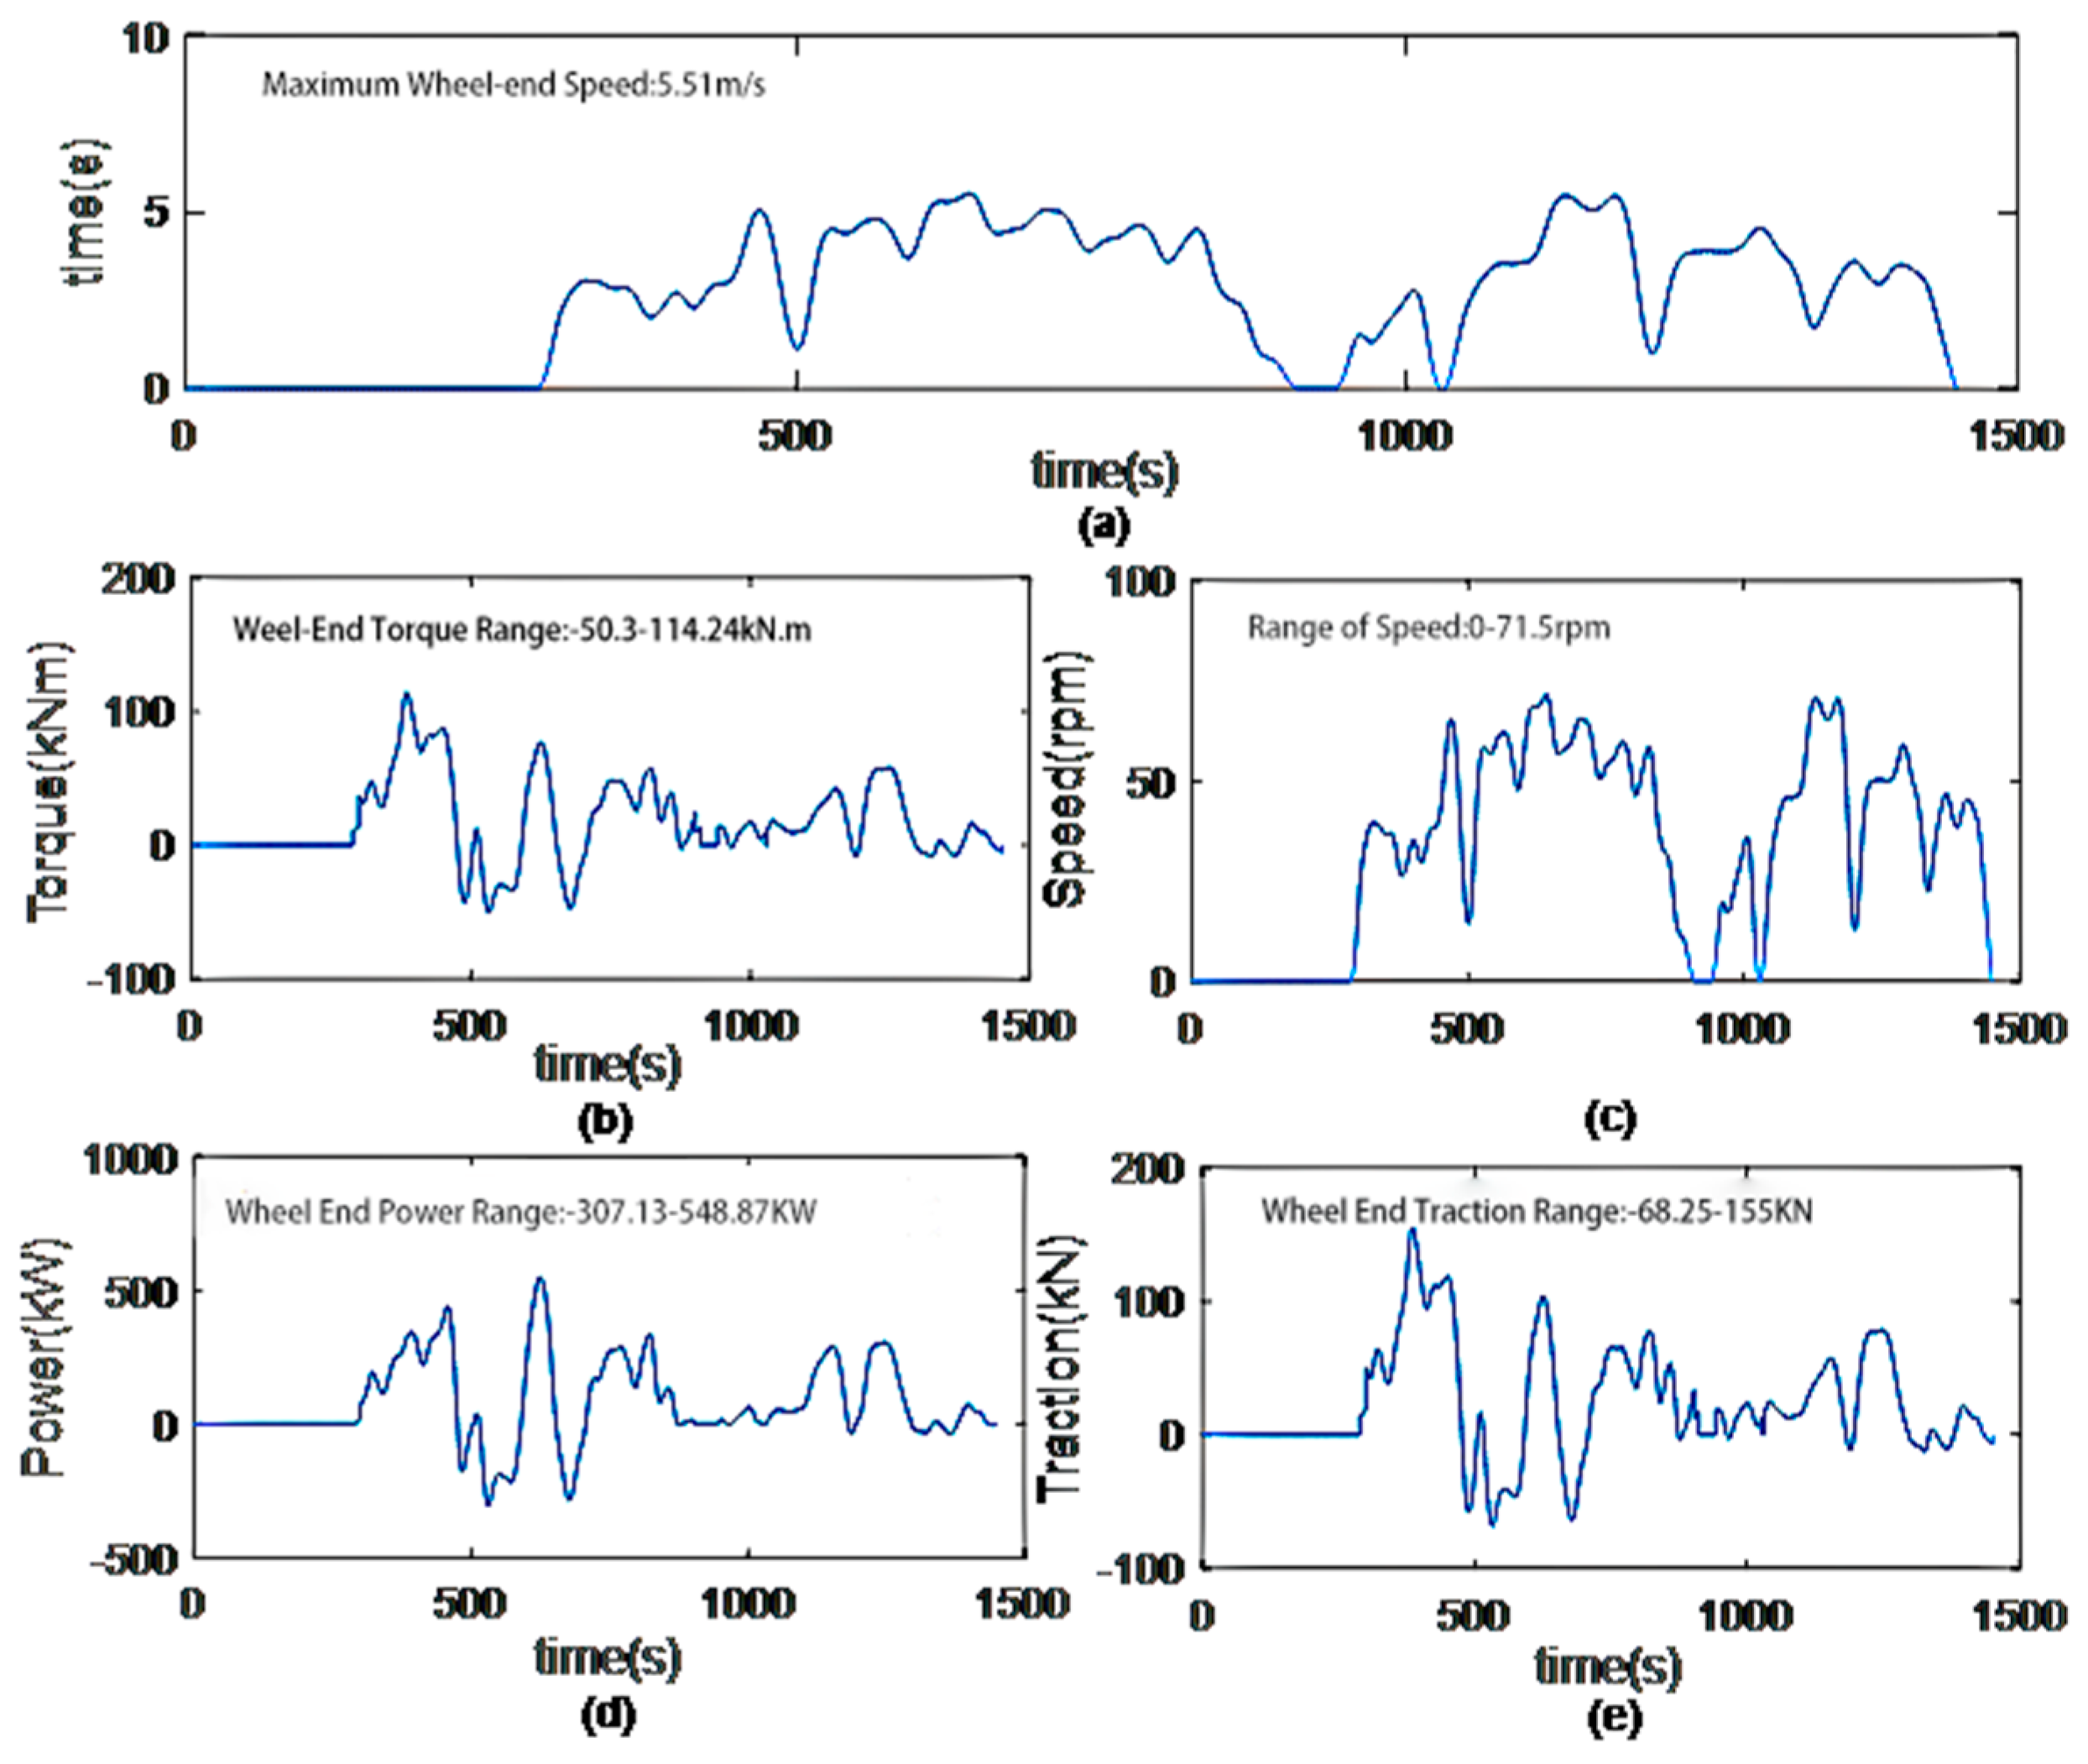
4.1. Dynamic Simulation Analysis of Parameters
4.2. Matching Calculation of Typical Working Conditions
- (1)
- Maximum wheel-end power: 184.3 kW at 13.81 rpm (torque: 127,409 Nm).
- (2)
- Maximum wheel-end torque: 127,409 Nm at 13.81 rpm (power: 184.3 kW).
- (3)
- Maximum wheel-end speed: 71.5 rpm at 45,014.5 Nm (power: 336.8 kW).
- (1)
- Maximum power: 568.63 kW/63,156.2 Nm/86.0 rpm;
- (2)
- Maximum torque: 267,033.4 Nm/7.64 rpm/213.5 kW;
- (3)
- Maximum speed: 198 rpm/25,302.7 Nm/524.6 kW.
4.2.1. Rock Row Condition (Flat Road and up and Downhill)
4.2.2. Uphill Under Heavy Load
4.2.3. Lower Condition (Heavy Downhill)
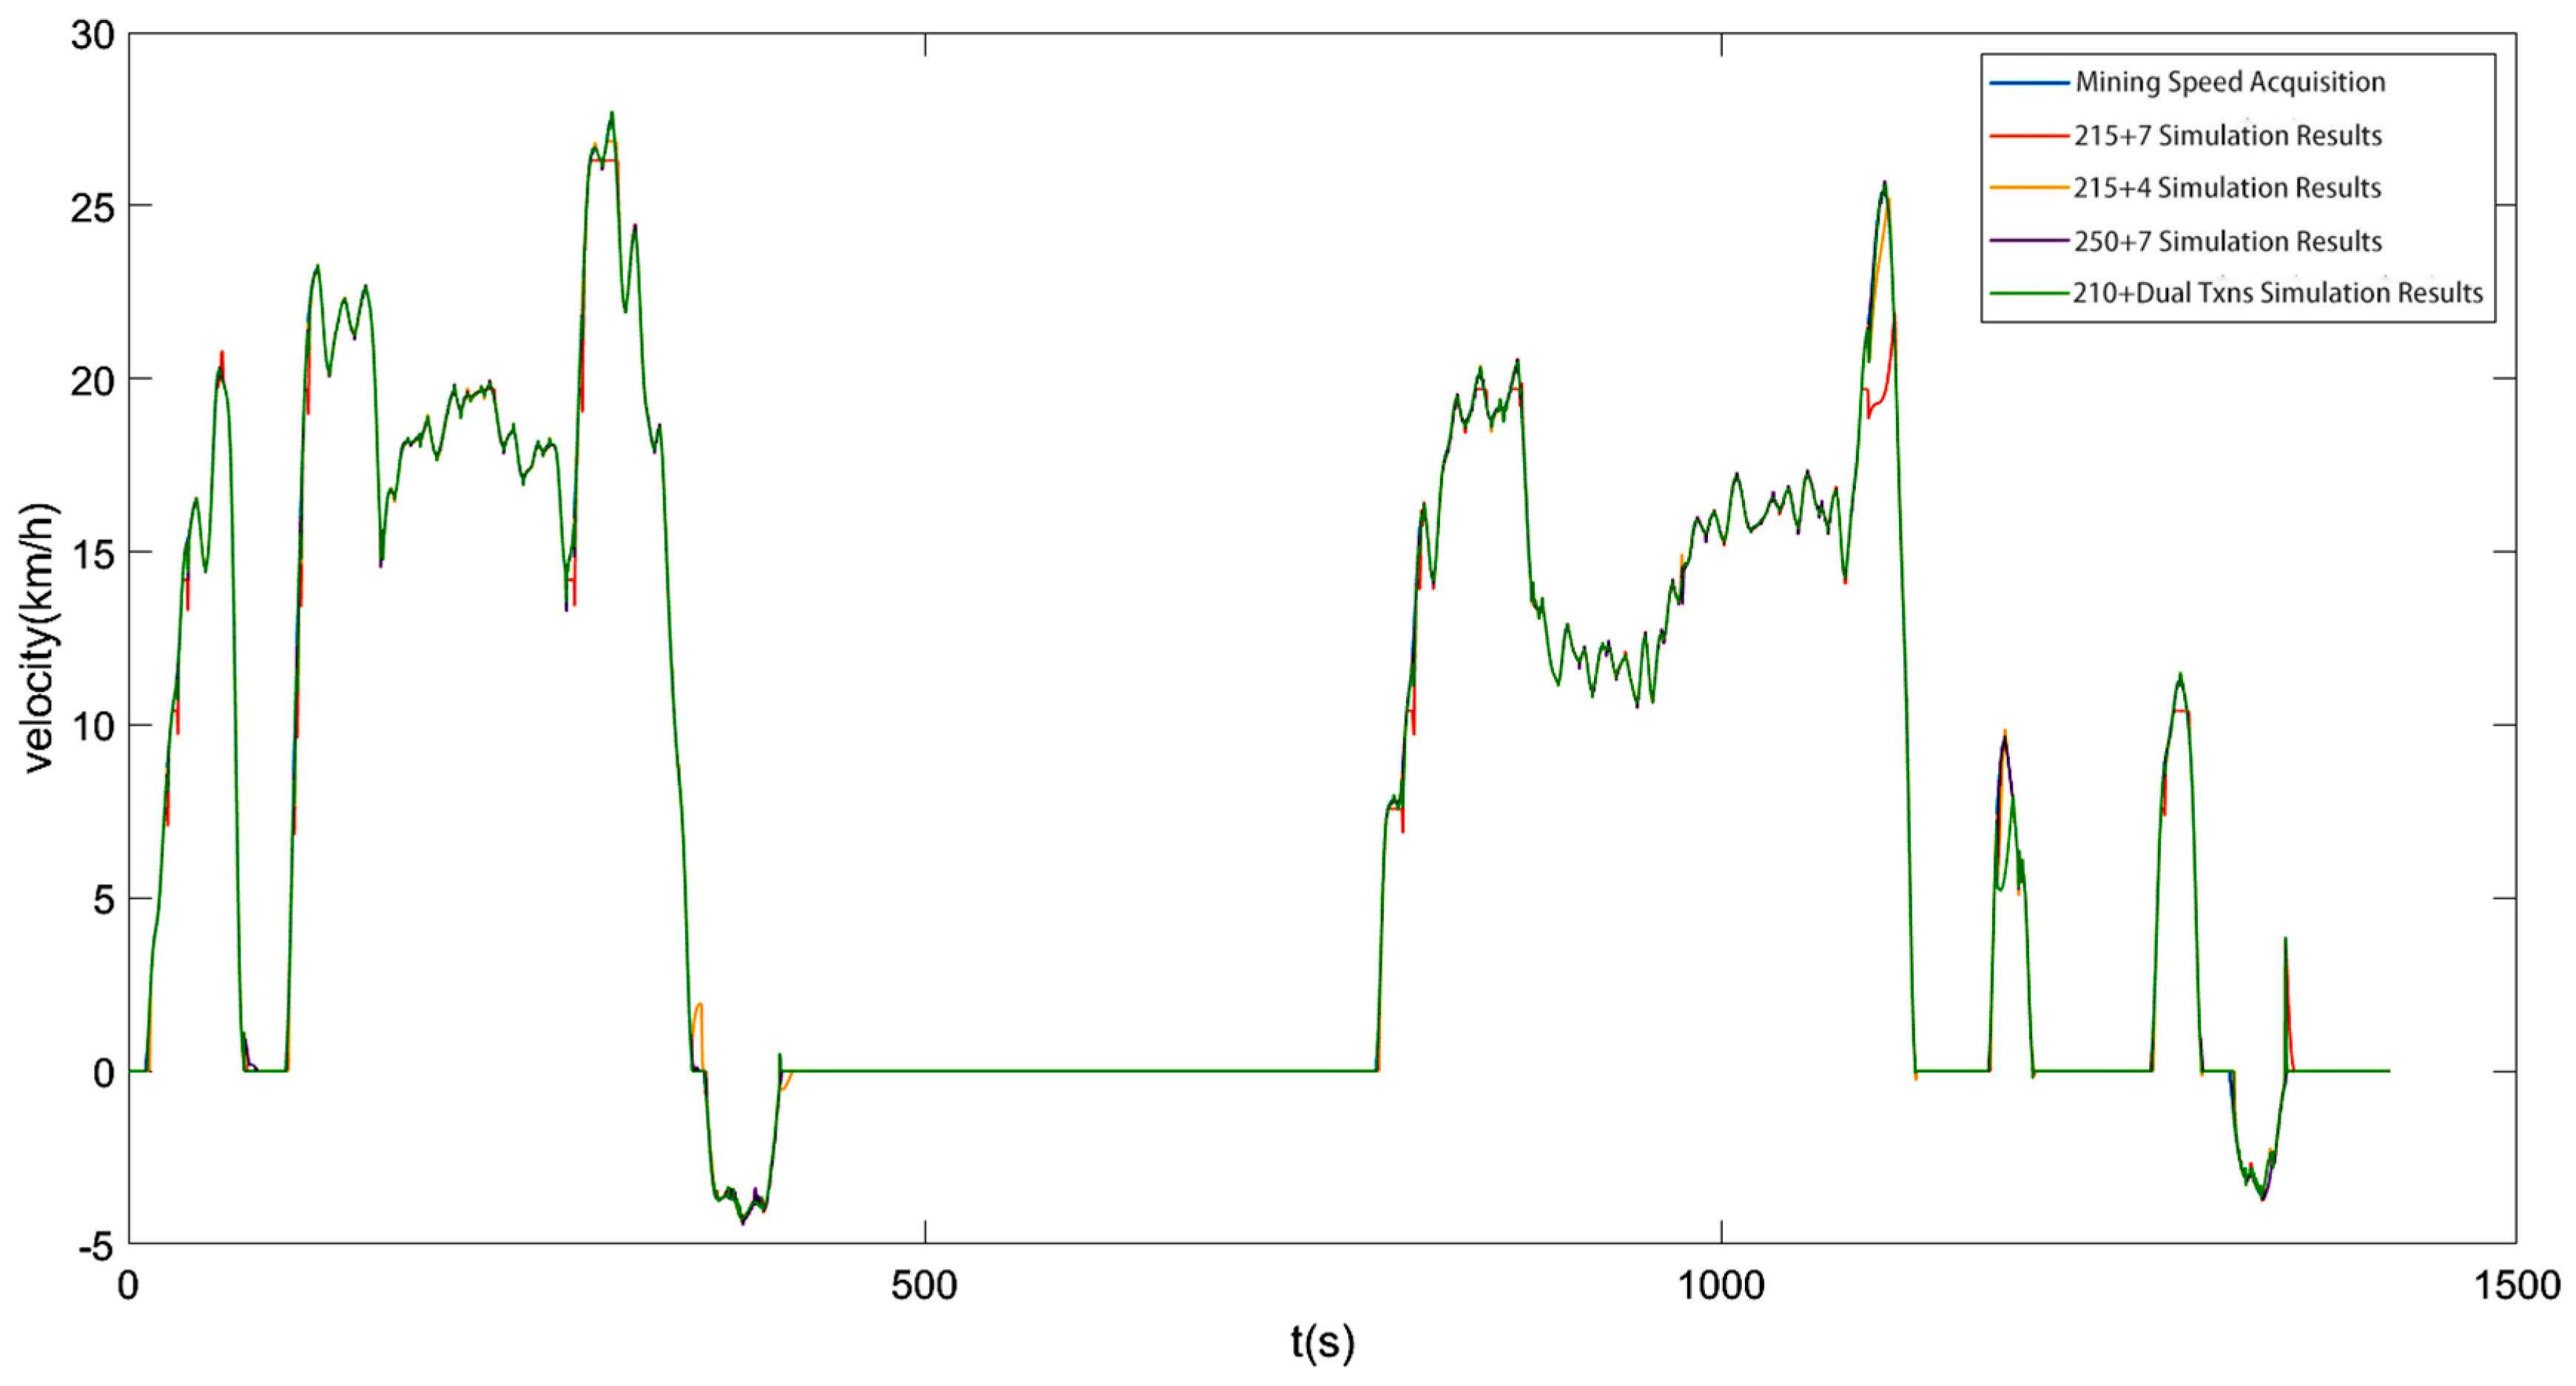
4.3. Operating Performance Under Typical Working Conditions
5. Conclusions
- (1)
- Power system configuration: the 250 kW dual-motor + seven-speed transmission configuration can provide a maximum torque output of 267 kNm under extreme working conditions, and the comprehensive efficiency of the system reaches more than 92%, which meets the demanding needs of mine transportation. Through the energy optimization strategy, the dual motors work together in low-speed climbing and high-speed transport conditions to improve the efficiency of the whole working conditions by 8.3%.
- (2)
- Control strategy effectiveness: the torque allocation algorithm, based on working condition identification, realizes the symmetry of the torque allocation of dual motors (error < 5%); the speed tracking error is controlled within 2% and the response time is <100 ms. The downhill braking energy recovery efficiency reaches 85%, and the comprehensive power consumption is reduced to 4.75 kWh/km, which is 83% in energy savings compared with that of diesel vehicles.
- (3)
- Economy verification: The full life cycle cost analysis shows that the comprehensive cost of the electric mining truck is USD 5.34/km, 38% lower than a diesel vehicle, and the payback period is 2.7 years. The energy recovery system contributes 68% in energy savings in the round-trip working condition, which further validates the economic feasibility of the system.
Author Contributions
Funding
Data Availability Statement
Conflicts of Interest
References
- Alika, R.; Mellouli, E.M.; Tissir, E.H. Adaptive Cruise Control of the Autonomous Vehicle Based on Sliding Mode Controller Using Arduino and Ultrasonic Sensor. J. Robot. Control JRC 2024, 5, 301–311. [Google Scholar]
- Baby, T.V.; HomChaudhuri, B. An Energy-Efficient Merge-Aware Cruise Control Method for Connected Electric Vehicles. SAE Int. J. Electrified Veh. 2024, 13, 125–135. [Google Scholar]
- Bai, J.; Lee, J.; Mao, S. Effects of Adaptive Cruise Control System on Traffic Flow and Safety Considering Various Combinations of Front Truck and Rear Passenger Car Situations. Transp. Res. Rec. 2024, 2678, 1009–1028. [Google Scholar]
- Qiao, X.; Zheng, L.; Li, Y.; Zhang, Z.; Zeng, J.; Zheng, H. A Novel Stochastic Model Predictive Control Considering Predictable Disturbance with Application to Personalized Adaptive Cruise Control. Int. J. Control Autom. Syst. 2024, 22, 446–459. [Google Scholar]
- Hong, J.; Luo, X.; Wu, H.; Na, X.; Chu, H.; Gao, B.; Chen, H. Energy-Saving Driving Assistance System Integrated with Predictive Cruise Control for Electric Vehicles. IEEE Trans. Intell. Veh. 2024, 9, 4518–4528. [Google Scholar]
- Kavas-Torris, O.; Guvenc, L. Modelling and Analysis of a Cooperative Adaptive Cruise Control (CACC) Algorithm for Fuel Economy. In R. SAE Technical Paper; SAE International: Warrendale, PA, USA, 2024. [Google Scholar]
- Yan, Y.; Zheng, H. Enhancing Lateral Stability in Adaptive Cruise Control: A TS Fuzzy Model-Based Strategy. In R. SAE Technical Paper; SAE International: Warrendale, PA, USA, 2024. [Google Scholar]
- Chen, Q.; Gan, L.; Jiang, Z.; Xu, Z.; Zhang, X. Study on multi-objective adaptive cruise control of intelligent vehicle based on multi-mode switching. Proc. Inst. Mech. Eng. Part D J. Automob. Eng. 2024, 238, 4505–4517. [Google Scholar]
- Ragavendran, R.; Kumar, M.; Bhavan, C. Modelling, Simulation and Virtual validation of Adaptive Cruise Control (ACC) Algorithm based on Sensor Fusion. In Proceedings of the First International Conference on Science, Engineering and Technology Practices for Sustainable Devel-opment, ICSETPSD, Coimbatore, India, 17–18 November 2023. [Google Scholar]
- Yang, F.; Li, H.; Lv, M.; Hu, J.; Zhou, Q.; Ghosh, B.K. Enhancing Safety in Nonlinear Systems: Design and Stability Analysis of Adaptive Cruise Control. arXiv 2024, arXiv:2401.11961v1. [Google Scholar]
- Bekiaris-Liberis, N. Nonlinear predictor-feedback cooperative adaptive cruise control of vehicles with nonlinear dynamics and input delay. Int. J. Robust Nonlinear Control 2024, 34, 6683–6698. [Google Scholar]
- Yang, M.; Rawoof, M.B.M.; Kan, X.D. Modeling Commercial Adaptive Cruise Control (ACC) on Multi-Lane Facilities by Incorporating Receiving-Lane-Change Car-Following. In Proceedings of the 2024 IEEE 27th International Conference on Intelligent Transportation Systems (ITSC), Edmonton, AB, Canada, 24–27 September 2024. [Google Scholar]
- Izci, D.; Rizk-Allah, R.M.; Ekinci, S.; Hussien, A.G. Enhancing time-domain performance of vehicle cruise control system by using a multi-strategy improved RUN optimizer. Alex. Eng. J. 2023, 80, 609–622. [Google Scholar]
- Ekinci, S.; Izci, D.; Abualigah, L. Revolutionizing vehicle cruise control: An elite opposition-based pattern search mechanism augmented INFO algorithm for enhanced controller design. Int. J. Comput. Intell. Syst. 2023, 16, 129. [Google Scholar]
- Wang, Q.; Dong, H.; Ju, F. Adaptive leading cruise control in mixed traffic considering human behavioral diversity. IEEE Trans. Intell. Transp. Syst. 2023, 25, 5059–5070. [Google Scholar]
- Wei, P.; Zeng, Y.; Ouyang, W.; Zhou, J. Multi-sensor environmental perception and adaptive cruise control of intelligent vehicles using kalman filter. IEEE Trans. Intell. Transp. Syst. 2023, 25, 3098–3107. [Google Scholar]
- Polverino, P.; Adinolfi, E.A.; Pianese, C. Target speed computation through predictive cruise control for vehicles energy consumption reduction. Energy Convers. Manag. 2023, 298, 117757. [Google Scholar]
- Mosharafian, S.; Velni, J.M. A hybrid stochastic model predictive design approach for cooperative adaptive cruise control in connected vehicle applications. Control Eng. Pract. 2023, 130, 105383. [Google Scholar]
- Gao, H.; Zhang, X.; Zeng, X. Predictive cruise control for hybrid electric vehicles based on hierarchical convex optimization. Energy Convers. Manag. 2024, 299, 117883. [Google Scholar]
- Ren, P.; Jiang, H.; Xu, X. Research on a Cooperative Adaptive Cruise Control (CACC) Algorithm Based on Frenet Frame with Lateral and Longitudinal Directions. Sensors 2023, 23, 1888. [Google Scholar] [CrossRef] [PubMed]
- Basargan, H.; Mihály, A.; Gáspár, P. Intelligent road-adaptive semi-active suspension and integrated cruise control. Machines 2023, 11, 204. [Google Scholar] [CrossRef]
- Chu, L.; Li, H.; Xu, Y. Research on Longitudinal Control Algorithm of Adaptive Cruise Control System for Pure Electric Vehicles. World Electr. Veh. J. 2023, 14, 32. [Google Scholar] [CrossRef]
- Flores, C.; Spring, J.; Nelson, D. Enabling cooperative adaptive cruise control on strings of vehicles with heterogeneous dynamics and powertrains. Veh. Syst. Dyn. 2023, 61, 128–149. [Google Scholar]
- Zhang, R.; Wu, N.; Wang, Z.; Li, K.; Song, Z.; Chang, Z.; Chen, X.; Yu, F. Constrained hybrid optimal model predictive control for intelligent electric vehicle adaptive cruise using energy storage management strategy. J. Energy Storage 2023, 65, 107383. [Google Scholar]
- Shang, M.; Wang, S.; Stern, R. A Two-Condition Continuous Asymmetric Car-Following Model for Adaptive Cruise Control Vehicles. IEEE Trans. Intell. Veh. 2024, 9, 3975–3985. [Google Scholar]
- Li, J.; Chen, C.; Yang, B. Energy-Efficient Cooperative Adaptive Cruise Control for Electric Vehicle Platooning. IEEE Trans. Intell. Transp. Syst. 2023, 25, 4862–4875. [Google Scholar]
- Filabadi, M.M.; Hashemi, E. Distributed Robust Control Framework for Adaptive Cruise Control Systems. In Proceedings of the American Control Conference (ACC), San Diego, CA, USA, 31 May–2 June 2023; IEEE: Piscataway, NJ, USA, 2023; pp. 3215–3220. [Google Scholar]
- Wu, D.; Qiao, B.; Du, C. Multi-objective dynamic coordinated Adaptive Cruise Control for intelligent electric vehicle with sensors fusion. Mech. Syst. Signal Process. 2024, 209, 111125. [Google Scholar]
- Zare, A.; Shang, M.; Kan, X.D. Modeling Car-Following Behavior of Electric Adaptive Cruise Control Vehicles Using Experimental Testbed Data. In Proceedings of the IEEE 26th International Conference on Intelligent Transportation Systems (ITSC), Bilbao, Spain, 24–28 September 2023; IEEE: Piscataway, NJ, USA, 2023; pp. 5585–5590. [Google Scholar]
- Theodosis, D.; Karafyllis, I.; Papageorgiou, M. Cruise controllers for lane-free ring-roads based on control Lyapunov functions. J. Frankl. Inst. 2023, 360, 6131–6161. [Google Scholar]
- Lin, J.; Li, Y.; Xiao, H. Predictive Cruise Cloud Control Scheme Design on Notable Vehicles—Under the Perspective of Cyber-Physical Systems. IEEE Trans. Intell. Transp. Syst. 2023, 25, 6796–6810. [Google Scholar]
- Qin, Y.; Wang, H. Stabilizing mixed cooperative adaptive cruise control traffic flow to balance capacity using car-following model. J. Intell. Transp. Syst. 2023, 27, 57–79. [Google Scholar]
- Ampountolas, K. The Unscented Kalman Filter for Nonlinear Parameter Identification of Adaptive Cruise Control Systems. IEEE Trans. Intell. Veh. 2023, 8, 4094–4104. [Google Scholar]
- Tian, G.; Zhang, L.; Fathollahi-Fard, A.M.; Kang, Q.; Li, Z.; Wong, K.Y. Addressing a Collaborative Maintenance Planning Using Multiple Operators by a Multi-Objective Metaheuristic Algorithm. IEEE Trans. Autom. Sci. Eng. 2023, 22, 606–618. [Google Scholar]
- Wang, J.; Pan, C.; Li, Z. Coordinated adaptive cruise control with integration of driving behaviors based on prediction for surrounding vehicles status. Proc. Inst. Mech. Eng. Part D J. Automob. Eng. 2023, 239, 09544070231213782. [Google Scholar]
- Pan, C.F.; Li, Y.; Huang, A.B. Energy-optimized adaptive cruise control strategy design at intersection for electric vehicles based on speed planning. Sci. China Technol. Sci. 2023, 66, 3504–3521. [Google Scholar]
- Klingbeil, X.; Wegener, M.; Zhou, H. Centralized model-predictive cooperative and adaptive cruise control of automated vehicle platoons in urban traffic environments. IET Intell. Transp. Syst. 2023, 17, 2154–2170. [Google Scholar]
- Tian, G.D.; Sheng, H.W.; Zhang, L.L.; Zhang, H.H.; Fathollahi-Fard, A.M.; Zhang, X.; Feng, Y. Enhancing End-of-Life Product Recyclability through Modular Design and Social Engineering Optimiser. Int. J. Prod. Res. 2024, 1–19. [Google Scholar]
- Zhang, H.H.; Huang, G.W.; Tian, G.D.; Wang, W.J.; Li, J.W. A hybrid QFD-based human-centric decision making approach of disassembly schemes under interval 2-tuple q-rung orthopair fuzzy sets. IEEE Trans. Autom. Sci. Eng. 2023, 22, 724–735. [Google Scholar]


| Variable | Description | Unit |
|---|---|---|
| Horizontal drag in the direction of the ramp | N | |
| Resistance to rolling | N | |
| Resistance to acceleration | N | |
| Resistance to air | N | |
| Wind power | N | |
| Ground adhesion | N | |
| Component force perpendicular to the ramp direction | N | |
| Front axle air lift | N | |
| Rear axle air lift | N | |
| Propulsive force | N | |
| Rear wheel vertical pressure | N | |
| Coefficient of air resistance | —— | |
| Quality conversion factor | —— | |
| Density of air | ||
| Vehicle effective upwind area | m2 | |
| Speed of vehicle | m/s | |
| Roll resistance coefficient of vehicle | —— | |
| Tire adhesion coefficient | —— | |
| Acceleration of vehicle | m/s2 | |
| Gravity of load | N | |
| Dead weight of vehicle | N | |
| Acceleration of gravity | m/s2 | |
| Front axle air lift coefficient | —— | |
| Rear axle air lift coefficient | —— | |
| The wind pressure constant is generally 0.613 | ||
| The wind speed, 12.5 m/s, is equivalent to a class 6 wind | m/s | |
| Vehicle shape coefficient, generally 1.1 | —— | |
| The vertical height of the vehicle centroid from the ground | m | |
| Horizontal distance between the center of mass of the vehicle and the front axle | m | |
| Horizontal distance between the center of mass of the vehicle and the rear axle | m | |
| Horizontal distance between front and rear axes | m |
| Variables | Description | Numerical Value | Unit |
|---|---|---|---|
| Vehicle no-load mass | 43,000 | kg | |
| Rated load quality | 73,000 | kg | |
| Density of air | 1.2258 | ||
| Vehicle effective upwind area | 16 | m2 | |
| Rotate the mass conversion factor | 1.1 | —— | |
| Coefficient of air resistance | 0.8 | —— | |
| Roll resistance coefficient of vehicle | 0.02 | —— | |
| Tire adhesion coefficient | 0.7 | —— | |
| Acceleration of gravity | 9.8 | m/s2 | |
| Front axle air lift coefficient | 0.13 | —— | |
| Rear axle air lift coefficient | 0.2 | —— | |
| Wind pressure constant | 0.613 | ||
| Wind speed | 12.5 | m/s | |
| Vehicle shape factor | 1.1 | —— | |
| Tire static/dynamic radius | 695/737 | mm | |
| The vertical height of the vehicle centroid from the ground | 2210 | mm | |
| Horizontal distance between the center of mass of the vehicle and the front axle | 4028 | mm | |
| Horizontal distance between the center of mass of the vehicle and the rear axle | 1192 | mm |
| Variable | Description | Number | Unit |
|---|---|---|---|
| Full load maximum speed | 43~55 | km/h | |
| Maximum climbing speed with full load | 2 | km/h | |
| Full load climb 10% slope sustained d maximum speed | >9 | km/h | |
| Full load climb 15% slope sustained maximum speed | >6 | km/h | |
| Maximum climb with full load | 33% | —— | |
| 0 to the maximum velocity acceleration time | 30 | s |
| Working Condition | Typical Working Condition Value | |||||
|---|---|---|---|---|---|---|
| Maximum climb with full load | 267,033.4 | 7.64 | 213.5 | 384.3 | 690.6 | |
| (No wind) | 94,372.4 | 34.4 | 339.5 | 135.8 | 644.6 | |
| Full load constant speed 10% climb | 132,842 | 22.9 | 318.6 | 191.2 | 657.3 | |
| (No wind) | 17,574.5~ 18,094.8 | 155~198 | 284.9~ 375.2 | 23.9~24.6 | 613.8 | |
| Full load constant speed 15% climbing | 20,909~ 25,302.7 | 155~198 | 338.9~ 524.6 | 28.4~ 34.4 | 233.1~ 234.5 | |
| (No wind) | 43,277.2 | 108 | 489.4 | 58.8 | 624.5 | |
| Maximum flat speed with full load | 17,154.6 | 108 | 194 | 23.3 | 614 |
| Condition of Operation | Drive Axle Requirements | |||||
|---|---|---|---|---|---|---|
| Input Speed/rpm | Input Torque/Nm | Input Power/kW | ||||
| Maximum power | 568.63 | 86.0 | 63,156.2 | 1384 | 4173 | 604.4 |
| Maximum torque | 213.5 | 7.64 | 267,033.4 | 123 | 17,644 | 227 |
| Maximum rotational speed | 524.6 | 198 | 25,302.7 | 3185 | 1672 | 557.6 |
| Remarks | The efficiency of drive axle assembly is calculated according to the main minus 0.97 differential 0.97, and the total reduction ratio is calculated according to 16.086. There are no special instructions below; all matches are in accordance with this setting. | |||||
| Design Requirements | Simulation Results | ||||
|---|---|---|---|---|---|
| Project Name | Target | 215 kW/7th gear | 215 kW/4th gear | 250 kW/7th gear | 210 kW/Dual transmission |
| Full load 2 km/h maximum climb | 33% | 35% | 38% | 43.8% | 45% |
| Full load maximum speed km/h | 43~55 | 42.3 | 57 | 57 | 45 |
| Full load climb 10% slope sustained maximum speed km/h | >9 | 10.21 | 13.6 | 13.8 | 15.2 |
| Full load climb 15% slope sustained maximum speed km/h | >6 | 7.43 | 9.8 | 10 | 10.7 |
| The maximum no-load speed is km/h | 43~55 | 42.3 | 57 | 57 | 57 |
| No load maximum speed (43~55) acceleration time s | 30 | 11.1 | 13.7 (7.5~12.6) | 12.6 (7.8~11.5) | 28 (8.5~22.5) |
| Full load 30 km/h Acceleration time s | 30 | 16.7 | 10.7 | 8.9 | 21.8 |
| Simulation Conclusion | The max speed is not satisfied | Satisfied | Satisfied | Satisfied | |
| Condition Serial Number | Discharge of Electricity (kWh) | Charging (kWh) | Single Cycle Power Consumption (kWh) |
|---|---|---|---|
| Rock discharge 1 | 27 | 5 | 22 |
| Rock discharge 2 | 28 | 11 | 17 |
| Rock discharge 3 | 29 | 9 | 20 |
| Rock discharge 4 | 28 | 11 | 17 |
| Average power consumption | 19 | ||
| Type of Working Condition | Dynamic Scaling Factor (α) | Energy Flow Symbols | Response Time (s) | Energy Efficiency Increase (%) |
|---|---|---|---|---|
| Heavy load uphill | 3:1 | ↑↓ (Discharge Dominance) | 0.98 | 82.6 |
| Heavy load downhill | 1:3 | ↓↑ (Charge Dominance) | 1.12 | 84.3 |
| Peak Standard Operating Conditions | 1.5:1 | 2.35 | 76.4 | |
| New Energy High Penetration Period | 2:1 | 1.87 | 79.1 |
| Condition of Operation | Discharge of Electricity (kWh) | Charging (kWh) |
|---|---|---|
| Heavy load downhill | 23.8 | 13.8 |
| Heavy load uphill | 71.4 | 4.6 |
| Comprehensive power consumption under single cycle condition on heavy load uphill | 66.8 kWh | |
| Condition Serial Number | Discharge of Electricity (kWh) | Charging (kWh) | Single Cycle Power Consumption (kWh) |
|---|---|---|---|
| Lower mine 1 | 26 | 13 | 13 |
| Lower mine 2 | 24 | 14 | 10 |
| Lower mine 3 | 24 | 14 | 10 |
| Lower mine 4 | 21 | 14 | 7 |
| Average power consumption | 10 | ||
Disclaimer/Publisher’s Note: The statements, opinions and data contained in all publications are solely those of the individual author(s) and contributor(s) and not of MDPI and/or the editor(s). MDPI and/or the editor(s) disclaim responsibility for any injury to people or property resulting from any ideas, methods, instructions or products referred to in the content. |
© 2025 by the authors. Licensee MDPI, Basel, Switzerland. This article is an open access article distributed under the terms and conditions of the Creative Commons Attribution (CC BY) license (https://creativecommons.org/licenses/by/4.0/).
Share and Cite
Liu, Y.; Liu, C.; Tan, J.; He, Y. Dual-Motor Symmetric Configuration and Powertrain Matching for Pure Electric Mining Dump Trucks. Symmetry 2025, 17, 583. https://doi.org/10.3390/sym17040583
Liu Y, Liu C, Tan J, He Y. Dual-Motor Symmetric Configuration and Powertrain Matching for Pure Electric Mining Dump Trucks. Symmetry. 2025; 17(4):583. https://doi.org/10.3390/sym17040583
Chicago/Turabian StyleLiu, Yingshuai, Chenxing Liu, Jianwei Tan, and Yunli He. 2025. "Dual-Motor Symmetric Configuration and Powertrain Matching for Pure Electric Mining Dump Trucks" Symmetry 17, no. 4: 583. https://doi.org/10.3390/sym17040583
APA StyleLiu, Y., Liu, C., Tan, J., & He, Y. (2025). Dual-Motor Symmetric Configuration and Powertrain Matching for Pure Electric Mining Dump Trucks. Symmetry, 17(4), 583. https://doi.org/10.3390/sym17040583