
A Novel Approach for Cyber Threat Analysis Systems Using BERT Model from Cyber Threat Intelligence Data


Abstract
:1. Introduction
1.1. Research Issues and Motivation
1.2. Main Contributions
- By utilising the existing capabilities of knowledge graphs in the cyber security domain, we demonstrate the structured conversion of raw cyber security data from various sources into an interconnected cyber intelligence network. This contribution provides an infrastructure for better understanding, querying, and analysing cybersecurity data with knowledge graphs.
- Using natural language processing techniques, we improve the process of extracting entities from raw cybersecurity content. By leveraging an ontology to build the relationships between entities, we both make the task of relationship building more meaningful and more clearly reveal insights that traditional methods may miss.
- Our proposed approach provides a comprehensive solution for analysing cyber entities and their relationships using knowledge graphs. This approach provides detailed knowledge of the current and future behaviour of cyber threats, enabling cybersecurity practitioners to effectively predict and identify potential threats.
- By analysing patterns within the knowledge graph, we present a novel approach to predicting future potential targets based on threat actor behaviour. This contribution plays an important role in improving cybersecurity by enabling the prediction of potential targets.
- This contribution aims to enable cyber security professionals to proactively defend against threats they may encounter. In this way, it is envisaged that more accurate decisions will be made in the cyber defence process using actionable cyber intelligence data.
- Finally, by integrating concepts from graph theory, data science, and cybersecurity, our work fosters interdisciplinary collaboration. We highlight the importance of combining expertise from different fields to tackle the complex and multifaceted nature of cyber threats.
2. Related Works
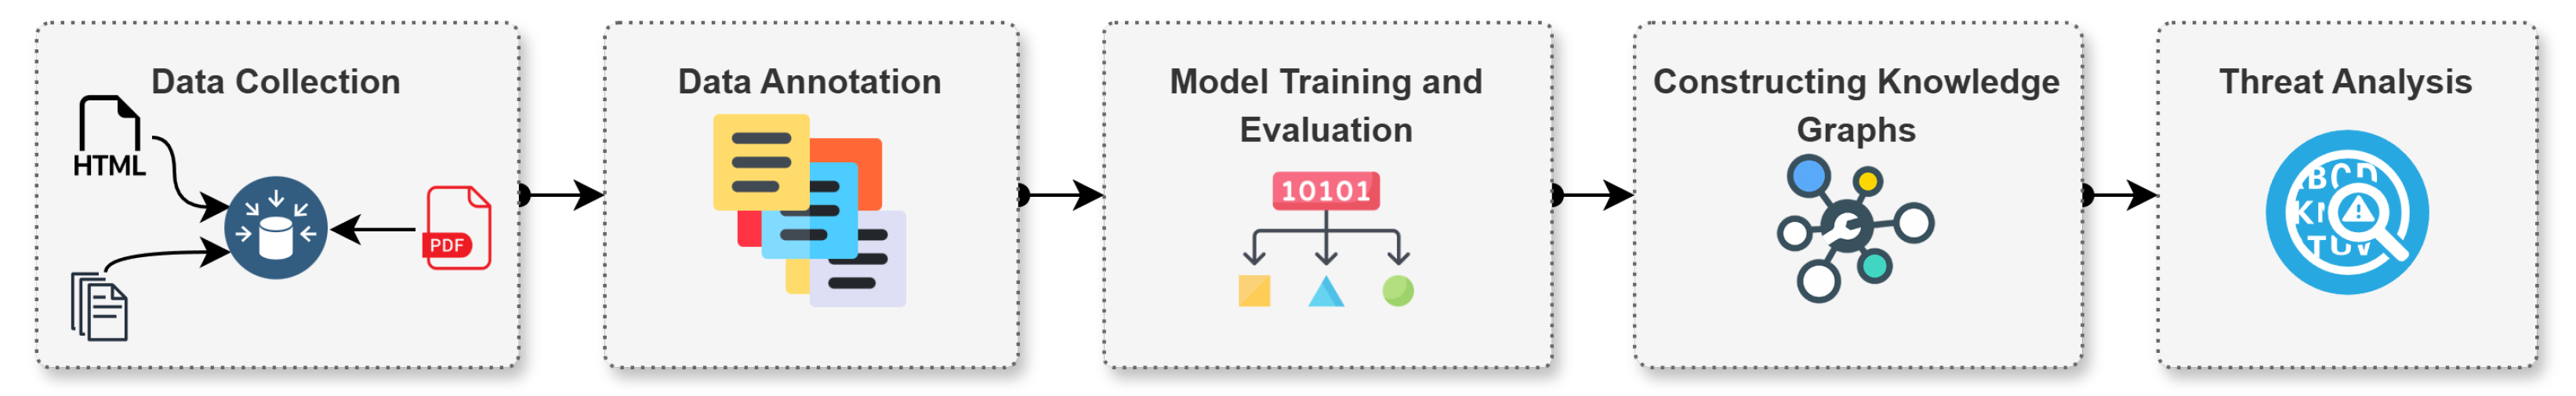
3. Proposed System Architecture and Implementation
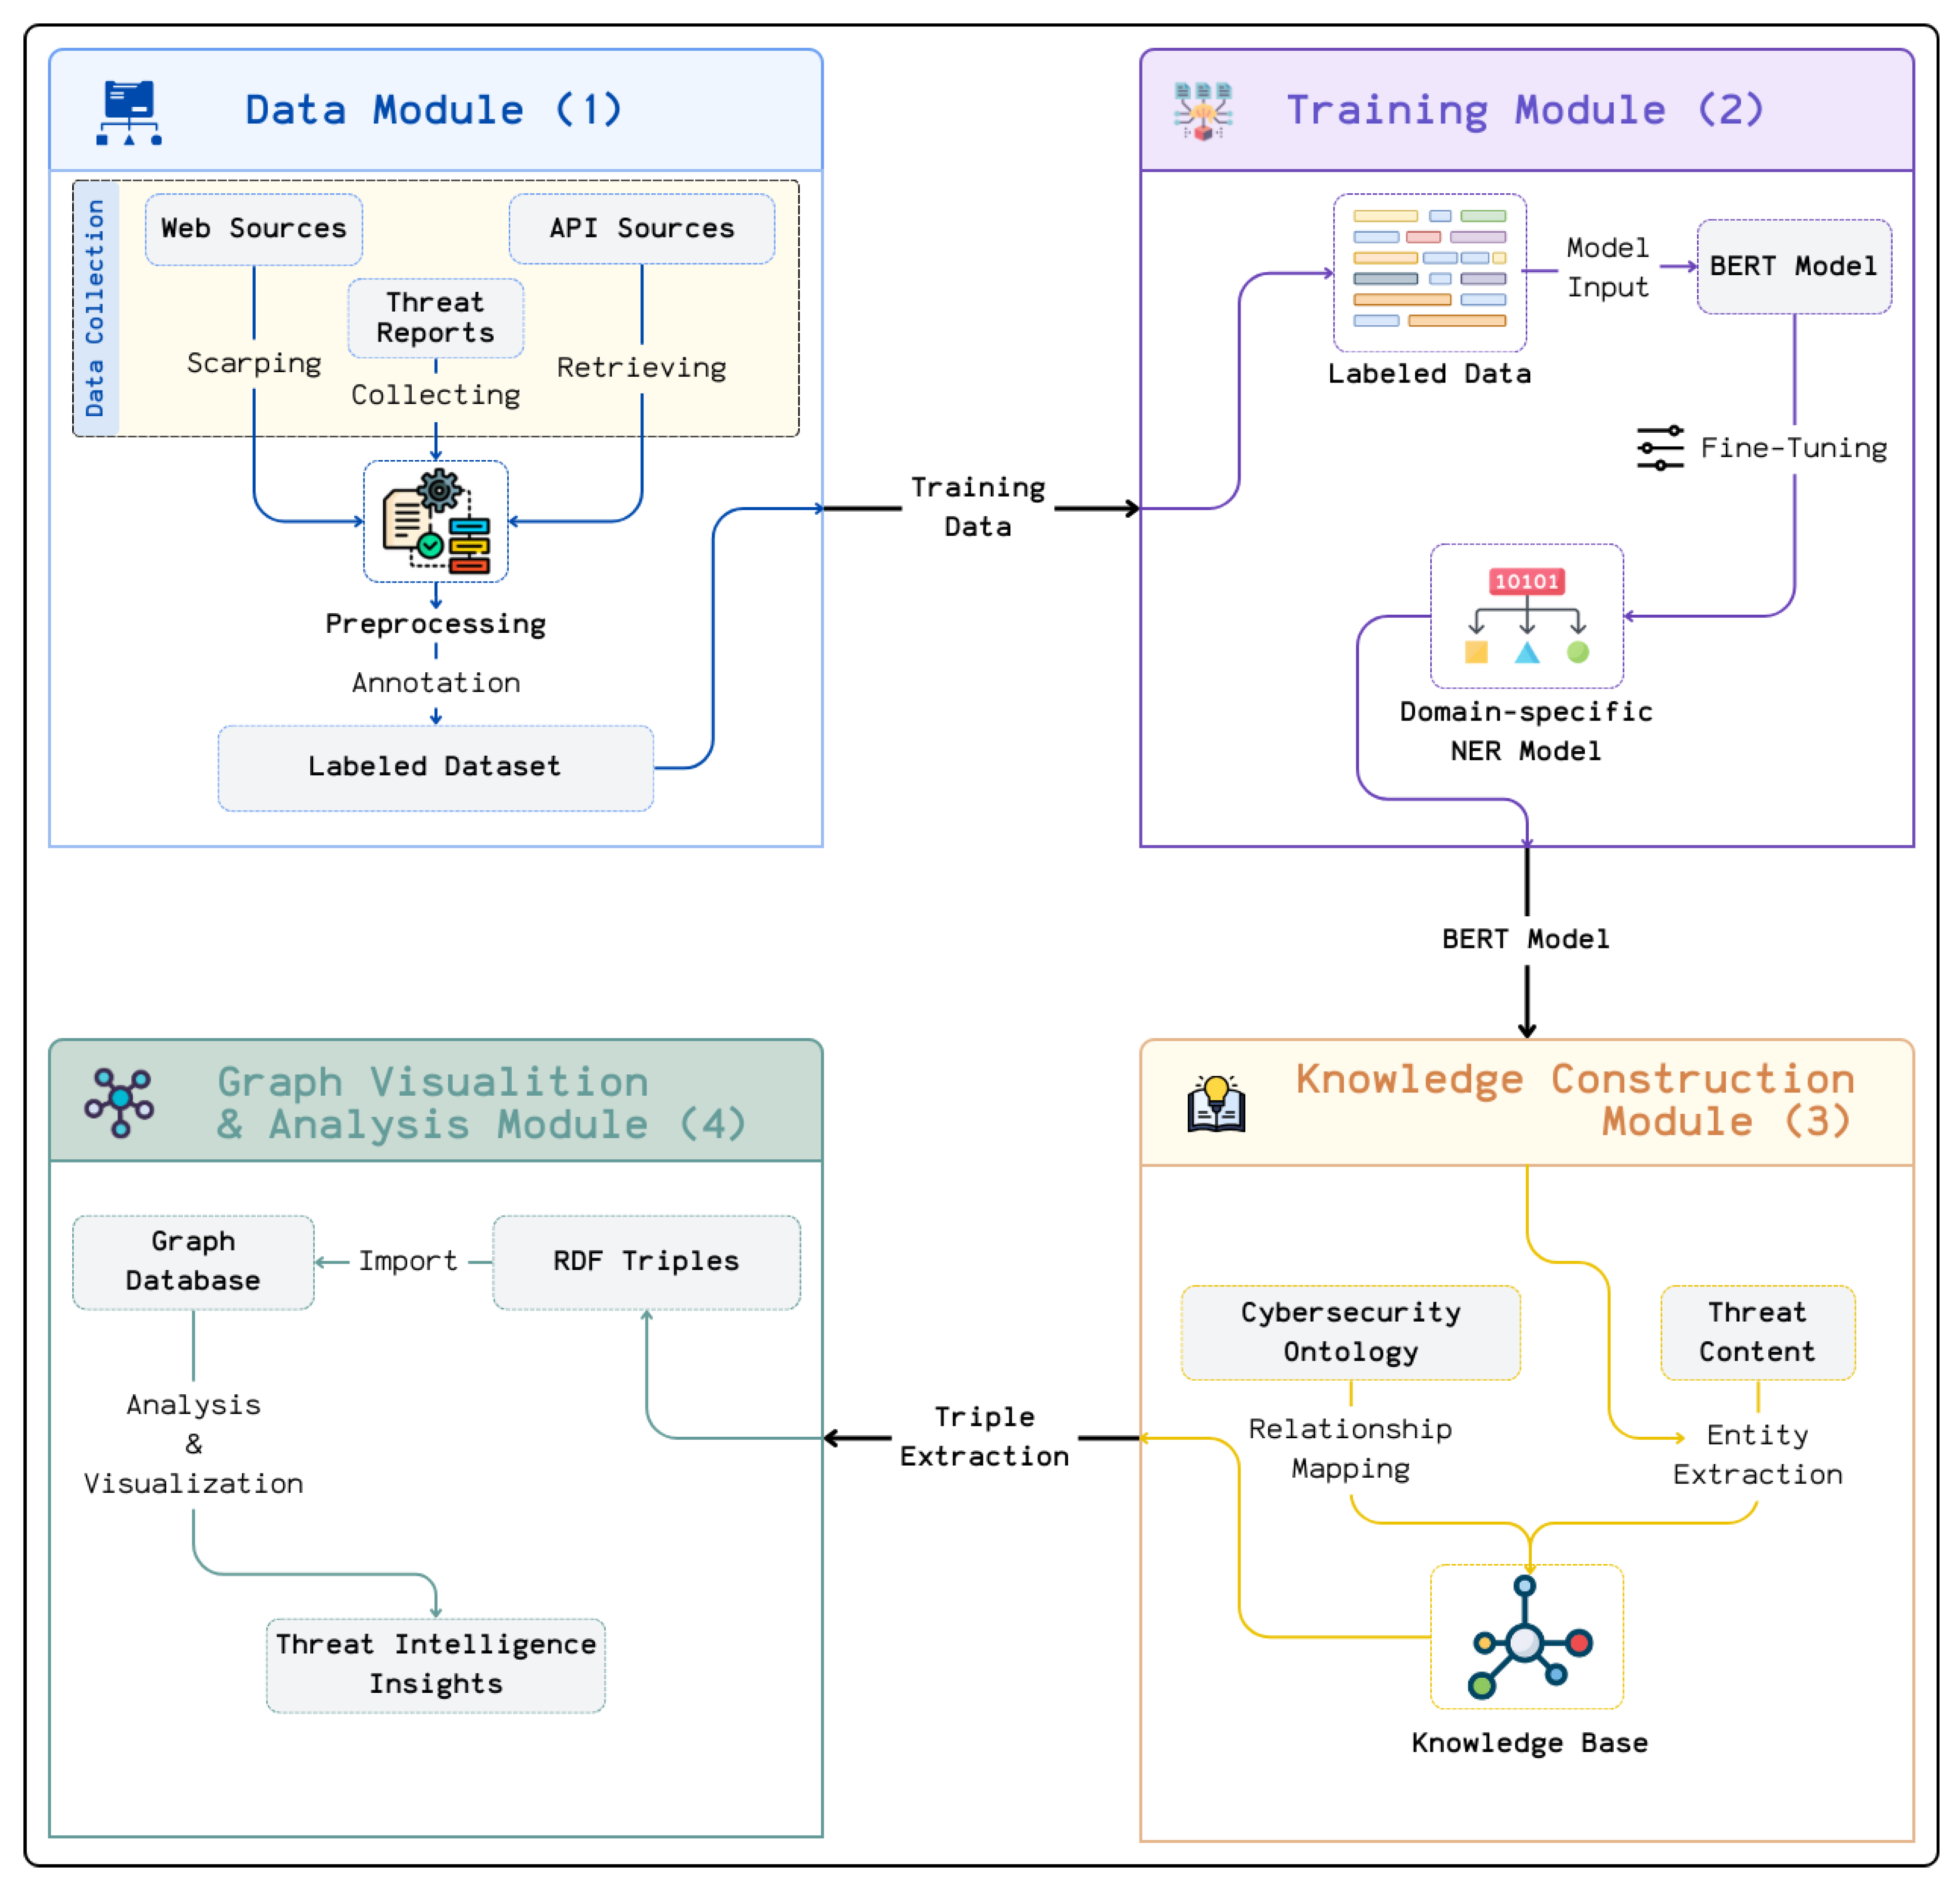
3.1. Data Module
3.1.1. Data Collection
- Web Sources: The data gathered from web sources are text-based content, such as cybersecurity articles and blog posts containing technical information. As these contents are extracted from web pages, the data are in an unstructured format and are extracted using web scraping techniques specific to the page in question [39,40]. A comprehensive preprocessing phase is performed on the raw data collected from web pages to remove unnecessary items such as HTML tags. The preprocessed data are stored in txt format for the next steps.
- Threat Reports: Threat reports are retrieved from a public GitHub repository [41]. The threat reports stored in the relevant GitHub repository are in PDF format, and the repository is regularly updated with new reports. The text content of these PDF files was extracted using the Python library PyPDF2 [42]. These contents were then preprocessed, and the texts were converted into a suitable form. The texts were saved in txt format for later use.
- API Sources: MITRE ATT&CK [43] is a trusted framework that provides structured cyber threat data. The data requested from this source can be accessed with API or Python packages. In this study, malware, threat actor, and campaign lists were retrieved from MITRE ATT&CK to be used in the proposed system using the mitreattack-python [44] package.
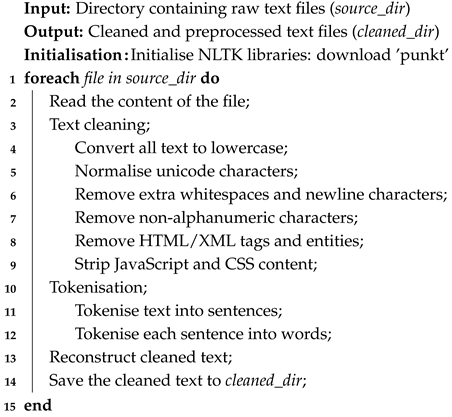
3.1.2. Preprocessing
- Text Cleaning: The text cleaning process includes the removal of irrelevant items to ensure the clarity and consistency of the raw data. In this stage, in order to achieve a certain quality of the dataset used in the following modules, the texts were converted to lower case, unicode characters were normalised, extra spaces and newlines were removed, non-alphanumeric characters such as “!”, “@” or “#” that were not of analytical importance were removed, and HTML and script tags were removed from the texts obtained from web pages. This minimised the noise in the data, improved the quality of the data, and made the data more suitable for the annotation process.
- Tokenisation: Tokenisation is the process of splitting text into small and manageable pieces. At this stage, text is split into sentences and then into words, and analysis is performed at the word level. In natural language processing, the tokenisation stage needs to be effectively implemented in order to perform an effective named entity recognition process. This is because NER systems perform this analysis at the token level when extracting entities from text.
| Algorithm 1: Preprocess text files. |
 |
3.1.3. Data Annotation
- B-Tag (Beginning): Specifies the beginning of an entity in a sequence of tags (e.g., B-ThreatActor for the beginning tag of a ThreatActor entity).
- I-Tag (Inside): Identifies the subsequent tokens within the same asset (e.g., I-ThreatActor for the second token in a threat actor entity).
- O-Tag (Outside): Identifies the tokens that do not belong to any entity.
3.2. Training Module
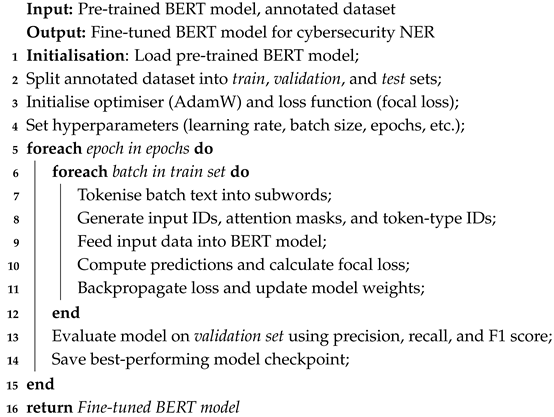
3.2.1. Fine-Tuning BERT Model
- Maximum length: Specifies the maximum length that an input string (e.g., a phrase) can be. This parameter specifies the number of tokens that the model will process for the input. A larger length setting allows the model to capture more context, but increases the computational cost. On the other hand, a smaller length setting may lead to loss of information.
- Batch Size: The batch size parameter specifies the number of examples the model learns at a time during each training step. A model with a high batch size value performs a more stable learning process but also uses more memory. On the other hand, setting this parameter to a low value can reduce memory usage but makes the model’s learning process more unstable.
- Test Size: Specifies the proportion of the dataset to be used for testing. For example, a value of 0.2 indicates that 20% of the data are used for testing.
- Hidden Dropout: This prevents the model from overfitting to the training data by temporarily deactivating the neurons in the hidden layers with a specified probability at each training step.
- Attention Dropout: Specifies the dropout rate applied to the attention mechanisms in the transformer layers. This regularisation helps prevent overfitting in complex models like BERT.
- Learning Rate: This is the parameter setting that controls how much the model’s parameters are updated in each training step. If this rate is set lower, the model performs slower but more stably. On the other hand, setting this rate higher increases the risk of the model exceeding the optimal weights while speeding up the training process.
- Adam Epsilon: A small constant added to the denominator in the Adam optimiser to prevent division by zero. This stabilises updates, particularly when gradients are sparse or small.
- Epoch: Refers to the number of complete passes through the entire training dataset. More epochs provide the model with additional opportunities to learn but may increase the risk of overfitting.
- Maximum Gradient Norm: Limits the magnitude of gradients during backpropagation. Gradient clipping prevents exploding gradients and ensures stable training, particularly in deep models like BERT.
- Warmup Ratio: Specifies the fraction of training steps used to gradually increase the learning rate from zero to its maximum value. This prevents abrupt changes in parameter updates early in training, leading to smoother convergence.
- Weight Decay: The Weight Decay parameter is the parameter that prevents the model from overfitting by preventing the weights from taking on too large values and by decreasing the weights gradually at each step of training so that the model can better adapt to new situations.
- Early Stopping Patience: This is a parameter that stops the training process if there is no improvement during the specified number of epochs while the validation performance of the model is being evaluated. This ensures efficient use of resources and prevents overfitting the model.
- Gradient Accumulation Steps: Accumulates gradients over multiple batches before performing an update. This allows effective training with smaller batch sizes, especially on memory-limited hardware.
- Focal Loss Gamma: Controls the focusing factor in the focal loss formula. A higher gamma value reduces the loss of well-classified examples, allowing the model to focus more on hard-to-classify tokens.
- Focal Loss Alpha: Balances the importance of different classes. A higher alpha value emphasises minority classes, helping to address class imbalance during training.
| Algorithm 2: Fine-tuning BERT for cybersecurity NER. |
 |
3.2.2. Domain-Specific Named Entity Recognition
3.3. Knowledge Construction Module
3.3.1. Entity Extraction Using the Fine-Tuned Model
- ThreatActor: Represents individuals, groups, or organisations involved in malicious activities (e.g., APT28).
- Malware: Refers to malicious software used in attacks, such as ransomware, trojans, or spyware (e.g., Emotet).
- Campaign: Denotes organised efforts by threat actors to achieve specific objectives (e.g., Operation Aurora).
- Target: Identifies sectors, organisations, or systems targeted by campaigns or malware (e.g., financial institutions).
3.3.2. Ontology-Based Relationship Construction
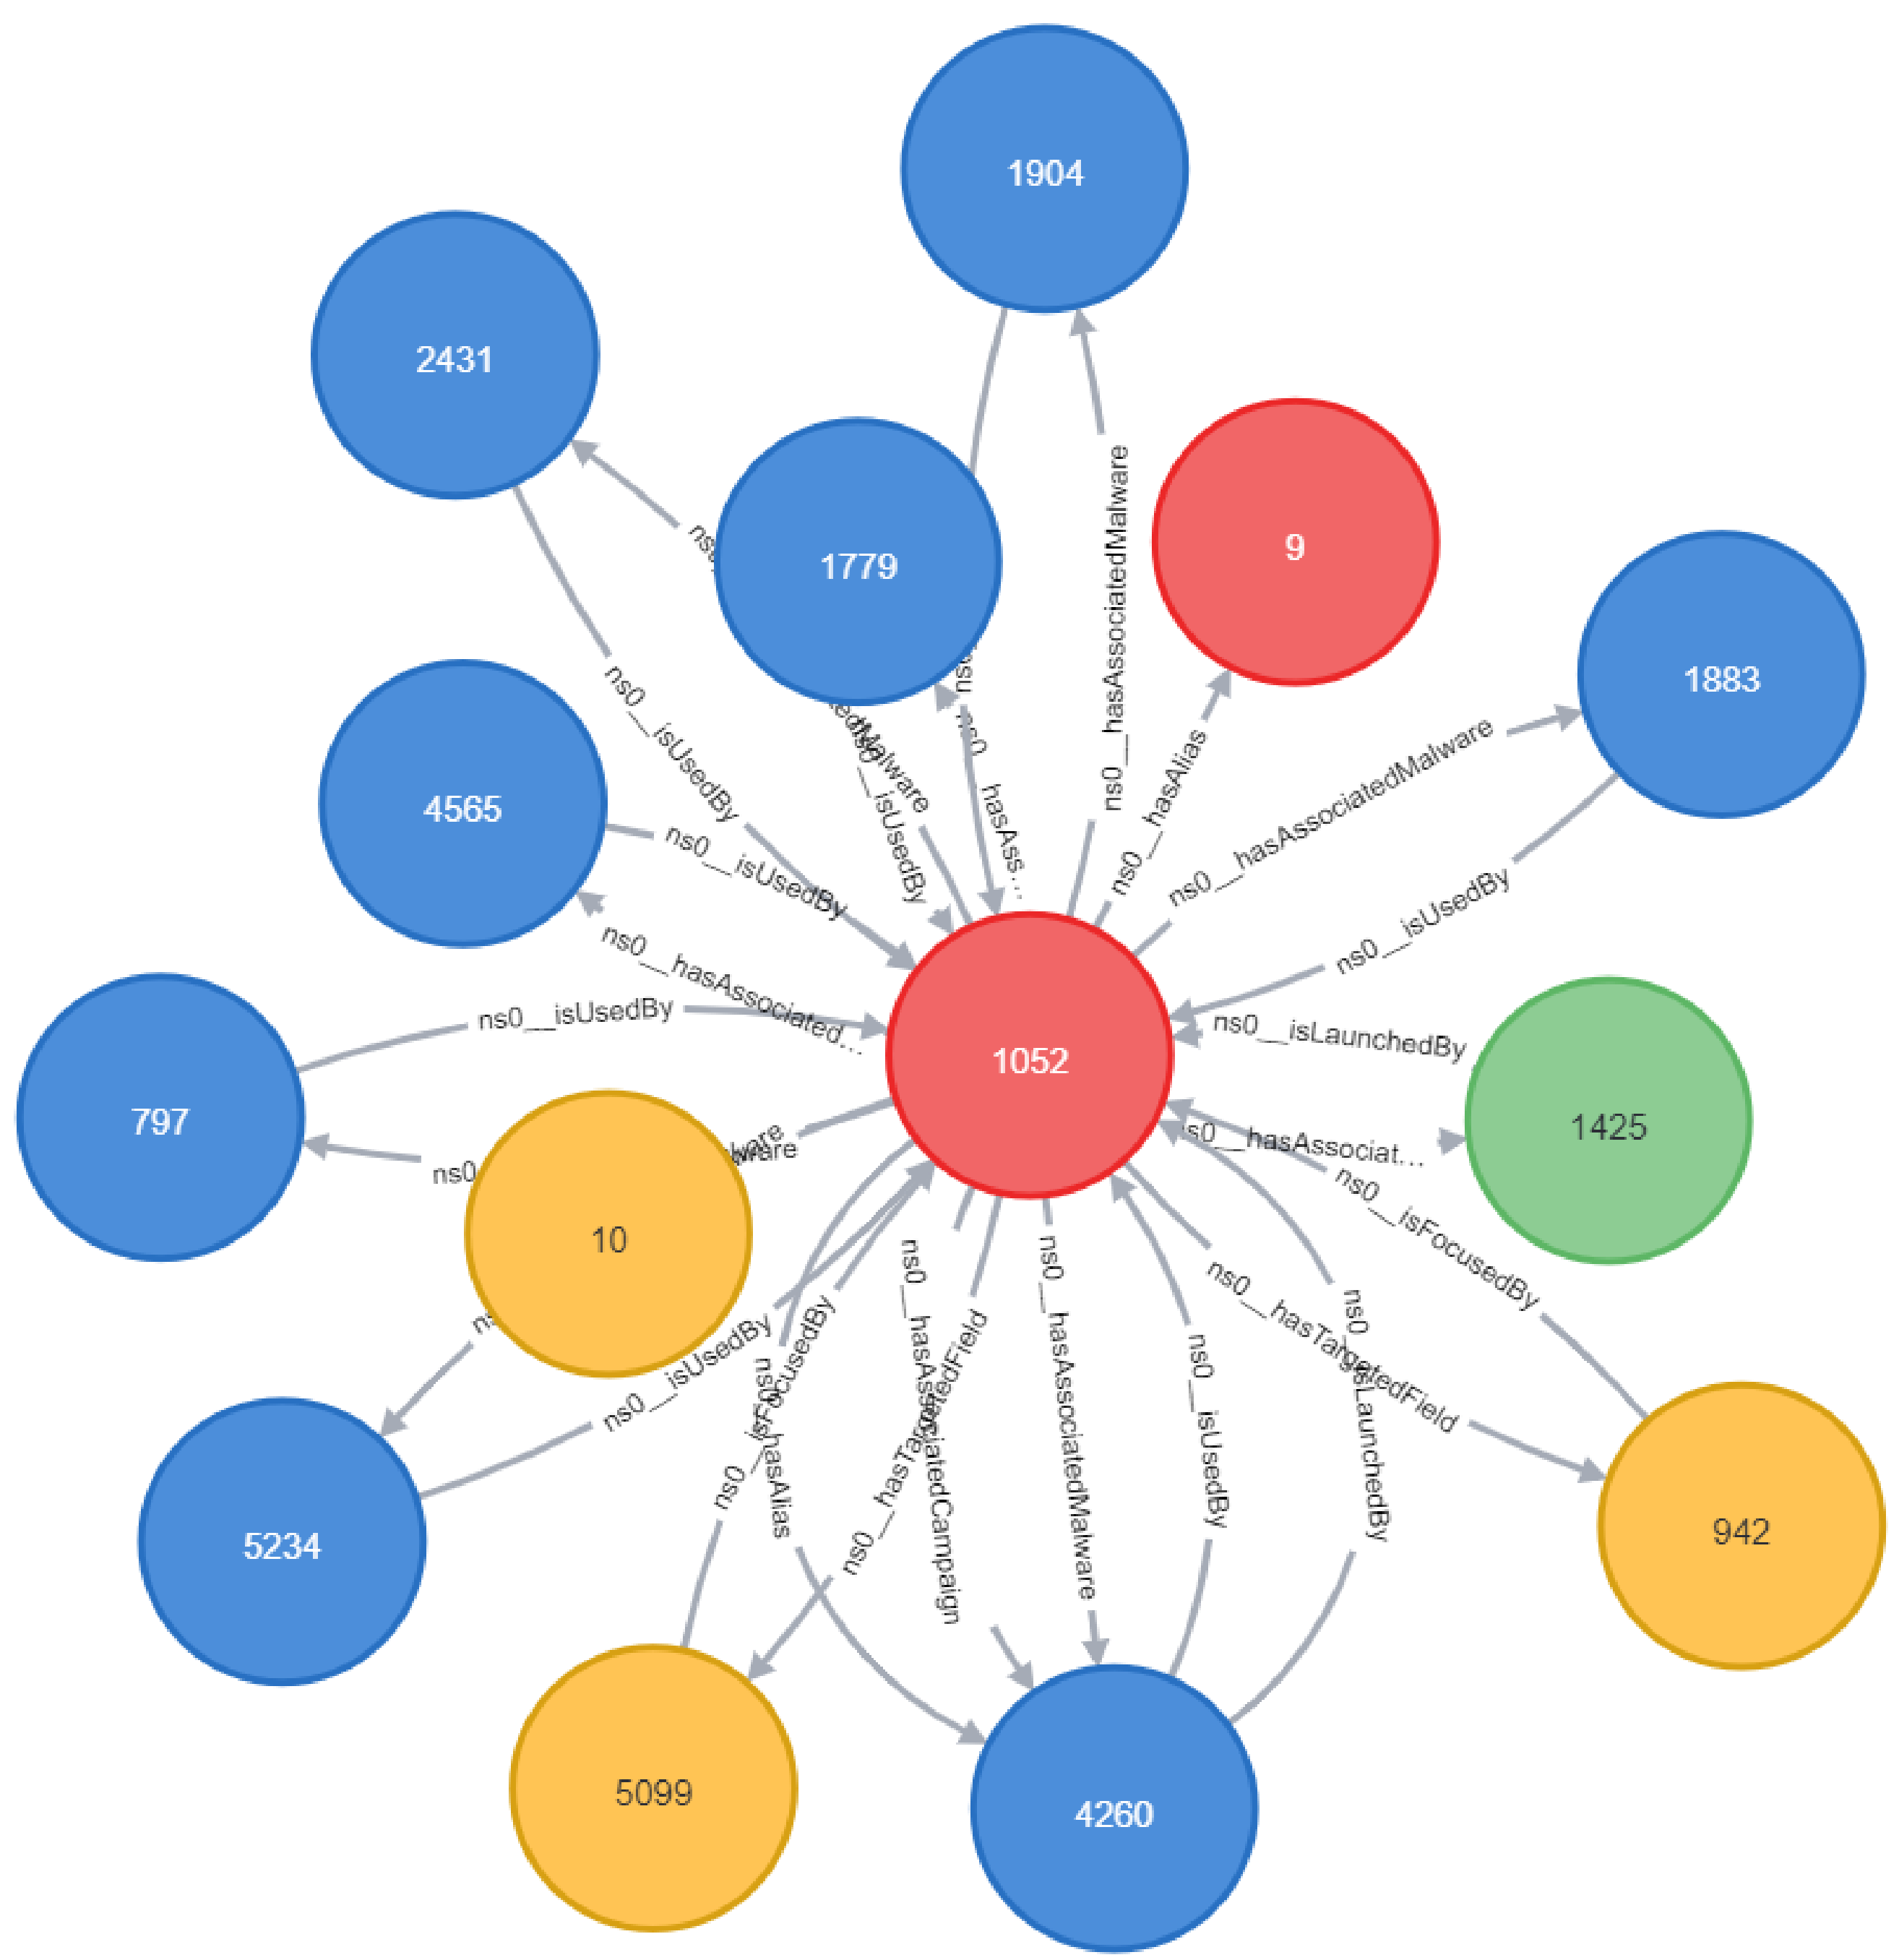
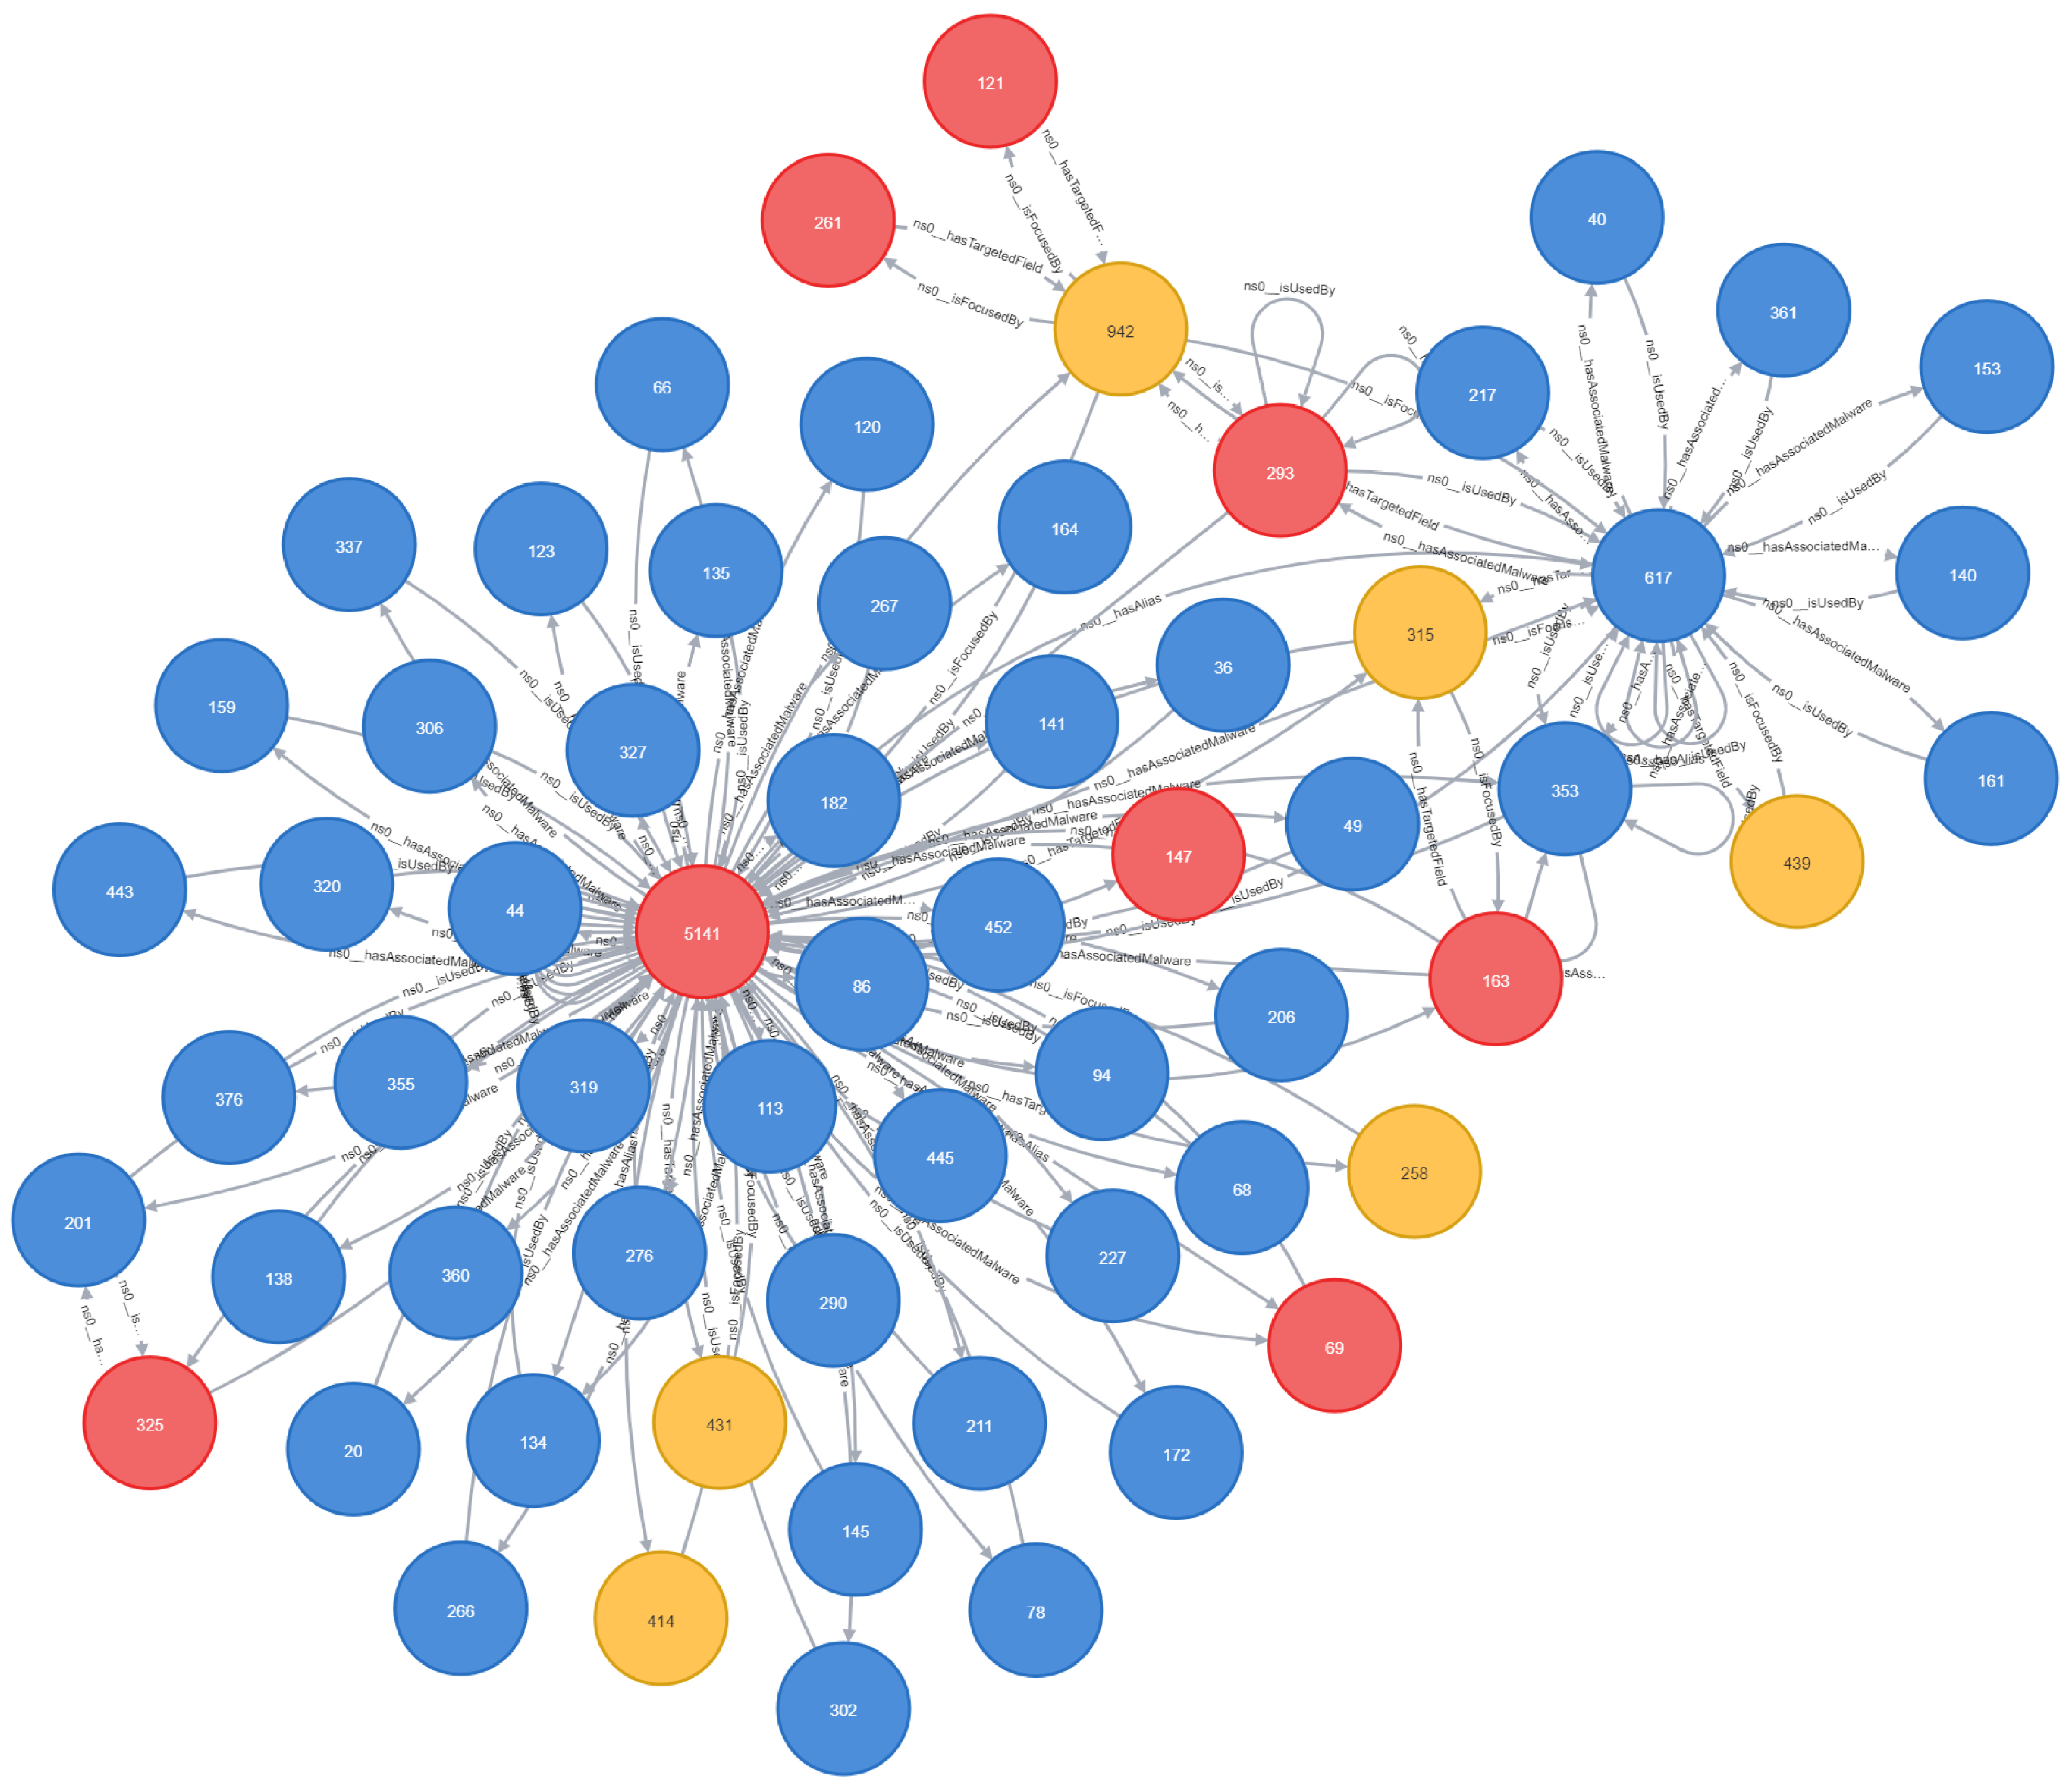
3.3.3. Triple Representation
3.4. Graph Analysis Module
4. Experimental Results
4.1. Training Module Results
4.2. Graph Analysis
4.2.1. PageRank Analysis
4.2.2. Relationship and Target Analysis of Threat Actors
4.2.3. Predictive Analyses
5. Conclusions
Author Contributions
Funding
Data Availability Statement
Acknowledgments
Conflicts of Interest
References
- Demirol, D.; Das, R.; Hanbay, D. A key review on security and privacy of big data: Issues, challenges, and future research directions. Signal Image Video Process. 2022, 17, 1335–1343. [Google Scholar] [CrossRef]
- Lei, J.; Kong, L. Fundamentals of big data in radio astronomy. In Big Data in Astronomy; Kong, L., Huang, T., Zhu, Y., Yu, S., Eds.; Elsevier: Amsterdam, The Netherlands, 2020; pp. 29–58. [Google Scholar] [CrossRef]
- Gantz, J.; Reinsel, D. Extracting value from chaos. IDC IVIEW 2011, 1142, 1–12. [Google Scholar]
- Ahmetoglu, H.; Das, R. A comprehensive review on detection of cyber-attacks: Data sets, methods, challenges, and future research directions. Internet Things 2022, 20, 100615. [Google Scholar] [CrossRef]
- Zhou, Y.; Tang, Y.; Yi, M.; Xi, C.; Lu, H. CTI View: APT Threat Intelligence Analysis System. Secur. Commun. Netw. 2022, 2022, 9875199. [Google Scholar] [CrossRef]
- Piplai, A.; Mittal, S.; Joshi, A.; Finin, T.; Holt, J.; Zak, R. Creating Cybersecurity Knowledge Graphs From Malware After Action Reports. IEEE Access 2020, 8, 211691–211703. [Google Scholar] [CrossRef]
- Sarhan, I.; Spruit, M. Open-CyKG: An Open Cyber Threat Intelligence Knowledge Graph. Knowl.-Based Syst. 2021, 233, 107524. [Google Scholar] [CrossRef]
- Meta. ThreatExchange: A Threat Intelligence Sharing Platform. 2024. Available online: https://developers.facebook.com/products/threat-exchange/ (accessed on 13 December 2023).
- Symantec. Symantec Enterprise Blogs-Threat Intelligence. Available online: https://symantec-enterprise-blogs.security.com/blogs/threat-intelligence (accessed on 25 January 2023).
- Sean, B. Standardising Cyber Threat Intelligence Information with the Structured Threat Information eXpression. 2014. Available online: https://stixproject.github.io/about/STIX_Whitepaper_v1.1.pdf (accessed on 25 January 2023).
- MITRE. MAEC-Malware Attribute Enumeration and Characterization. 2022. Available online: https://maecproject.github.io/ (accessed on 25 January 2023).
- Husari, G.; Al-Shaer, E.; Ahmed, M.; Chu, B.; Niu, X. TTPDrill: Automatic and Accurate Extraction of Threat Actions from Unstructured Text of CTI Sources. In Proceedings of the 33rd Annual Computer Security Applications Conference, Orlando, FL, USA, 4–8 December 2017; pp. 103–115. [Google Scholar] [CrossRef]
- Jones, C.L.; Bridges, R.A.; Huffer, K.M.T.; Goodall, J.R. Towards a Relation Extraction Framework for Cyber-Security Concepts. In Proceedings of the 10th Annual Cyber and Information Security Research Conference, Oak Ridge, TN, USA, 7–9 April 2015; pp. 1–4. [Google Scholar] [CrossRef]
- Alves, F.; Bettini, A.; Ferreira, P.M.; Bessani, A. Processing tweets for cybersecurity threat awareness. Inf. Syst. 2021, 95, 101586. [Google Scholar] [CrossRef]
- Kim, E.; Kim, K.; Shin, D.; Jin, B.; Kim, H. CyTIME: Cyber Threat Intelligence ManagEment framework for automatically generating security rules. In Proceedings of the 13th International Conference on Future Internet Technologies, Seoul, Republic of Korea, 20–22 June 2018; pp. 1–5. [Google Scholar] [CrossRef]
- Zhang, H.; Shen, G.; Guo, C.; Cui, Y.; Jiang, C. EX-Action: Automatically Extracting Threat Actions from Cyber Threat Intelligence Report Based on Multimodal Learning. Secur. Commun. Netw. 2021, 2021, 5586335:1–5586335:12. [Google Scholar] [CrossRef]
- Alam, M.T.; Bhusal, D.; Park, Y.; Rastogi, N. CyNER: A Python Library for Cybersecurity Named Entity Recognition. arXiv 2022, arXiv:2204.05754. [Google Scholar] [CrossRef]
- Zhu, Z.; Dumitras, T. ChainSmith: Automatically Learning the Semantics of Malicious Campaigns by Mining Threat Intelligence Reports. In Proceedings of the 2018 IEEE European Symposium on Security and Privacy (EuroS&P), London, UK, 24–26 April 2018; pp. 458–472. [Google Scholar] [CrossRef]
- Ahmetoglu, H.; Das, R. Analysis of Feature Selection Approaches in Large Scale Cyber Intelligence Data with Deep Learning. In Proceedings of the 2020 28th Signal Processing and Communications Applications Conference (SIU), Gaziantep, Turkey, 5–7 October 2020; pp. 1–4. [Google Scholar] [CrossRef]
- Noor, U.; Anwar, Z.; Amjad, T.; Choo, K.K.R. A machine learning-based FinTech cyber threat attribution framework using high-level indicators of compromise. Future Gener. Comput. Syst. 2019, 96, 227–242. [Google Scholar] [CrossRef]
- Qin, Y.; Shen, G.; Zhao, W.; Chen, Y.; Yu, M.; Jin, X. A network security entity recognition method based on feature template and CNN-BiLSTM-CRF. Front. Inf. Technol. Electron. Eng. 2019, 20, 872–884. [Google Scholar] [CrossRef]
- Bose, A.; Behzadan, V.; Aguirre, C.; Hsu, W.H. A novel approach for detection and ranking of trendy and emerging cyber threat events in Twitter streams. In Proceedings of the 2019 IEEE/ACM International Conference on Advances in Social Networks Analysis and Mining, Vancouver, BC, Canada, 27–30 August 2019; pp. 871–878. [Google Scholar] [CrossRef]
- Ma, P.; Jiang, B.; Lu, Z.; Li, N.; Jiang, Z. Cybersecurity named entity recognition using bidirectional long short-term memory with conditional random fields. Tsinghua Sci. Technol. 2021, 26, 259–265. [Google Scholar] [CrossRef]
- Kim, D.; Kim, H.K. Automated Dataset Generation System for Collaborative Research of Cyber Threat Analysis. Secur. Commun. Netw. 2019, 2019, 6268476. [Google Scholar] [CrossRef]
- Zhang, H.; Guo, Y.; Li, T. Multifeature Named Entity Recognition in Information Security Based on Adversarial Learning. Secur. Commun. Netw. 2019, 2019, 6417407. [Google Scholar] [CrossRef]
- Georgescu, T.M.; Iancu, B.; Zurini, M. Named-Entity-Recognition-Based Automated System for Diagnosing Cybersecurity Situations in IoT Networks. Sensors 2019, 19, 3380. [Google Scholar] [CrossRef]
- Sun, T.; Yang, P.; Li, M.; Liao, S. An Automatic Generation Approach of the Cyber Threat Intelligence Records Based on Multi-Source Information Fusion. Future Internet 2021, 13, 40. [Google Scholar] [CrossRef]
- Wu, H.; Li, X.; Gao, Y. An Effective Approach of Named Entity Recognition for Cyber Threat Intelligence. In Proceedings of the 2020 IEEE 4th Information Technology, Networking, Electronic and Automation Control Conference (ITNEC), Chongqing, China, 12–14 June 2020; IEEE: New York, NY, USA, 2020; pp. 1370–1374. [Google Scholar] [CrossRef]
- Simran, K.; Sriram, S.; Vinayakumar, R.; Soman, K.P. Deep Learning Approach for Intelligent Named Entity Recognition of Cyber Security. In Proceedings of the Advances in Signal Processing and Intelligent Recognition Systems, Trivandrum, India, 18–21 December 2019; Thampi, S.M., Hegde, R.M., Krishnan, S., Mukhopadhyay, J., Chaudhary, V., Marques, O., Piramuthu, S., Corchado, J.M., Eds.; Springer: Singapore, 2020; pp. 163–172. [Google Scholar] [CrossRef]
- Kim, G.; Lee, C.; Jo, J.; Lim, H. Automatic extraction of named entities of cyber threats using a deep Bi-LSTM-CRF network. Int. J. Mach. Learn. Cybern. 2020, 11, 2341–2355. [Google Scholar] [CrossRef]
- Jia, J.; Yang, L.; Wang, Y.; Sang, A. Hyper attack graph: Constructing a hypergraph for cyber threat intelligence analysis. Comput. Secur. 2025, 149, 104194. [Google Scholar] [CrossRef]
- Srivastava, S.; Paul, B.; Gupta, D. Study of Word Embeddings for Enhanced Cyber Security Named Entity Recognition. Procedia Comput. Sci. 2023, 218, 449–460. [Google Scholar] [CrossRef]
- Ahmed, K.; Khurshid, S.K.; Hina, S. CyberEntRel: Joint extraction of cyber entities and relations using deep learning. Comput. Secur. 2024, 136, 103579. [Google Scholar] [CrossRef]
- Satvat, K.; Gjomemo, R.; Venkatakrishnan, V.N. Extractor: Extracting Attack Behavior from Threat Reports. In Proceedings of the 2021 IEEE European Symposium on Security and Privacy (EuroS&P), Vienna, Austria, 6–10 September 2021; IEEE: New York, NY, USA, 2021; pp. 598–615. [Google Scholar] [CrossRef]
- Guo, Y.; Liu, Z.; Huang, C.; Wang, N.; Min, H.; Guo, W.; Liu, J. A framework for threat intelligence extraction and fusion. Comput. Secur. 2023, 132, 103371. [Google Scholar] [CrossRef]
- Jo, H.; Lee, Y.; Shin, S. Vulcan: Automatic extraction and analysis of cyber threat intelligence from unstructured text. Comput. Secur. 2022, 120, 102763. [Google Scholar] [CrossRef]
- Wang, G.; Liu, P.; Huang, J.; Bin, H.; Wang, X.; Zhu, H. KnowCTI: Knowledge-based cyber threat intelligence entity and relation extraction. Comput. Secur. 2024, 141, 103824. [Google Scholar] [CrossRef]
- Syed, Z.; Padia, A.; Finin, T.; Mathews, M.L.; Joshi, A. UCO: A Unified Cybersecurity Ontology. In Proceedings of the AAAI Workshop: Artificial Intelligence for Cyber Security, Phoenix, AZ, USA, 12 February 2016; Martinez, D.R., Streilein, W.W., Carter, K.M., Sinha, A., Eds.; AAAI Technical Report. AAAI Press: Washington, DC, USA, 2016; Volume WS-16-03. [Google Scholar]
- ESET. WeLiveSecurity. 2023. Available online: https://www.welivesecurity.com (accessed on 9 August 2024).
- Labs, F. FortiGuard Labs Threat Research. Available online: https://www.fortinet.com/blog/threat-research (accessed on 9 August 2024).
- CyberMonitor. APT Cyber Criminal Campaign Collections. 2023. Available online: https://github.com/CyberMonitor/APT_CyberCriminal_Campagin_Collections (accessed on 9 August 2024).
- Fenniak, M. The PyPDF2 Library. 2022. Available online: https://pypi.org/project/PyPDF2/ (accessed on 9 August 2024).
- MITRE Corporation. MITRE ATT&CK Framework. Available online: https://attack.mitre.org (accessed on 14 December 2023).
- MITRE Corporation. Mitreattack-Python: Python Library for Interacting with the MITRE ATT&CK Framework. 2024. Available online: https://github.com/mitre-attack/mitreattack-python (accessed on 14 December 2024).
- Devlin, J.; Chang, M.; Lee, K.; Toutanova, K. BERT: Pre-Training of Deep Bidirectional Transformers for Language Understanding; Association for Computational Linguistics: Stroudsburg, PA, USA, 2019; pp. 4171–4186. [Google Scholar] [CrossRef]
- Lin, T.Y.; Goyal, P.; Girshick, R.; He, K.; Dollár, P. Focal Loss for Dense Object Detection. IEEE Trans. Pattern Anal. Mach. Intell. 2018, 42, 318–327. [Google Scholar] [CrossRef]
- Sulu, M.; Das, R. Graph visualization of cyber threat intelligence data for analysis of cyber attacks. Balk. J. Electr. Comput. Eng. 2022, 10, 300–306. [Google Scholar] [CrossRef]


| Ref. | Data | Method | Key Takeaways | Key Findings |
|---|---|---|---|---|
| [20] | CTI reports collected from open sources | NLP, LSA, SVD, Naïve Bayes, KNN, Decision Tree, Random Forest, DLNN | Facilitates more accurate classification and analysis of high-level IOCs and threat actors. | The DLNN model achieved the highest performance with a 94% accuracy rate, producing more reliable results compared to other methods. |
| [21] | Freebuf website and WooYun Vulnerability Database | CRF, LSTM, LSTM-CRF, BiLSTM-CRF, CNN-BiLSTM-CRF, FT-LSTM-CRF, FT-BiLSTM-CRF, FT-CNN-BiLSTM-CRF | Feature templates (FT) enhance the detection of security entities by combining local and global features. | The proposed FT-CNN-BiLSTM-CRF model achieved the best performance with 93.31% accuracy and an F-score of 86. |
| [22] | Twitter data | TF-IDF, DBSCAN, TextRank, TextRazor | The proposed method identifies new and emerging cyber threat events from X streams. | The system demonstrated an accuracy rate of 93.75%, showcasing the applicability of threat detection with X data. |
| [23] | CVE list, Adobe and Microsoft Security Bulletins, and security blog texts | Stanford NER, LSTM + Dense, LSTM + CRF, XBiLSTM-CRF | The proposed XBiLSTM-CRF method outperformed others in recognizing entity categories by learning distinctions more effectively. | The proposed model achieved the best results with 90.54% accuracy and an F1 score of 89.38%. |
| [24] | APT security reports and malware repository data | Regex-based IoC Parser, malware repository service (for analysis) | The CTIMiner system generated a high-quality CTI dataset by leveraging open source reports and malware analysis data. | CTIMiner accelerated threat analysis processes by integrating indicators from open source reports and malware analyses to form a high-quality CTI dataset. |
| [25] | CVE records and security blog texts | BiLSTM-Attention-CRF-crowd, CRF-MA, Dawid and Skene-LSTM, BiLSTM-Attention-CRF, BiLSTM-Attention-CRF-VT | The proposed method effectively extracts accurate information from low-quality data sources and classifies security entities. | The BiLSTM-Attention-CRF-crowd model outperformed others with 89.1% accuracy and an F1 score of 89. |
| [26] | CVE records | Named Entity Recognition (NER), Ontology-Based Data Modeling | An NER-based system was developed for identifying and evaluating IoT security statuses. | The proposed model successfully identified vulnerabilities in IoT networks, achieving positive results through semantic analysis and ontology contributions. |
| [6] | Malware After Action Reports (AARs), Microsoft and Adobe Security Bulletins, and CVE descriptions | Named Entity Recognition (NER), Relation Extraction, Ontology-Based Modeling, Knowledge Graphs | Automatic extraction of information from cybersecurity incident reports led to the creation of knowledge graphs. | The proposed method extracted entities and relations from AARs, creating knowledge graphs and improving the analysis of security threats. |
| [27] | Open source threat intelligence platforms | Multi-layer perceptron (MLP), and TF-IDF-Based Feature Extraction | The proposed method provides an effective framework for extracting accurate and meaningful information from threat articles. | The system classified articles with an accuracy rate of 94.85% and produced enriched knowledge graphs using multi-source data. |
| [28] | Cyber threat reports, Chinese CTI reports, and vulnerability data | CRF, BiLSTM, BiLSTM-CRF, BiLSTM-CRF + Correction | Ontology-based correction and BiLSTM-CRF integration improved contextual accuracy and produced effective results for complex entity types. | The BiLSTM-CRF + Correction model achieved the highest F1 scores across all entity types, providing reliable information extraction for cyber threat intelligence. |
| [29] | Cyber threat reports and vulnerability information | CRF, LSTM-CRF, CNN-CRF, RNN-CRF, GRU-CRF, BiGRU-CRF, BiGRU + CNN-CRF | The deep learning-based Bi-GRU + CNN + CRF model excelled in contextual information modeling and understanding entity relationships. | The Bi-GRU + CNN + CRF model achieved the highest performance with an F1 score of 93.4%, producing more accurate results in entity recognition compared to existing approaches. |
| [30] | Cyber threat reports and CVE information | Char-RNN-Bi-LSTM, Char-RNN-Bi-LSTM-CRF, Char-CNN-Bi-LSTM, Char-CNN-Bi-LSTM-CRF, BOC-Bi-LSTM, BOC-Bi-LSTM-CRF | BOC-Bi-LSTM-CRF produced the best results in accuracy and efficiency by leveraging contextual and character information. | The proposed model achieved an F1 score of 75.05%, outperforming other methods. CRF improved performance across all models. |
| [31] | Cyber threat reports | CTIBERT model (BERT, BiGRU, CRF, Multi-head Mechanism) | The Hyper Attack Graph (HAG) framework is the first approach to analyse cyber threat intelligence using a hyper-graph structure. | HAG intuitively modeled tactical and technical information with a hyper-graph structure. The CTIBERT model excelled in extracting complex contextual information, with the multi-head mechanism enhancing accuracy. |
| [32] | Automatically Labeled Corpus | GloVe + BiLSTM + CRF, FastText + BiLSTM + CRF, BERT-base-cased + BiLSTM + CRF, BERT-large-cased + BiLSTM + CRF, BERT-large-cased-wwm + BiLSTM + CRF, BERT-base-cased + FFN, BERT-large-cased + FFN, BERT-large-cased-wwm + FFN | The BERT-large-cased-wwm + FFN achieved the best performance with an F1 score of 97.4%, excelling in contextual information extraction. | BERT-based approaches, especially with Whole Word Masking, improved accuracy, while CRF successfully modeled label dependencies. |
| [33] | CTI reports from Microsoft, Cisco, McAfee, Kaspersky, Fortinet, CrowdStrike, and others | CNN-BiLSTM-CRF, CNN-BiGRU-CRF, BERT-BiLSTM-CRF, BERT-BiGRU-CRF, RoBERTa-BiLSTM-CRF, RoBERTa-BiGRU-CRF | The RoBERTa-BiGRU-CRF model achieved the best performance with an F1 score of 83.2%, excelling in contextual information extraction. | RoBERTa-based models demonstrated superior performance in complex relationships during overlap tests, with high accuracy in “all” tests compared to other models. |
| [34] | Cyber threat reports from Microsoft, Cisco, McAfee, Kaspersky, and others | Bi-LSTM, BERT | Automatically extracts attack behaviours from reports, producing results similar to manually prepared graphs. | High accuracy rates were achieved in threat detection, extracting meaningful information from complex CTI reports. |
| [7] | Cybersecurity reports and open source datasets from Microsoft, Cisco, McAfee, and Kaspersky | Bi-GRU, Bi-GRU + Att, Bi-LSTM + CRF, Bi-GRU + CRF | The model provides a novel method for cyber threat analysis by extracting contextual and accurate information from unstructured text. Canonicalisation processes standardised knowledge graph creation. | The Open-CyKG-Bi-GRU + CRF model achieved outstanding success in accurate relationship extraction with an F1 score of 98.9% and sensitivity of 80.8%. Canonicalisation achieved an F1 score of 82.6% in relationship matching. |
| [35] | CVE descriptions, APT reports, Security Bulletins, ATT&CK, MISP, Unit 42, and WatcherLab | BERT, BiGRU, Attention Mechanism | The proposed method improved the accuracy of cyber threat intelligence by simultaneously extracting entities and relationships. Ontology alignment ensured contextual consistency. | The knowledge graph creation process provided reliable information and relationships with an F1 score of 81.37%. BERT-based models demonstrated superior success in contextual analysis. |
| [36] | CTI reports, MITRE ATT&CK, NVD, and open source data | BERT + BiLSTM + CRF, BERT (Relation Extraction) | The proposed system provided superior accuracy in extracting threat entities and relationships from unstructured text compared to existing methods. Contextual information alignment optimised threat analysis processes. | The model achieved an F1 score of 97.2% in entity extraction and 98.5% in relation extraction, outperforming existing methods. |
| [37] | Structured data from OpenCVE, ATT&CK, CAPEC, and websites | BERT, graph attention networks (GAT) | Achieved the best performance in threat intelligence extraction with an F1 score of 90.16% for entity extraction and 81.83% for relationship extraction. | The GAT model supported accurate modeling of contextual relationships during knowledge graph creation, optimising threat analysis processes. |
| Entity Type | Count |
|---|---|
| O | 7926 |
| B-ThreatActor | 2848 |
| I-ThreatActor | 1196 |
| B-Target | 1746 |
| I-Target | 1220 |
| B-Malware | 2204 |
| I-Malware | 516 |
| B-Campaign | 760 |
| I-Campaign | 644 |
| Token | → | Tag |
|---|---|---|
| The | → | O |
| APT29 | → | B-ThreatActor |
| group | → | I-ThreatActor |
| used | → | O |
| the | → | O |
| malware | → | O |
| SUNBURST | → | B-Malware |
| in | → | O |
| a | → | O |
| campaign | → | B-Campaign |
| targeting | → | O |
| U.S. | → | B-Target |
| government | → | I-Target |
| agencies | → | I-Target |
| . | → | O |
| Entity Type | Relationship | Target Entity |
|---|---|---|
| ThreatActor | hasAssociatedCampaign | Campaign |
| ThreatActor | hasAssociatedMalware | Malware |
| ThreatActor | hasTargetedField | Target |
| ThreatActor | hasAlias | ThreatActor |
| Malware | isUsedBy | ThreatActor |
| Campaign | isLaunchedBy | ThreatActor |
| ThreatActor | isAssociatedWithCampaign | Campaign |
| Campaign | usesMalware | Malware |
| Campaign | hasTargetedField | Target |
| Hyperparameters | Value |
|---|---|
| Maximum Sequence Length | 128 |
| Batch Size | 32 |
| Test Size | 0.2 |
| Hidden Dropout | 0.1 |
| Attention Dropout | 0.4 |
| Learning Rate | |
| Adam Epsilon | |
| Number of Epochs | 20 |
| Max Gradient Norm | 1.0 |
| Warmup Ratio | 0.1 |
| Weight Decay | 0.01 |
| Early Stopping Patience | 5 |
| Gradient Accumulation Steps | 3 |
| Gamma | 2.0 |
| Alpha | 0.25 |
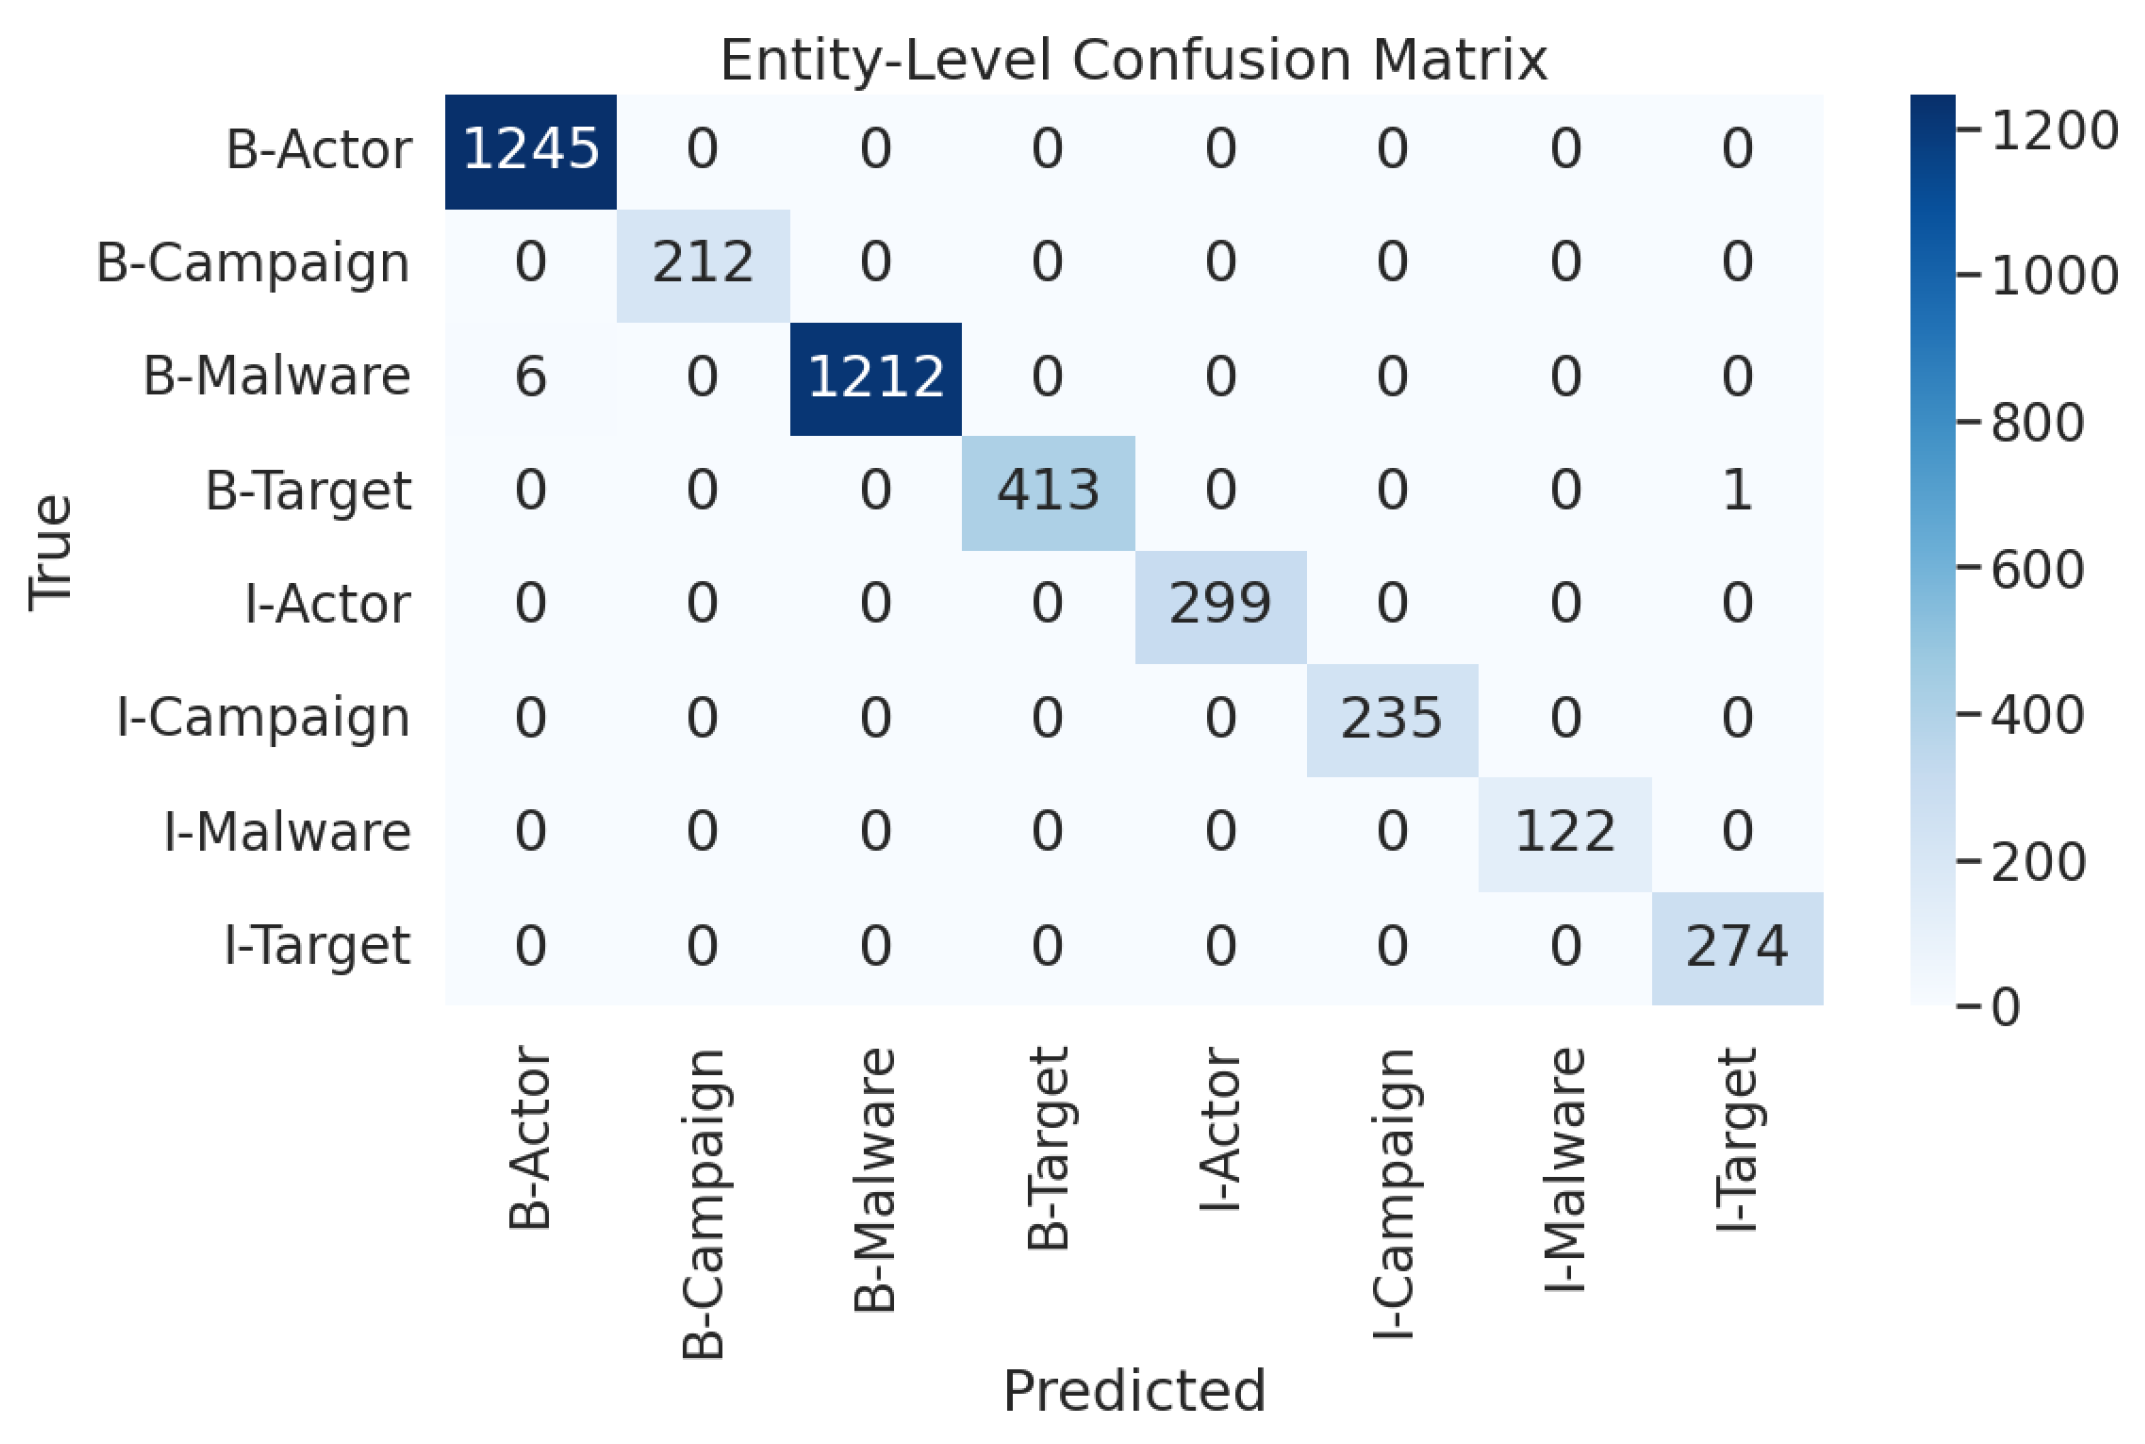
| Entity Class | Precision% | Recall% | F1 Score% | Support |
|---|---|---|---|---|
| Actor | 0.96 | 0.99 | 0.97 | 1245 |
| Campaign | 0.95 | 1.00 | 0.97 | 212 |
| Malware | 0.96 | 0.99 | 0.98 | 1218 |
| Target | 0.73 | 0.95 | 0.83 | 414 |
| Micro Avg | 0.92 | 0.99 | 0.95 | 3089 |
| Macro Avg | 0.90 | 0.98 | 0.94 | 3089 |
| Weighted Avg | 0.93 | 0.99 | 0.96 | 3089 |
| Node ID (ThreatActor) | Malware Count |
|---|---|
| 5141 | 347 |
| 2398 | 55 |
| 261 | 34 |
| 2261 | 25 |
| 687 | 21 |
| Node ID (Malware) | Actor Count |
|---|---|
| 617 | 5 |
| 1570 | 3 |
| 318 | 2 |
| 1465 | 2 |
| 1140 | 2 |
| Targeted Sector | Number of Targeting Actors |
|---|---|
| 27 | |
| Infrastructure | 7 |
| Government | 5 |
| Banking | 5 |
| Government Agencies | 4 |
| Node ID (Malware) | Target Count |
|---|---|
| 2168 | 19 |
| 1140 | 14 |
| 617 | 11 |
| 1046 | 9 |
| 4206 | 7 |
| Node ID | Entity Type | PageRank Score |
|---|---|---|
| 5141 | ThreatActor | 47.4870 |
| 318 | Malware | 40.9437 |
| 942 | Target | 30.7374 |
| 2005 | Malware | 25.2274 |
| 617 | Malware | 20.7660 |
| Actor1 ID | Actor2 ID | Common Targets | Count |
|---|---|---|---|
| 5141 | 2082 | banking, organisations, infrastructure, energy | 4 |
| 5141 | 2398 | bank, Google, banking | 3 |
| 1125 | 5141 | infrastructure, financial, information | 3 |
| 2285 | 51,411 | payment, infrastructure, banks | 3 |
| 4515 | 1581 | Google, government agencies | 2 |
| 5141 | 463 | healthcare, law | 2 |
| Threat Actor | Potential Target | Common Connections | Common Nodes |
|---|---|---|---|
| 5141 | government agencies | 3 | 933, 1581, 4515 |
| 5141 | crypto | 2 | 687, 5617 |
| 5141 | government agency | 2 | 254, 2168 |
| 5141 | political | 2 | 687, 1581 |
| 5141 | business | 2 | 1639, 2168 |
| Threat Actor | Potential Target | Adamic/Adar Index | Shared Connections |
|---|---|---|---|
| 5141 | SSH service | 2.71 | 10 |
| 5141 | gaming | 2.71 | 10 |
| 5141 | coffee shops | 2.71 | 10 |
| 5141 | sports | 2.71 | 10 |
| 5141 | airports | 2.71 | 10 |
Disclaimer/Publisher’s Note: The statements, opinions and data contained in all publications are solely those of the individual author(s) and contributor(s) and not of MDPI and/or the editor(s). MDPI and/or the editor(s) disclaim responsibility for any injury to people or property resulting from any ideas, methods, instructions or products referred to in the content. |
© 2025 by the authors. Licensee MDPI, Basel, Switzerland. This article is an open access article distributed under the terms and conditions of the Creative Commons Attribution (CC BY) license (https://creativecommons.org/licenses/by/4.0/).
Share and Cite
Demirol, D.; Das, R.; Hanbay, D. A Novel Approach for Cyber Threat Analysis Systems Using BERT Model from Cyber Threat Intelligence Data. Symmetry 2025, 17, 587. https://doi.org/10.3390/sym17040587
Demirol D, Das R, Hanbay D. A Novel Approach for Cyber Threat Analysis Systems Using BERT Model from Cyber Threat Intelligence Data. Symmetry. 2025; 17(4):587. https://doi.org/10.3390/sym17040587
Chicago/Turabian StyleDemirol, Doygun, Resul Das, and Davut Hanbay. 2025. "A Novel Approach for Cyber Threat Analysis Systems Using BERT Model from Cyber Threat Intelligence Data" Symmetry 17, no. 4: 587. https://doi.org/10.3390/sym17040587
APA StyleDemirol, D., Das, R., & Hanbay, D. (2025). A Novel Approach for Cyber Threat Analysis Systems Using BERT Model from Cyber Threat Intelligence Data. Symmetry, 17(4), 587. https://doi.org/10.3390/sym17040587