Article

Quantification of Foot Drop Stimulator Effects on Post-Stroke Hemiplegic Gait: A Cyclogram-Based Evaluation of Inter-Limb Gait Symmetry

1
Department of Electronics, Information and Bioengineering, Politecnico di Milano, Piazza Leonardo da Vinci 32, 20133 Milano, Italy
2
Department of Mechanical Engineering, Politecnico di Milano, Via La Masa 1, 20156 Milano, Italy
3
Rehabilitation Sciences Graduate Program, Universidade Federal de Ciências da Saúde de Porto Alegre (UFCSPA), Porto Alegre 90050-170, Brazil
4
Istituto Auxologico Italiano, IRCCS, S. Giuseppe Hospital, Piancavallo, 28824 Oggebbio, Italy
5
Department of Mechanical, Chemical and Materials Engineering, University of Cagliari, Piazza d’Armi, 09123 Cagliari, Italy
*
Author to whom correspondence should be addressed.
These authors contributed equally to this work.
Symmetry 2025, 17(5), 631; https://doi.org/10.3390/sym17050631
Submission received: 4 March 2025 / Revised: 15 April 2025 / Accepted: 19 April 2025 / Published: 22 April 2025
(This article belongs to the Section Life Sciences)

Abstract

:
Post-stroke hemiplegia often leads to gait asymmetry, mobility reduction, and increased fall risk. Foot Drop Stimulation (FDS) is used in rehabilitation to improve dorsiflexion and gait patterns. Through cyclogram-based analysis, this retrospective study evaluated the effectiveness of FDS in enhancing inter-limb gait symmetry in 21 post-stroke hemiplegic individuals following 10 sessions of treadmill training combined with FDS. Participants underwent 3D gait analysis pre- and post-intervention, performed by means of optical motion capture system, from which spatiotemporal and cyclogram features of the hip, knee, and ankle were computed. FDS was found to significantly improve dynamic range of motion (ROM) of the affected side at hip (+5%) and knee (+9%) joints. Cyclogram analysis showed that FDS reduced inter-limb hip asymmetry (orientation: 13.35° to 10.65°, Trend Symmetry Index: 19.09° to 15.46°), though no improvements were observed at the ankle. FDS with treadmill training improved hip and knee symmetry, supporting cyclogram-based assessments for gait rehabilitation and highlighting the need for targeted ankle interventions. Further research is needed to explore long-term effects and optimize rehabilitation strategies.

1. Introduction

Stroke is the third leading cause of death and disability worldwide, with an increase in incidence of 70% over the last three decades [1]. Despite medical advances that have significantly reduced mortality, stroke remains a major cause of chronic disability [2]. This cerebrovascular disorder causes various symptoms, such as motor and cognitive deficits, which substantially affect quality of life [2,3,4,5]. The ability to walk is impaired with inefficient and asymmetric gait resulting in increased energy expenditure and risk of falls [6,7]. Many stroke survivors present with hemiparesis, resulting in ankle-control deficits and equinovarus deformity [8]. Such anomalies, in turn, lead to a reduction in gait speed, stride length, and range of motion (ROM) of the lower limb joints, causing affected individuals to adopt compensatory strategies to preserve walking capabilities. In particular, the presence of foot drop causes a circumduction of the limb during the swing phase with hip hiking and a shortened support time to counteract the inadequate propulsion and the muscular weakness of the paretic side [6,9]. Thus, in general, during standing and locomotion, the unaffected limb is overinvolved in body support and balance control, which can lead to musculoskeletal injuries in the nonparetic lower limb and loss of bone mass density in the paretic lower limb [10,11,12,13]. For this reason, the main goal of rehabilitation is to restore interlimb symmetry through muscle strengthening (i.e., Functional Electrical Stimulation, FES), physical therapy, and gait training, the latter supported by the use of virtual reality, robotic assistance, or orthosis [10,14,15,16,17,18,19]. It is therefore fundamental to accurately quantify the difference in performance between the two limbs in order to support the choice of the most appropriate treatment to assess its effectiveness after the rehabilitation program [10,20,21].
FES is a therapeutic technique that applies electrical impulses to nerves or muscles to elicit functional movements, thereby improving muscle activation and coordination in individuals with neurological impairments, such as stroke survivors [22]. In hemiplegia, FES specifically targets the peroneal nerve, which stimulates the dorsiflexor muscles, particularly the tibialis anterior, to induce ankle dorsiflexion, thereby reducing foot drop and enhancing foot clearance [15,23]. Beyond its immediate functional benefits, through its repeated use, FES promotes motor relearning, gradually reducing the reliance on compensatory strategies such as hip hiking or circumduction. Moreover, FES has been shown to improve gait symmetry, reduce energy expenditure, and enhance overall walking efficiency, making it a valuable tool for post-stroke rehabilitation [24,25].
Inter-limb asymmetry significantly impairs gait efficiency and mobility in post-stroke patients [26], making its precise measurement critical. This assessment supports the selection of the most appropriate interventions and evaluates their effectiveness in restoring symmetrical gait.
To date, several quantitative approaches to assessing gait asymmetry are available [27]. The simplest ones make use of “discrete indices” calculated on the basis of a direct comparisons between several gait parameters among the two limbs, such as the step length or time, to identify their relative deviation. Although these indices are not calculated using standardized equations and often require a normalization to keep into account subject’s anthropometric features, they are the most widely used due to their ease of implementation [11,21,27,28,29,30,31].
More refined methods have been also proposed to provide additional information, such as identifying the temporal position of the asymmetry or detecting occasional events during the gait cycle. In particular, the statistically-based and nonlinear methods are based on complex measures and are therefore not used in clinical practice [27]. Instead, the waveform-based methods are a good compromise between the information obtained about the whole gait cycle kinematics and the ease of interpretation. Among these methods, the most commonly used are the “bilateral cyclograms”, also called “angle–angle diagrams”, which are obtained by the simultaneous plotting of the angular position of a joint of interest during the gait cycle for the right and left limbs, without considering the time axis of each curve [27,32,33,34,35]. In this case, the asymmetry can be quantified based on simple geometric properties of the curve (i.e., area, perimeter, orientation, and shape) or different order moments and trend symmetry [31,33,34,35,36].
Cyclograms have been successfully employed to assess gait asymmetry in a wide range of neurological and orthopedic conditions: hemiplegia [21,37], Multiple Sclerosis [38,39], osteoarthritis [40], obesity, anorexia and bulimia, and Prader–Willi syndrome [41,42]. In all these cases, cyclograms showed good sensitivity in assessing asymmetry and discriminative power (i.e., affected vs. healthy or different stages of the disease). Therefore, considering the potential of this method in a clinical context, we aim to apply it to quantify the improvement of symmetry after rehabilitation sessions of Foot-Drop Stimulation (FDS) in hemiparetic patients after stroke.
To our knowledge, few studies have used cyclograms to evaluate post-stroke asymmetry. Marrone et al. [21] assessed hip, knee, and ankle asymmetry in 41 stroke survivors compared with a control group by using bilateral cyclograms. Kutilek et al. [31,43,44] calculated the inclination angle of the hip–hip and knee–knee diagrams to compare asymmetry before and immediately after the application of an orthosis to correct foot drop and peroneal nerve palsy. Lee et al. [45] also evaluated the differences in inter-joint coordination and gait variability in mild and moderate stroke patients and a control group, but in this case, they used unilateral hip–knee cyclograms.
To the best of our knowledge, only one study, conducted by Pilkar et al. [37], evaluated the effect of a 6-month follow-up of FDS use in 13 post-stroke patients. They developed a novel cyclogram-based symmetry (CBS) method capable of providing a synthetic index that combines asymmetry of all three joints of the lower limb. This method was found suitable for comparing the hemiplegic population with the healthy group, and the results showed a significant improvement in hip symmetry when patients wore the stimulator.
Based on these considerations, we propose a retrospective study to assess the presence of changes in inter-limb asymmetry following 10 sessions of treadmill training with a FDS in post-stroke survivors. We hypothesize that the use of cyclograms could identify specific changes in inter-limb asymmetry and provide a more detailed assessment of subtle gait alterations that conventional methods cannot detect.

2. Materials and Methods

2.1. Participants

The study recruited 21 stroke survivors (14 left and 7 right hemiplegic patients; 9 females, 12 males; age: 55.8 (9.3) years) from the Ambulatory of Neurology at Hospital Santa Case de Misericordia de Porto Alegre (Brazil). Participants were aged between 20 and 80 years, with a history of ischemic or hemorrhagic chronic stroke, confirmed by head CT or MRI at least 6 months prior to enrollment. They exhibited varying degrees of hemiparesis, ranging from mild (29–34/34), to severe (0–19/34), as per the lower limb subdivision of the Fugl-Meyer score. Eligibility criteria required participants to have a minimum cognitive ability as assessed by the Mini-Mental State Examination test, no history of seizure and recent falls, and the ability to walk at least 30 m without assistance. Exclusion criteria included contraindications for FES (i.e., electric or metallic implants, skin problems or lesions near the stimulation site), musculoskeletal disorders, severe visual impairments, or significant restrictions on ankle motion (i.e., ankle fixed at ≥10 degrees in plantar flexion in the affected leg with the knee extended).
A group of healthy individuals (Control Group, CG) matched by age and anthropometric data (height and weight) were also tested. Exclusion criteria for the CG were the existence of conditions able to affect gait capability. All of them exhibited normal flexibility and muscle strength, had no evident gait abnormalities, and were able to walk independently. Participant characteristics of both groups, including anthropometric and clinical data, are summarized in Table 1.
The study was approved by the Ethical Committee of Santa Casa de Misericordia of Hospital of Porto Alegre (CAAE 64819617.0.0000.5335) and carried out in accordance with the 1964 Helsinki declaration and its latest amendments. Written informed consent was signed by all participants.

2.2. Intervention

The WalkAide system (Innovative Neurotronics, Austin, TX, USA) was used to stimulate the peroneal nerve on the affected side. The orthosis stimulates the peroneal nerve through a tilt sensor which detects the affected leg tilt when foot contact on the ground changes from posterior to anterior (pre-swing phase). Stimulus stops when the leg is tilted forward on a foot strike [46,47]. FDS parameters were adjusted for each participant using the WalkAnalyst software by a licensed physical therapist. The frequency of electrical stimulation was set at 25 Hz, the pulse duration at 150 µs, and the intensity between 60 and 150 V. The intensity of stimulation was painlessly controlled by allowing sufficient dorsiflexion and eversion during the swing phase of the gait cycle as an immediate effect of starting to use the device [48,49].
First, volunteers underwent a three-day habituation period using the FDS device for an hour a day. Participants used the FDS in ON mode and walked on a flat surface, went up and downstairs, and finally walked on a treadmill. During the habituation period, the most appropriate intensity of the stimulus was adjusted for each participant to guarantee a comfortable dorsiflexion and eversion movement by asking about possible undesirable effects and tolerance during each stimulation session. Then, 3 days after finishing the habituation period, participants underwent ten sessions of gait training with FDS stimulation for 20 min, 5 times a week for 2 weeks (excluding weekends). Participants underwent gait training on a treadmill (Athletic advanced-720EE) with a self-selected comfortable velocity [49,50,51]. During gait training, participants were allowed to hold the treadmill bars. They could stop walking at any time.
At the beginning of each session, participants received a protocol of lower limb stretching and passive ankle mobilization for approximately 15 min. Heart rate and blood pressure were periodically monitored. The training was conducted by the same licensed physiotherapist who had received training and competency assessment in the use of FDS. Total time of training sessions was approximately 50 min.

2.3. Data Collection and Processing

Participants underwent instrumented 3D gait analysis (3D-GA) at the Movement Analysis and Rehabilitation Laboratory at the Universidade Federal de Ciencias da Saude de Porto Alegre (Brazil), using an optoelectronic system involving 6 smart-D cameras (BTS Bioengineering, Milano, Italy) with a sample rate 100 Hz, 2 tri-axial force platforms (BTS Bioengineering, Milano, Italy, P6000 model) with an acquisition frequency 500 Hz and 2 TV camera Video Systems (BTS Bioengineering, Italy) synchronized with the force platform and the optoelectronic system. Participants’ anthropometric characteristics were collected (i.e., height, weight, anterior superior iliac spine distance, pelvis thickness, knee and ankle width, and leg length) and twenty-two retro-reflective markers were placed on participants’ body according to the setup proposed by Davis et al. [52]. Participants were then asked to walk barefoot along an 8 m walkway at their natural pace. Participants were assessed in two sessions (i.e., baseline and follow-up), with each session including up to five trials to ensure data reproducibility.
Kinematic data were pre-processed using cubing spline interpolation to fill missing frames and low-pass Butterworth filtering (10 Hz) to remove noise. For each participant, three consistent trials in terms of spatio-temporal parameters and kinematics were selected for further analysis. The following gait-related variables were computed:
  • Spatio-temporal parameters (i.e., gait speed, step length, cadence, stance, swing, and double support phase duration);
  • Hip, knee, and ankle kinematics in the sagittal plane (i.e., flexion–extension for hip and knee, dorsi-plantar flexion during the gait cycle). All the graphs derived from 3D-GA were normalized as % of the gait cycle;
  • Dynamic range of motion (ROM), calculated as the difference between the maximum and the minimum flexion–extension angles for the hip and knee, and dorsi-plantar flexion angle for the ankle throughout the gait cycle.
Bilateral cyclogram features were then computed based on sagittal kinematics using a dedicated Matlab routine following the methodology outlined by Goswami et al. [33]. Specifically, the following parameters were obtained:
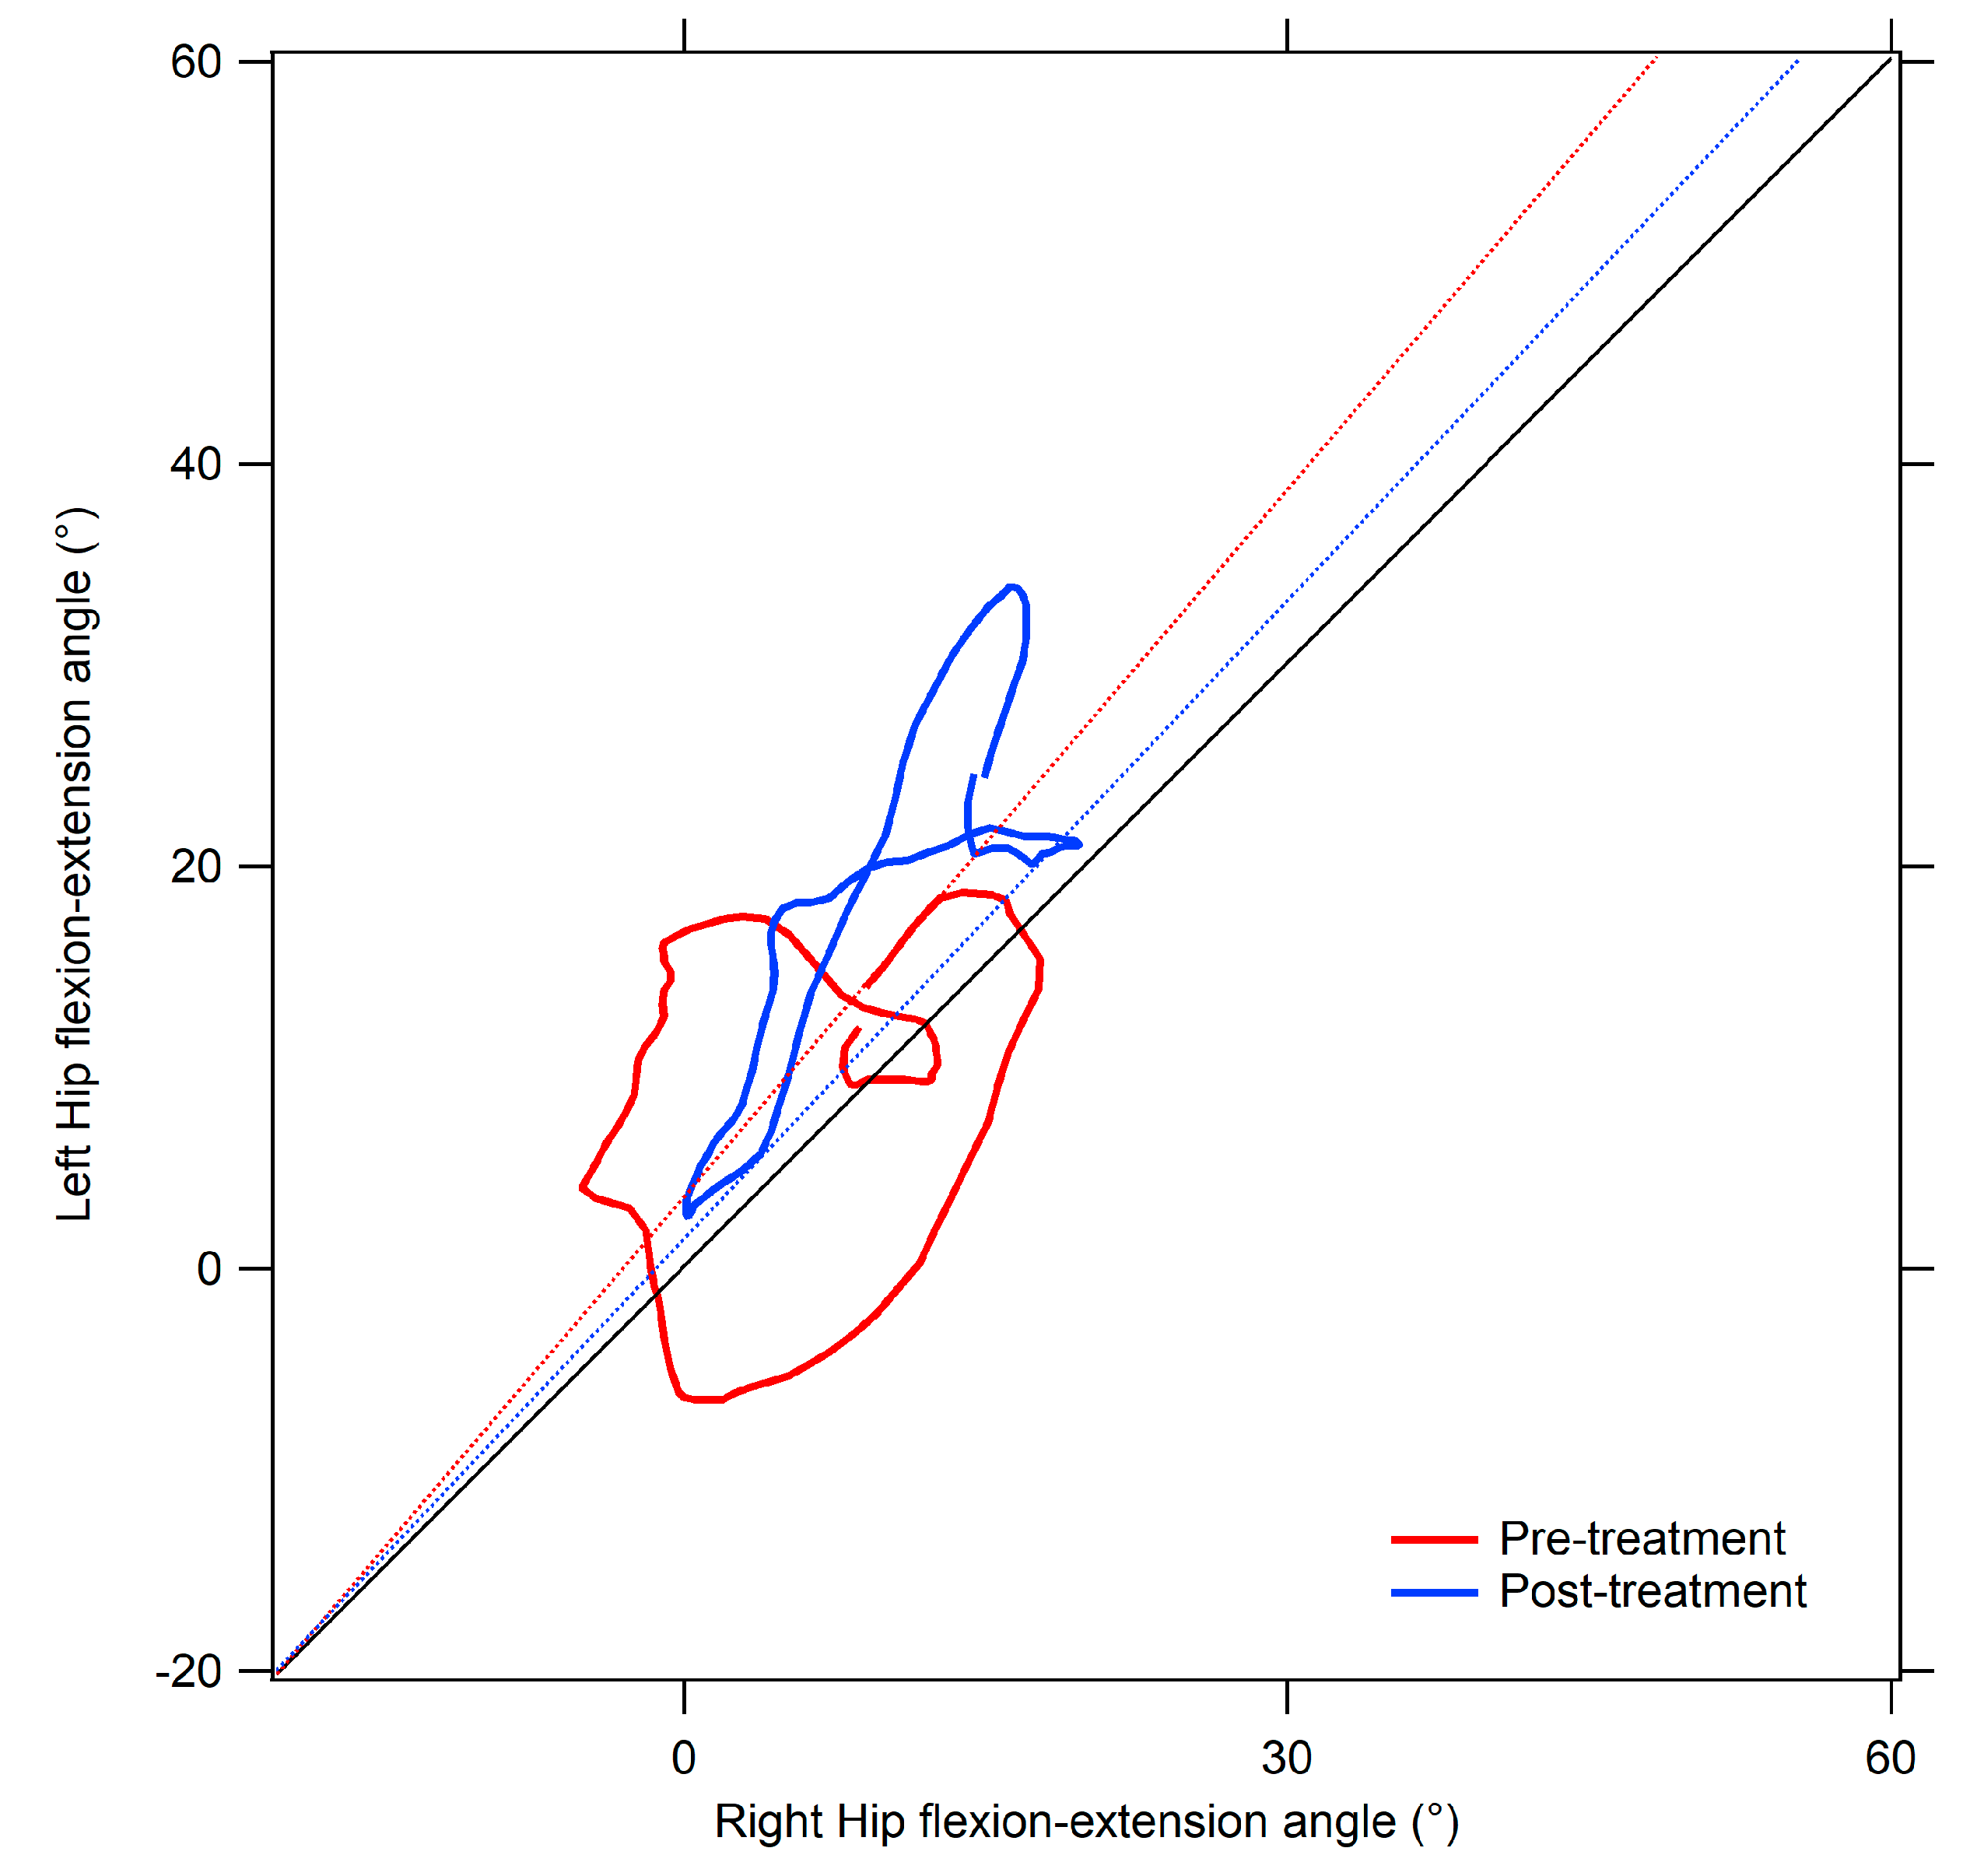
  • Area (degrees2), representing the area of the cyclogram. In symmetric gait, the left and right joints are characterized by identical angular positions during each phase of the gait cycle, thus resulting in a null area. Deviations from null value indicate increased gait asymmetry [35].
  • Cyclogram orientation (φ, degrees), defined as the absolute difference between the angular orientation of the principal axis of inertia of the cyclogram and the 45° line, which denotes perfect symmetry [33,34]. Larger φ angles indicate reduced inter-limb symmetry.
  • Trend Symmetry Index (dimensionless), computed through an eigenvector analysis as described by Crenshaw et al. [53]. It assesses the similarity between the angular trends of the right and left limbs across the gait cycle. Increased Trend Symmetry values are indicative of higher degrees of asymmetry.

2.4. Statistical Analysis

A preliminary analysis was carried out to test data for normality and homogeneity of variances by means of the Shapiro–Wilk and Levene’s test, respectively. Then, three separate two-way analyses of variance for repeated measure (RM-ANOVA) were performed in order to assess the effectiveness of the intervention on the previously mentioned variable of interest by setting time (pre/post intervention) and limb (affected/non-affected) as independent variables and the 6 spatio-temporal parameters of gait, the 3 dynamic ROM, and the 3 cyclogram parameters at hip, knee and ankle joints as dependent variables. The Student’s t-test assessed the differences between the pre- and post-treatment evaluation and the controls (Control Group). The level of significance was set at p = 0.05. All the analyses were performed using SPSS software (v.20, IBM, Armonk, NY, USA).

3. Results

Table 2 (spatio-temporal parameters of gait), Table 3 (dynamic ROM), and Table 4 (cyclogram parameters) summarize the results of the analysis. The intervention gives rise to: a significant increase in the dynamic ROM of the affected limb at hip (+5%, p = 0.041) and knee (+9%, p = 0.026) joints and an improvement of the interlimb symmetry at hip level, as suggested by the significantly reduced value of the cyclogram orientation (10.65 post intervention vs. 13.35, p = 0.008) and of the Trend Symmetry (15.46 post intervention vs. 19.09, p = 0.013). The post-treatment values showed a clear positive trend, displaying significant improvement from a statistical point of view, even if they did not yet fully align with the normal levels of the control group. No significant changes occurred for the other parameters. An example of inter-limb cyclograms of the hip joint for one of the participants, calculated before and after the FDS treatment is displayed in Figure 1.

4. Discussion

This retrospective study investigated the effects of FDS on gait asymmetry in post-stroke hemiplegic individuals using cyclogram features. This method compares the inter-limb joint kinematics, providing a deeper understanding of gait dynamics, particularly in individuals with neurological impairments like those recovering from a stroke, as well as in other populations with altered movement patterns, such as adults with obesity [54,55].
Overall, the results suggest that a short-term intervention of 10 treadmill training sessions with FDS originates some degree of improvement for the affected limb especially in terms of dynamic flexion–extension ROM of the affected hip (+5%, p = 0.041) and knee (+9%, p = 0.026). These findings are consistent with previous studies, which suggest that FDS can both improve motor control and flexibility in the paretic limb, thereby reducing compensatory strategies such as circumduction and hip hiking and improving overall gait efficiency [56,57]. While improvements were observed at the hip and knee, the affected limb’s ankle ROM did not significantly change after the rehabilitation program (19.30° pre-treatment vs. 21.30° post-treatment) and remained lower than the control group (28.60°). Then, although not significant, the gait spatiotemporal parameters showed a slight improvement comparing pre- and post-intervention values (i.e., +3.6% Gait speed, −2.5% Stance phase duration of the affected limb).
Regarding the inter-limb asymmetry, the cyclogram-based analysis revealed positive changes in the hip and knee joints of the affected limbs. Specifically, the orientation of the hip cyclogram significantly decreased from 13.35° to 10.65° (p = 0.008), and the Trend Symmetry Index improved from 19.09 to 15.46 (p = 0.013). These findings are indicative of an enhancement in inter-limb coordination at the proximal level. Conversely, changes in the knee and ankle metrics, including cyclogram area and orientation, did not reach statistical significance. These results are in line with the results of the analysis of the dynamic ROM and with previous studies applying the cyclogram method to assess changes in inter-limb symmetry in post-stroke individuals, which also reported significant improvements in hip symmetry following FDS [37]. The absence of significant improvements in knee and ankle symmetry also aligns with the findings by Marrone et al. [21] who highlighted that proximal joints tend to exhibit greater responsiveness to rehabilitative interventions than distal ones. The explanation could be that FDS promotes dorsi-plantar flexion of the ankle, assisting the hip and knee movement and preventing the hip from adopting compensatory strategies. Post-stroke individuals present reduced dorsiflexion during swing phases of gait that interferes with initial foot contact at the beginning of the stance phase due to poor motor control of ankle dorsiflexion [58], reduced intermuscular coordination [59] and/or increased spasticity of plantar flexor [60]. FDS stimulation could be able to increase sensory inputs to the brain, improve tibialis anterior muscle activity [49], and decrease spasticity [61]. Additionally, an improvement in ankle dorsiflexion during mid stance and mid/terminal swing phases allows for foot clearance and preparation for the next initial contact. Improvements in ankle mobility would facilitate forward progression and stability [62] with an impact on gait performance. These observations highlight the need for targeted strategies to address asymmetries in the distal joints, potentially through longer intervention durations or joint-specific therapies to address ankle-specific deficits.
From a methodological point of view, incorporating bilateral cyclograms offers a comprehensive perspective that complements traditional spatio-temporal analyses, revealing nuanced changes in joint coordination that might otherwise go unnoticed. The application of cyclograms as a quantitative tool in this study highlights their potential in clinical practice, offering a holistic view of gait symmetry by capturing angular relationships throughout the gait cycle. In this study, the observed improvements in hip symmetry have important functional implications. First, enhanced coordination and ROM at the hip level are likely to reduce compensatory strategies, leading to increased energy expenditure and reliance on the unaffected limb for balance propulsion. Over time, this may lead to a reduced risk of musculoskeletal injuries in the non-paretic limb and thus improved quality of life for stroke survivors. Moreover, these benefits highlight the role of FDS in supporting recovery and reintegration into daily activities.
Despite the promising findings, several limitations warrant consideration. First, the relatively short period of 10 training sessions of 20 min each over two weeks may have limited the extent of the observed improvements, especially at the knee and ankle joints. Previous studies suggest that the long-term use of FDS devices induces improvement in maladaptive motor patterns and increases the speed and stability of gait [61,63]. Although intensive but shorter treatments may not induce therapeutic effects on spatiotemporal gait parameters, a training effect could be achieved [64]. Future studies should explore the effects of longer intervention periods to determine whether improvements persist over time following FDS.
Second, the absence of a placebo control group limits our ability to fully attribute the observed changes to the FDS intervention. Including a control group in future research would help disentangle the effects of FDS from potential placebo effects or natural recovery. Third, our study population was predominantly male (57.1%) and exhibited a wide range of time since stroke (6 to 96 months), both of which could have influenced the results. Future research should aim for a more balanced gender distribution and a narrower time range since stroke to better understand the impact of these factors on treatment outcomes. Fourth, the small sample size may have limited the statistical power of our findings, potentially obscuring significant changes in knee and ankle function. A larger sample would provide a more robust evaluation of FDS’s impact and allow for more generalizable conclusions. Fifth, the study was conducted at a single institution, which may have influenced the findings due to specific environmental and operational factors. Conducting multi-center studies in the future would help validate these results across different clinical settings, ensuring broader applicability and reliability
Finally, it is important to note that this study focused exclusively on spatio-temporal parameters, angular lower limb ROM in the sagittal plane, and inter-limb gait symmetry as assessed through cyclograms. Future research should expand on these findings by incorporating analysis of synergies among lower limb joints of the affected side. Furthermore, integrating kinetic data and electromyographic signals could provide a more comprehensive understanding of gait changes resulting from treatment. Such an approach would help identify the precise locations of symmetry deviations and determine the most sensitive measures of gait improvement.

5. Conclusions

This study demonstrates that FDS, combined with treadmill training, primarily improves gait strategy at the proximal level in post-stroke individuals. After treatment, our data showed increased hip and knee ROM and improved inter-limb gait symmetry at the hip joint, as quantified through cyclogram-based measures.
These findings highlight the potential of cyclograms as a sensitive tool for evaluating gait rehabilitation outcomes and underscore the need for further research to optimize and extend these benefits to other joints. Addressing the study’s limitations through future investigations will contribute to a deeper understanding of FDS efficacy and its role in comprehensive stroke rehabilitation programs. By leveraging innovative tools like cyclograms, clinicians can advance personalized rehabilitation strategies and ultimately enhance the quality of care for stroke survivors. Moreover, future longitudinal studies could provide more information on the prolonged use of FDS in stroke rehabilitation and its potential to maintain or further enhance mobility improvements over time.

Author Contributions

Conceptualization, F.M., M.P. (Massimiliano Pau), A.S.P. and V.C., formal analysis, F.M. and M.P. (Massimiliano Pau), data curation, F.M., M.P. (Massimiliano Pau), and S.C.; software, M.P. (Micaela Porta), B.L.; writing—original draft preparation, F.M., S.C., and V.C.; writing—review and editing, A.S.P., M.J.d.C., M.T., M.G., M.P. (Massimiliano Pau), and M.P. (Micaela Porta). All authors have read and agreed to the published version of the manuscript.

Funding

This publication has been supported by the Italian Ministry of Health-Ricerca Corrente.

Institutional Review Board Statement

The study was conducted in accordance with the Declarationof Helsinki, and approved by the Ethics Committee of Santa Casa de Misericordia of Hospital of Porto Alegre, Brazil (CAAE 64819617.0.0000.5335).

Informed Consent Statement

Informed consent was obtained from all subjects involved in the study.

Data Availability Statement

Dataset available on request from the authors.

Conflicts of Interest

The authors declare no conflicts of interest.

References

  1. Feigin, V.L.; Brainin, M.; Norrving, B.; Martins, S.; Sacco, R.L.; Hacke, W.; Fisher, M.; Pandian, J.; Lindsay, P. World Stroke Organization (WSO): Global Stroke Fact Sheet 2022. Int. J. Stroke 2022, 17, 18–29. [Google Scholar] [CrossRef]
  2. Alawieh, A.; Zhao, J.; Feng, W. Factors Affecting Post-Stroke Motor Recovery: Implications on Neurotherapy after Brain Injury. Behav. Brain Res. 2018, 340, 94–101. [Google Scholar] [CrossRef]
  3. Einstad, M.S.; Saltvedt, I.; Lydersen, S.; Ursin, M.H.; Munthe-Kaas, R.; Ihle-Hansen, H.; Knapskog, A.-B.; Askim, T.; Beyer, M.K.; Næss, H.; et al. Associations between Post-Stroke Motor and Cognitive Function: A Cross-Sectional Study. BMC Geriatr. 2021, 21, 103. [Google Scholar] [CrossRef]
  4. Dimyan, M.A.; Cohen, L.G. Neuroplasticity in the Context of Motor Rehabilitation after Stroke. Nat. Rev. Neurol. 2011, 7, 76–85. [Google Scholar] [CrossRef]
  5. Verstraeten, S.; Mark, R.E.; Dieleman, J.; Van Rijsbergen, M.; De Kort, P.; Sitskoorn, M.M. Motor Impairment Three Months Post Stroke Implies A Corresponding Cognitive Deficit. J. Stroke Cerebrovasc. Dis. 2020, 29, 105119. [Google Scholar] [CrossRef]
  6. Chen, G.; Patten, C.; Kothari, D.H.; Zajac, F.E. Gait Differences between Individuals with Post-Stroke Hemiparesis and Non-Disabled Controls at Matched Speeds. Gait Posture 2005, 22, 51–56. [Google Scholar] [CrossRef]
  7. Verma, R.; Arya, K.N.; Sharma, P.; Garg, R.K. Understanding Gait Control in Post-Stroke: Implications for Management. J. Bodyw. Mov. Ther. 2012, 16, 14–21. [Google Scholar] [CrossRef]
  8. Abe, H.; Michimata, A.; Sugawara, K.; Sugaya, N.; Izumi, S.-I. Improving Gait Stability in Stroke Hemiplegic Patients with a Plastic Ankle-Foot Orthosis. Tohoku J. Exp. Med. 2009, 218, 193–199. [Google Scholar] [CrossRef]
  9. Li, J.; Huang, H.J. Small Directional Treadmill Perturbations Induce Differential Gait Stability Adaptation. J. Neurophysiol. 2022, 127, 38–55. [Google Scholar] [CrossRef] [PubMed]
  10. Beyaert, C.; Vasa, R.; Frykberg, G.E. Gait Post-Stroke: Pathophysiology and Rehabilitation Strategies. Neurophysiol. Clin. 2015, 45, 335–355. [Google Scholar] [CrossRef] [PubMed]
  11. Patterson, K.K.; Gage, W.H.; Brooks, D.; Black, S.E.; McIlroy, W.E. Evaluation of Gait Symmetry after Stroke: A Comparison of Current Methods and Recommendations for Standardization. Gait Posture 2010, 31, 241–246. [Google Scholar] [CrossRef]
  12. Carda, S.; Cisari, C.; Invernizzi, M.; Bevilacqua, M. Osteoporosis after Stroke: A Review of the Causes and Potential Treatments. Cerebrovasc. Dis. 2009, 28, 191–200. [Google Scholar] [CrossRef]
  13. Brown, L.A.; Sleik, R.J.; Winder, T.R. Attentional Demands for Static Postural Control after Stroke. Arch. Phys. Med. Rehabil. 2002, 83, 1732–1735. [Google Scholar] [CrossRef]
  14. Pomeroy, V.M.; King, L.M.; Pollock, A.; Baily-Hallam, A.; Langhorne, P. Electrostimulation for Promoting Recovery of Movement or Functional Ability after Stroke. Cochrane Database Syst. Rev. 2006, 2006, CD003241. [Google Scholar] [CrossRef]
  15. Da Cunha, J.M.; Rech, K.D.; Salazar, A.P.; Pagnussat, A.S. Functional Electrical Stimulation of the Peroneal Nerve Improves Post-Stroke Gait Speed When Combined with Physiotherapy. A Systematic Review and Meta-Analysis. Ann. Phys. Rehabil. Med. 2021, 64, 101388. [Google Scholar] [CrossRef]
  16. Belfiore, P.; Miele, A.; Gallè, F.; Liguori, G. Adapted Physical Activity and Stroke: A Systematic Review. J. Sports Med. Phys. Fit. 2018, 58, 1867–1875. [Google Scholar] [CrossRef]
  17. Mazzucchelli, M.; Mazzoleni, D.; Campanini, I.; Merlo, A.; Mazzoli, D.; Melegari, C.; Colombo, V.; Cerulli, S.; Piscitelli, D.; Perin, C.; et al. Evidence-Based Improvement of Gait in Post-Stroke Patients Following Robot-Assisted Training: A Systematic Review. NeuroRehabilitation 2022, 51, 595–608. [Google Scholar] [CrossRef]
  18. Maggio, M.G.; Latella, D.; Maresca, G.; Sciarrone, F.; Manuli, A.; Naro, A.; De Luca, R.; Calabrò, R.S. Virtual Reality and Cognitive Rehabilitation in People With Stroke: An Overview. J. Neurosci. Nurs. 2019, 51, 101–105. [Google Scholar] [CrossRef]
  19. Choo, Y.J.; Chang, M.C. Effectiveness of an Ankle–Foot Orthosis on Walking in Patients with Stroke: A Systematic Review and Meta-Analysis. Sci. Rep. 2021, 11, 15879. [Google Scholar] [CrossRef] [PubMed]
  20. Aqueveque, P.; Ortega, P.; Pino, E.; Saavedra, F.; Germany, E.; Gómez, B. After Stroke Movement Impairments: A Review of Current Technologies for Rehabilitation. In Physical Disabilities—Therapeutic Implications; Tan, U., Ed.; InTech: Singapore, 2017; ISBN 978-953-51-3247-9. [Google Scholar]
  21. Marrone, F.; Pau, M.; Vismara, L.; Porta, M.; Bigoni, M.; Leban, B.; Cerfoglio, S.; Galli, M.; Mauro, A.; Cimolin, V. Synchronized Cyclograms to Assess Inter-Limb Symmetry during Gait in Post-Stroke Patients. Symmetry 2022, 14, 1560. [Google Scholar] [CrossRef]
  22. Marquez-Chin, C.; Popovic, M.R. Functional Electrical Stimulation Therapy for Restoration of Motor Function after Spinal Cord Injury and Stroke: A Review. BioMed Eng. OnLine 2020, 19, 34. [Google Scholar] [CrossRef]
  23. Kesar, T.M.; Perumal, R.; Reisman, D.S.; Jancosko, A.; Rudolph, K.S.; Higginson, J.S.; Binder-Macleod, S.A. Functional Electrical Stimulation of Ankle Plantarflexor and Dorsiflexor Muscles: Effects on Poststroke Gait. Stroke 2009, 40, 3821–3827. [Google Scholar] [CrossRef]
  24. York, G.; Chakrabarty, S. A Survey on Foot Drop and Functional Electrical Stimulation. Int. J. Intell. Robot. Appl. 2019, 3, 4–10. [Google Scholar] [CrossRef]
  25. Shin, H.E.; Kim, M.; Lee, D.; Jang, J.Y.; Soh, Y.; Yun, D.H.; Kim, S.; Yang, J.; Kim, M.K.; Lee, H.; et al. Therapeutic Effects of Functional Electrical Stimulation on Physical Performance and Muscle Strength in Post-Stroke Older Adults: A Review. Ann. Geriatr. Med. Res. 2022, 26, 16–24. [Google Scholar] [CrossRef]
  26. Lee, Y.; Kim, G.B.; Shin, S. Association Between Lower Limb Strength Asymmetry and Gait Asymmetry: Implications for Gait Variability in Stroke Survivors. J. Clin. Med. 2025, 14, 380. [Google Scholar] [CrossRef]
  27. Viteckova, S.; Kutilek, P.; Svoboda, Z.; Krupicka, R.; Kauler, J.; Szabo, Z. Gait Symmetry Measures: A Review of Current and Prospective Methods. Biomed. Signal Process. Control 2018, 42, 89–100. [Google Scholar] [CrossRef]
  28. Ekman, L.; Lindholm, E.; Brogren, E.; Dahlin, L.B. Normative Values of the Vibration Perception Thresholds at Finger Pulps and Metatarsal Heads in Healthy Adults. PLoS ONE 2021, 16, e0249461. [Google Scholar] [CrossRef]
  29. Lauzière, S.; Betschart, M.; Aissaou, R.; Nadeau, S. Understanding Spatial and Temporal Gait Asymmetries in Individuals Post Stroke. Int. J. Phys. Med. Rehabil. 2014, 2. [Google Scholar] [CrossRef]
  30. Zifchock, R.A.; Davis, I.; Higginson, J.; Royer, T. The Symmetry Angle: A Novel, Robust Method of Quantifying Asymmetry. Gait Posture 2008, 27, 622–627. [Google Scholar] [CrossRef] [PubMed]
  31. Kutilek, P.; Viteckova, S.; Svoboda, Z.; Smrcka, P. Kinematic Quantification of Gait Asymmetry in Patients with Peroneal Nerve Palsy Based on Bilateral Cyclograms. J. Musculoskelet. Neuronal Interact. 2013, 13, 244–250. [Google Scholar] [PubMed]
  32. Grieve, D.W. Gait Patterns and the Speed of Walking. Biomed. Eng. 1968, 3, 119–122. [Google Scholar]
  33. Goswami, A. A New Gait Parameterization Technique by Means of Cyclogram Moments: Application to Human Slope Walking. Gait Posture 1998, 8, 15–36. [Google Scholar] [CrossRef]
  34. Goswami, A. Kinematic Quantification of Gait Asymmetry Based on Bilateral Cyclograms. United States Patent Application No. US 2005/0004495A1, 6 January 2005. [Google Scholar]
  35. Hershler, C.; Milner, M. Angle-Angle Diagrams in the Assessment of Locomotion. Am. J. Phys. Med. 1980, 59, 109–125. [Google Scholar]
  36. Kutílek, P.; Slavka, V.; Zdeněk, S.; Vladimír, S.; Pavel, S. Kinematic Quantification of Gait Asymmetry Based on Characteristics of Angle-Angle Diagrams. Acta Polytech. Hung. 2014, 11, 25–38. [Google Scholar] [CrossRef]
  37. Pilkar, R.; Ramanujam, A.; Chervin, K.; Forrest, G.F.; Nolan, K.J. Cyclogram-Based Joint Symmetry Assessment After Utilization of a Foot Drop Stimulator During Post-Stroke Hemiplegic Gait. J. Biomech. Eng. 2018, 140, 121005. [Google Scholar] [CrossRef]
  38. Pau, M.; Leban, B.; Deidda, M.; Putzolu, F.; Porta, M.; Coghe, G.; Cocco, E. Kinematic Analysis of Lower Limb Joint Asymmetry During Gait in People with Multiple Sclerosis. Symmetry 2021, 13, 598. [Google Scholar] [CrossRef]
  39. Di Giminiani, R.; Di Lorenzo, D.; La Greca, S.; Russo, L.; Masedu, F.; Totaro, R.; Padua, E. Angle-Angle Diagrams in the Assessment of Locomotion in Persons with Multiple Sclerosis: A Preliminary Study. Appl. Sci. 2022, 12, 7223. [Google Scholar] [CrossRef]
  40. Porta, M.; Pau, M.; Leban, B.; Deidda, M.; Sorrentino, M.; Arippa, F.; Marongiu, G. Lower Limb Kinematics in Individuals with Hip Osteoarthritis during Gait: A Focus on Adaptative Strategies and Interlimb Symmetry. Bioengineering 2021, 8, 47. [Google Scholar] [CrossRef]
  41. Pau, M.; Cerfoglio, S.; Capodaglio, P.; Marrone, F.; Grugni, G.; Porta, M.; Leban, B.; Galli, M.; Cimolin, V. Cyclogram-Based Evaluation of Inter-Limb Gait Symmetry in Prader-Willi Syndrome. Gait Posture 2024, 112, 167–172. [Google Scholar] [CrossRef] [PubMed]
  42. Pau, M.; Cerfoglio, S.; Capodaglio, P.; Marrone, F.; Mendolicchio, L.; Porta, M.; Leban, B.; Galli, M.; Cimolin, V. Synchronized Cyclograms to Assess Inter-Limb Symmetry during Gait in Women with Anorexia and Bulimia: A Retrospective Study. Symmetry 2023, 15, 2200. [Google Scholar] [CrossRef]
  43. Kutilek, P.; Hejda, J.; Svoboda, Z. Kinematic Quantification of Gait Asymmetry in Patients with Elastic Ankle Wrap Based on Cyclograms. In XIII Mediterranean Conference on Medical and Biological Engineering and Computing 2013; Roa Romero, L.M., Ed.; IFMBE Proceedings; Springer International Publishing: Cham, Switzerland, 2014; Volume 41, pp. 117–120. ISBN 978-3-319-00845-5. [Google Scholar]
  44. Kutilek, P.; Socha, V.; Viteckova, S.; Svoboda, Z. Quantification of Gait Asymmetry in Patients with Ankle Foot Orthoses Based on Hip–Hip Cyclograms. Biocybern. Biomed. Eng. 2014, 34, 46–52. [Google Scholar] [CrossRef]
  45. Lee, H.S.; Ryu, H.; Lee, S.-U.; Cho, J.; You, S.; Park, J.H.; Jang, S.-H. Analysis of Gait Characteristics Using Hip-Knee Cyclograms in Patients with Hemiplegic Stroke. Sensors 2021, 21, 7685. [Google Scholar] [CrossRef]
  46. Damiano, D.L.; Prosser, L.A.; Curatalo, L.A.; Alter, K.E. Muscle Plasticity and Ankle Control After Repetitive Use of a Functional Electrical Stimulation Device for Foot Drop in Cerebral Palsy. Neurorehabil Neural Repair. 2013, 27, 200–207. [Google Scholar] [CrossRef]
  47. Everaert, D.G.; Stein, R.B.; Abrams, G.M.; Dromerick, A.W.; Francisco, G.E.; Hafner, B.J.; Huskey, T.N.; Munin, M.C.; Nolan, K.J.; Kufta, C.V. Effect of a Foot-Drop Stimulator and Ankle–Foot Orthosis on Walking Performance After Stroke: A Multicenter Randomized Controlled Trial. Neurorehabil Neural Repair. 2013, 27, 579–591. [Google Scholar] [CrossRef] [PubMed]
  48. Kluding, P.M.; Dunning, K.; O’Dell, M.W.; Wu, S.S.; Ginosian, J.; Feld, J.; McBride, K. Foot Drop Stimulation Versus Ankle Foot Orthosis After Stroke: 30-Week Outcomes. Stroke 2013, 44, 1660–1669. [Google Scholar] [CrossRef]
  49. Hwang, D.-Y.; Lee, H.-J.; Lee, G.-C.; Lee, S.-M. Treadmill Training with Tilt Sensor Functional Electrical Stimulation for Improving Balance, Gait, and Muscle Architecture of Tibialis Anterior of Survivors with Chronic Stroke: A Randomized Controlled Trial. Technol. Health Care 2015, 23, 443–452. [Google Scholar] [CrossRef]
  50. Lee, H.-J.; Cho, K.-H.; Lee, W.-H. The Effects of Body Weight Support Treadmill Training with Power-Assisted Functional Electrical Stimulation on Functional Movement and Gait in Stroke Patients. Am. J. Phys. Med. Rehabil. 2013, 92, 1051–1059. [Google Scholar] [CrossRef] [PubMed]
  51. Hesse, S. Locomotor Therapy in Neurorehabilitation. NeuroRehabilitation 2001, 16, 133–139. [Google Scholar] [CrossRef]
  52. Davis, R.B.; Õunpuu, S.; Tyburski, D.; Gage, J.R. A Gait Analysis Data Collection and Reduction Technique. Hum. Mov. Sci. 1991, 10, 575–587. [Google Scholar] [CrossRef]
  53. Crenshaw, S.J.; Richards, J.G. A Method for Analyzing Joint Symmetry and Normalcy, with an Application to Analyzing Gait. Gait Posture 2006, 24, 515–521. [Google Scholar] [CrossRef]
  54. Park, J.H.; Lee, H.; Cho, J.; Kim, I.; Lee, J.; Jang, S.H. Effects of Knee Osteoarthritis Severity on Inter-Joint Coordination and Gait Variability as Measured by Hip-Knee Cyclograms. Sci. Rep. 2021, 11, 1789. [Google Scholar] [CrossRef]
  55. Capodaglio, P.; Leban, B.; Porta, M.; Galli, M.; Cimolin, V. Kinematics Adaptation and Inter-Limb Symmetry during Gait in Obese Adults. Sensors 2021, 21, 5980. [Google Scholar] [CrossRef] [PubMed]
  56. Ernst, J.; Grundey, J.; Hewitt, M.; Von Lewinski, F.; Kaus, J.; Schmalz, T.; Rohde, V.; Liebetanz, D. Towards Physiological Ankle Movements with the ActiGait Implantable Drop Foot Stimulator in Chronic Stroke. Restor. Neurol. Neurosci. 2013, 31, 557–569. [Google Scholar] [CrossRef] [PubMed]
  57. Dunning, K.; O’Dell, M.W.; Kluding, P.; McBride, K. Peroneal Stimulation for Foot Drop After Stroke: A Systematic Review. Am. J. Phys. Med. Rehabil. 2015, 94, 649–664. [Google Scholar] [CrossRef]
  58. Gök, H.; Küçükdeveci, A.; Altinkaynak, H.; Yavuzer, G.; Ergin, S. Effects of Ankle-Foot Orthoses on Hemiparetic Gait. Clin. Rehabil. 2003, 17, 137–139. [Google Scholar] [CrossRef] [PubMed]
  59. Routson, R.L.; Clark, D.J.; Bowden, M.G.; Kautz, S.A.; Neptune, R.R. The Influence of Locomotor Rehabilitation on Module Quality and Post-Stroke Hemiparetic Walking Performance. Gait Posture 2013, 38, 511–517. [Google Scholar] [CrossRef]
  60. Pittock, S.J.; Moore, A.P.; Hardiman, O.; Ehler, E.; Kovac, M.; Bojakowski, J.; Al Khawaja, I.; Brozman, M.; Kaňovský, P.; Skorometz, A.; et al. A Double-Blind Randomised Placebo-Controlled Evaluation of Three Doses of Botulinum Toxin Type A (Dysport®) in the Treatment of Spastic Equinovarus Deformity after Stroke. Cerebrovasc. Dis. 2003, 15, 289–300. [Google Scholar] [CrossRef]
  61. Everaert, D.G.; Thompson, A.K.; Chong, S.L.; Stein, R.B. Does Functional Electrical Stimulation for Foot Drop Strengthen Corticospinal Connections? Neurorehabil. Neural Repair. 2010, 24, 168–177. [Google Scholar] [CrossRef]
  62. Ring, H.; Treger, I.; Gruendlinger, L.; Hausdorff, J.M. Neuroprosthesis for Footdrop Compared with an Ankle-Foot Orthosis: Effects on Postural Control during Walking. J. Stroke Cerebrovasc. Dis. 2009, 18, 41–47. [Google Scholar] [CrossRef]
  63. Kottink, A.I.R.; Oostendorp, L.J.M.; Buurke, J.H.; Nene, A.V.; Hermens, H.J.; IJzerman, M.J. The Orthotic Effect of Functional Electrical Stimulation on the Improvement of Walking in Stroke Patients with a Dropped Foot: A Systematic Review. Artif. Organs 2004, 28, 577–586. [Google Scholar] [CrossRef]
  64. Cunha, M.J.D.; Pinto, C.; Zanfir, B.; Cimolin, V.; Pagnussat, A.S. Combining Foot Drop Stimulation Devices with Gait Training Improves Gait, Active Ankle Movement of Chronic Poststroke Individuals. J. Prosthet. Orthot. 2022, 34, 213–222. [Google Scholar] [CrossRef]
Figure 1. Example of inter-limb cyclograms of the hip joint for one of the participants, calculated before (red curve) and after (blue curve) the FDS treatment. The solid black line indicates the case of perfect symmetry (i.e., 45°) while the red and blue dashed lines refer to the cyclograms orientation. Reduction of cyclogram area and of the orientation angle with respect to the 45° line indicate improvement of inter-limb coordination.
Symmetry 17 00631 g001
Table 1. Participant characteristics. Values are expressed as mean (SD) for continuous variables and as counts (%) for categorical variables. Fugl-Meyer Lower Limb (FML) score and time since stroke are reported as median (min–max) while Modified Ashworth Scale (MAS) is presented as frequency counts across score levels.
GroupStroke (n = 21)Control Group (n = 48)
Gender, n (%)
Male12 (57.1%)29 (60.4%)
Female9 (42.9%)19 (39.6%)
Age (years)55.8 (9.30)54.4 (12.5)
Height (m)1.69 (0.08)1.68 (0.08)
Body mass (kg)74.48 (12.27)67.92 (11.68)
Time since stroke (months), median (min–max)35 (6–96)
Stroke type, n (%)
Ischemic16 (76%)
Hemorrhagic6 (14%)
Affected hemisphere, n (%)
Right8 (38%)
Left13 (62%)
FMA-LL (0–34), median (min–max)21 (11–32)
MAS, frequency (0/1/1+/2/3/4)
Plantiflexors0/3/2/2/6/8
Knee extensors5/3/4/2/5/2
Adductors5/3/2/6/5/0
Note: FMA-LL = Fugl Meyer Assessment—Lower Limb; MAS = Modified Ashworth Scale; max= maximum; min= minimum; n = number of participants.
Table 2. Spatio-temporal parameters of gait of the participants before and after the treatment and of the Control Group. Values are expressed as mean (SD). The symbol * denotes a statistically significant difference when comparing the Pre-treatment and control group: Student’s t-test (p < 0.05). GC: Gait Cycle.
Pre-TreatmentPost-TreatmentControl Group
Affected LimbNon-Affected LimbAffected LimbNon-Affected Limb
Gait speed (m/s)0.56 (0.25) *0.58 (0.23) *1.23 (0.19)
Cadence (steps/min)84.27 (19.26) *85.90 (17.58) *111.6 (10.7)
Step length (m)0.33 (0.14) *0.42 (0.12) *0.36 (0.14) *0.44 (0.10) *0.66 (0.06)
Stance phase (% GC)75.93 (6.76) *64.58 (6.69) *74.04 (5.88) *64.15 (7.53) *59.49 (1.73)
Swing phase (% GC)23.70 (6.87) *35.06 (7.14) *25.93 (6.00) *36.19 (6.10) *40.41 (1.46)
Double support phase (% GC)16.65 (5.03)24.18 (9.45)15.29 (4.69)23.57 (9.32)19.59 (1.79)
Table 3. Dynamic Range of Motion (ROM) of the participants during gait before and after the treatment. Values are expressed as mean (SD). The symbol + denotes a statistically significant difference between Pre- and Post-treatment; The symbol * denotes a statistically significant difference when comparing the Pre-treatment and control group: Student’s t-test (p < 0.05).
Pre-TreatmentPost-TreatmentControl Group
Affected LimbNon-Affected LimbAffected LimbNon-Affected Limb
Hip ROM (degrees)29.81 (10.14) *43.94 (9.47)31.34 (10.14) +*43.79 (8.78)45.88 (4.57)
Knee ROM (degrees)31.94 (12.31) *48.00 (9.93) *34.69 (12.99) +*49.35 (8.38) *59.76 (4.27)
Ankle ROM (degrees)19.30 (6.95) *29.31 (9.17)21.30 (10.10) *27.86 (9.02)28.60 (6.02)
Table 4. Inter-limb cyclogram parameters for hip, knee and ankle joints of before and after the treatment. Values are expressed as mean (SD). The symbol + denotes a statistically significant difference between Pre- and Post-treatment; The symbol * denotes a statistically significant difference when comparing the Pre-treatment and control group: Student’s t-test (p < 0.05).
ParameterJointPre-TreatmentPost-TreatmentControl Group
Cyclogram area (degrees2)Hip391.58 (237.15) *422.09 (278.67) *96.79 (84.74)
Cyclogram orientation ϕ (degrees)13.35 (9–82) *10.65 (8.19) +*1.63 (1.24)
Trend Symmetry19.09 (14.29) *15.46 (2.56) +*1.66 (1.26)
Cyclogram area (degrees2)Knee436.30 (311.13) *496.36 (353.95) *273.43 (177.67)
Cyclogram orientation ϕ (degrees)22.80 (23.19) *25.17 (21.16) *1.37 (1.39)
Trend Symmetry30.23 (33.16) *31.79 (31.78) *1.35 (1.39)
Cyclogram area (degrees2)Ankle139.02 (87.00) *134.91 (87.67) *67.84 (49.72)
Cyclogram orientation ϕ (degrees)25.61 (15.77) *26.24 (3.87) *3.17 (2.95)
Trend Symmetry25.83 (16.21) *28.37 (27.19) *2.89 (2.67)
Disclaimer/Publisher’s Note: The statements, opinions and data contained in all publications are solely those of the individual author(s) and contributor(s) and not of MDPI and/or the editor(s). MDPI and/or the editor(s) disclaim responsibility for any injury to people or property resulting from any ideas, methods, instructions or products referred to in the content.

