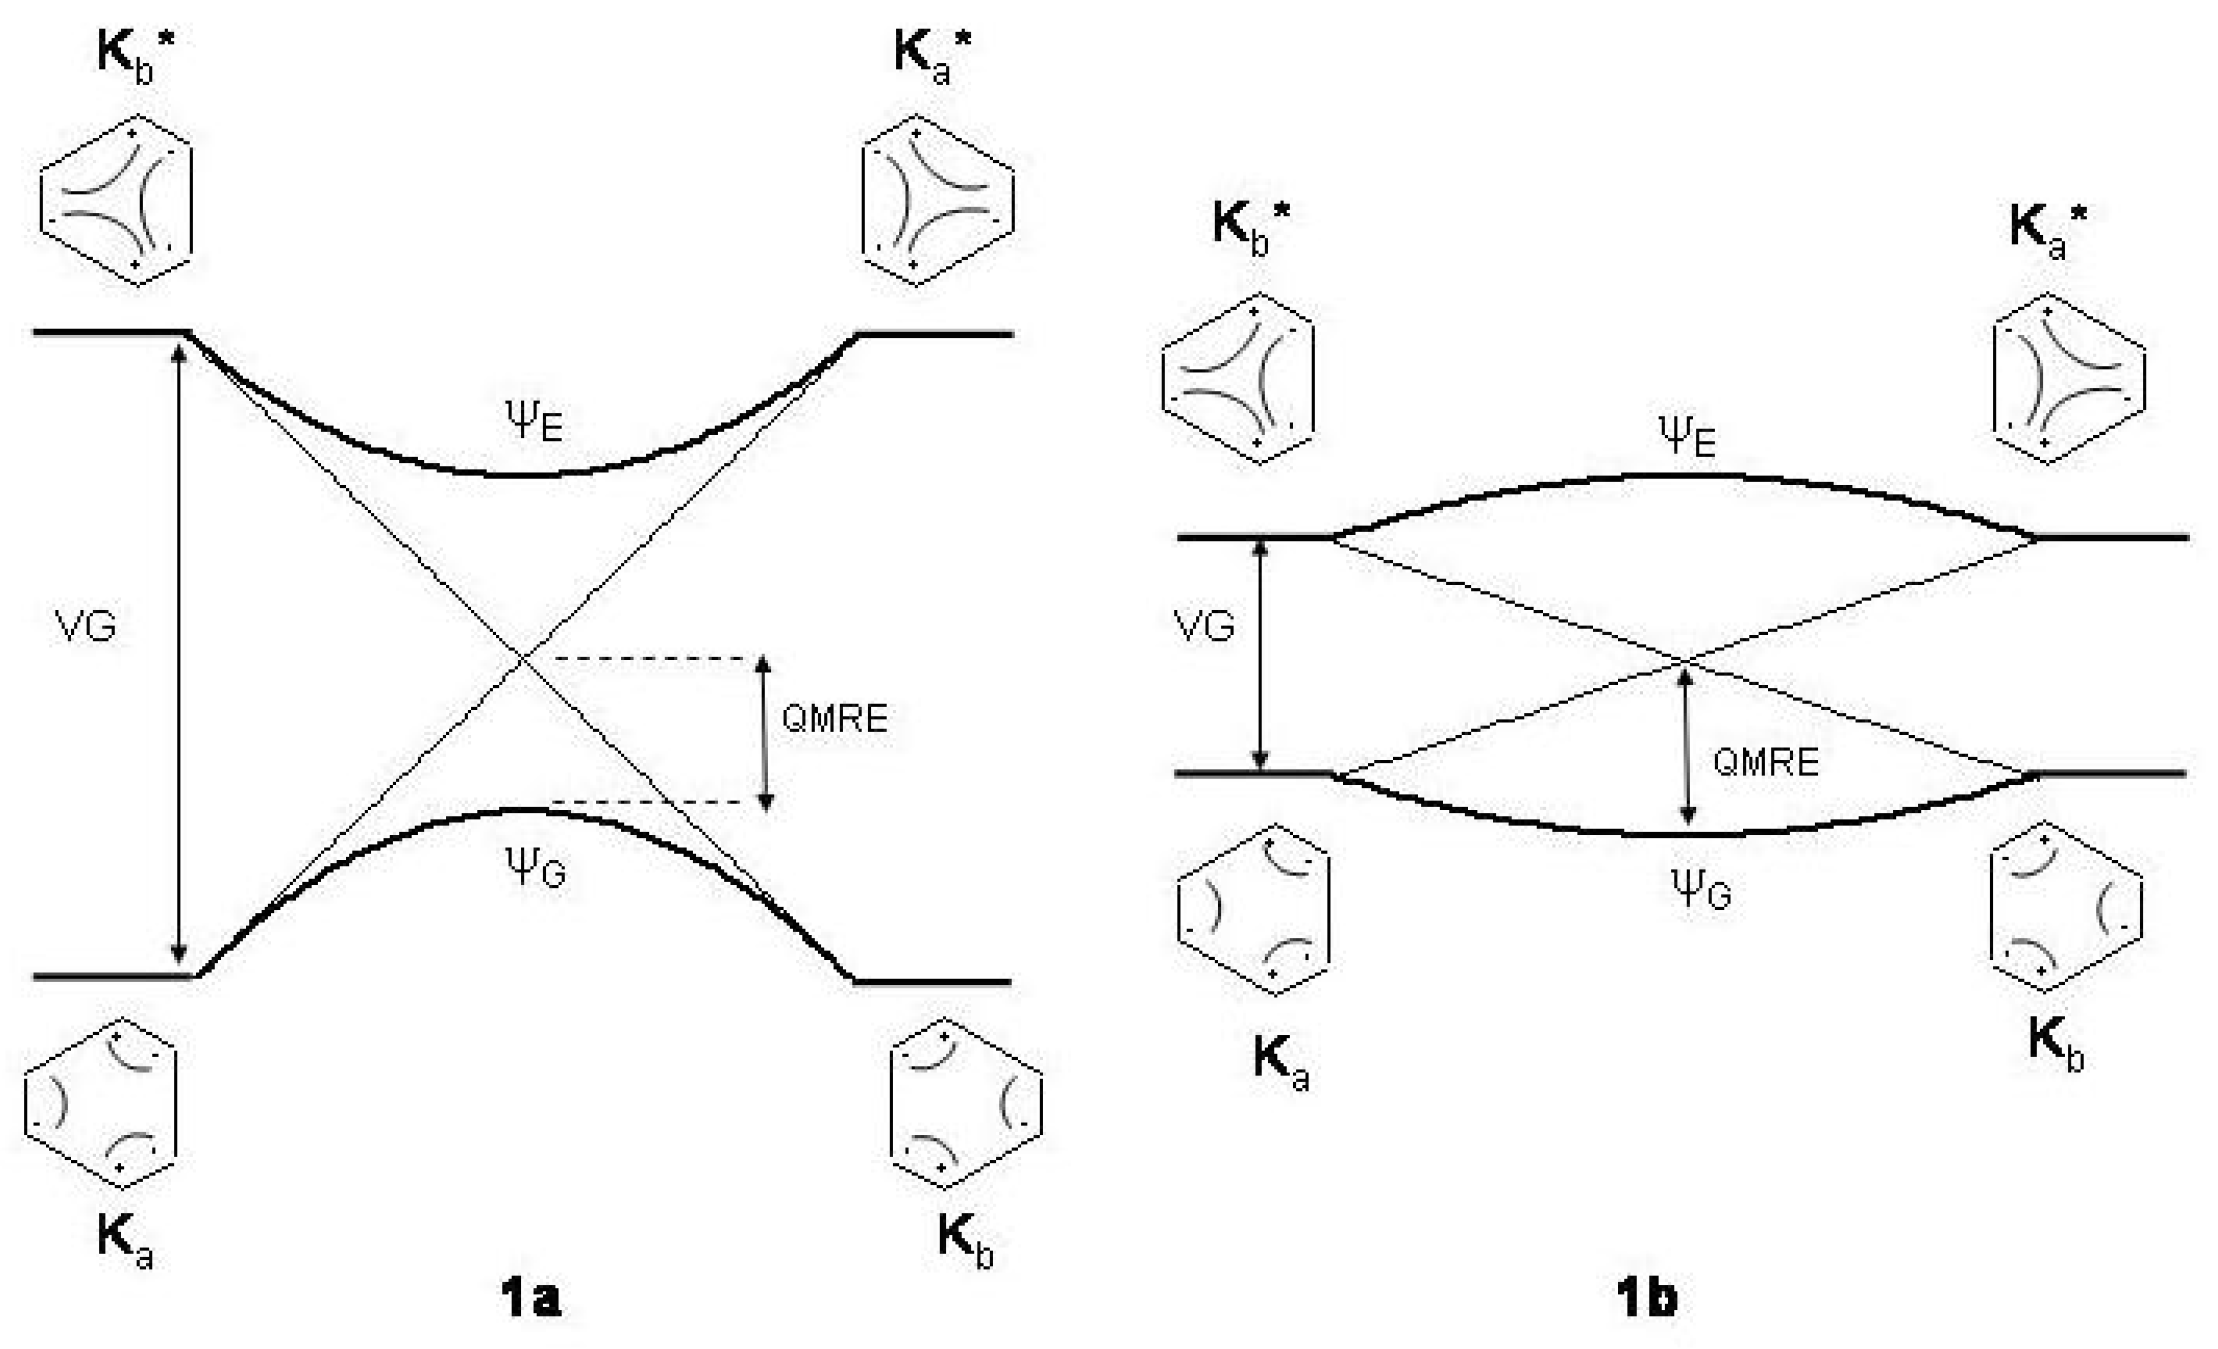
Figure 1.
The bond exchange process between the two alternating structures of benzene: , ground state (G) structures; , excited state (E) structures conserving electron pairing. and : wave functions after and mixing. Light and heavy lines: unperturbed and perturbed energy profiles. For the sake of clarity the correlation diagrams between the Kekule’ structures have been assumed to be linearly dependent on the bond alternating coordinate . Bond alternating (1a) and bond equalized (1b) structures are stabilized according to the height of the vertical gap (). : quantum mechanical resonance energy, equal in both cases.
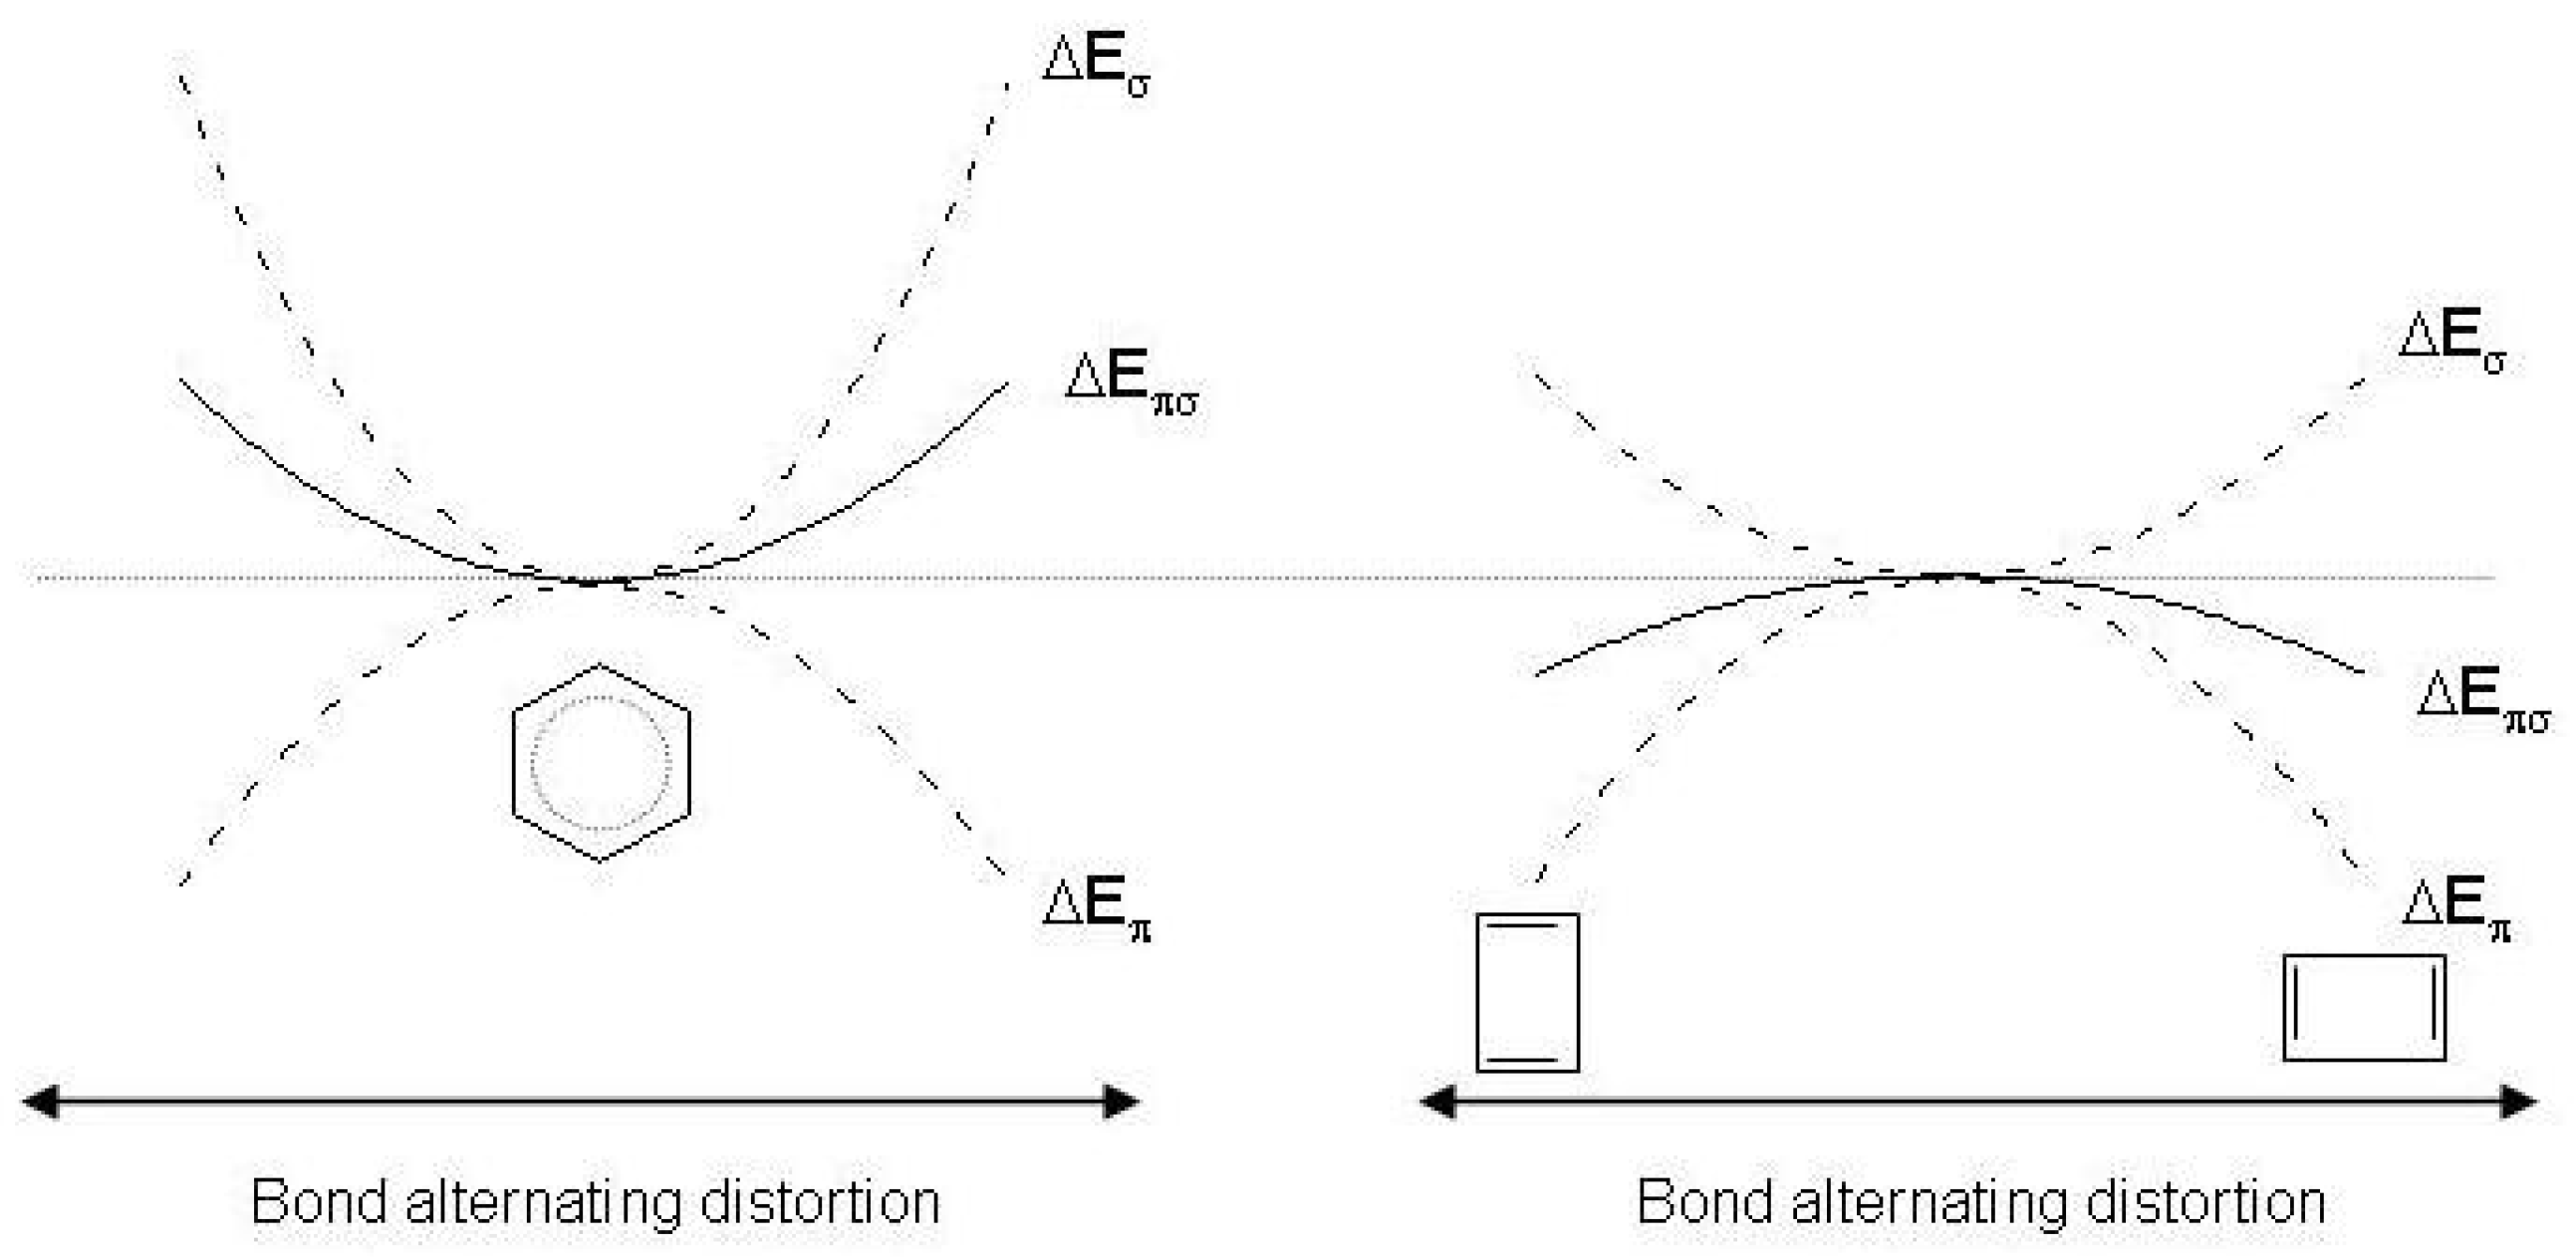
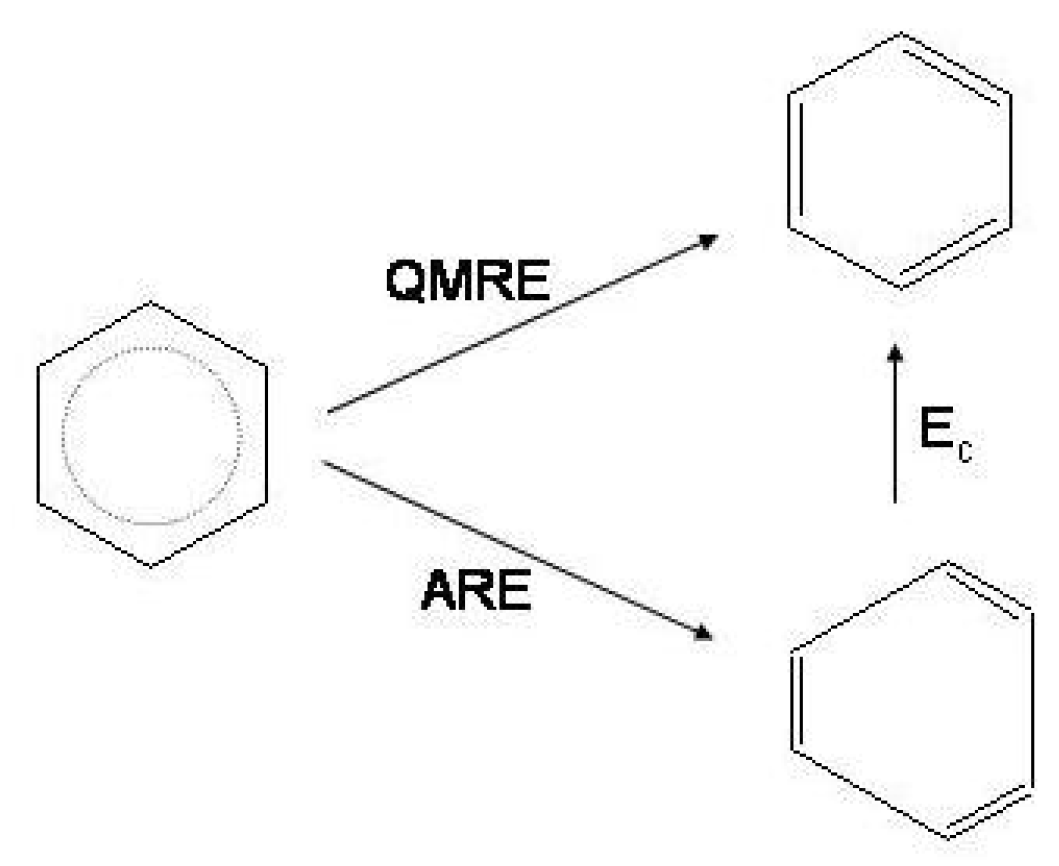
Figure 2.
Schematic representation of the and response to distortion in benzene (left) and cyclobutadiene (right). and are the energy changes as a result of the bond alternating distortion and .
Figure 2.
Schematic representation of the and response to distortion in benzene (left) and cyclobutadiene (right). and are the energy changes as a result of the bond alternating distortion and .
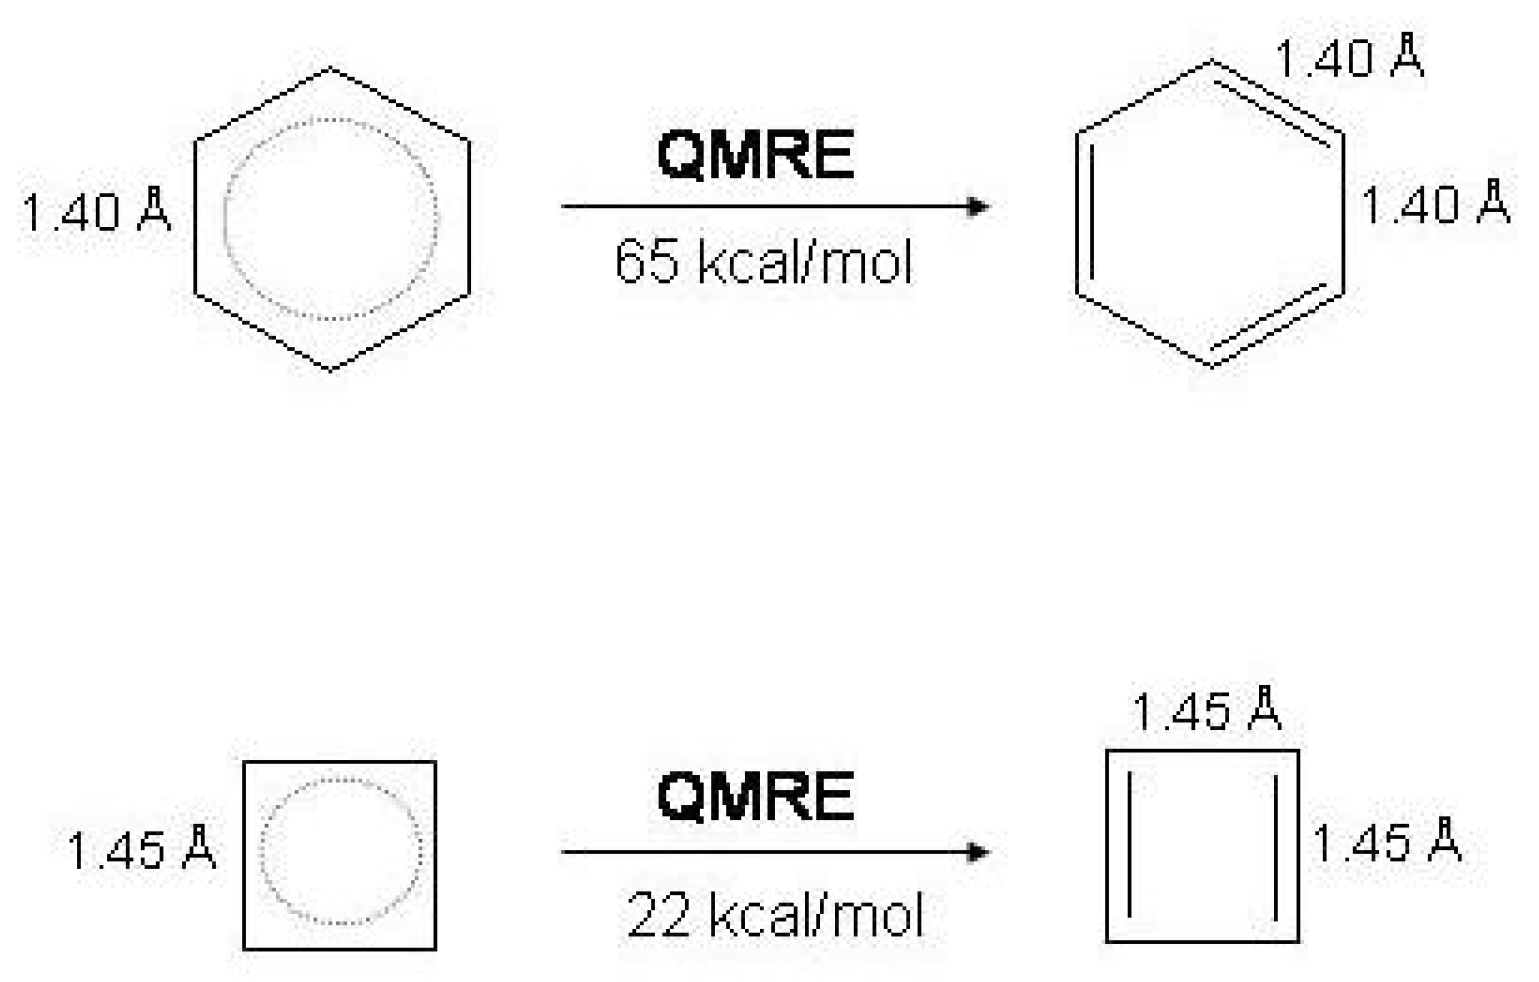
Figure 3.
Quantum mechanical energy resonance (
) in benzene and cyclobutadiene at the bond equalized geometries of
and
symmetry, respectively (VBSCF/6-31G calculation [
17]).
Figure 3.
Quantum mechanical energy resonance (
) in benzene and cyclobutadiene at the bond equalized geometries of
and
symmetry, respectively (VBSCF/6-31G calculation [
17]).
Figure 4.
Relation between and in benzene. represents the compression energy from the non-conjugated optimized to the non-conjugated bond-equalized geometry.
Figure 4.
Relation between and in benzene. represents the compression energy from the non-conjugated optimized to the non-conjugated bond-equalized geometry.
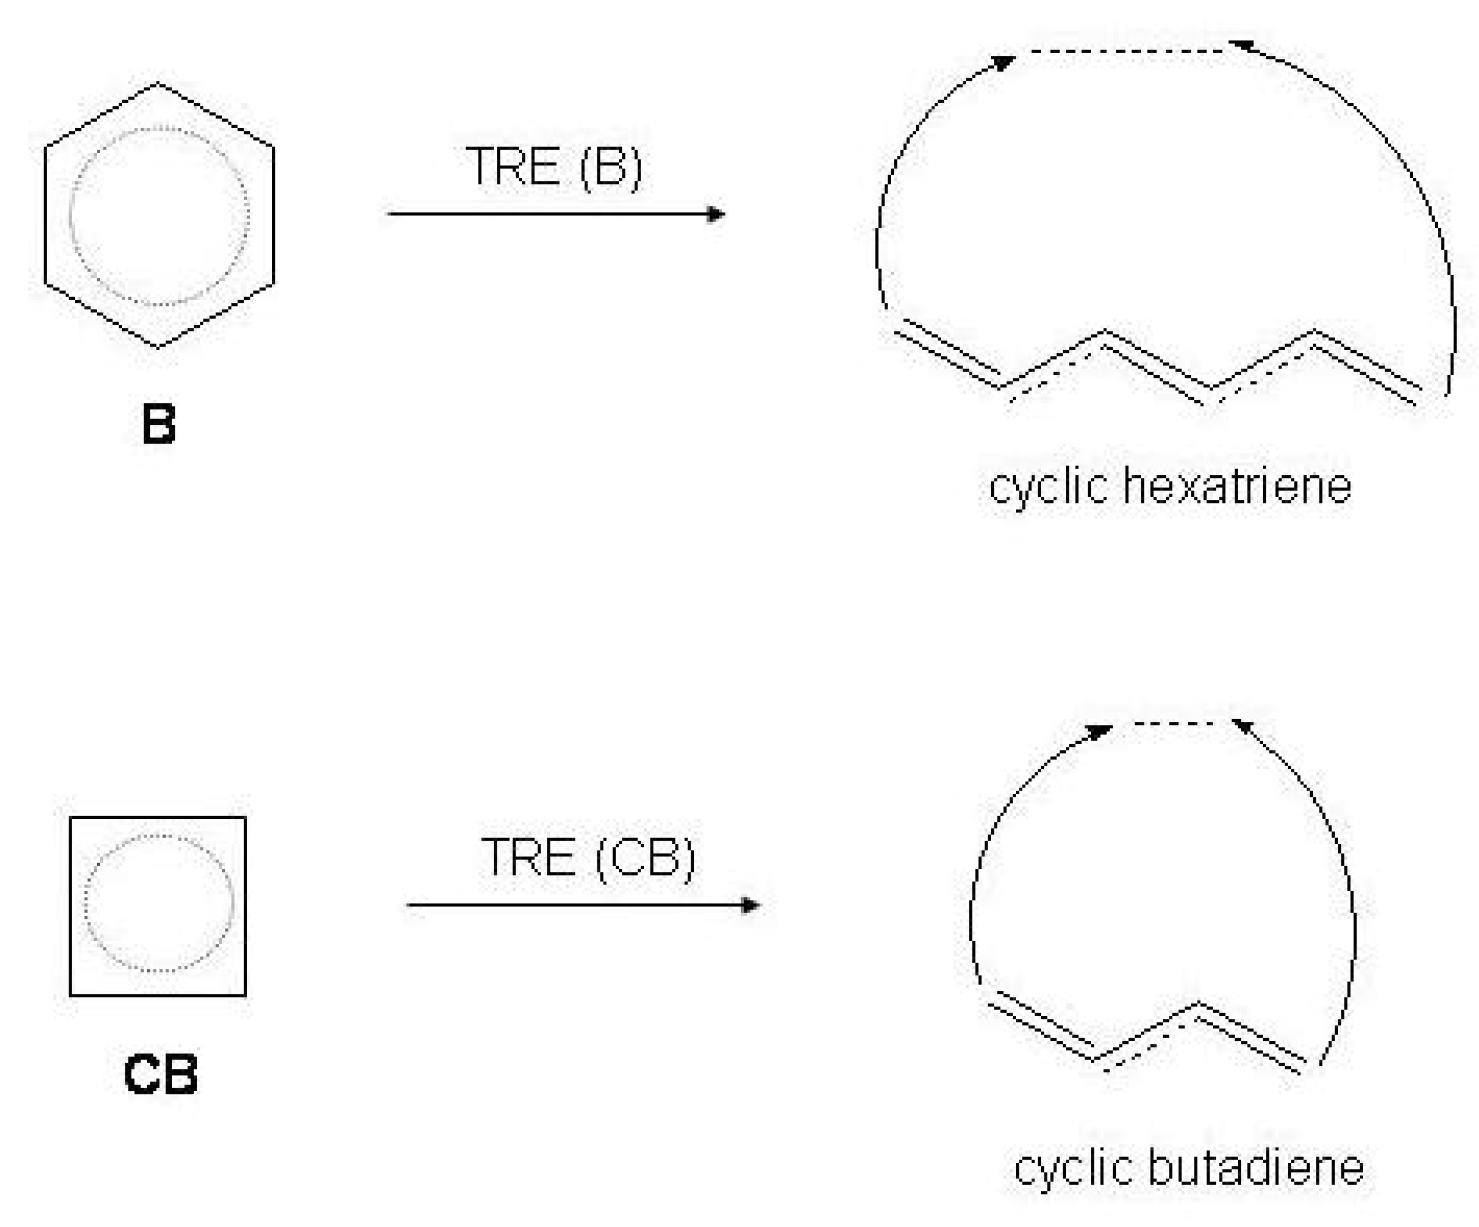
Figure 5.
Thermochemical resonance energy () of benzene and cyclobutadiene with respect to the cyclic reference of polyenic origin, i.e., cyclic hexatriene and cyclic butadiene.
Figure 5.
Thermochemical resonance energy () of benzene and cyclobutadiene with respect to the cyclic reference of polyenic origin, i.e., cyclic hexatriene and cyclic butadiene.
Figure 6.
Examples of homodesmotic reactions of benzene and cyclobutadiene.
Figure 6.
Examples of homodesmotic reactions of benzene and cyclobutadiene.
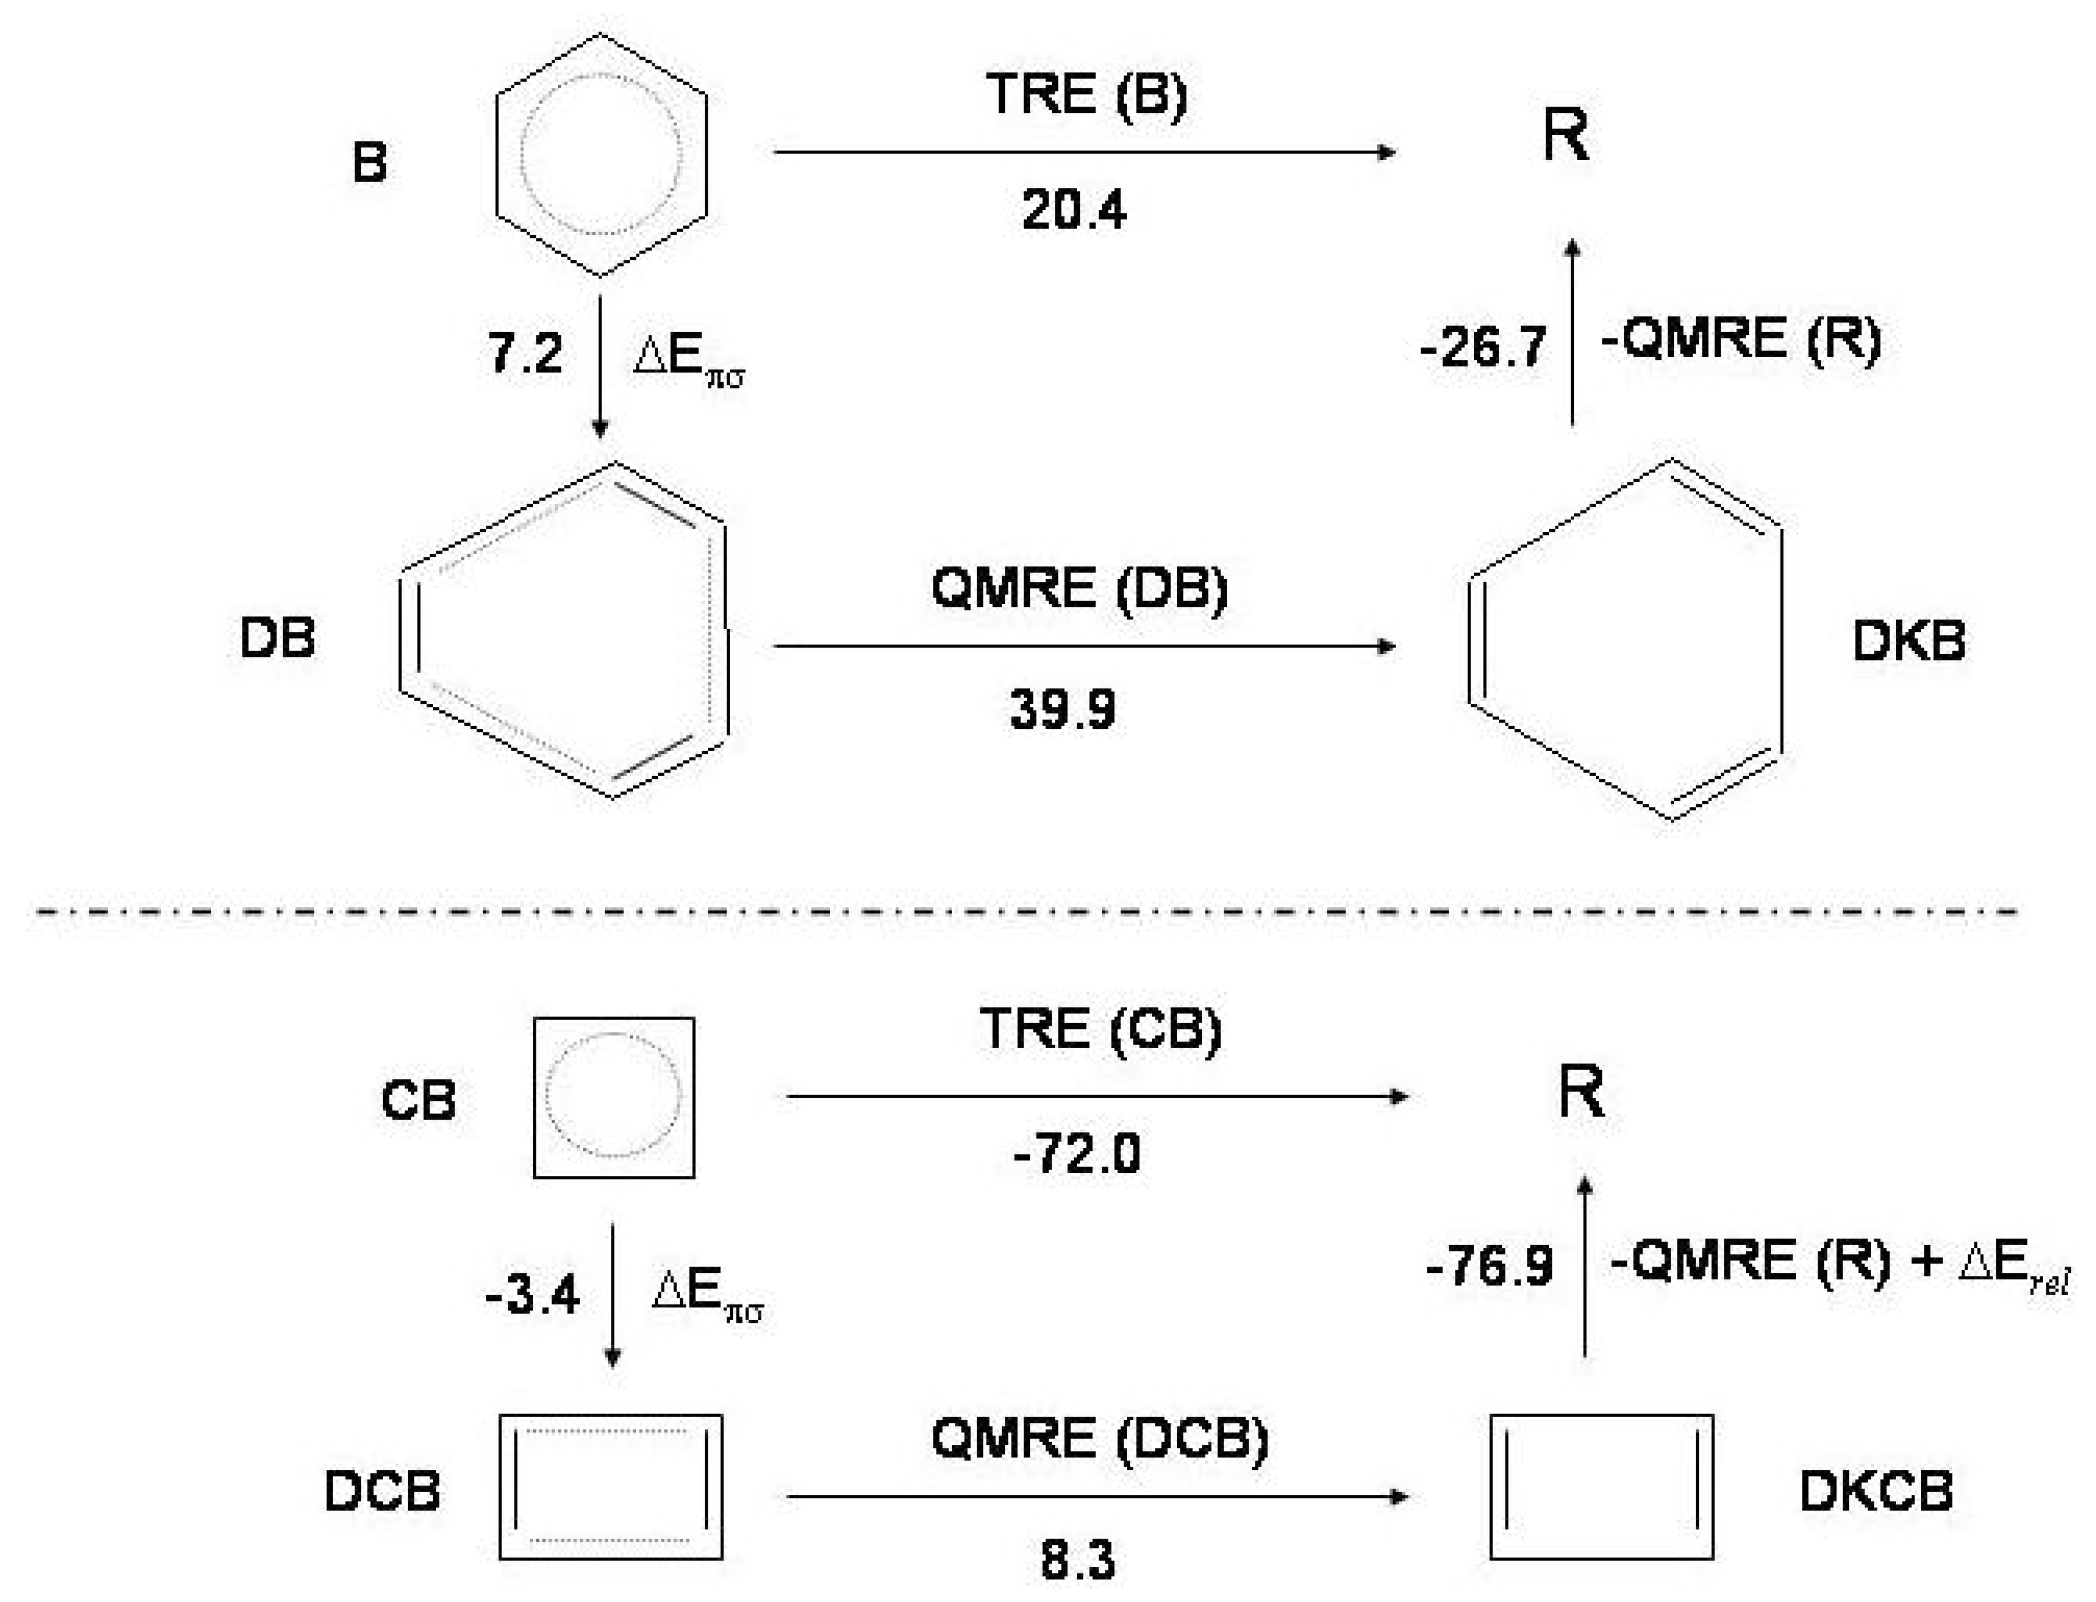
Figure 7.
The thermochemical cycle for benzene (
B, upper) and cyclobutadiene (
, lower):
distorted
;
Kekule’ structures of distorted
(see text for explanation of these acronyms);
R reference molecule, cyclic hexatriene and cyclic butadiene.
and
: thermal and quantum mechanical resonance energies.
: relaxation energy due to angle strain and
overlap in cyclobutadiene; this term is not considered for benzene [
17]. The energy values (kcal/mol) characterizing the thermochemical cycle of benzene and cyclobutadiene are indicated.
Figure 8.
Upper: molecular orbitals of cyclobutadiene with energies, symmetry labels ( symmetry) and representation in terms of atomic orbitals. Lower: valence bond configurations contributing to the low energy states of cyclobutadiene.
Figure 8.
Upper: molecular orbitals of cyclobutadiene with energies, symmetry labels ( symmetry) and representation in terms of atomic orbitals. Lower: valence bond configurations contributing to the low energy states of cyclobutadiene.
Figure 9.
The valence isomerization or bond shifting process in cyclobutadiene.
Figure 9.
The valence isomerization or bond shifting process in cyclobutadiene.
Figure 10.
Energy profiles (a.u.) of the lowest four states of cyclobutadiene (
,
,
,
in
symmetry in order of increasing energy) as a function of the rectangular and rhomboidal distortion. Adapted MRCCSD(T) results [
90]. The state correlation for the square (
) → rectangular (
) distortion is
,
,
and
. The state correlation for the square (
) → rhomboidal (
) distortion is
,
,
and
.
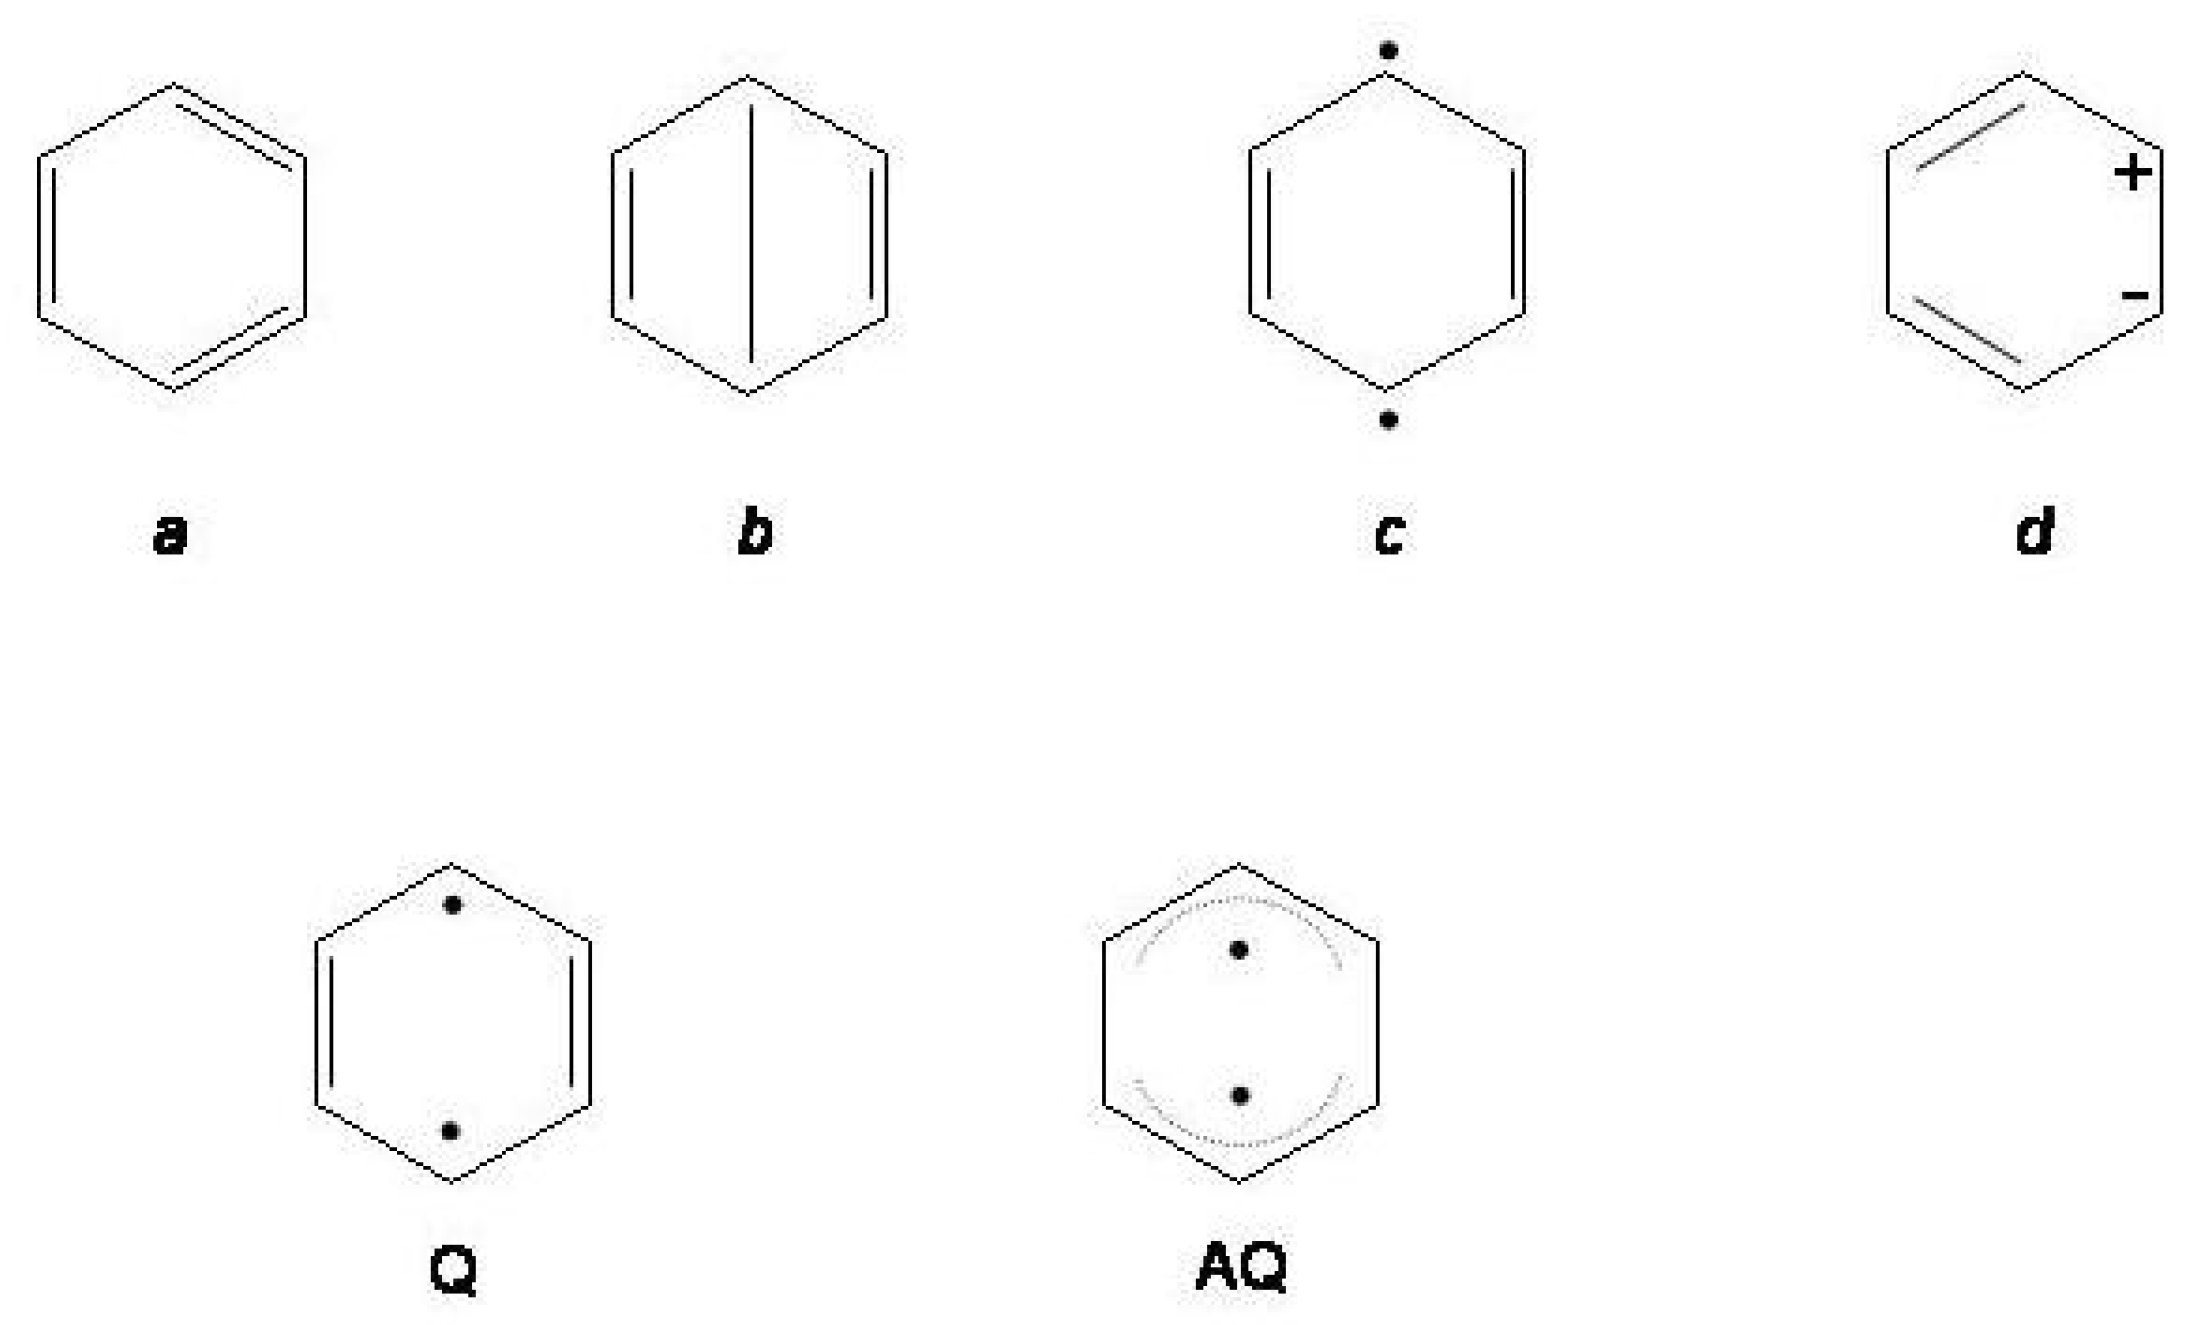
Figure 11.
Upper row: valence bond configurations contributing to covalent and ionic states of benzene. Lower row: quinoidal (Q) and antiquinoidal () structures of the second excited singlet of benzene.
Figure 11.
Upper row: valence bond configurations contributing to covalent and ionic states of benzene. Lower row: quinoidal (Q) and antiquinoidal () structures of the second excited singlet of benzene.
Figure 12.
The molecular structure of cyclooctatetraene in
symmetry, femtosecond measurement [
144] and electron diffraction data (in parentheses) [
141].
Figure 12.
The molecular structure of cyclooctatetraene in
symmetry, femtosecond measurement [
144] and electron diffraction data (in parentheses) [
141].
Figure 13.
Ring inversion () and bond shifting () between the four conformational isomers of cyclooctatetraene.
Figure 13.
Ring inversion () and bond shifting () between the four conformational isomers of cyclooctatetraene.
Figure 14.
On the left,
cyclooctatetraene and
,
transition states of
and
symmetry; on the right cyclooctatetraene isomers (crown, chair and bicyclo[4.2.0]octa-2,4,7-triene,
,
and
symmetry, respectively). Structural parameters (Å) and energies (kcal/mol) relative to
minimum, reported results [
148] (MP2-CASSCF//CASSCF/6-31G* calculations). Experimental energy values (kcal/mol) of the
and
transition states are given in parentheses [
151].
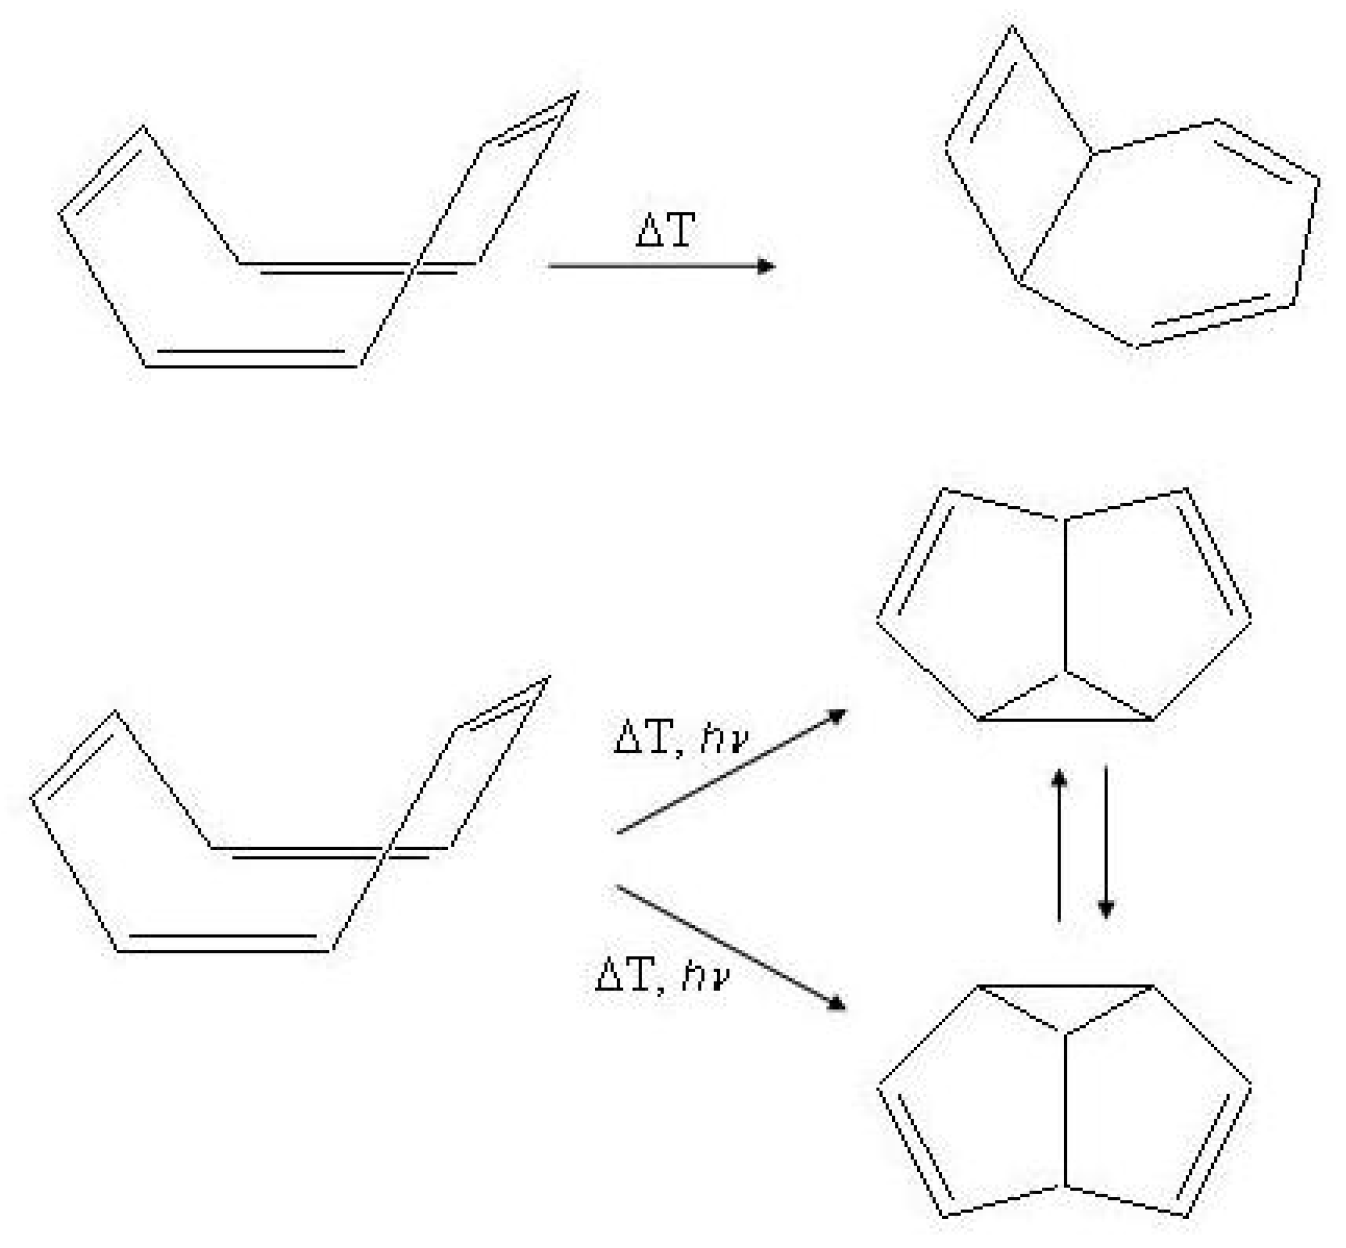
Figure 15.
Photochemical and thermal isomerization processes in cyclooctatetraene.
Figure 15.
Photochemical and thermal isomerization processes in cyclooctatetraene.
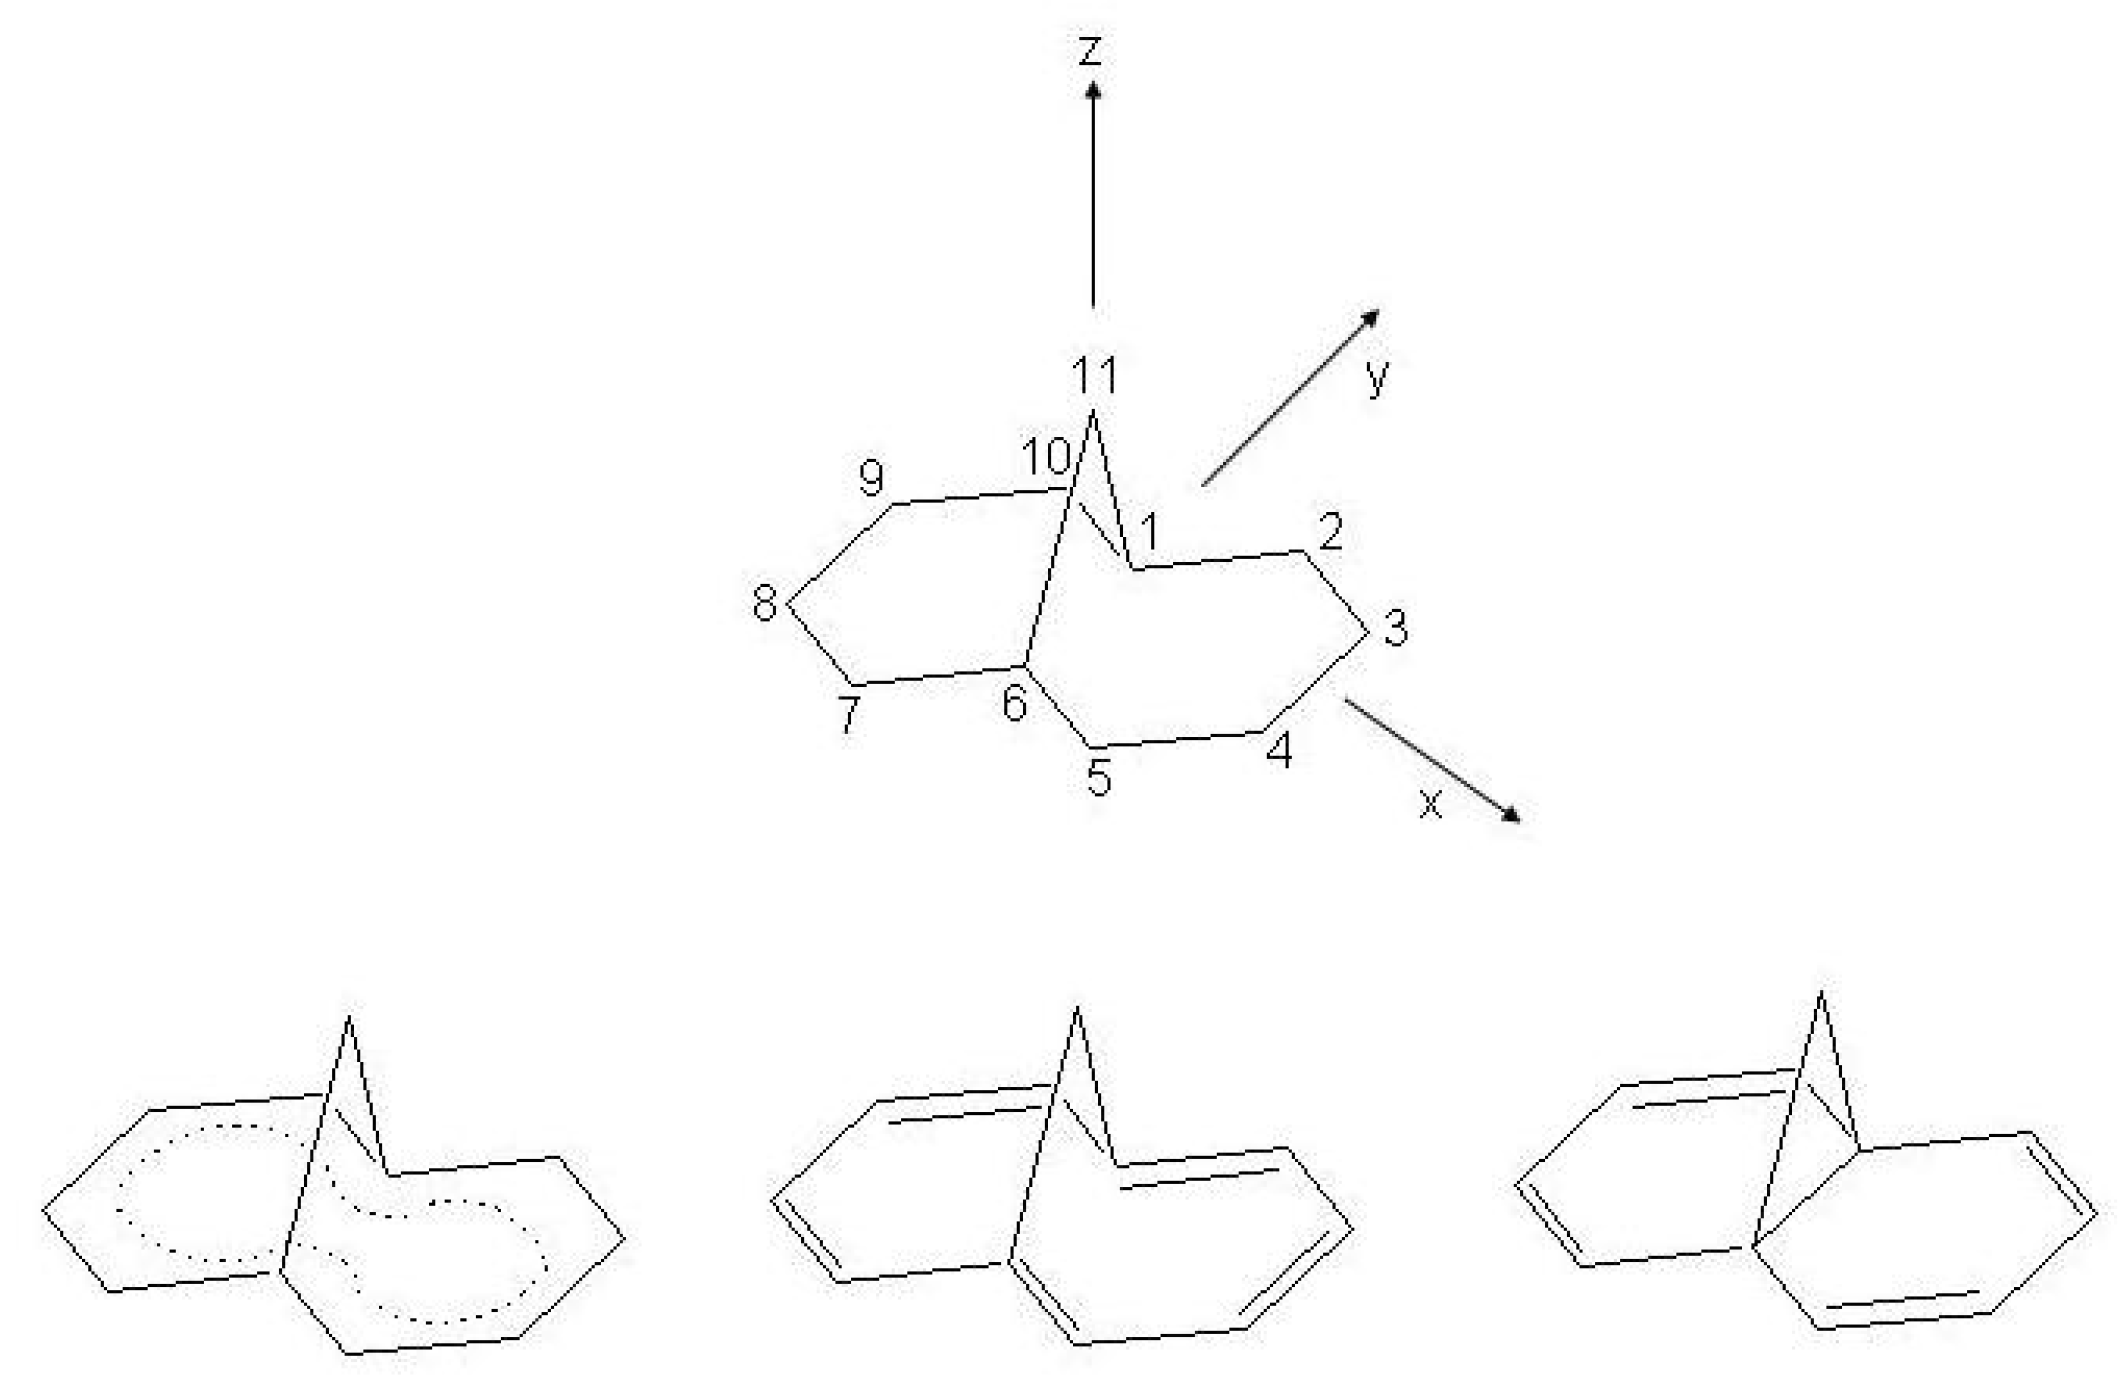
Figure 16.
Pentalene: upper (a), atomic numbering and reference axes; lower (b), valence isomerization between structures.
Figure 16.
Pentalene: upper (a), atomic numbering and reference axes; lower (b), valence isomerization between structures.
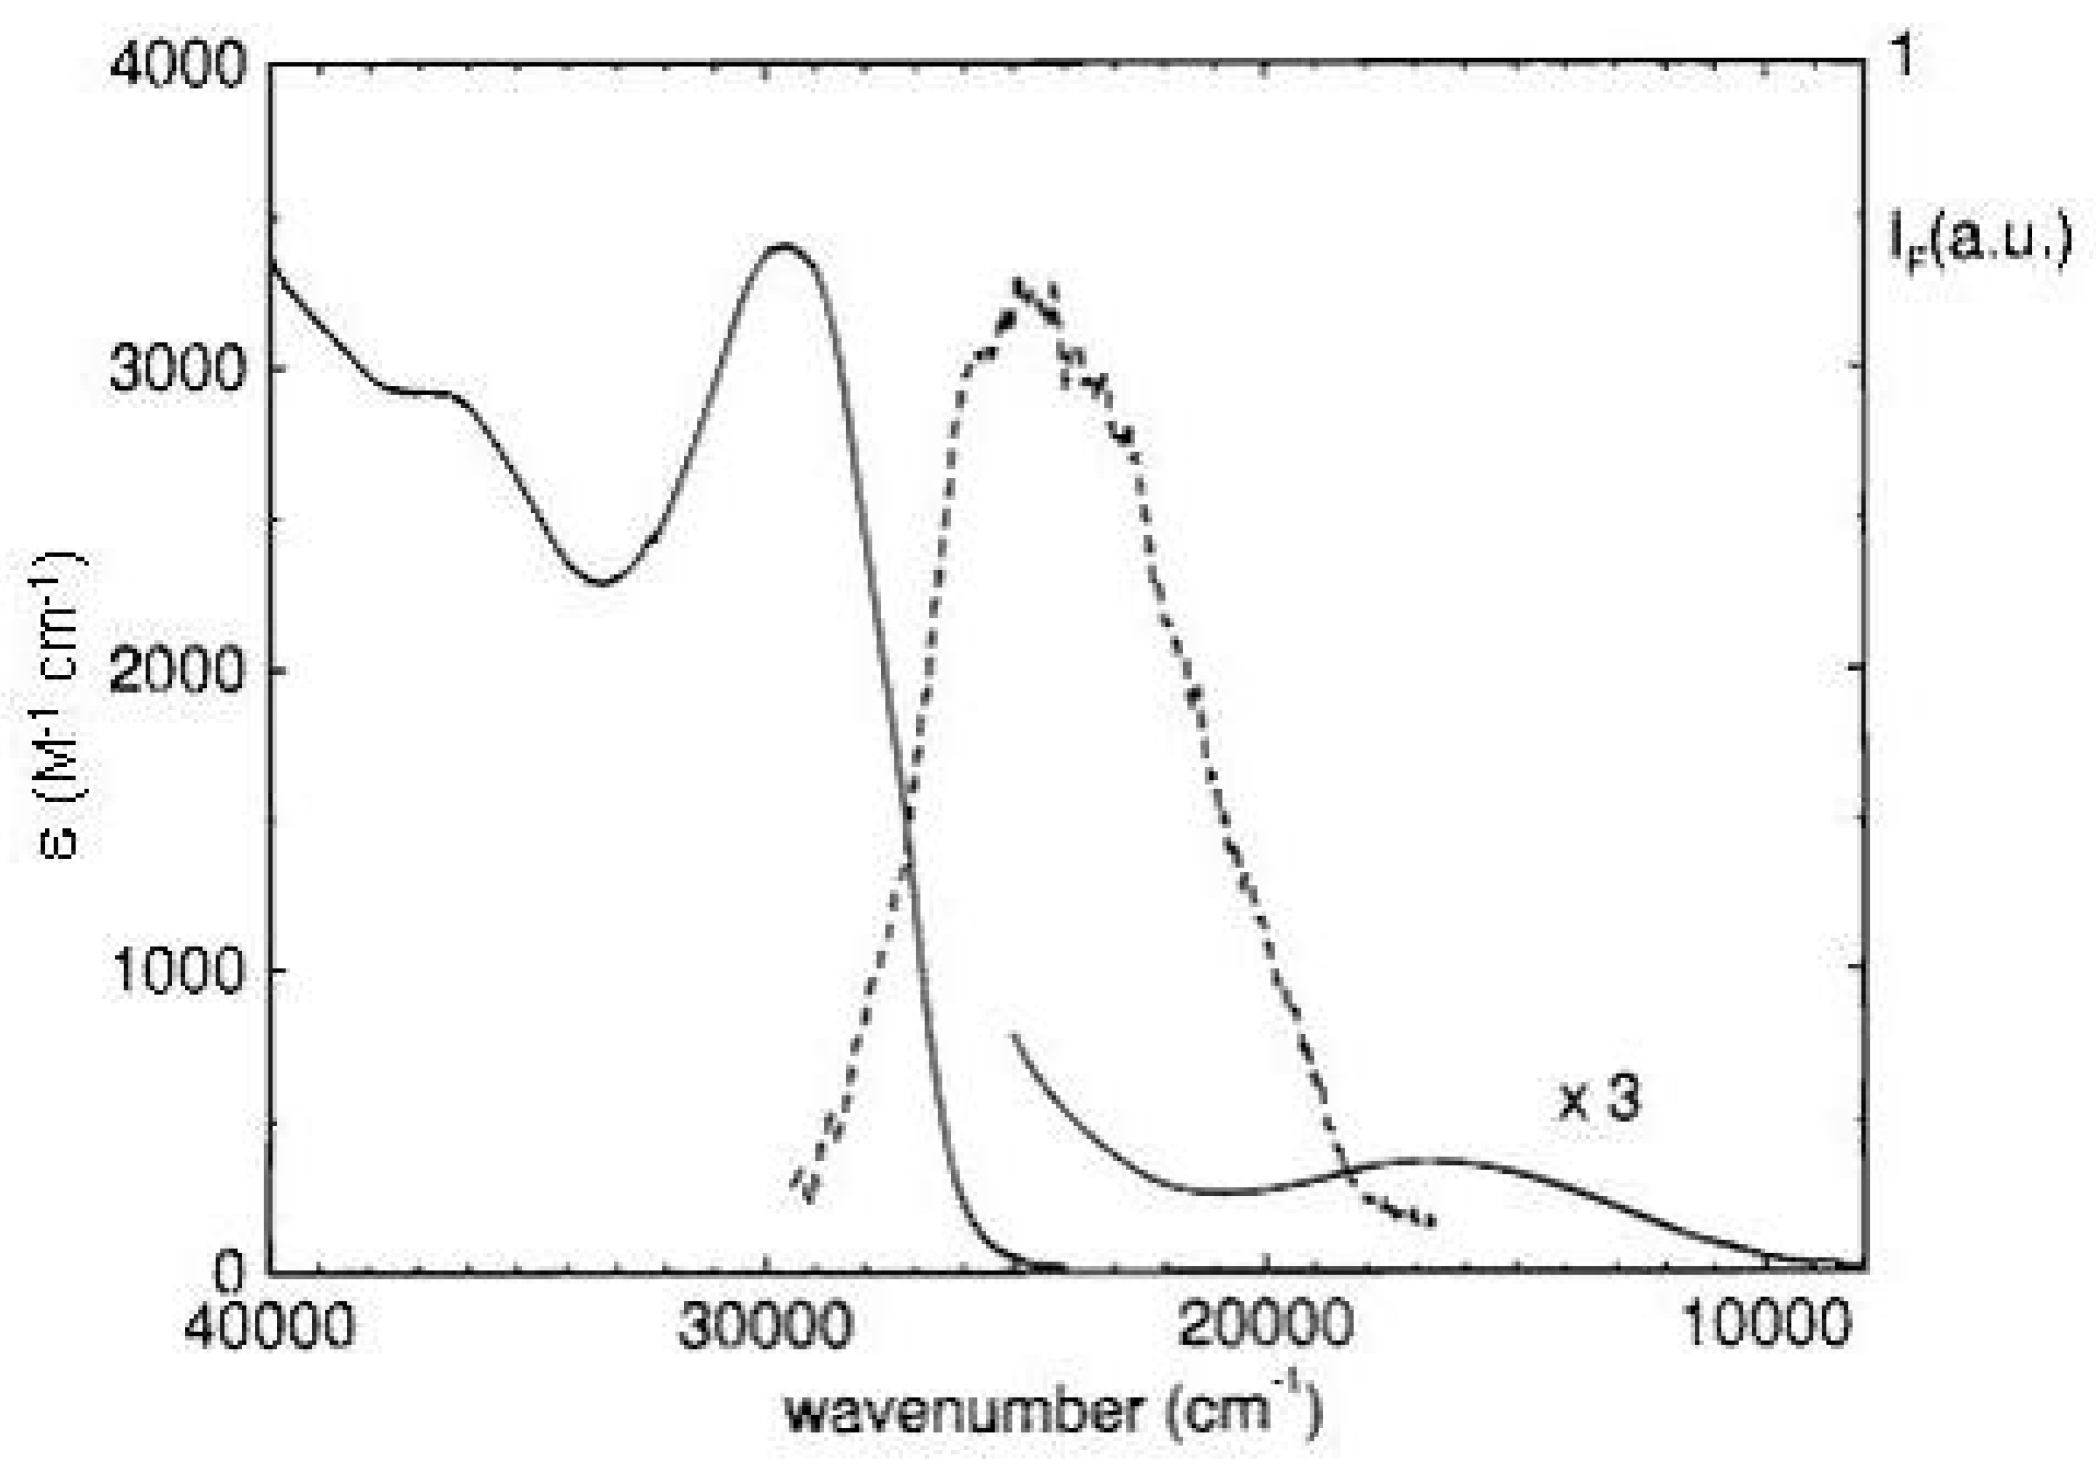
Figure 17.
Absorption and fluorescence ( = 313 nm, 10 M in cyclohexane) spectra of 1,3,5-tri-tert-butylpentalene at room temperature.
Figure 17.
Absorption and fluorescence ( = 313 nm, 10 M in cyclohexane) spectra of 1,3,5-tri-tert-butylpentalene at room temperature.
Figure 18.
Energy profiles of the lowest four states of pentalene (
,
,
,
in
symmetry) as a function of the displacement from
geometry (vertical dotted line). Adapted MCSCF/CAS(8,8)/3-21G results [
29]. For the sake of clarity the
and
structures of pentalene displaced from
symmetry have strongly exaggerated differences. Actually, the
minimum has
symmetry (
normal to the molecular plane) while the
minimum has
symmetry (
along the short in-plane axis).
Figure 19.
The low energy isomers of [10]annulene. The symmetry group, usual names and bondlengths (Å, CCSD/DZd and MP2/DZd results [
174]) are indicated. Boat, twist and naphthalene-like isomers are non planar, azulene-like and heart are quasi planar.
Figure 19.
The low energy isomers of [10]annulene. The symmetry group, usual names and bondlengths (Å, CCSD/DZd and MP2/DZd results [
174]) are indicated. Boat, twist and naphthalene-like isomers are non planar, azulene-like and heart are quasi planar.
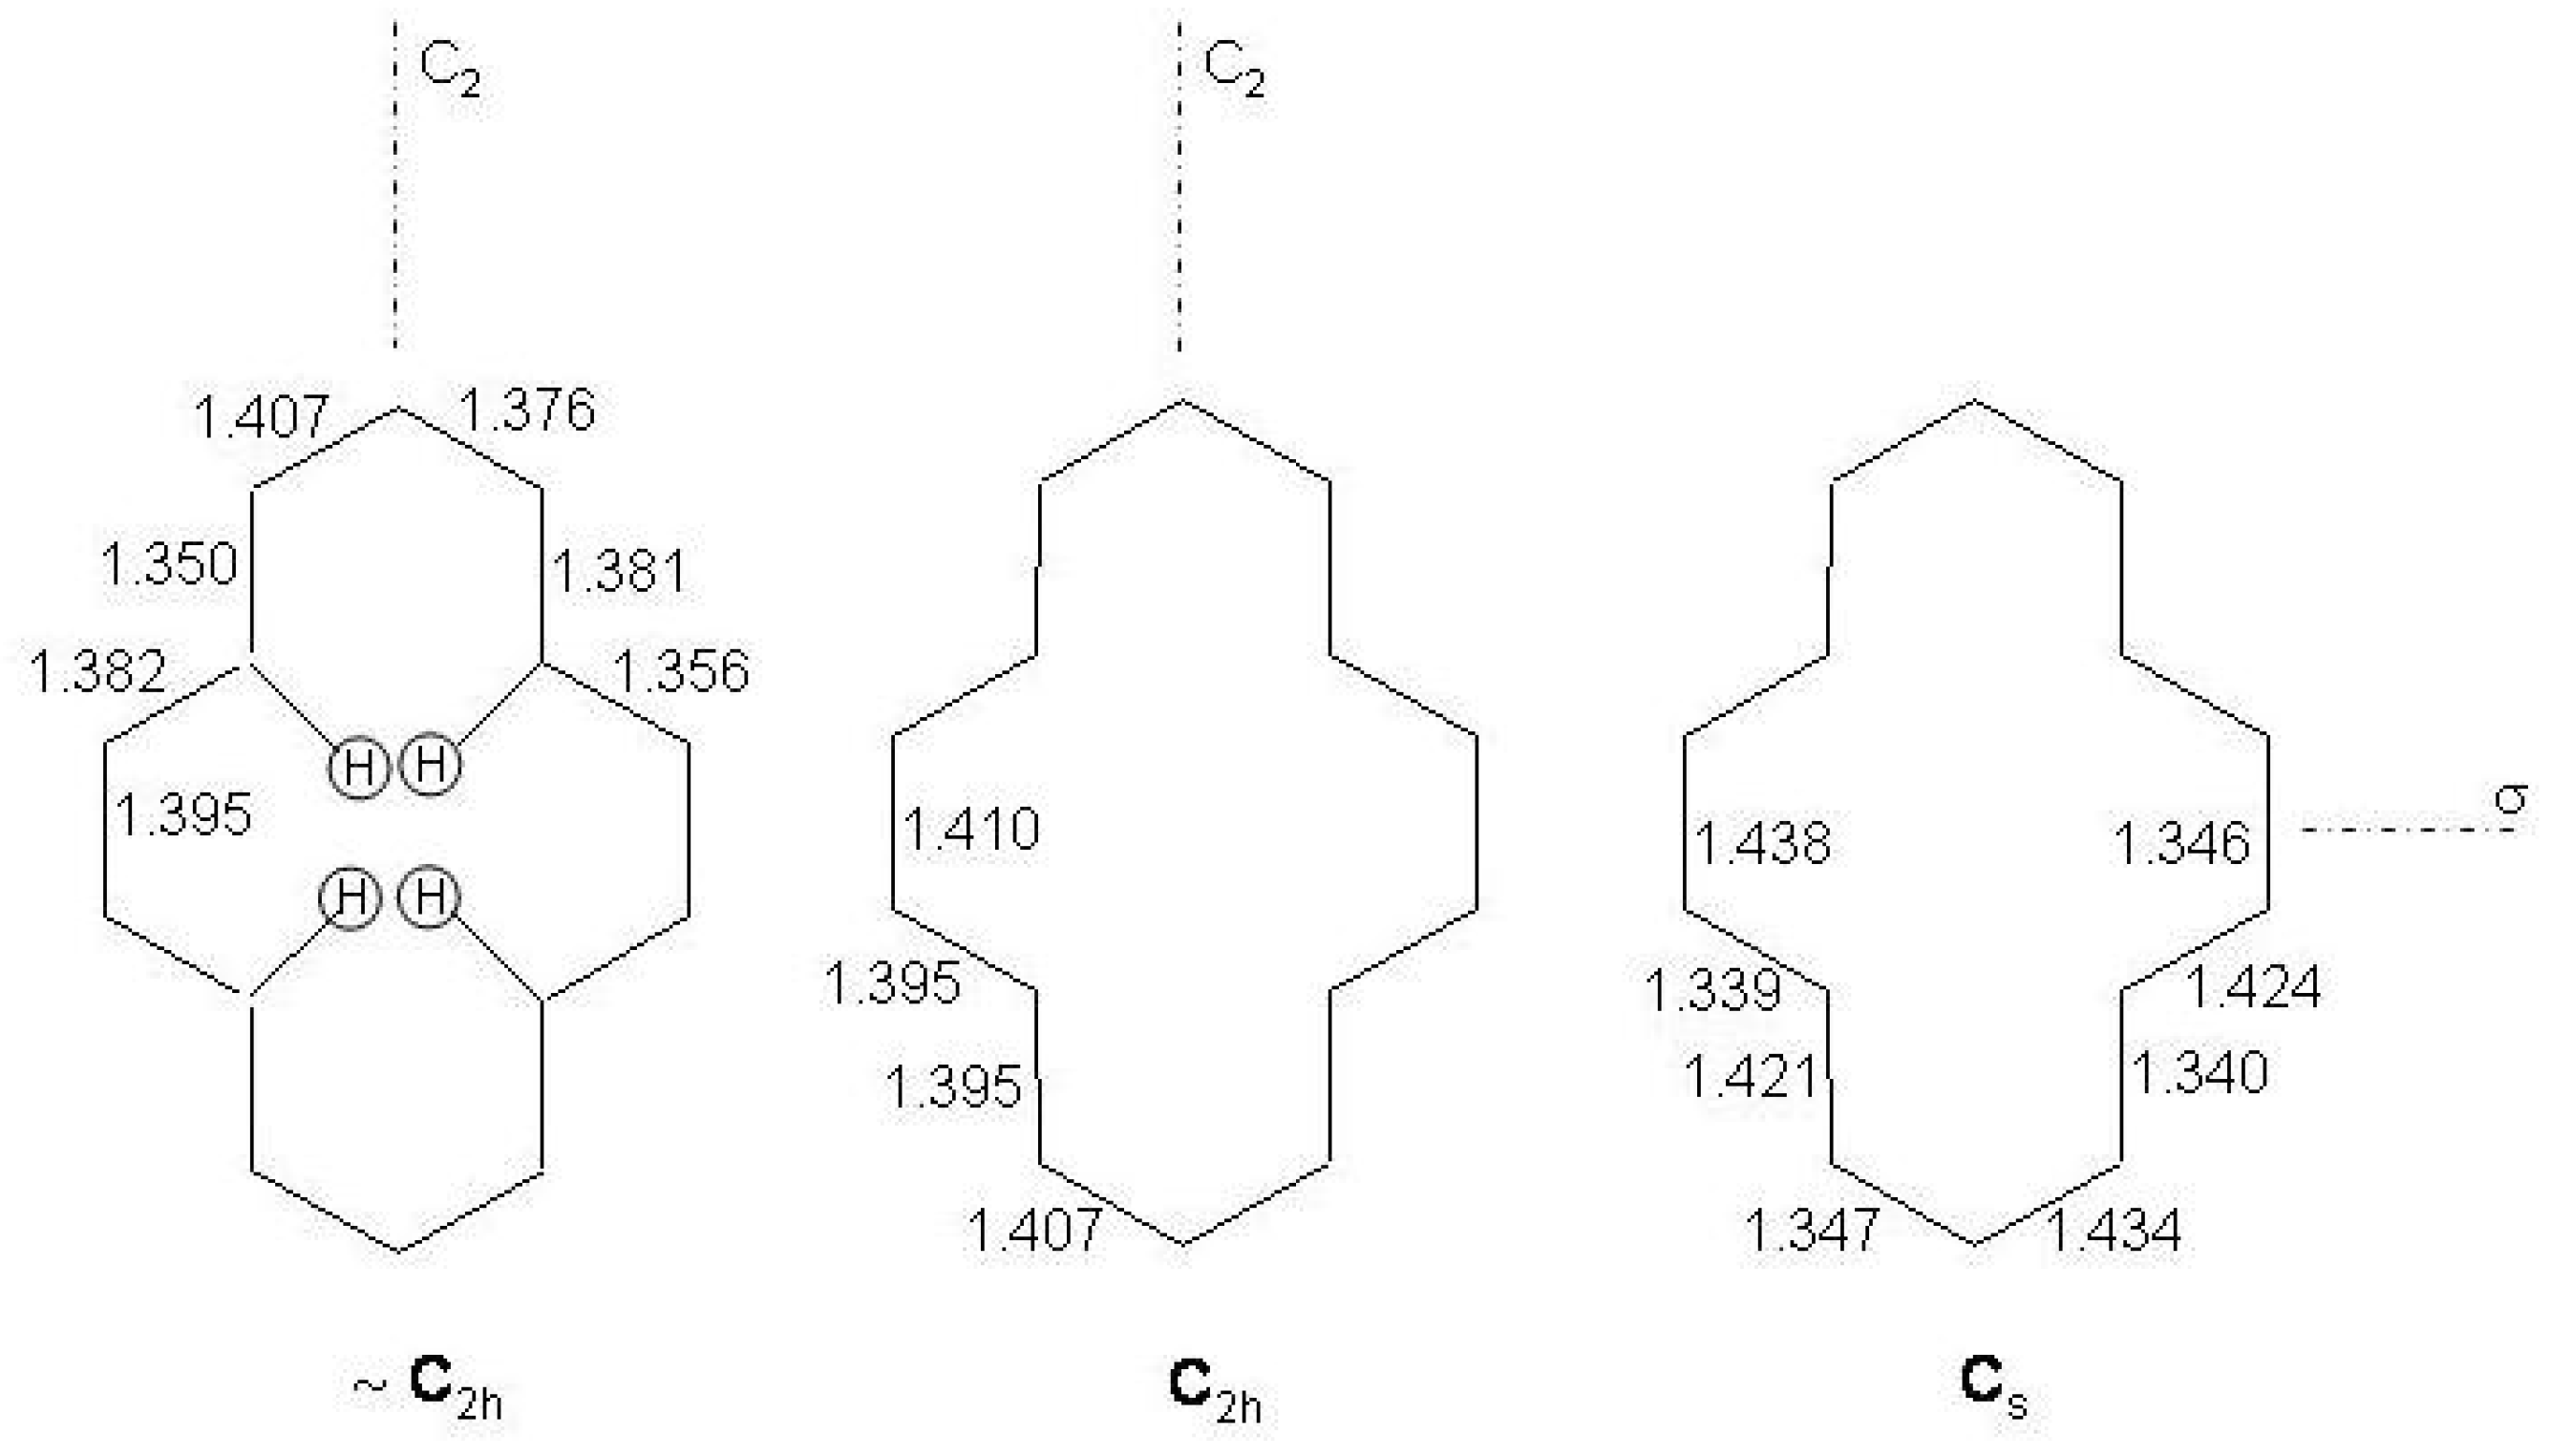
Figure 20.
Top: atomic numbering of bridged [10]annulenes and molecular reference system. Bottom: structures of bridged [10]annulenes: aromatic (left), polyolefinic (center), norcaradienic (right).
Figure 20.
Top: atomic numbering of bridged [10]annulenes and molecular reference system. Bottom: structures of bridged [10]annulenes: aromatic (left), polyolefinic (center), norcaradienic (right).
Figure 21.
Experimental (lower, polycrystalline sample, room temperature, 647.1 nm excitation wavelength) and calculated (DF/B3LYP/6-31G basis set) Raman spectra of 1,6-epoxy[10]annulene.
Figure 21.
Experimental (lower, polycrystalline sample, room temperature, 647.1 nm excitation wavelength) and calculated (DF/B3LYP/6-31G basis set) Raman spectra of 1,6-epoxy[10]annulene.
Figure 22.
Fluorescence spectra of 1,6-methano[10]annulene in isopentane/ether solution (c = 10 M) at 15 K exciting into the origin and the lowest three vibronic bands, as shown in the inset.
Figure 22.
Fluorescence spectra of 1,6-methano[10]annulene in isopentane/ether solution (c = 10 M) at 15 K exciting into the origin and the lowest three vibronic bands, as shown in the inset.
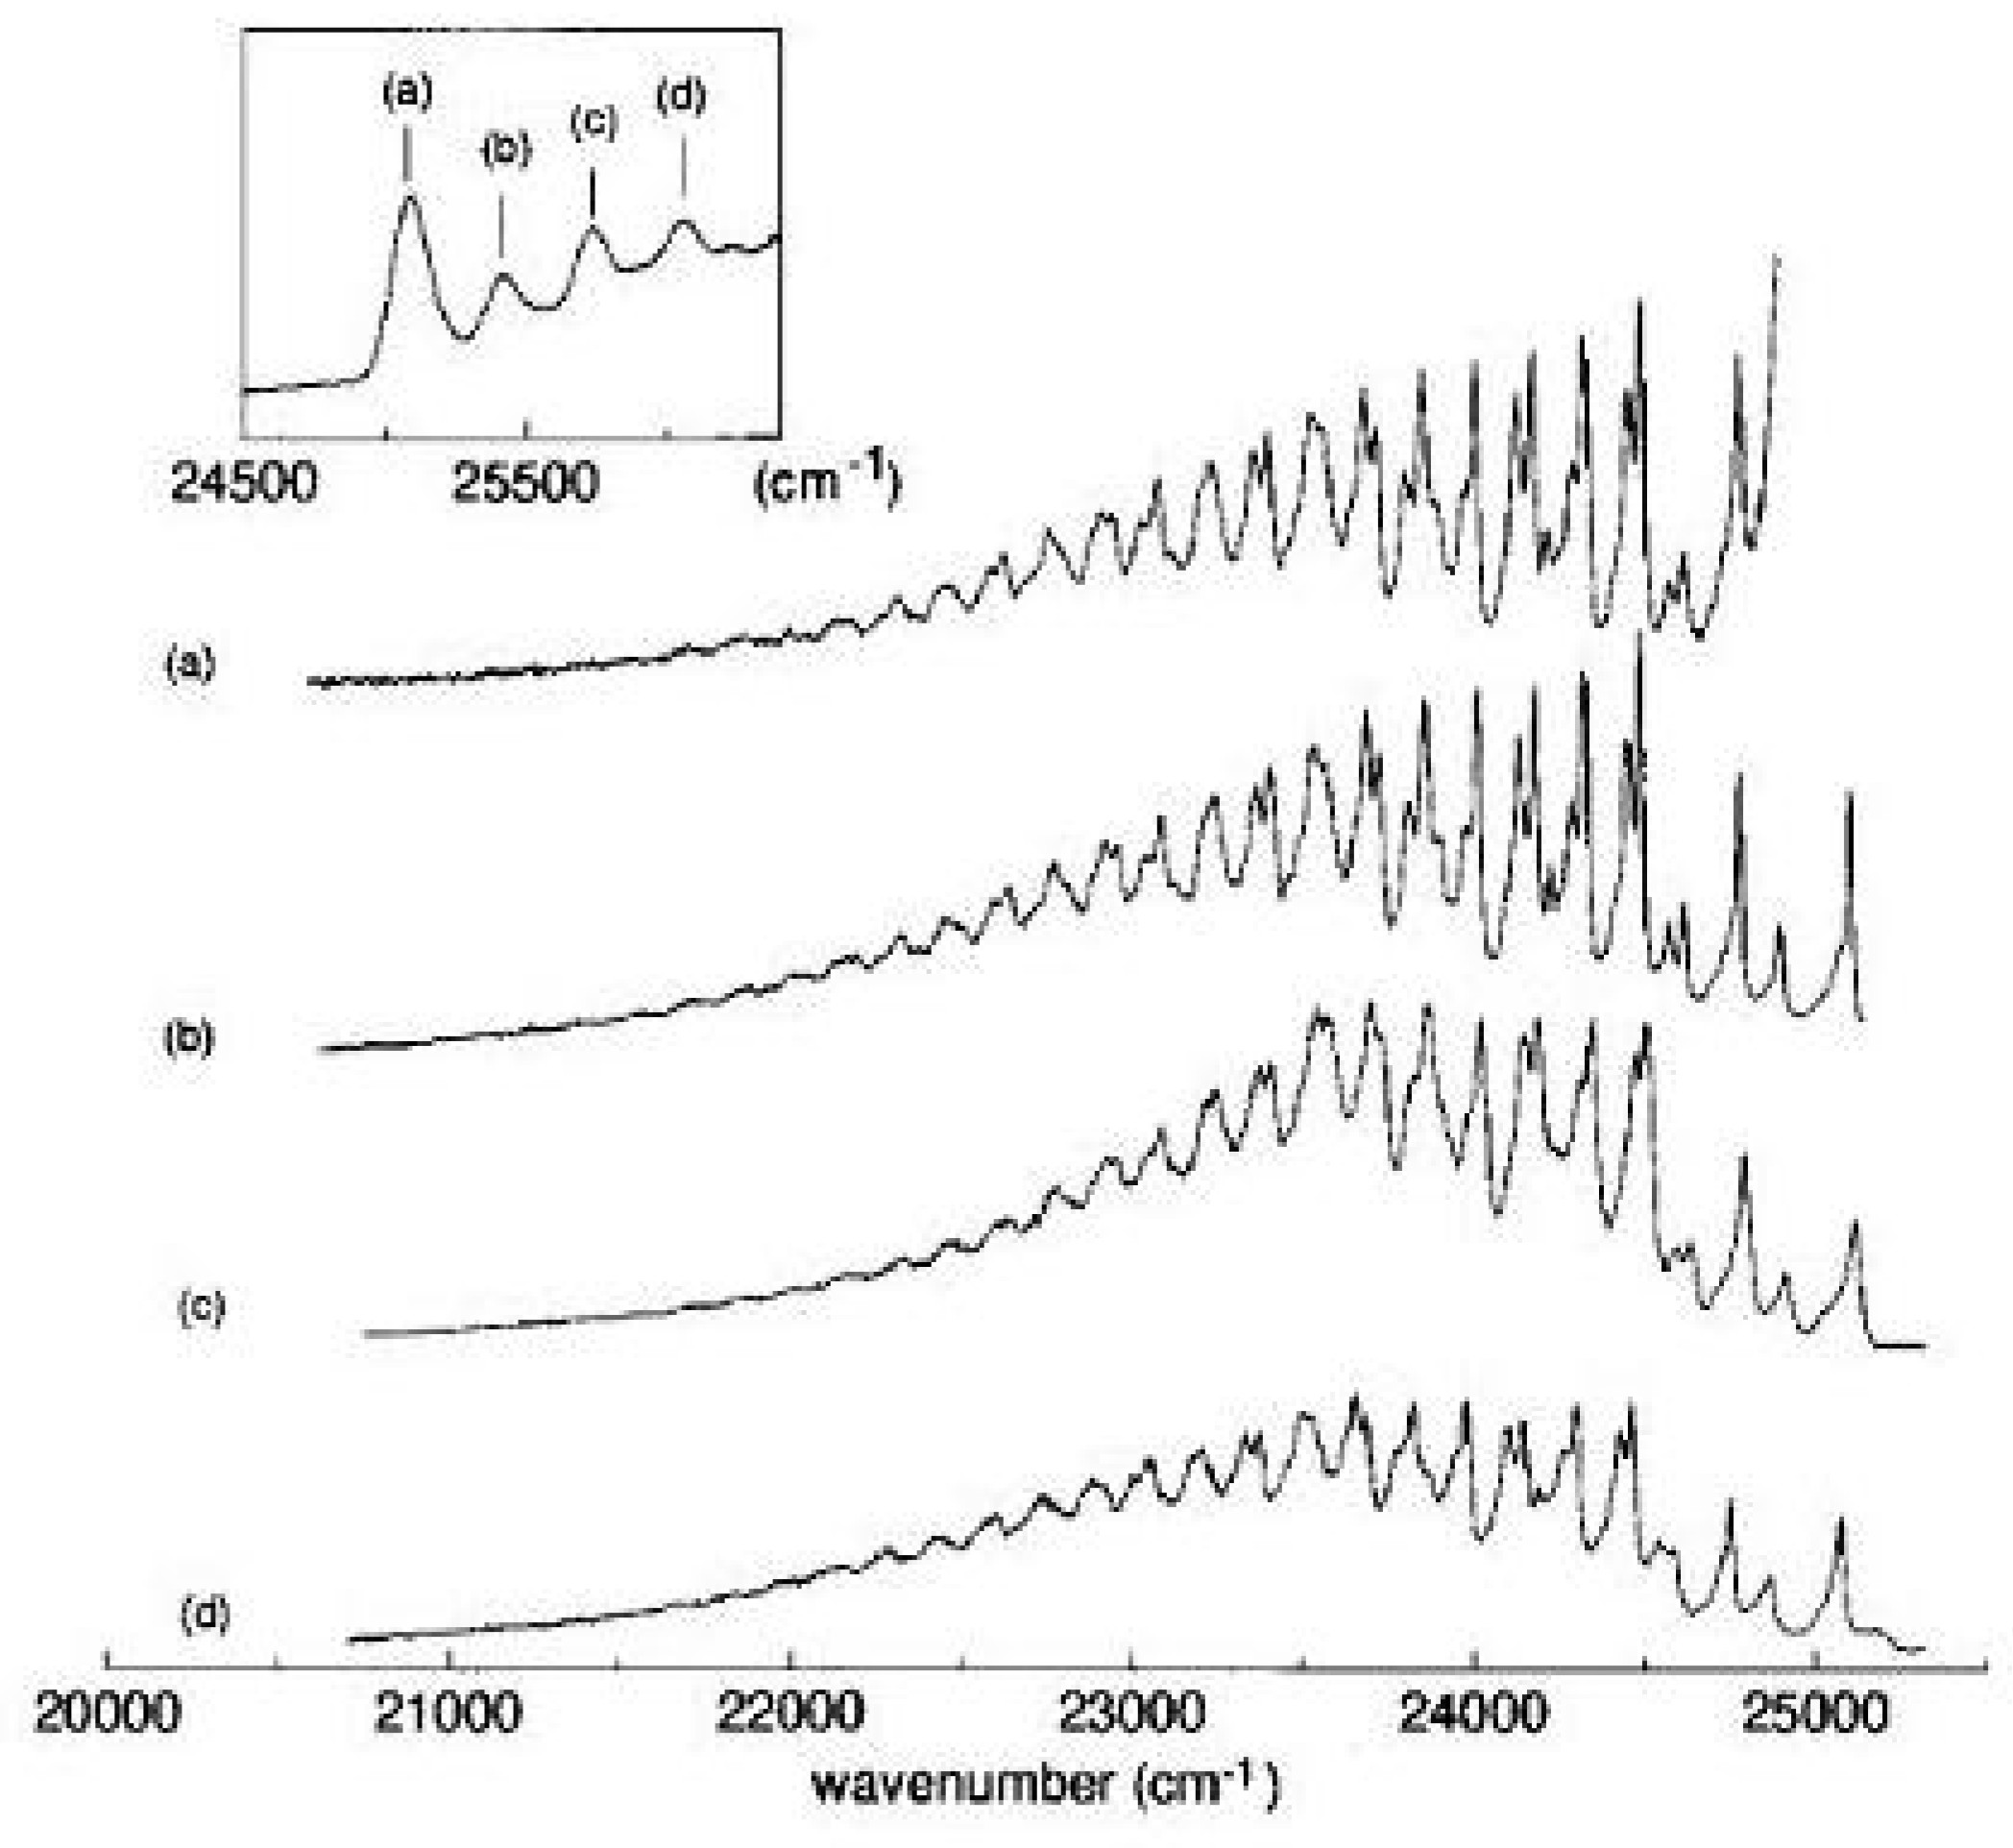
Figure 23.
Two-photon excitation spectrum [(a), left, linear polarization] and polarization ratio of 1,6-methano[10]annulene 10 M in isopentane/ether at room temperature. For the sake of comparison, also the one-photon solution spectrum [(b), right] 10 M in cyclohexane is shown. The one-photon absorption region around 27000 cm is too weak to be observed in these experimental conditions.
Figure 24.
Calculated and observed vertical transition energies (eV) of 1,6-methano[10]annulene. Left: MCSCF/CAS(10,10)/6-31G results; center: results from MC/QDPT perturbation treatment [
204]; right: observed one- and two-photon transitions.
Figure 24.
Calculated and observed vertical transition energies (eV) of 1,6-methano[10]annulene. Left: MCSCF/CAS(10,10)/6-31G results; center: results from MC/QDPT perturbation treatment [
204]; right: observed one- and two-photon transitions.
Figure 25.
The five low energy isomers of [12]annulene with the indication of
cis/trans configuration around double bond, symmetry group, relative energies (kcal/mol) with respect to the
isomer and CC bondlengths (Å) on selected structures. CCSD(T)/cc-pVDZ//BHHLYP/6-311+G
results [
208,
209].
Figure 25.
The five low energy isomers of [12]annulene with the indication of
cis/trans configuration around double bond, symmetry group, relative energies (kcal/mol) with respect to the
isomer and CC bondlengths (Å) on selected structures. CCSD(T)/cc-pVDZ//BHHLYP/6-311+G
results [
208,
209].
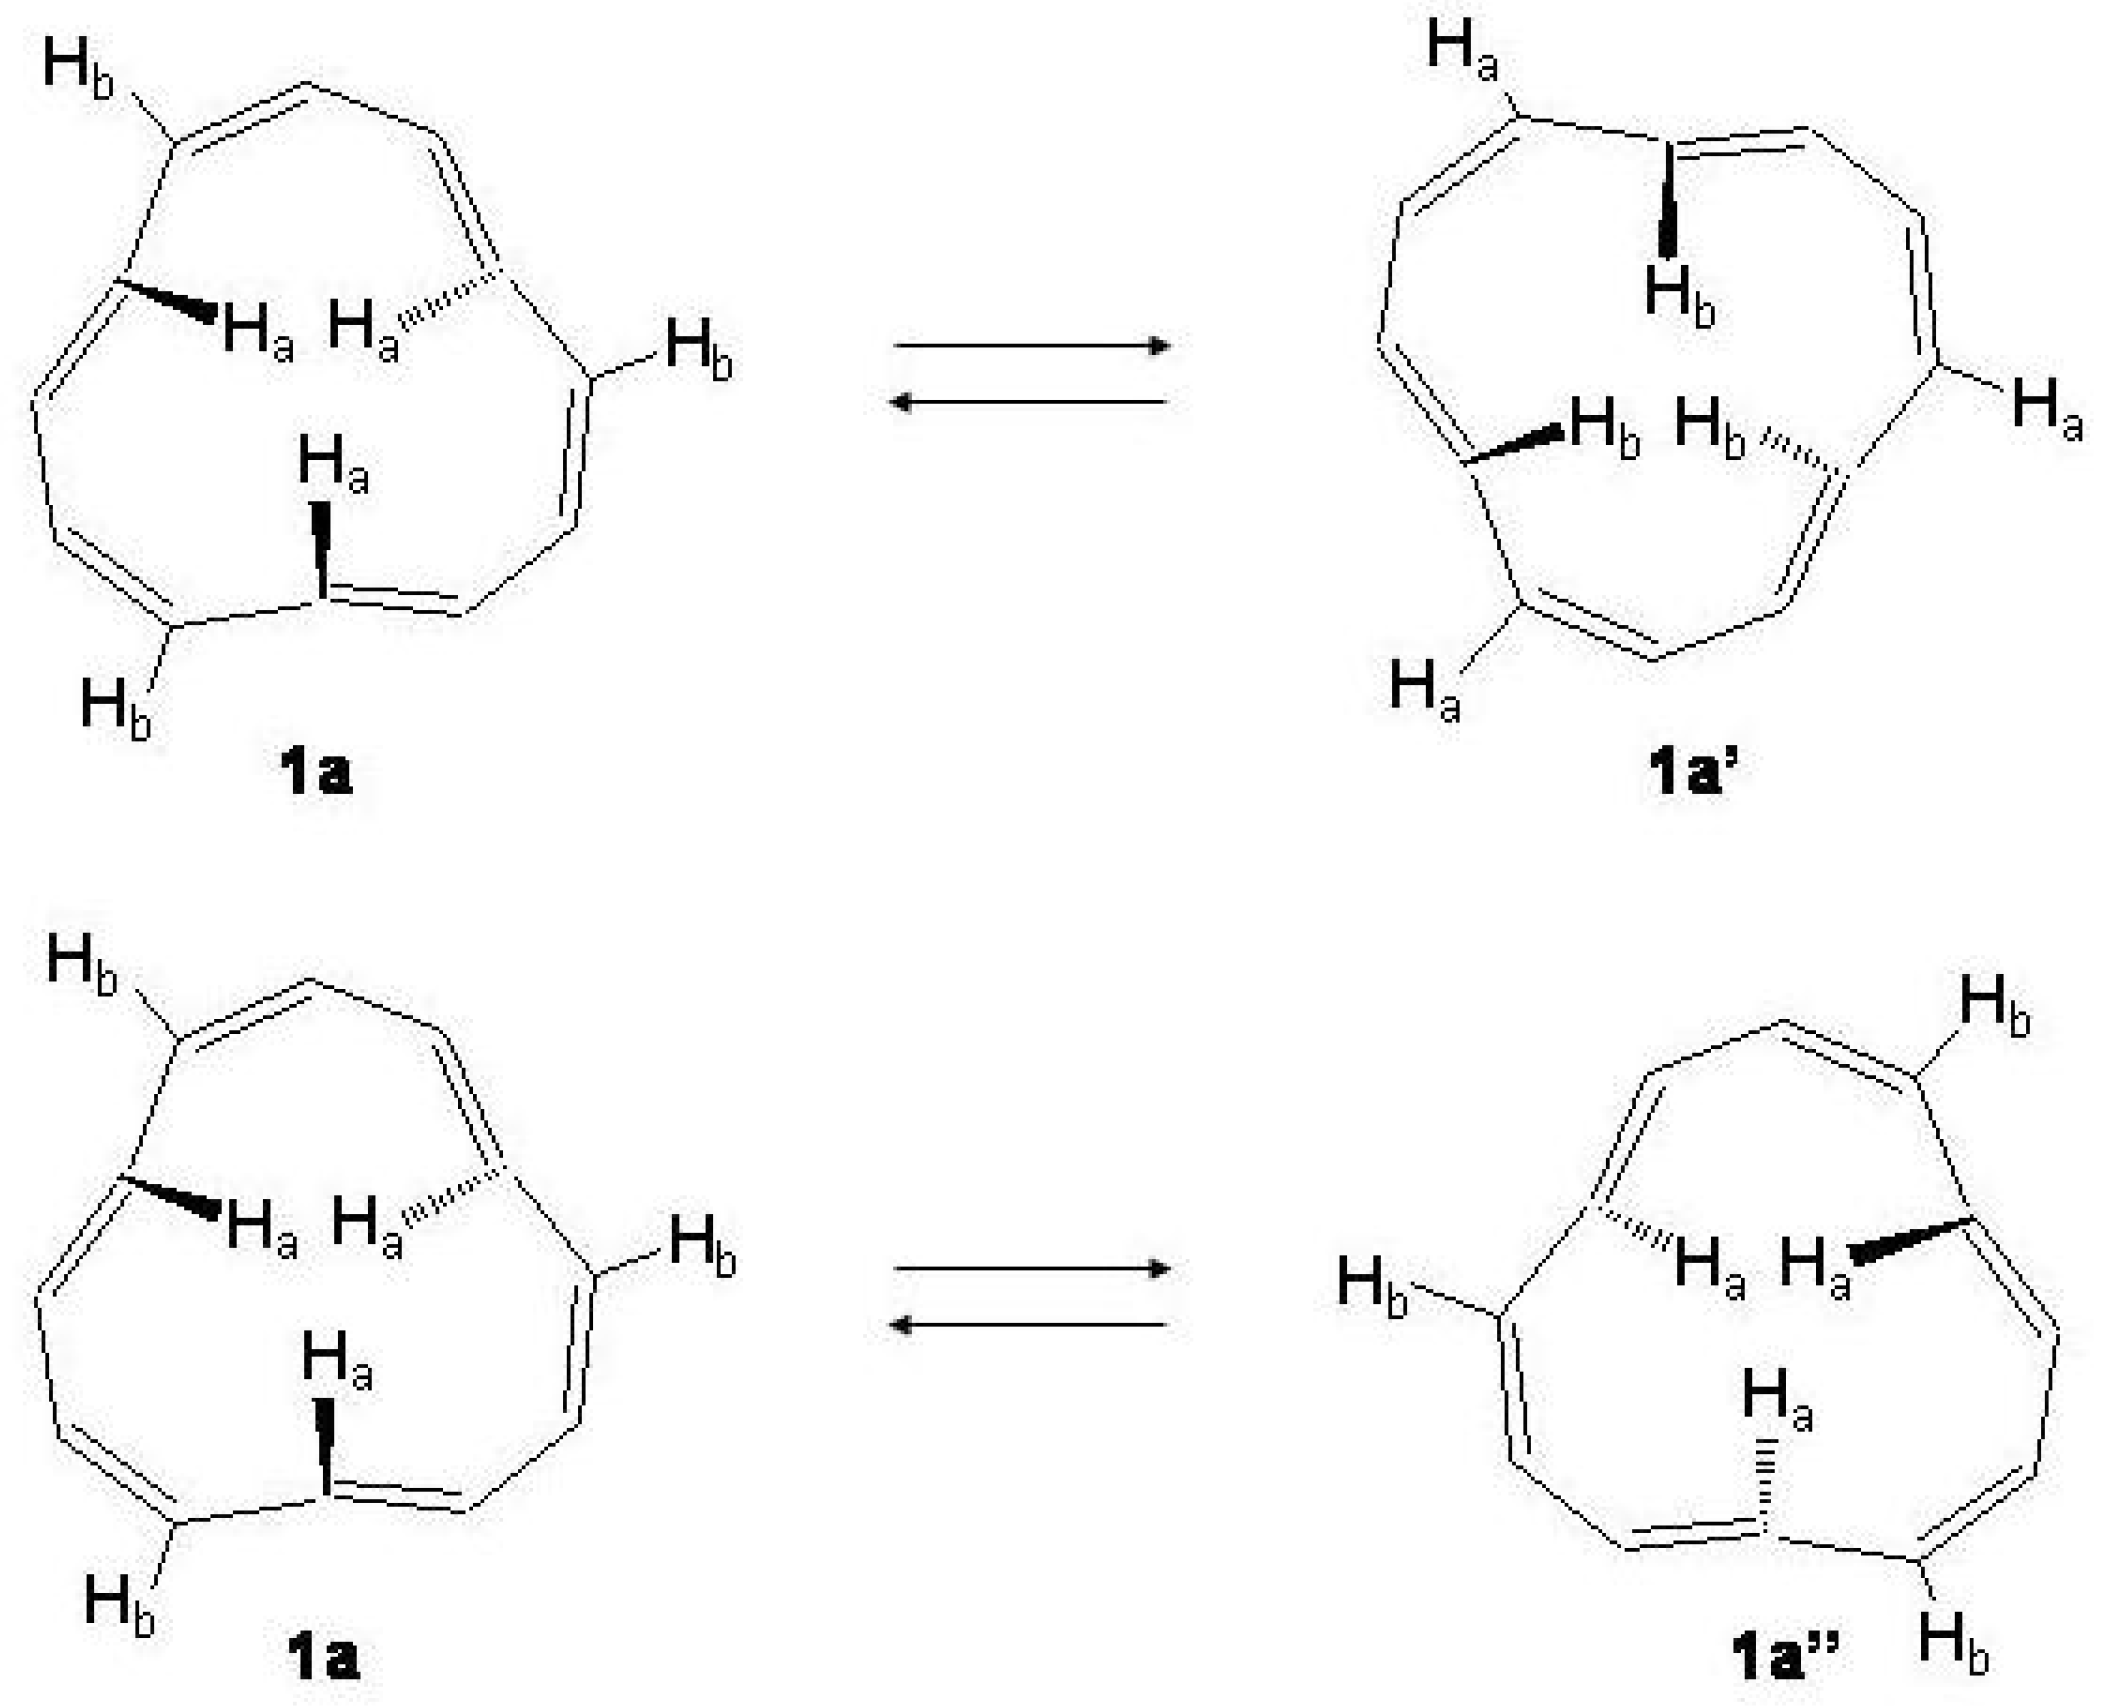
Figure 26.
Upper: interconversion of the three inner with the three outer trans hydrogen atoms, 1a →1a. Lower: conversion of the tri-trans[12]annulene to the enantiomer, 1a→1a.
Figure 26.
Upper: interconversion of the three inner with the three outer trans hydrogen atoms, 1a →1a. Lower: conversion of the tri-trans[12]annulene to the enantiomer, 1a→1a.
Figure 27.
Energy profiles of the
1a →
1a and
1a→
1a reaction paths, adapted CCSD(T)/cc-pVDZ//BHHLYP/6-311+G
results [
208].
Figure 27.
Energy profiles of the
1a →
1a and
1a→
1a reaction paths, adapted CCSD(T)/cc-pVDZ//BHHLYP/6-311+G
results [
208].
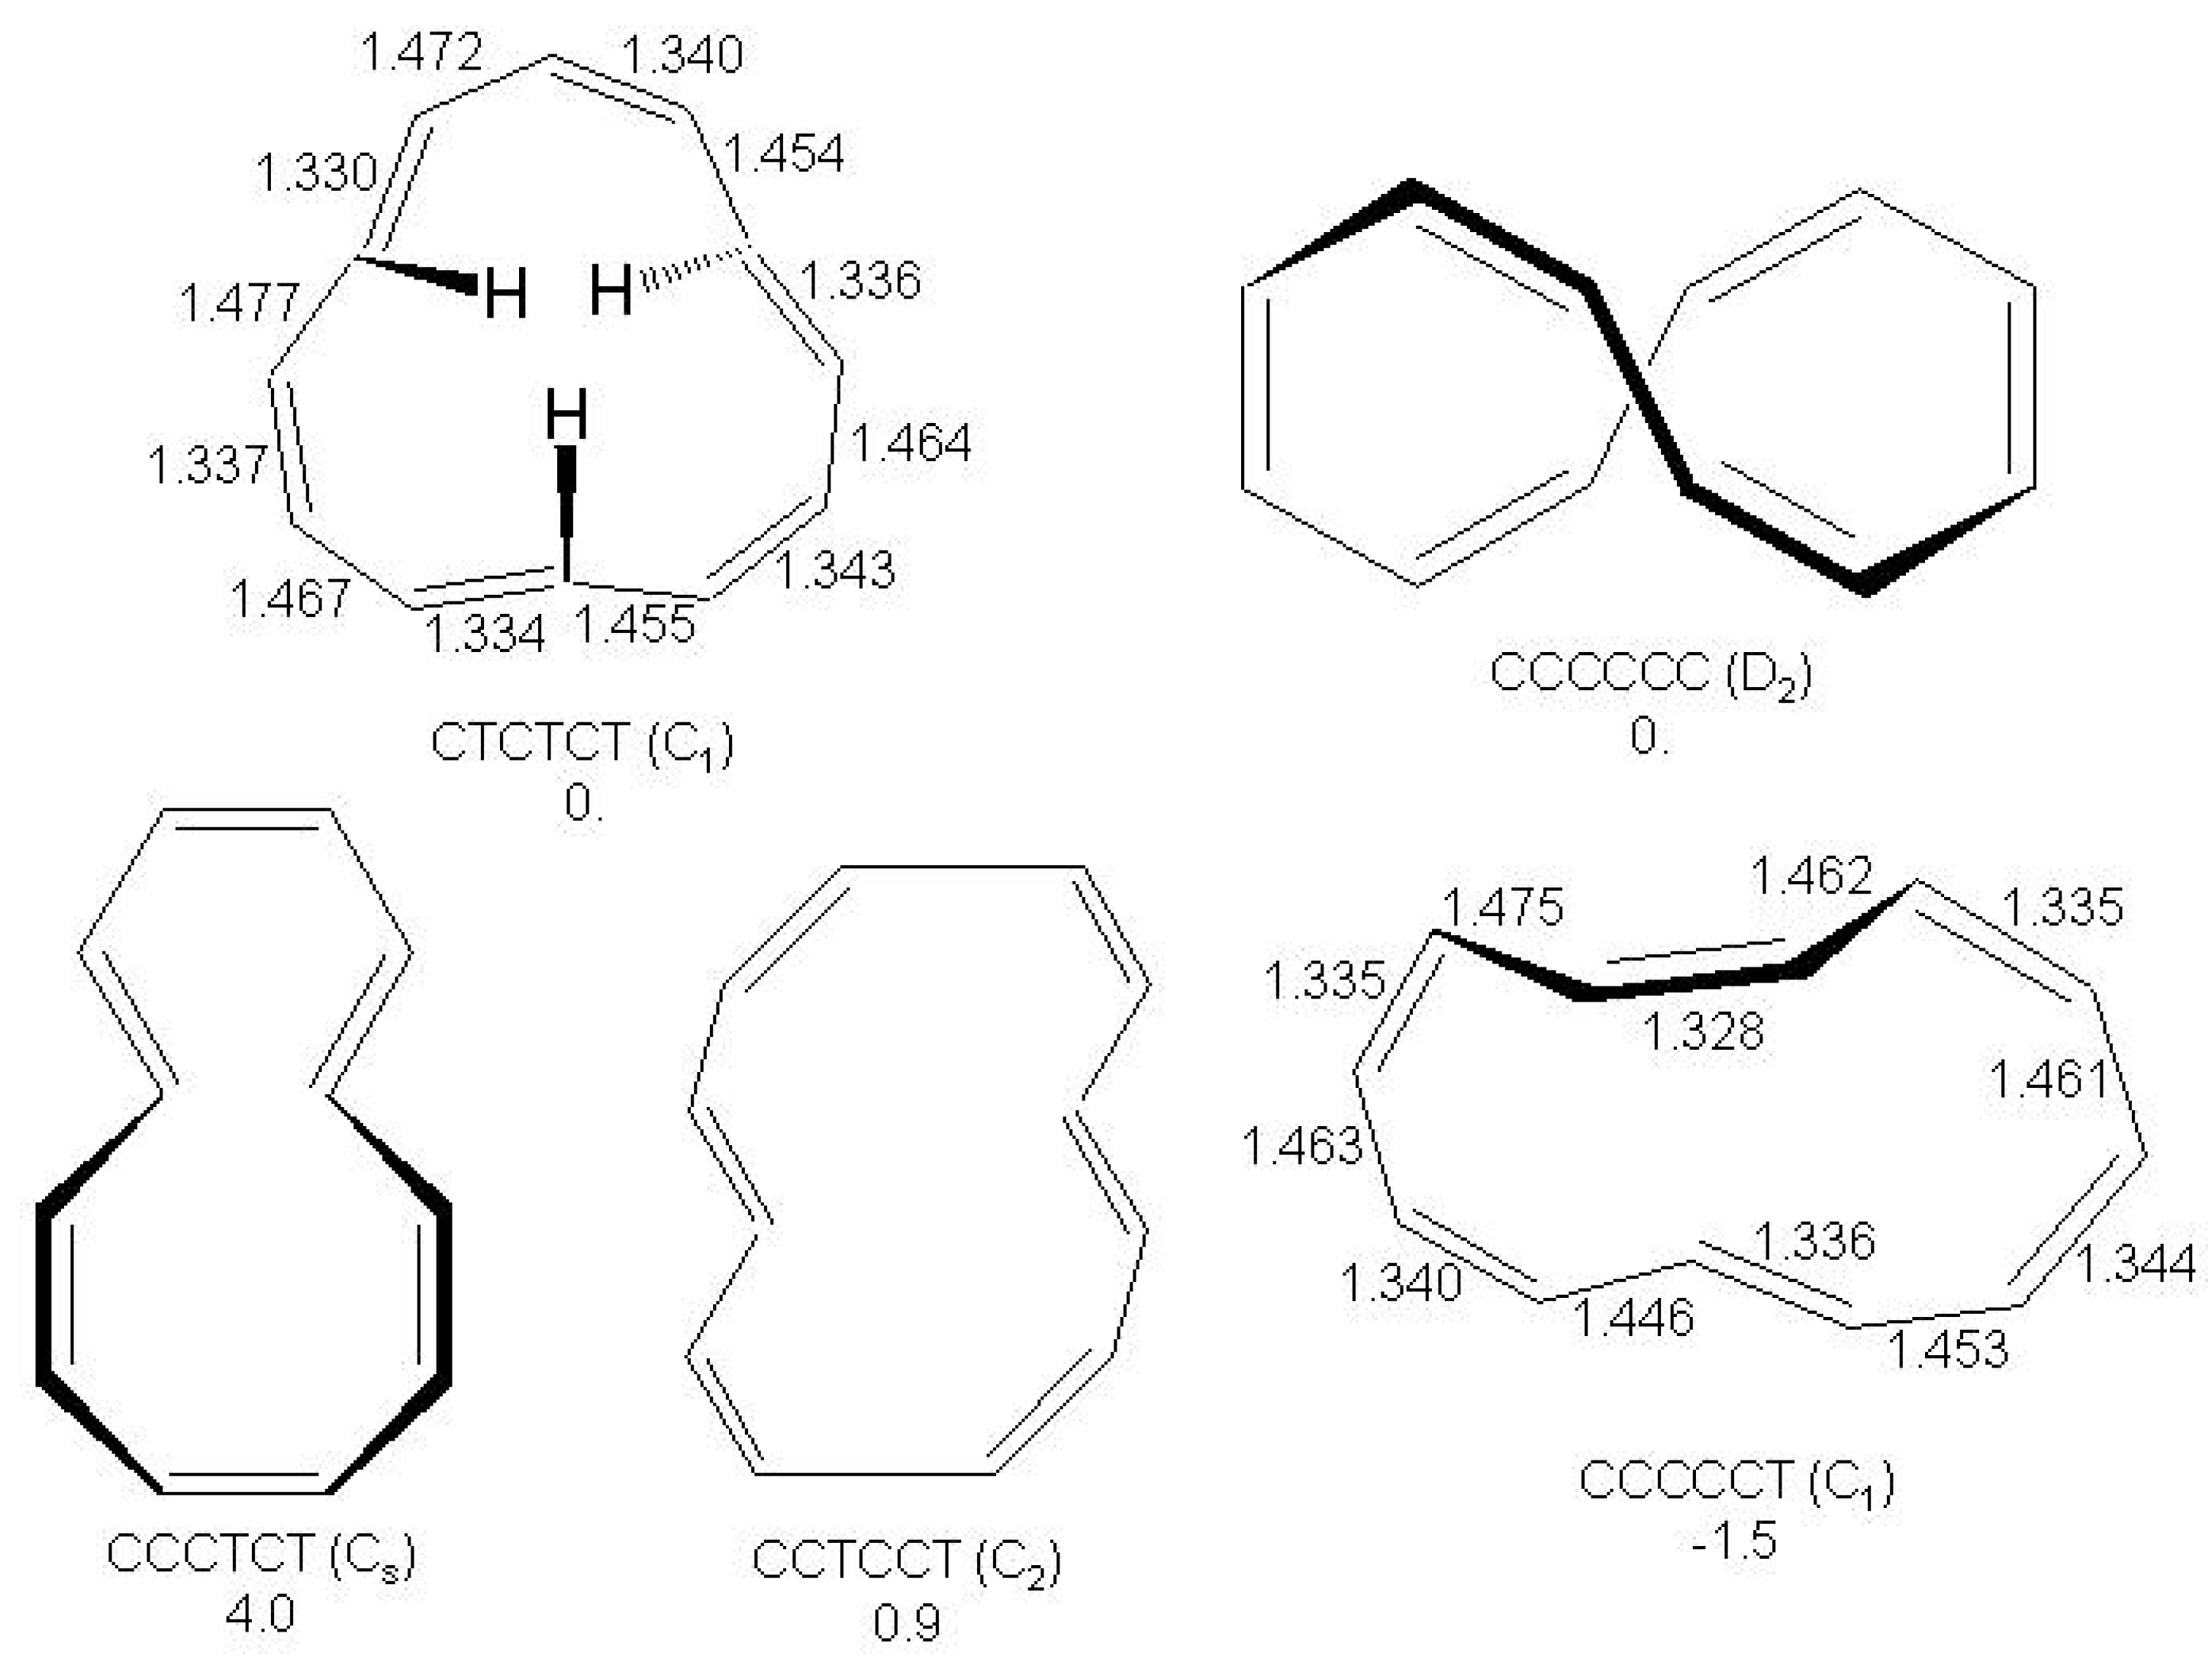
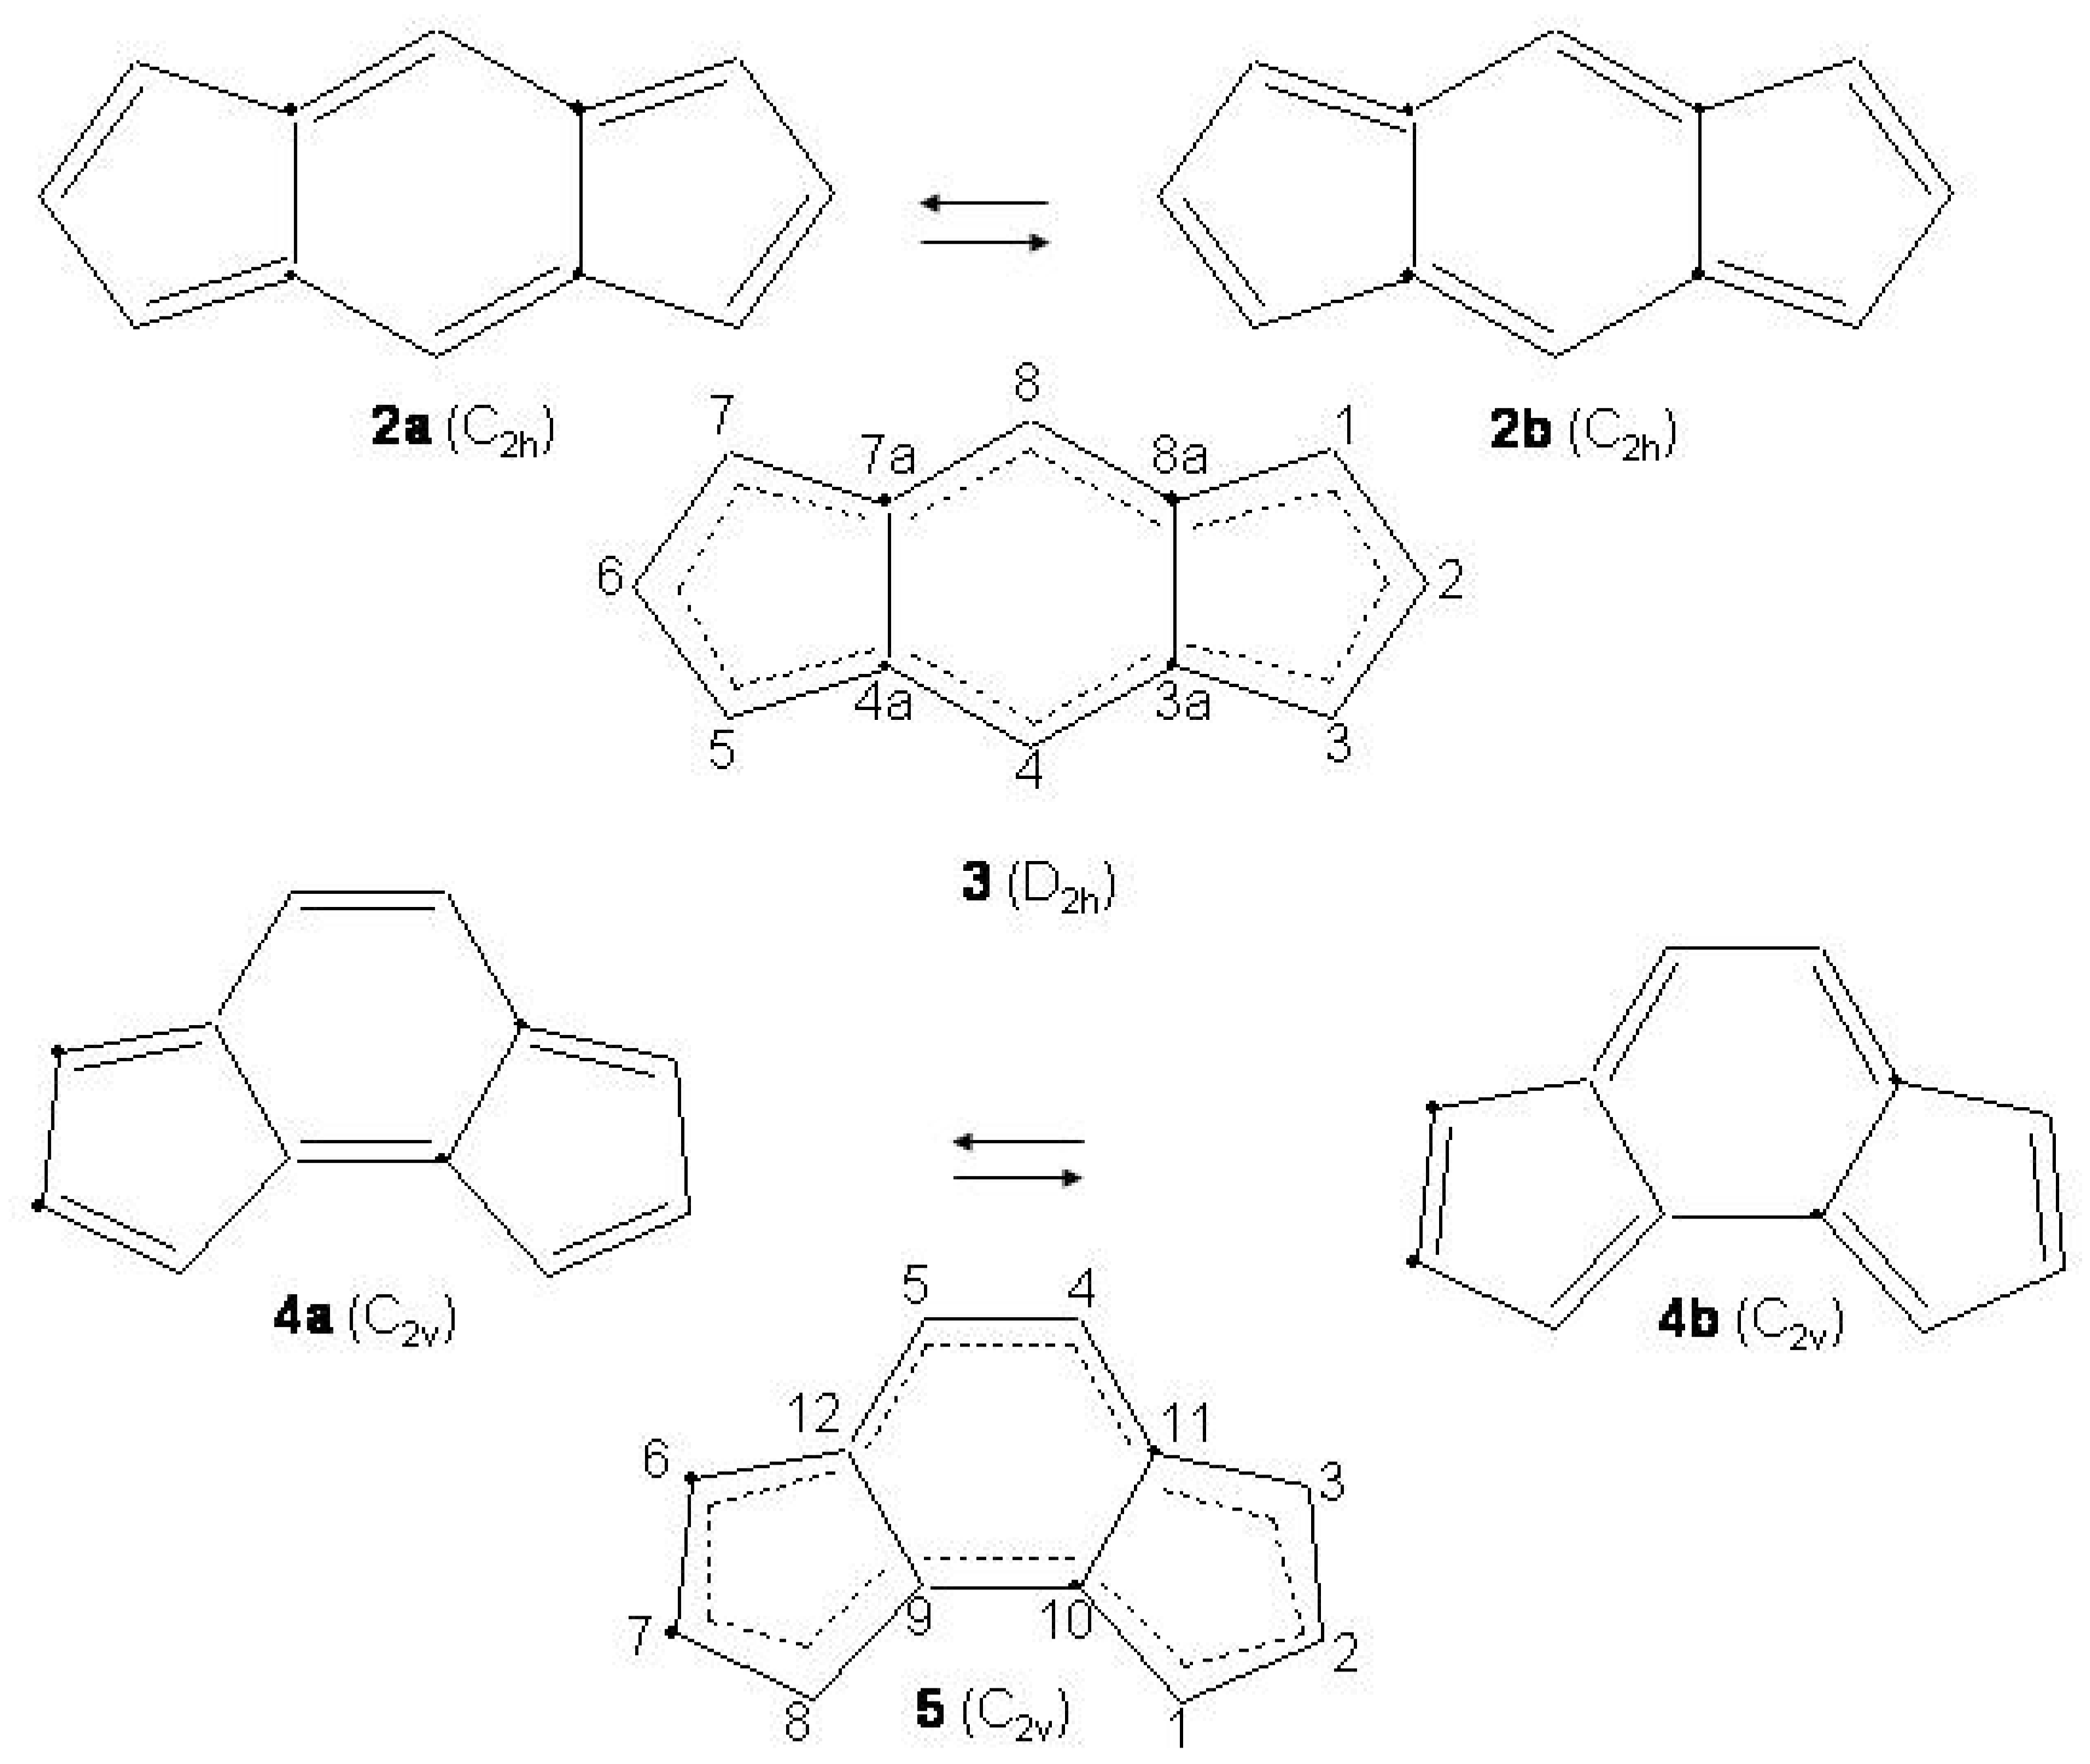
Figure 28.
Bond alternating and bond equalized structures of s-indacene (2a, 2b, 3) and -indacene (4a, 4b, 5) with atomic numbering.
Figure 28.
Bond alternating and bond equalized structures of s-indacene (2a, 2b, 3) and -indacene (4a, 4b, 5) with atomic numbering.
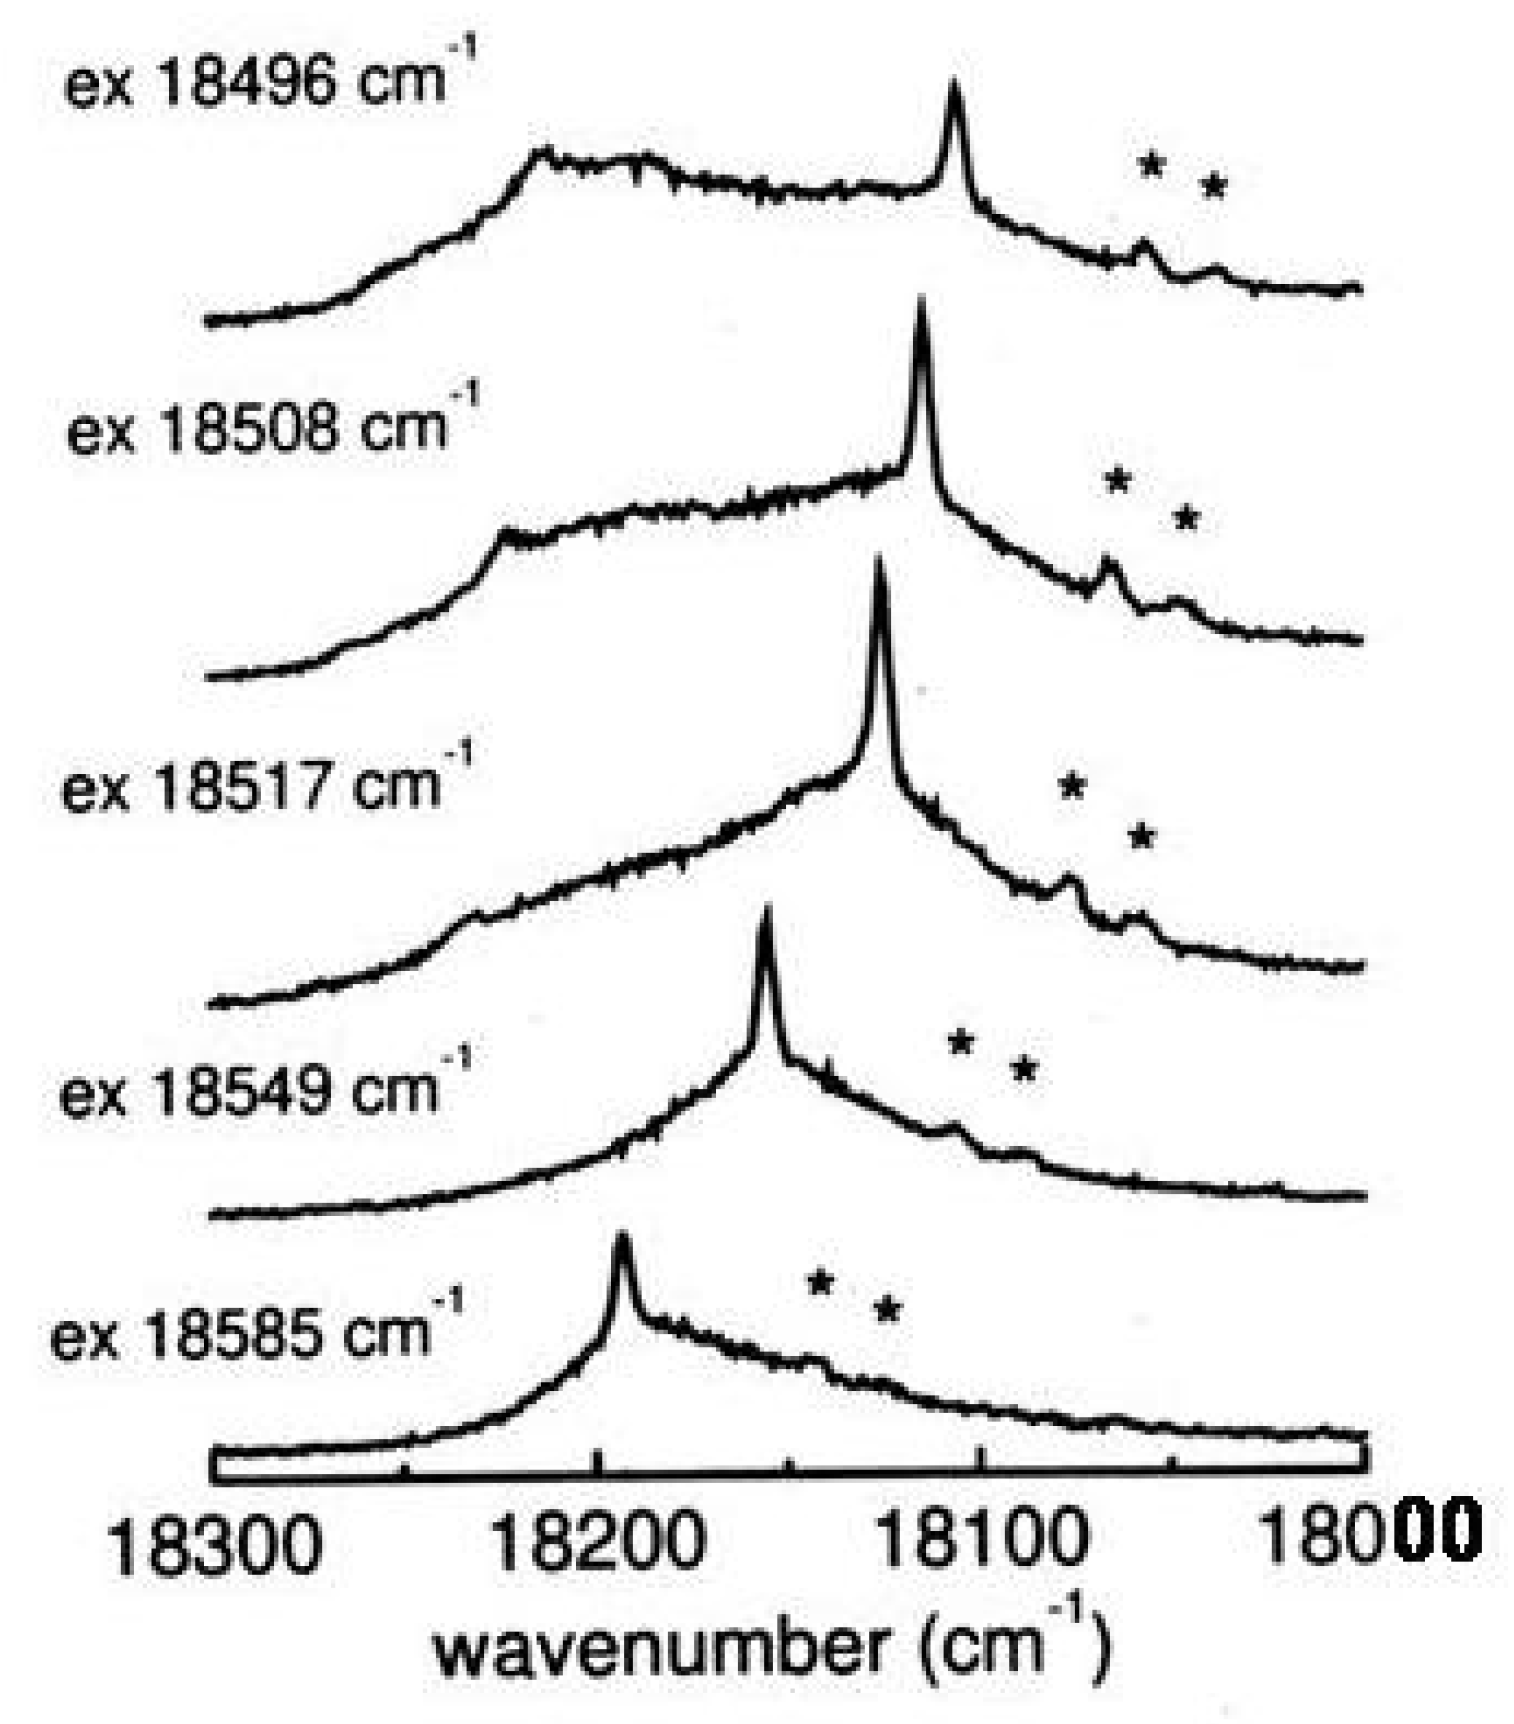
Figure 29.
Pre-resonance Raman spectra of tetra-tert-butyl-s-indacene as a function of the exciting wavelength approaching the origin (bottom to top, c = 6×10 M in isopentane/ether, 77K). Solvents bands are indicated by asterisks.
Figure 29.
Pre-resonance Raman spectra of tetra-tert-butyl-s-indacene as a function of the exciting wavelength approaching the origin (bottom to top, c = 6×10 M in isopentane/ether, 77K). Solvents bands are indicated by asterisks.
Figure 30.
Resonance Raman and fluorescence spectra of tetra-tert-butyl-s-indacene as a function of the exciting wavenumber across the absorption region (bottom to top, c = 10 M in isopentane/ether, 77K). Solvents bands are indicated by asterisks.
Figure 30.
Resonance Raman and fluorescence spectra of tetra-tert-butyl-s-indacene as a function of the exciting wavenumber across the absorption region (bottom to top, c = 10 M in isopentane/ether, 77K). Solvents bands are indicated by asterisks.
Figure 31.
Experimental Raman enhancement factor (crosses and squares) of the 390 cm peak scanning across the origin band and the first vibronic band of tetra-tert-butyl-s-indacene and calculated factor of the corresponding 431 cm mode for the model system mono-tert-butyl-s-indacene.
Figure 31.
Experimental Raman enhancement factor (crosses and squares) of the 390 cm peak scanning across the origin band and the first vibronic band of tetra-tert-butyl-s-indacene and calculated factor of the corresponding 431 cm mode for the model system mono-tert-butyl-s-indacene.
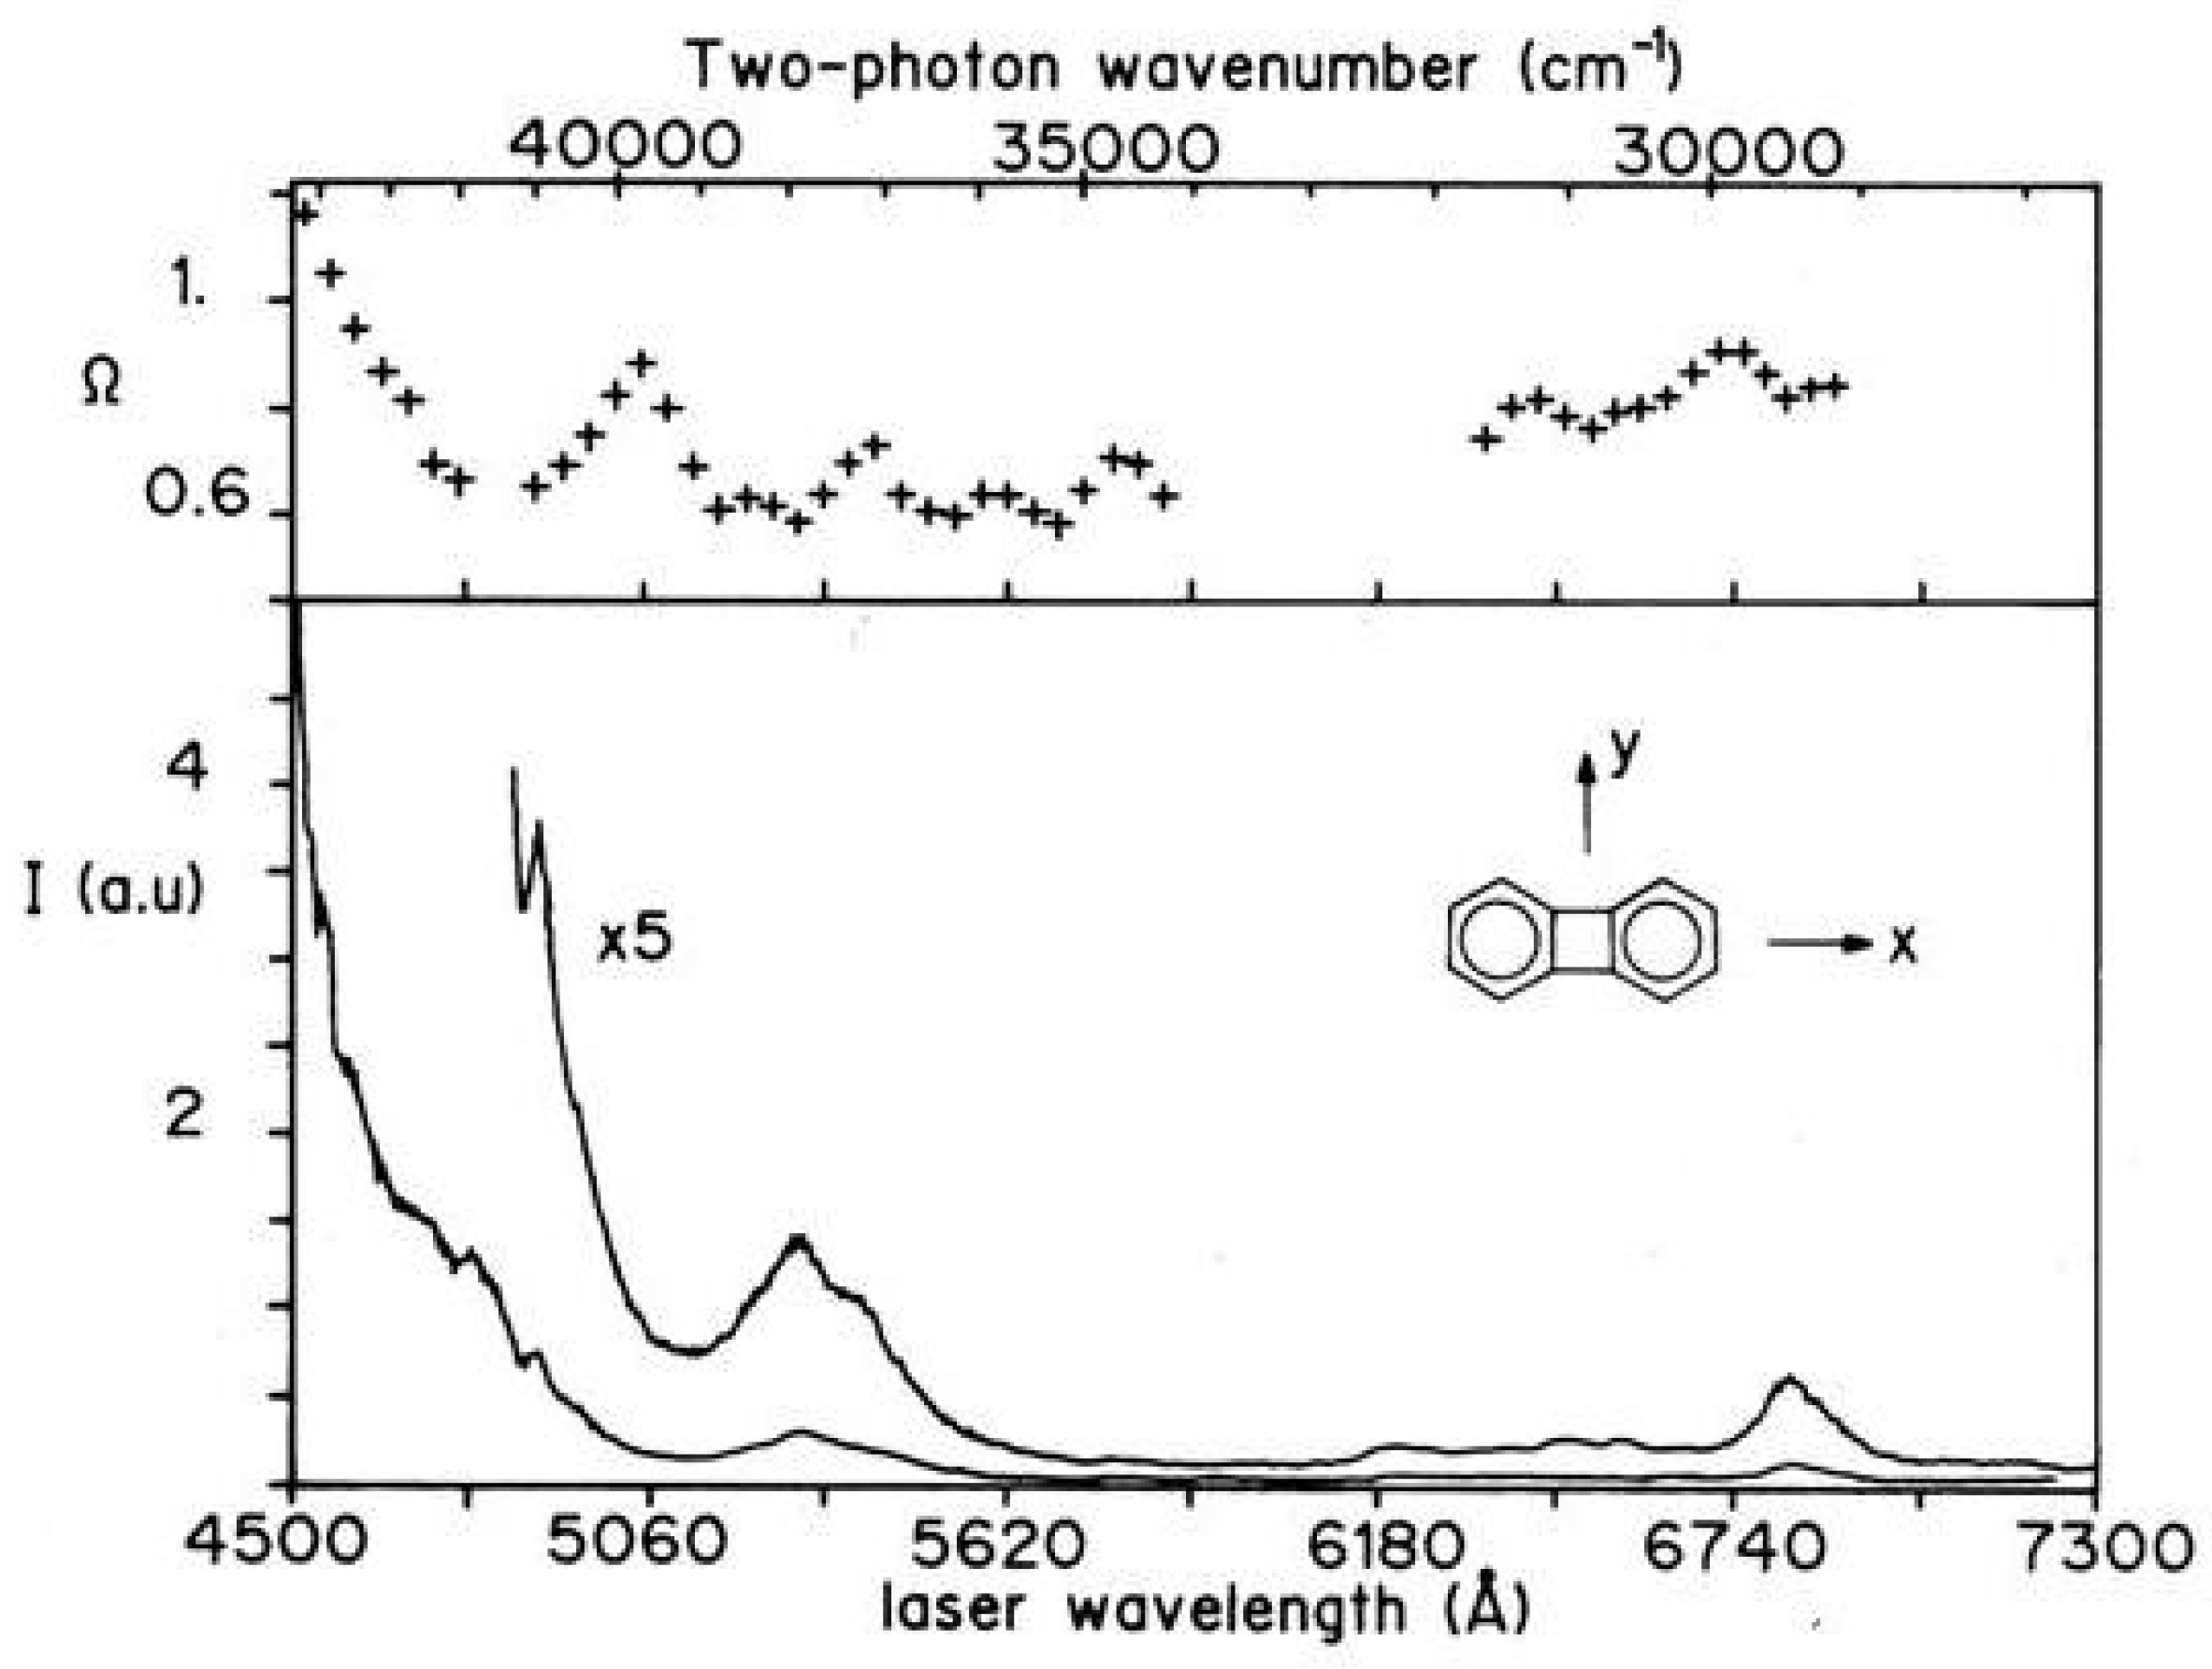
Figure 32.
Two-photon excitation spectrum (lower trace) and polarization ratio (upper trace) of biphenylene in cyclohexane at room temperature in the 225–370 nm spectral range.
Figure 32.
Two-photon excitation spectrum (lower trace) and polarization ratio (upper trace) of biphenylene in cyclohexane at room temperature in the 225–370 nm spectral range.
Figure 33.
Experimental [
228], left, and calculated [
20] (B3LYP/6-311+G
, center; BHLYP/6-311+G
, right) structures of [14]annulene. Bondlengths in Å.
Figure 33.
Experimental [
228], left, and calculated [
20] (B3LYP/6-311+G
, center; BHLYP/6-311+G
, right) structures of [14]annulene. Bondlengths in Å.
Figure 34.
Cis/trans isomerization reaction of [14]annulene in solution at room temperature.
Figure 34.
Cis/trans isomerization reaction of [14]annulene in solution at room temperature.
Figure 35.
Energy profile of the
cis/trans isomerization reaction connecting the
and
isomers of [14]annulene. CASPT2(14,14)/cc-pVDZ//(U)BHHLYP/6-311+G
results [
9].
Figure 35.
Energy profile of the
cis/trans isomerization reaction connecting the
and
isomers of [14]annulene. CASPT2(14,14)/cc-pVDZ//(U)BHHLYP/6-311+G
results [
9].
Figure 36.
Upper: molecular structures of syn- and anti-1,6:8,13-bismethano[14]annulene, 6, left; 7 right, respectively, with atomic numbering. Lower: molecular structures of 1,6:8,13-ethanediylidene[14]annulene (8, left) and 1,6:8,13-propanediylidene[14]annulene (9, right).
Figure 36.
Upper: molecular structures of syn- and anti-1,6:8,13-bismethano[14]annulene, 6, left; 7 right, respectively, with atomic numbering. Lower: molecular structures of 1,6:8,13-ethanediylidene[14]annulene (8, left) and 1,6:8,13-propanediylidene[14]annulene (9, right).
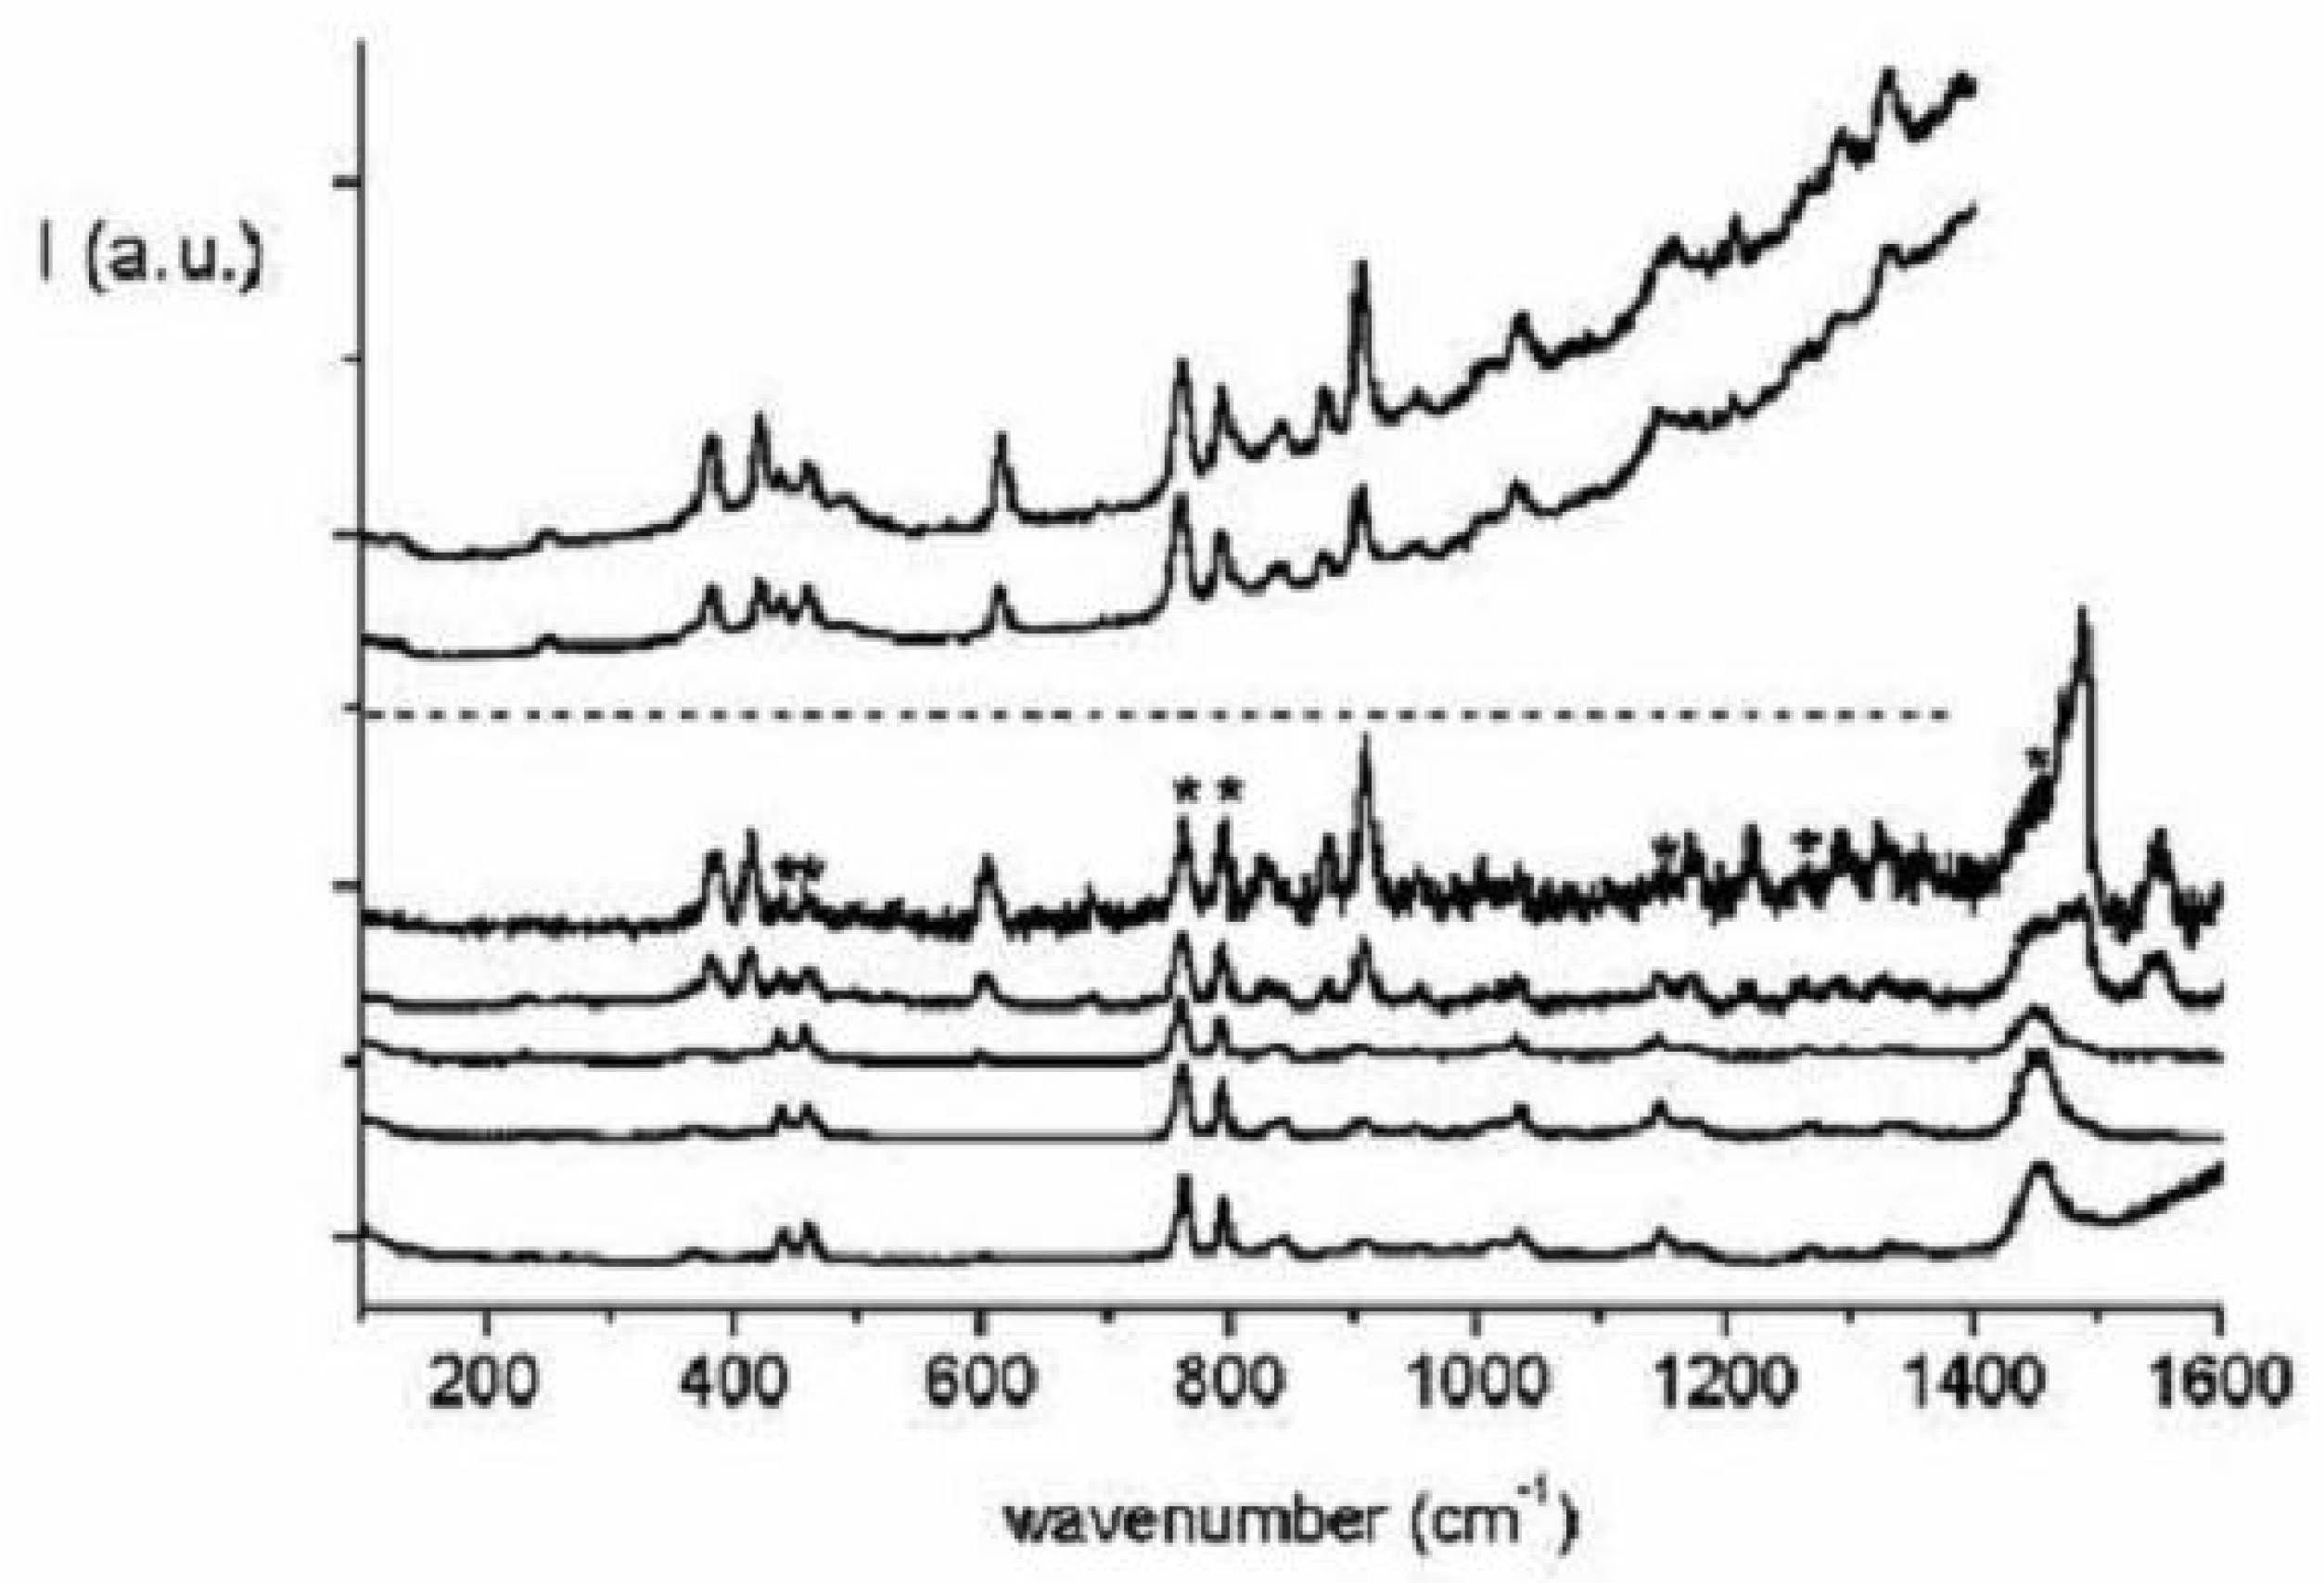
Figure 37.
Raman spectra of polycrystalline 1,6:8,13-ethanediylidene[14]annulene 8 at room temperature at two excitation wavelengths, 1064 nm (upper) and 647.1 nm (lower).
Figure 37.
Raman spectra of polycrystalline 1,6:8,13-ethanediylidene[14]annulene 8 at room temperature at two excitation wavelengths, 1064 nm (upper) and 647.1 nm (lower).
Figure 38.
Absorption spectra of 1,6:8,13-ethanediylidene[14]annulene 8 (lower, c = 5×10 M in isopentane/ether, room temperature) and 1,6:8,13-propanediylidene[14]annulene 9 (upper, c = 2×10 M and 2×10 M in isopentane/ether, room temperature). The excitation wavelengths of the Raman spectra are shown in the figure as vertical lines between the two spectra.
Figure 39.
Raman spectra of 1,6:8,13-ethanediylidene[14]annulene 8 (lower five traces) and 1,6:8,13-propanediylidene[14]annulene 9 (upper two traces), c = 10 M in isopentane/ether, room temperature. The excitation wavelengths are, from bottom to top, 476.5, 457.9, 441.6, 413.1 and 406.7 nm for 1,6:8,13-ethanediylidene[14]annulene and 413.1 and 406.7 nm for 1,6:8,13-propanediylidene[14]annulene. The most intense solvent bands are indicated by asterisks in the 406.7 nm spectrum.
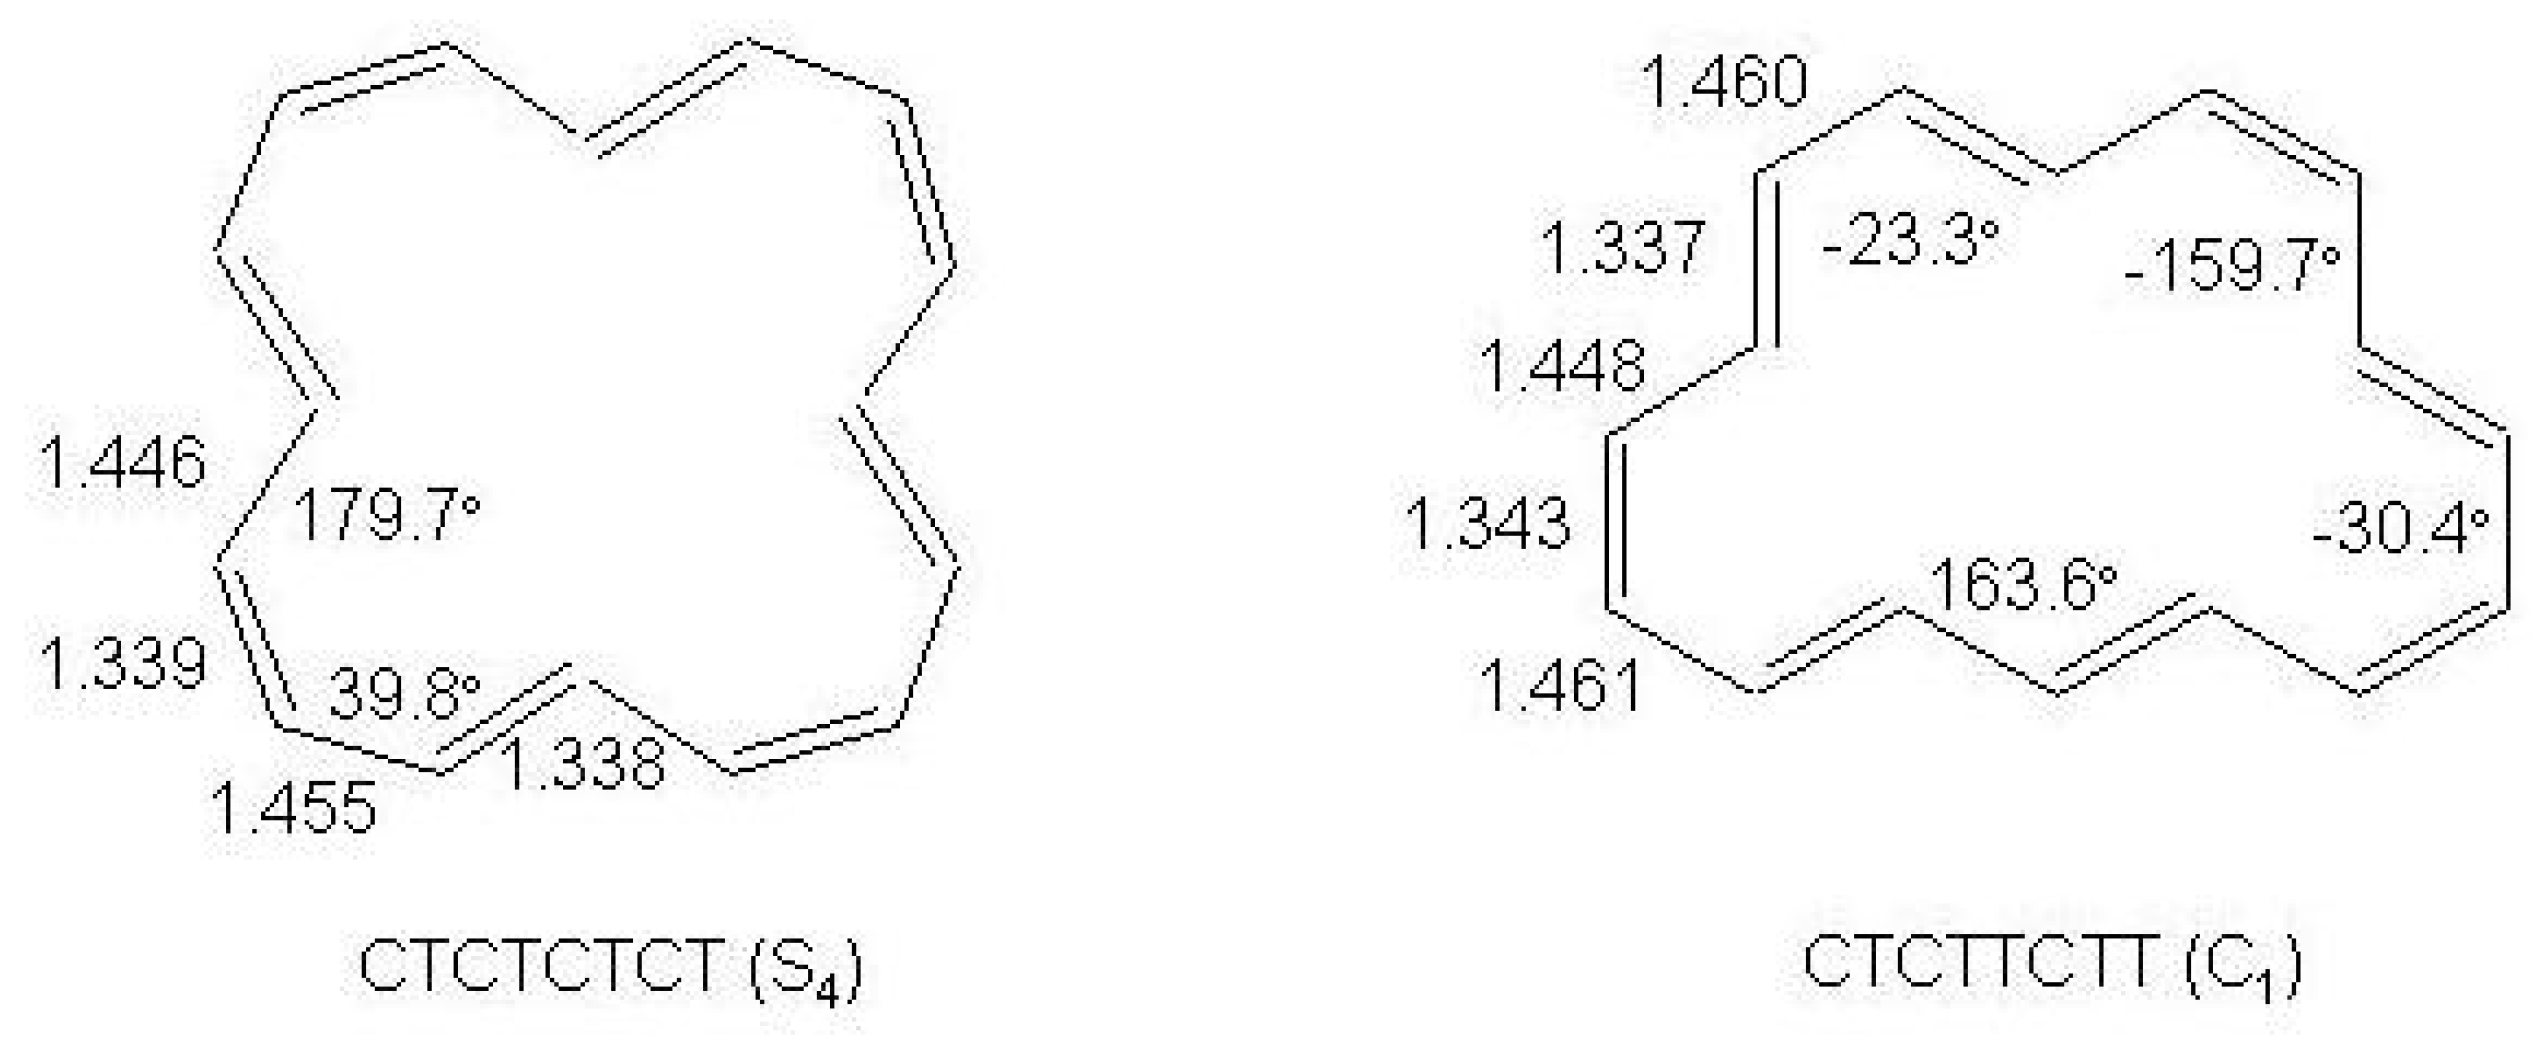
Figure 40.
The structures of the
(
10a and
(
10b [16]annulene isomers calculated at the BHHLYP/6-311+G
level [
8]. Selected bondlengths (Å) and dihedral angles (∘) are shown.
Figure 40.
The structures of the
(
10a and
(
10b [16]annulene isomers calculated at the BHHLYP/6-311+G
level [
8]. Selected bondlengths (Å) and dihedral angles (∘) are shown.
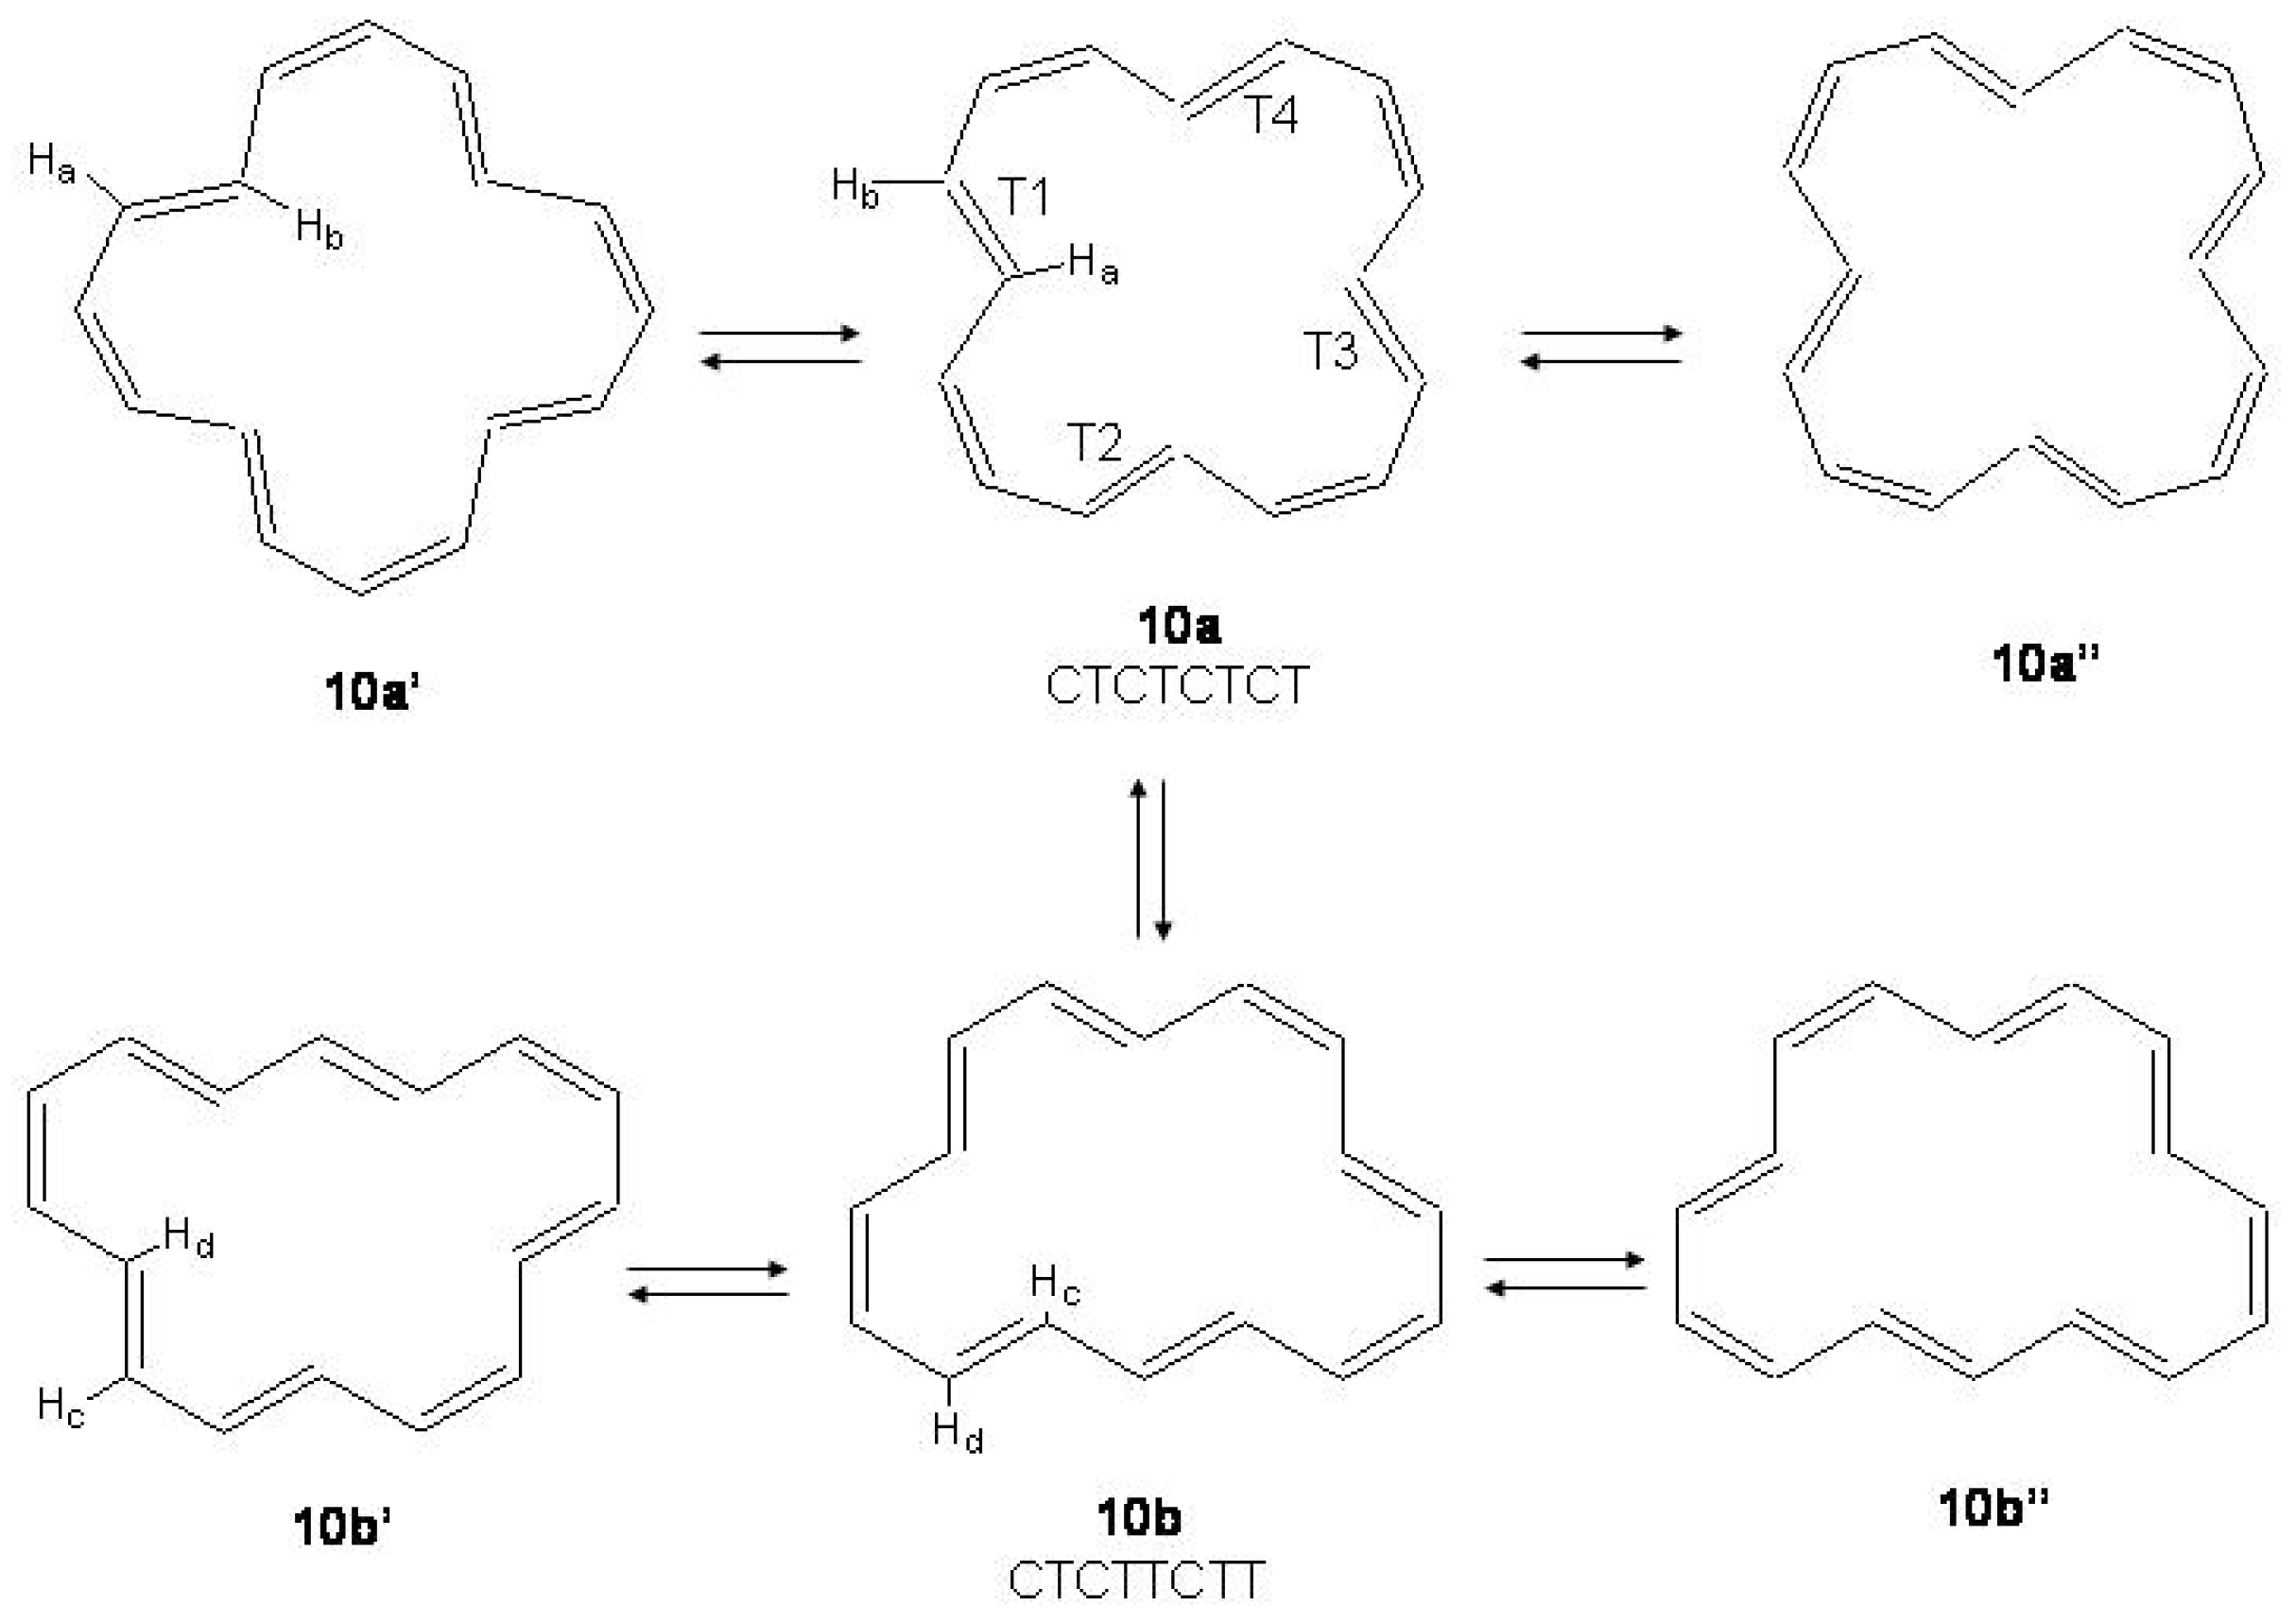
Figure 41.
Conformational (10a →10a; 10b→10b), configurational (10a→10b) and bond shift (10a→10a; 10b→10b) processes in [16]annulene.
Figure 41.
Conformational (10a →10a; 10b→10b), configurational (10a→10b) and bond shift (10a→10a; 10b→10b) processes in [16]annulene.
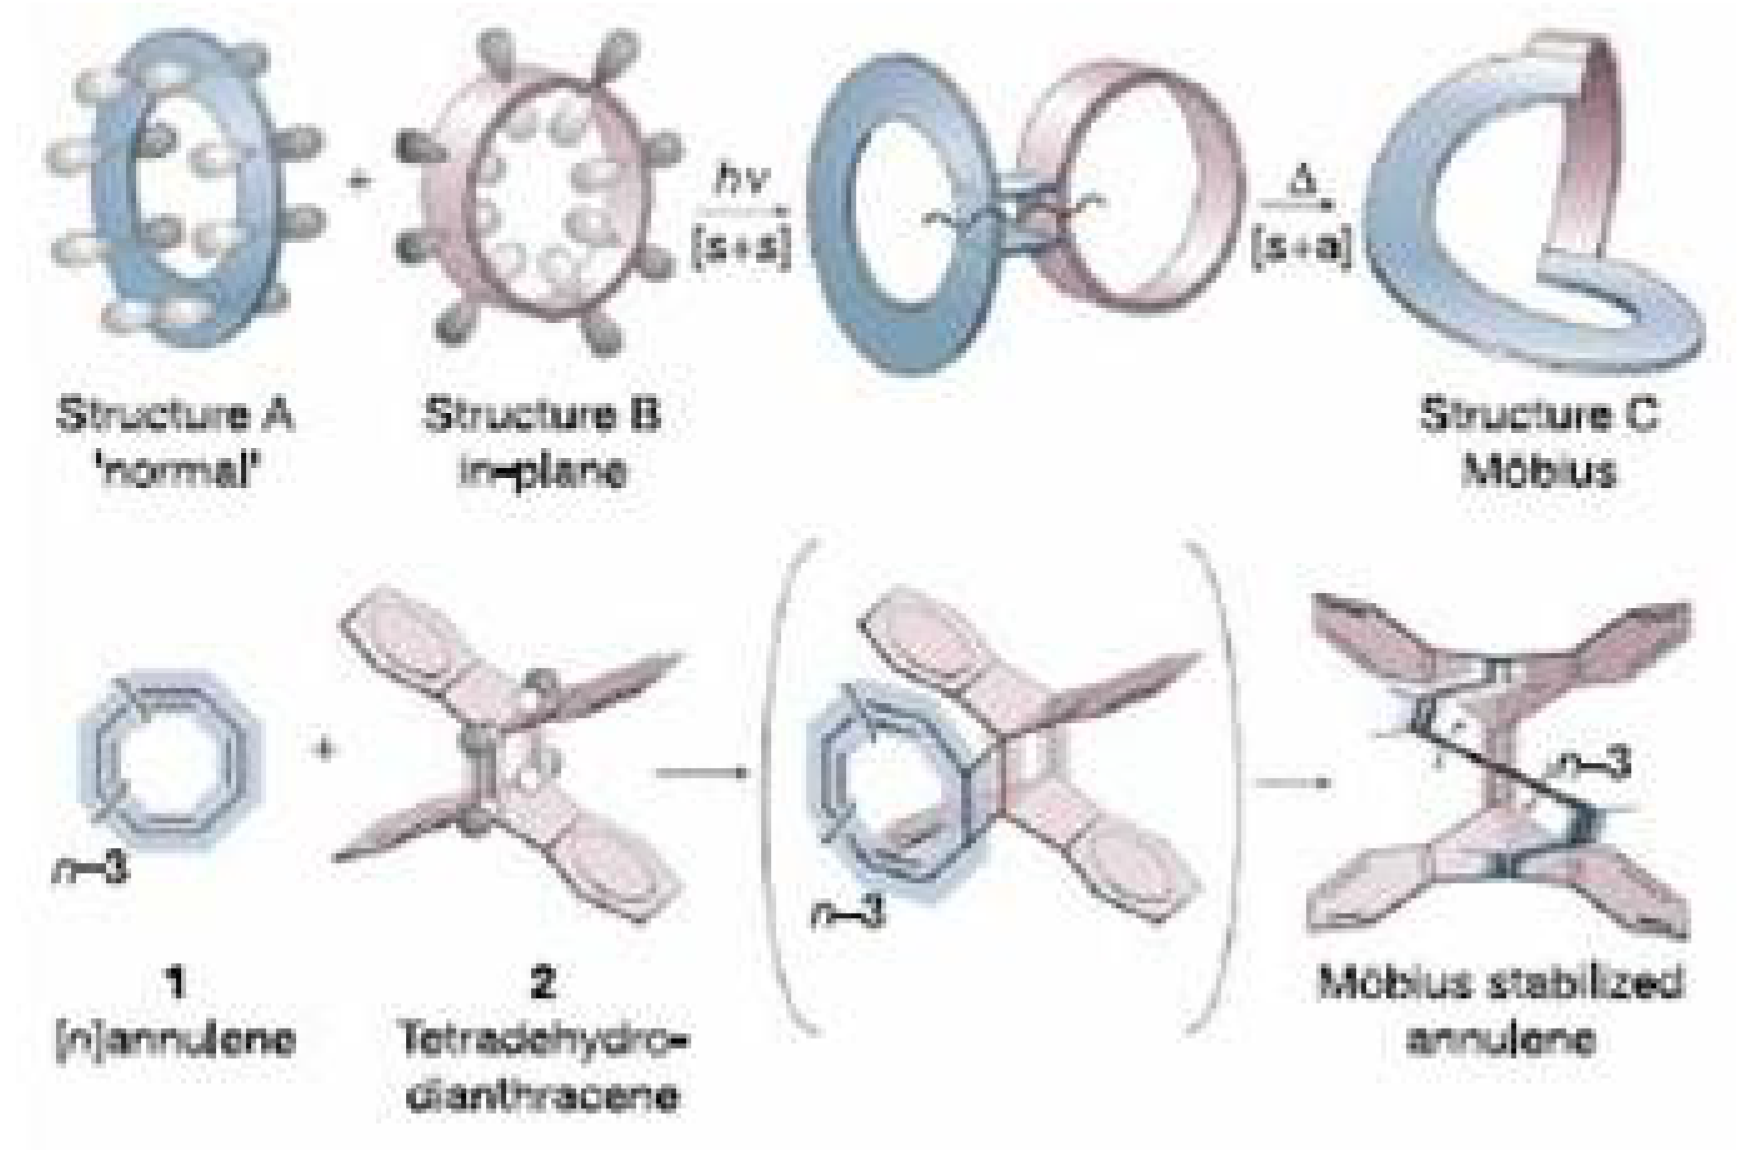
Figure 42.
Schematic view of the synthetic strategy used to stabilize the
Möbius structure of [16]annulene [
255].
Figure 42.
Schematic view of the synthetic strategy used to stabilize the
Möbius structure of [16]annulene [
255].
Figure 43.
Structure of
[16]annulene in the Möbius topology. Bondlengths in Å are from X-ray data [
255]. Dihedral angles (∘) are from DFT calculations (B3LYP/6-31G*) [
255]. Nomenclature: the
configuration is relative to the two H atoms at the quinoid double bonds;
c and
t denote the
s-cis or
s-trans geometry between two adjacent double bonds;
E and
Z the stereochemistry of the three central double bonds. For the sake of clarity the benzo groups fused with bonds marked with a
b are omitted [
230].
Figure 44.
The structure of [18]annulene: left, experimental [
260,
261], in parentheses, and calculated B3LYP/6-311+G
[
20] CC bond lengths; right, calculated [
20] KMLYP/6-311+G
CC bond lengths in
symmetry. Bond lengths in Å. The calculated structure on the right is slightly non planar with
axis as indicated. No dihedral angle has been reported [
20].
Figure 45.
Calculated (B3LYP/cc-pVDZ) [
275] and (in parentheses) experimental bond lengths (Å) [
272,
283,
284] of the stable structures of porphyrin (PH
,
), diprotonated porphyrin (PH
,
) and tetraoxaporphyrin dication (TOXP
,
). The experimental bond lengths are in the three cases average values of distances symmetrically equivalent in
,
and
symmetry, respectively. The reference axis system is also shown on the top of the Figure.
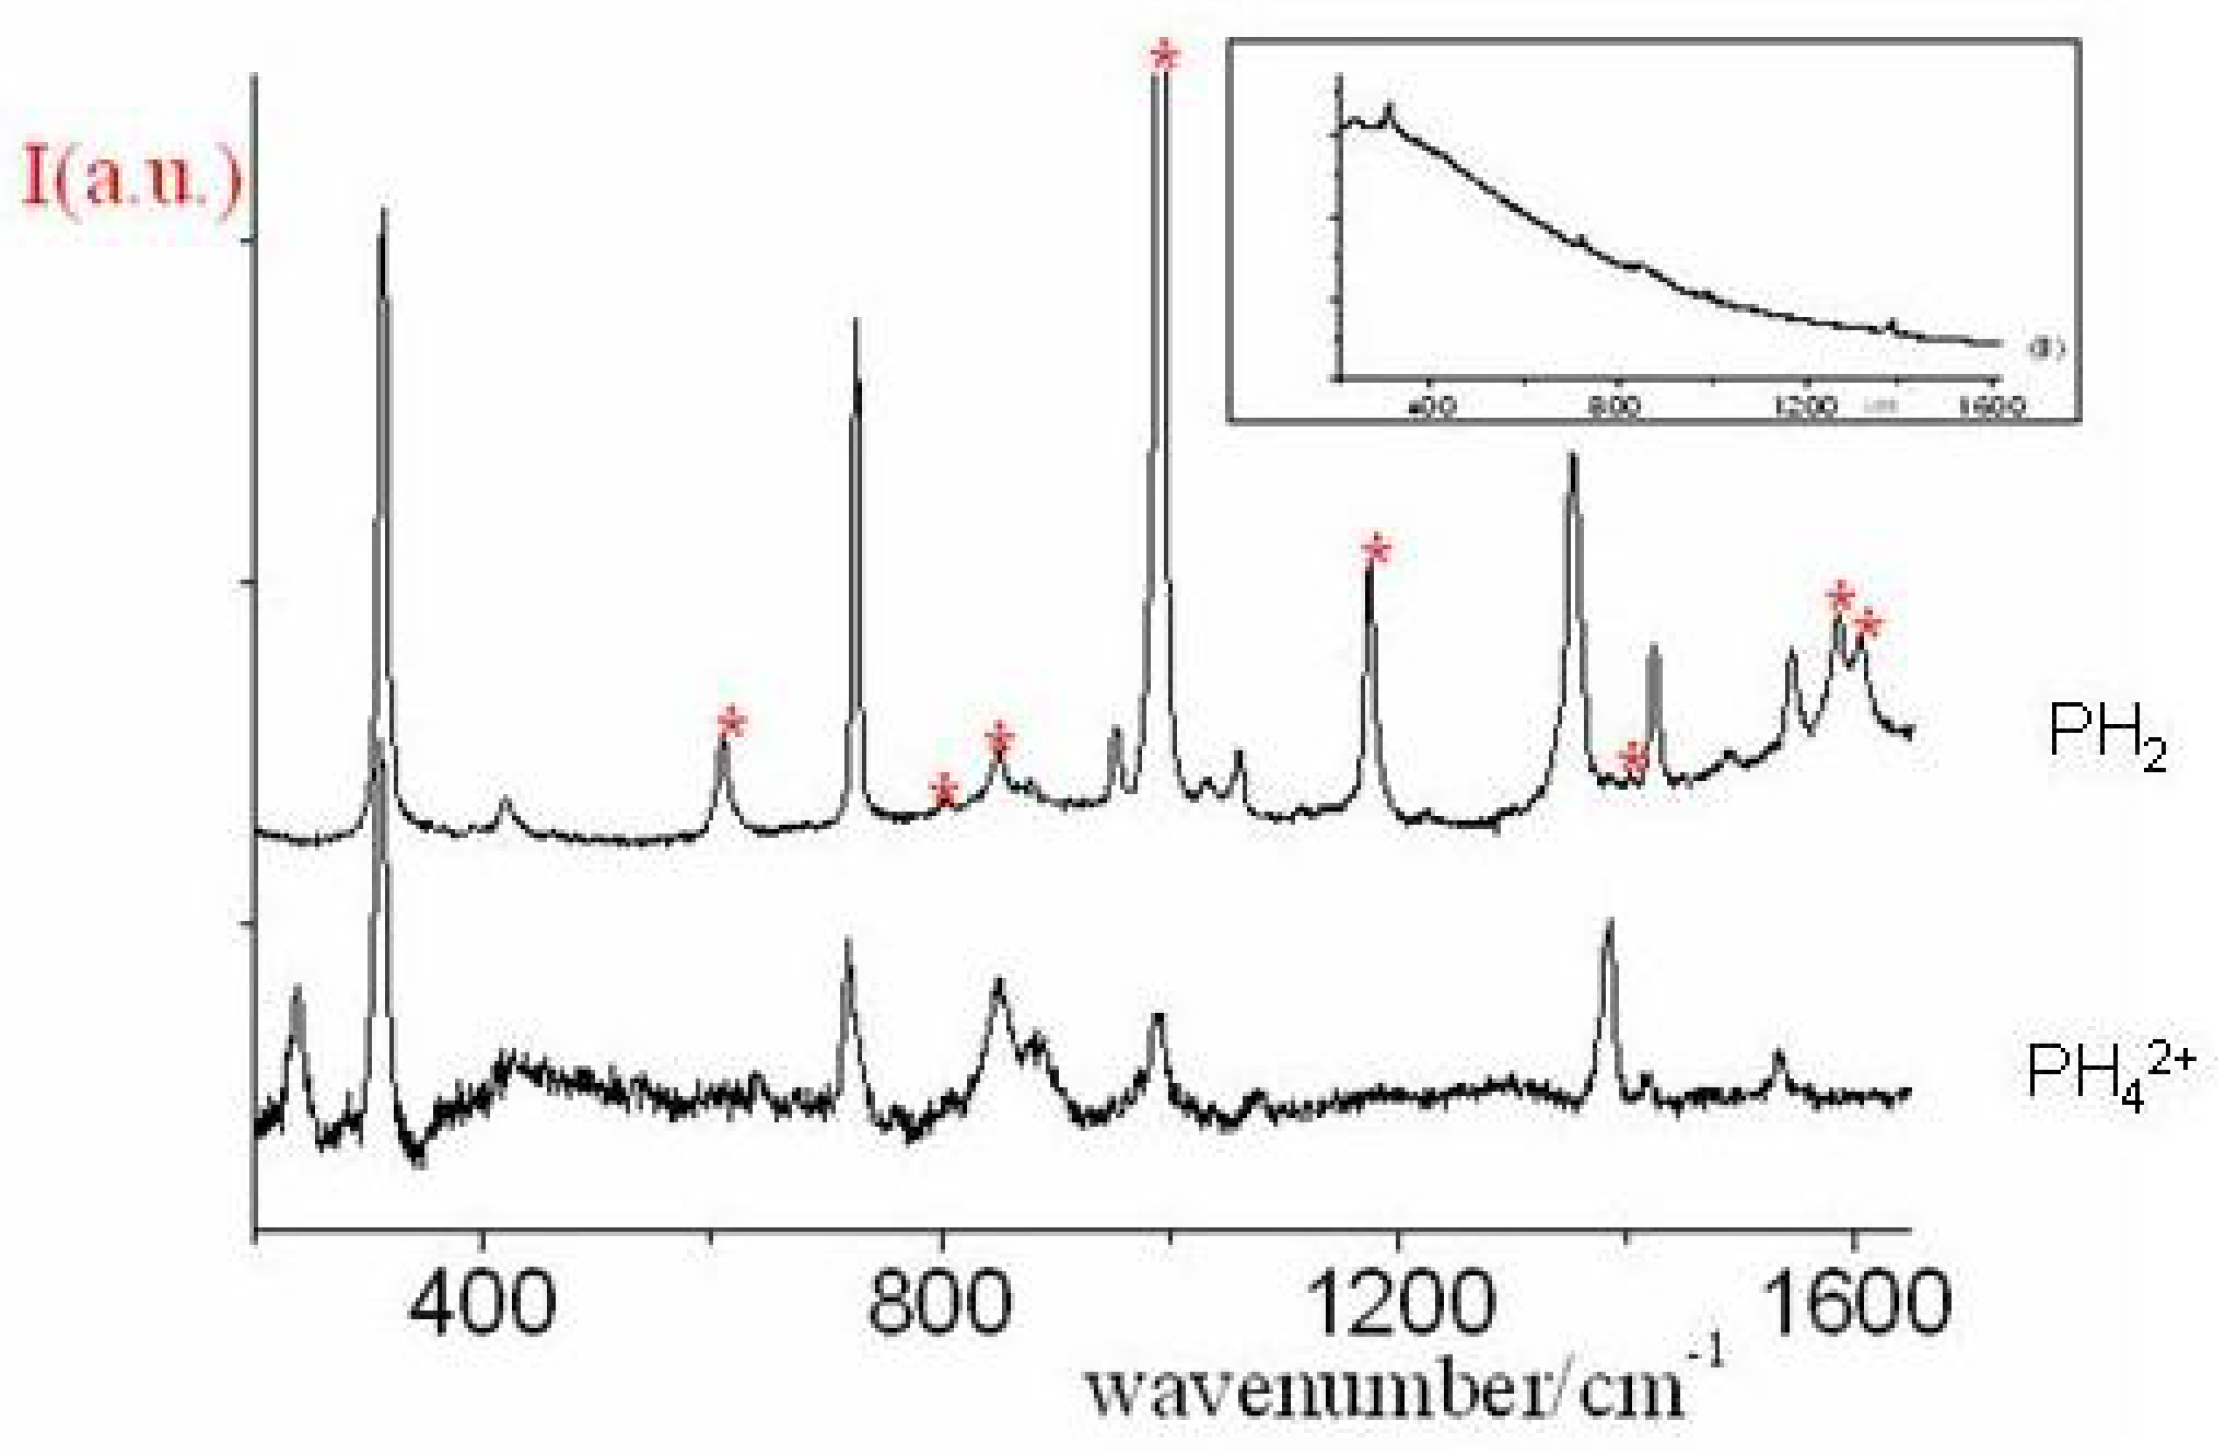
Figure 46.
Raman spectra of PH in benzene (c = 7×10 M) and of PH in HCl solution (c = 3×10 M) at room temperature excited at 406.7 nm. The asterisks mark solvent bands. In the inset the experimentally observed spectrum of PH.
Figure 46.
Raman spectra of PH in benzene (c = 7×10 M) and of PH in HCl solution (c = 3×10 M) at room temperature excited at 406.7 nm. The asterisks mark solvent bands. In the inset the experimentally observed spectrum of PH.
Figure 47.
Raman spectrum of TOXP as polycrystalline sample at room temperature excited at 785 nm. The asterisks mark solvent bands of the ClO counterion. In the inset the experimentally observed spectrum of TOXP.
Figure 47.
Raman spectrum of TOXP as polycrystalline sample at room temperature excited at 785 nm. The asterisks mark solvent bands of the ClO counterion. In the inset the experimentally observed spectrum of TOXP.
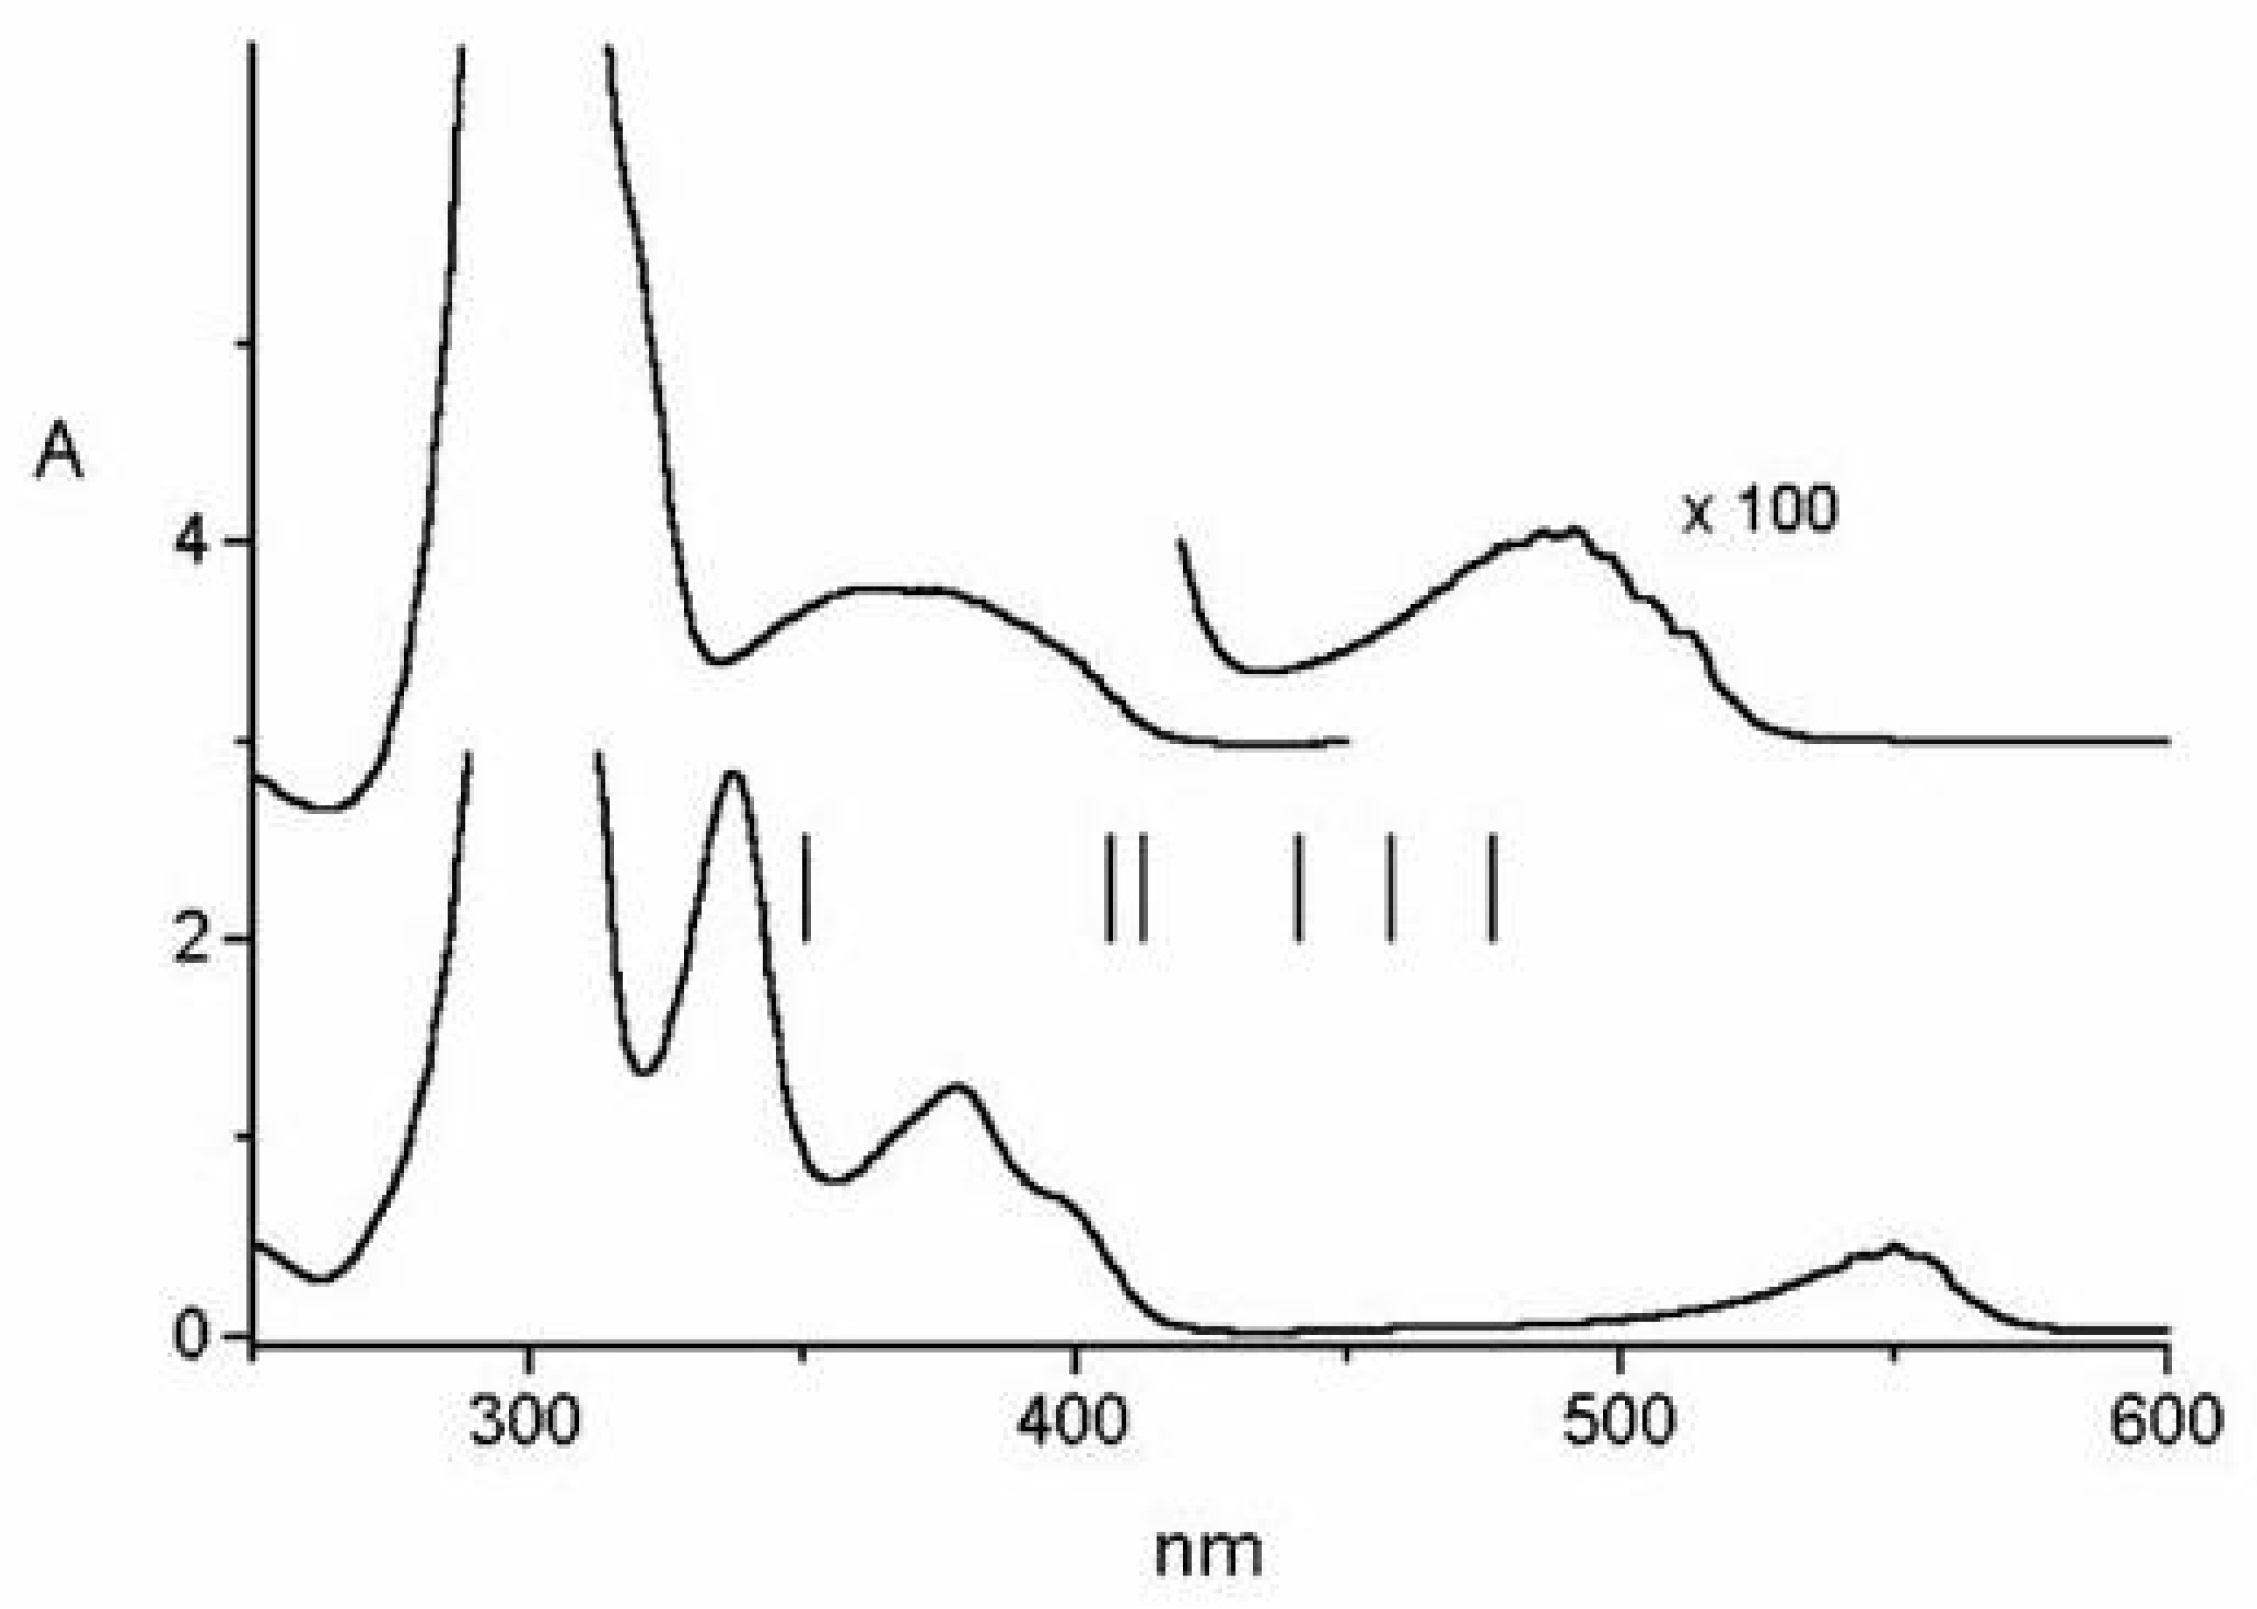
Figure 48.
Absorption spectra of PH, PH and TOXP solutions, c ≈ 10 M, room temperature, from bottom to top. The solvents are benzene/cyclohexane 1:10 for PH, benzene/cyclohexane 1:10 added with CFCOOH (5 % in volume) for PH, concentrated HClO for TOXP. Vertical arrows indicate pump wavelengths in our pump-probe experiments in the three cases.
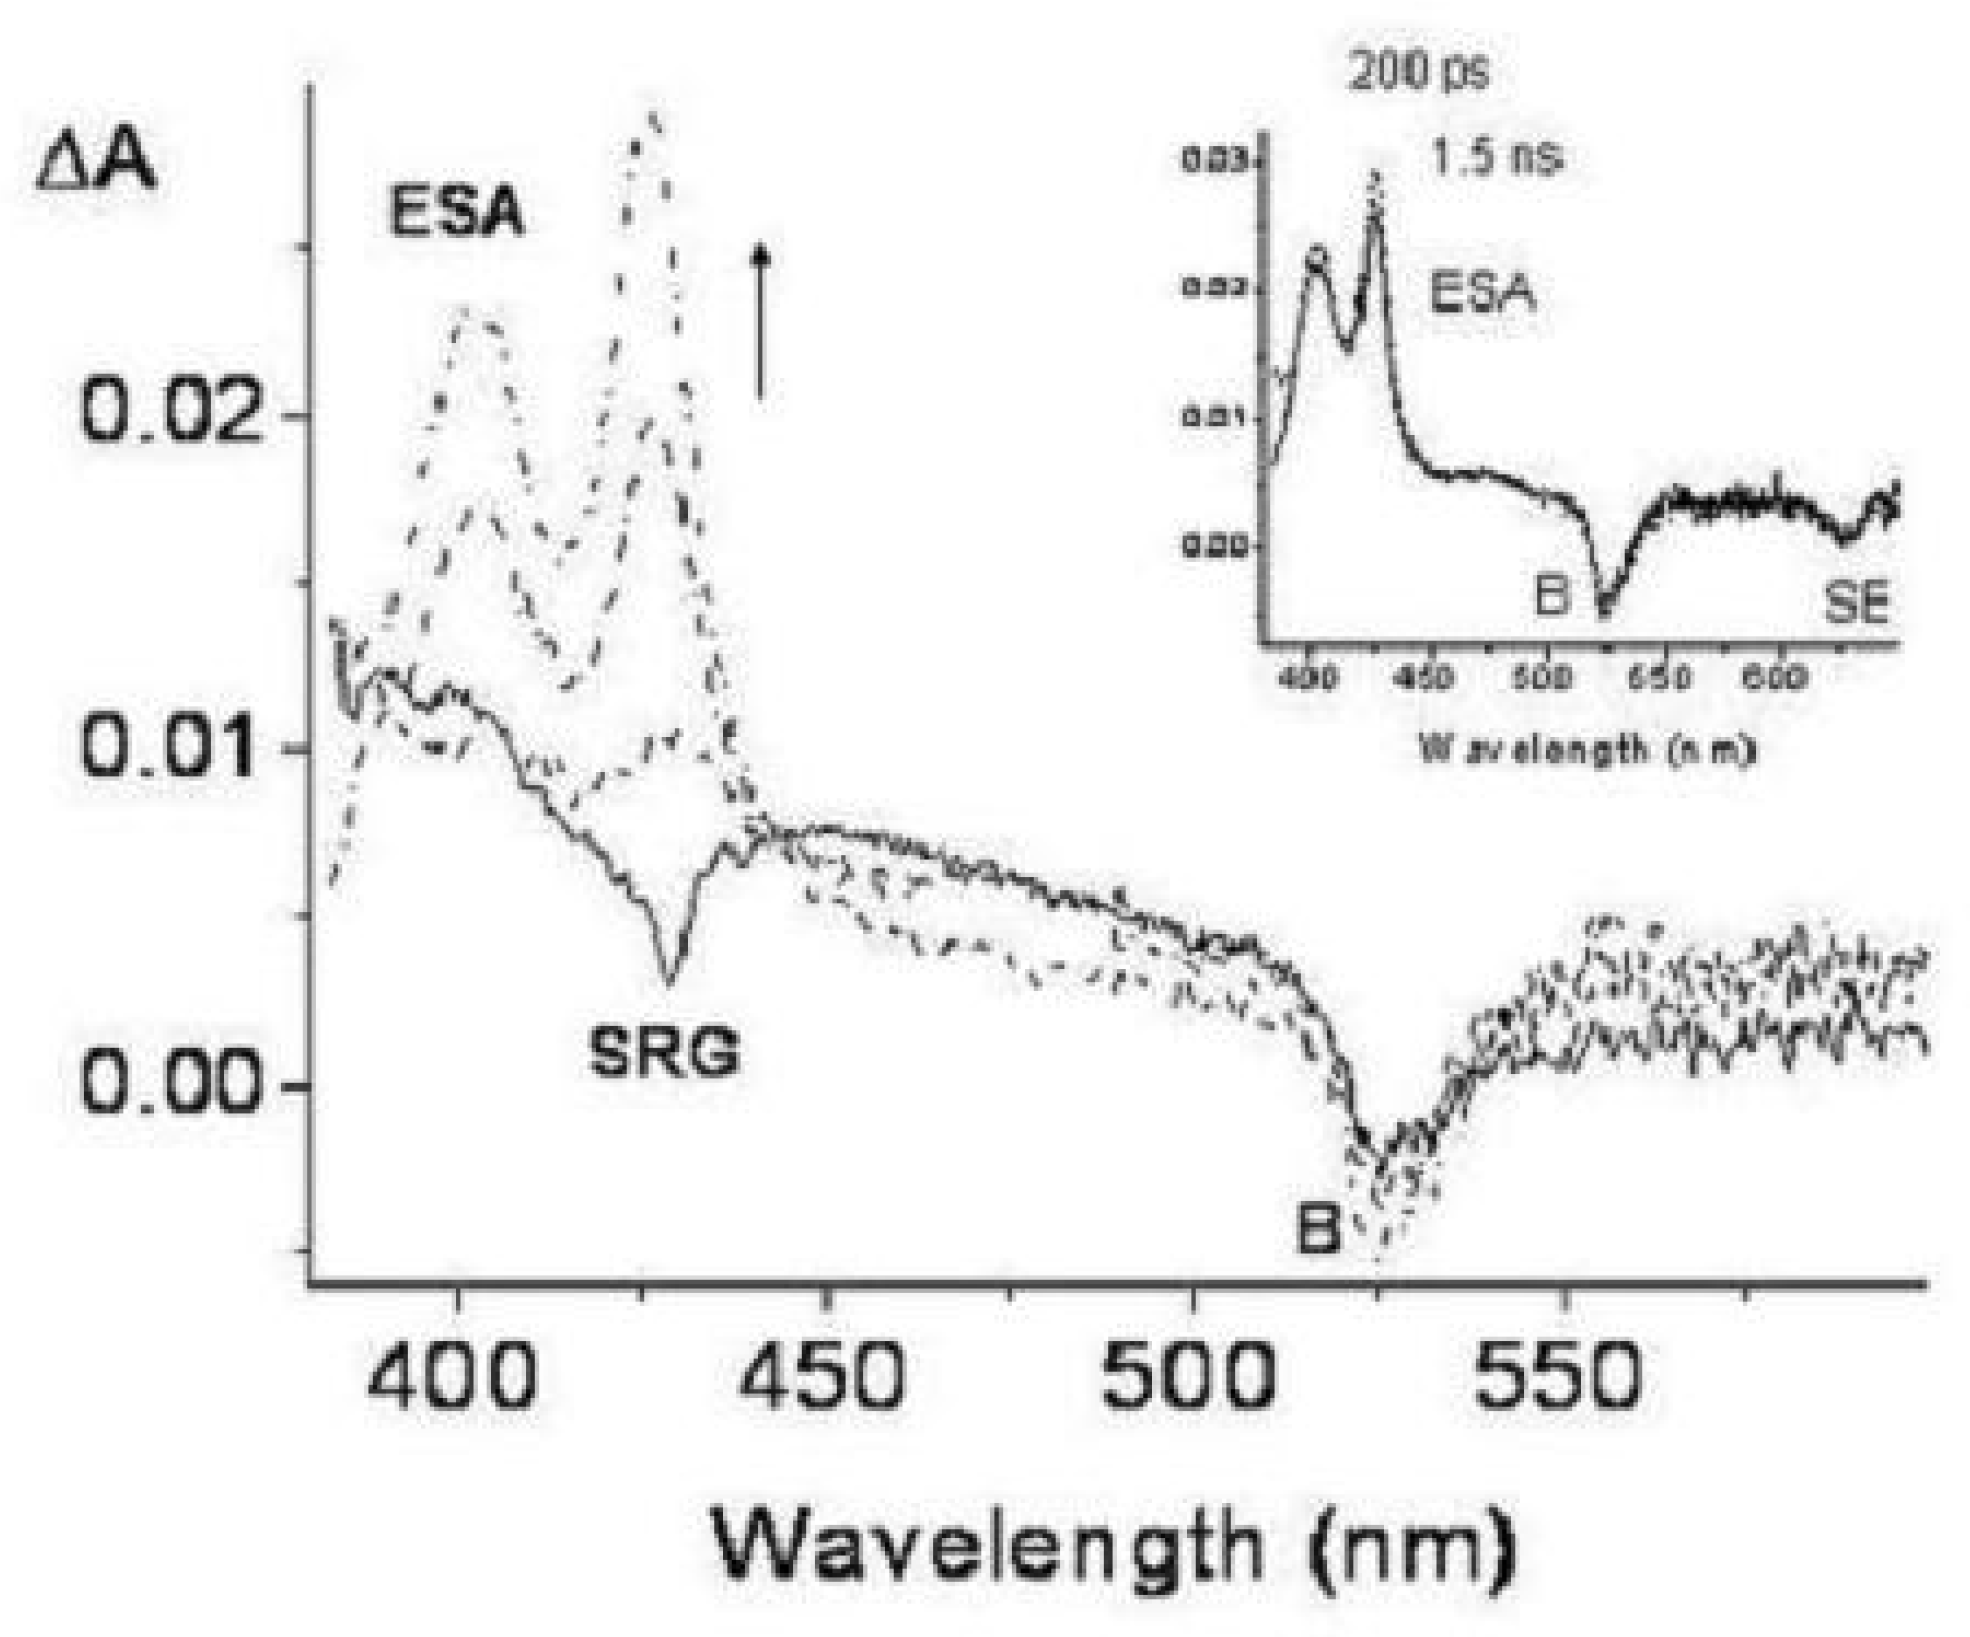
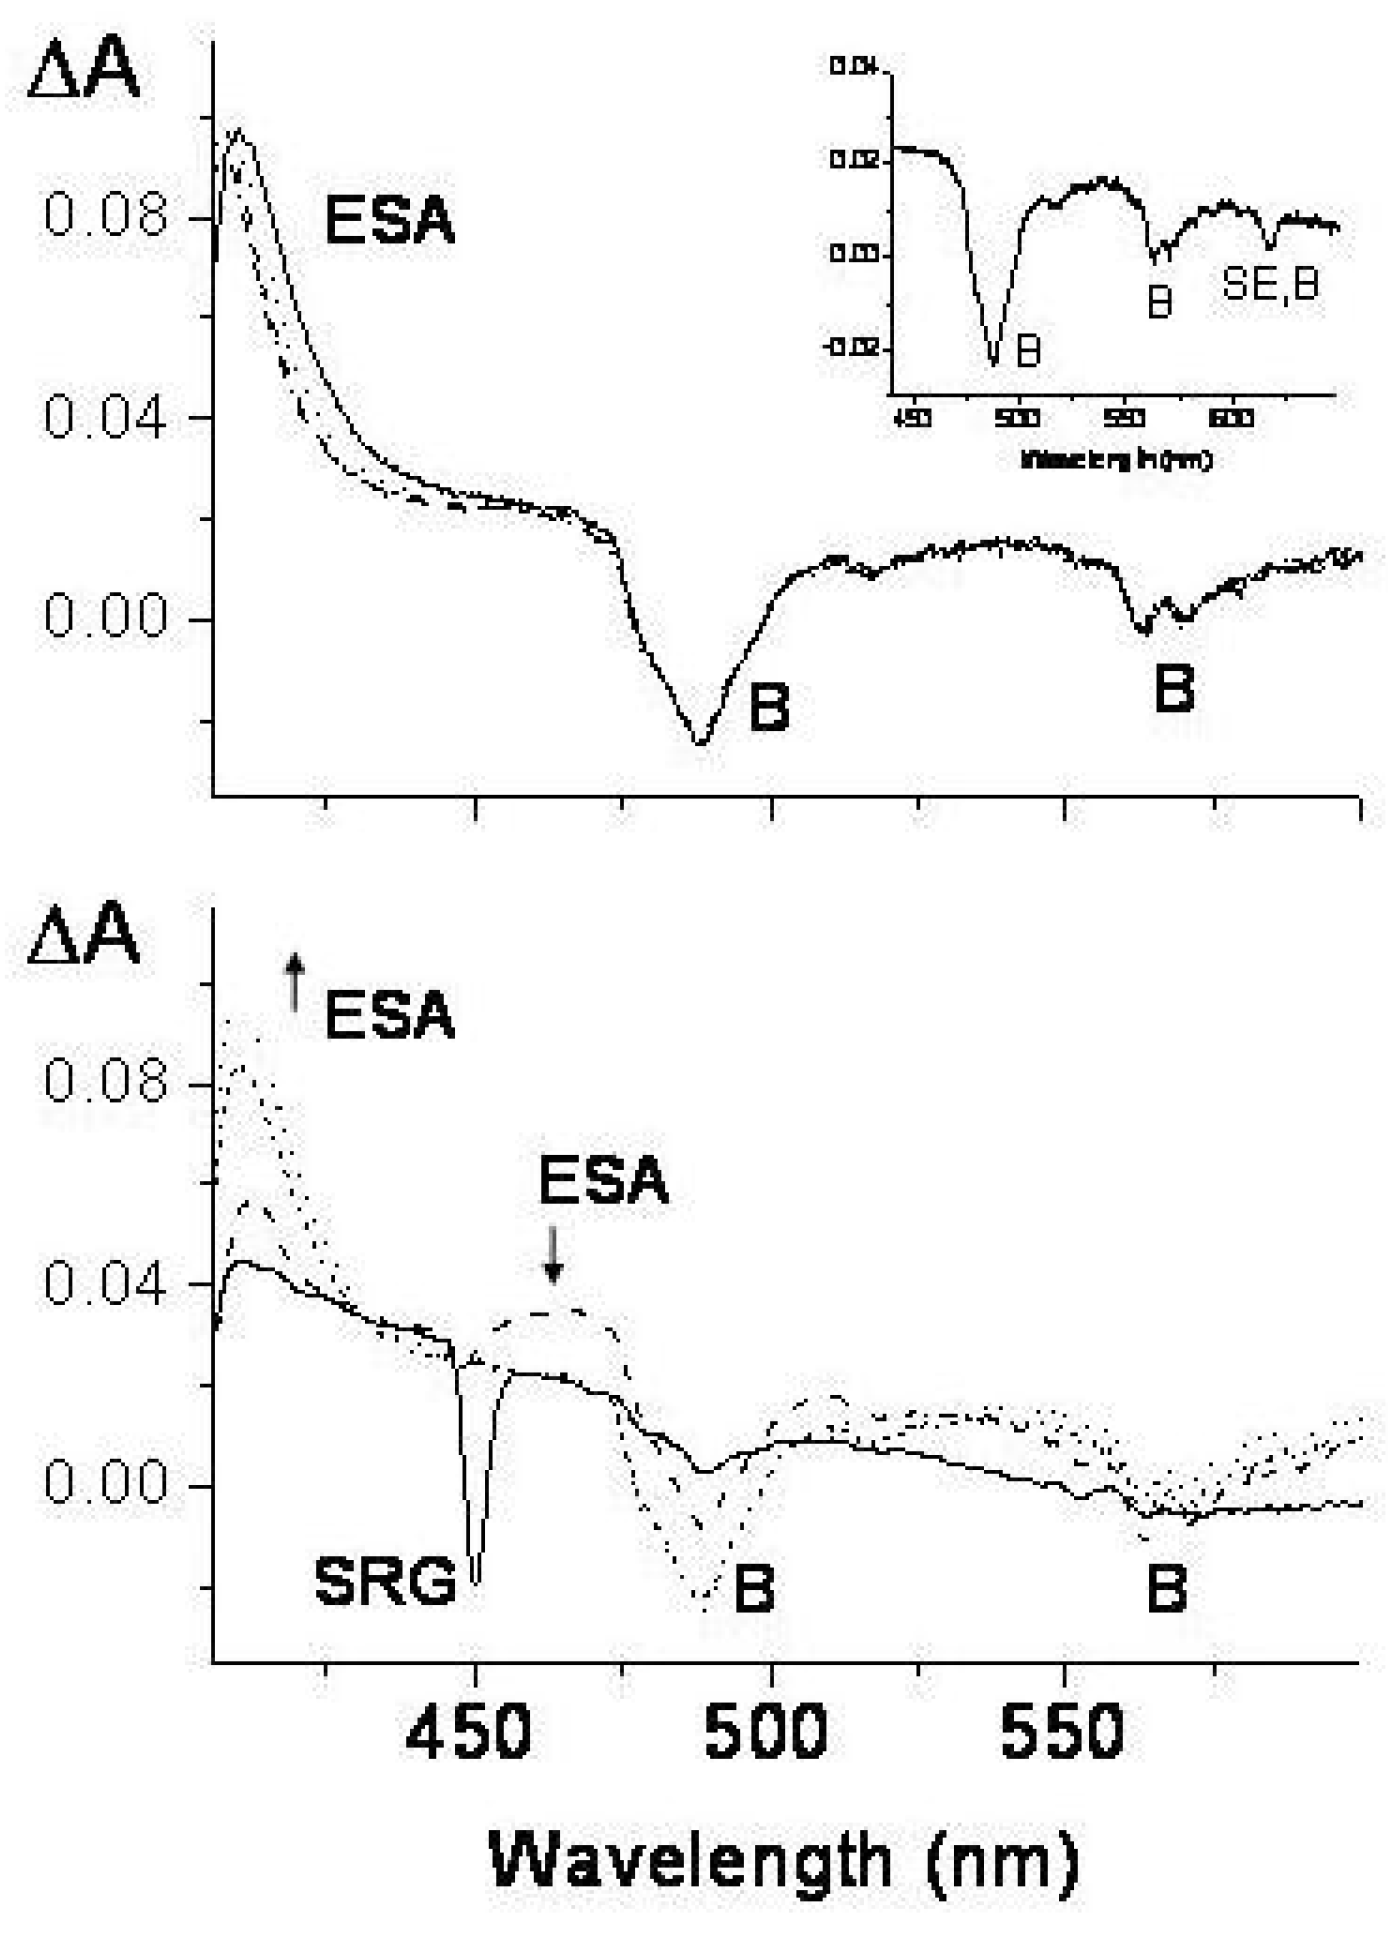
Figure 49.
Transient absorption spectra of TOXP (c = 6×10 M in concentrated HClO, room temperature) in the spectral range 400–600 nm exciting at 370 nm with femtosecond pulses. The transient spectra are plotted as a function of the delay time between pump and probe pulses. The ESA, SRG, B and SE symbols identify transient bands due to excited state absorption, stimulated Raman gain of the solvent, bleaching and stimulated emission, respectively. Solid line, temporal coincidence between pump and probe pulses; long dashed, dashed-dotted, dashed-doubly dotted, 5, 20 and 200 ps delay times, respectively; vertical arrow up, intensity increase with time. Inset: transient absorption spectra at 200 ps and 1.5 ns delay times.
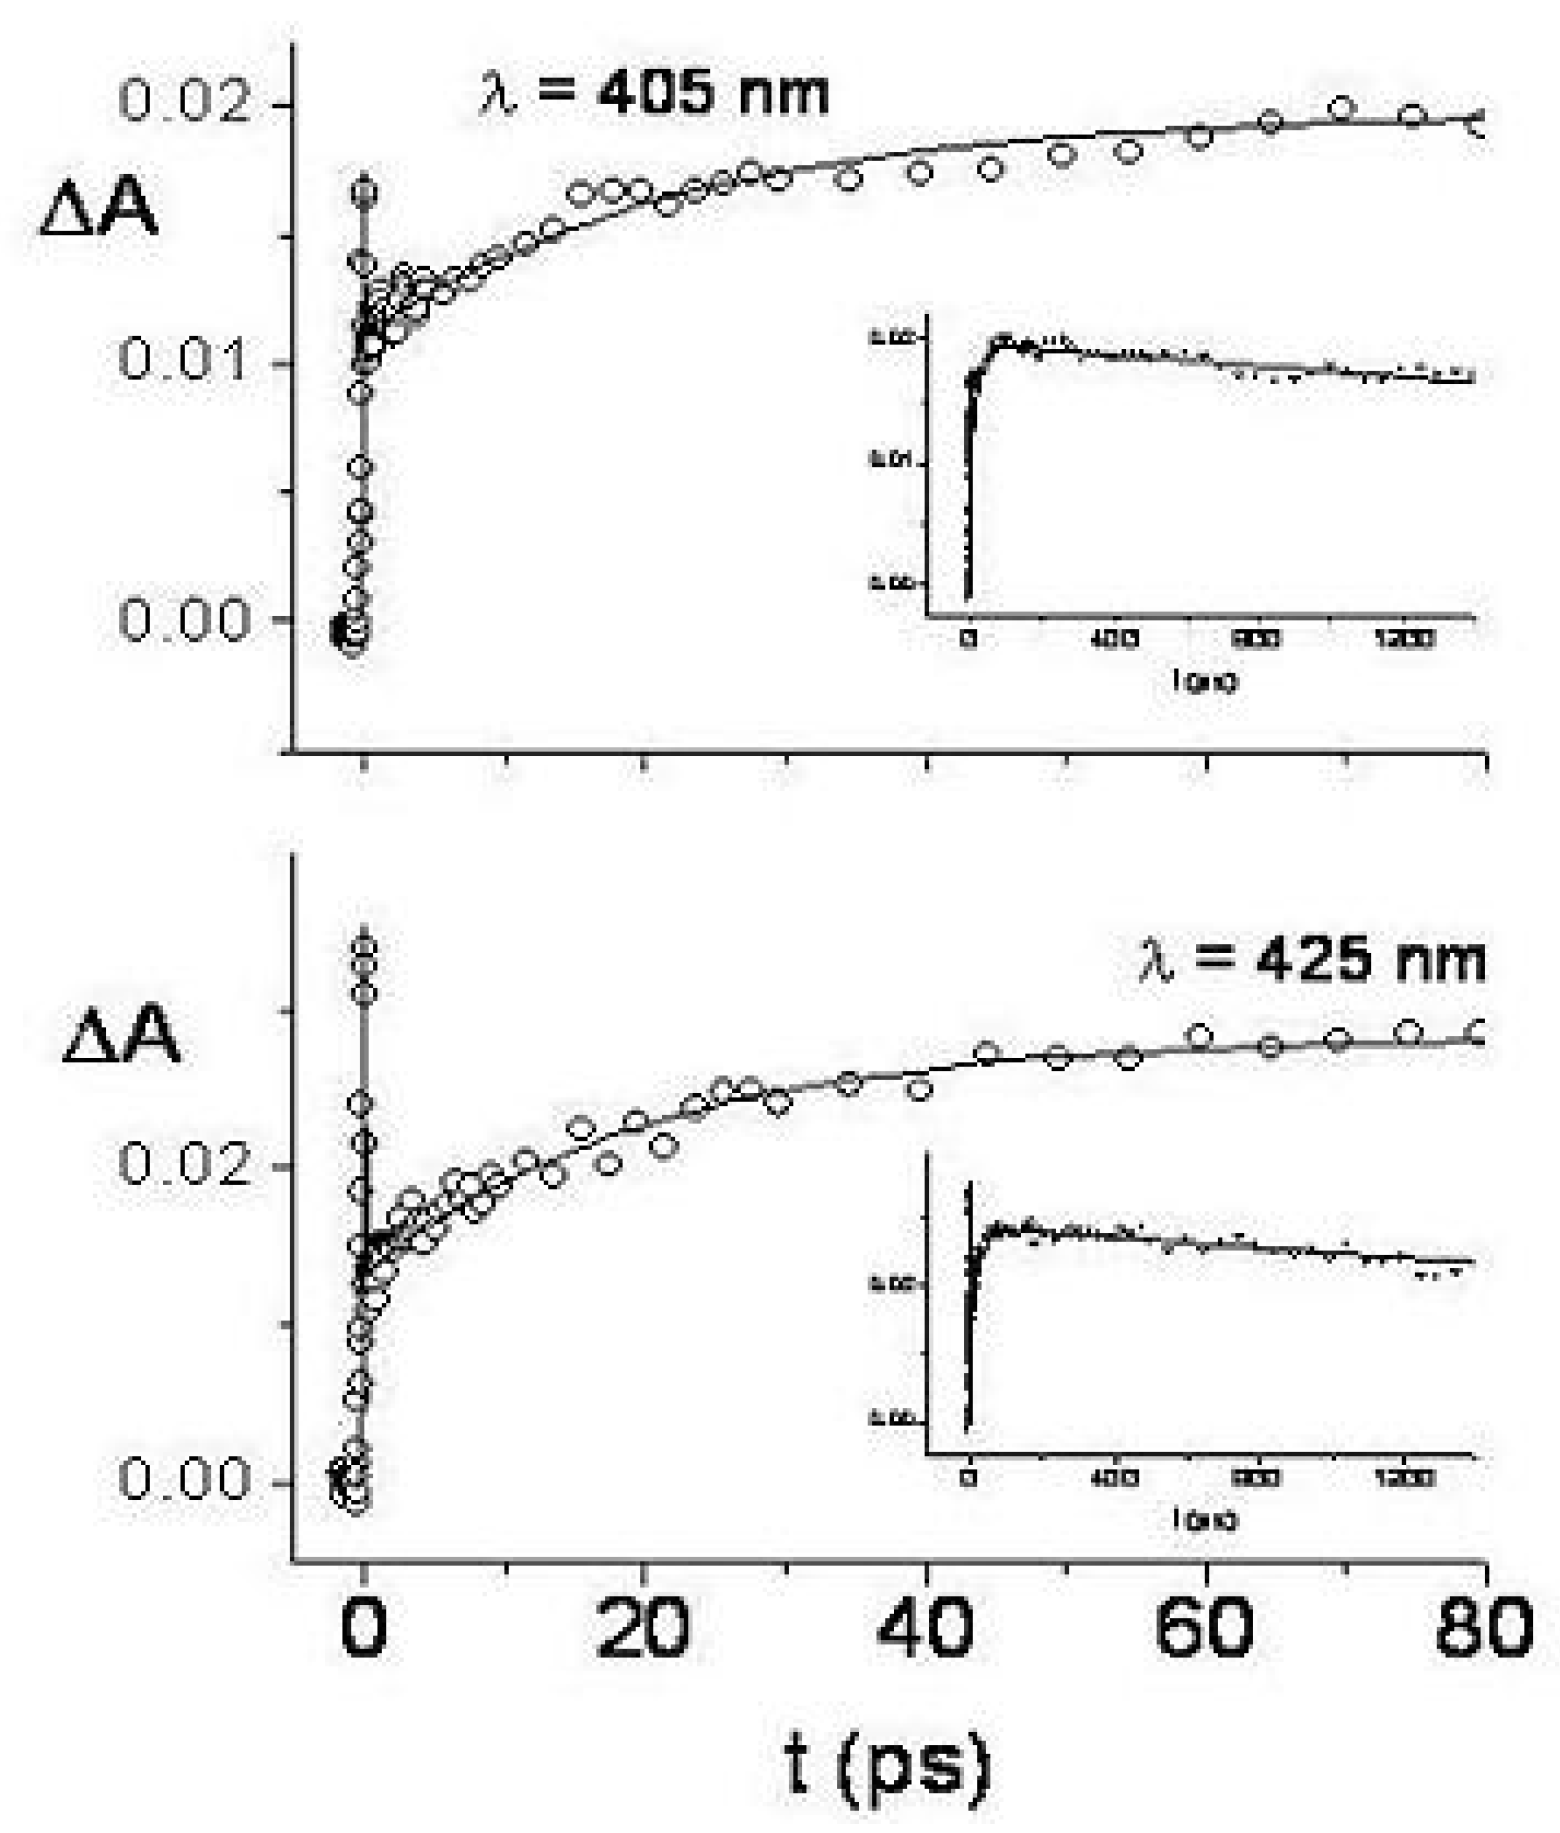
Figure 50.
Transient absorbance of TOXP
as a function of the delay time in the same experimental conditions detailed in
Figure 37 and probing at 425 nm (lower) and 405 nm (upper). The insets of the two panels show the transient absorbances at the probe wavelengths 425 and 405 nm for long delay times.
Figure 51.
Transient absorption spectra of PH (c = 3×10 M in benzene/cyclohexane 1:10, room temperature) in the spectral range 400–600 nm exciting at 400 nm with femtosecond pulses. The transient spectra are plotted as a function of the delay time between pump and probe pulses. The ESA, SRG, B and SE symbols identify transient bands due to excited state absorption, stimulated Raman gain of the solvent, bleaching and stimulated emission, respectively. Lower panel: transient spectra in the first 5 ps; solid line, temporal coincidence between pump and probe pulses; long dashed, short dashed, dotted lines, 200 fs, 1 ps, 5 ps delay times, respectively; vertical arrows up and down, intensity increase and decrease with time. Upper panel: transient spectra after 5 ps delay time; solid, dotted, short dashed, dash-dotted lines; 5, 20, 100, 500 ps delay times, respectively. Inset of the upper panel: transient absorption spectrum at 1.5 ns delay time.
Figure 52.
Transient absorbance of PH
as a function of the delay time in the same experimental conditions detailed in
Figure 39 and probing at 465 nm (lower) and 412 nm (upper). In the lower panel the cross-correlation gaussian profile (FWHM = 160 fs) between pump and probe pulses is also reported as dashed line. The insets of the two panels show the transient absorbances at the probe wavelengths 412 and 465 nm for long delay times.
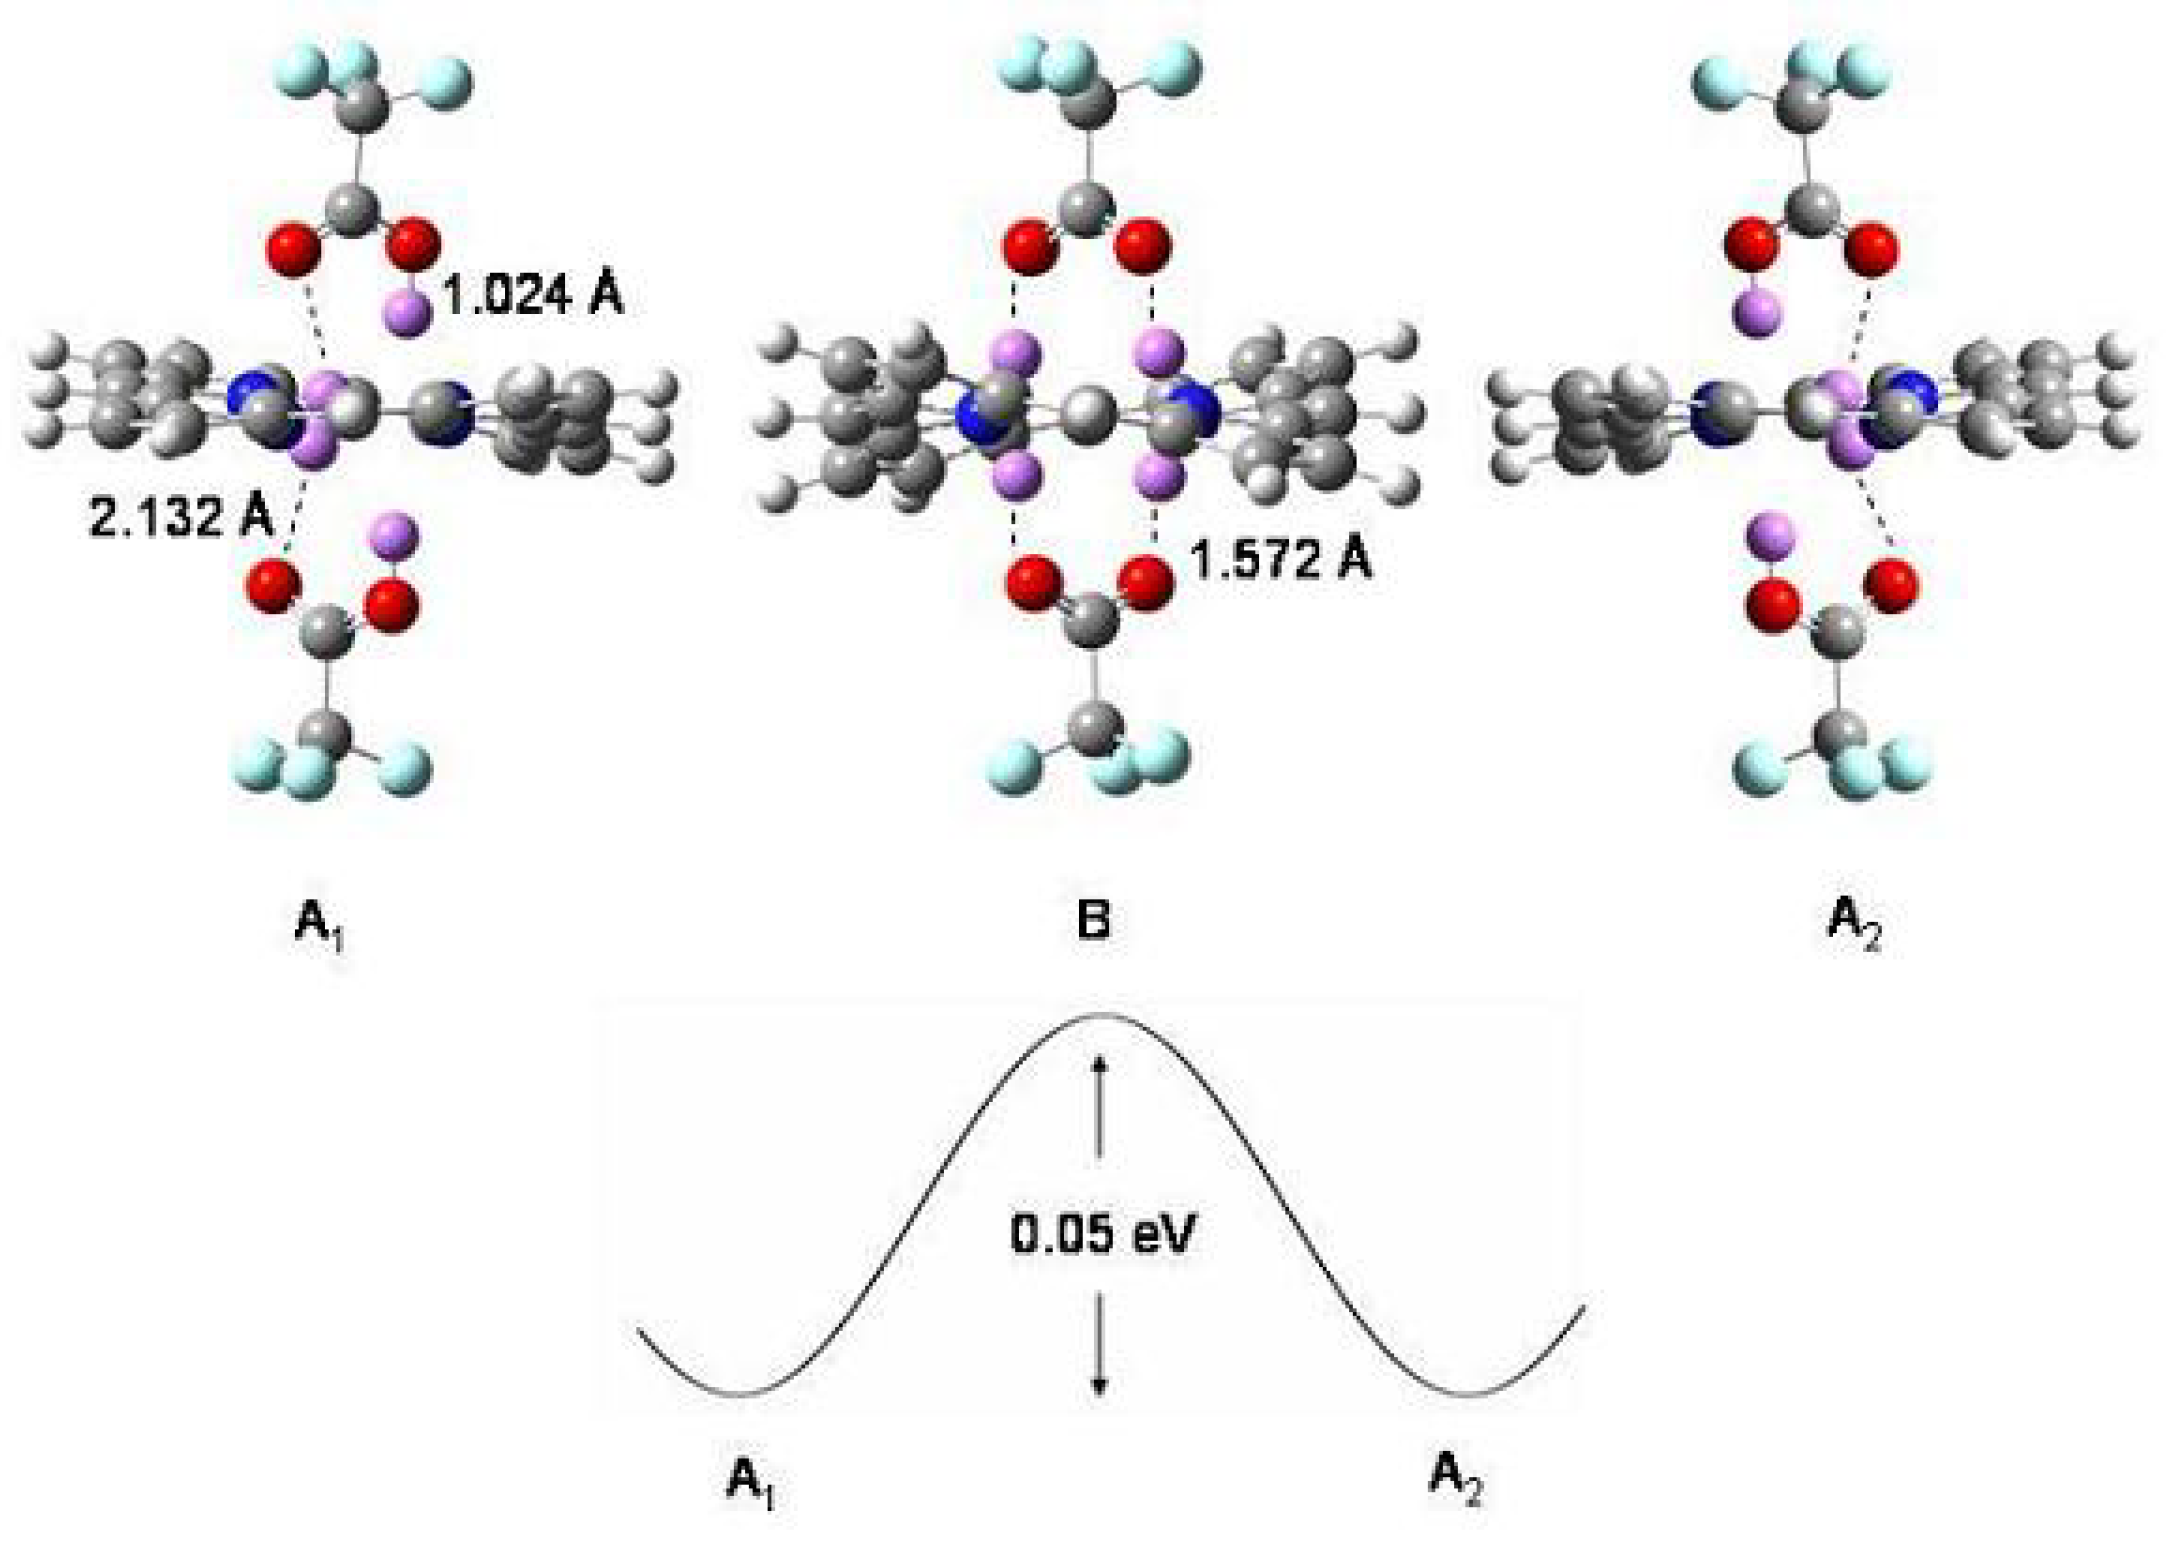
Figure 53.
The complex of diprotonated porphyrin with trifluoroacetic acid according to B3-LYP/cc-pVDZ calculations. A, A: (PH)(CFCOOH) tautomers. B: (PH)(CFCOO) transition structure. For the sake of clarity, the four central hydrogen atoms are evidentiated as violet balls for the three structures and their distances (Å) from the closest oxygen atoms are indicated. Bottom: schematic diagram of the potential energy responsible for interconversion of A and A structures through the transition structure B. The energy barrier is estimated to be 0.05 eV (≈ 1.1 kcal/mol).
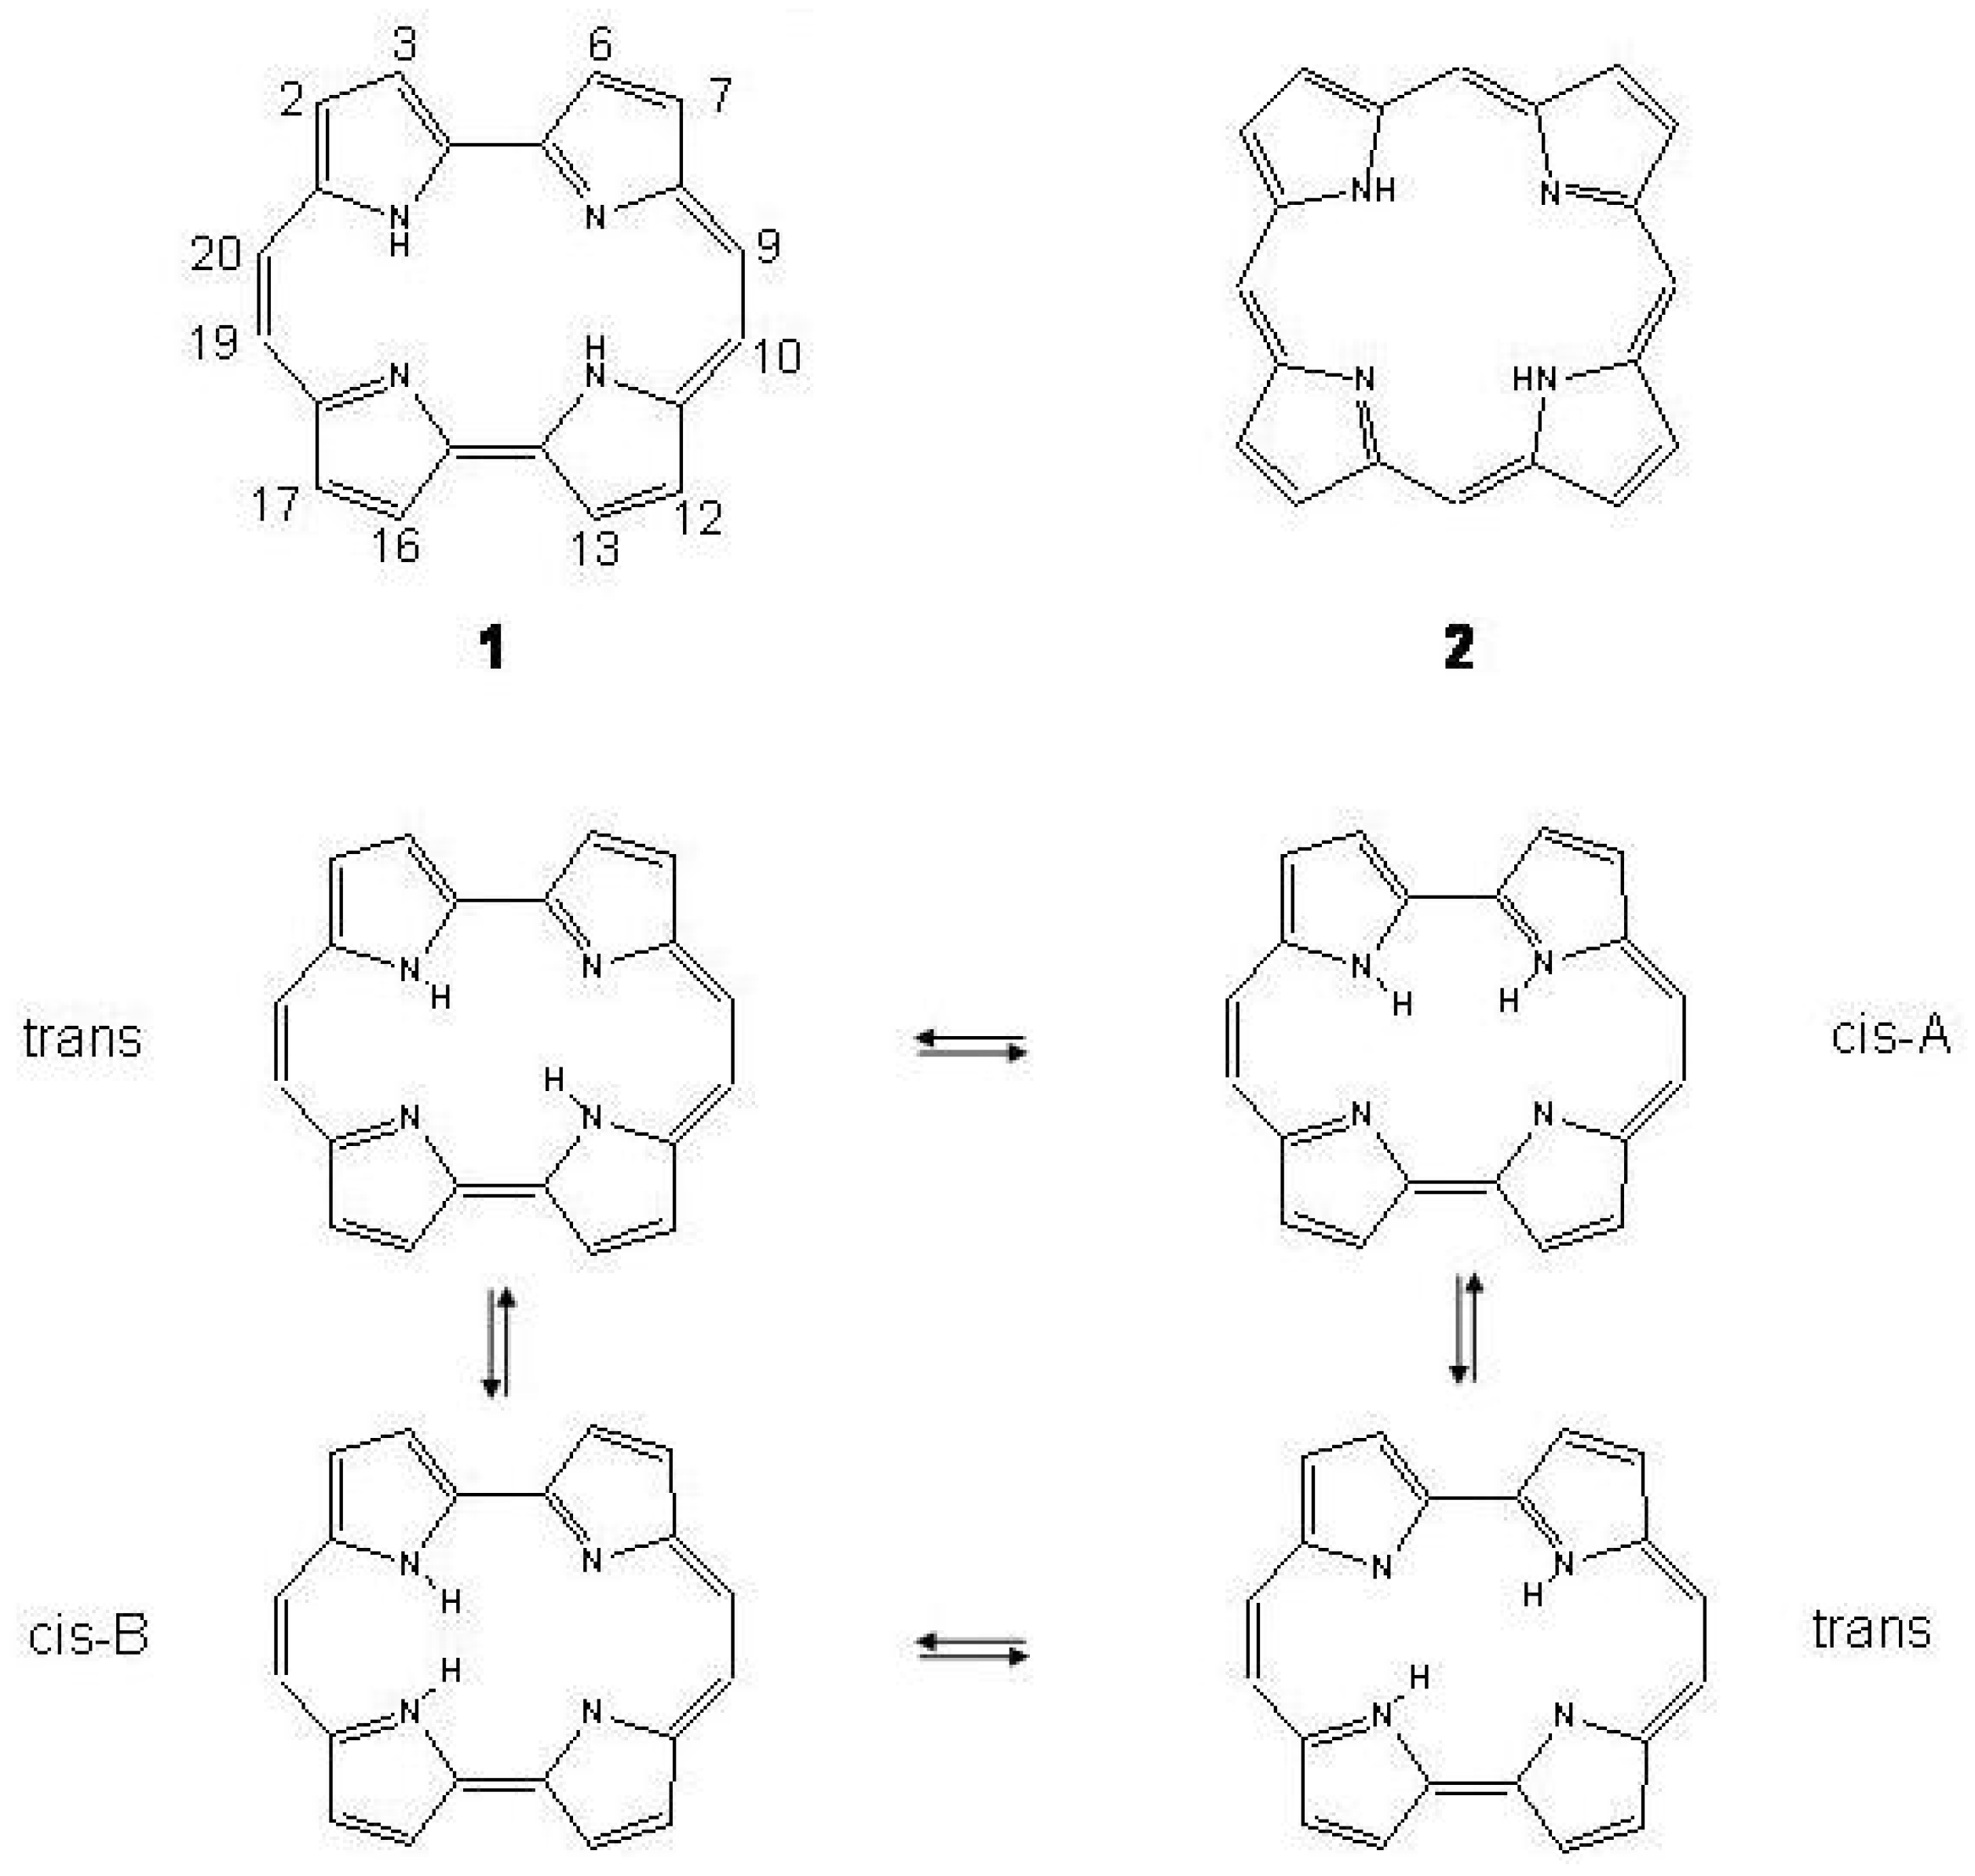
Figure 54.
Top: the structures of porphycene 1 and porphyrine 2. Bottom: the inner hydrogen migration in porphycene.
Figure 54.
Top: the structures of porphycene 1 and porphyrine 2. Bottom: the inner hydrogen migration in porphycene.
Figure 55.
Fluorescence (right) and fluorescence excitation (left) spectra of porphycene in poly(vinyl butyral) film at 20 K.
Figure 55.
Fluorescence (right) and fluorescence excitation (left) spectra of porphycene in poly(vinyl butyral) film at 20 K.
Table 1.
Valence bond (VB) and molecular orbital (MO) energies of cyclobutadiene and benzene [
38,
39]. Upper, VB theory: under
,
; energies of the Kekule’ structures at the most symmetrical geometries,
for cyclobutadiene and
for benzene; under
G; E
(0) ground state
energy after
,
mixing at the undistorted geometries,
and
, respectively,
E
(
)
energy change as a function of the displacement parameter
; under
; the same quantities for the excited state.
Q,
, coulomb and exchange integrals, both negative [
40]. Lower, MO theory: under E
,
energies of cyclobutadiene and benzene in the Hückel approximation; under
E
(
),
energy change as a function of the displacement parameter
; under
E
(
),
energy change as a function of the displacement parameter
.
,
resonance integral and slope at the symmetrical configuration;
k, force constant of the CC
bond.
| | | | | VB theory | | | |
|---|
| | ; | | G | | |
| | | | E(0) | E() | | E(0) | E() |
| CH | Q + J | | J | 3J | | –3J | –3J |
| CH | Q + J | | J | J | | –J | –J |
| | | | | MO theory | | | |
| | bond equalized → bond alternating configuration |
| | | E | | E() | E() | |
| CH | | 4 | | 4 | 2 | | |
| CH | | 8 | | 6 | 3 | | |
Table 2.
Summary of distortion energies
,
,
, quantum mechanical resonance energies [
, cyclobutadiene and benzene;
, distorted cyclobutadiene and distorted benzene;
, reference, cyclic butadiene and cyclic hexatriene], relaxation energy
and thermochemical resonance energy
(all values in kcal/mol, VBSCF/6-31G calculation [
17]).
| | | | | | | | | |
| CH | 7.0 | –10.4 | –3.4 | 22. | 8.3 | 17.9 | –57.0 | –70.0 |
| CH | 16.3 | –9.1 | 7.2 | 65. | 39.9 | 26.7 | | 20.4 |
Table 3.
Energies (kcal/mol) of the lowest excited states of square cyclobutadiene relative to that of 1.
| | SCF | GRVB | -CI | -CI | -CI |
| 57.1 | 55.2 | 53.2 | 49 | 50 |
| 52.0 | – | 50.2 | 74 | 83 |
| 0 | 0 | 0 | 0 | 0 |
| –4.4 | 12.9 | –4.4 | 6.4 | 10.2 |
| | MCSCF | MCSCF | MRCCSD(T) | MR-AQCC |
| 55.3 | 55.8 | 40.9 | 30.7 |
| 80.6 | 95.4 | 52.6 | 41.6 |
| 0 | 0 | 0 | 0 |
| 15.9 | 12.6 | 6.9 | 5.4 |
Table 4.
energy barrier (kcal/mol) for the interconversion process square rectangular (first two rows) and for the process square rhombic process (last row). Values in parentheses include the Zero Point Energy () correction.
Table 4.
energy barrier (kcal/mol) for the interconversion process square rectangular (first two rows) and for the process square rhombic process (last row). Values in parentheses include the Zero Point Energy () correction.
| | SCF/IEPA | GRVB | -CI | -CI | -CI |
| 7.3 | 4.8 | 8.7 | 8.3 | 12 |
| | GVB/CISD | MCSCF | MCSCF | MRCCSD | MR-AQCC |
| 9 | 6.2 | 4.8(3.2) | 6.6(4.0) | 8.3(5.8) |
| | MCSCF | MRCCSD | | | |
| 3.2(3.3) | 3.6(1.8) | | | |
Table 5.
Bondlengths (Å) and bond angles (degrees) of cyclobutadiene in the , (rectangular) and (rhombic) structures. Structural data indicated but not reported are determined by symmetry. Imaginary frequencies (cm) of the 1 () ground state, of the 1 () and 1 () (rhombic symmetry) excited singlet states.
| | ground state S | | |
| | 1B (D) | | 1A (rect. D) |
| C-C | | 1.452 | | 1.467 | | 1.447 | | | 1.553 | | 1.570 | | 1.562 | | 1.566 |
| C-C | | | | | | | | | 1.365 | | 1.366 | | 1.350 | | 1.343 |
| C-H | | 1.067 | | 1.104 | | 1.076 | | | 1.068 | | 1.097 | | 1.077 | | 1.074 |
| | 990i | | 803i | | 1579i | | | | | | | | | |
| | lowest singlet S | |
| | 1A (D) | | 1A (rh. D) |
| C-C | | 1.458 | | 1.457 | | 1.447 | | | | 1.450 | | | | 1.454 | |
| C-H | | 1.066 | | 1.101 | | 1.076 | | | | 1.073 | | | | 1.111 | |
| C-H | | | | | | | | | | 1.061 | | | | 1.094 | |
| CCC | | | | | | | | | | 85.8 | | | | 95.0 | |
| | 2125 | | 1783 | | | | | | | | | | | |
| | 9423i | | 1104i | | | | | | 459i | | | | 506i | |
| | | | | | | | | | | 247i | | | | 404i | |
| | lowest triplet T | | second excited singlet S |
| | 1A (D) | | 1B (D) |
| C-C | | 1.449 | | 1.456 | | 1.442 | | 1.439 | | 1.431 | | 1.447 | | 1.436 | |
| C-H | | 1.067 | | 1.102 | | 1.076 | | 1.073 | | 1.066 | | 1.101 | | 1.076 | |
Table 6.
Bondlengths (Å) and bond angles (degrees) of benzene in the , (quinoidal and antiquinoidal) and structures. Structural data indicated but not reported are determined by symmetry. Imaginary frequencies (cm) of the and triplet states. (kcal/mol) is the energy barrier between minima.
| | ground state | | |
| | exp | | calc |
| C-C | | 1.392 | | 1.398 | | 1.399 | | 1.397 | | 1.398 | | 1.388 | | 1.407 | | 1.386 | | 1.388 | | 1.389 |
| C-H | | | | 1.090 | | 1.085 | | 1.084 | | 1.086 | | 1.073 | | 1.092 | | 1.075 | | 1.073 | | 1.084 |
| | lowest triplet T | |
| | 1 () | | 1 (; ) |
| | | | | | | | | | A | | Q | | A | | Q |
| C-C | | 1.432 | | 1.440 | | | | | 1.404 | | 1.466 | | 1.403 | | 1.477 |
| C-C | | | | | | | | | 1.494 | | 1.370 | | 1.514 | | 1.366 |
| C-H | | 1.072 | | | | | | | 1.074 | | 1.071 | | | | |
| C-H | | | | | | | | | 1.072 | | 1.073 | | | | |
| | 924i | | | | | | | 1108 | | 1213 | | | | |
| | | | | | | | | | 369i | | 541 | | | | |
| | 0 | | 0 | | | | | -1.0 | | -1.4 | | -2.3 | | -2.3 |
| | lowest excited singlet | | second excited singlet |
| | exp | | calc | | | | |
| C-C | | 1.435 | 1.432 | | 1.449 | 1.416 | 1.428 | | 1.438 | 1.358/1.432 | 1.46 |
| C-C | | | | | | | | | | 1.469/1.321 | 1.37 |
| C-C | | | | | | | | | | | 1.45 |
| C-H | | 1.07 | 1.084 | | 1.082 | 1.071 | | | 1.079 | | |
| C-H | | | | | | | | | | | |
Table 7.
Lowest singlet and triplet excited states of benzene: experimental and band maxima (eV) and calculated transition energies (eV).
Table 7.
Lowest singlet and triplet excited states of benzene: experimental and band maxima (eV) and calculated transition energies (eV).
| | exp | | calc | |
| | 4.8 | | 5.0 | | 4.9 | | 5.25 | | 5.02 | | 6.32 | | 5.02 | |
| | 6.2 | | 7.64 | | 7.4 | | 6.60 | | | | 6.53 | | | |
| | 6.9 | | 8.34 | | 7.8 | | 7.47 | | | | 8.53 | | | |
| | 7.8 | | 8.33 | | 8.1 | | | | | | | | | |
| | 3.9 | | 3.83 | | 3.9 | | 4.06 | | 4.16 | | | | 4.18 | |
| | 4.85 | | 4.98 | | 4.9 | | 5.02 | | 4.83 | | | | 4.86 | |
| | 5.7 | | 7.0 | | 6.7 | | 6.02 | | 6.02 | | | | 5.69 | |
| | | | 7.28 | | 7.2 | | | | | | | | | |
Table 8.
Upper: bond lengths (Å) of pentalene (
and
equilibrium structures, numbering as in
Figure 16) and of 1,3,5-tri-
tert-butylpentalene (
equilibrium structure) in the ground state. Structural data indicated but not reported are determined by symmetry. Imaginary frequency
(cm
) of the
state.
(kcal/mol) is the energy barrier between minima of
symmetry. Lower: bond lengths (Å) of pentalene in the lowest excited states, from
to
. Imaginary frequency
(cm
) of the
state.
(kcal/mol) is the energy barrier between minima of
symmetry.
| | ground state |
|---|
| | | | | | |
| | | TS | calc | | exp | calc | exp |
| r | 1.404 | 1.422 | 1.352 | 1.369 | 1.355 | 1.360/1.357 | 1.354/1.358 | 1.34/1.41 |
| r | 1.426 | 1.414 | 1.500 | 1.504 | 1.497 | 1.478/1.500 | 1.504/1.506 | 1.54/1.50 |
| r | | | 1.357 | 1.369 | 1.356 | 1.351/1.358 | 1.360/1.361 | 1.32/1.28 |
| r | | | 1.472 | 1.482 | 1.474 | 1.496/1.465 | 1.485/1.470 | 1.46/1.52 |
| r | 1.490 | 1.413 | 1.468 | 1.468 | 1.461 | 1.460 | 1.465 | 1.43 |
| 2726i | | | | | | | |
| 9.7 | 6.6 | 0 | | 0 | | | |
| | excited states |
| | | | | | | | |
| | | | | | | |
| r | | 1.431 | | | 1.405 | | 1.400 | | 1.444 | | | 1.435 | |
| r | | 1.411 | | | 1.427 | | 1.482 | | 1.434 | | | 1.428 | |
| r | | | | | | | 1.387 | | | | | | |
| r | | | | | | | 1.435 | | | | | | |
| r | | 1.390 | | | 1.502 | | 1.479 | | 1.401 | | | 1.459 | |
| | | | | 1262i | | | | | | | | |
| | | | | 1.6 | | 0 | | | | | | |
Table 9.
Energy [
174] (kcal/mol) of the [10]annulene isomers of
Figure 19. DZd and TZ2P: double-
polarized and triple-
polarized basis sets. HF: uncorrelated Hartree/Fock, B3LYP and MP2: correlated density functional and Moller-Plesset, CCSD(T): coupled cluster calculation including singles, doubles and perturbatively connected triple excitations. (//) single-point energy calculation with the method indicated before the double slash at the optimized structures determined after the double slash.
| | | HF/DZd | | B3LYP/DZd | | MP2/DZd | | CCSD(T)/DZd | | CCSD(T)/DZd | | CCSD(T)/TZ2P | |
| | | | | | | | | //MP2/DZd | | | | //CCSD(T)/DZd | |
| C boat | | 1.84 | | 2.47 | | 7.12 | | 5.66 | | | | | |
| C azulene-like | | 8.13 | | -2.96 | | -1.14 | | 8.61 | | | | | |
| C heart | | 11.77 | | -9.11 | | -4.22 | | 5.99 | | 6.29 | | 4.24 | |
| C naphthalene-like | | 2.87 | | -2.89 | | 1.23 | | 2.04 | | 1.74 | | 1.40 | |
| C twist | | 0 | | 0 | | 0 | | 0 | | 0 | | 0 | |
Table 10.
Structural and spectral data characterizing 1,6-methano- (A) and 1,6-epoxy[10]annulene (B). Upper: ground state geometries (bondlengths, Å), including those of the 11,11-dicyano (C) and 11,11-dimethyl (D) derivatives of 1,6-methano[10]annulene. Center: geometries of the ground and of the lowest excited state of A and B (bondlengths, Å). Lower: vertical excitation energies (eV), oscillator strengths (f) and relative two-photon intensities (I) of the transitions to the lowest excited states of A.
| | ground state |
|---|
| | A | | B | | C | | D |
|---|
| | calc | exp | | calc | exp | | calc | exp | | calc | exp |
| C-C | | 1.410 | 1.402 | | | 1.400 | 1.39 | | | 1.478 | 1.474 | | | 1.426 | 1.459 |
| C-C | | 1.393 | 1.378 | | | 1.396 | 1.39 | | | 1.348 | 1.334 | | | 1.382 | 1.357 |
| C-C | | 1.426 | 1.417 | | | 1.416 | 1.39 | | | 1.455 | 1.439 | | | 1.427 | 1.432 |
| C-C | | 1.493 | 1.484 | | | | | | | 1.580 | 1.566 | | | 1.515 | 1.510 |
| C-O | | | | | | 1.392 | 1.43 | | | | | | | | |
| CC | | 2.284 | 2.235 | | | 2.214 | 2.22 | | | 1.558 | 1.542 | | | 2.167 | 1.827 |
| | A | | B |
| | | | | | | | |
| C-C | | 1.406 | | 1.422 | | | 1.391 | | 1.404 |
| C-C | | 1.379 | | 1.424 | | | 1.399 | | 1.417 |
| C-C | | 1.423 | | 1.432 | | | 1.417 | | 1.423 |
| C-C | | 1.487 | | 1.500 | | | | | |
| CC | | 2.244 | | 2.424 | | | 2.273 | | 2.365 |
| | A |
| | one-photon | | two-photon | | calc |
| | | | f | | | | I | | | | f | | I |
| | 3.44 | | 0.003 | | | 3.47 | | 0.08 | | | 3.33 | | 5.E-6 | | 0.337 |
| | 4.16 | | 0.107 | | | 4.09 | | | | | 4.39 | | 3.E-3 | | 1.E-3 |
| | 4.87 | | 1.04 | | | | | | | | 4.65 | | 1.64 | | 0.024 |
| | | | | | | 4.87 | | 1 | | | 4.89 | | 8.E-6 | | 1 |
Table 11.
Upper: ground state geometries (bondlengths, Å) of
s- and
-indacene and energy difference
(kcal/mol) between localized and delocalized structures of
Figure 28. Center: ground state geometries (bondlengths, Å) of
s-indacene (
I), 1,3,5,7-tetramethyl-
s-indacene (
TMI) and 1,3,5,7-tetra-
tert-butyl-
s-indacene (
TTBI). Lower: experimental ground state geometry of 1,3,5,7-tetra-
tert-butyl-
s-indacene and calculated geometries of the
and
states of
s-indacene. The atomic numbering is indicated in
Figure 28.
| | s-indacene | | -indacene |
| | MP2/6-31G | | B3LYP/6-31G | | MP2/6-31G |
| | | | | | | | | | 4a | | 4b | |
| C-C | | 1.404 | | 1.439 | | 1.406 | | 1.432 | | | C-C | 1.363 | | 1.466 | |
| C-C | | | | 1.378 | | | | 1.383 | | | C-C | 1.469 | | 1.364 | |
| C-C | | 1.429 | | 1.450 | | 1.423 | | 1.445 | | | C-C | 1.374 | | 1.462 | |
| C-C | | | | 1.397 | | | | 1.400 | | | C-C | 1.440 | | 1.367 | |
| C-C | | 1.397 | | 1.379 | | 1.399 | | 1.380 | | | C-C | 1.366 | | 1.449 | |
| C-C | | | | 1.420 | | | | 1.419 | | | C-C | 1.363 | | 1.439 | |
| C-C | | 1.437 | | 1.448 | | 1.448 | | 1.452 | | | | | | | |
| | 0.7 | | 0. | | 0.1 | | 0. | | | | 5.0 | | 7.5 | |
| | I | | TMI | | TTBI | | exp | |
| | B3LYP/6-31G | |
| C-C | | 1.413 | | 1.413 | | 1.414 | | 1.406/08 | |
| C-C | | 1.428 | | 1.437 | | 1.443 | | 1.438/34 | |
| C-C | | 1.402 | | 1.400 | | 1.402 | | 1.394/95 | |
| C-C | | 1.454 | | 1.454 | | 1.454 | | 1.442 | |
| | (TTBI, exp) | | | | |
| C-C | | 1.406 | | 1.418 | | 1.431 |
| C-C | | 1.408 | | 1.414 | | 1.424 |
| C-C | | 1.438 | | 1.445 | | 1.416 |
| C-C | | 1.434 | | 1.441 | | 1.409 |
| C-C | | 1.394 | | 1.413 | | 1.422 |
| C-C | | 1.395 | | 1.416 | | 1.430 |
| C-C | | 1.442 | | 1.449 | | 1.479 |
Table 12.
Structural data (bondlengths, Å) of
syn-1,6:8,13-bismethano[14]annulene (
6), 1,6:8,13-ethanediylidene[14]annulene (
8) and 1,6:8,13-propanediylidene[14]annulene (
9). Upper row: ground state B3LYP/cc-pVDZ results [
239]. Central and lower rows: geometries of the ground and of the lowest excited states (
8, central;
9, lower); MCSCF/CAS(10,10)/6-31G results [
241].
| | ground state |
| | 6 | | 8 | | 9 |
| | calc | exp | | calc | exp | | calc | exp |
| C-C | 1.421 | 1.412 | | 1.402 | 1.406 | | 1.415 | 1.413 |
| C-C | 1.391 | 1.370 | | 1.397 | 1.381 | | 1.391 | 1.387 |
| C-C | 1.428 | 1.407 | | 1.415 | 1.404 | | 1.425 | 1.414 |
| C-C | 1.406 | 1.393 | | 1.403 | 1.387 | | 1.404 | 1.395 |
| CC | 2.402 | 2.410 | | 2.514 | 2.469 | | 2.408 | 2.384 |
| C-C | 1.512 | 1.498 | | 1.518 | 1.524 | | 1.516 | 1.517 |
| C-C | 2.933 | 2.917 | | 1.548 | 1.570 | | 1.523 | 1.518 |
| CC | | | | | | | 2.444 | 2.434 |
| H⋯H | 1.686 | 1.780 | | | | | | |
| | 8 |
| | | | | | | |
| | calc | exp | | | | | |
| C-C | | 1.398 | 1.406 | | 1.410 | 1.384 | 1.403 | 1.417 |
| C-C | | 1.396 | 1.381 | | 1.408 | 1.424 | 1.402 | 1.388 |
| C-C | | 1.391 | 1.404 | | 1.383 | 1.373 | 1.400 | 1.408 |
| C-C | | 1.403 | 1.387 | | 1.414 | 1.410 | 1.408 | 1.414 |
| CC | | 2.508 | 2.469 | | 2.554 | 2.478 | 2.552 | 2.525 |
| C-C | | 1.514 | 1.524 | | 1.513 | 1.512 | 1.505 | 1.514 |
| C-C | | 1.547 | 1.570 | | 1.545 | 1.545 | 1.539 | 1.554 |
| | 9 |
| | | | | | | |
| | calc | exp | | | | | |
| C-C | 1.413 | 1.413 | | 1.420 | 1.392 | 1.423 | 1.418 |
| C-C | 1.388 | 1.387 | | 1.408 | 1.422 | 1.390 | 1.394 |
| C-C | 1.404 | 1.414 | | 1.388 | 1.379 | 1.411 | 1.411 |
| C-C | 1.404 | 1.395 | | 1.416 | 1.413 | 1.411 | 1.410 |
| CC | 2.408 | 2.384 | | 2.479 | 2.386 | 2.440 | 2.477 |
| C-C | 1.512 | 1.517 | | 1.516 | 1.511 | 1.513 | 1.512 |
| C-C | 1.520 | 1.518 | | 1.522 | 1.518 | 1.522 | 1.522 |
| CC | 2.443 | 2.434 | | 2.443 | 2.448 | 2.451 | 2.437 |
Table 13.
Transition energies and oscillator strengths (
E, eV;
f) of porphyrin to the lowest excited states,
unless otherwise specified. Exp: gas-phase [
304] and solution band maxima
E [
299] and
f values [
300]. Calculated transition energies under all other headings: DF/SCI results [
299] (reference system as in
Figure 33); TD/DFT, results [
298]; CASPT2 results [
297].


