
Output Effect Evaluation Based on Input Features in Neural Incremental Attribute Learning for Better Classification Performance


_Park.png)

Abstract
: Machine learning is a very important approach to pattern classification. This paper provides a better insight into Incremental Attribute Learning (IAL) with further analysis as to why it can exhibit better performance than conventional batch training. IAL is a novel supervised machine learning strategy, which gradually trains features in one or more chunks. Previous research showed that IAL can obtain lower classification error rates than a conventional batch training approach. Yet the reason for that is still not very clear. In this study, the feasibility of IAL is verified by mathematical approaches. Moreover, experimental results derived by IAL neural networks on benchmarks also confirm the mathematical validation.1. Introduction
Machine learning is a very useful technology for pattern classification and regression. It has been widely used and successfully applied in a number of different fields, and can bring very good performance and accurate results to us [1–4]. Neural Network (NN) is one of most popular machine learning technologies, which has been widely employed in many scenarios [5,6]. NN is often built according to some machine learning strategy, and Incremental Attribute Learning (IAL) is one of the newest machine learning strategies.
IAL is a “divide-and-conquer” machine learning strategy, which gradually trains input features in one or more size. Previous research has shown that IAL is an applicable approach for solving multidimensional problems in pattern classification integrated with some machine learning predictive algorithms such as Genetic Algorithm (GA) [7,8], NN [9,10], Support Vector Machine (SVM) [11], Particle Swarm Optimization (PSO) [12], Decision Tree (DT) [13]. The results of these previous studies also showed that IAL can exhibit better performance than conventional methods, where all input features are trained together in one batch.
Generally, there are two important factors which make IAL overcome conventional batch-training machine learning. One is the incremental training structure of IAL. For example, Incremental Learning in terms of Input Attributes (ILIA) [9] and Incremental Training with an Increasing input Dimension (ITID) [10] have been shown to be applicable for achieving better performance by neural network based IAL. The other factor is feature ordering, a unique preprocessing in IAL [14–18]. In comparison with the results derived by conventional batch training machine learning approaches, both the structure and the preprocessing of feature ordering in IAL can bring positive efforts on the improvement of classification accuracy. However, why the structure and the feature ordering can efficiently enhance classification performance and reduce error rates in IAL is a question which has still not been answered yet.
In this paper, as a frequently-used metric, Single Discriminability (SD) [14] is taken as an example for feature’s classification capacity evaluation. The structure of IAL neural networks and the feature ordering of IAL will be analyzed in detail to make it clear why the unique structure and the preprocessing are important to IAL, and how IAL is able to reduce the error rate in final classification results.
2. Neural IAL and Its Preprocessing
2.1. IAL Based on Neural Networks
IAL gradually imports features one by one. At present, based on some intelligent predictive methods like NN, new approaches and algorithms have been presented for IAL. For example, ITID was shown to be applicable for classification. It divides the whole input space into several sub spaces, each of which corresponds to an input feature. Instead of learning input features altogether as an input vector in a training instance, ITID learns input features one after another through their corresponding sub-networks while the structure of NN gradually grows with an increasing input dimension based on Incremental Learning in terms of Input Attributes (ILIA) [9]. During training, information obtained by a new sub-network is merged together with the information obtained by the old network. Such architecture is based on ILIA1. After training, if the outputs of NN are collapsed with an additional network sitting on the top where links to the collapsed output units and all the input units are built to collect more information from the inputs, this results in ILIA2 as shown in Figure 1. Finally, a pruning technique is adopted to find out the appropriate network architecture. Previous experiments have shown that, with less internal interference among input features, ITID achieves higher generalization accuracy than conventional batch training methods [10].
2.2. Feature Ordering and Single Discriminability
Many previous studies have shown that preprocessing, like feature selection, feature ordering and feature extraction, usually plays a very important role in the final performance [19–21]. Feature ordering is naturally treated as an independent preprocessing stage in IAL [14], because features should be imported into an IAL predictive system one by one. Thus, it is necessary to decide which feature should be trained early and which one should be put in a later place. The criterion for feature sorting usually depends on a metric, which is a measurement for feature’s discrimination ability.
Feature discrimination ability is an expected index metric of each single feature’s capacity for final classification rates in pattern classification. It can be used as a predictive tool to evaluate the final classification performance. There are many feature discrimination ability estimation approaches for feature ordering [14–18,22]. Usually, feature discrimination ability can be derived based on each single feature’s contribution or some statistical metrics. In previous studies, SD [14] was used as a metric for feature ordering. However, why it is applicable for feature’s discrimination ability evaluation was unknown until this study. In the next section, it will be mathematically analyzed. Here is the definition of SD.
Definition 1. Single Discriminability (SD) refers to the discriminating capacity of one input feature fi in distinguishing all output features ω1, ω2, …, ωm, where fi is the i-th feature in the input set, m is the number of output features. Let f = [f1, f2, …, fn] the pool of input, and Ω = [ω1, ω2, …, ωm] the pool of output, where fi (1 ≤ i ≤ n) is the i-th input features in Ω, and μj (1 ≤ j ≤ m) is the j-th output feature in Ω, SD can be calculated by
3. Classification Estimation in IAL
As a simple and efficient classifier, linear classification methods can be employed to estimate each feature’s discrimination ability in IAL preprocessing. Although the result is not very accurate, the estimation to predict feature’s single discrimination ability is still effective and applicable more or less. Usually, classification can be treated as a process for searching a hyperplane or set of hyperplanes in a high- or finite-dimensional space. Intuitively, a good separation achieved by a hyperplane should have the largest distance to the nearest training data point of any class (so-called functional margin), since in general the larger the margin the lower the generalization error of the classifier. In supervised learning, datasets are usually divided into training dataset and testing dataset. Assuming a dataset with n features, f = {f1, f2, …, fn} is the data vector containing all input data while is the training data, which is a subset of f. The computing process of SD should be based on ftrn. In IAL, features are incrementally imported into the predictive system; thus, the feature space starts from one dimension, and then grows to more dimensions, step by step. When ftrn is introduced into the predictive system for the first time, only one feature is introduced. Each classification hyperplane is a single point. Along with the growing of feature numbers, the dimensionality of hyperplanes also increases. When all n features are imported, the hyperplanes will have n − 1 dimensions.
Assuming the feature ordering in IAL for ftrn is , which indicates that when another new feature is introduced into the system, SD of the new one should be smaller than those of previous features. Namely,
In another aspect, because the classification work is based on ITID neural networks, SD(f1, f2), the SD of the integration of f1 and f2 is
Based on Equation (5), if SD(f1) value refers to the real classification ability of each single feature, then the classification performance evaluation is SD(f1,⋯,fn) for conventional batch-training method and, SD(f1,⋯,fn)IAL for IAL.
Theorem 1. In IAL, for classification with neural networks based on ILIA and ITID, ∀ f ={f1,⋯,fn}, if SD(f1) ≥ SD(f2) ≥ ⋯≥ SD(fn), then
(1) SD(f1,⋯,fn)IAL≥SD(f1,⋯,fn), conditionally;
(2) SD(f1,⋯,fn)IAL≧SD(fn)
The proof of Theorem 1 is in the Appendix. This theorem indicates that IAL usually conditionally performs better than conventional batch-training methods in classification, if features are imported into system according to the feature ordering sorted by their discrimination ability in descending order. Anyway, SD is only a metric with an expected value of Classification performance derived by features. It is not the real classification results that are finally obtained. Moreover, because only training data are employed in the feature ordering calculation, SD results always have a bias when the testing data are imported in the later steps.
4. Benchmarks
4.1. Experiments
In this study, eight classification benchmarks from UCI Machine Learning Repository are employed to verify that SD is feasible to evaluate each feature’s classification capacity for IAL final classification performance. They are Diabetes, Cancer, Glass, Thyroid, Ionosphere, Musk1, Sonar and Semeion. In these experiments, all the patterns were randomly divided into three groups: training set (50%), validation set (25%) and testing set (25%), and SD is employed for feature discrimination ability evaluation. After evaluation, all the features are sorted according to their SD value. Neural networks with ITID structure are employed for classification using datasets formatted according to SD feature orderings which have been shown in Table 1. Their ILIA1 results derived in last feature importing step and final classification results (ILIA2 results) are compared with those derived by conventional batch-training approaches in Table 2. The final classification error reduction and the Correlation Coefficient between SD and Step Error Rate are also demonstrated in this table.
4.2. Result Analysis
It is obvious that all the final results derived by ITID (SD-ILIA2) are better than those obtained by conventional batch training according to the results shown in Table 2. They obtained lower final classification error rates by using IAL with the feature orderings based on SD. Moreover, the Correlation Coefficient derived by SD values and error rates obtained in each ILIA1 step show that there is a strong positive correlation between SD and classification performance. Therefore, in IAL, SD estimation for feature ordering has more probability to exhibit better performance when neural networks based on ITID is employed for classification.
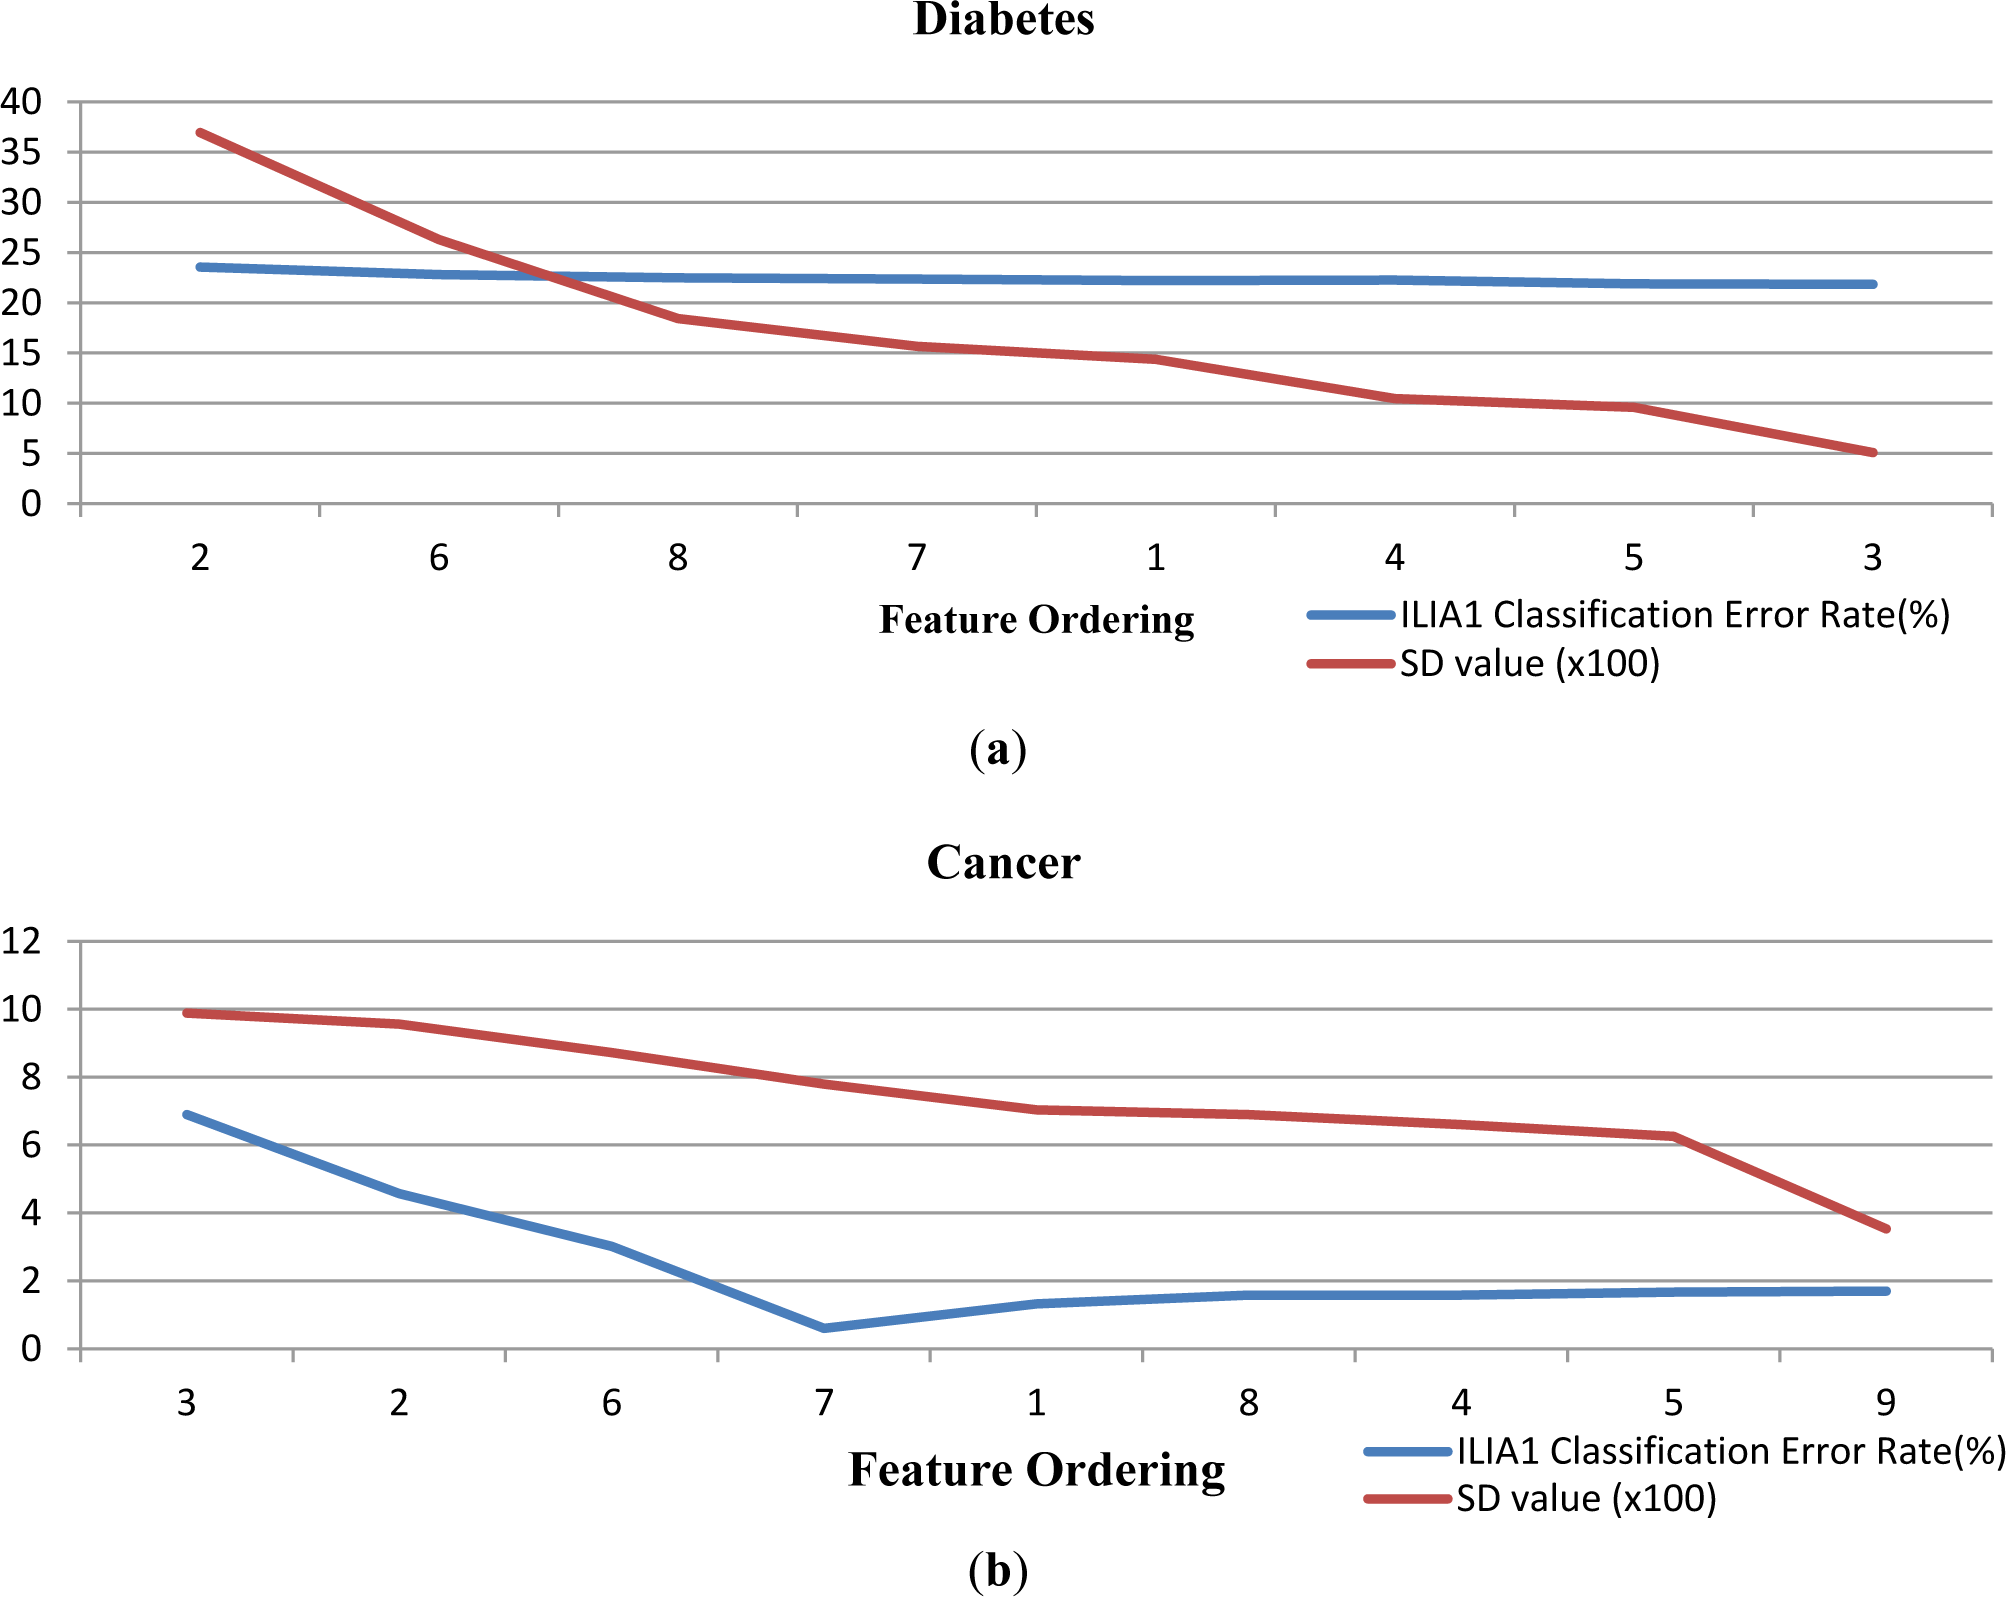
Figure 2 demonstrates the correlation between SD value and ILIA1 classification error rates obtained in each feature importing step. It also confirms that there is a strong positive correlation between SD values and classification error rates. According to Figure 2, it is manifest that both feature ordering SD values and ILIA1 classification error rates have the same reductive trend during the IAL classification process in general. This phenomenon coincides with the Correlation Coefficient values shown in Table 1, which also means that SD value is an applicable metric for final classification performance estimation.
However, in Figure 2, ILIA1 classification result values fluctuate in almost all datasets, although the general trend is reductive. That means that some features trained in later steps have more contribution than some of those trained in earlier steps. This is influenced by sampling. Actually, there are no effective approaches existing to cope with the difference between sampling and population. Another way to tackle such a fluctuation of results is feature selection. If feature selection is used, better results can be obtained. Taking Cancer as an example, if feature selection can be employed in this datasets, only features 3, 2, 6, and 7 should be employed. Other features will be discarded. Thus, the final classification can be easily improved. This is an important issue which will be discussed and solved in the future.
5. Conclusions
This paper aims to analyze why IAL can outperform conventional batch training approaches and emphasize that SD is a feasible metric for feature ordering which is a preprocessing of IAL. In this study, the feasibility of IAL is verified by using mathematical proof. According to the mathematical validation and benchmarks, if features can be sorted according to their SD values, and imported into the IAL system based on this feature ordering, it can usually obtain lower classification error rates than conventional batch training approaches. Thus, feature ordering is very important to IAL, which depends on the evaluation of each feature’s capacity to final classification performance. Moreover, based on some conditions of neural networks weights, IAL is more applicable than conventional batch training approaches for obtaining a lower error rate in classification.
In general, IAL is a novel machine learning approach which gradually trains input attributes in one or more sizes. Feature ordering in training is a unique preprocessing step in IAL pattern recognition. It also plays a very important role in result improvement. Reasons why IAL can often obtain lower classification error rates in final results than conventional batch training approaches is clear according to this study. Feature Ordering based on SD can be employed as a preprocessing in Neural IAL classification for lower error rates.
Acknowledgments
This research is supported by National Natural Science Foundation of China under Grant 61070085 and Jiangsu Provincial Science and Technology under Grant No. BK20131182.
Appendix
The proof of Theorem 1:
Proof. When f1 is introduced in IAL, namely n = 1,
In the next step, based on ITID, when f2 is introduced, namely n = 2, according to Equation (3), the estimation of classification effects is
According to Equations (2) and (A3), because
Moreover, according to Equation (3), which is
Then,
According to Equation (A5), for a {f1, f2} two-dimensional input classification, so long as we ensure that is always greater than w2, IAL classification performance is evaluated to be better than that derived by the conventional batch-training approach. When n = 3, namely the third feature is introduced for IAL,
Assuming that when n = k − 1,
According to Equations (4) and (A6),
Therefore, in IAL, ∀f={f1,⋯,fn}, if SD(f1)≥ SD(f2)≥ ⋯≥SD(fn), then
(1) SD(f1,⋯,fn)IAL ≥ SD(f1,⋯,fn), if w1 – w1′ ≥ 0,⋯, wn–2 – wn–2′ ≥ 0, and wn–wn′ ≤ 0;
(2) SD(f1,⋯,fn)IAL ≥ SD(fn).□
Author Contributions
Ting Wang wrote this manuscript; Sheng-Uei Guan, Jong Hyuk Park and Ka Lok Man and Hui-Huang Hsu contributed to the writing, direction and content and also revised the manuscript.
Conflicts of Interest
The authors declare no conflict of interest.
References
- Kim, J.S.; Byun, J.; Jeong, H.; Cloud, A.E.H.S. Advanced learning system using user preferences. J. Converg 2013, 4, 31–36. [Google Scholar]
- Mirzaei, O.; Akbarzadeh-T, M.-R. A Novel Learning Algorithm based on a Multi-Agent Structure for Solving Multi-Mode Resource-Constrained Project Scheduling Problem. J. Converg 2013, 4, 47–52. [Google Scholar]
- Ghimire, D.; Lee, J. Extreme Learning Machine Ensemble Using Bagging for Facial Expression Recognition. J. Inf. Process. Syst 2014, 10, 443–458. [Google Scholar]
- Nishanth, K.J.; Ravi, V. A. Computational Intelligence Based Online Data Imputation Method: An Application For Banking. J. Inf. Process. Syst 2013, 9, 633–650. [Google Scholar]
- Gopalakrishnan, A. A subjective job scheduler based on a backpropagation neural network. Hum.-Centric Comput. Inf. Sci 2013, 3. [Google Scholar] [CrossRef]
- Malkawi, M.; Murad, O. Artificial neuro fuzzy logic system for detecting human emotions. Hum.-Centric Comput. Inf. Sci 2013, 3. [Google Scholar] [CrossRef]
- Guan, S.U.; Zhu, F.M. An incremental approach to genetic-algorithms-based classification. IEEE Trans. Syst. Man Cybern. Part B Cybern 2005, 35, 227–239. [Google Scholar]
- Zhu, F.; Guan, S.-U. Ordered incremental training with genetic algorithms. Int. J. Intell. Syst 2004, 19, 1239–1256. [Google Scholar]
- Guan, S.-U.; Li, S. Incremental learning with respect to new incoming input attributes. Neural Process. Lett 2001, 14, 241–260. [Google Scholar]
- Guan, S.-U.; Liu, J. Incremental neural network training with an increasing input dimension. Int. J. Intell. Syst 2004, 13, 45–69. [Google Scholar]
- Liu, X.; Zhang, G.; Zhan, Y.; Zhu, E. An incremental feature learning algorithm based on least square support vector machine. Proceedings of the 2nd International Frontiers in Algorithmics Workshop, FAW 2008, Changsha, China, 19–21 June 2008; Volume 5059 LNCS. pp. 330–338.
- Bai, W.; Cheng, S.; Tadjouddine, E.M.; Guan, S.-U. Incremental attribute based particle swarm optimization. Proceedings of the 2012 8th International Conference on Natural Computation, ICNC 2012, Chongqing, China, 29–31 May 2012; pp. 669–674.
- Chao, S.; Wong, F. An incremental decision tree learning methodology regarding attributes in medical data mining. Proceedings of the 2009 International Conference on Machine Learning and Cybernetics, Baoding, China, 12–15 July 2009; 3, pp. 1694–1699.
- Wang, T.; Guan, S.-U.; Liu, F. Feature discriminability for pattern classification based on neural incremental attribute learning. Foundations of Intelligent Systems, Proceedings of the Sixth International Conference on Intelligent Systems and Knowledge Engineering, Shanghai, China, 15–17 December 2011; ISKE2011. Springer Verlag: Heidelberg, Germany, 2011; 122, pp. 275–280. [Google Scholar]
- Wang, T.; Guan, S.-U.; Liu, F. Entropic feature discrimination ability for pattern classification based on neural IAL. Proceedings of the 9th International Symposium on Neural Networks, ISNN 2012, Shenyang, China, 11–14 July 2012; Volume 7368 LNCS. pp. 30–37.
- Wang, T.; Guan, S.-U.; Liu, F. Correlation-based Feature Ordering for Classification based on Neural Incremental Attribute Learning. Int. J. Mach. Learn. Comput 2012, 2, 807–811. [Google Scholar]
- Wang, T.; Guan, S.-U.; Ting, T.O.; Man, K.L.; Liu, F. Evolving linear discriminant in a continuously growing dimensional space for incremental attribute learning. Proceedings of the 9th IFIP International Conference on Network and Parallel Computing, NPC 2012, Gwangju, Korea, 6–8 September 2012; Volume 7513 LNCS. pp. 482–491.
- Wang, T.; Wang, Y. Pattern classification with ordered features using mRMR and neural networks. Proceedings of the 2010 International Conference on Information, Networking and Automation, ICINA 2010, Kunming, China, 17–19 October 2010; 2, pp. V2128–V2131.
- James, A.; Mathews, B.; Sugathan, S.; Raveendran, D. Discriminative histogram taxonomy features for snake species identification. Hum.-Centric Comput. Inf. Sci 2014, 4, 3. [Google Scholar] [CrossRef]
- Uddin, J.; Islam, R.; Kim, J.-M. Texture Feature Extraction Techniques for Fault Diagnosis of Induction Motors. J. Converg 2014, 5, 15–20. [Google Scholar]
- Namsrai, E.; Munkhdalai, T.; Li, M.; Shin, J.-H.; Namsrai, O.-E.; Ryu, K.H. A Feature Selection-based Ensemble Method for Arrhythmia Classification. J. Inf. Process. Syst 2013, 9, 31–44. [Google Scholar]
- Wang, T.; Guan, S.-U. Feature Ordering for Neural Incremental Attribute Learning based on Fisher’s Linear Discriminant. Proceedings of the 5th International Conference on Intelligent Human-Machine Systems and Cybernetics, IHMSC 2013; 2, pp. 507–510.


| Dataset | SD Feature Ordering |
|---|---|
| Diabetes | 2-6-8-7-1-4-5-3 |
| Cancer | 3-2-6-7-1-8-4-5-9 |
| Glass | 3-8-4-2-6-5-9-1-7 |
| Thyroid | 21-19-17-18-3-7-6-16-13-20-10-8-2-4-5-1-11-12-14-15-9 |
| Ionosphere | 1-5-3-7-23-15-29-9-13-21-31-25-11-8-17-16-19-33-4-22-6-27-10-20-12-28-26-24-30-18-32-14-34-2 |
| Sonar | 1-54-2-15-21-14-4-16-20-59-36-3-49-58-52-53-33-11-5-32-55-51-22-19-48-56-9-17-34-31-60-37-13-45-35-8-12-46-47-18-10-6-29-7-50-28-40-42-23-27-57-30-26-43-24-25-44-38-39-41 |
| Musk1 | 1-165-66-116-129-37-94-132-164-140-22-97-5-141-82-43-63-83-26-13-86-56-51-52-124-133-7-144-127-108-53-9-48-21-143-118-77-119-98-134-10-24-139-81-50-95-114-34-25-18-57-100-112-117-16-113-49-54-122-121-157-23-17-55-158-166-73-128-60-12-30-19-145-147-79-28-38-142-42-46-137-96-135-74-47-115-154-160-123-162-20-85-8-40-11-27-156-146-45-58-120-150-61-155-130-110-62-41-89-65-90-101-159-107-14-102-78-163-69-88-71-64-80-106-72-6-29-87-39-76-2-111-131-44-105-149-126-35-75-99-104-125-136-36-109-91-161-3-103-151-59-148-152-84-93-4-67-31-153-68-32-33-138-92-15-70 |
| Semeion | 112-162-96-128-146-178-111-79-95-161-145-1-130-177-80-194-63-127-82-98-129-113-163-66-114-47-9-64-62-93-193-8-77-81-179-78-10-231-2-230-229-11-97-143-3-17-83-195-232-65-144-147-99-50-7-228-105-76-92-191-233-67-210-4-84-234-152-103-175-46-51-108-48-91-159-174-109-94-61-18-107-192-136-167-104-75-6-151-5-245-12-135-246-207-121-150-106-168-16-188-153-166-120-100-119-68-183-189-227-102-90-164-149-247-211-255-115-182-60-31-101-256-235-137-89-165-190-131-209-59-208-180-35-36-158-45-122-134-184-254-37-238-110-13-69-19-52-123-187-226-118-124-240-74-173-49-237-148-248-169-138-236-85-15-32-181-34-154-206-23-22-212-160-53-222-244-176-157-204-30-21-142-205-155-172-58-14-196-125-33-249-139-88-253-20-239-171-141-170-199-185-140-223-126-38-225-156-186-221-54-198-24-203-70-73-116-86-55-220-44-87-197-117-41-133-71-57-56-224-25-250-243-241-213-252-39-40-132-251-242-200-219-26-43-42-27-218-29-217-216-72-202-28-201-215-214 |
| Dataset | ITID (SD-ILIA1) Classification Error Rate (%) | ITID (SD-ILIA2) Final Classification Error Rate (%) | Batch-Training Classification Error Rate (%) | Final Classification Error Reduction (%) | Correlation Coefficient btw SD and Step Error Rate |
|---|---|---|---|---|---|
| Diabetes | 21.84896 | 22.39583 | 23.93229 | 6.42 | 0.98135 |
| Cancer | 1.69541 | 1.72414 | 1.86782 | 7.69 | 0.68054 |
| Glass | 34.81133 | 28.96228 | 41.22641 | 29.75 | 0.84795 |
| Thyroid | 1.92778 | 1.52500 | 1.86389 | 18.18 | 0.95581 |
| Ionosphere | 4.54545 | 5.79546 | 9.09091 | 36.25 | 0.63419 |
| Sonar | 36.73077 | 34.42308 | 38.94231 | 11.60 | 0.68819 |
| Musk1 | 34.41176 | 23.27730 | 24.11764 | 3.48 | 0.66361 |
| Semeion | 18.85678 | 12.96483 | 13.32915 | 2.73 | 0.93497 |
© 2015 by the authors; licensee MDPI, Basel, Switzerland This article is an open access article distributed under the terms and conditions of the Creative Commons Attribution license (http://creativecommons.org/licenses/by/4.0/).
Share and Cite
Wang, T.; Guan, S.-U.; Man, K.L.; Park, J.H.; Hsu, H.-H. Output Effect Evaluation Based on Input Features in Neural Incremental Attribute Learning for Better Classification Performance. Symmetry 2015, 7, 53-66. https://doi.org/10.3390/sym7010053
Wang T, Guan S-U, Man KL, Park JH, Hsu H-H. Output Effect Evaluation Based on Input Features in Neural Incremental Attribute Learning for Better Classification Performance. Symmetry. 2015; 7(1):53-66. https://doi.org/10.3390/sym7010053
Chicago/Turabian StyleWang, Ting, Sheng-Uei Guan, Ka Lok Man, Jong Hyuk Park, and Hui-Huang Hsu. 2015. "Output Effect Evaluation Based on Input Features in Neural Incremental Attribute Learning for Better Classification Performance" Symmetry 7, no. 1: 53-66. https://doi.org/10.3390/sym7010053
APA StyleWang, T., Guan, S.-U., Man, K. L., Park, J. H., & Hsu, H.-H. (2015). Output Effect Evaluation Based on Input Features in Neural Incremental Attribute Learning for Better Classification Performance. Symmetry, 7(1), 53-66. https://doi.org/10.3390/sym7010053