Abstract
There is much uncertainty and fuzziness in product quality attributes or quality parameters of a manufacturing process, so the traditional quality control chart can be difficult to apply. This paper proposes a fuzzy control chart. The plotted data was obtained by transforming expert scores into fuzzy numbers. Two types of nonconformity judgment rules—necessity and possibility measurement rules—are proposed. Through graphical analysis, the nonconformity judging method (i.e., assessing directly based on the shape feature of a fuzzy control chart) is proposed. For four different widely used membership functions, control levels were analyzed and compared by observing gaps between the upper and lower control limits. The result of the case study validates the feasibility and reliability of the proposed approach.
1. Introduction
International quality management expert Dr. Juran pointed out that, for users, quality is the fitness for use, and not conformance to specification. End users rarely know what the specifications are—they evaluate the product mostly based on the applicability and the durability of its applicability. From the quality viewpoint of fitness for use, the conformance to specifications is downplayed and the users’ evaluation is strengthened. Due to the emphasis on the user’s feelings and psychological factors, there are many fuzzy attributes of quality from the fitness-for-use viewpoint. As a result, there are not only two distinct judgments (applicative or inapplicable) when evaluating the quality from a fitness point of view. In this sense, considering the fuzzy property of fitness-for-use quality is more practical.
As one of the main tools of SPC (statistical process control), the control chart is widely used for monitoring the state of a process. However, for the aforementioned fitness quality, the conventional continuous control chart or attributes control charts cannot be applied directly.
In recent years, many researchers have applied fuzzy set theory to solve the problems that arise during the construction of uncertain quality control charts. Gülbay and Kahraman put forward a direct fuzzy approach in [1,2,3]. They represented the linguistic variables and control limits of sample quality evaluation with a fuzzy set, without any defuzzification operation, and judged the process control state by the degree of overlap of α-cut set of sample fuzzy set and the control limits’ fuzzy set. In their approach, the control level can be adjusted by the parameter α. Taleb and Sorooshian used fuzzy set to depict linguistic data, defuzzified the fuzzy set to crisp values by use of the weighted average method, and then built the control chart in [4,5]. By describing the magnitude of the process shift and the occurrence rate of an assignable cause as fuzzy numbers, the fuzziness was modeled using both minimax and maximin approaches, and a control chart suitable for processes with fuzzy parameters was presented by Morabi et al. in [6]. Grzegorzewski et al. [7] proposed a fuzzy control chart based on a necessity coefficient. Hsieh et al. constructed a c-chart of wafer defects in an integrated circuit manufacturing process by using fuzzy theory in [8]. Tannock [9] proposed an approach to construct a fuzzy individual control chart.
Some indirect approaches were also proposed to build different types of control charts, for example, Shu et al. [10] constructed fuzzy and R control charts based on the fuzzy dominance between the fuzzy averages and variances, and Gildeh et al. [11] used Dp,q-distance between fuzzy numbers to calculate their variance, covariance, and autocorrelation coefficient, and then used the autocorrelation coefficient to modify the limits of the control chart. Zarandi et al. [12] constructed a fuzzy control chart for different process shifts by adjusting the membership function parameters. In order to detect small shifts represented by fuzzy numbers, fuzzy exponentially weighted moving average (EWMA) control charts for univariate variable was developed by Sentürk et al. in [13]. Faraz et al. [14] constructed a fuzzy control chart to treat two uncertainties of fuzziness and randomness in data.
Product quality is often measured by various characteristics that are generally correlated. Multivariate control charts are necessary for quality control in such situations. Attribute quality characteristics are sometimes defined by linguistic variables, or product units are classified into several categories with linguistic forms. Fernandez et al. developed a method to control these fuzzy quality evaluations with fuzzy multivariate control charts in [15]. In order to simultaneously monitor the quality characteristics of a product or process measured by linguistic or fuzzy data, Ghobadi et al. [16] developed a fuzzy multivariate cumulative sum (F-MCUSUM) control chart by means of fuzzy set theory. In [17], Alipour et al. combined multivariate statistical quality control with fuzzy set theory to develop a fuzzy multivariate exponentially weighted moving average (F-MEWMA) control chart.
The aforementioned literatures have provided good ideas to deal with the fitness quality attributes. However, their common feature is that they constructed fuzzy control charts by fuzzy operation and defuzzification based on fuzzy set membership functions given in advance. When there is some deviation of a priori information, the control chart based on such a priori information can produce distorted signals, and the application effect can be discounted greatly. Literature that describes the construction of the fuzzy membership functions by use of rating scores, and subsequent creation of a corresponding fuzzy-number-based control chart, is still rare.
This paper proposes a method to build a control chart based on fuzzy score number, and describes the design of nonconformity judging criteria and analysis of the type selection of fuzzy numbers. The rest of this paper is organized as follows. Section 2 analyzes the data acquisition and transformation method. Possibility and necessity rules for nonconformity judgment are presented in Section 3. The basic form of a control chart based on fuzzy score number is described in Section 4, and an application case study is given in Section 5. Section 6 quantitatively analyzes the influence of different types of fuzzy numbers to the control chart. Section 7 ends the paper with a summary and conclusions.
2. The Plotted Data of a Control Chart Based on Fuzzy Number
Fuzzy number-based control chart has a similar working principle of Shewhart control chart. It plots the fuzzy number data of sample mean, and takes fuzzy number data of process mean to construct the control limits, including central line and upper and lower limit. The state of the control chart is judged according the relationship between the fuzzy number characteristic value of sample mean and control limits.
In order to acquire the process information used to construct a fuzzy control chart, this paper adopted sample mean to evaluate the process mean when the process was in steady state. Suppose a triangular fuzzy number sample, whose size is , , ,…,, and the fuzzy number estimator of process mean is as follows:
The parameters of process fuzzy number take the mean of corresponding parameters of sample fuzzy number (i.e., ():
After determining the fuzzy number of process mean, plotted data of the control chart is obtained by transforming the expert score of sample evaluation into a fuzzy number.
3. Control Limits of a Fuzzy Number-Based Control Chart and Its Nonconformity Judgment
3.1. Possibility and Necessity Measures
A fuzzy score number-based control chart indicates the status of a process according to the matching degree between the fuzzy number of sample mean and the fuzzy number of process mean. A degree of matching higher than a predefined value between the two means indicates that the process is in a better control state. This is on the basis of two measures of fuzzy events: possibility (Pos) and necessity (Nec) measures,.
Suppose fuzzy set A, B∈F(X), then we have the following definition (as mentioned by Jamison et al. in [18] and Zadeh in [19]):
The above two formulas will be called possibility measure and necessity measure of fuzzy set B under the given fuzzy set A, respectively, where x∈A, B, and and are the membership functions of fuzzy sets A and B, respectively. The former is an optimistic estimation of the possibility of fuzzy events, and the latter is a conservative estimation of the possibility of fuzzy event, satisfying the following relations:
Formula (5) shows that the necessity measure of some fuzzy event is the possibility measure of its opposite event.
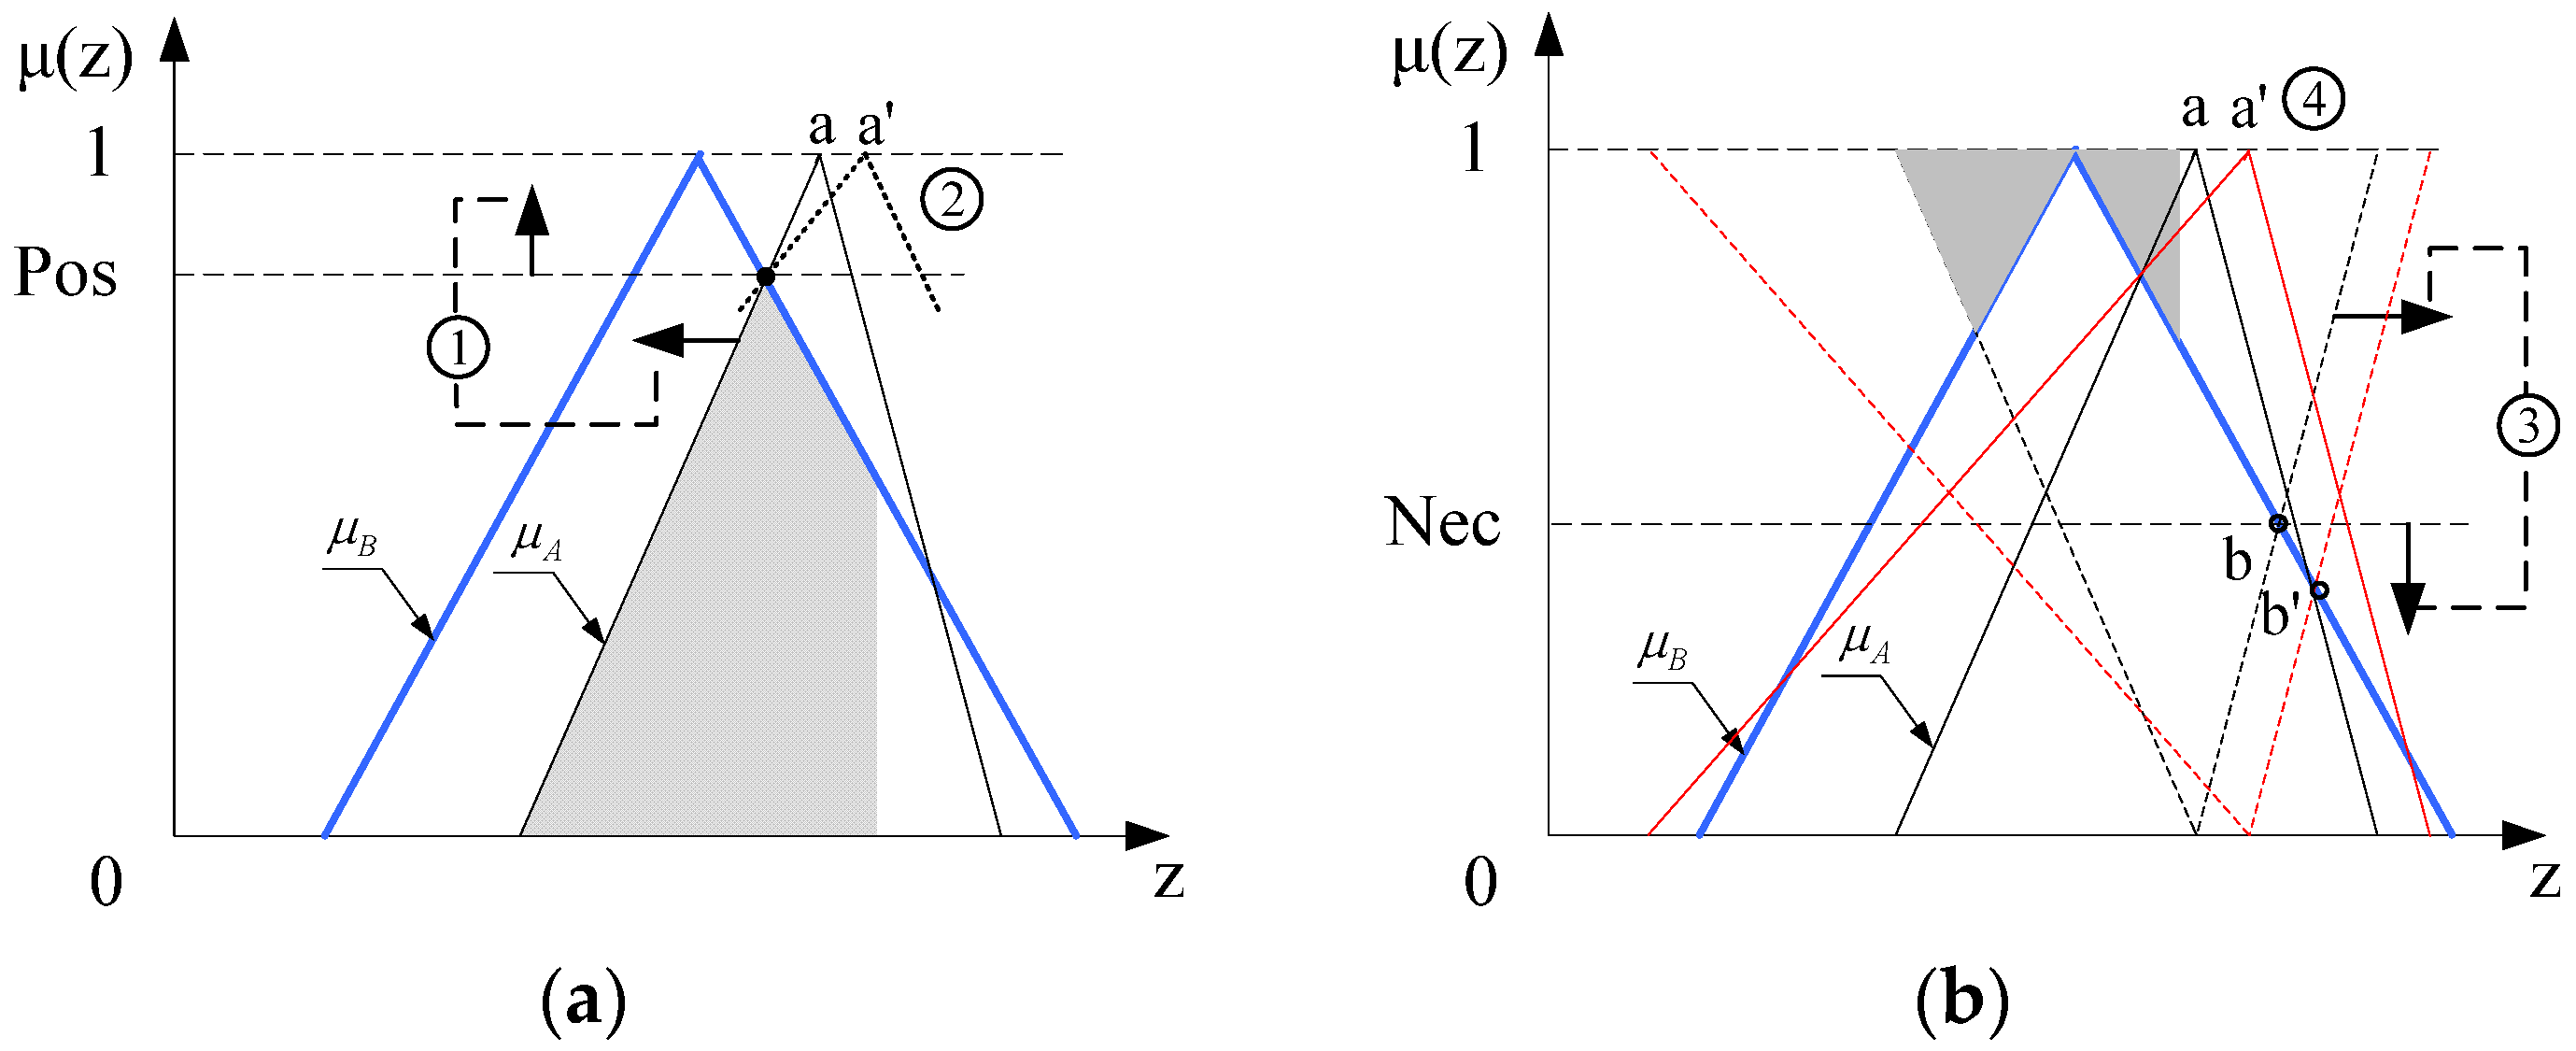
Taking triangular fuzzy number as an example, the possibility measure is shown in Figure 1a; its value is the highest point of the shadowed area and denotes the matching degree of possibility between fuzzy numbers A and B. However, for a given Pos, there are no constraints on the vertex of B, and in Figure 1a, a and a′ all satisfy the given Pos.
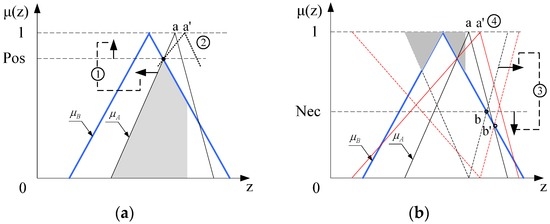
Figure 1.
Schematic diagram of two fuzzy measures. (a) Possibility measure (Pos); (b) necessity measure (Nec).
The necessity measure is shown in Figure 1b, whose value is the lowest point of the shadowed area, and denotes the matching degree of necessity between fuzzy numbers A and B. The given Nec can limit the value range of elements in B for known A. As shown by the symbol ④ in Figure 1b, when the vertex of B moves from to , the value of Nec decease from to , although the value of Pos remains the same, shown by the symbol ② in Figure 1a. So, the matching degree between fuzzy numbers A and B can be judged synthetically by selecting the appropriate combination of Pos values and Nec values.
Let fuzzy number be the estimation of current process level. For known fuzzy number of sample mean and its possibility distribution, the matching degree between and can be decided by the possibility measure and necessity measure as follows:
The above two formulas can be used to judge the abnormal status of control chart.
3.2. Control Chart Nonconformity Judgment Rules
Suppose and are the triangular fuzzy numbers of process mean and sample mean, respectively. The in-control fuzzy control chart must satisfy the following two conditions:
- (1)
- The possibility measure of under known must be no less than the preset (i.e., (See [20]));
- (2)
- The necessity measure of under known must be no less than the preset (i.e., ).
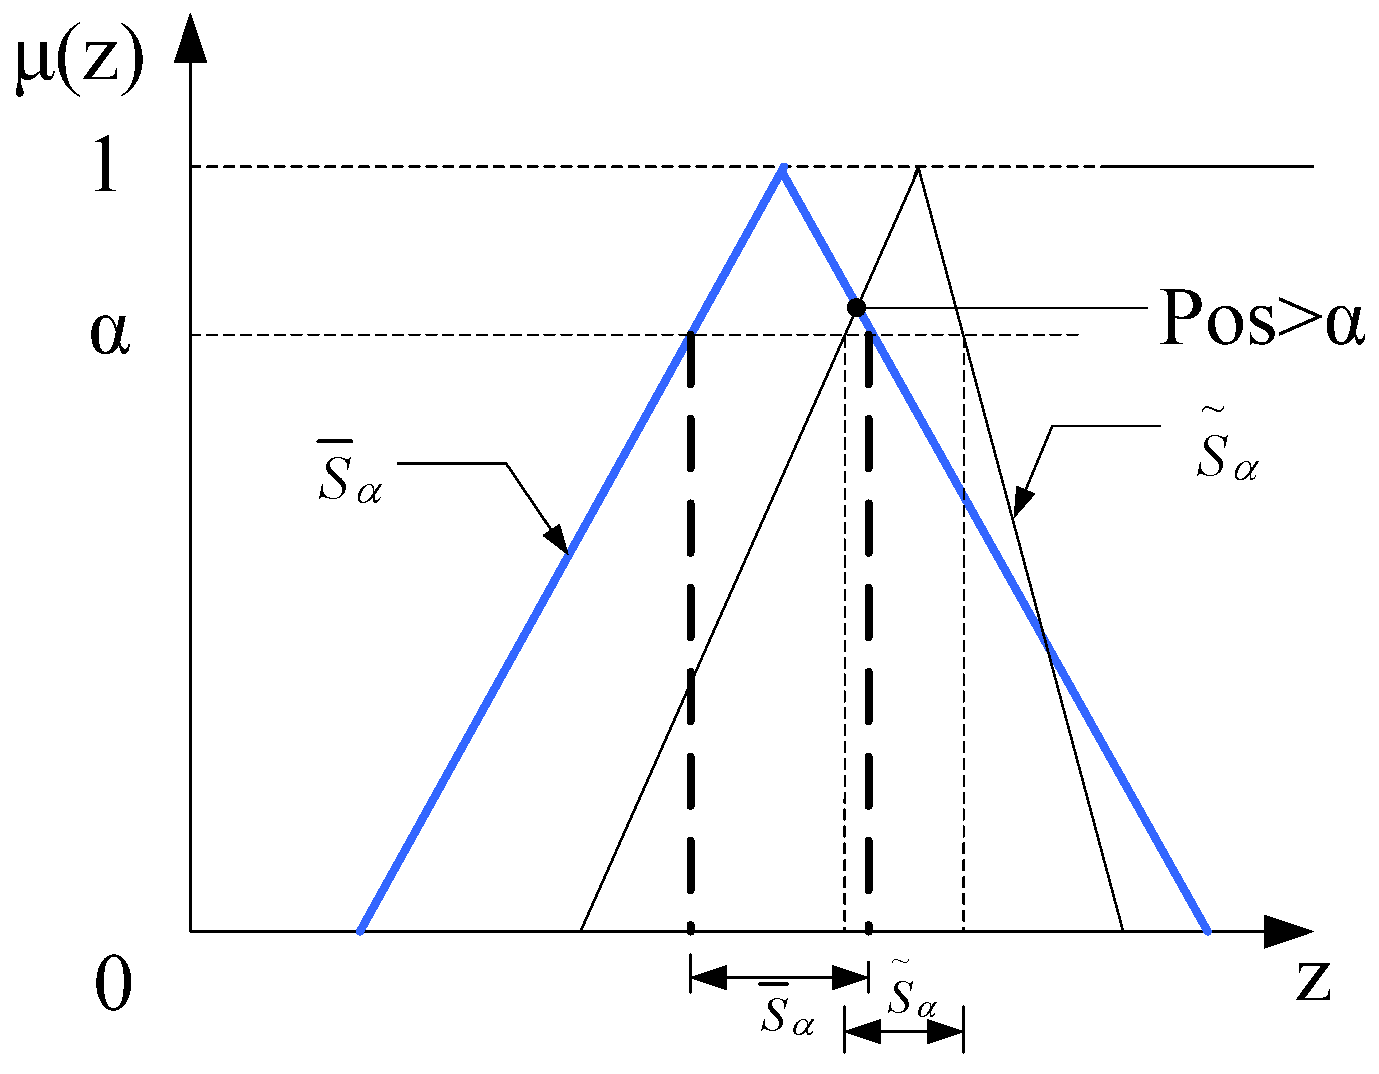
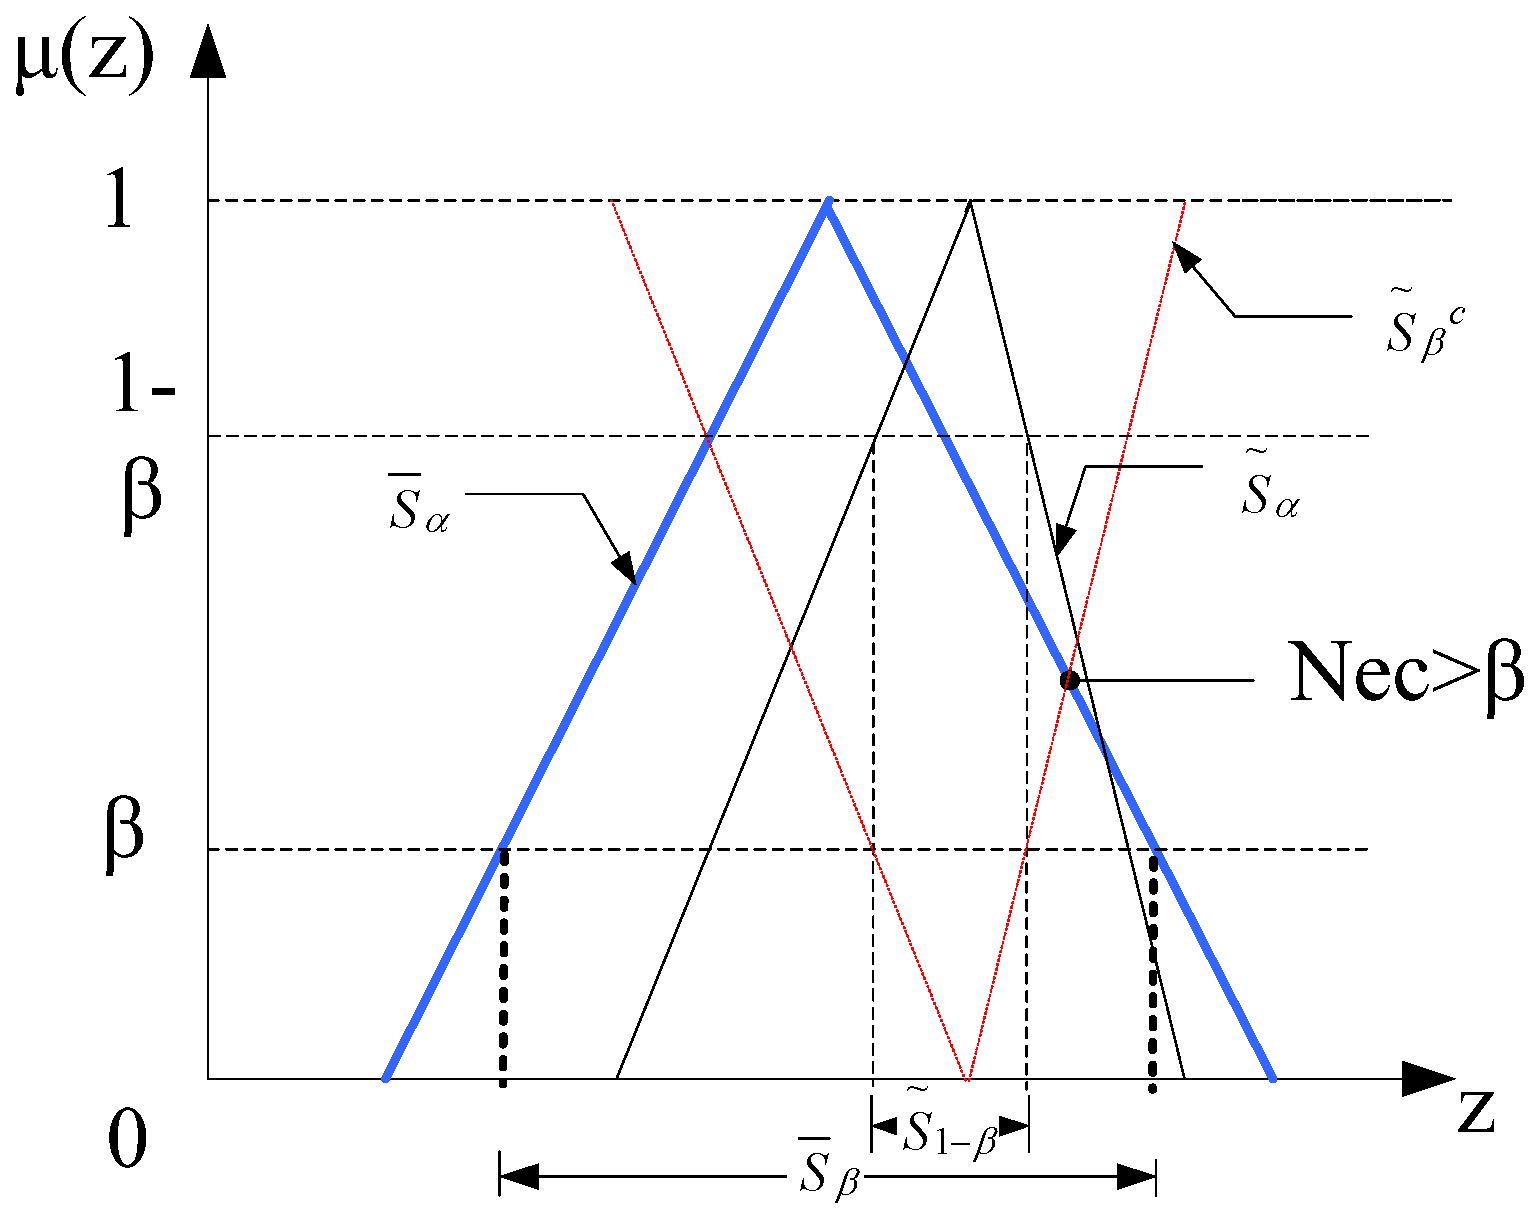
By analyzing the graphical characteristics of these two measures, it was found that the fuzzy set and , meeting conditions of and , has the following features, as shown in Figure 2 and Figure 3:
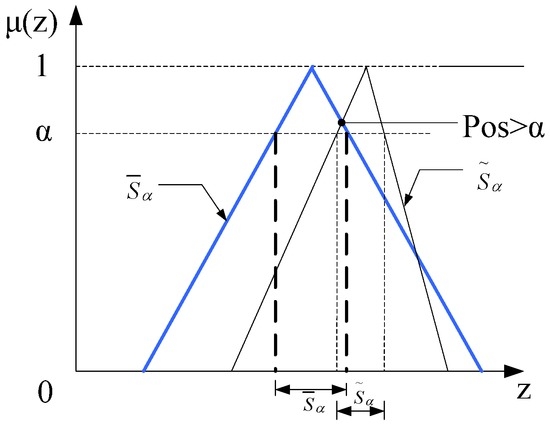
Figure 2.
Probability measure (Pos) of triangular fuzzy number.
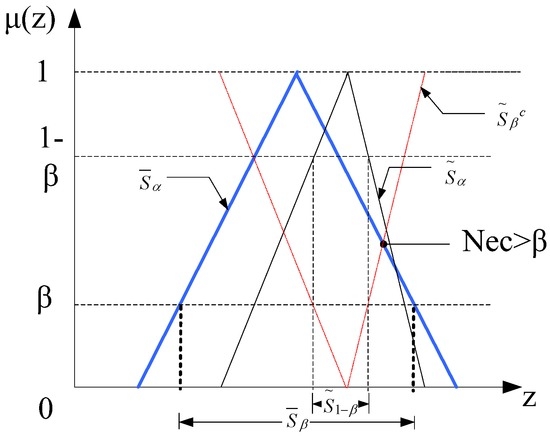
Figure 3.
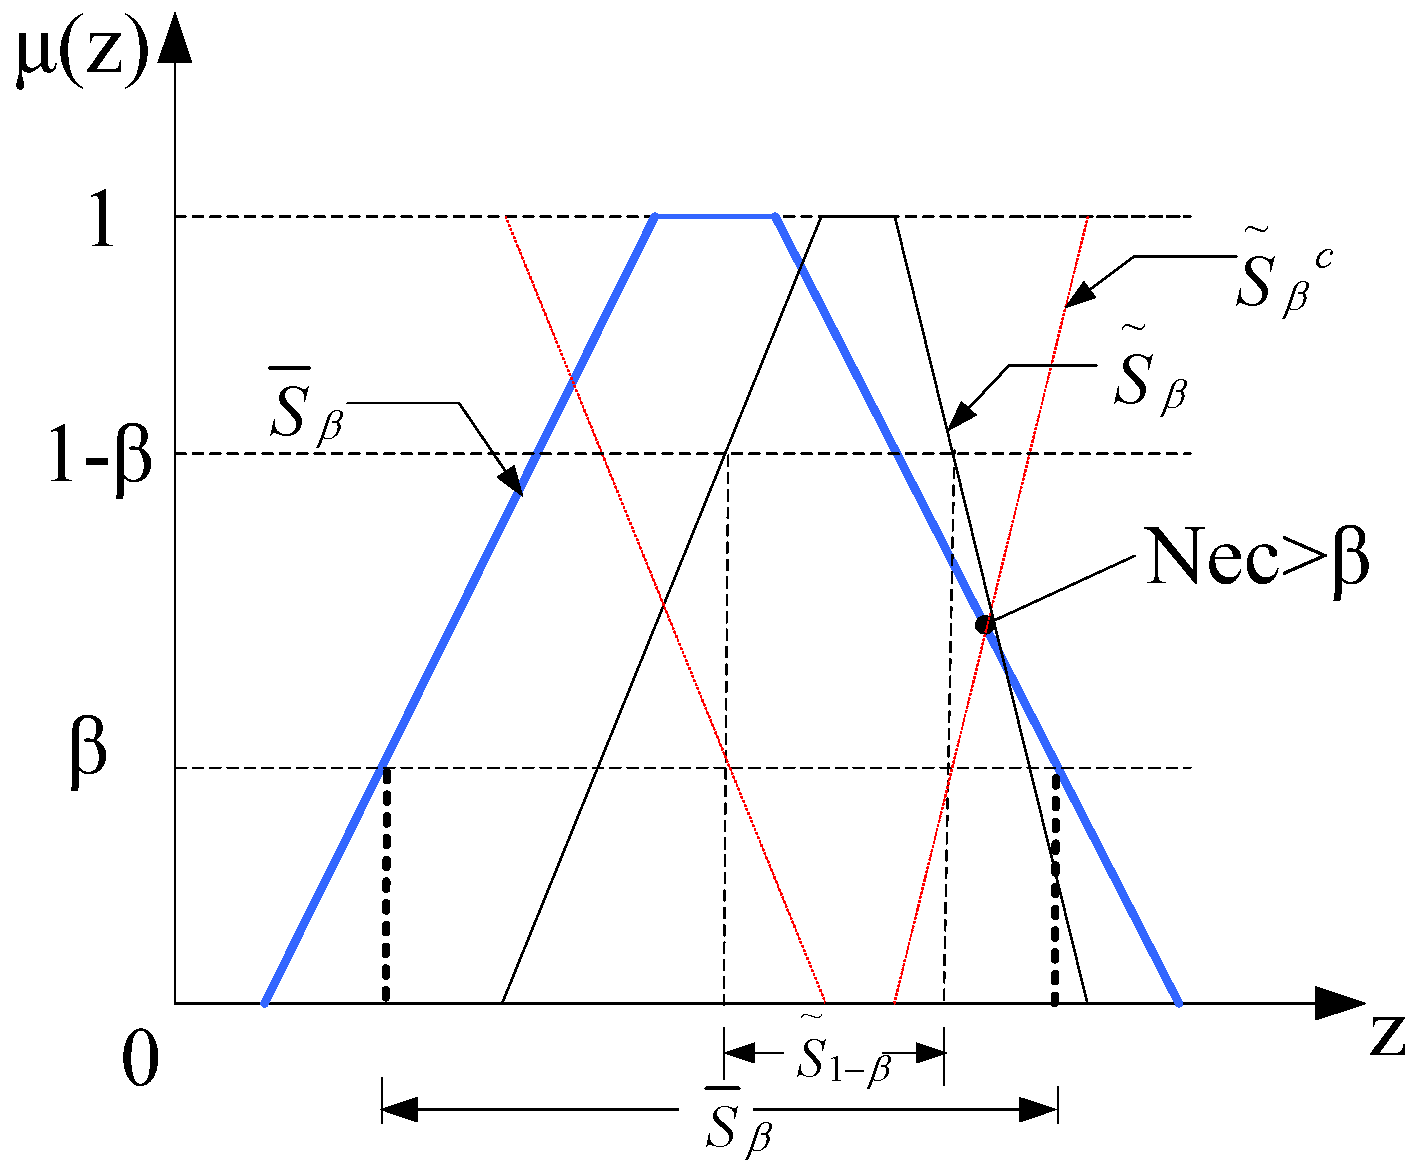
Necessity measure (Nec) of triangular fuzzy number.
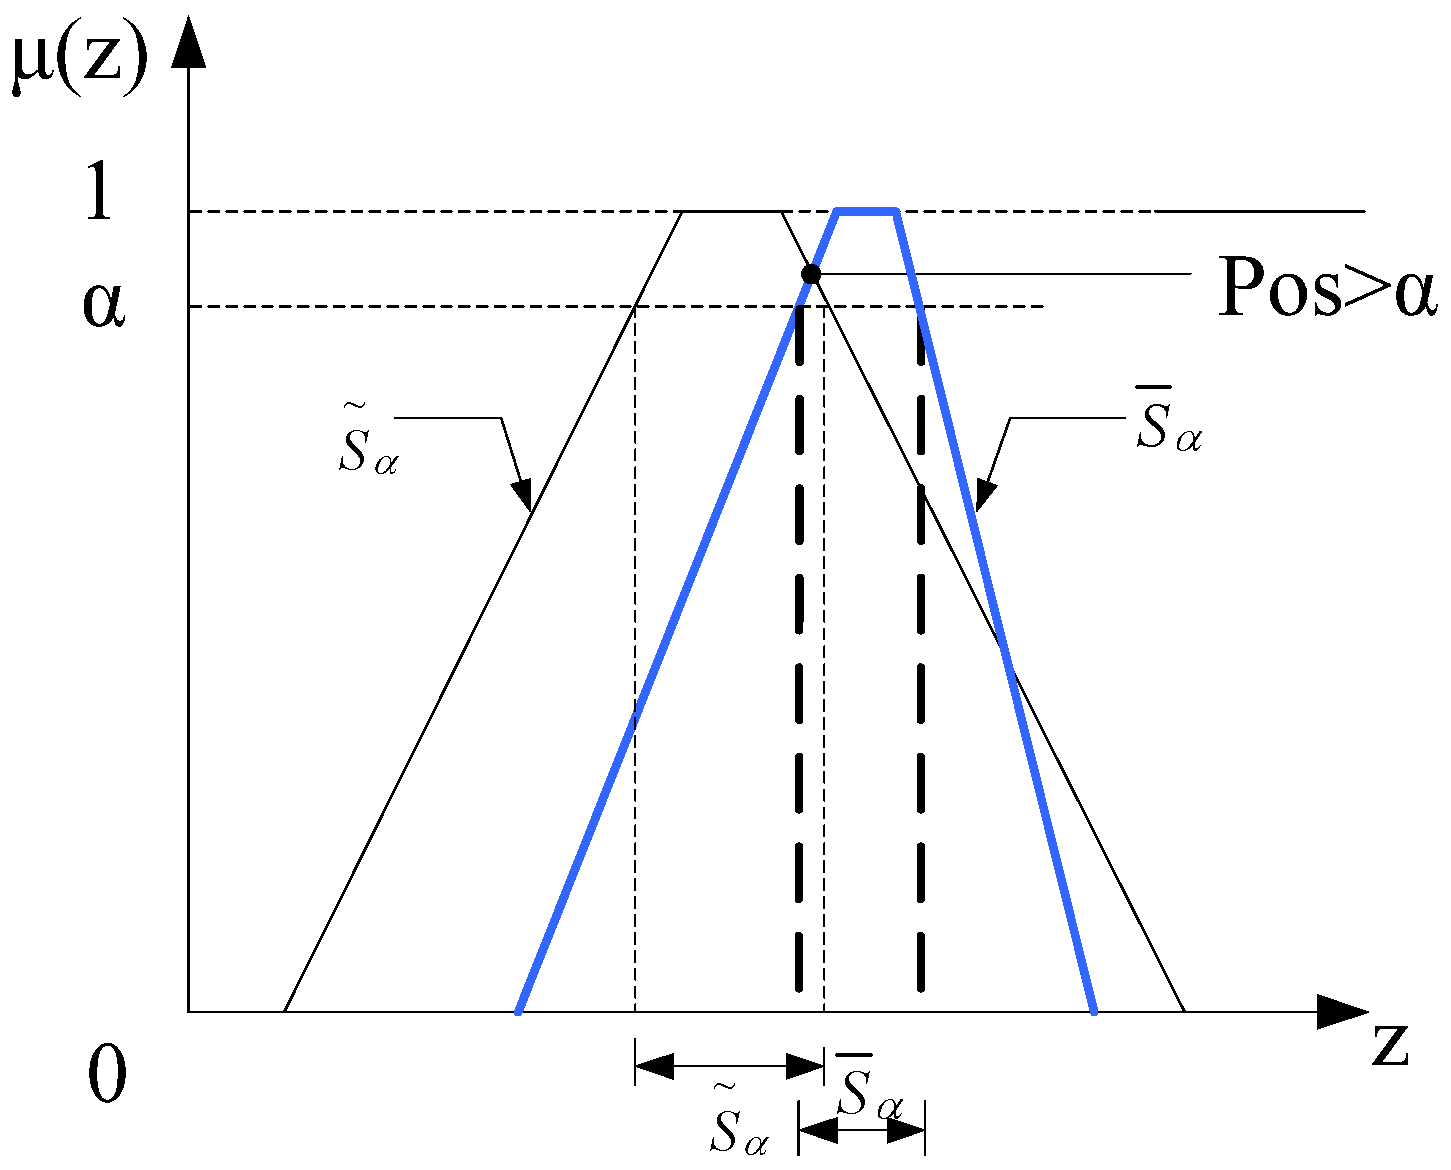
For trapezoidal fuzzy numbers, graphical analysis results show that the above two features are still true (as shown in Figure 4 and Figure 5). So, the above two features regarding probability measure and necessity measure can be used as the criteria for judging the fuzzy control chart’s abnormal state.
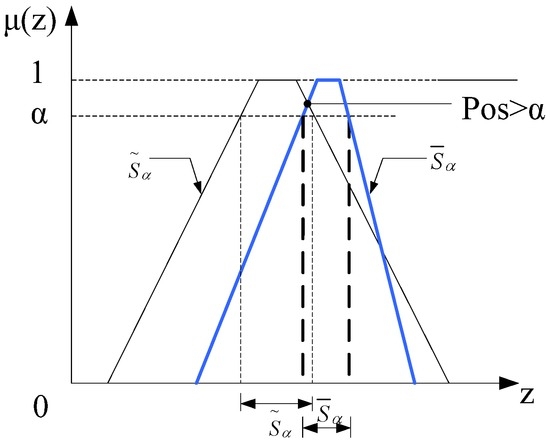
Figure 4.
Pos of trapezoidal fuzzy number.
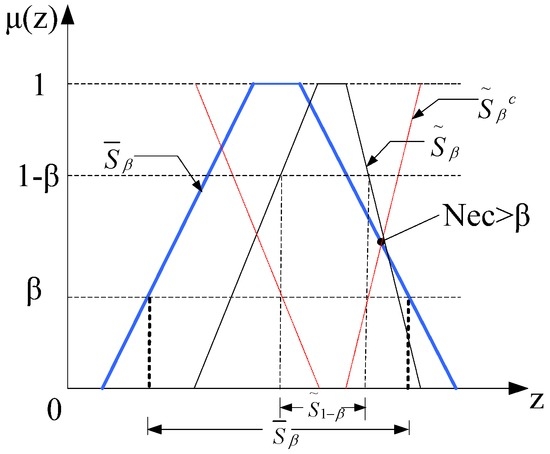
Figure 5.
Nec of trapezoidal fuzzy number.
3.3. Parameters of Threshold for Nonconformity Judgment
In the aforementioned two rules, the value of parameters and are not uniformly set and depend on the specific process mean fuzzy number and sample mean fuzzy number.
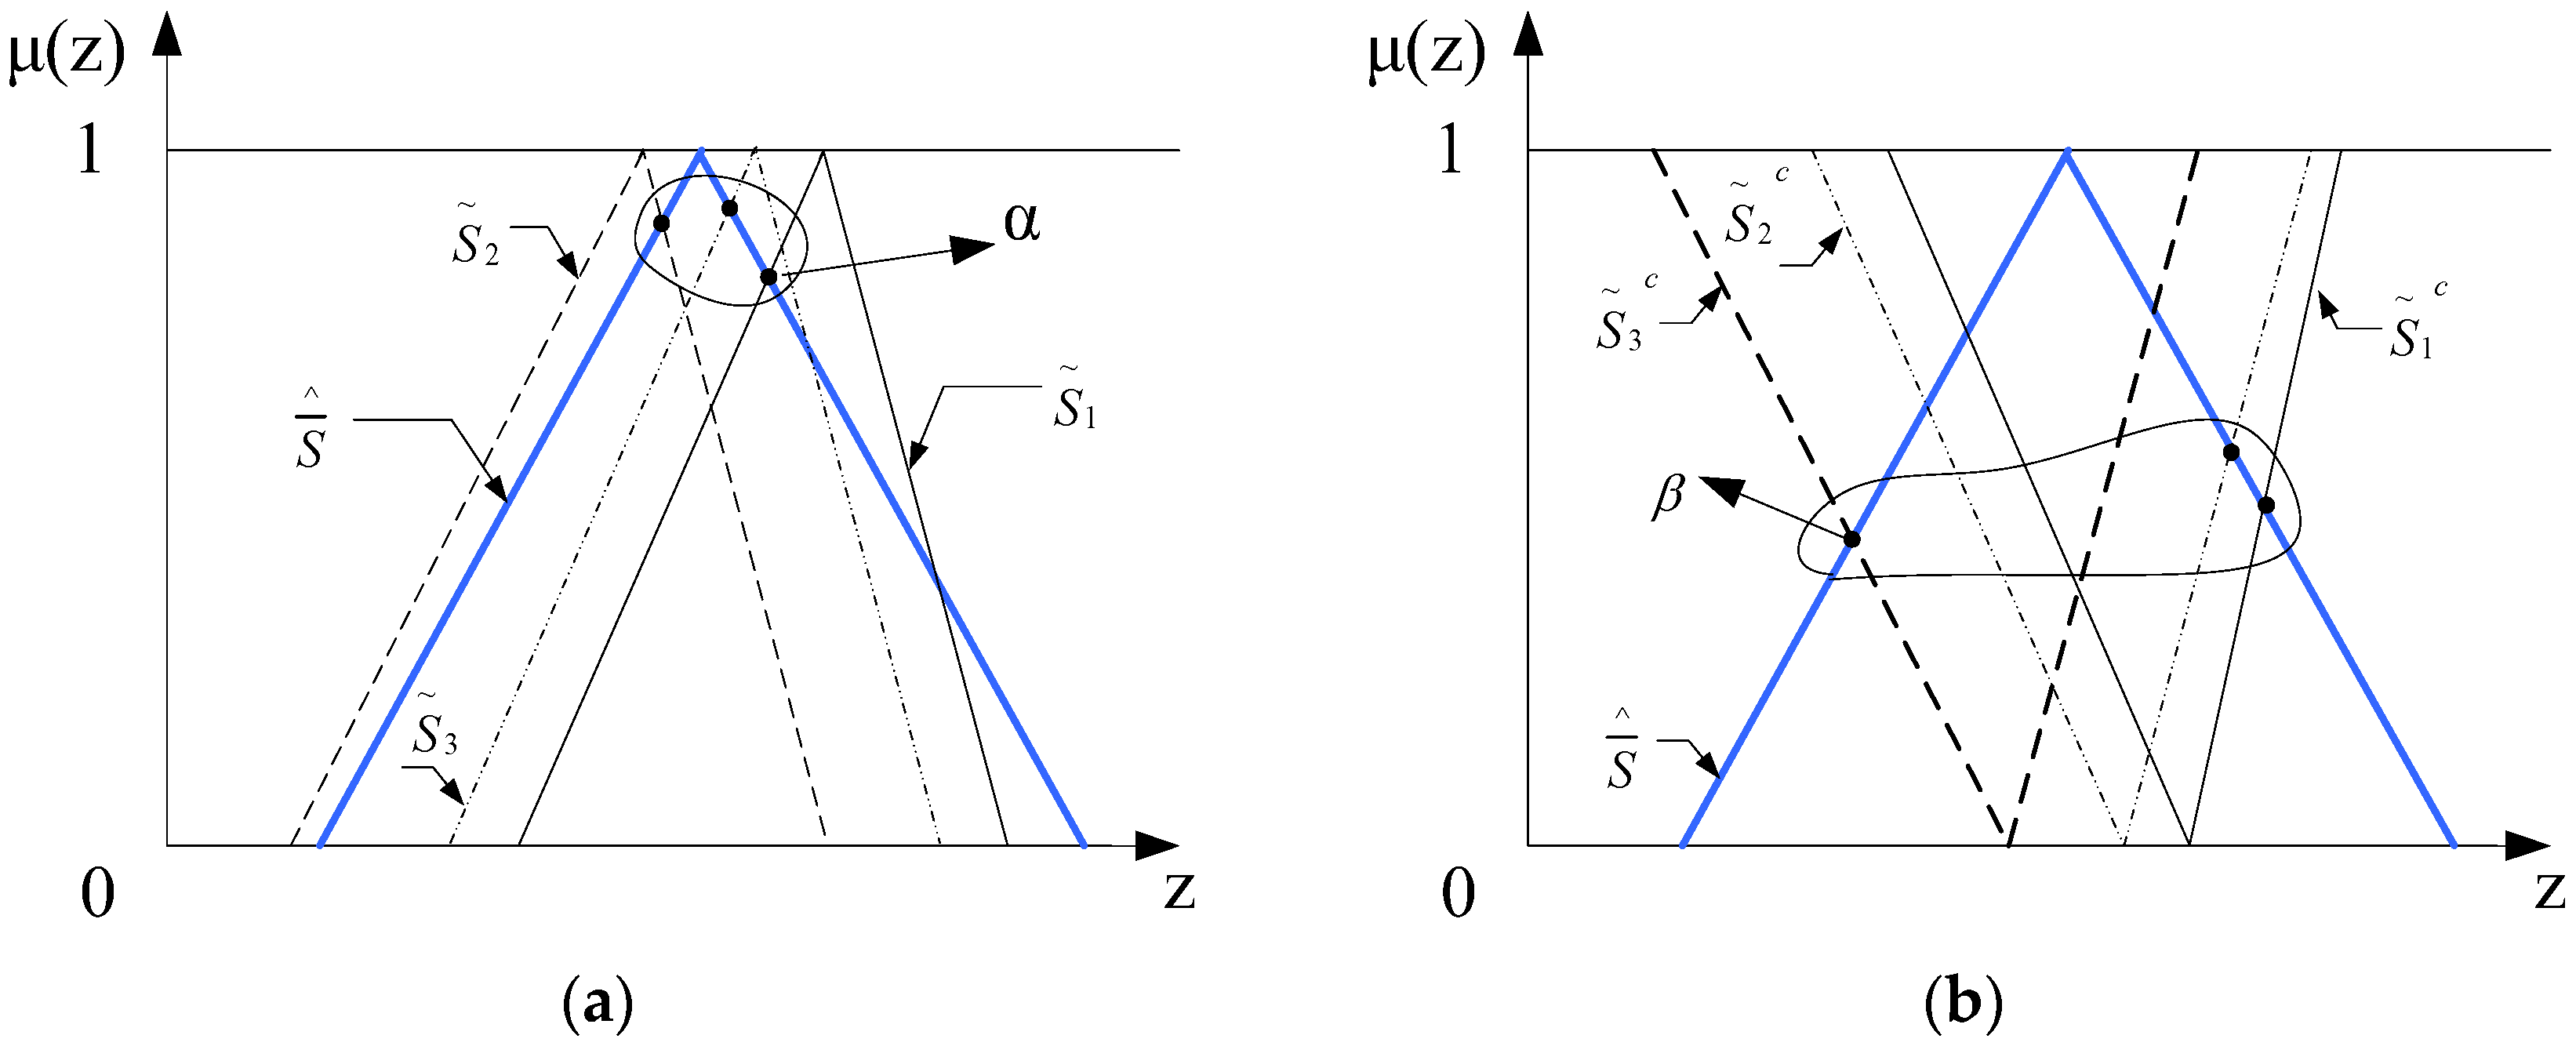
For example, let () and be the fuzzy numbers of process mean and sample mean, respectively. If there is no abnormity in the control chart during a certain sampling period, the values of parameters and can be taken as the minimum of Pos and Nec of under different as follows:
Figure 6 illustrates the above process.
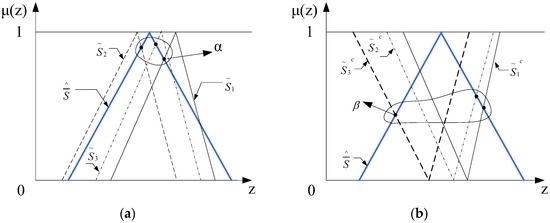
Figure 6.
Determination of parameters. (a) Determination of parameter ; (b) determination of parameter .
4. Basic Form of a Fuzzy Control Chart
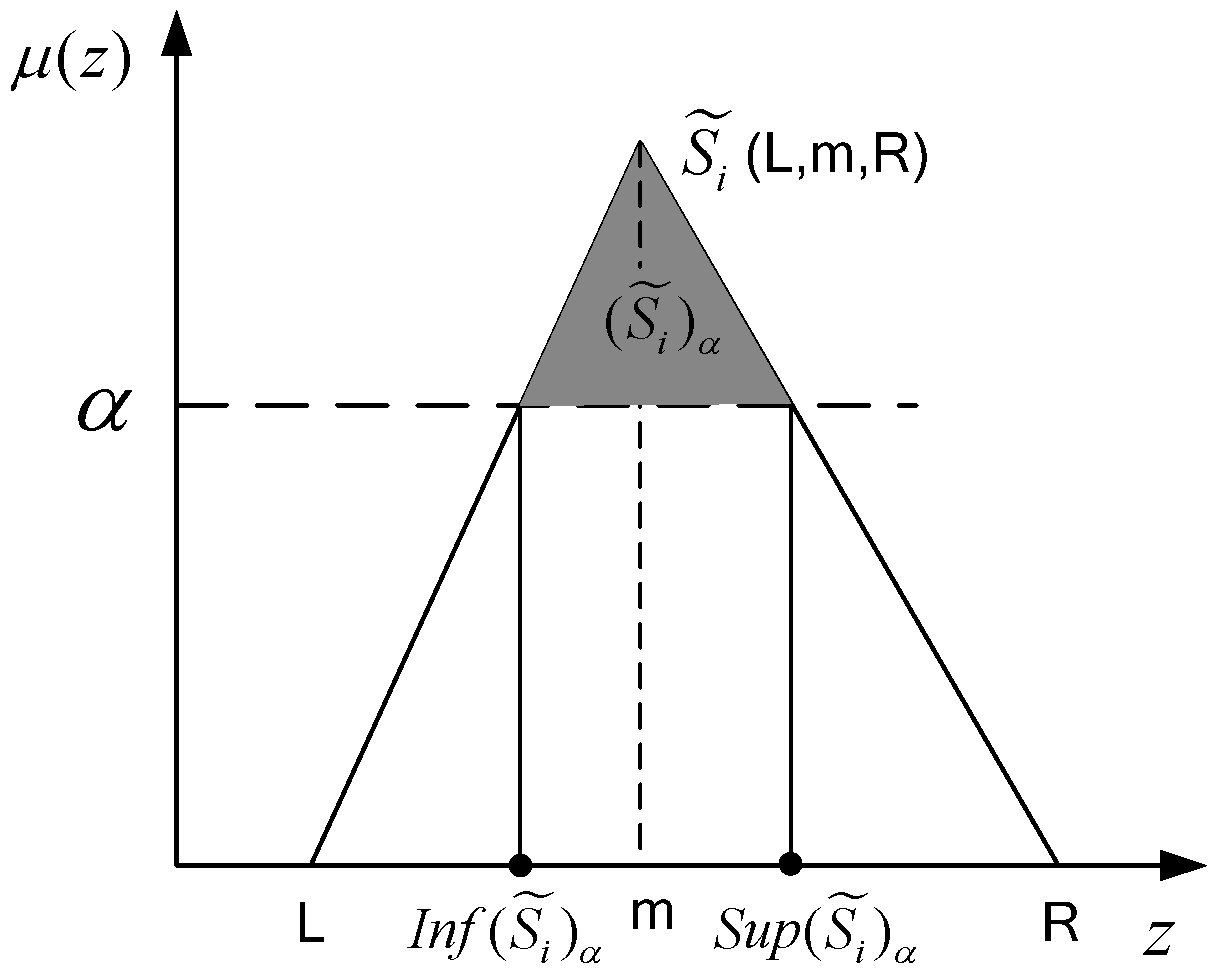
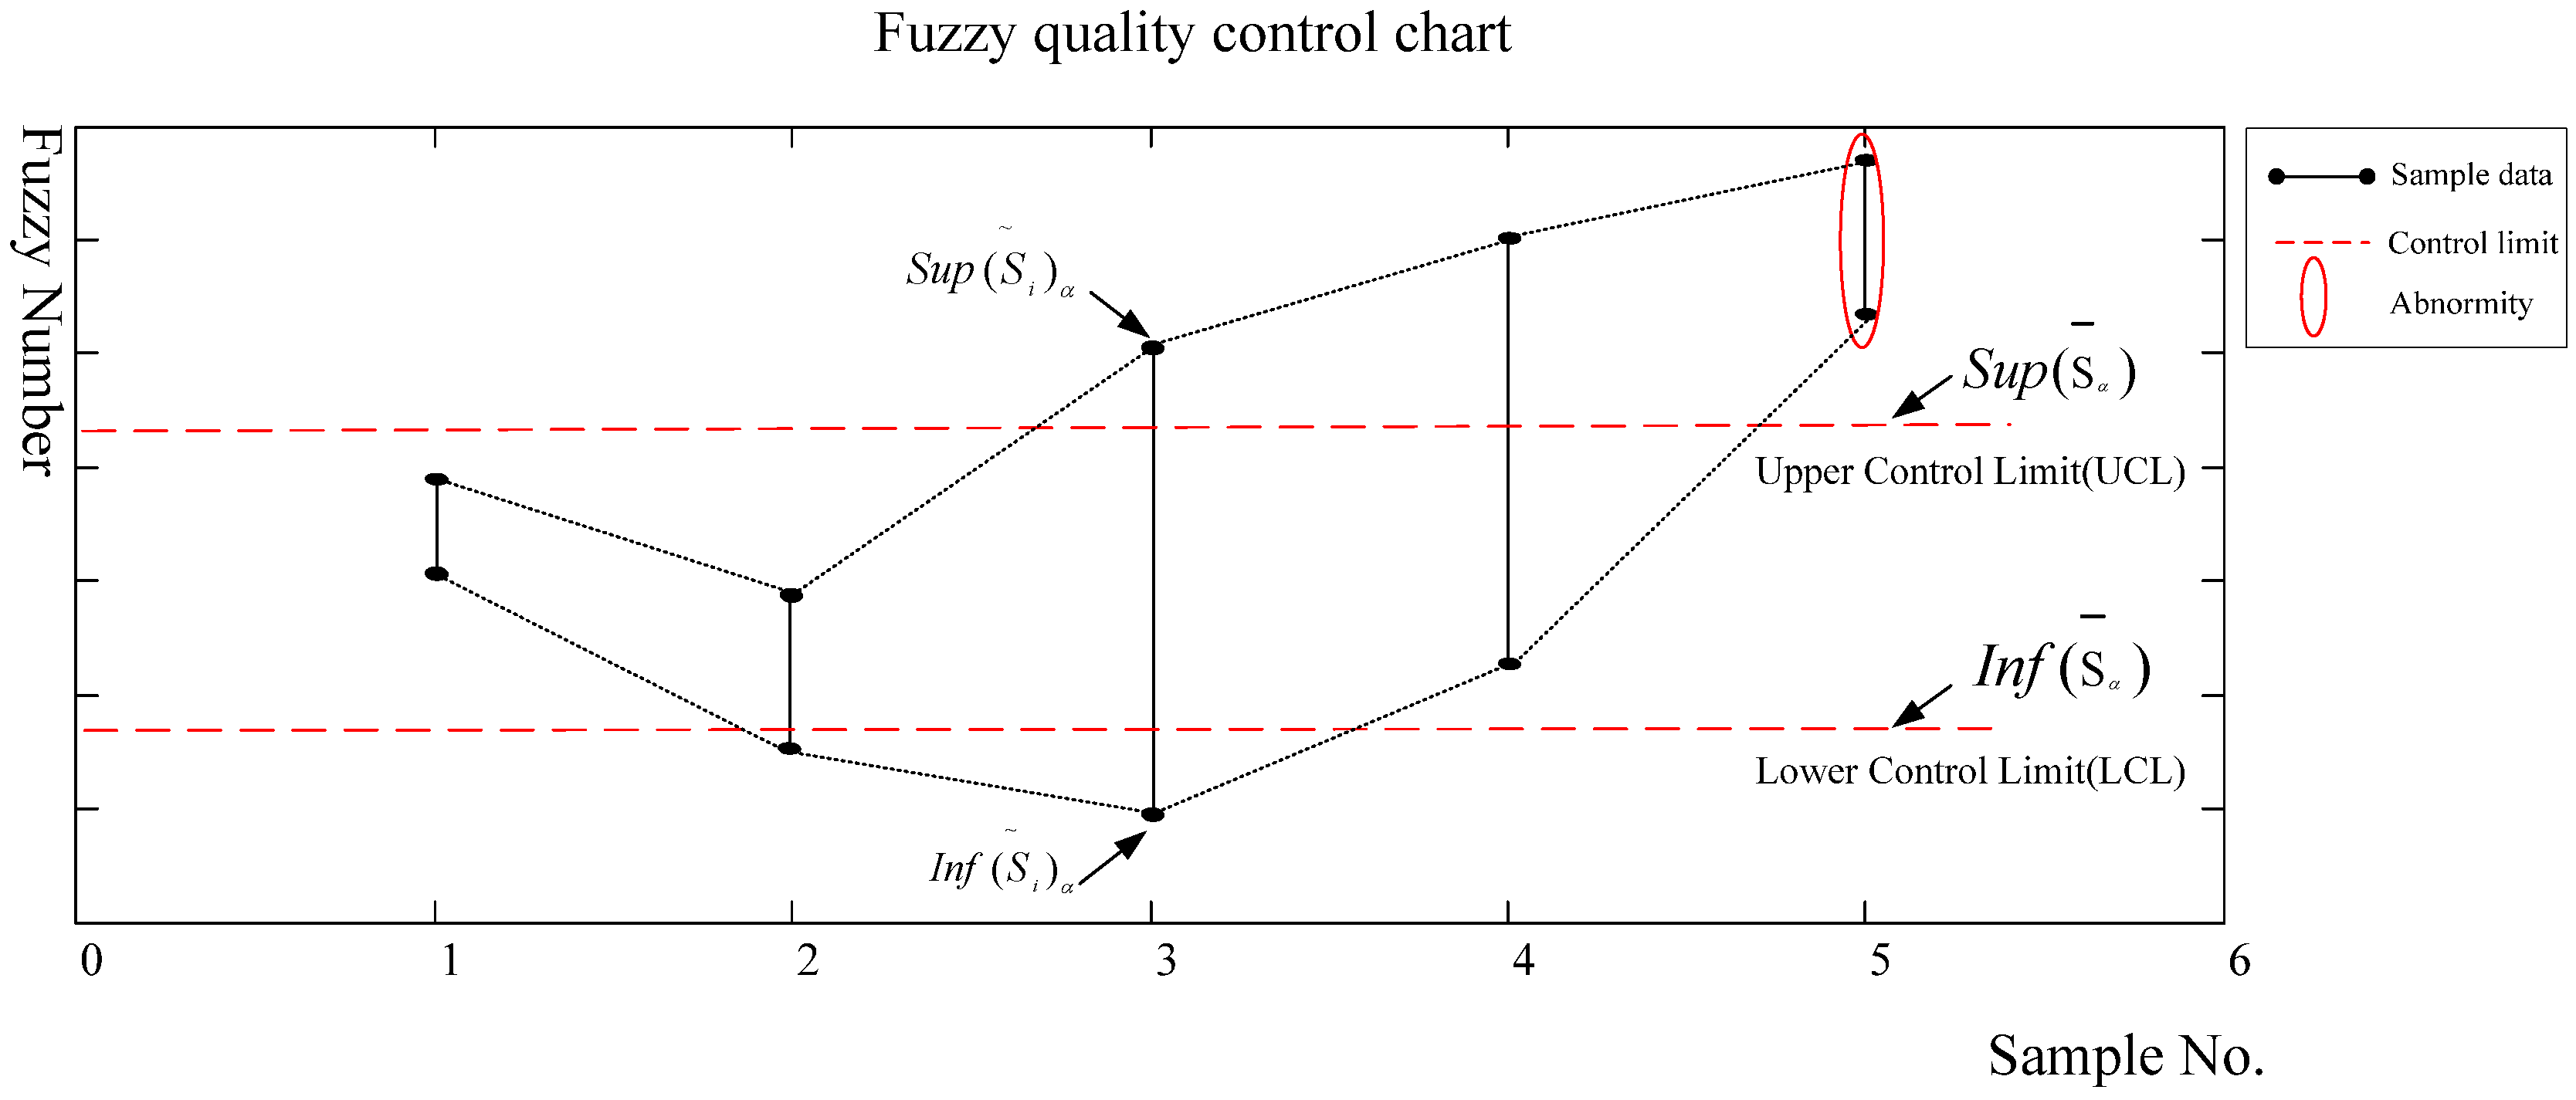
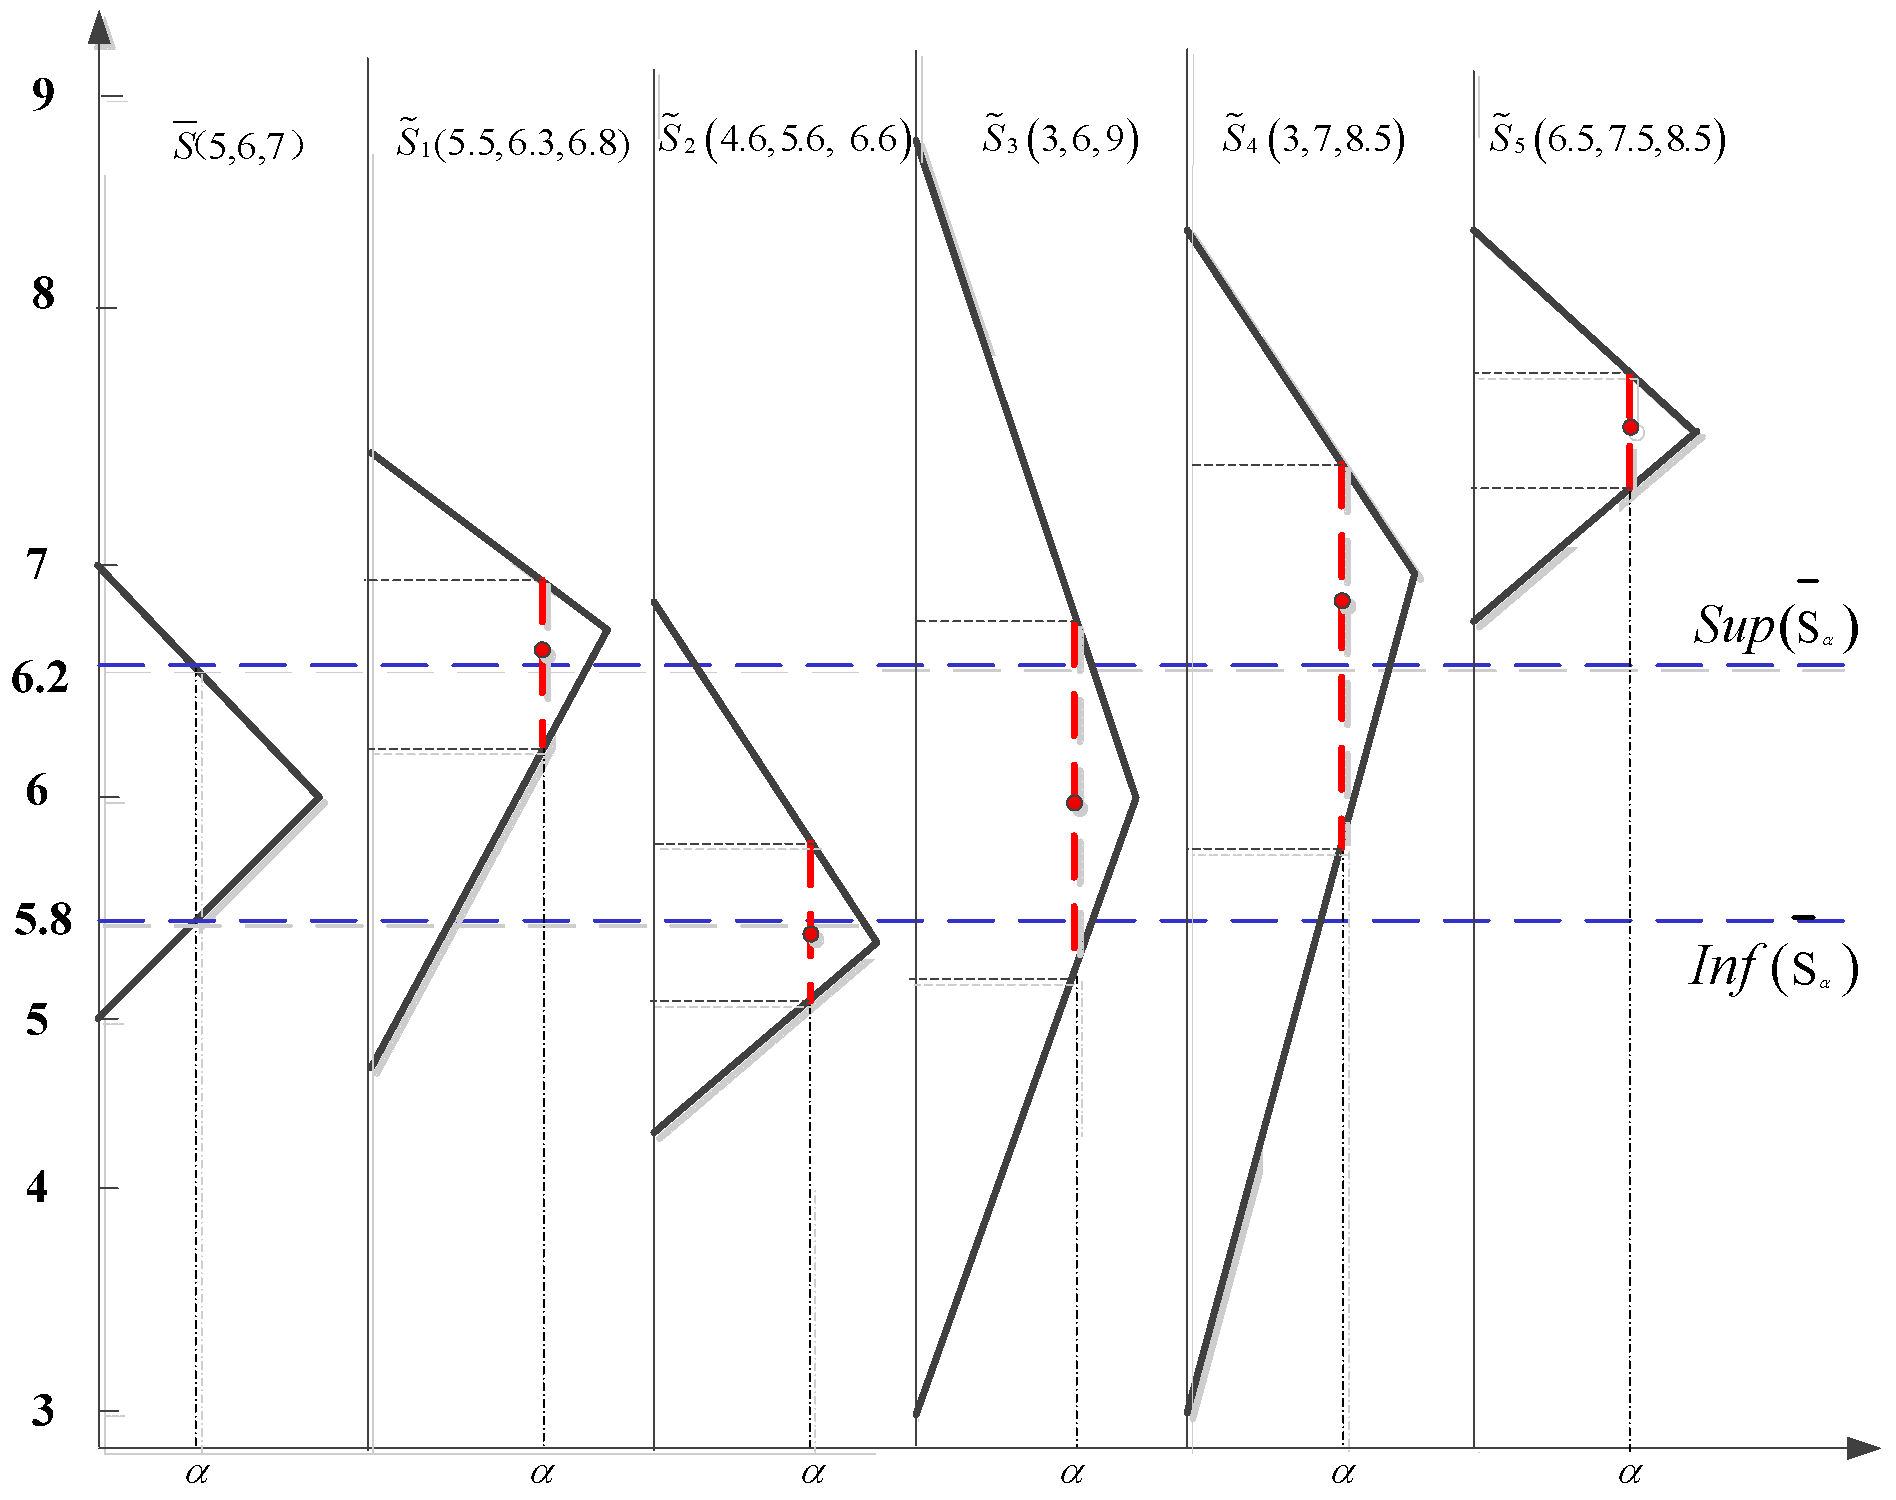
The plotted data of fuzzy control chart is the supremum and infimum of of quality characteristic-scoring sample fuzzy number, which is denoted as a line segment connecting and . The upper and lower control limits are supremum and infimum of mean scoring fuzzy number, respectively. The fuzzy control chart is judged abnormal when the set of sample fuzzy number and process mean fuzzy number do not meet the two criteria.
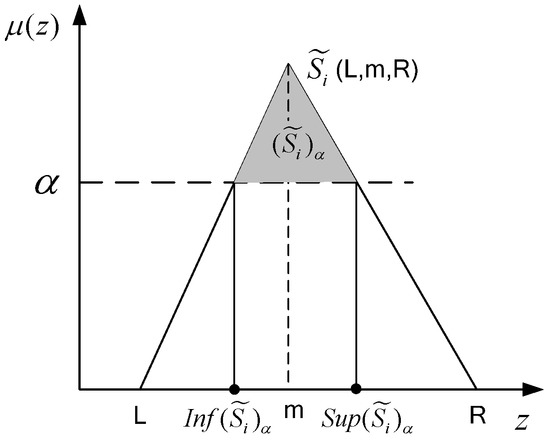
Figure 7.
Supremum (Sup(Si)a) and infimum (Inf(Si)a) of fuzzy number .
Figure 8 shows the basic form of fuzzy score number-based control chat.
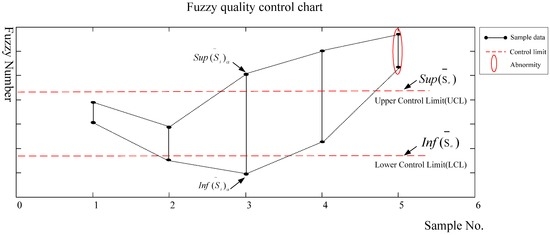
Figure 8.
Basic form of a fuzzy score number-based fuzzy control chart.
5. Case Study
5.1. Construction of a Fuzzy Control Chart Based on Triangular Fuzzy Number
In the outer packaging inspection station of a certain workshop, the outer packaging quality was evaluated by a professional quality inspector. The process of monitoring packaging quality using a fuzzy control chart was as follows.
Step 1: Obtain the statistics of process mean. When process was in steady status, the quality inspector evaluated the cases by random sampling, and the triangular fuzzy number of the process mean was calculated as .
Step 2: Determine the parameters of nonconformity judgment. In this case study, the parameters were set as and in terms of Formulas (10) and (11). The upper and lower control limits, 6.2, 5.8 and 6.7, 5.3, were the right and left endpoints of and of process mean fuzzy number , respectively, according to Formulas (12) and (13).
Step 3: Prepare the plotted data. A sample size of 5 was taken randomly and the scoring triangular fuzzy numbers were , , , , and . According to Formulas (6), (7), (11), and (12), we obtain the results shown in Table 1.

Table 1.
The calculation results of sample fuzzy number parameters.
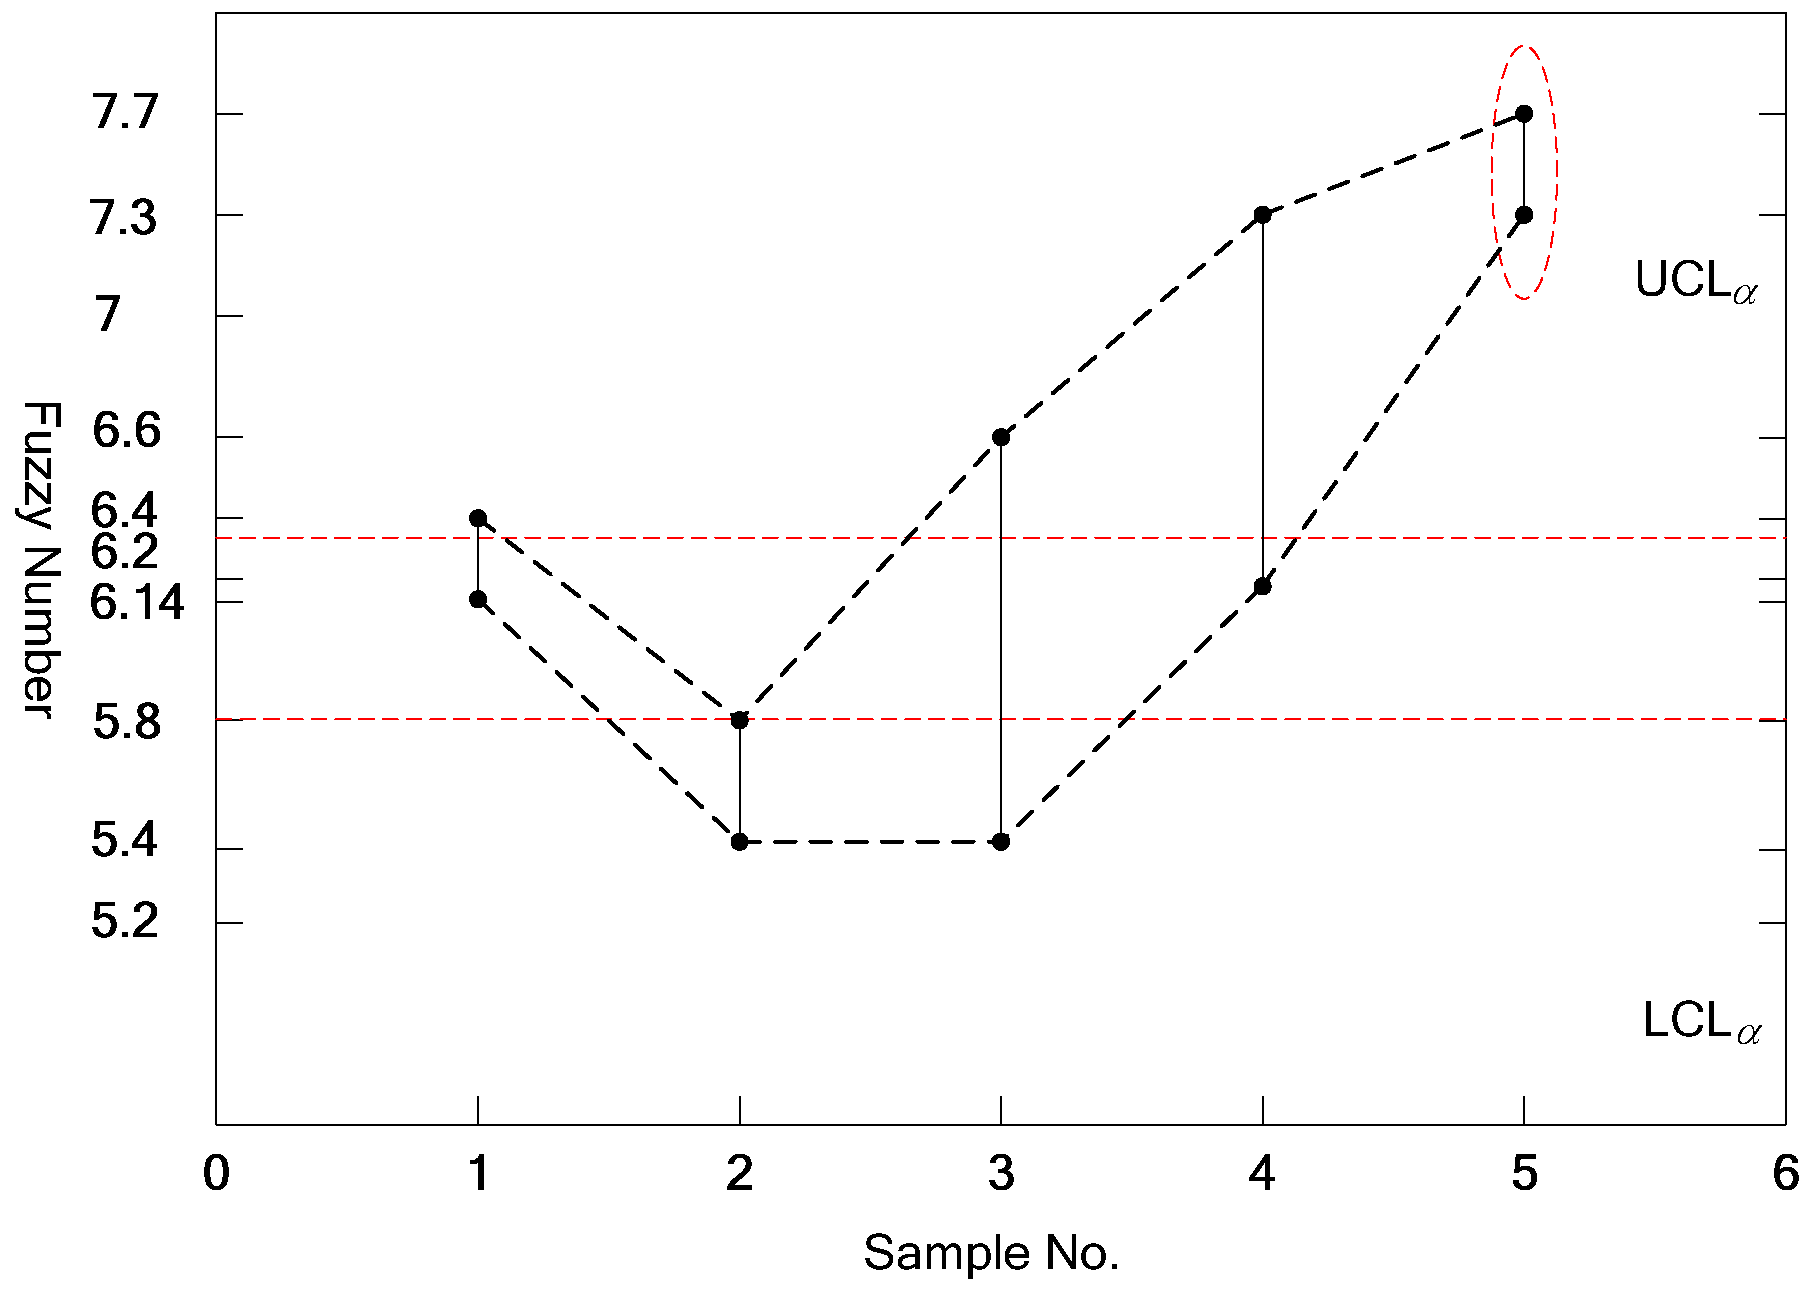
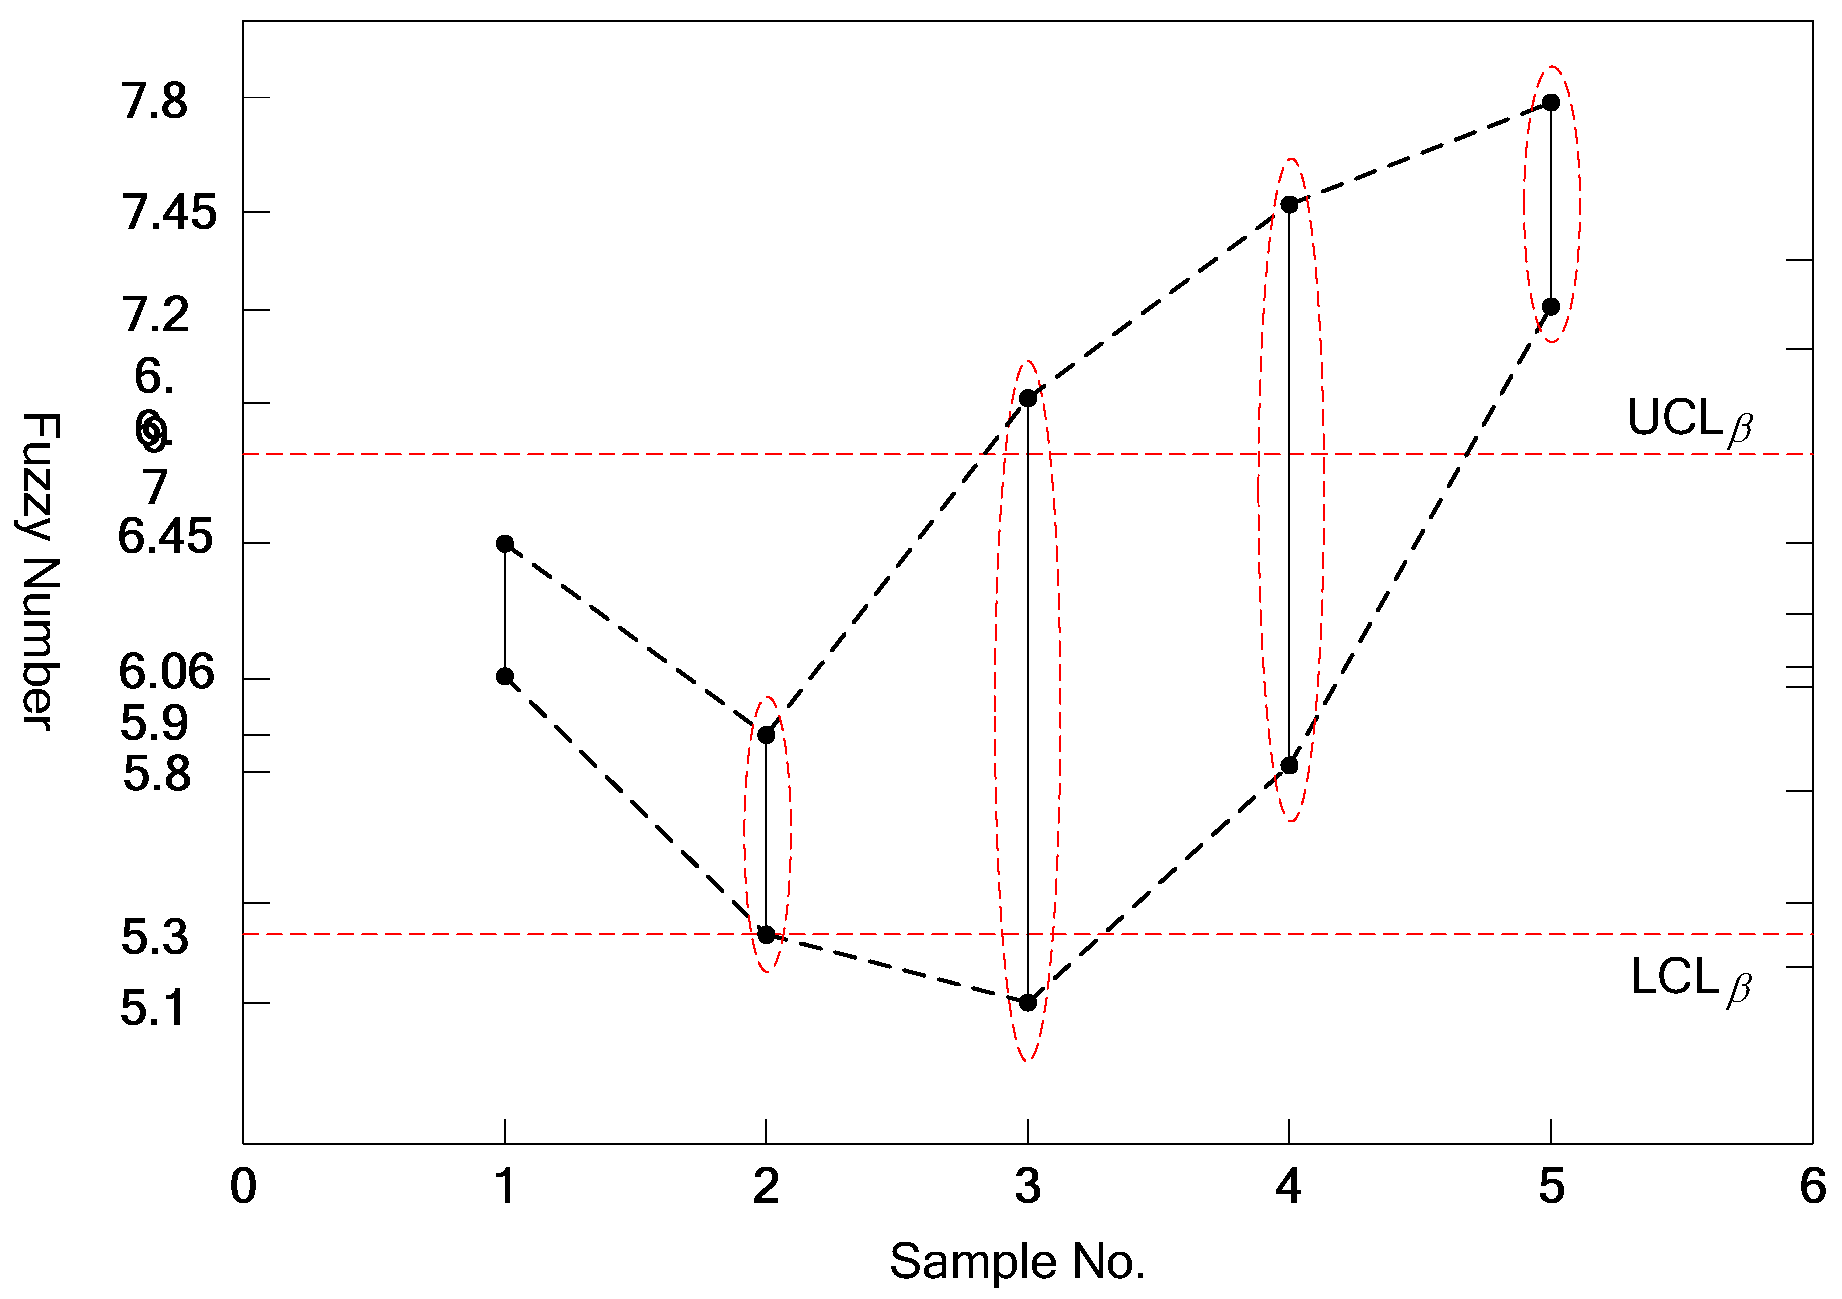
Step 4: Build a fuzzy control chart for control. A fuzzy control chart can be built by using the data in Table 1. In Figure 9 and Figure 10, the vertical segments were drawn in the chart by connecting the left and right endpoints of a complementary set of sample fuzzy number , and the control chart state can be determined by the cross-relationship between the limit lines and vertical segments according to Formulas (8) and (9).
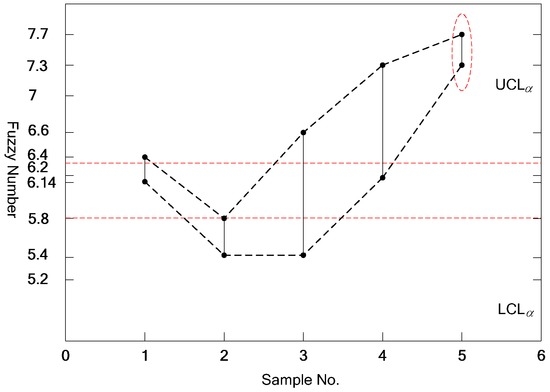
Figure 9.
Possibility measure of control chart.
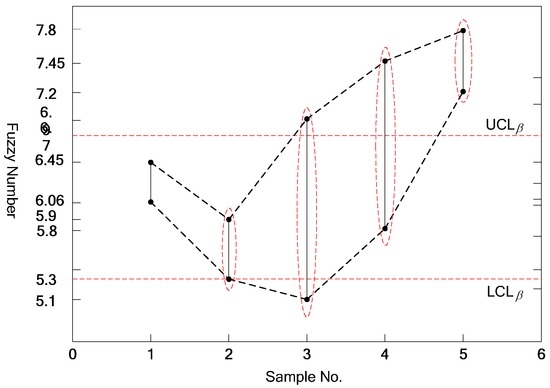
Figure 10.
Necessity measure of control chart.
5.2. Analysis of Control Chart
For the fifth sample in Figure 9, the intersection of and was empty. It did not satisfy the criterion of possibility measure, thus the process was judged as abnormal. For the second, third, fourth, and fifth samples in Figure 10, did not include . This did not satisfy the criterion of necessity measure, and the process was judged as abnormal. So, the process was in control only for Sample 1. The control level can be adjusted by parameters and .
For the same sample data, the following control chart (Figure 11) can be built by the commonly used method. The plotted data was the -level fuzzy median of fuzzy number of each sample. The -level fuzzy median of ith sample was obtained by . If the fuzzy median is between the upper limit and the lower limit , the process can be judged as being in a controlled state. We can see from Figure 11 that, except for the third sample, the other four samples were all nonconformities. This method has higher sensitivity than the control chart proposed by this paper, but this also limits actual application for its excessive alarms. In contrast, the proposed control chart is more suitable for practical application.
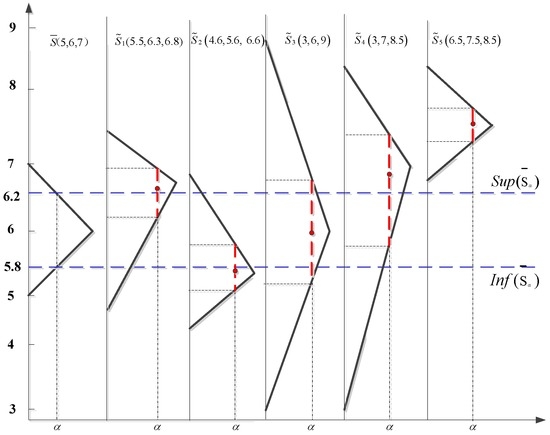
Figure 11.
Fuzzy control chart based on -level fuzzy median.
6. Influence of the of Membership Function Type on a Fuzzy Control Chart
The membership function of a fuzzy number plotted in a control chart can be any curve with a domain of [0,1]. In addition to the triangular membership function, trapezoidal-type, Gauss-type, and π-type functions are also used in fuzzy system.
In order to compare the impact of different types of membership functions on a fuzzy control chart, we designed the corresponding algorithm to calculate the parameters of other membership function by use of the parameters R, L, and m of the triangular membership function.
Suppose a triangular membership function is:
(1) For π-type membership function,
and trapezoidal-type membership function,
then the parameters a, b, c, and d can be obtained by the following formulas:
where k, p are shape parameters valued between 0 and 1.
(2) For a Gauss-type membership function,
where the parameters n and can be obtained by the following formulas:
Taking the triangular fuzzy number data set shown in Table 1 as an example, the respective parameters of a fuzzy control chart for trapezoidal-type, Gauss-type, and π-type functions are shown in Table 2.

Table 2.
Calculated results of fuzzy number parameters for different membership functions.
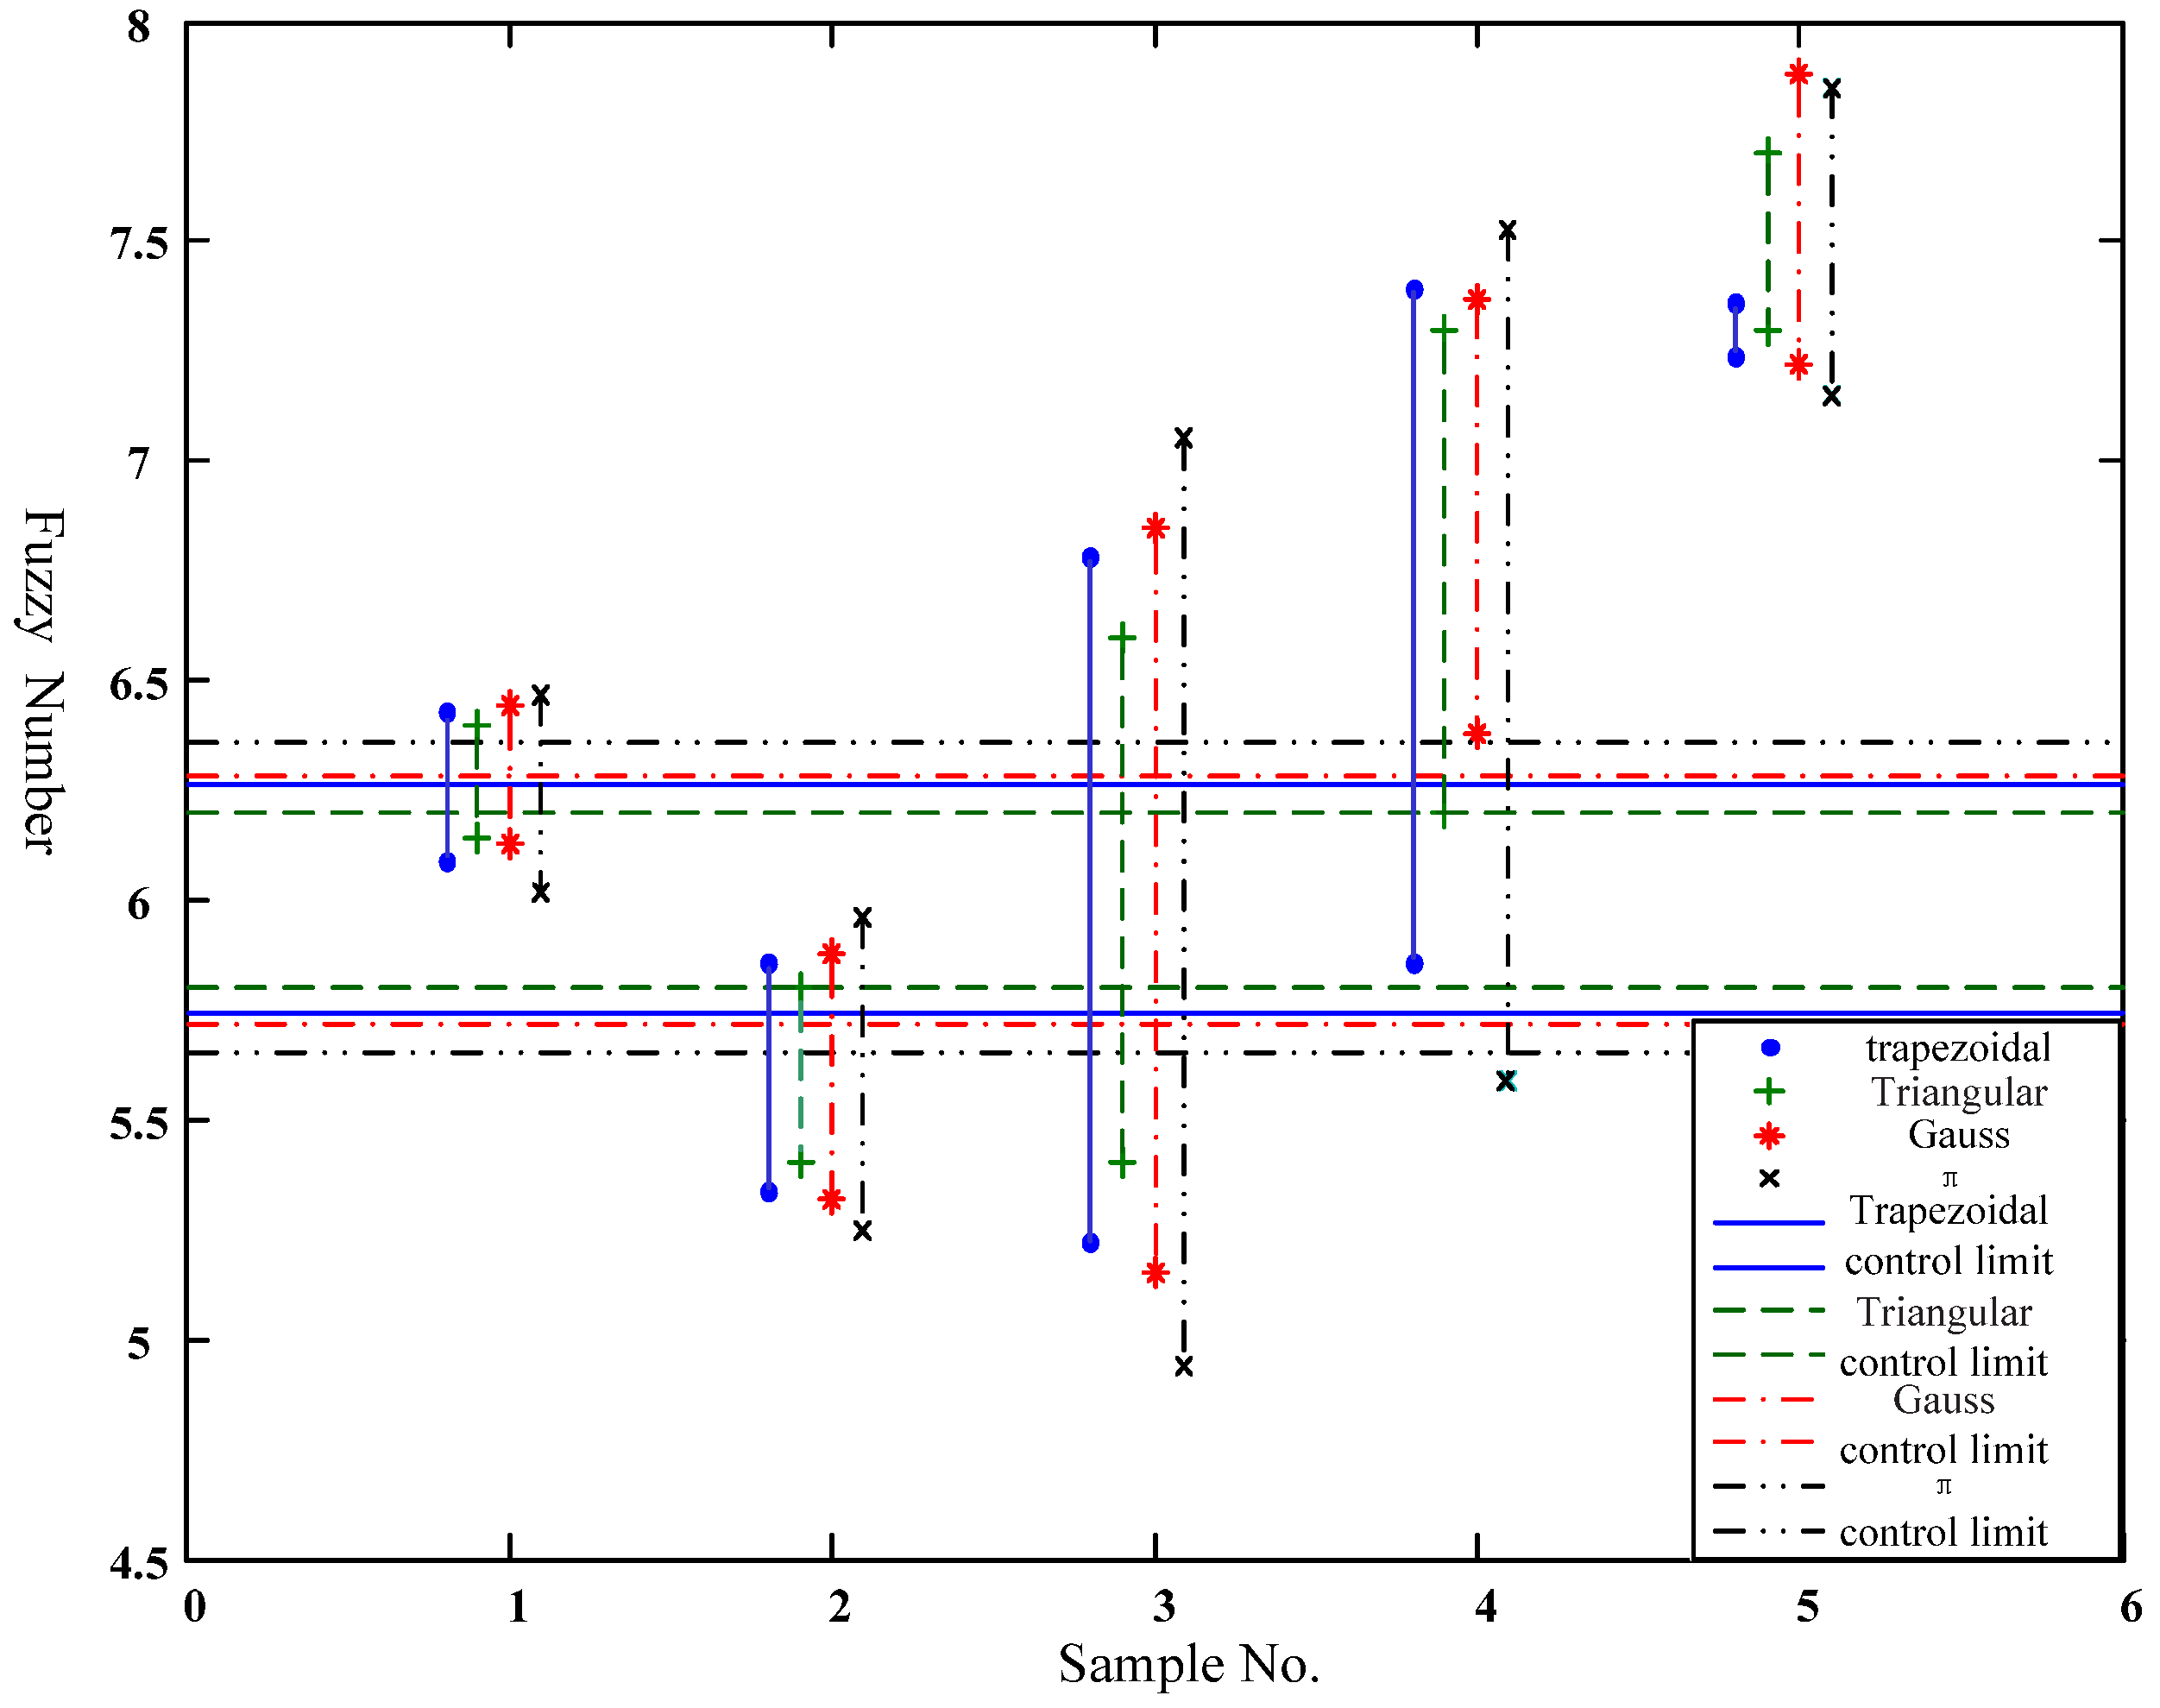
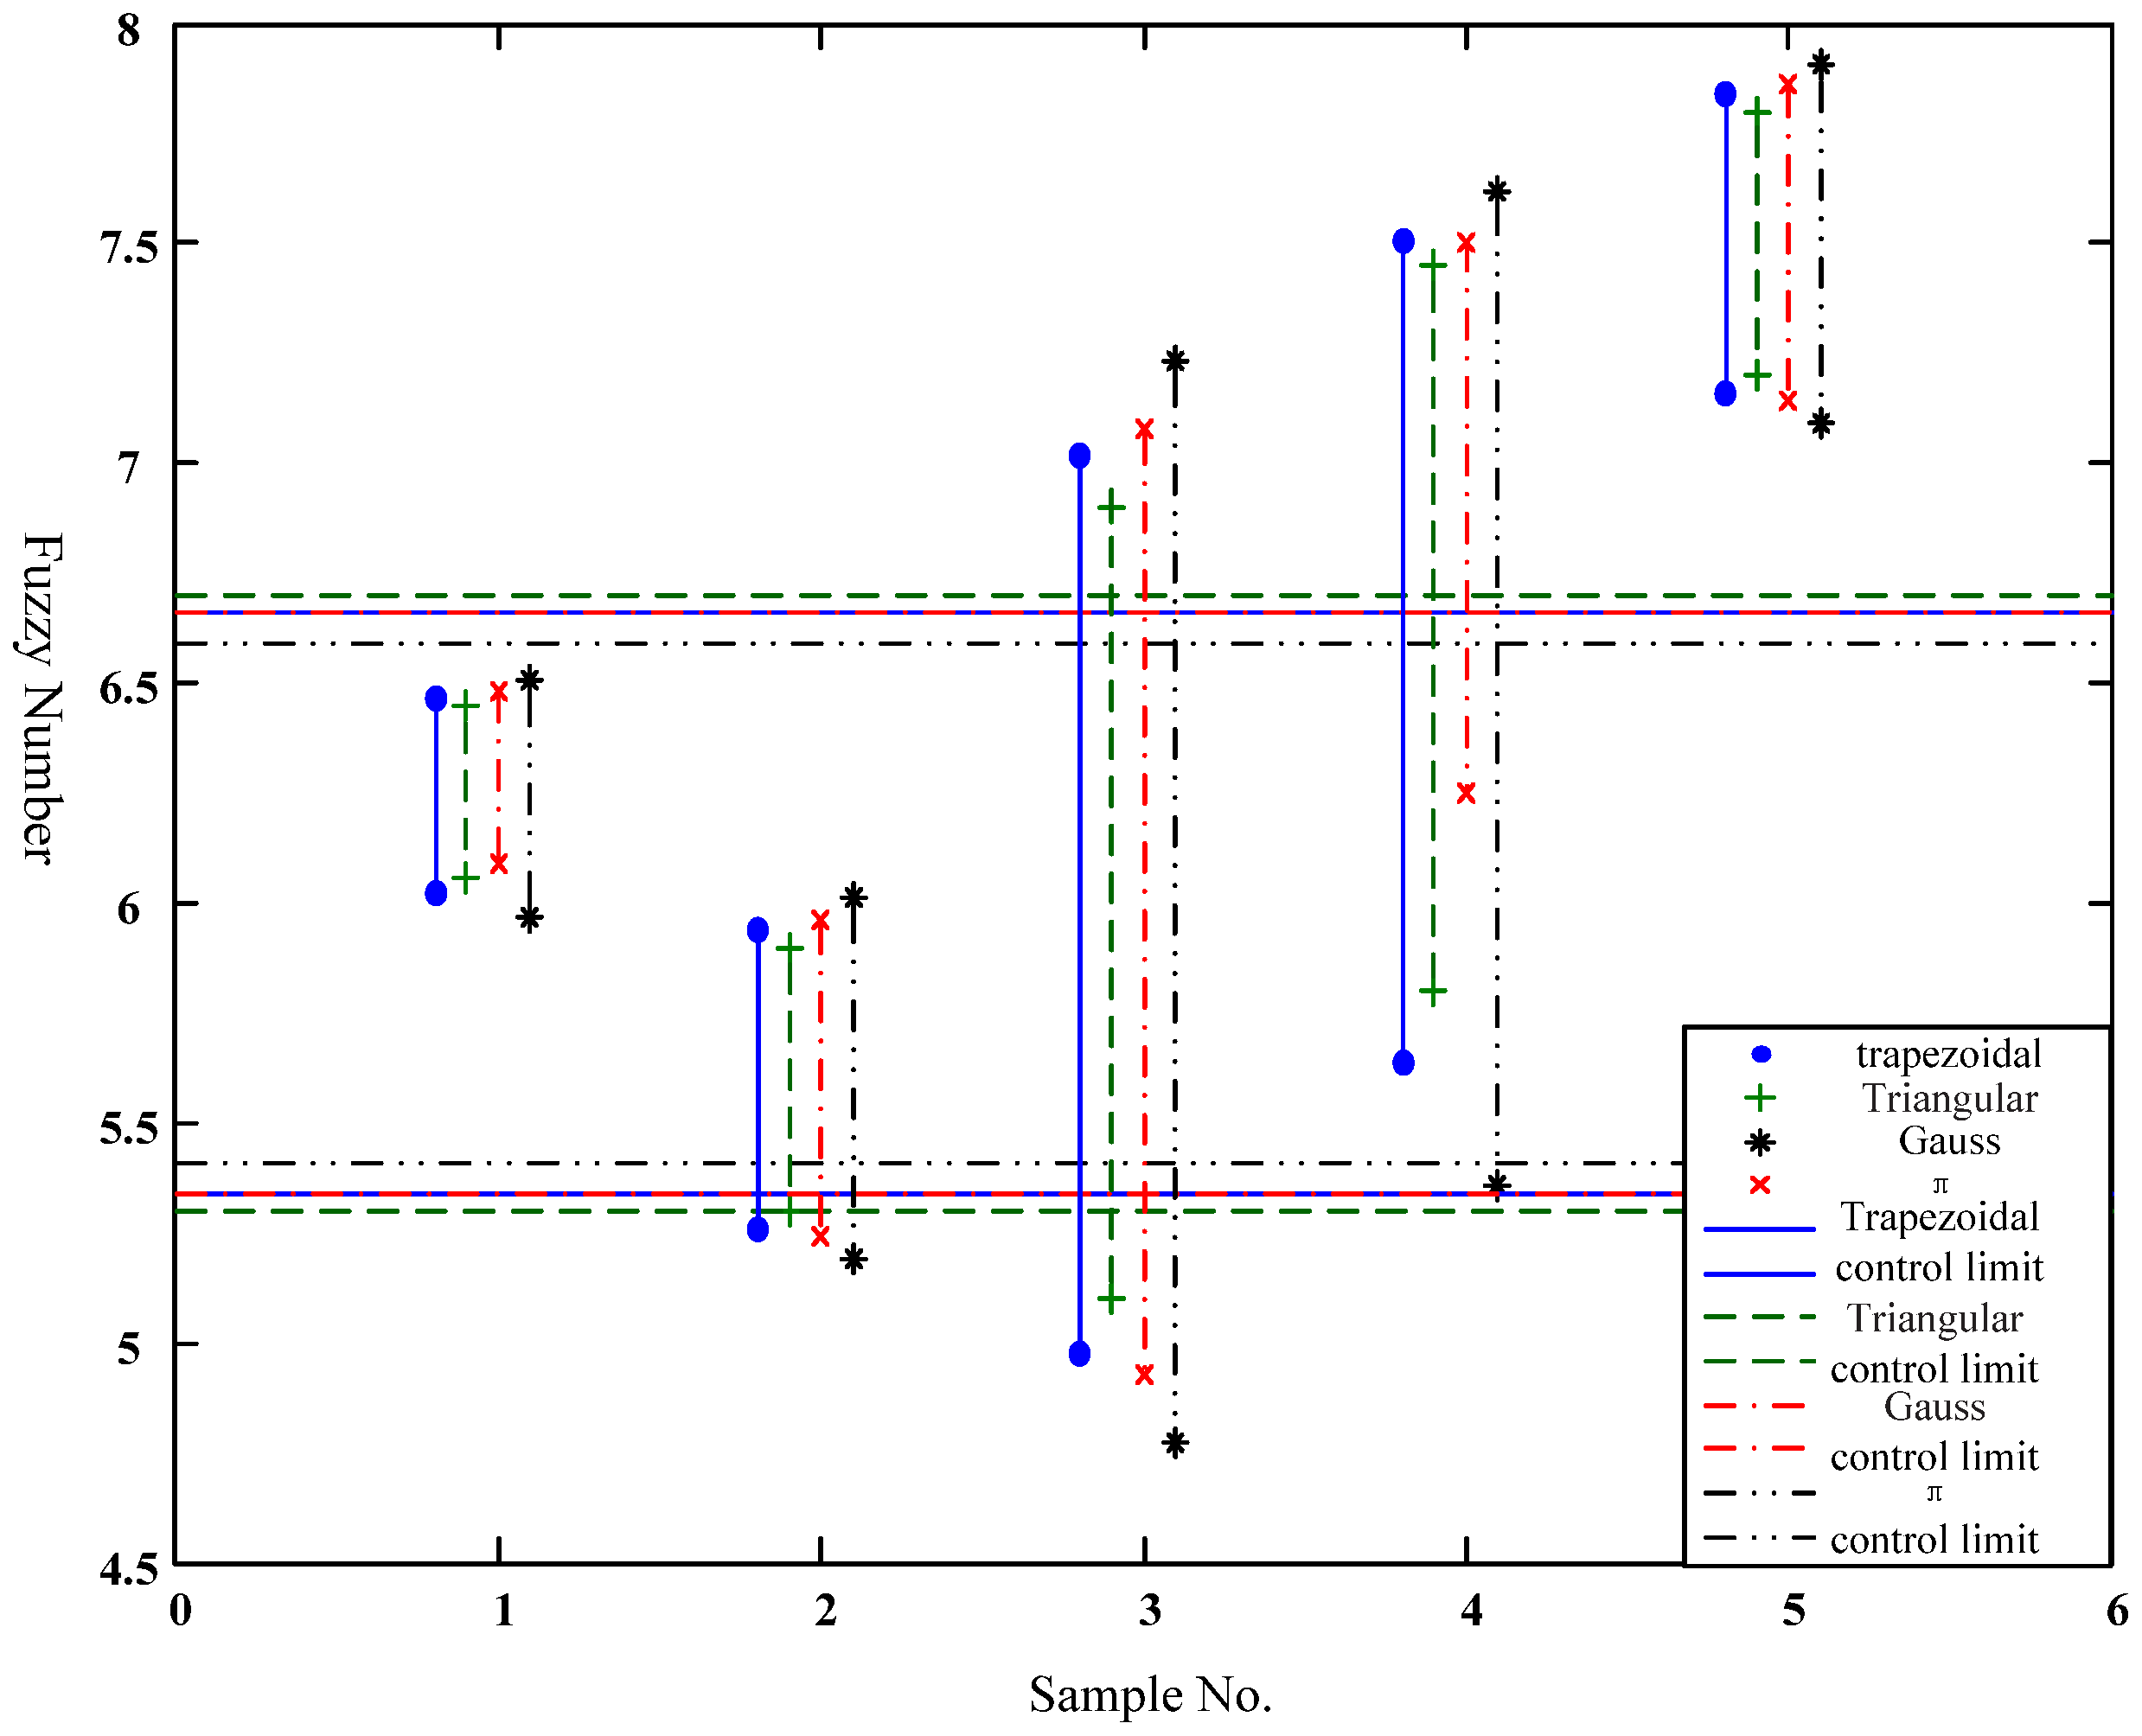
Figure 12 and Figure 13 show the difference between possibility and necessity measures of a fuzzy control chart constructed by four types of fuzzy numbers.
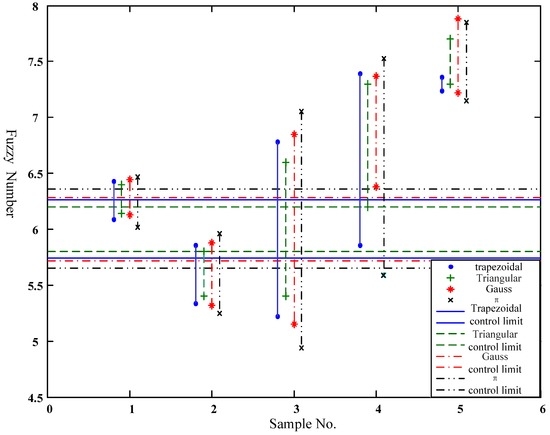
Figure 12.
Possibility measure of a control chart built by different fuzzy numbers.
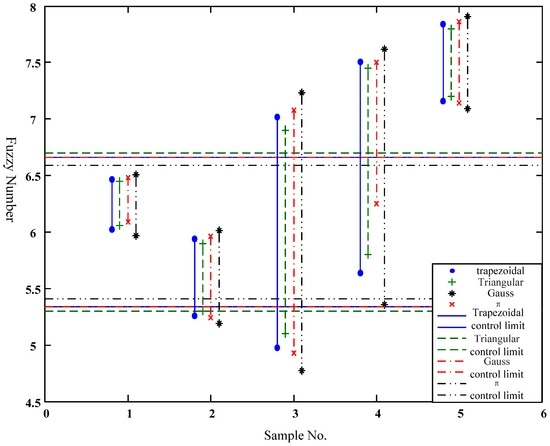
Figure 13.
Necessity measure of a control chart built by different fuzzy numbers.
The following conclusions can be drawn:
- (1)
- As for the possibility measure, triangular membership function has the narrowest control limit (i.e., the highest control level), trapezoid type takes second place, and π-type function is last.
- (2)
- As for the necessity measure, π-type function has the narrowest control limit (i.e., the highest control level), trapezoid type takes second place, and triangular-type function is last; there is no distinct difference between the trapezoid-type and Gauss-type function, and their control limits are almost overlapping. Furthermore, the control interval of each sample has little difference.
Considering the product features and quality control level, we can adopt different membership functions to construct the fuzzy number and build the control chart. Correspondingly, different combinations of functions can be used to carry out the possibility and necessity measures in order to satisfy the quality control requirement of given applications.
7. Conclusions
Focusing on the fuzzy uncertain and immeasurable product attributes, this paper proposed an approach to construct a control chart based on fuzzy score number obtained from experts’ quality scores. This approach uses actual score values to calculate the statistical parameters of a fuzzy number, and can effectively avoid the influence of a prior distortion of a predefined membership function.
Two kinds of nonconformity judging rules were proposed, and their mathematical and graphical features were also analyzed. By use of the graphical features, the process state can be judged by the distribution of the plotted data in the control chart directly, and this facilitates the popularization and application of the proposed control chart.
The influence of membership function on the control chart was analyzed. According to the results of this analysis, for quality attributes needing strict control, the triangular membership function should be selected; however, for quality attributes more loosely controlled, π-type function should be selected.
The parameters have a great influence on the effectiveness of proposed control chart. Therefore, determining the appropriate values of these two parameters for different process conditions is worth studying further.
Acknowledgments
This work was supported in part by Scientific Research Fund of Hunan Provincial Education Department (Grant No. 16B208); MOE (Ministry of Education in China) Project of Humanities and Social Sciences (Grant No. 13YJC630049), China; Natural Science Foundation of Shanxi Province (Grant No. 2013021021-2), China.
Author Contributions
Shiwang Hou, Hui Wang and Shunxiao Feng conceived and worked together to achieve this work, Shiwang Hou wrote the paper, Hui Wang and Shunxiao Feng made contribution to the case study.
Conflicts of Interest
The authors declare no conflict of interest.
References
- Gülbay, M.; Kahraman, C. An alternative approach to fuzzy control charts: Direct fuzzy approach. Inf. Sci. 2007, 177, 1463–1480. [Google Scholar] [CrossRef]
- Gülbay, M.; Kahraman, C. Development of fuzzy process control charts and fuzzy unnatural pattern analyses. Comput. Stat. Data Anal. 2006, 51, 434–451. [Google Scholar] [CrossRef]
- Gülbay, M.; Kahraman, C.; Ruan, D. α-Cut fuzzy control charts for linguistic data. Int. J. Intell. Syst. 2004, 19, 1173–1195. [Google Scholar] [CrossRef]
- Taleb, H.; Limam, M. On fuzzy and probabilistic control charts. Int. J. Prod. Res. 2002, 40, 2849–2863. [Google Scholar] [CrossRef]
- Sorooshian, S. Fuzzy Approach to Statistical Control Charts. J. Appl. Math. 2013, 19, 4499–4588. [Google Scholar] [CrossRef]
- Morabi, Z.S.; Owlia, M.S.; Bashiri, M.; Doroudyan, M.H. Multi-objective design of control charts with fuzzy process parameters using the hybrid epsilon constraint PSO. Appl. Soft Comput. 2015, 30, 390–399. [Google Scholar] [CrossRef]
- Grzegorzewski, P.; Hryniewicz, O. Soft methods in statistical quality control. Control Cybern. 2000, 29, 119–140. [Google Scholar]
- Hsieh, K.L.; Tong, L.I.; Wang, M.C. The application of control chart for defects and defect clustering in IC manufacturing based on fuzzy theory. Expert Syst. Appl. 2007, 32, 765–776. [Google Scholar] [CrossRef]
- Tannock, J.D.T. A fuzzy control charting method for individuals. Int. J. Prod. Res. 2003, 41, 1017–1032. [Google Scholar] [CrossRef]
- Shu, M.H.; Wu, H.C. Fuzzy and R control charts: Fuzzy dominance approach. Comput. Ind. Eng. 2011, 61, 676–685. [Google Scholar] [CrossRef]
- Gildeh, B.S.; Shafiee, N. X-MR control chart for autocorrelated fuzzy data using Dp,q-distance. Int. J. Adv. Manuf. Technol. 2015, 5, 1047–1054. [Google Scholar] [CrossRef]
- Zarandi, M.H.F.; Alaeddini, A.; Turksen, I.B. A hybrid fuzzy adaptive sampling—Run rules for Shewhart control charts. Inf. Sci. 2008, 178, 1152–1170. [Google Scholar] [CrossRef]
- Sentürk, S.; Erginel, N.; Kaya, I.; Kahraman, C. Fuzzy exponentially weighted moving average control chart for univariate data with a real case application. Appl. Soft Comput. 2014, 22, 1–10. [Google Scholar] [CrossRef]
- Faraz, A.; Shapiro, A.F. An application of fuzzy random variables to control charts. Fuzzy Sets Syst. 2010, 16, 2684–2694. [Google Scholar] [CrossRef]
- Fernández, M.N.P.; García, A.C.; Barzola, O.R. Multivariate multinomial control chart using fuzzy approach. Int. J. Prod. Res. 2015, 53, 2225–2238. [Google Scholar] [CrossRef]
- Ghobadi, S.; Noghondarian, K.; Noorossana, R. Developing a fuzzy multivariate CUSUM control chart to monitor multinomial linguistic quality characteristics. Int. J. Adv. Manuf. Technol. 2015, 79, 1893–1903. [Google Scholar] [CrossRef]
- Alipour, H.; Noorossana, R. Fuzzy multivariate exponentially weighted moving average control chart. Int. J. Adv. Manuf. Technol. 2010, 48, 1001–1007. [Google Scholar] [CrossRef]
- Jamison, K.D.; Lodwick, W.A. The construction of consistent possibility and necessity measures. Fuzzy Sets Syst. 2002, 132, 1–10. [Google Scholar] [CrossRef]
- Zadeh, L.A. Fuzzy sets as a basis for a theory of possibility. Fuzzy Sets Syst. 2002, 100, 9–34. [Google Scholar] [CrossRef]
- Dubois, D.; Prade, H. Ranking fuzzy numbers in the setting of possibility theory. Inf. Sci. 1983, 30, 183–224. [Google Scholar] [CrossRef]
© 2016 by the authors; licensee MDPI, Basel, Switzerland. This article is an open access article distributed under the terms and conditions of the Creative Commons Attribution (CC-BY) license (http://creativecommons.org/licenses/by/4.0/).

