Article

Clayey Soil Strength Improvement by Using Alkali Activated Slag Reinforcing

by
Darius Žurinskas
,
Danutė Vaičiukynienė
*,
Gediminas Stelmokaitis
* and
Viktoras Doroševas
Faculty of Civil Engineering and Architecture, Kaunas University of Technology, LT-51367 Kaunas, Lithuania
*
Authors to whom correspondence should be addressed.
Minerals 2020, 10(12), 1076; https://doi.org/10.3390/min10121076
Submission received: 11 November 2020 / Revised: 26 November 2020 / Accepted: 27 November 2020 / Published: 30 November 2020
(This article belongs to the Special Issue Geopolymers, Volume II)

Abstract

:
There are many studies related to using alkali activated binders for the improvement of clayey soil mechanical properties. In this study, alkali activated slag (AAS) for the improvement of clayey soil strength was used and it reinforced the clay. This paper presents results of an investigation on the utilization of ground-granulated blast-furnace slag in the reinforcement of clay soils. Therefore, significant cost savings could be achieved by using alkali activated slag as binding material. These samples were analyzed by X-Ray fluorescence analysis (XRF), X-Ray diffraction (XRD), scanning electron microscopy (SEM) and strength tests after the curing. The clay samples reinforced with AAS showed higher shear stress, cohesion and internal friction angle compared with the samples without reinforcement. The highest shear strength was achieved by using the highest amount of AAS (30%). This shear stress of the unreinforced clay samples could be increased from 63.2 to 137.4 kPa (117.4%) and from 123.2 to 257.4 kPa (108.9%) when the normal stress value of 100 and 500 kPa was used, respectively. The increase in shear strength is closely related to the compact contact zone between AAS and clay. Moreover, the new formed cementitious compounds of AAS had a positive influence on the shear strength of samples as well.

1. Introduction

Research papers contain a lot of descriptions of soil strengthening studies using stabilizers (binders), such as fly ash, blends of calcium carbide residue and fly ash, ground-granulated blast-furnace slag (GGBFS), geopolymers or alkali activated binders. There are many studies on soil stabilization works with different types of stabilizers and their compositions, their properties, dimensions, and experimental methodology. Successful research by some scientists has confirmed the fact that fly ash can improve clay soils [1]. Kampala et al. [2] revealed that the addition of fly ash increases the strength of clay soil. It was found that the optimum amount of fly ash is about 20% and that, with further increases in the content of fly ash, soil strength was almost constant. In this case, the blend of calcium carbide residue and fly ash was used. Horpibulsuk et al. [3] produced similar results with a mixture of calcium carbide residues and fly ash. They also claimed that their blend was better suited to soil stabilization than Portland cement. Previous studies [4,5,6] showed that the strength of clay soils was increased by the addition of ground-granulated blast-furnace slag (GGBFS). The values of soil strength may vary depending on the type of GGBFS activator [4,6].
It is possible to improve the strength of clay soil by using geopolymers or alkali activated materials. These materials could replace ordinary Portland cement (OPC) in several geotechnical engineering positions. Alkali activated binders have some advantages compared to OPC binders. Alkali activated materials (based on waste) have much lower harmful emissions and energy consumption. Abdullah et al. [7] performed the experiment related to the stabilization of clay soils with geopolymer. The unconfined compressive strength significantly increased by using the addition of geopolymer. It is important to note that the heterogeneity of clay soils and the soil mineralogy has a major impact on the interaction between clay and geopolymer. Zhang et al. [8] investigated low plasticity clay, which was stabilized with metakaolin-based geopolymers. The results of the study showed that with increasing geopolymer filler concentrations, the compressive strength, Young’s modulus and failure strain increased, and shrinkage strains decreased in the stabilized soil samples. According to SEM and XRD analysis, the metakaolinic geopolymer gels formed. This stabilization method increased the mechanical properties and volume stability of the investigated soil. Previous studies [9] show that to it is possible to consolidate pozzolana incoherent soils by using geopolymerization treatments. In addition, uniaxial strength values achieved 40 MPa for the alkali activated samples. In another study [10], alkali activated fly ash was used for the improvement of soft soils. The grout for soil mixing reached up to 26.4 MPa after 90 days. Cristelo et al. [11] used fly ash for soft soil stabilization. They concluded that it was better to use low calcium fly ash for long-term soft soil improvement compared with high calcium fly ash. Abdeldjouad et al. [12] presented the study related to the amount of clay in alkali activated soil during stabilization. The use of a higher amount of kaolinite content with palm oil fuel ash had influence on the higher strength values of soil samples.
Alkali activated blast-furnaces slags were applied for the strength improvement of clayed soil. By using alkali activated slag systems, good engineering properties were reached. Yi et al. [13] stabilized a marine soft clay with alkali activated GGBFS. It was determined that the highest unconfined compressive strength was reached for the binder of marine soft clay made from Na2SO4, carbide slag and GGBFS. The values of unconfined compressive strength were two times higher than OPC and stabilized this clay. Mozumder et al. [14] stated that alkali activated GGBFS could be used for the stabilization of clayey soil and it had significantly higher strength then alkali activated fly ash, which was used for clayey soil as well. Yi et al. [15] used two types of granulated furnace slag geopolymers for a soft clay stabilization. It was concluded that the geopolymers based on granulated furnace slags (activated with CaO and MgO) could be possibly used for soft clay stabilization. A soil–geopolymer system was studied by Singhi et al. [16]. They stated that the unconfined compressive strength of the soil–geopolymer system was affected by the slag content which is the most significant factor. The geopolymer based on blast-furnace slag is a binder which could have a high strength at room temperature. Davari et al. [17] investigated the influence of alkali activated slag on the main properties of clayey soil. It was concluded that the most significant factor was the weight ratio of alkaline solution and slag. The slag amount of 15% wt and sodium hydroxide concentration of 6 M was recommended as optimal values.
However, previous studies show that the strength of soils for clay is increased by using the addition of materials rich in aluminum and silicon such as ashes, slags, and OPC with alkali activation. Clayey soils were mixed with activator solutions and some amount of aluminosilicate materials was added to them. Subsequently, the samples were prepared and their main properties were determined. The present study aimed to characterize the clayey soil samples with strength improvement by using the alkali activated GGBFS reinforcing method.

2. Methodology

2.1. The Experimental Techniques

The mineral composition of initial materials such as raw clay, GGBFS and phosphogypsum were determined by using X-Ray diffraction (XRD) analysis. The same method was used to evaluate the mineral composition of alkali activated slag (AAS) pastes and the contact zone between clay and AAS after 7 days. XRD was carried out by using X-Ray powder diffraction analysis. Data were collected by DRON-6 X-Ray diffractometer (Bruker AXS, Karlsruhe, Germany) with Bragg–Brentano geometry using Ni-filtered Cu K radiation and graphite monochromator, operating with the voltage of 30 kV and an emission current of 20 mA. The step-scan covered an angular range of 2–70° in steps of 2θ = 0.02°. The powder X-Ray diffraction patterns were identified with the references available in the PDF-2 data base [18].
The chemical composition of GGBFS and phosphogypsum was evaluated by using X-Ray fluorescence spectrometry (XRF) analysis. For this purpose, a Bruker X-Ray S8 Tiger WD (Bruker AXS, Karlsruhe, Germany) using a rhodium (Rh) tube, an anode voltage Ua up to 60 kV, and an electric current I up to 130 mA were used. The compressed samples were measured in a helium atmosphere [19]. The loss on ignition of phosphogypsum was calculated by using calcination at the temperature of 400 °C.
Finally, for the evaluation of the microstructure of a contact zone between clay and AAS, scanning electron microscopy (SEM) analysis was used. The microstructural investigations of hte contact zone of clay and alkali activated GGBFS paste was performed using a high-resolution scanning electron microscope ZEISS EVO MA10 (Carl Zeiss Microscopy Deutschland GmbH, Jena, Germany) [20]. The resolution of the images (of secondary electrons in a high vacuum) of this microscope is at least 3 nm with 30 kV and at least 10 nm with 3 kV. In the performed analysis, the acceleration voltage was 5 kV.
The Atterberg limits (plastic limit, PL and liquid limit, LL) were found for determining the clay plasticity index according to LST EN ISO 17892-12:2018 [21]. The water content at which the clay changed from one state to the other is known as the consistency limits of Atterberg’s limit. The plasticity index (PI) is the difference between the liquid limit and the plastic limit (PI = LL−PL) [21]. The consistency index Ic indicates the consistency (firmness) of the soil [22].
Standard Proctor compaction test results of clay were performed accordingly [23]. The dry clayey soils were initially mixed with the predetermined quantity of water (15%; 18%; 21%; 24%; 27%; 30%; 33%). Initial mixing was carried with hands. The moist clay was subsequently put into sealed plastic bags and stored in the room (20 ± 1 °C, 96% ± 2% RH) for 20–24 h. After that, all clay samples were processed with the Standard Proctor test LST EN 13286-2:2010/AC:2013 [23] to determine the optimum moisture content and maximum density.
All clay samples were consolidated to the optimum Proctor value, determined by testing the original clay samples. This test was performed with a consolidometer. When the maximum density by Standard Proctor test was achieved, then stress was determined. The clay samples with the optimal moisture content were prepared and stored in sealed plastic bags for 12 h in room conditions. This test was performed with a consolidometer, for which stress determines when the maximum density by Standard Proctor test was achieved. All the consolidometer’s samples were put inside sealed plastic bags and were kept for 12 h under pressure.
The direct shear test was performed on three specimens from the soil sample. A specimen was placed in a shear box that has two stacked rings to hold the sample. Confining stress was applied vertically to the specimen, and the upper ring was pulled laterally until the sample failed, or through a specified strain. Cylindrical samples’ (∅ = 71.4 mm, H = 35 mm) cross-section displacement of criterion with ε = 10% was adopted. Several specimens were at varying confining stresses (normal stress 100, 300, 500 kPa) to determine the shear stress parameters, the soil cohesion (c), and the angle of internal friction [24].

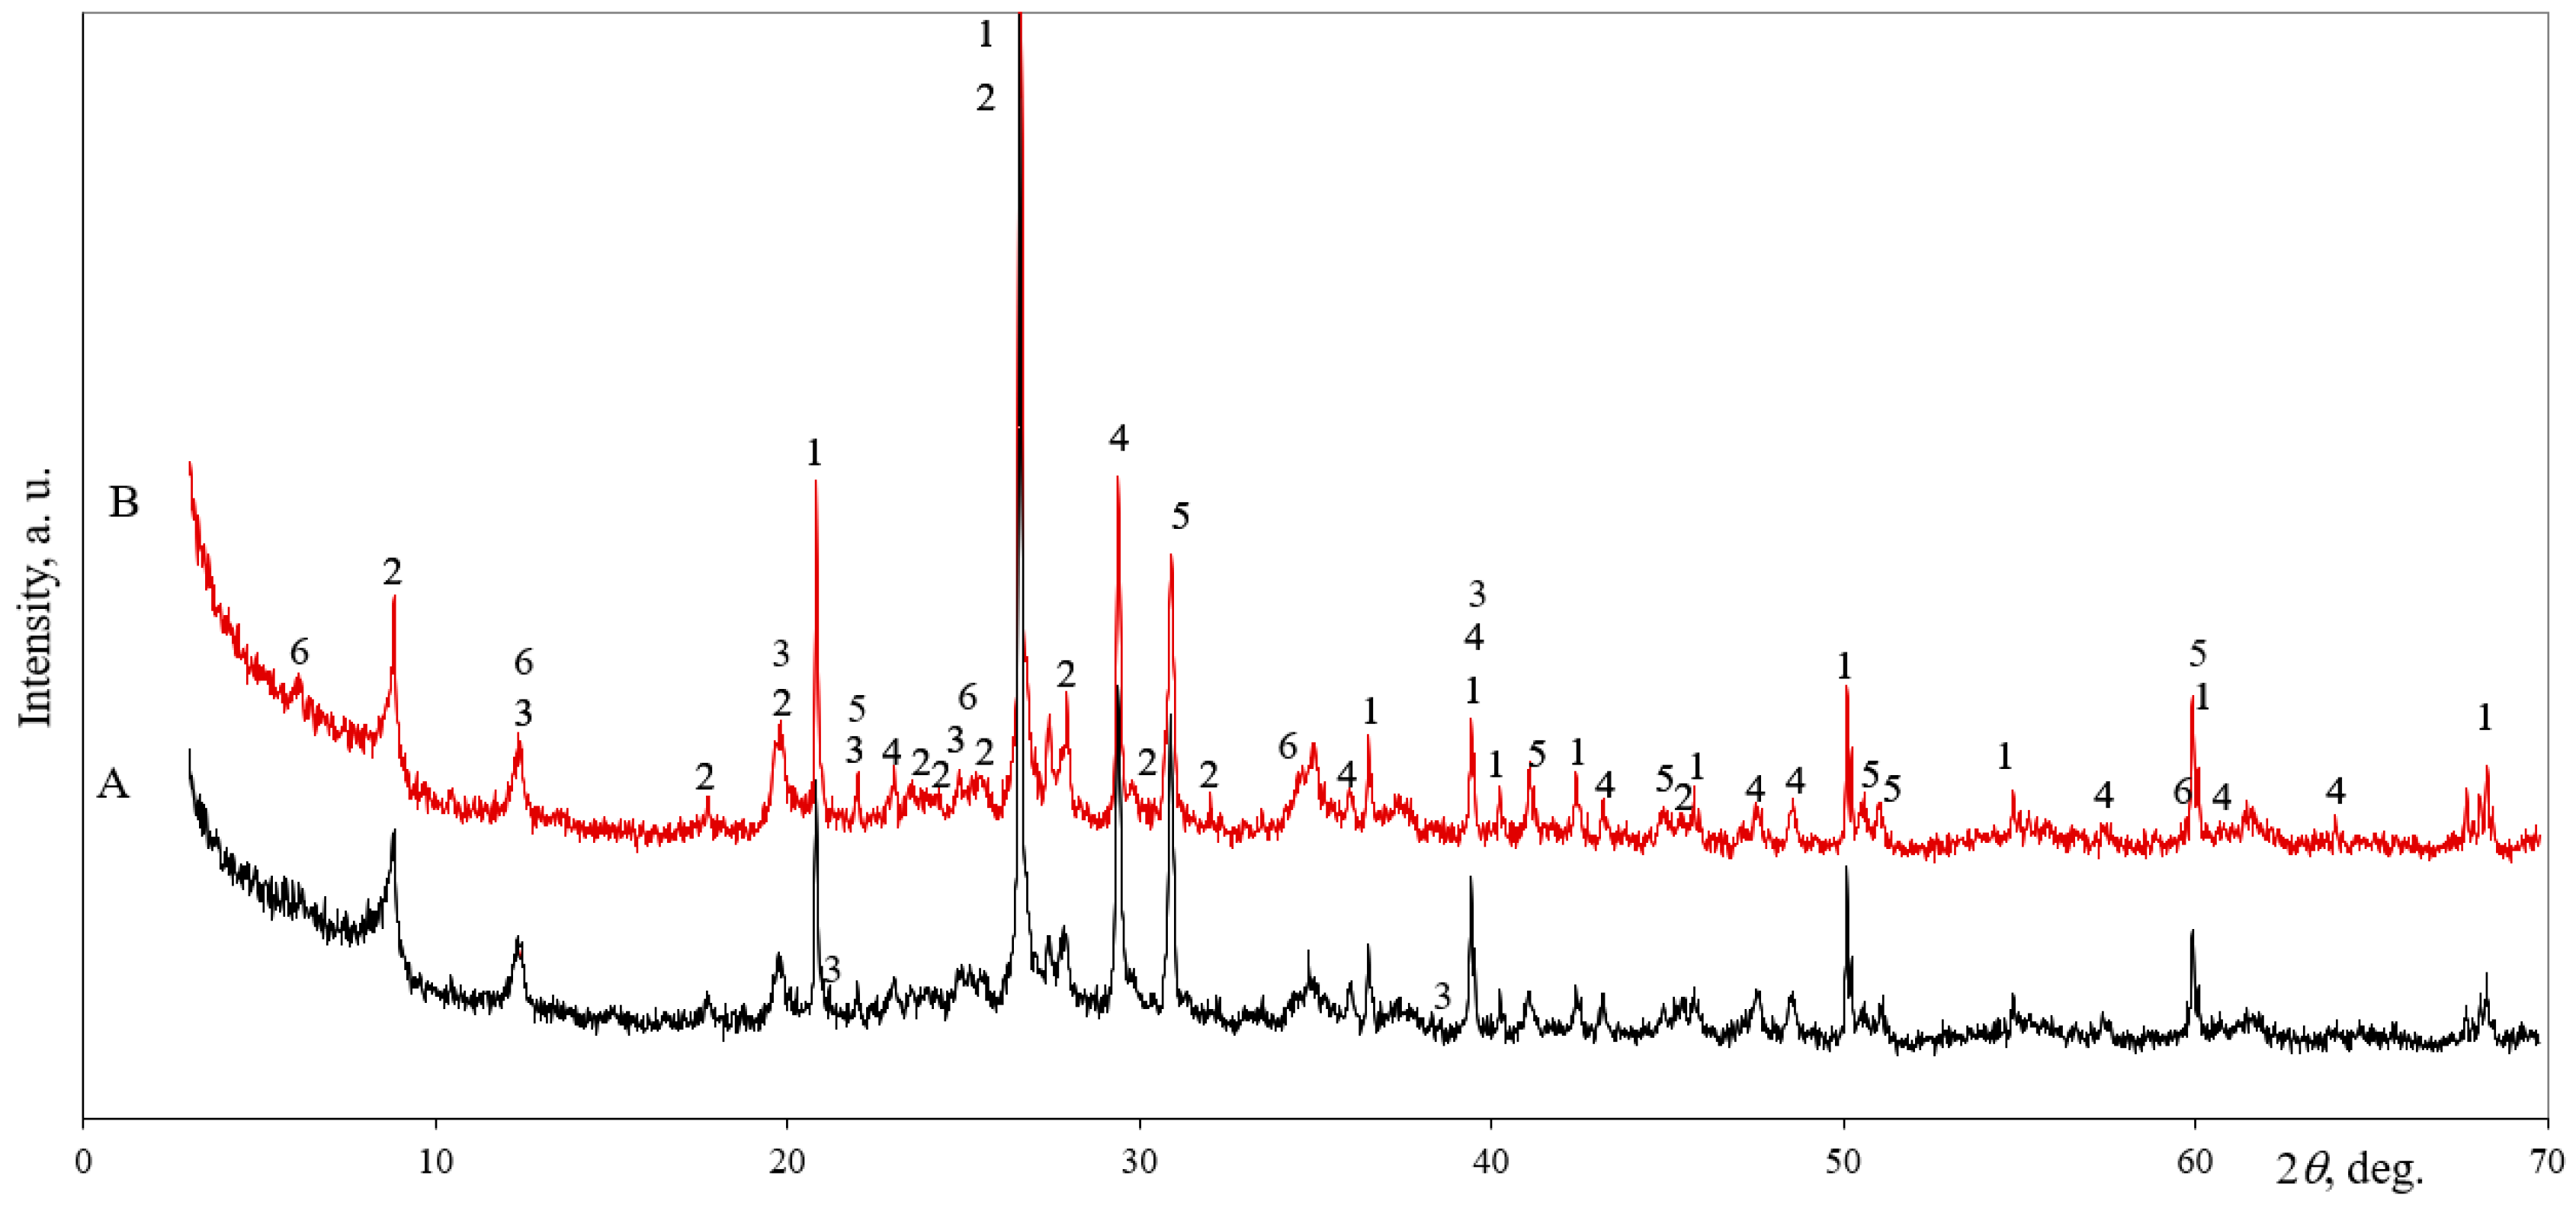
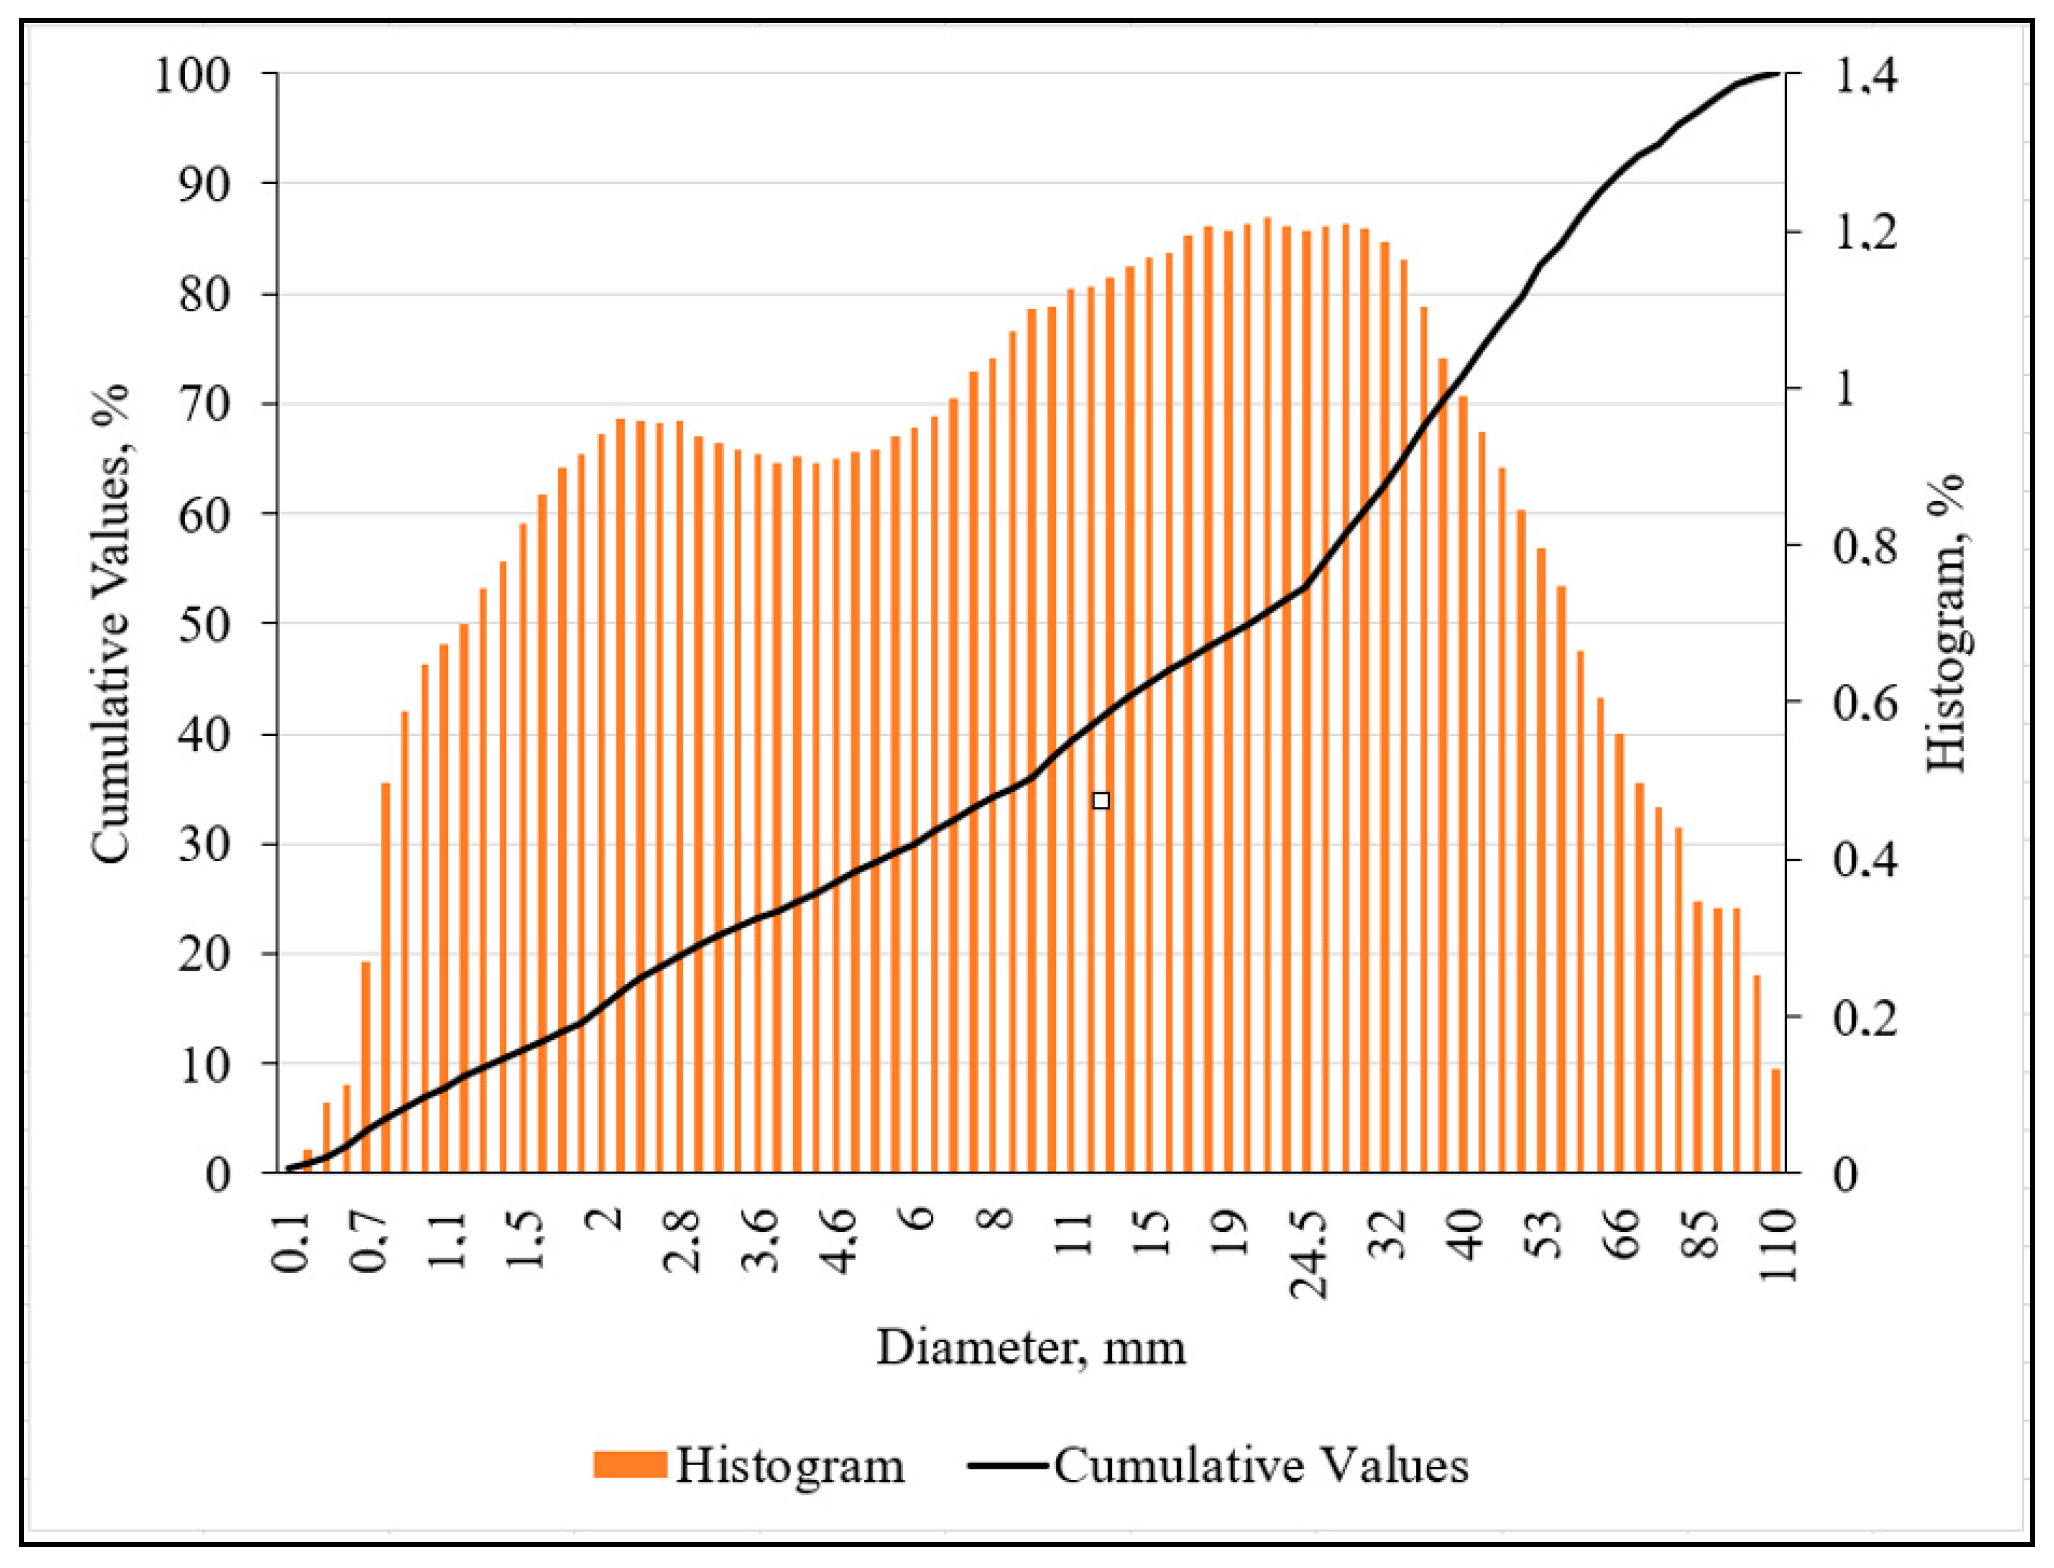
2.2. The Characterization of Raw Clay

For this study, clayey soil was used from a local quarry in Lithuania and its mineral composition is shown in Figure 1. According to XRD analysis, this clay was mainly composed of illite (d-spacing—1.000, 0.502, 0.334, and 0.201 nm), kaolinite (d-spacing—0.716, 0.436, 0.418, 0.357, and 0.237 nm), quartz (d-spacing—0.334, 0.425, 0.182, and 0.154 nm), calcite (d-spacing—0.304, 0.249, 0.228, 0.191, and 0.187 nm) and dolomite (d-spacing—0.289, 0.219, 0.202, 0.181, and 0.178 nm) [25]. There were traces of chlorite (d-spacing—1.417, 0.708, 0.354, 0.261, and 0.155 nm) as well (Figure 1, curve A).
The particles of clay powder were in the range of 0.1–110 μm (Figure 2). The mean diameter of the clay powders was 15.80 µm. In the histogram, two peaks were detected. The first of peak formed at 2.20 µm with 0.96% and the second peak formed at 21.5 µm with 1.22% calculated of all particles in the histogram.
The variations of the Atterberg’s limits (the cone penetrometer method was used) of the clay are given in Table 1. The plasticity index (PI) is a measure of the plasticity of a clay and according to the value of PI (21.72%) this clay could be assigned to highly plastic soils. The PI is (>17)—indicating a highly plastic soil [22].

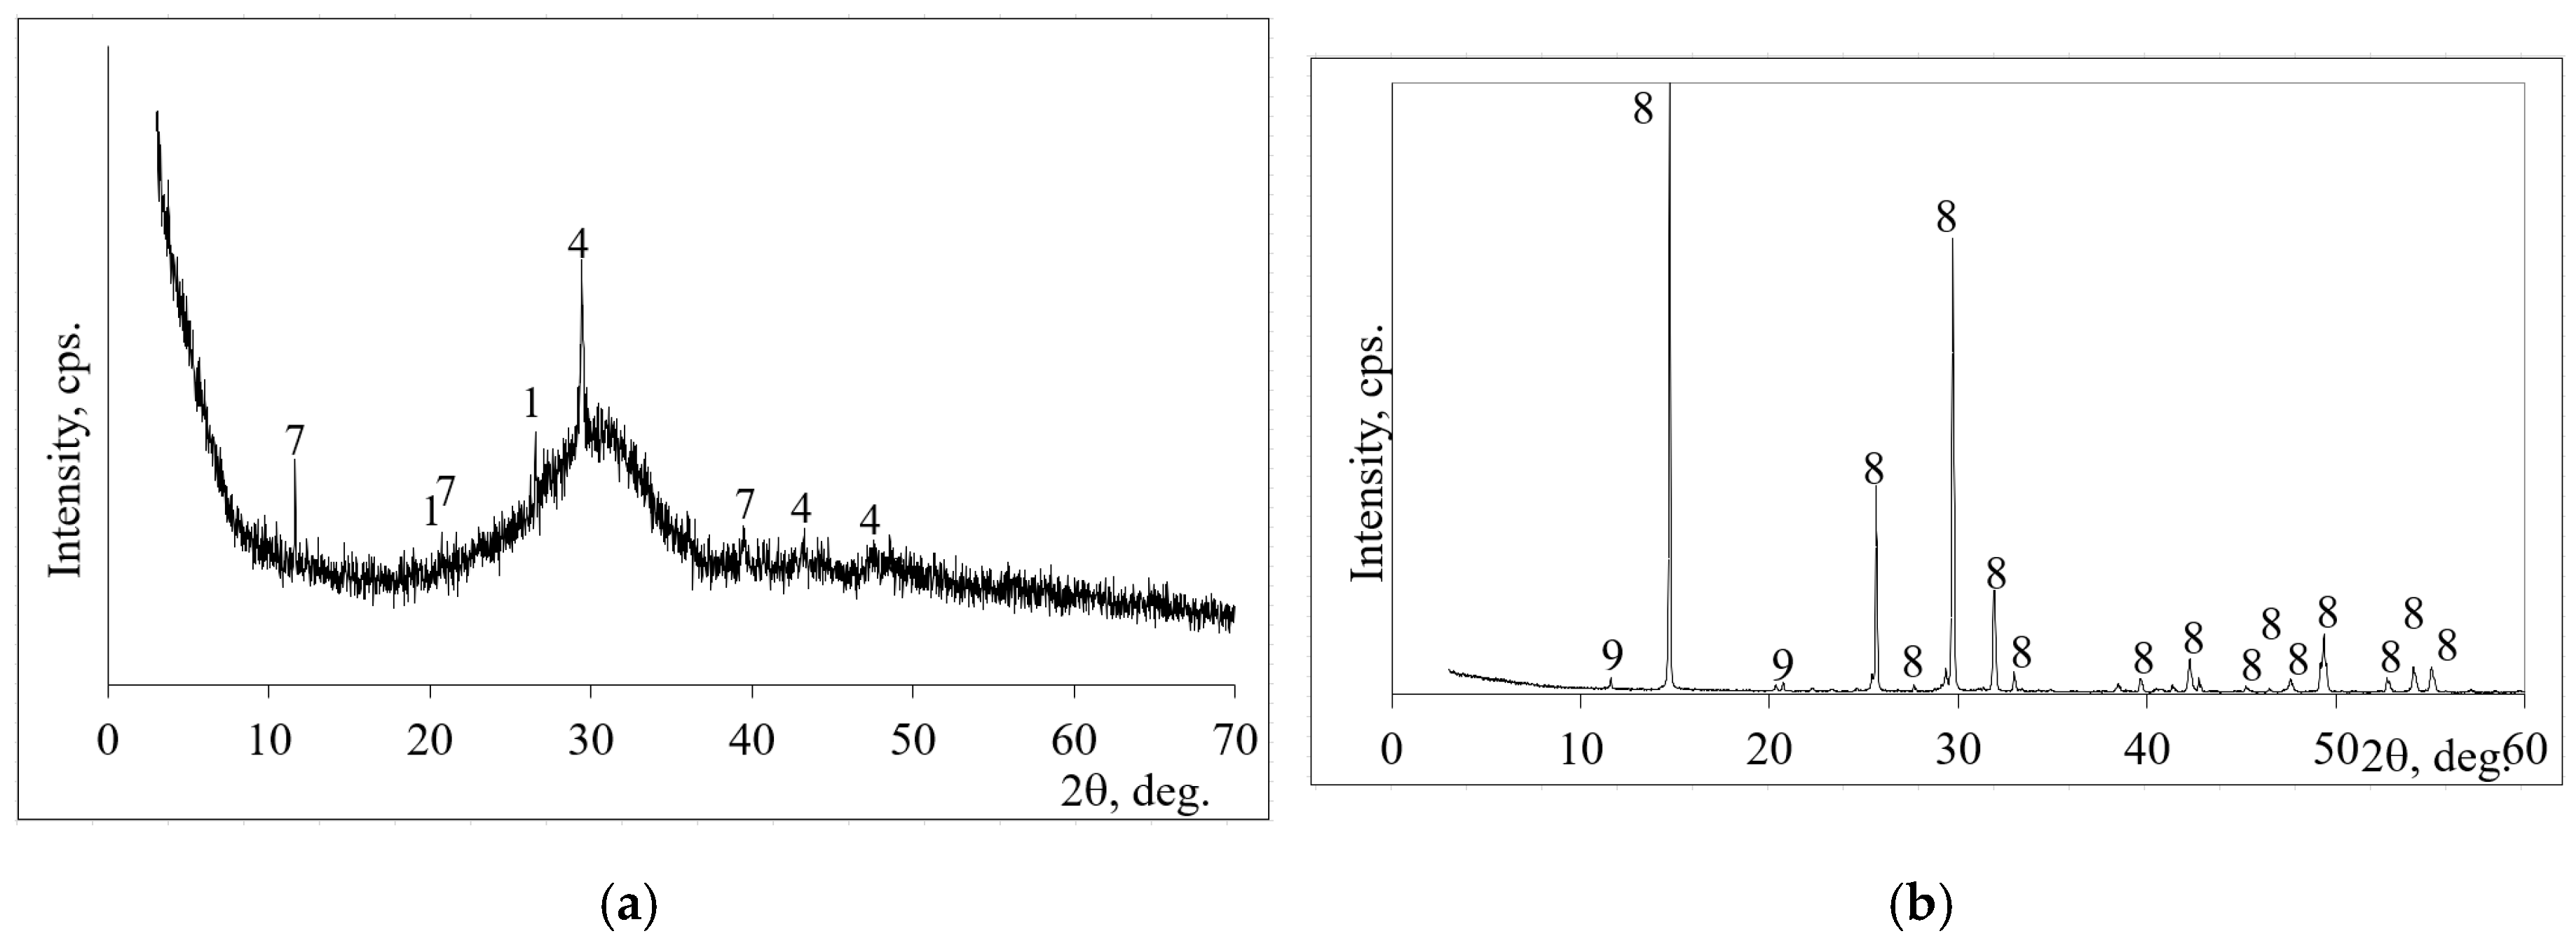
2.3. The Characterization of Initial Materials for the Alkali Activated Binder

For the preparation of binder alkali, activated GGBFS was used. As aluminosilicate precursor was used, GGBFS, and its oxygen composition is shown in Table 2. In this slag, CaO and SiO2 dominated. The total amount of these oxides constituted 82.3%. There are Al2O3 and MgO with the traces of Na2O, P2O5, K2O and TiO2.
In this binder, the addition of phosphogypsum was used. This additive is quite frequently used in alkali activated binders and enhances the geopolymerization process when it is added in low doses [26,27]. According to the chemical composition in phosphogypsum-dominated CaO and SO3 (Table 2). It mainly consists of calcium sulphate semihydrate (LOI = 6.40%). In phosphogypsum, there are traces of SiO2, Al2O3, MgO, P2O5 and F [28].
XRD analysis was used to evaluate the mineral composition of GGBFS (Figure 3a). This aluminosilicate precursor is the mixture of crystalline and amorphous material. The crystalline compounds are calcite (d-spacing—0.304, 0.249, 0.228, 0.191, and 0.187 nm), hydrotalcite (d-spacing—0.769, 0.388, and 0.230 nm) and quartz (d-spacing—0.334, 0.425, 0.182, and 0.154 nm). The amorphous part could be assigned as the hill in the range of 20–38° on XRD curve within 2θ degree.
Phosphogypsum is the crystalline materials and according XRD basanite (d-spacing—0.600, 0.3470, 0.301, 0.281 and 0.214 nm) dominated in this material (Figure 3b). Only small amount of brushite (d-spacing—0.761, and 0.428 nm) possible to detect in phosphogypsum.
The mixture of initial materials is shown in Table 3. These quantities of alkali activated GGBFS binder were selected due to a previous study [27].
The aluminosilicate precursor was made from GGBFS and as an activator, sodium hydroxide solution was used. The phosphogypsum was incorporated in this mixture as well, as the accelerator of geopolymerization. First, the powder of GGBFS and phosphogypsum were carefully mixed and after that, the mixtures were filed with sodium solution. The paste was mixed again in order to obtain a homogeneous mass.

2.4. The Procedures for Samples Preparation

Clay was mixed with the predetermined optimum quantity of water at the Standard Proctor test. The compaction pressure of clay was obtained from the test with the consolidometer. Clay density received from the confirmation test with consolidometer. The sealed plastic bags were used for all sample’s preparation stages for the protection of water evaporation.
The five groups with nine samples in each group were prepared as cylindrical samples (∅ = 71.4 mm, H = 35 mm) (Table 4).
Each group had a different number of drilled piles (∅ = 10 mm). The first group was without piles; the second group—3 piles; the third group—6 piles, etc. (Figure 4). Inside drilled holes were filled with AAS paste carefully (from bottom to top). The samples were sealed with plastic bags and left for 7 days as a curing period at ambient temperature. In this study, the samples were cured for 7 days and the curing time is close related with the compressive strength development of alkali activated binders. Several works [29,30] have been conducted on the compressive strength development of alkali activated binders. Atiş et al. [29] reported that after 7 days of hardening, the compressive strength of alkali activated slag increased from 69% to 89% over 28 days. Similar results were obtained by Dadsetan et al. [30]. After 7 days and after 28 days of hardening, the similar values of compressive strengths were obtained for metakaolin-based geopolymer samples.
After that, a non-consolidated direct shear test was performed [24].

3. Results and Discussion

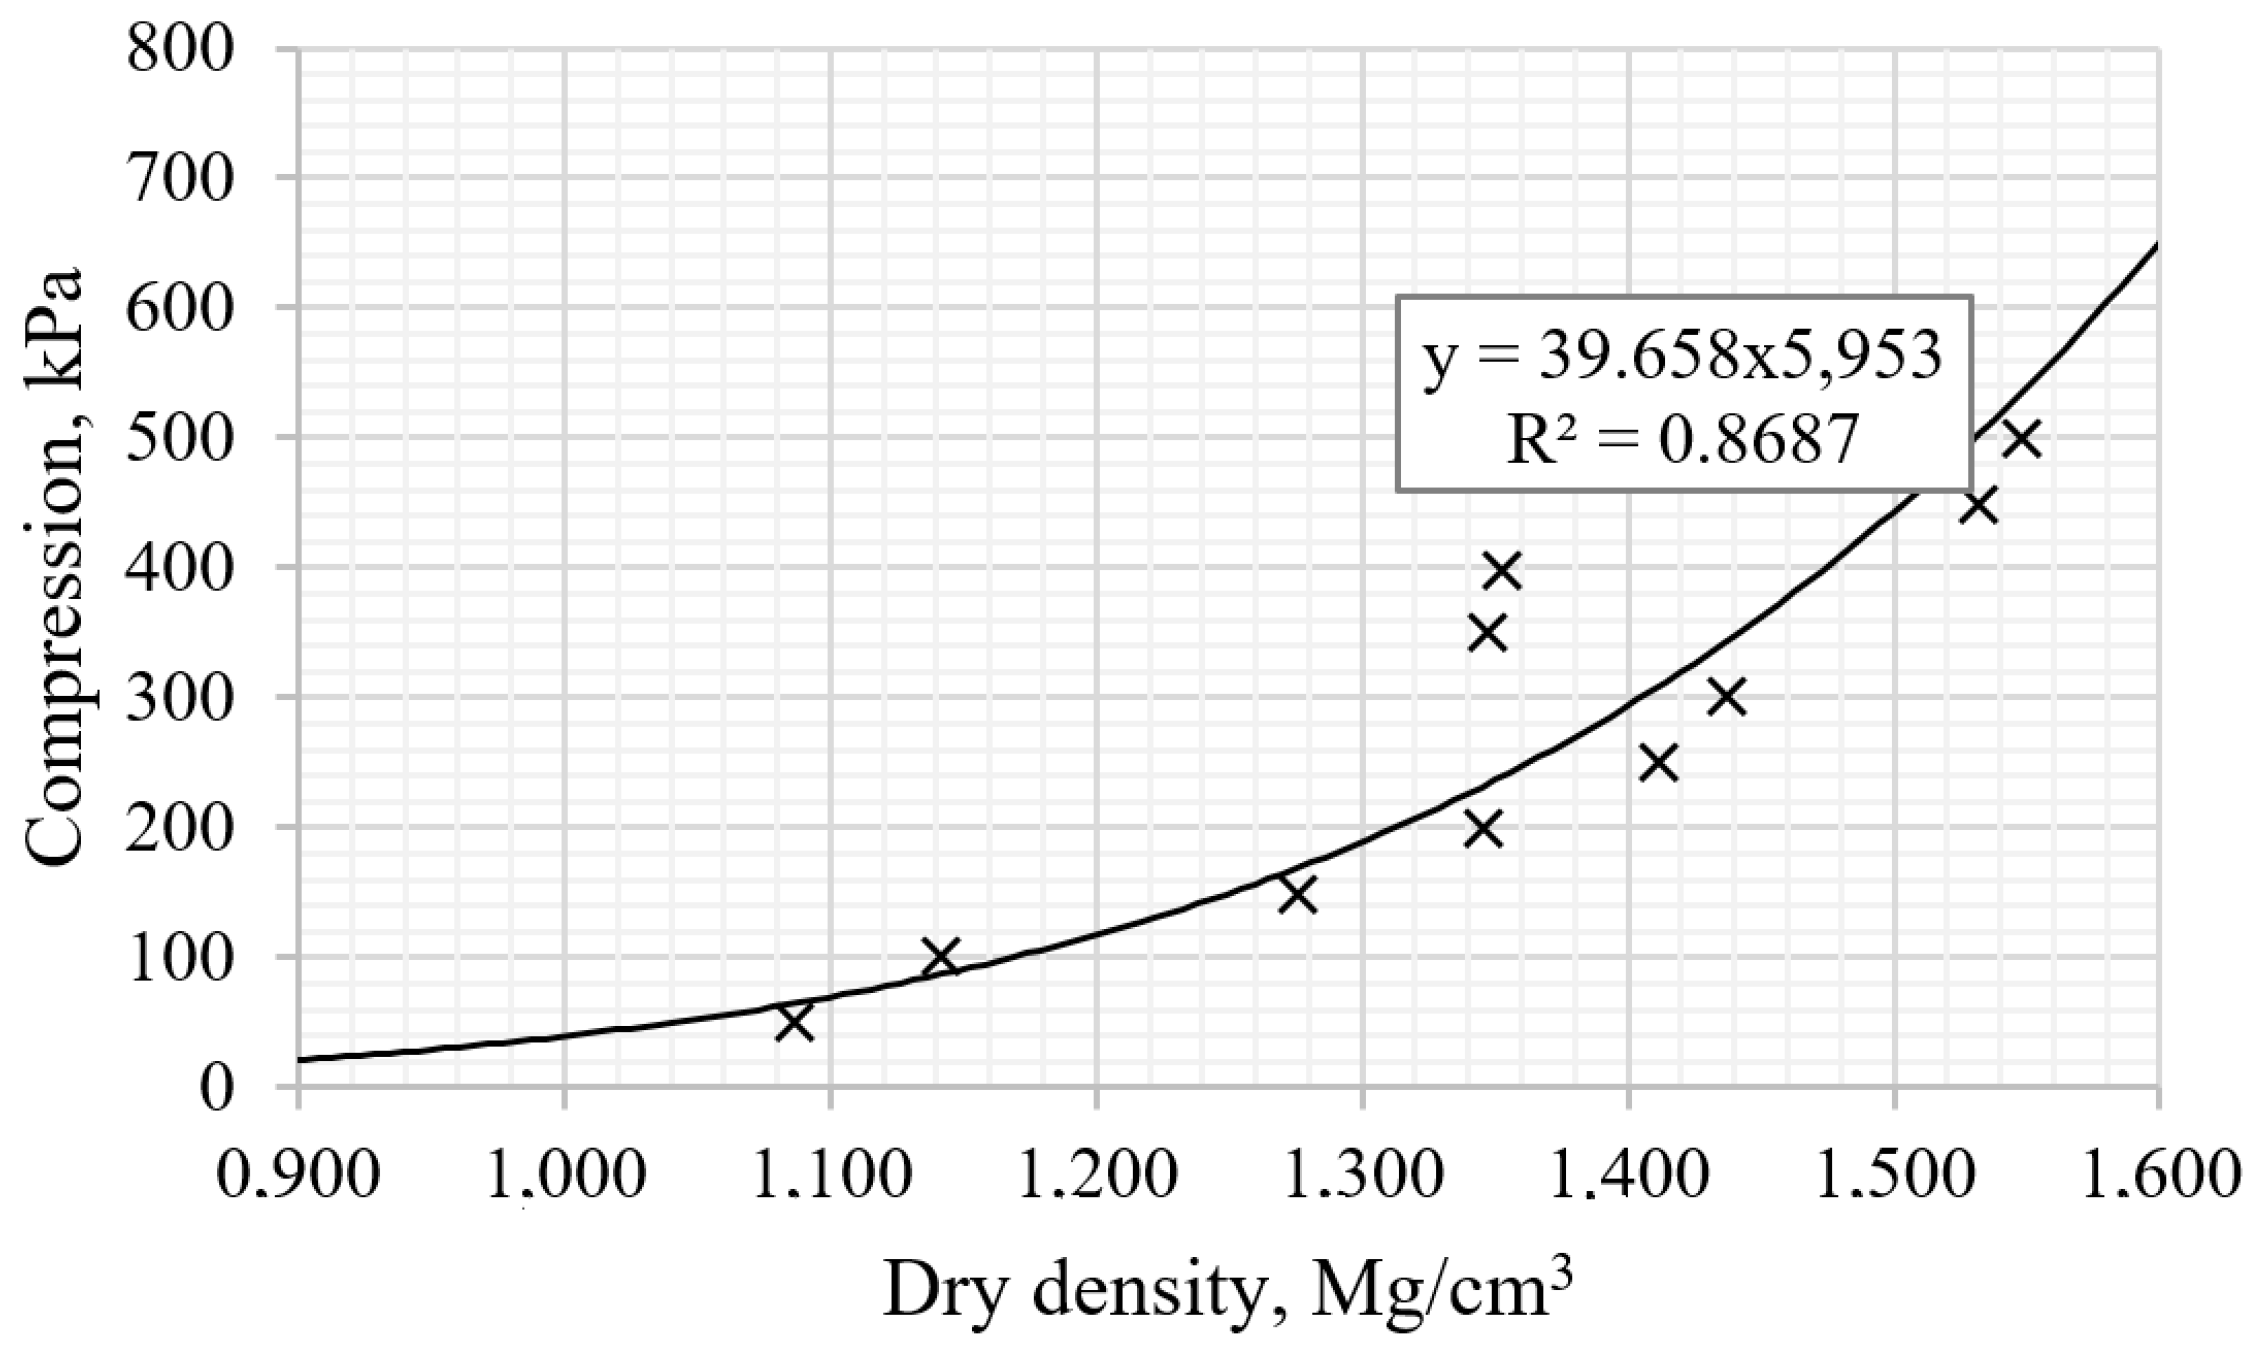
3.1. Standard Proctor Compaction Tests and Consolidation Test of Clay

The results of Standard Proctor compaction tests were obtained according to LST EN 13286-2. These measurements were performed for clay in terms of the mix’s initial moisture content, i.e., calculated from the amount of added water and of the measured moisture content from the samples taken from the ground clay specimen. It was determined that the optimal moisture content of clay was 24.4% and the maximal density (1.55 Mg/m3) according to the optimal moisture content equal to 24.4% was determined. All clay samples were prepared with this moisture content value.
The results of tests with the consolidometer are given in Figure 5, the optimum stress value was estimated from the equation, which reached up to 650 kPa. The dry clay density was determined between 1.55 and 1.60 Mg/m3 under 650 kPa pressure.

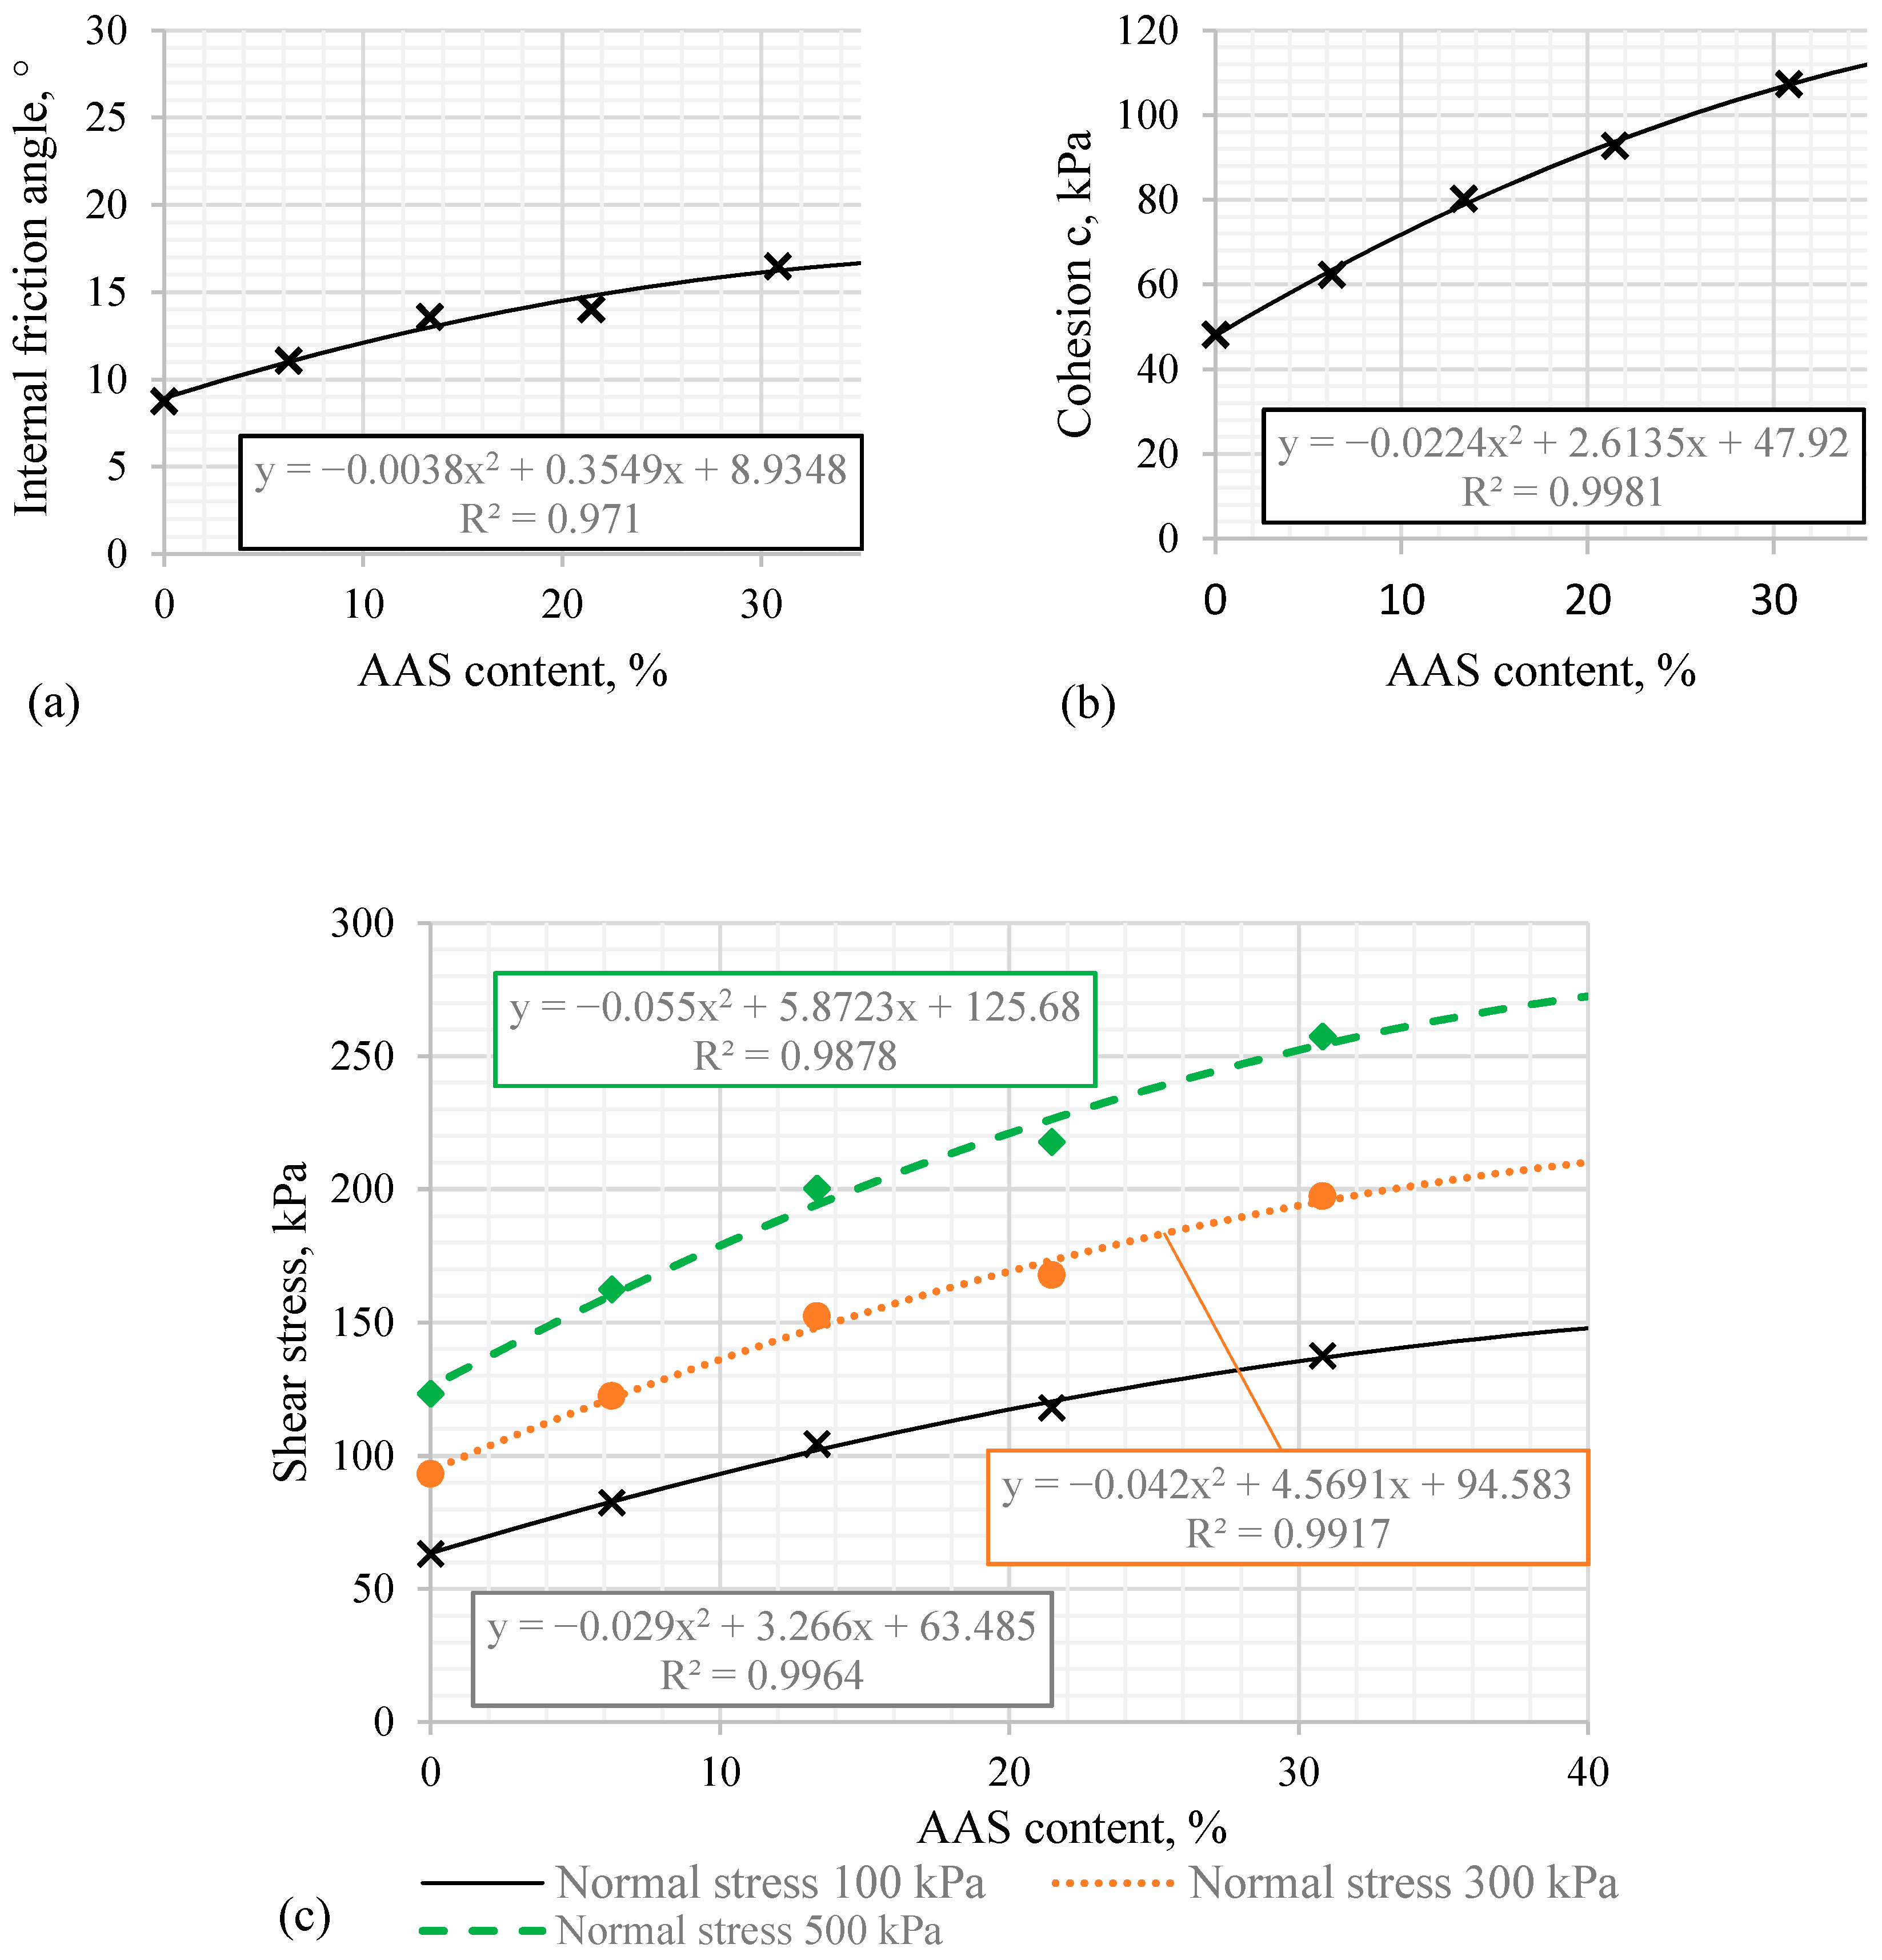
3.2. The Mechanical Properties of AAS Reinforced Clay

The obtained results of the direct shear stress tests of clay samples are given in Table 5. The tested samples reinforced with AAS binder exhibited the higher gains of shear stress compared with the samples without the reinforcement. The highest of the share stress values was 257.4 kPa with 30.82% of AAS and when 500 kPa of normal stress was used.
From the regression analysis of the study data in Table 5, it can be seen that the clay strength correlation was strong (R2 was in the range of 0.87 and 0.95) and it could be expressed as a linear relationship that was identical to the Coulomb Equation (1):
τ = a i + b i σ
  • τ—failure shear stress kPa;
  • ai—coefficient corresponding to the cohesion, kPa;
  • bi—factor corresponding to tanφ.
Therefore, it could be stated that the cylindrical piles of AAS strengthened the clayey primer, although the structure of the clay was damaged by the formation of the holes in which AAS was inserted. However, by using AAS reinforcement, the clayey samples were strengthened in all investigated cases by comparing the strength values of clay samples without reinforcement. Thus, it can be concluded that irrespective of the values of normal stresses, the AAS is most effective when their amount in clay was 30%. In this case, the shear strength of samples increased by 137.5–257.4% (calculated from the initial clay shear strength) by using 100 and 500 kPa normal stress, respectively.
According to Figure 6, it is possible to determine the optimal amount of AAS. The shear clay strength, the internal friction angle, and cohesion depend on the amount of AAS (on the number of piles and their spacing and diameter) in the clay. The coefficient of these curves is determined by the square equations. These curves showed the strong correlation between the strength and the amount of AAS (R2 was in the range of 0.98–0.99). They can determine the required amount of AAS to obtain the appropriate parameter value or to calculate the parameters.
By increasing the AAS content in the samples, both the cohesion and the internal friction angle of the clay samples increased as well, as is shown in Figure 6a,b. These curves provide functions that show the main characteristics: the cohesion and tangent of the internal friction angle. According to the data in the c, the shear strength of the samples increased, with the increase in the amount of AAS. It is evident from the results presented in Figure 6 that the strength values at a different normal stress are dependent on the amount of AAS.

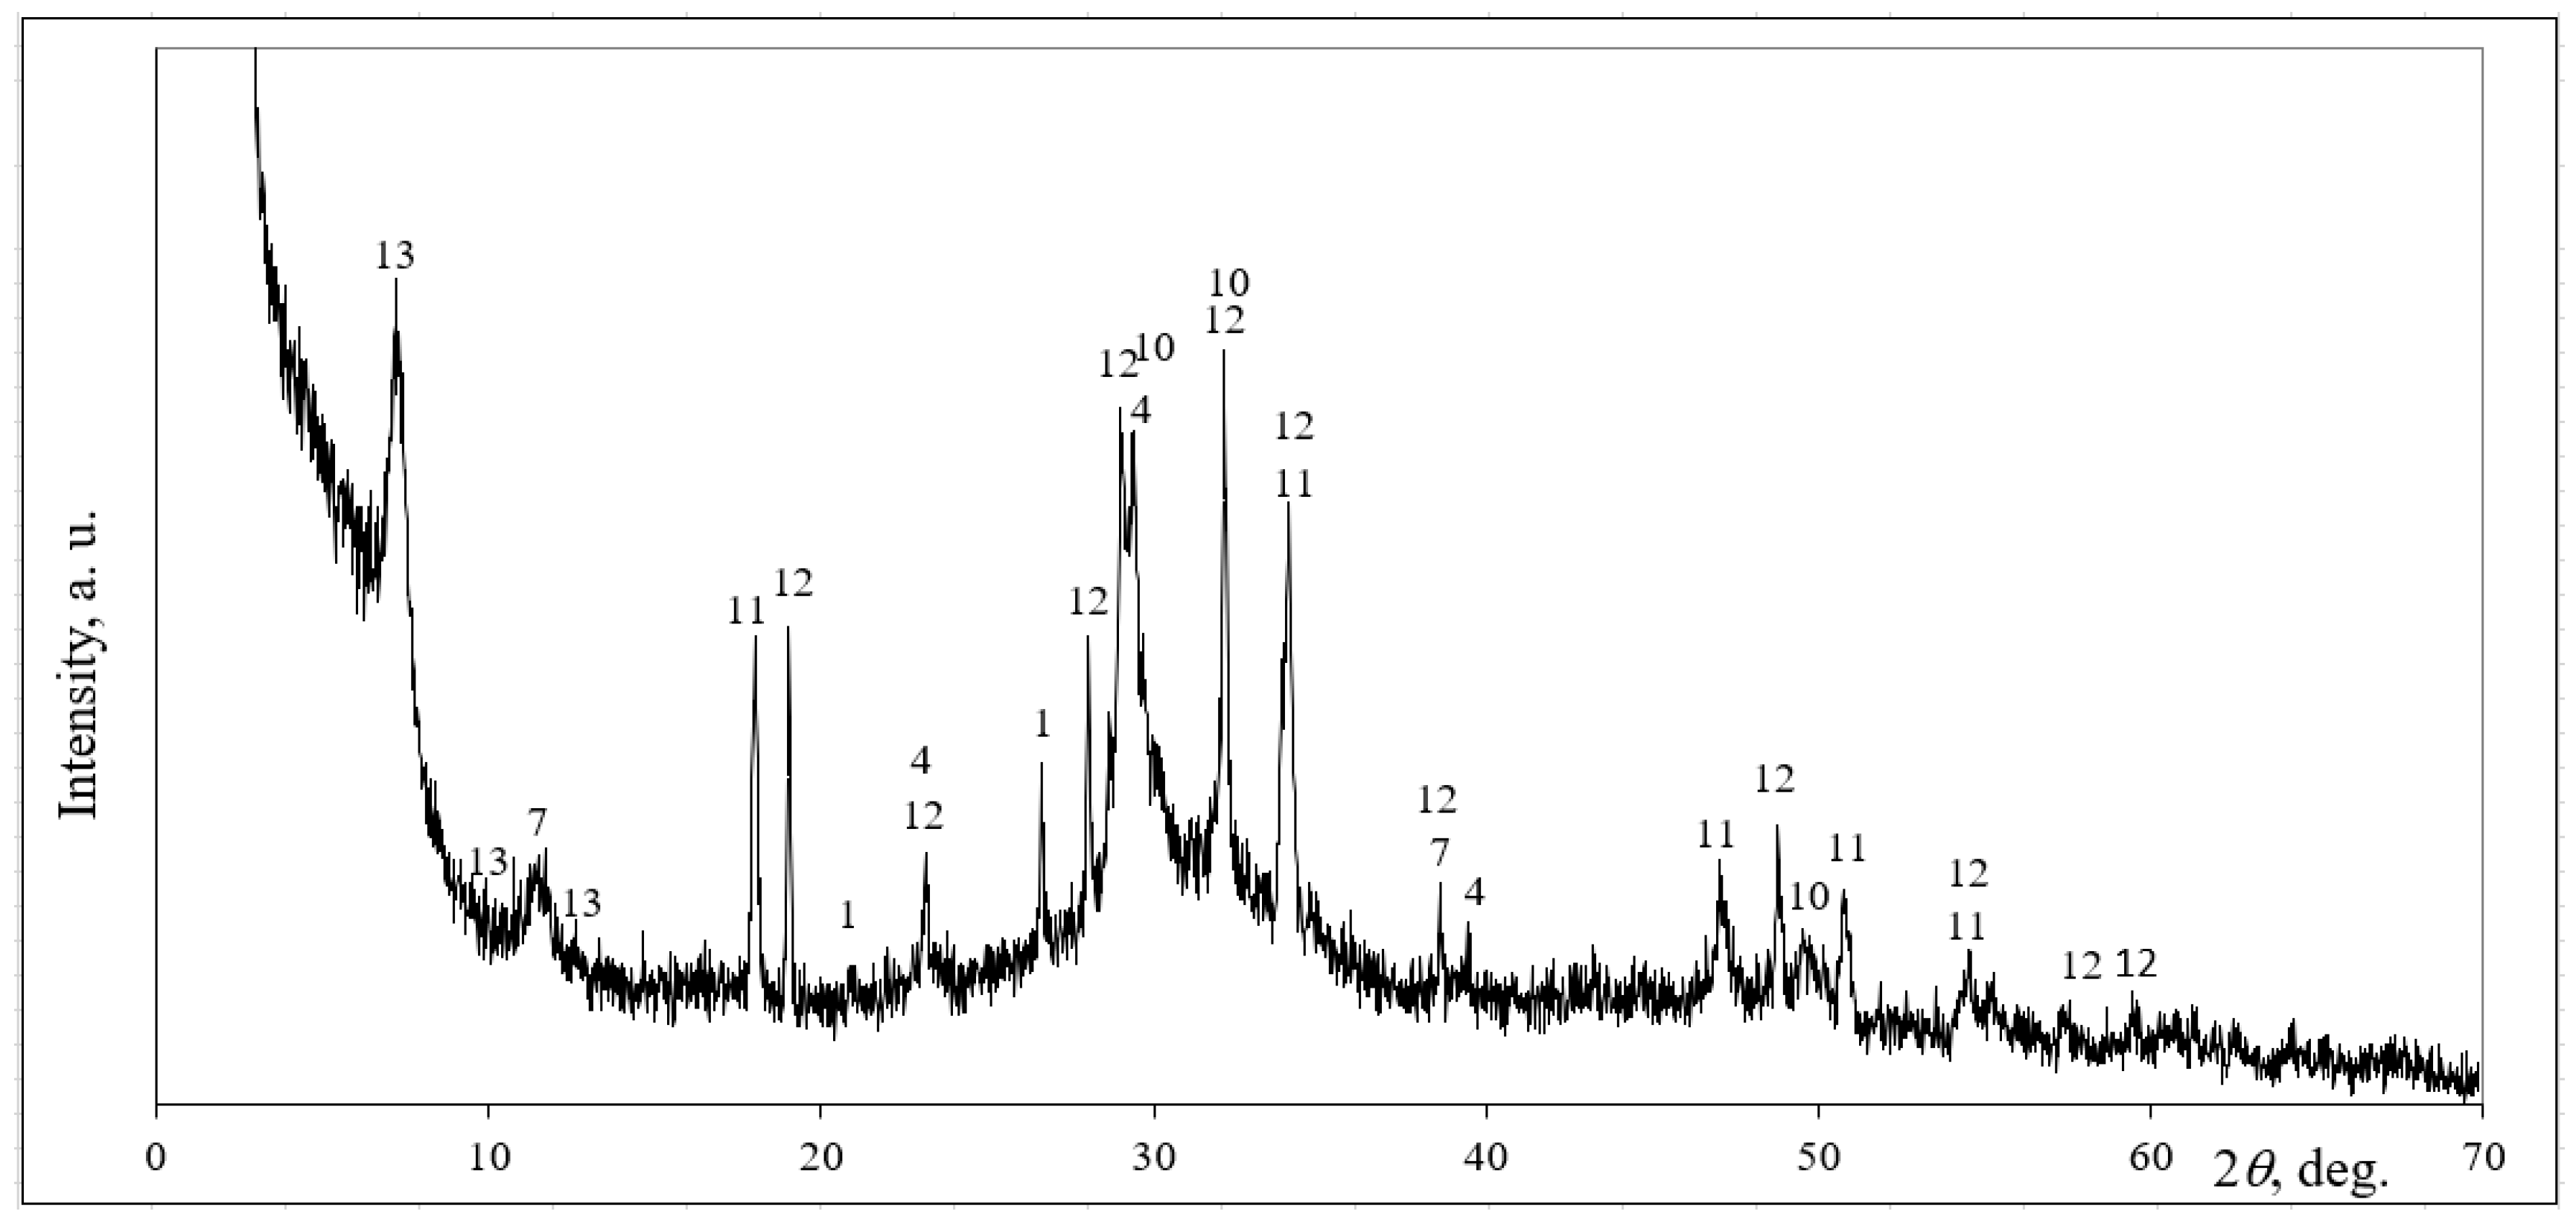
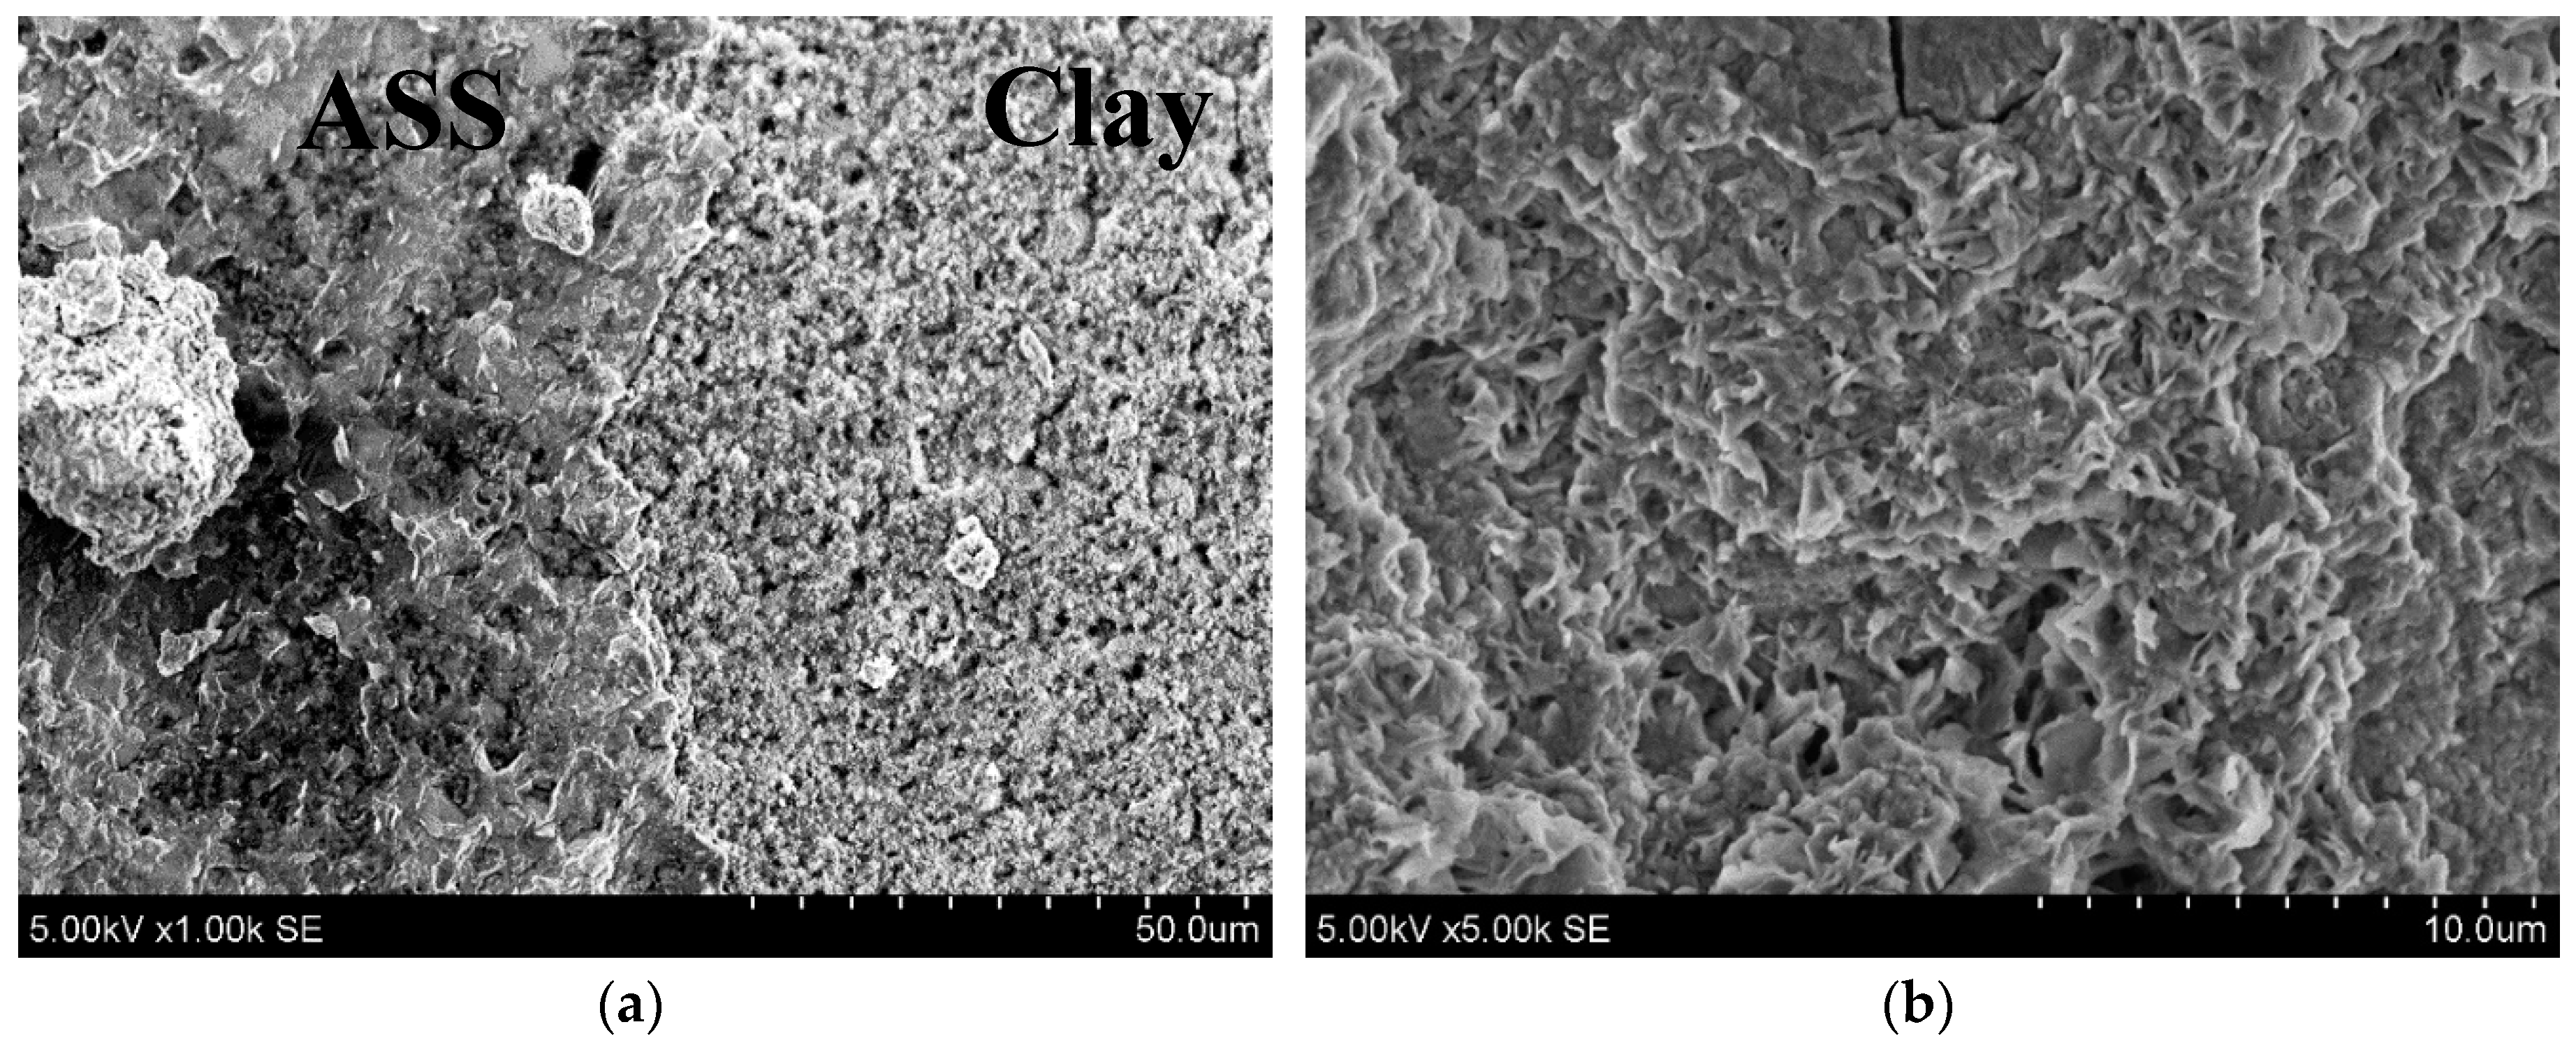
3.3. The Microstructural Development of AAS in Clay Samples

After 7 days of hydrating the AAS, some new compounds formed (Figure 7). As crystalline phases, they formed calcium aluminum silicate hydrate (d-spacing—1.222, 0.864, 0.706, 0.547 and 0.326 nm), calcium silicate hydrate (d-spacing—0.304, 0.279 and 0.182 nm), portlandite (d-spacing—0.492, 0.311, 0.263, 0.193 and 0.179 nm), and sodium sulfate (d-spacing—0.466, 0.317, 0.307, 0.278 and 0.264 nm). Calcite, quartz and hydrotalcite were left unreacted from GGBFS. In alkali activated GGBFS systems, the same phases were detected for Bernal et al. [31].
The mineral composition of clay from the contact zone between AAS and clay (Figure 1, curve B) was evaluated. XRD patterns showed that both curves from Figure 1 have the same peaks with similar intensities. In the clay from the contact zone dominated the same mineral phases such as illite, kaolinite, quartz, calcite and dolomite, like in the raw clay sample. The solution of sodium hydroxide dissolved silicon and aluminum in the amorphous phase from slag but it did not act on the silicon and aluminum from clay because it is mainly in crystalline unreactive phases. Similar results were obtained by Sukmak et al. [32,33]. They investigated a silty clay as fine aggregates in the clay–fly ash geopolymer. However, clay could form an ionic interlayer due to the sorption capacity of clay as stated by Sukmak et al. [33]. Some amount of dissolved silicon and aluminum in alkaline media were absorbed by the negative charges between clay layers and in this way could form an ionic interlayer.
For the investigation of the contact zone between the clay and AAS at microstructural level, the SEM images was used (Figure 8). This picture demonstrated two different microstructures: one for AAS and the second for clay (Figure 8a). SEM observation showed that the contact zone between AAS and clay formed a compact layer after slag geopolymerization. During the hydration of AAS formed new phases such as platy or foil-like CSH, fine bundles of CSH fibers and lamellar C–A–S–H [34] (Figure 8b). This could be related with the compact the contact zone. Thus, a compact microstructure could contribute to an increase in the strength of the clayey soil.

4. Conclusions

XRD results show that the AAS inserted in the clayey samples had these cementitious hydration products: calcium aluminum silicate hydrate and calcium silicate hydrate. In the clay from the contact zone between AAS and clay the same mineral phases (illite, muscovite, kaolinite, quartz, calcite and dolomite) like in raw clay sample dominated. SEM results demonstrated the contact zone between AAS and clay, which formed a compact layer, and this corresponding bonding could be due to the cementitious hydration products’ formation and hardening. Results from the shear strength testing demonstrated that the reinforcement of AAS was most effective when the amount of clay was 30%. The highest shear strength of the samples increased by 137.5–257.4% (calculated from the initial clay shear strength) by using 100 and 500 kPa normal stress, respectively. The increase in the content of AAS in the clayey samples improved the shear strength, the cohesion and the internal friction angle as well. The best results were achieved by using 12 piles (diameter 71.4 mm) when the total area of AAS was 30.82 cm2. The results suggested that the AAS is an excellent material for the reinforcement of clayey soil and it could improve the shear strength of clay. The results obtained in this study contribute to the potential use of AAS reinforcement for clayey soil stabilization. This method (reinforcing with AAS poles) would allow increasing the clay’s cohesion and its shear strength; because of this, the stability of the clay slope improves, especially if additional loads occur on the slope.

Author Contributions

Methodology, V.D.; Formal Analysis, G.S.; Investigation, D.Ž.; Writing-Review & Editing, D.V.; All authors have read and agreed to the published version of the manuscript.

Funding

This research received no external funding.

Conflicts of Interest

The authors declare no conflict of interest.

References

  1. Bose, B. Geo engineering properties of expansive soil stabilized with fly ash. Electron. J. Geotech. Eng. 2012, 17, 1339–1353. [Google Scholar]
  2. Kampala, A.; Horpibulsuk, S.; Prongmanee, N.; Chinkulkijniwat, A. Influence of wet-dry cycles on compressive strength of calcium carbide residue–fly ash stabilized clay. J. Mater. Civ. Eng. 2014, 26, 633–643. [Google Scholar] [CrossRef]
  3. Horpibulsuk, S.; Phetchuay, C.; Chinkulkijniwat, A. Soil stabilization by calcium carbide residue and fly ash. J. Mater. Civ. Eng. 2012, 24, 184–193. [Google Scholar] [CrossRef]
  4. Chen, L.; Chuan, S.; Songyu, L. The Effects of GGBS on the Engineering Properties of Stabilized Soil. Chin. J. Undergr. Space Eng. 2013, S2. [Google Scholar]
  5. Swamy, R.; Sarvade, P.G.; Nayak, D. Utilization of GGBS and Lime to Improve the Compaction and Unconfined Strength Properties of Marine Clay. Asian J. Eng. Technol. 2015, 3. [Google Scholar]
  6. Gu, K.; Jin, F.; Al-Tabbaa, A.; Shi, B. Initial Investigation of Soil Stabilization with Calcined Dolomite-GGBS Blends. In Ground Improvement and Geosynthetics; American Society of Civil Engineers: Reston, VA, USA, 2014; pp. 148–157. [Google Scholar]
  7. Abdullah, H.H.; Shahin, M.A.; Walske, M.L. Geo-mechanical behavior of clay soils stabilized at ambient temperature with fly-ash geopolymer-incorporated granulated slag. Soils Found. 2019, 59, 1906–1920. [Google Scholar] [CrossRef]
  8. Zhang, M.; Guo, H.; El-Korchi, T.; Zhang, G.; Tao, M. Experimental feasibility study of geopolymer as the next-generation soil stabilizer. Constr. Build. Mater. 2013, 47, 1468–1478. [Google Scholar] [CrossRef]
  9. Verdolotti, L.; Iannace, S.; Lavorgna, M.; Lamanna, R. Geopolymerization reaction to consolidate incoherent pozzolanic soil. J. Mater. Sci. 2008, 43, 865–873. [Google Scholar] [CrossRef]
  10. Cristelo, N.; Glendinning, S.; Teixeira Pinto, A. Deep soft soil improvement by alkaline activation. Proc. Inst. Civ. Eng. Ground Improv. 2011, 164, 73–82. [Google Scholar] [CrossRef] [Green Version]
  11. Cristelo, N.; Glendinning, S.; Fernandes, L.; Pinto, A.T. Effect of calcium content on soil stabilisation with alkaline activation. Constr. Build. Mater. 2012, 29, 167–174. [Google Scholar] [CrossRef]
  12. Abdeldjouad, L.; Asadi, A.; Nahazanan, H.; Huat, B.B.; Dheyab, W.; Elkhebu, A.G. Effect of clay content on soil stabilization with alkaline activation. Int. J. Geosynth. Ground Eng. 2019, 5, 4. [Google Scholar] [CrossRef]
  13. Yi, Y.; Li, C.; Liu, S. Alkali-activated ground-granulated blast furnace slag for stabilization of marine soft clay. J. Mater. Civ. Eng. 2015, 27, 04014146. [Google Scholar] [CrossRef]
  14. Mozumder, R.A.; Laskar, A.I. Prediction of unconfined compressive strength of geopolymer stabilized clayey soil using artificial neural network. Comput. Geotech. 2015, 69, 291–300. [Google Scholar] [CrossRef]
  15. Salimi, M.; Ghorbani, A. Mechanical and compressibility characteristics of a soft clay stabilized by slag-based mixtures and geopolymers. Appl. Clay Sci. 2020, 184, 105390. [Google Scholar] [CrossRef]
  16. Singhi, B.; Laskar, A.I.; Ahmed, M.A. Investigation on soil–geopolymer with slag, fly ash and their blending. Arab. J. Sci. Eng. 2016, 41, 393–400. [Google Scholar] [CrossRef]
  17. Davari Algoo, S.; Akhlaghi, T.; Ranjbarnia, M. Engineering properties of clayey soil stabilised with alkali-activated slag. Proc. Inst. Civ. Eng. Ground Improv. 2019. [Google Scholar] [CrossRef]
  18. Bruker. D8 Advance Diffractometer (Bruker AXS) Technical Details. Available online: https://www.bruker.com/products/x-ray-difractionand-elemental-analysis/x-ray-difraction/d8-advance.html (accessed on 13 March 2020).
  19. Bruker. X-ray S8 Tiger WD Series 2 Technical Details. Available online: https://www.bruker.com/products/x-ray-diffraction-andelemental-analysis/x-ray-fuorescence/s8-tiger.html (accessed on 13 March 2020).
  20. Zeiss. EVO MA and LS Series Scanning Electron Microscopes for Materials Analysis and Life Science. In Operator User Guide; Version 1.0; Zeiss: Cambridge, MA, USA, 2008. [Google Scholar]
  21. LST EN ISO 17892-12:2018 Geotechnical Investigation and Testing—Laboratory Testing of Soil—Part 12: Determination of Liquid and Plastic Limits (ISO 17892-12:2018); EN ISO 17892-12:2018; Lithuanian Standards Board: Vilnius, Lithuania, 2018.
  22. LST EN ISO 14688-2:2018 Geotechnical Investigation and Testing—Identification and Classification of Soil—Part 2: Principles for a Classification (ISO 14688-2:2017); EN ISO 14688-2:2018; Lithuanian Standards Board: Vilnius, Lithuania, 2018.
  23. LST EN 13286-2:2010/AC:2013 Unbound and Hydraulically Bound Mixtures—Part 2: Test Methods for Laboratory Reference Density and Water Content—Proctor Compaction; EN 13286-2:2010/AC:2012; Lithuanian Standards Board: Vilnius, Lithuania, 2013.
  24. LST EN ISO 17892-10:2019 Geotechnical Investigation and Testing—Laboratory Testing of Soil—Part 10: Direct Shear Tests (ISO 17892-10:2018); EN ISO 17892-10:2018; Lithuanian Standards Board: Vilnius, Lithuania, 2019.
  25. Kubiliūtė, R.; Kaminskas, R. The pozzolanic activity of calcined clay–silica gel composites. Mater. Sci. 2013, 19, 453–460. [Google Scholar] [CrossRef] [Green Version]
  26. Rashad, A.M.; Sadek, D.M.; Hassan, H.A. An investigation on blast-furnace stag as fine aggregate in alkali-activated slag mortars subjected to elevated temperatures. J. Clean. Prod. 2016, 112, 1086–1096. [Google Scholar] [CrossRef]
  27. Vaičiukynienė, D.; Nizevičienė, D.; Kielė, A.; Janavičius, E.; Pupeikis, D. Effect of phosphogypsum on the stability upon firing treatment of alkali-activated slag. Constr. Build. Mater. 2018, 184, 485–491. [Google Scholar] [CrossRef]
  28. Nizevičienė, D.; Vaičiukynienė, D.; Vaitkevičius, V.; Rudžionis, Ž. Effects of waste fluid catalytic cracking on the properties of semi-hydrate phosphogypsum. J. Clean. Prod. 2016, 137, 150–156. [Google Scholar] [CrossRef]
  29. Atiş, C.D.; Bilim, C.; Çelik, Ö.; Karahan, O. Influence of activator on the strength and drying shrinkage of alkali-activated slag mortar. Constr. Build. Mater. 2009, 23, 548–555. [Google Scholar] [CrossRef]
  30. Dadsetan, S.; Siad, H.; Lachemi, M.; Sahmaran, M. Extensive evaluation on the effect of glass powder on the rheology, strength, and microstructure of metakaolin-based geopolymer binders. Constr. Build. Mater. 2020, 121168. [Google Scholar] [CrossRef]
  31. Bernal, S.A.; Nicolas, R.S.; van Deventer, J.S.; Provis, J.L. Alkali-activated slag cements produced with a blended sodium carbonate/sodium silicate activator. Adv. Cem. Res. 2016, 28, 262–273. [Google Scholar] [CrossRef]
  32. Sukmak, P.; Horpibulsuk, S.; Shen, S.L.; Chindaprasirt, P.; Suksiripattanapong, C. Factors influencing strength development in clay–fly ash geopolymer. Constr. Build. Mater. 2013, 47, 1125–1136. [Google Scholar] [CrossRef]
  33. Sukmak, P.; Horpibulsuk, S.; Shen, S.L. Strength development in clay–fly ash geopolymer. Constr. Build. Mater. 2013, 40, 566–574. [Google Scholar] [CrossRef]
  34. Jia, Z.; Yang, Y.; Yang, L.; Zhang, Y.; Sun, Z. Hydration products, internal relative humidity and drying shrinkage of alkali activated slag mortar with expansion agents. Constr. Build. Mater. 2018, 158, 198–207. [Google Scholar] [CrossRef]
Figure 1. The X-Ray diffraction pattern of raw clay (A) and clay from the contact zone with the alkali activated slag (AAS) binder (B). Indices: 1 is quartz SiO2 (77–1060), 2 is illite (26–911), 3 is kaolinite (83–971), 4 is calcite CaCO3 (83–578), 5 is dolomite (36–426), and 6 is chlorite (72–1234).
Minerals 10 01076 g001
Figure 2. The particles’ size distribution of raw clay.
Minerals 10 01076 g002
Figure 3. X-Ray diffraction patterns of GGBFS (a) and phosphogypsum (b). Indices: 1 is quartz (78–2315), 4 is calcite (83–578), 7 is indicates hydrotalcite (14–191), 8 is basanite (33–310), and 9 is brushite (11–293).
Minerals 10 01076 g003
Figure 4. Cylindrical samples with the alkali activated GGBFS piles (the number at the right corner of pictures shows geopolymer volume quantity from clay volume, %).
Minerals 10 01076 g004
Figure 5. Clay consolidation test results.
Minerals 10 01076 g005
Figure 6. The AAS influence on the internal friction angle (a), cohesion (b) and shear stress of cylindrical samples (c).
Minerals 10 01076 g006
Figure 7. X-Ray diffraction pattern of alkali activated GGBFS with 3% of phosphogypsum. Indices: 1 is quartz (78–2315), 4 is calcite (83–578), 7 is hydrotalcite (14–191), 10 is calcium silicate hydrate (33–306), 11 is portlandite (81–2040), 12 is sodium sulfate (74–1738), and 13 is calcium aluminum silicate hydrate (76-1507).
Minerals 10 01076 g007
Figure 8. The SEM images of the contact zone between AAS and clay (a) and the microstructure of AAS (b).
Minerals 10 01076 g008
Table 1. The characterization of clay by Atterberg’s limits.
Sample NoSample Moisture Content, % Average Moisture Content, %Plasticity Index (PI), %
Plastic limit (PL), %21.72
127.9327.85
227.76
Liquid limit (LL), %
349.8749.57
449.26
Table 2. Chemical composition (according to XRF) of the ground-granulated blast-furnace slag (GGBFS) and the hemihydrate phosphogypsum, wt%.
OxidesCaOSiO2SO3Al2O3MgONa2OP2O5K2OTiO2FSrOLOI *Others
GGBFS45.2037.101.856.445.761.020.680.520.29-0.07-1.07
PG39.060.3452.750.070.21-1.11--0.06-6.40-
* Loss in ignition.
Table 3. The composition of alkali activated GGBFS binder.
GGBFS, wt.%Phosphogypsum, wt.%NaOH, wt.%W/S *
973100.27
* W/S—Water solid ratio.
Table 4. Composition of the shear test cylindrical samples.
Samples GroupArea of Cylinder, cm2Drilled Holes Number, UnitsTotal Area of AAS, cm2The Area of Clay, cm2Total Area of AAS, %
Clay400040.000
G 6%4032.3637.646.26
G 13%4064.7135.2913.35
G 21%4097.0732.9321.46
G 30%40129.4230.5830.82
Table 5. The results of the direct shear test of the clay samples.
Sample GroupNormal Stress, kPaShear Stress, kPaShear Strength Increment, %ai, kPabiR2
Clay10063.2048.200.150.95
30093.20
500123.20
G 6%10082.430.462.400.200.93
300122.431.3
500197.431.8
G 13%100104.365.080.300.240.87
300152.363.4
500200.362.6
G 21%100117.886.492.800.250.93
300167.880.0
500217.876.8
G 30%100137.4117.4107.400.300.90
300197.4111.8
500257.4108.9
Publisher’s Note: MDPI stays neutral with regard to jurisdictional claims in published maps and institutional affiliations.

