Geochemical Contrasts between Late Triassic Rb-Rich and Barren Pegmatites from Ningshan Pegmatite District, South Qinling Orogen, China: Implications for Petrogenesis and Rare Metal Exploration

Abstract
:1. Introduction
2. Geological Setting

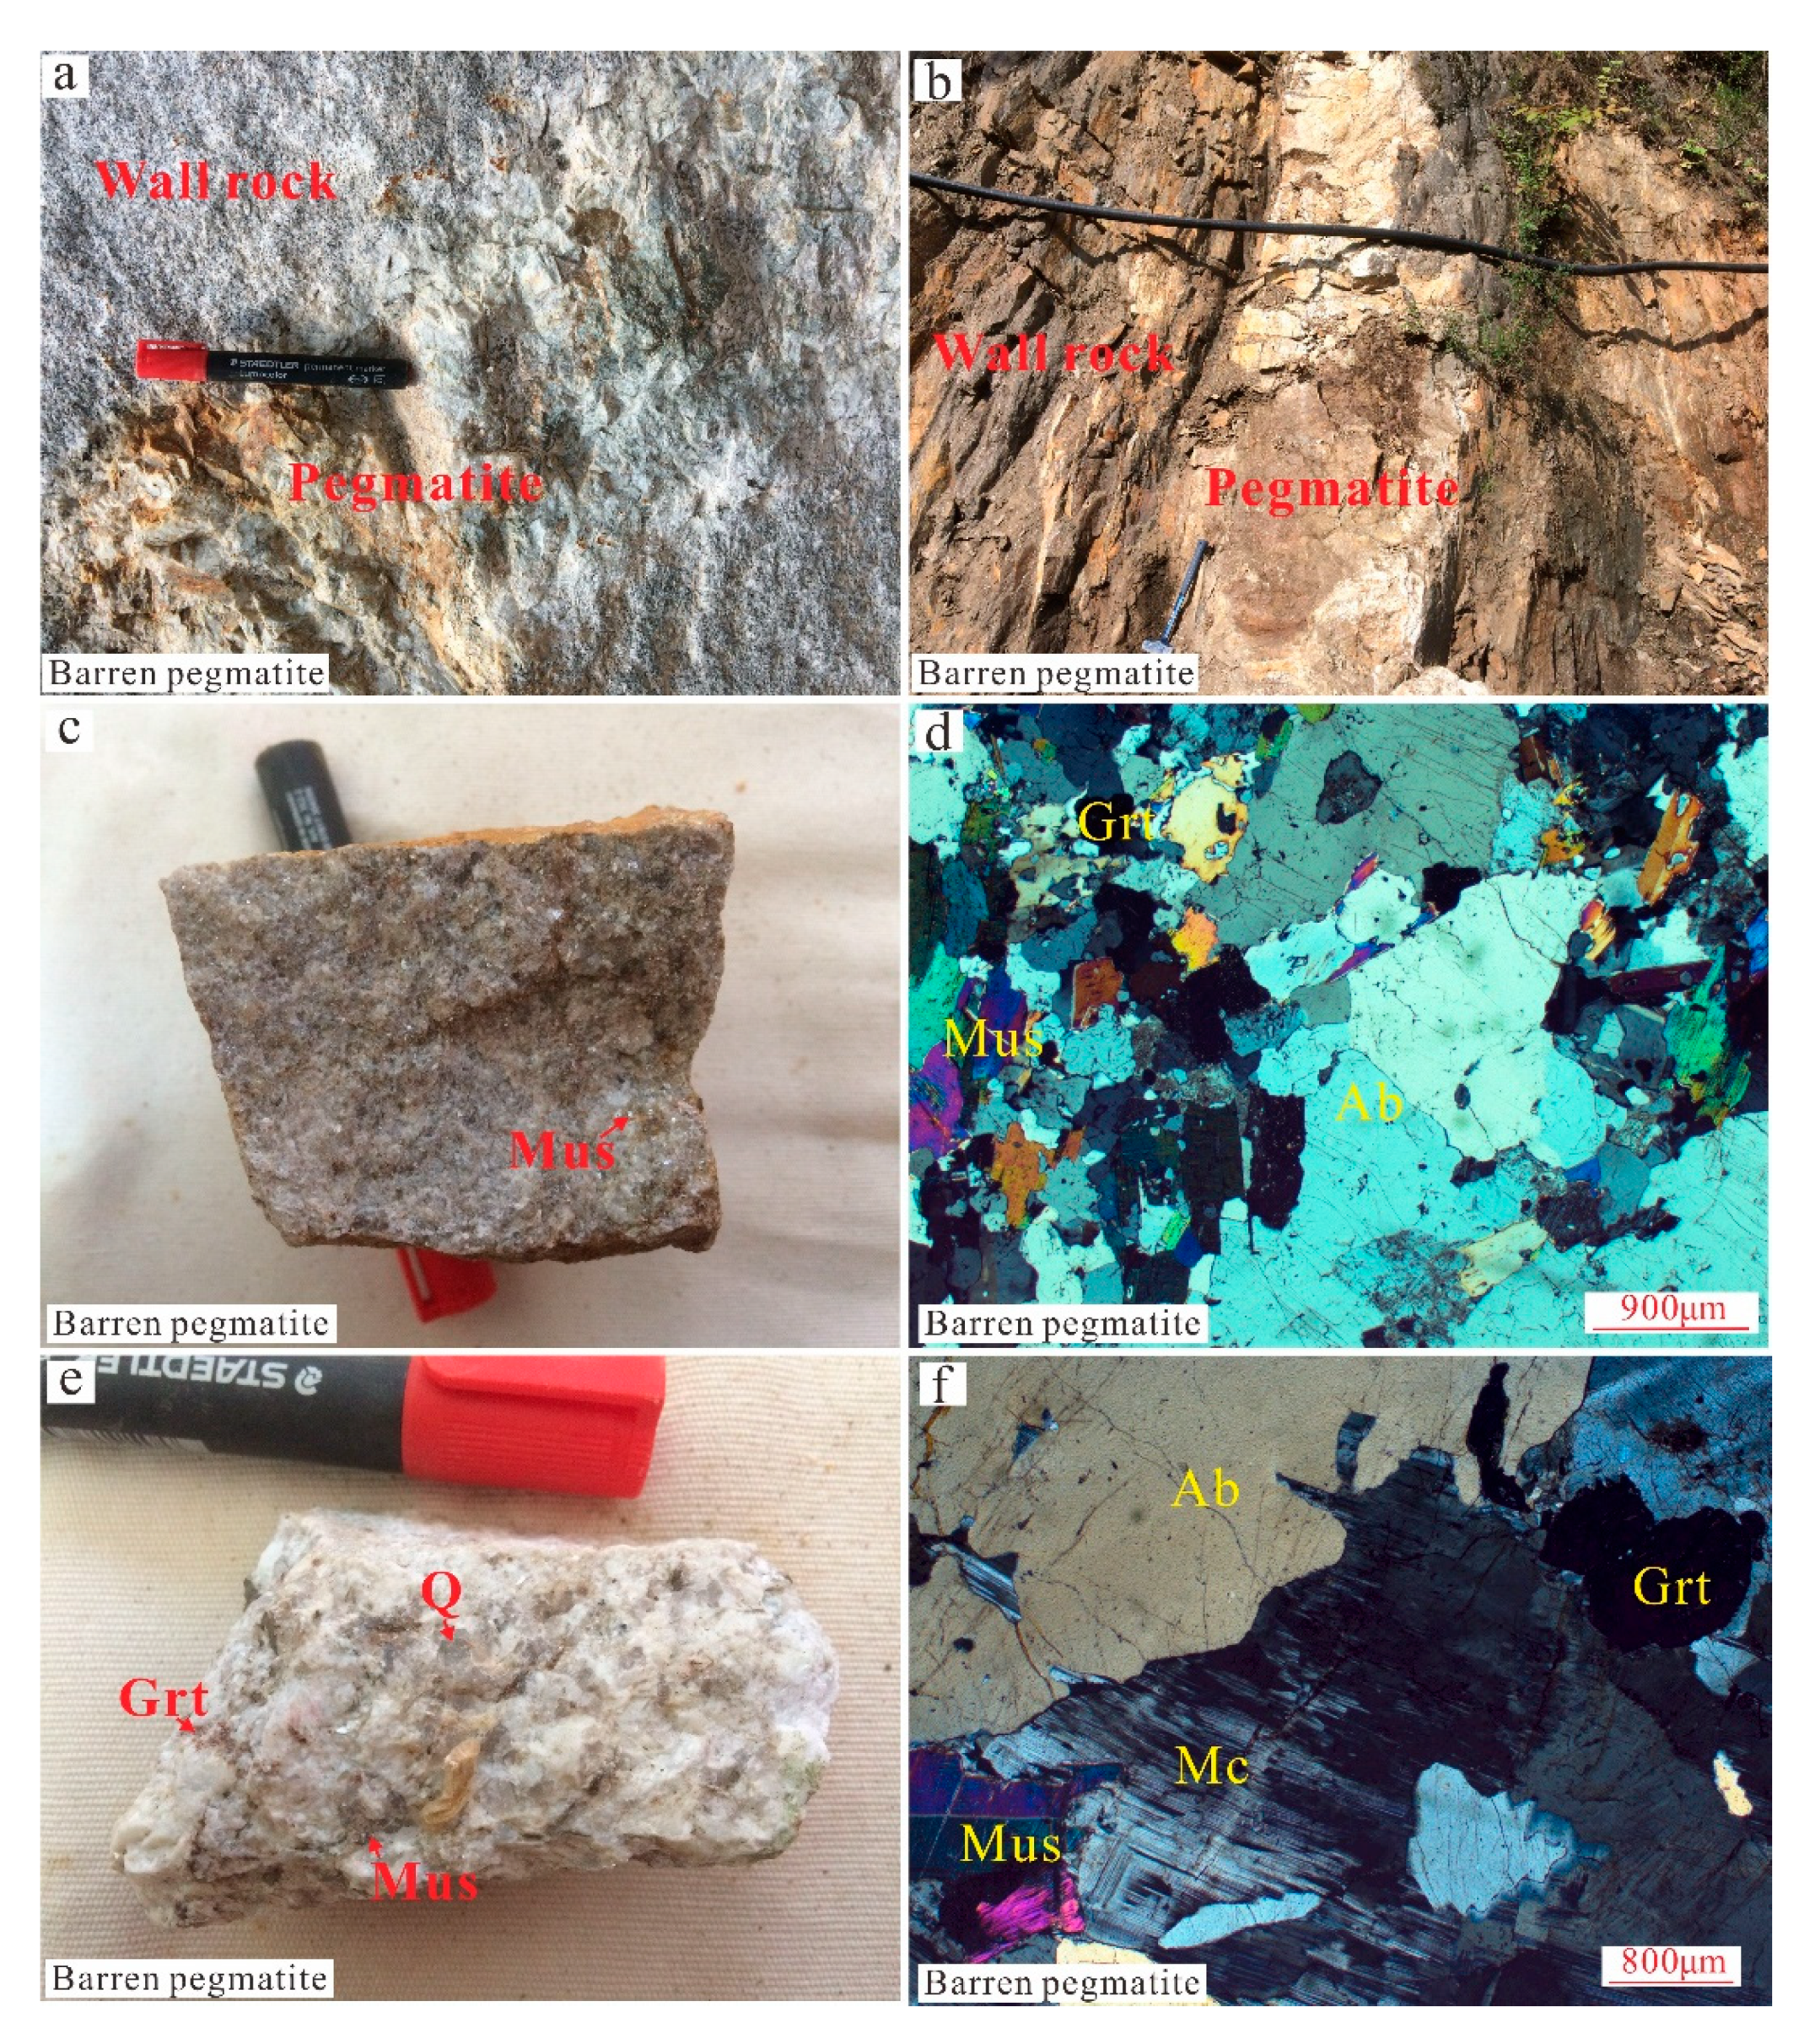
3. Pegmatite and Sample Description
4. Analytical Methods
4.1. Whole-Rock Compositional Analysis
4.2. Mineral Compositions Analysis
4.3. Zircon CL Images and LA-ICP-MS U–Pb Dating
5. Results
5.1. Whole-Rock Geochemistry
5.2. Mineral Geochemistry
5.3. Zircon U–Pb Ages
6. Discussion
6.1. Age of Pegmatites
6.2. Relationship between the Pegmatites and Granites
6.3. Tectonic Setting and Petrogenesis of Pegmatite
6.4. Importance of Mineral Compositions to Rare Metal Exploration
7. Conclusions
Author Contributions
Funding
Acknowledgments
Conflicts of Interest
References
- London, D. Ore-forming processes within granitic pegmatites. Ore Geol. Rev. 2018, 101, 349–383. [Google Scholar] [CrossRef]
- Černý, P. Rare-element granitic pegmatites. Part I: Anatomy and internal evolution of pegmatitic deposits. Geosci. Can. 1991, 18, 49–67. [Google Scholar]
- Černý, P. Rare-element granitic pegmatites. Part II: Regional to global environments and petrogenesis. Geosci. Can. 1991, 18, 68–81. [Google Scholar]
- Černý, P.; Ercit, T.S. The classification of granitic pegmatites revisited. Can. Miner. 2005, 43, 2005–2026. [Google Scholar]
- Černý, P.; London, D.; Novák, M. Granitic pegmatites as reflections of their sources. Elements 2012, 8, 289–294. [Google Scholar] [CrossRef]
- London, D. Internal differentiation of rare-element pegmatites: A synthesis of recent research. Geol. Soc. Am. Spec. Pap. 1990, 246, 35–50. [Google Scholar]
- Jolliff, B.L.; Papike, J.J.; Shearer, C.K. Petrogenetic relationships between pegmatite and granite based on geochemistry of muscovite in pegmatite wall zones, Black Hills, South Dakota, USA. Geochim. Cosmochim. Acta 1992, 56, 1915–1939. [Google Scholar] [CrossRef]
- Zhu, Y.F.; Zeng, Y.; Gu, L. Geochemistry of the rare metal-bearing pegmatite No. 3 vein and related granites in the Keketuohai region, Altay Mountains, northwest China. J. Asian Earth Sci. 2006, 27, 61–77. [Google Scholar] [CrossRef]
- Webster, J.D.; Thomas, R.; Rhede, D.; Förster, H.-J.; Seltmann, R. Melt inclusions in quartz from an evolved peraluminous pegmatite: Geochemical evidence for strong tin enrichment in fluorine-rich and phosphorus-rich residual liquids. Geochim. Cosmochim. Acta 1997, 61, 2589–2604. [Google Scholar] [CrossRef]
- Martin, R.F.; De Vito, C. The patterns of enrichment in felsic pegmatites ultimately depend on tectonic setting. Can. Miner. 2005, 43, 2027–2048. [Google Scholar] [CrossRef] [Green Version]
- Lv, Z.H.; Zhang, H.; Tang, Y.; Guan, S.J. Petrogenesis and magmatic–hydrothermal evolution time limitation of Kelumute No. 112 pegmatite in Altay, Northwestern China: Evidence from zircon U–Pb and Hf isotopes. Lithos 2012, 154, 374–391. [Google Scholar] [CrossRef]
- Simmons, W.; Falster, A.; Webber, K.; Roda-Robles, E.; Boudreaux, A.P.; Grassi, L.R.; Freeman, G. Bulk Composition of Mt. Mica Pegmatite, Maine, USA: Implications for the Origin of an Lct Type Pegmatite By Anatexis. Can. Miner. 2016, 54, 1053–1070. [Google Scholar] [CrossRef]
- Shaw, R.A.; Goodenough, K.M.; Roberts, N.M.W.; Horstwood, M.S.A.; Chenery, S.R.; Gunn, A.G. Petrogenesis of rare-metal pegmatites in high-grade metamorphic terranes: A case study from the Lewisian Gneiss Complex of north-west Scotland. Precambrian Res. 2016, 281, 338–362. [Google Scholar] [CrossRef] [Green Version]
- Zhang, X.; Zhang, H.; Ma, Z.L.; Tang, Y.; Lv, Z.H.; Zhao, J.Y.; Liu, Y.L. A new model for the granite–pegmatite genetic relationships in the Kaluan–Azubai–Qiongkuer pegmatite-related ore fields, the Chinese Altay. J. Asian Earth Sci. 2016, 124, 139–155. [Google Scholar] [CrossRef] [Green Version]
- Nabelek, P.I.; Russ-Nabelek, C.; Denison, J. The generation and crystallization conditions of the Proterozoic Harney Peak leucogranite, Black Hills, South Dakota, USA: Petrologic and geochemical constraints. Contrib. Miner. Pet. 1992, 110, 173–191. [Google Scholar] [CrossRef]
- Nabelek, P.I.; Russ-Nabelek, C.; Haeussler, G. Stable isotope evidence for the petrogenesis and fluid evolution in the Proterozoic Harney Peak leucogranite, Black Hills, South Dakota. Geochim. Cosmochim. Acta 1992, 56, 403–417. [Google Scholar] [CrossRef]
- Robles, E.R.; Perez, A.P.; Roldan, F.V.; Fontan, F. The granitic pegmatites of the Fregeneda area (Salamanca, Spain): Characteristics and petrogenesis. Miner. Mag. 1999, 63, 535–558. [Google Scholar] [CrossRef]
- Dill, H. Geology and chemistry of Variscan-type pegmatite systems (SE Germany)—With special reference to structural and chemical pattern recognition of felsic mobile components in the crust. Ore Geol. Rev. 2018, 92, 205–239. [Google Scholar] [CrossRef]
- Müller, A.; Romer, R.L.; Pedersen, R.B. The Sveconorwegian pegmatite province-thousands of pegmatites without parental granites. Can. Miner. 2017, 55, 283–315. [Google Scholar]
- Webber, K.L.; Simmons, W.B.; Falster, A.U.; Hanson, S.L. Anatectic pegmatites of the Oxford County pegmatite field, Maine, USA. Can. Miner. 2019, 57, 811–815. [Google Scholar] [CrossRef]
- Chen, X.J.; Wang, S.R.; Zhang, X.Y. Geological Characteristics of Qinling Granitic Pegmatites; Beijing Geology Publishing House: Beijing, China, 1993; pp. 8–70. (In Chinese) [Google Scholar]
- Lu, X.X.; Zhu, C.H.; Gu, D.M.; Zhang, H.M.; Wu, M.; Wu, Y. The main geological and metallogenic characteristics of granitic pegmatite in Eastern Qinling Belt. Geol. Rev. 2010, 56, 21–30. (In Chinese) [Google Scholar]
- Feng, Y.; Lei, R.; Ju, M.; Song, G.; Xu, F. Origin and petrogenetic implications of garnet from Rb-rich pegmatites in North Qinling Orogen, China. Geol. J. 2017, 52, 215–237. [Google Scholar] [CrossRef]
- Yuan, F.; Liu, J.J.; Carranza, E.J.M.; Zhang, S.; Zhai, D.G.; Liu, G.; Wang, G.W.; Zhang, H.Y.; Sha, Y.Z.; Yang, S.S. Zircon trace element and isotopic (Sr, Nd, Hf, Pb) effects of assimilation-fractional crystallization of pegmatite magma: A case study of the Guangshigou biotite pegmatites from the North Qinling Orogen, central China. Lithos 2018, 302, 20–36. [Google Scholar] [CrossRef]
- Yuan, F.; Jiang, S.Y.; Liu, J.; Liu, G.; Zhang, S.; Sha, Y. Origin and evolution of uraniferous pegmatite: A case study from the Xiaohuacha granite–pegmatite system and related country rocks in the Shangdan uranium mineralization district of North Qinling Orogenic Belt, China. Lithos 2020. [Google Scholar] [CrossRef]
- Meng, Q.R.; Zhang, G.W. Timing of collision of the North and South China blocks: Controversy and reconciliation. Geology 1999, 27, 123–126. [Google Scholar] [CrossRef]
- Meng, Q.R.; Zhang, G.W. Geologic framework and tectonic evolution of the Qinling orogen, central China. Tectonophysics 2000, 323, 183–196. [Google Scholar] [CrossRef]
- Yan, Z.; Wang, Z.; Chen, J.; Yan, Q.; Wang, T. Detrital record of Neoproterozoic arc-magmatism along the NW margin of the Yangtze Block, China: U–Pb geochronology and petrography of sandstones. J. Asian Earth Sci. 2010, 37, 322–334. [Google Scholar] [CrossRef]
- Lai, S.; Qin, J.; Chen, L.; Grapes, R. Geochemistry of ophiolites from the Mian-Lue Suture Zone: Implications for the tectonic evolution of the Qinling Orogen, Central China. Int. Geol. Rev. 2008, 50, 650–664. [Google Scholar] [CrossRef]
- Dong, Y.; Zhang, G.; Neubauer, F.; Liu, X.; Genser, J.; Hauzenberger, C. Tectonic evolution of the Qinling orogen, China: Review and synthesis. J. Asian Earth Sci. 2011, 41, 213–237. [Google Scholar] [CrossRef]
- Zhang, G.; Meng, Q.; Lai, S. Tectonics and structure of Qinling orogenic belt. Sci. China (Sci. Sin.) Ser. B. 1995, 11, 1379–1394. [Google Scholar]
- Zhang, G.; Meng, Q.; Yu, Z.; Sun, Y.; Zhou, D.; Guo, A. Orogenesis and dynamics of the Qinling orogen. Sci. China Ser. D-Earth Sci. 1996, 39, 225–234. [Google Scholar]
- Zhang, G.; Dong, Y.; Lai, S.; Guo, A.; Meng, Q.; Liu, S.; Cheng, S.; Yao, A.; Zhang, Z.; Pei, X. Mianlue tectonic zone and Mianlue suture zone on southern margin of Qinling-Dabie orogenic belt. Sci. China Ser. D-Earth Sci. 2004, 47, 300–316. [Google Scholar] [CrossRef]
- Mattauer, M.; Matte, P.; Malavieille, J.; Tapponnier, P.; Maluski, H.; Qin, X.Z.; Lun, L.Y.; Qin, T.Y. Tectonics of the Qinling belt: Build-up and evolution of eastern Asia. Nature 1985, 317, 496–500. [Google Scholar] [CrossRef]
- Zhang, G.W.; Zhang, Z.Q.; Dong, Y.P. Nature of main tectono-lithostratigraphic units of the Qinling Orogen: Implications for the tectonic evolution. Acta Pet. Sin. 1995, 11, 101–114. [Google Scholar]
- Liu, S.W.; Li, Q.G. Petrogenesis of Indosinian Granitoids in Middle-Segment of South Qinling Tectonic Belt:Constraints from Sr–Nd Isotopic Systematics. Acta Geol. Sin. Engl. Ed. 2011, 85, 610–628. [Google Scholar] [CrossRef]
- Wang, X.; Tao, W.; Zhang, C. Neoproterozoic, Paleozoic, and Mesozoic granitoid magmatism in the Qinling Orogen, China: Constraints on orogenic process. J. Asian Earth Sci. 2013, 72, 129–151. [Google Scholar] [CrossRef]
- Li, N.; Chen, Y.J.; Santosh, M.; Pirajno, F. Compositional polarity of Triassic granitoids in the Qinling Orogen, China: Implication for termination of the northernmost paleo-Tethys. Gondwana Res. 2015, 27, 244–257. [Google Scholar] [CrossRef]
- Dong, Y.; Liu, X.; Zhang, G.; Chen, Q.; Zhang, X.; Wei, L.; Chen, Y. Triassic diorites and granitoids in the Foping area: Constraints on the conversion from subduction to collision in the Qinling orogen, China. J. Asian Earth Sci. 2012, 47, 123–142. [Google Scholar] [CrossRef]
- Zhang, H.F.; Ouyang, J.P.; Ling, W.L.; Chen, Y.L. Pb, Sr, Nd isotope composition of Ningshan Granitoids, South Qiling and their deep geological information. Acta Pet. Miner. 1997, 16, 22–32. (In Chinese) [Google Scholar]
- Peng, H.L.; Li, W.C.; Li, W.J.; Wang, J.J.; Lv, J.L.; Du, B. Geological characteristics and prospecting potential of Rubidium and other rare metal mineralization in Ninghan county, Shanxi province. Geol. Shanxi. 2016, 34, 21–26. (In Chinese) [Google Scholar]
- Liu, Y.; Hu, Z.; Gao, S.; Günther, D.; Xu, J.; Gao, C.; Chen, H. In situ analysis of major and trace elements of anhydrous minerals by LA-ICP-MS without applying an internal standard. Chem. Geol. 2008, 257, 34–43. [Google Scholar] [CrossRef]
- Liu, Y.; Hu, Z.; Zong, K.; Gao, C.; Gao, S.; Xu, J.; Chen, H. Reappraisement and refinement of zircon U–Pb isotope and trace element analyses by LA-ICP-MS. Chin. Sci. Bull. 2010, 55, 1535–1546. [Google Scholar] [CrossRef]
- Hou, K.; Li, Y.; Tian, Y. In situ U–Pb zircon dating using laser ablation-multi ion counting-ICP-MS. Miner. Depos. 2009, 28, 481–492. [Google Scholar]
- Maniar, P.D.; Piccoli, P.M. Tectonic discrimination of granitoids. Geol. Soc. Am. Bull. 1989, 101, 635–643. [Google Scholar] [CrossRef]
- Sun, S.S.; Mcdonough, W.F. Chemical and isotopic systematics of oceanic basalts: Implications for mantle composition and processes. Geol. Soc. Lond. Spec. Pub. 1989, 42, 313–345. [Google Scholar] [CrossRef]
- Jiang, Y.H.; Jin, G.D.; Liao, S.Y.; Zhou, Q.; Zhao, P. Geochemical and Sr–Nd–Hf isotopic constraints on the origin of Late Triassic granitoids from the Qinling orogen, central China: Implications for a continental arc to continent–continent collision. Lithos 2010, 117, 183–197. [Google Scholar] [CrossRef]
- Yang, P.; Liu, S.; Li, Q.; Wang, Z.; Wang, R.; Wang, W. Geochemistry and zircon U–Pb–Hf isotopic systematics of the Ningshan granitoid batholith, middle segment of the south Qinling belt, Central China: Constraints on petrogenesis and geodynamic processes. J. Asian Earth Sci. 2012, 61, 166–186. [Google Scholar] [CrossRef]
- Tischendorf, G.; Gottesmann, B.; Foerster, H.J.; Trumbull, R.B. On Li-bearing micas: Estimating Li from electron microprobe analyses and an improved diagram for graphical representation. Miner. Mag. 1997, 61, 809–834. [Google Scholar] [CrossRef]
- Van Lichtervelde, M.; Grégoire, M.; Linnen, R.L.; Béziat, D.; Salvi, S. Trace element geochemistry by laser ablation ICP-MS of micas associated with Ta mineralization in the Tanco pegmatite, Manitoba, Canada. Contrib. Miner. Pet. 2008, 155, 791–806. [Google Scholar] [CrossRef]
- Tindle, A.G.; Webb, P.C. Estimation of lithium contents in trioctahedral micas using microprobe data: Application to micas from granitic rocks. Eur. J. Miner. 1990, 2, 595–610. [Google Scholar] [CrossRef]
- Mezger, K.; Krogstad, E. Interpretation of discordant U-Pb zircon ages: An evaluation. J. Metamorph. Geol. 1997, 15, 127–140. [Google Scholar] [CrossRef]
- Geisler, T.; Schaltegger, U.; Tomaschek, F. Re-equilibration of zircon in aqueous fluids and melts. Elements 2007, 3, 43–50. [Google Scholar] [CrossRef]
- Soman, A.; Geisler, T.; Tomaschek, F.; Grange, M.; Berndt, J. Alteration of crystalline zircon solid solutions: A case study on zircon from an alkaline pegmatite from Zomba–Malosa, Malawi. Contrib. Miner. Pet. 2010, 160, 909–930. [Google Scholar] [CrossRef]
- Zhou, Q.; Qin, K.; Tang, D.; Wang, C.; Sakyi, P.A. LA-ICP-MS U–Pb zircon, columbite-tantalite and 40Ar–39Ar muscovite age constraints for the rare-element pegmatite dykes in the Altai orogenic belt, NW China. Geol. Mag. 2018, 155, 707–728. [Google Scholar] [CrossRef]
- Zhou, Q.; Qin, K.; Tang, D.; Tian, Y.; Cao, M.; Wang, C. Formation Age and Evolution Time Span of the Koktokay No. 3 Pegmatite, Altai, NW C hina: Evidence from U–Pb Zircon and 40Ar–39Ar Muscovite Ages. Resour. Geol. 2015, 65, 210–231. [Google Scholar] [CrossRef]
- Wang, C.L.; Qin, K.Z.; Tang, D.M.; Zhou, Q.F.; Shen, D.M.; Guo, Z.L.; Guo, X.J. Geochronology and Hf isotope of zircon for the Arskartor Be–Nb–Mo deposit in Altay and its geological implications. Acta Pet. Sin. 2015, 2337–2352. (In Chinese) [Google Scholar]
- Hoskin, P.W.; Schaltegger, U. The composition of zircon and igneous and metamorphic petrogenesis. Rev. Miner. Geochem. 2003, 53, 27–62. [Google Scholar] [CrossRef]
- Wang, T.; Tong, Y.; Jahn, B.M.; Zou, T.R.; Wang, Y.B.; Hong, D.W.; Han, B.F. SHRIMP U–Pb Zircon geochronology of the Altai No. 3 Pegmatite, NW China, and its implications for the origin and tectonic setting of the pegmatite. Ore Geol. Rev. 2007, 32, 325–336. [Google Scholar] [CrossRef]
- Yang, H.; Wang, W.; Liu, J.H. Zircon U-Pb dating and its geological significance of granitic pegmatites from the Kuandian and Sanjiazi area in Eastern Liaoning Province. Acta Pet. Sin. 2017, 9, 2675–2688. (In Chinese) [Google Scholar]
- Qin, J.F.; Lai, S.C.; Wang, J.; Li, Y.F. High-Mg# adakitic tonalite from the Xichahe area, South Qinling orogenic belt (central China): Petrogenesis and geological implications. Int. Geol. Rev. 2007, 49, 1145–1158. [Google Scholar]
- Qin, J.; Lai, S.; Wang, J.; Li, Y. Zircon LA-ICP MS U–Pb age, Sr–Nd–Pb isotopic compositions and geochemistry of the Triassic post-collisional Wulong adakitic granodiorite in the South Qinling, Central China, and its petrogenesis. Acta Geol. Sin. Engl. Ed. 2008, 82, 425–437. [Google Scholar]
- Yang, P.; Liu, S.; Li, Q.; Fan, Z.; Wang, Z.; Wang, D.; Wang, R.; Yan, Q.; Zhen, Y. Ages of the Laocheng Granitoids and Crustal Growth in the South Qinling Tectonic Domain, Central China: Zircon U–Pb and Lu–Hf Isotopic Constraints. Acta Geol. Sin. Engl. Ed. 2011, 85, 854–869. [Google Scholar] [CrossRef]
- Qin, J.F.; Lai, S.C.; Li, Y.F. Multi-stage granitic magmatism during exhumation of subducted continental lithosphere: Evidence from the Wulong pluton, South Qinling. Gondwana Res. 2013, 24, 1108–1126. [Google Scholar] [CrossRef]
- Zhang, F.; Liu, S.; Xu, C.; Li, Q.; Dai, J.; Yang, K.; Wu, F.; Chen, Y. Xiba granitic pluton in the Qinling orogenic belt, central China: Its petrogenesis and tectonic implications. Acta Geol. Sin. Engl. Ed. 2012, 86, 1128–1142. [Google Scholar]
- Dill, H.G. Pegmatites and aplites: Their genetic and applied ore geology. Ore Geol. Rev. 2015, 69, 417–561. [Google Scholar] [CrossRef]
- Selway, J.B.; Breaks, F.W.; Tindle, A.G. A review of rare-element (Li–Cs–Ta) pegmatite exploration techniques for the Superior Province, Canada, and large worldwide tantalum deposits. Explor. Min. Geol. 2005, 14, 1–30. [Google Scholar] [CrossRef]
- Halliday, A.; Davidson, J.P.; Hildreth, W.; Holden, P. Modelling the petrogenesis of high Rb/Sr silicic magmas. Chem. Geol. 1991, 92, 107–114. [Google Scholar] [CrossRef] [Green Version]
- Gamage, S.J.K.; Rupasinghe, M.S.; Dissanayake, C.B. Application of Rb-Sr ratios to gem exploration in the granulite belt of Sri Lanka. J. Geochem. Explor. 1992, 43, 281–292. [Google Scholar] [CrossRef]
- Raimbault, L.; Cuney, M.; Azencott, C.; Duthou, J.L.; Joron, J.L. Geochemical evidence for a multistage magmatic genesis of Ta-Sn-Li mineralization in the granite at Beauvoir, French Massif Central. Econ. Geol. 1995, 90, 548–576. [Google Scholar] [CrossRef]
- Xie, L.; Wang, R.C.; Zhu, J.C.; Lu, J.J.; Zhang, W.L.; Che, X.D.; Zhang, R.Q.; Huang, F.F. Felsic dykes in the metallogenic area of southern Hunan Province and their implications for mineralization and exploration. Acta Pet. Sin. 2013, 29, 4261–4280. (In Chinese) [Google Scholar]
- Linnen, R.L.; Keppler, H. Melt composition control of Zr/Hf fractionation in magmatic processes. Geochim. Cosmochim. Acta 2002, 66, 3293–3301. [Google Scholar] [CrossRef]
- Li, J.; Huang, X.L.; He, P.L.; Li, W.X.; Yu, Y.; Chen, L.L. In situ analyses of micas in the Yashan granite, South China: Constraints on magmatic and hydrothermal evolutions of W and Ta–Nb bearing granites. Ore Geol. Rev. 2015, 65, 793–810. [Google Scholar] [CrossRef]
- Bau, M. Controls on the fractionation of isovalent trace elements in magmatic and aqueous systems: Evidence from Y/Ho, Zr/Hf, and lanthanide tetrad effect. Contrib. Miner. Pet. 1996, 123, 323–333. [Google Scholar] [CrossRef]
- Nash, W.P.; Crecraft, H.R. Partition coefficients for trace elements in silicic magmas. Geochim. Cosmochim. Acta 1985, 49, 2309–2322. [Google Scholar] [CrossRef]
- Rollinson, H. Using Geochemical Data: Evaluation, Presentation, Interpretation; Longman Geochemistry Society: London, UK, 1993; pp. 1–352. [Google Scholar]
- Bea, F. Residence of REE, Y, Th and U in granites and crustal protoliths; implications for the chemistry of crustal melts. J. Pet. 1996, 37, 521–552. [Google Scholar] [CrossRef]
- Shao, T.Q.; Jiang, K.T.; Liu, Y.H.; Tang, H.H.; Qin, J.C.; Hu, B.; Wang, Q.; Zhang, Y.N.; Zhang, H. Geochemistry and a metallogenic model for Nb-Ta-bearing granitic pegmatites from the northern Qaidam Basin. Geol. J. 2018, 53, 113–123. [Google Scholar] [CrossRef]
- Fei, G.C.; Menuge, J.F.; Li, Y.Q.; Yang, J.Y.; Deng, Y.; Chen, C.S.; Yang, Y.F.; Yang, Z.; Qin, L.Y.; Zheng, L. Petrogenesis of the Lijiagou spodumene pegmatites in Songpan-Garze Fold Belt, West Sichuan, China: Evidence from geochemistry, zircon, cassiterite and coltan UPb geochronology and Hf isotopic compositions. Lithos 2020, 364–365. [Google Scholar] [CrossRef]
- Möller, P.; Muecke, G.K. Significance of Europium anomalies in silicate melts and crystal-melt equilibria: A re-evaluation. Contrib. Miner. Pet. 1984, 87, 242–250. [Google Scholar] [CrossRef]
- D’Arco, P.; Piriou, B. Fluorescence spectra of Eu3+ in synthetic polycrystalline anorthite: Distribution of Eu3+ in the structure. Am. Miner. 1989, 74, 191–199. [Google Scholar]
- Kimata, M. The crystal structure of non-stoichiometric Eu-anorthite: An explanation of the Eu-positive anomaly. Miner. Mag. 1988, 52, 257–265. [Google Scholar] [CrossRef] [Green Version]
- Walker, R.J.; Hanson, G.N.; Papike, J.J.; O’neil, J.R.; Laul, J.C. Internal evolution of the Tin Mountain pegmatite, Black Hills, South Dakota. Am. Miner. 1986, 71, 440–459. [Google Scholar]
- Michallik, R.M.; Wagner, T.; Fusswinkel, T.; Heinonen, J.S.; Heikkilä, P. Chemical evolution and origin of the Luumäki gem beryl pegmatite: Constraints from mineral trace element chemistry and fractionation modeling. Lithos 2017, 274, 147–168. [Google Scholar] [CrossRef]
- Černý, P.; Masau, M.; Goad, B.E.; Ferreira, K. The Greer Lake leucogranite, Manitoba, and the origin of lepidolite-subtype granitic pegmatites. Lithos 2005, 80, 305–321. [Google Scholar] [CrossRef]
- Roda, E.; Pesquera, A.; Fontan, F.; Keller, P. Phosphate mineral associations in the Canada pegmatite (Salamanca, Spain): Paragenetic relationships, chemical compositions, and implications for pegmatite evolution. Am. Miner. 2004, 89, 110–125. [Google Scholar] [CrossRef]
- Linnen, R.L.; Van Lichtervelde, M.; Černý, P. Granitic pegmatites as sources of strategic metals. Elements 2012, 8, 275–280. [Google Scholar] [CrossRef]
- Bea, F.; Fershtater, G.; Corretgé, L. The geochemistry of phosphorus in granite rocks and the effect of aluminium. Lithos 1992, 29, 43–56. [Google Scholar] [CrossRef]
- Blundy, J.D.; Wood, B.J. Crystal-chemical controls on the partitioning of Sr and Ba between plagioclase feldspar, silicate melts, and hydrothermal solutions. Geochim. Cosmochim. Acta 1991, 55, 193–209. [Google Scholar] [CrossRef]
- Chappell, B. Aluminium saturation in I-and S-type granites and the characterization of fractionated haplogranites. Lithos 1999, 46, 535–551. [Google Scholar] [CrossRef]
- Stilling, A.; Černý, P.; Vanstone, P.J. The Tanco pegmatite at Bernic Lake, Manitoba. XVI. Zonal and bulk compositions and their petrogenetic significance. Can. Miner. 2006, 44, 599–623. [Google Scholar] [CrossRef]
- Sha, L.K.; Chappell, B.W. Apatite chemical composition, determined by electron microprobe and laser-ablation inductively coupled plasma mass spectrometry, as a probe into granite petrogenesis. Geochim. Cosmochim. Acta 1999, 63, 3861–3881. [Google Scholar] [CrossRef]
- Belousova, E.; Griffin, W.; O’Reilly, S.Y.; Fisher, N. Apatite as an indicator mineral for mineral exploration: Trace-element compositions and their relationship to host rock type. J. Geochem. Explor. 2002, 76, 45–69. [Google Scholar] [CrossRef]
- Swanson, S.E. Mineralogy of spodumene pegmatites and related rocks in the tin–spodumene belt of North Carolina and South Carolina, USA. Can. Miner. 2012, 50, 1589–1608. [Google Scholar] [CrossRef]
- Cao, M.J.; Zhou, Q.F.; Qin, K.Z.; Tang, D.M.; Evans, N.J. The tetrad effect and geochemistry of apatite from the Altay Koktokay No. 3 pegmatite, Xinjiang, China: Implications for pegmatite petrogenesis. Miner. Pet. 2013, 107, 985–1005. [Google Scholar] [CrossRef] [Green Version]
- Miles, A.; Graham, C.; Hawkesworth, C.; Gillespie, M.; Hinton, R.; Bromiley, G. Apatite: A new redox proxy for silicic magmas? Geochim. Cosmochim. Acta 2014, 132, 101–119. [Google Scholar] [CrossRef] [Green Version]
- Marks, M.A.; Scharrer, M.; Ladenburger, S.; Markl, G. Comment on” Apatite: A new redox proxy for silicic magmas?”[Geochimica et Cosmochimica Acta 132 (2014) 101-119]. Geochim. Cosmochim. Acta 2016, 183, 267–270. [Google Scholar] [CrossRef]
- Mathez, E.A.; Webster, J.D. Partitioning behavior of chlorine and fluorine in the system apatite-silicate melt-fluid. Geochim. Cosmochim. Acta 2005, 49, 1275–1286. [Google Scholar] [CrossRef]
- Webster, J.D.; Tappen, C.M.; Mandeville, C.M. Partitioning behavior of chlorine and fluorine in the system apatite–melt–fluid. II: Felsic silicate systems at 200 MPa. Geochim. Cosmochim. Acta 2009, 73, 559–581. [Google Scholar] [CrossRef]


| Sample | Barren Pegmatite | Rb-Rich Pegmatite | ||||||
|---|---|---|---|---|---|---|---|---|
| LZP03-1 | LZP03-2 | DZXG01-1 | DZXG01-2 | DZXG01-3 | XJ01-3 | XJ01-1 | XJ01-2 | |
| SiO2 | 75.05 | 72.27 | 76.71 | 74.58 | 74.73 | 73.87 | 72.46 | - |
| Al2O3 | 14.50 | 16.34 | 13.46 | 14.89 | 15.03 | 14.75 | 17.57 | - |
| MgO | 0.10 | 0.16 | 0.10 | 0.11 | 0.13 | 0.11 | 0.04 | - |
| Na2O | 2.61 | 2.96 | 4.03 | 5.21 | 5.31 | 3.93 | 4.18 | - |
| K2O | 5.76 | 5.84 | 4.17 | 3.00 | 2.12 | 6.15 | 2.94 | - |
| P2O5 | 0.08 | 0.10 | 0.12 | 0.10 | 0.15 | 0.06 | 0.29 | - |
| TiO2 | 0.07 | 0.11 | 0.06 | 0.05 | 0.07 | 0.09 | 0.04 | - |
| CaO | 0.73 | 0.80 | 0.76 | 0.95 | 1.17 | 0.68 | 0.47 | - |
| FeOT | 0.50 | 0.67 | 0.42 | 0.62 | 0.52 | 0.39 | 0.21 | - |
| MnO | 0.10 | 0.12 | 0.06 | 0.13 | 0.04 | 0.02 | 0.08 | - |
| LOI | 0.67 | 0.96 | 0.55 | 0.54 | 0.77 | 0.46 | 1.61 | - |
| Sum | 100.19 | 100.32 | 100.44 | 100.17 | 100.03 | 100.51 | 99.89 | - |
| A/CNK | 1.22 | 1.29 | 1.07 | 1.10 | 1.14 | 1.03 | 1.61 | - |
| A/NK | 1.38 | 1.46 | 1.21 | 1.26 | 1.36 | 1.12 | 1.74 | - |
| Na2O + K2O | 8.37 | 8.80 | 8.19 | 8.21 | 7.43 | 10.08 | 7.12 | - |
| Li | 18.18 | 28.26 | 73.58 | 59.30 | 96.59 | 30.67 | 17.60 | 16.91 |
| Be | 4.41 | 7.41 | 5.61 | 5.92 | 6.01 | 3.41 | 184.09 | 171.15 |
| Sc | 3.54 | 8.04 | 2.56 | 3.24 | 3.52 | 6.35 | 0.88 | 0.75 |
| Ti | 205.22 | 442.16 | 108.27 | 71.36 | 147.59 | 322.60 | 6.39 | 6.52 |
| V | 4.16 | 2.73 | 0.69 | 0.62 | 3.11 | 3.16 | 1.04 | 0.99 |
| Cr | 2.02 | 3.73 | 1.70 | 5.56 | 4.54 | 4.23 | 2.59 | 4.22 |
| Mn | 707.55 | 875.58 | 453.39 | 908.04 | 259.98 | 145.26 | 501.43 | 505.98 |
| Co | 0.19 | 0.25 | 0.20 | 0.10 | 0.10 | 0.28 | 0.05 | 0.06 |
| Ni | 0.68 | 1.29 | 0.30 | 2.14 | 1.67 | 1.68 | 1.09 | 1.96 |
| Cu | 0.03 | 9.20 | 2.31 | 0.64 | 0.03 | 3.40 | bdl. | bdl. |
| Zn | 12.37 | 24.85 | 27.24 | 30.65 | 30.11 | 15.71 | 33.33 | 33.09 |
| Ga | 20.23 | 31.20 | 14.37 | 15.55 | 15.25 | 22.62 | 22.46 | 21.48 |
| Rb | 192.11 | 213.40 | 205.16 | 161.39 | 119.79 | 237.85 | 1043.29 | 1049.65 |
| Cs | 6.25 | 7.61 | 11.26 | 17.85 | 12.77 | 10.35 | 657.84 | 650.40 |
| Sr | 56.76 | 64.64 | 21.46 | 20.11 | 29.59 | 69.69 | 49.53 | 49.57 |
| Y | 25.28 | 21.59 | 10.90 | 10.24 | 10.55 | 10.07 | 1.09 | 1.05 |
| Nb | 16.24 | 29.67 | 12.82 | 14.80 | 15.92 | 17.61 | 133.74 | 125.07 |
| Ta | 1.35 | 2.30 | 1.45 | 1.82 | 2.28 | 1.77 | 65.50 | 69.14 |
| Mo | 0.09 | 0.10 | 0.13 | 0.07 | 0.03 | 0.13 | 0.09 | 0.11 |
| Sn | 4.74 | 9.20 | 5.64 | 6.10 | 6.51 | 6.82 | 126.40 | 127.38 |
| Ba | 229.45 | 232.63 | 28.52 | 8.16 | 9.20 | 151.98 | 9.95 | 9.35 |
| La | 7.99 | 5.46 | 3.27 | 3.79 | 3.68 | 3.14 | 1.79 | 1.72 |
| Ce | 17.66 | 11.85 | 6.73 | 7.81 | 7.94 | 5.45 | 1.57 | 1.52 |
| Pr | 2.10 | 1.39 | 0.84 | 0.85 | 0.88 | 0.64 | 0.23 | 0.21 |
| Nd | 7.62 | 5.15 | 3.11 | 2.82 | 3.22 | 2.33 | 0.81 | 0.77 |
| Sm | 2.73 | 1.92 | 1.05 | 1.00 | 1.15 | 0.77 | 0.13 | 0.13 |
| Eu | 0.26 | 0.23 | 0.09 | 0.04 | 0.06 | 0.21 | 0.04 | 0.04 |
| Gd | 2.91 | 2.17 | 1.06 | 1.01 | 1.28 | 0.93 | 0.13 | 0.12 |
| Tb | 0.64 | 0.51 | 0.25 | 0.25 | 0.29 | 0.21 | 0.01 | 0.01 |
| Dy | 4.12 | 3.44 | 1.54 | 1.66 | 1.84 | 1.53 | 0.12 | 0.12 |
| Ho | 0.76 | 0.66 | 0.32 | 0.29 | 0.32 | 0.30 | 0.01 | 0.01 |
| Er | 2.18 | 1.98 | 1.01 | 0.81 | 0.86 | 0.94 | 0.05 | 0.05 |
| Tm | 0.33 | 0.32 | 0.20 | 0.13 | 0.12 | 0.15 | bdl. | bdl. |
| Yb | 2.34 | 2.37 | 1.48 | 0.96 | 0.84 | 1.10 | 0.04 | 0.04 |
| Lu | 0.32 | 0.33 | 0.25 | 0.12 | 0.11 | 0.16 | bdl. | bdl. |
| Zr | 43.47 | 34.19 | 20.55 | 28.61 | 31.46 | 15.50 | 26.73 | 27.33 |
| Hf | 2.40 | 1.94 | 1.13 | 1.64 | 1.54 | 1.00 | 3.10 | 3.51 |
| W | 1.39 | 2.51 | 1.12 | 1.76 | 1.81 | 1.65 | 4.27 | 4.32 |
| Tl | 0.89 | 0.94 | 0.88 | 0.70 | 0.47 | 1.15 | 6.31 | 6.33 |
| Pb | 36.48 | 35.78 | 33.69 | 24.30 | 20.63 | 39.61 | 22.60 | 21.98 |
| Th | 5.67 | 3.75 | 1.79 | 2.18 | 2.34 | 2.02 | 1.01 | 0.96 |
| U | 4.81 | 5.06 | 2.05 | 3.50 | 2.32 | 5.60 | 1.68 | 1.62 |
| ΣREE | 51.96 | 37.78 | 21.22 | 21.54 | 22.59 | 17.84 | 4.94 | 4.74 |
| (La/Yb)N | 2.45 | 1.65 | 1.58 | 2.83 | 3.14 | 2.05 | 35.50 | 27.67 |
| δEu | 0.28 | 0.35 | 0.26 | 0.12 | 0.16 | 0.37 | 0.99 | 0.97 |
| Nb/Ta | 12.02 | 12.91 | 8.86 | 8.15 | 6.97 | 9.95 | 21.07 | 21.17 |
| Zr/Hf | 18.09 | 17.61 | 18.18 | 17.48 | 20.41 | 15.55 | 8.64 | 7.78 |
| Rb/Sr | 3.38 | 3.30 | 9.56 | 8.03 | 4.05 | 3.41 | 2.04 | 1.81 |
| Sample | Muscovite from Barren Pegmatite | Muscovite from Rb-Rich Pegmatite | |||||||||||
|---|---|---|---|---|---|---|---|---|---|---|---|---|---|
| LZP03-1-5 | LZP03-1-6 | LZP03-1-7 | DZXG01-1-4 | DZXG01-1-5 | DZXG01-1-6 | XJ03-1-6 | XJ03-1-7 | XJ03-1-8 | XJ01-1-12 | XJ01-1-13 | XJ01-1-14 | XJ01-1-15 | |
| SiO2 | 45.84 | 45.44 | 45.84 | 45.87 | 45.94 | 45.73 | 47.58 | 47.42 | 48.14 | 48.21 | 48.89 | 46.48 | 46.14 |
| TiO2 | 0.27 | 0.23 | 0.27 | 0.21 | 0.17 | 0.14 | 0.47 | 0.97 | 0.64 | 0.03 | bdl. | bdl. | 0.02 |
| Al2O3 | 35.14 | 35.37 | 35.43 | 34.06 | 34.30 | 34.33 | 32.78 | 30.1 | 30.52 | 36.48 | 35.16 | 37.18 | 37.17 |
| FeO | 2.10 | 1.98 | 1.92 | 2.29 | 2.35 | 2.25 | 2.48 | 3.00 | 3.64 | 0.63 | 0.32 | 0.33 | 0.28 |
| MnO | 0.03 | bdl. | 0.02 | 0.04 | 0.03 | 0.07 | 0.00 | 0.03 | 0.00 | bdl. | 0.08 | 0.02 | bdl. |
| MgO | 0.67 | 0.71 | 0.64 | 0.57 | 0.55 | 0.61 | 0.54 | 1.62 | 1.10 | 0.02 | bdl. | bdl. | bdl. |
| CaO | 0.03 | 0.03 | 0.07 | bdl. | bdl. | bdl. | 0.02 | bdl. | 0.06 | 0.02 | 0.01 | 0.03 | bdl. |
| Na2O | 0.54 | 0.57 | 0.64 | 0.49 | 0.45 | 0.56 | 0.10 | 0.16 | 0.14 | 0.52 | 0.75 | 0.96 | 0.89 |
| K2O | 10.04 | 9.96 | 9.91 | 10.28 | 10.21 | 10.51 | 10.65 | 10.91 | 10.24 | 8.26 | 8.01 | 8.31 | 8.27 |
| Rb2O | bdl. | bdl. | bdl. | 0.08 | bdl. | bdl. | bdl. | bdl. | bdl. | 0.29 | 0.41 | 0.41 | 0.38 |
| Cl | bdl. | bdl. | 0.05 | bdl. | bdl. | bdl. | 0.02 | bdl. | 0.03 | bdl. | 0.02 | bdl. | bdl. |
| F | bdl. | 0.29 | bdl. | 0.36 | 0.26 | 0.44 | bdl. | 0.2 | 0.26 | 0.05 | 0.13 | 0.08 | 0.01 |
| Li2O * | 0.01 | 0.24 | 0.01 | 0.29 | 0.22 | 0.36 | 0.01 | 0.17 | 0.22 | 0.05 | 0.12 | 0.08 | 0.02 |
| H2O * | 4.47 | 4.32 | 4.47 | 4.25 | 4.31 | 4.22 | 4.46 | 4.32 | 4.31 | 4.54 | 4.46 | 4.47 | 4.48 |
| O = F,Cl | 0.00 | 0.12 | 0.01 | 0.15 | 0.11 | 0.19 | 0.00 | 0.08 | 0.12 | 0.02 | 0.06 | 0.04 | 0.00 |
| Total | 99.14 | 99.03 | 99.26 | 98.66 | 98.69 | 99.05 | 99.11 | 98.90 | 99.30 | 99.08 | 98.31 | 98.31 | 97.66 |
| K/Rb | - | - | - | 117 | - | - | - | - | - | 26 | 18 | 18 | 20 |
| O = 22 atoms per formula unit (a.p.f.u.) | |||||||||||||
| Si | 6.15 | 6.10 | 6.14 | 6.20 | 6.20 | 6.17 | 6.40 | 6.44 | 6.50 | 6.33 | 6.46 | 6.18 | 6.17 |
| Al IV | 1.85 | 1.90 | 1.86 | 1.80 | 1.80 | 1.83 | 1.60 | 1.56 | 1.50 | 1.67 | 1.54 | 1.82 | 1.83 |
| Al VI | 3.71 | 3.70 | 3.73 | 3.63 | 3.66 | 3.62 | 3.59 | 3.26 | 3.35 | 3.98 | 3.94 | 4.00 | 4.03 |
| Ti | 0.03 | 0.02 | 0.03 | 0.02 | 0.02 | 0.01 | 0.05 | 0.10 | 0.06 | 0.00 | 0.00 | 0.00 | 0.00 |
| Fe | 0.24 | 0.22 | 0.21 | 0.26 | 0.27 | 0.25 | 0.28 | 0.34 | 0.41 | 0.07 | 0.04 | 0.04 | 0.03 |
| Mn | 0.00 | 0.00 | 0.00 | 0.00 | 0.00 | 0.01 | 0.00 | 0.00 | 0.00 | 0.00 | 0.01 | 0.00 | 0.00 |
| Mg | 0.13 | 0.14 | 0.13 | 0.11 | 0.11 | 0.12 | 0.11 | 0.33 | 0.22 | 0.00 | 0.00 | 0.00 | 0.00 |
| Li | 0.01 | 0.13 | 0.01 | 0.16 | 0.12 | 0.19 | 0.01 | 0.09 | 0.12 | 0.03 | 0.06 | 0.04 | 0.01 |
| Ca | 0.00 | 0.00 | 0.01 | 0.00 | 0.00 | 0.00 | 0.00 | 0.00 | 0.01 | 0.00 | 0.00 | 0.00 | 0.00 |
| Na | 0.14 | 0.15 | 0.17 | 0.13 | 0.12 | 0.15 | 0.03 | 0.04 | 0.04 | 0.13 | 0.19 | 0.25 | 0.23 |
| K | 1.72 | 1.71 | 1.69 | 1.77 | 1.76 | 1.81 | 1.83 | 1.89 | 1.76 | 1.38 | 1.35 | 1.41 | 1.41 |
| Rb | 0.00 | 0.00 | 0.00 | 0.01 | 0.00 | 0.00 | 0.00 | 0.00 | 0.00 | 0.02 | 0.03 | 0.04 | 0.03 |
| F | 0.00 | 0.12 | 0.00 | 0.15 | 0.11 | 0.19 | 0.00 | 0.09 | 0.11 | 0.02 | 0.06 | 0.04 | 0.00 |
| Cl | 0.00 | 0.00 | 0.01 | 0.00 | 0.00 | 0.00 | 0.00 | 0.00 | 0.01 | 0.00 | 0.00 | 0.00 | 0.00 |
| OH * | 4.00 | 3.88 | 3.99 | 3.85 | 3.89 | 3.81 | 4.00 | 3.91 | 3.88 | 3.98 | 3.94 | 3.96 | 4.00 |
| Sample | Albite from Barren Pegmatite | K-Feldspar from Barren Pegmatite | Albite from Rb-Rich Pegmatite | |||||||||||||
|---|---|---|---|---|---|---|---|---|---|---|---|---|---|---|---|---|
| DZXG01-1 | DZXG01-2 | DZXG01-3 | DZXG01-4 | XJ03-2 | DZXG01-1 | DZXG01-2 | DZXG01-3 | DZXG01-4 | XJ03-3 | XJ01-2 | XJ01-3 | XJ01-4 | XJ01-5 | XJ01-6 | XJ01-8 | |
| SiO2 | 65.61 | 67.85 | 66.14 | 65.95 | 67.97 | 64.62 | 64.12 | 64.45 | 64.35 | 64.68 | 69.01 | 69.45 | 68.31 | 67.81 | 68.18 | 68.22 |
| Al2O3 | 20.39 | 19.13 | 19.93 | 20.08 | 19.25 | 17.86 | 17.86 | 18.11 | 17.90 | 17.98 | 19.80 | 19.62 | 19.53 | 19.52 | 19.10 | 19.30 |
| CaO | 2.10 | 0.44 | 1.98 | 2.01 | 0.35 | 0.03 | 0.02 | 0.03 | 0.02 | 0.06 | 0.09 | 0.04 | 0.05 | 0.03 | bdl. | 0.02 |
| Na2O | 10.51 | 11.37 | 10.71 | 10.79 | 11.62 | 0.55 | 0.44 | 0.81 | 0.62 | 0.90 | 11.30 | 11.30 | 11.17 | 11.49 | 11.41 | 11.57 |
| K2O | 0.27 | 0.09 | 0.19 | 0.21 | 0.12 | 16.20 | 16.47 | 15.71 | 15.82 | 15.99 | 0.06 | 0.04 | 0.08 | 0.09 | 0.11 | 0.14 |
| P2O5 | 0.14 | 0.13 | 0.11 | 0.18 | 0.05 | 0.06 | 0.09 | 0.12 | 0.05 | 0.09 | 0.45 | 0.04 | 0.08 | 0.22 | 0.14 | 0.28 |
| Rb2O | bdl. | bdl. | bdl. | bdl. | bdl. | 0.06 | 0.10 | bdl. | bdl. | bdl. | 0.12 | 0.10 | 0.12 | 0.13 | 0.14 | 0.10 |
| Total | 99.02 | 99.01 | 99.06 | 99.22 | 99.36 | 99.38 | 99.10 | 99.23 | 98.76 | 99.70 | 100.84 | 100.58 | 99.33 | 99.28 | 99.07 | 99.63 |
| O=8 atoms per formula unit (a.p.f.u.) | ||||||||||||||||
| Si | 2.92 | 3.00 | 2.94 | 2.93 | 2.99 | 3.01 | 3.00 | 3.00 | 3.01 | 3.00 | 2.99 | 3.01 | 3.00 | 2.99 | 3.01 | 3.00 |
| Al | 1.07 | 1.00 | 1.04 | 1.05 | 0.99 | 0.98 | 0.99 | 0.99 | 0.99 | 0.98 | 1.01 | 1.00 | 1.01 | 1.01 | 0.99 | 1.00 |
| Ca | 0.10 | 0.02 | 0.09 | 0.10 | 0.01 | 0.00 | 0.00 | 0.00 | 0.00 | 0.00 | 0.00 | 0.00 | 0.00 | 0.00 | 0.00 | 0.00 |
| Na | 0.91 | 0.97 | 0.92 | 0.93 | 0.99 | 0.05 | 0.04 | 0.07 | 0.06 | 0.08 | 0.95 | 0.95 | 0.95 | 0.98 | 0.98 | 0.98 |
| K | 0.02 | 0.01 | 0.01 | 0.01 | 0.00 | 0.96 | 0.98 | 0.93 | 0.94 | 0.94 | 0.00 | 0.00 | 0.00 | 0.00 | 0.01 | 0.01 |
| P | 0.00 | 0.00 | 0.00 | 0.00 | 0.00 | 0.00 | 0.00 | 0.00 | 0.00 | 0.00 | 0.01 | 0.00 | 0.00 | 0.00 | 0.00 | 0.01 |
| Rb | 0.00 | 0.00 | 0.00 | 0.00 | 0.00 | 0.00 | 0.00 | 0.00 | 0.00 | 0.00 | 0.00 | 0.00 | 0.00 | 0.00 | 0.00 | 0.00 |
| End-member components (moles %) | ||||||||||||||||
| An | 9.80 | 2.10 | 9.20 | 9.20 | 1.60 | 0.20 | 0.10 | 0.20 | 0.10 | 0.30 | 0.43 | 0.17 | 0.26 | 0.16 | 0.00 | 0.10 |
| Ab | 88.70 | 97.40 | 89.80 | 89.60 | 97.70 | 4.90 | 3.90 | 7.30 | 5.60 | 7.90 | 99.21 | 99.63 | 99.29 | 99.34 | 99.39 | 99.11 |
| Or | 1.50 | 0.50 | 1.10 | 1.20 | 0.70 | 95.00 | 96.00 | 92.60 | 94.30 | 91.90 | 0.36 | 0.20 | 0.45 | 0.50 | 0.61 | 0.79 |
| Sample | Apatite from Barren Pegmatite | Apatite from Rb-Rich Pegmatite | ||||||||||
|---|---|---|---|---|---|---|---|---|---|---|---|---|
| LZP03-1-1 | LZP03-2-1 | LZP03-2-2 | DZXG01-1-1 | DZXG01-1-2 | DZXG01-1-3 | XJ01-1-1 | XJ01-1-2 | XJ01-1-3 | XJ01-1-4 | XJ01-1-5 | XJ01-1-6 | |
| P2O5 | 42.00 | 42.16 | 42.13 | 42.20 | 41.90 | 41.47 | 41.62 | 42.83 | 41.49 | 41.12 | 42.12 | 42.24 |
| CaO | 54.71 | 55.18 | 54.89 | 54.39 | 54.68 | 54.92 | 36.93 | 38.72 | 36.53 | 36.74 | 36.29 | 40.17 |
| FeO | 0.13 | 0.15 | 0.30 | 0.06 | 0.25 | 0.25 | 0.78 | 0.37 | 0.82 | 0.80 | 0.73 | 0.25 |
| MnO | 0.34 | 0.42 | 0.54 | 0.36 | 0.45 | 0.45 | 19.12 | 16.28 | 18.96 | 18.98 | 18.53 | 14.51 |
| MgO | bdl. | 0.02 | 0.02 | bdl. | 0.03 | bdl. | bdl. | 0.01 | bdl. | bdl. | bdl. | bdl. |
| Na2O | 0.11 | 0.11 | 0.05 | 0.10 | bdl. | 0.11 | 0.12 | 0.01 | 0.11 | 0.12 | 0.11 | 0.04 |
| Cl | bdl. | 0.02 | bdl. | bdl. | 0.02 | bdl. | 0.12 | 0.14 | 0.16 | 0.12 | 0.15 | 0.14 |
| F | 3.56 | 3.27 | 2.85 | 3.32 | 3.38 | 3.30 | 2.97 | 3.20 | 3.37 | 3.28 | 2.86 | 2.85 |
| H2O * | 0.09 | 0.23 | 0.43 | 0.20 | 0.17 | 0.20 | 0.30 | 0.20 | 0.09 | 0.13 | 0.34 | 0.35 |
| O=F,Cl | −1.5 | −1.38 | −1.2 | −1.4 | −1.43 | −1.39 | −1.28 | −1.38 | −1.46 | −1.41 | −1.24 | −1.23 |
| Total | 99.44 | 100.18 | 100.01 | 99.23 | 99.45 | 99.31 | 100.66 | 100.39 | 100.06 | 99.88 | 99.89 | 99.31 |
| P | 6.01 | 5.99 | 5.99 | 6.03 | 6.00 | 5.96 | 6.09 | 6.20 | 6.11 | 6.08 | 6.17 | 6.17 |
| Ca | 9.90 | 9.92 | 9.88 | 9.84 | 9.90 | 9.99 | 6.84 | 7.09 | 6.80 | 6.87 | 6.73 | 7.42 |
| Fe | 0.02 | 0.02 | 0.04 | 0.01 | 0.04 | 0.04 | 0.11 | 0.05 | 0.12 | 0.12 | 0.11 | 0.04 |
| Mn | 0.05 | 0.06 | 0.08 | 0.05 | 0.06 | 0.06 | 2.80 | 2.36 | 2.79 | 2.81 | 2.72 | 2.12 |
| Mg | 0.00 | 0.01 | 0.01 | 0.00 | 0.01 | 0.00 | 0.00 | 0.00 | 0.00 | 0.00 | 0.00 | 0.00 |
| Na | 0.04 | 0.04 | 0.02 | 0.03 | 0.00 | 0.04 | 0.04 | 0.00 | 0.04 | 0.04 | 0.04 | 0.01 |
| Cl | 0.00 | 0.01 | 0.00 | 0.00 | 0.01 | 0.00 | 0.03 | 0.04 | 0.05 | 0.03 | 0.04 | 0.04 |
| F | 1.90 | 1.74 | 1.51 | 1.77 | 1.81 | 1.77 | 1.62 | 1.73 | 1.85 | 1.81 | 1.56 | 1.55 |
| OH* | 0.10 | 0.26 | 0.49 | 0.23 | 0.19 | 0.23 | 0.34 | 0.23 | 0.10 | 0.15 | 0.39 | 0.41 |
| SampleTitle | Element (ppm) | Th/U | Isotope Ratio | Age (Ma) | |||||||
|---|---|---|---|---|---|---|---|---|---|---|---|
| Th | U | 207Pb/235U | 1σ | 206Pb/238U | 1σ | 207Pb/235U | 1σ | 206Pb/238U | 1σ | ||
| Sample LZP03 | |||||||||||
| 1 | 816 | 586 | 1.393 | 1.1429 | 0.0247 | 0.1270 | 0.0018 | 774 | 12 | 771 | 10 |
| 2 | 1458 | 1114 | 1.308 | 0.5944 | 0.0150 | 0.0760 | 0.0013 | 474 | 10 | 472 | 8 |
| 3 | 1089 | 888 | 1.226 | 0.7227 | 0.0210 | 0.0916 | 0.0017 | 552 | 12 | 565 | 10 |
| 4 | 1259 | 2493 | 0.505 | 0.2266 | 0.0060 | 0.0327 | 0.0006 | 207 | 5 | 208 | 4 |
| 5 | 1179 | 1679 | 0.702 | 0.9216 | 0.0163 | 0.1084 | 0.0015 | 663 | 9 | 664 | 9 |
| 6 | 771 | 649 | 1.189 | 1.2463 | 0.0303 | 0.1375 | 0.0025 | 822 | 14 | 831 | 14 |
| 7 | 491 | 2275 | 0.216 | 0.2310 | 0.0060 | 0.0334 | 0.0005 | 211 | 5 | 212 | 3 |
| 8 | 1868 | 727 | 2.569 | 1.0417 | 0.0214 | 0.1174 | 0.0017 | 725 | 11 | 716 | 10 |
| Sample DZXG01 | |||||||||||
| 1 | 218 | 10,836 | 0.020 | 0.3170 | 0.0067 | 0.0355 | 0.0006 | 280 | 5 | 225 | 4 |
| 2 | 491 | 7240 | 0.068 | 0.6655 | 0.0283 | 0.0361 | 0.0009 | 518 | 17 | 229 | 5 |
| 3 | 793 | 9015 | 0.088 | 0.4844 | 0.0338 | 0.0362 | 0.0010 | 401 | 23 | 230 | 6 |
| 4 | 186 | 12,941 | 0.014 | 0.5848 | 0.0561 | 0.0411 | 0.0011 | 468 | 36 | 260 | 7 |
| 5 | 1115 | 4882 | 0.228 | 0.5825 | 0.0250 | 0.0354 | 0.0006 | 466 | 16 | 225 | 4 |
| 6 | 323 | 8437 | 0.038 | 1.6545 | 0.0509 | 0.0519 | 0.0011 | 991 | 19 | 326 | 7 |
| 7 | 1358 | 5266 | 0.258 | 0.7202 | 0.0388 | 0.0369 | 0.0007 | 551 | 23 | 234 | 4 |
| 8 | 179 | 6978 | 0.026 | 0.3182 | 0.0092 | 0.0342 | 0.0007 | 281 | 7 | 217 | 4 |
| 9 | 758 | 10,702 | 0.071 | 1.2831 | 0.1187 | 0.0466 | 0.0010 | 838 | 53 | 294 | 6 |
| Sample XJ01-4 | |||||||||||
| 1 | 1863 | 1674 | 1.113 | 0.2292 | 0.0079 | 0.0316 | 0.0008 | 210 | 7 | 200 | 5 |
| 2 | 1485 | 1321 | 1.124 | 0.2299 | 0.0079 | 0.0313 | 0.0005 | 210 | 7 | 199 | 3 |
| 3 | 1816 | 1405 | 1.292 | 0.2237 | 0.0056 | 0.0315 | 0.0004 | 205 | 5 | 200 | 2 |
| 4 | 806 | 1094 | 0.737 | 0.2260 | 0.0089 | 0.0333 | 0.0008 | 207 | 7 | 211 | 5 |
| 5 | 542 | 771 | 0.703 | 0.2238 | 0.0087 | 0.327 | 0.0006 | 205 | 7 | 208 | 4 |
| 6 | 446 | 700 | 0.637 | 0.2127 | 0.0091 | 0.0320 | 0.0006 | 196 | 8 | 203 | 4 |
| 7 | 295 | 501 | 0.589 | 0.2246 | 0.0095 | 0.0329 | 0.0006 | 206 | 8 | 209 | 4 |
© 2020 by the authors. Licensee MDPI, Basel, Switzerland. This article is an open access article distributed under the terms and conditions of the Creative Commons Attribution (CC BY) license (http://creativecommons.org/licenses/by/4.0/).
Share and Cite
Nie, X.; Wang, Z.; Chen, L.; Wang, G.; Li, Z. Geochemical Contrasts between Late Triassic Rb-Rich and Barren Pegmatites from Ningshan Pegmatite District, South Qinling Orogen, China: Implications for Petrogenesis and Rare Metal Exploration. Minerals 2020, 10, 582. https://doi.org/10.3390/min10070582
Nie X, Wang Z, Chen L, Wang G, Li Z. Geochemical Contrasts between Late Triassic Rb-Rich and Barren Pegmatites from Ningshan Pegmatite District, South Qinling Orogen, China: Implications for Petrogenesis and Rare Metal Exploration. Minerals. 2020; 10(7):582. https://doi.org/10.3390/min10070582
Chicago/Turabian StyleNie, Xiao, Zongqi Wang, Lei Chen, Gang Wang, and Zengda Li. 2020. "Geochemical Contrasts between Late Triassic Rb-Rich and Barren Pegmatites from Ningshan Pegmatite District, South Qinling Orogen, China: Implications for Petrogenesis and Rare Metal Exploration" Minerals 10, no. 7: 582. https://doi.org/10.3390/min10070582