Article

Correlation between the Pore Structure and Water Retention of Cemented Paste Backfill Using Centrifugal and Nuclear Magnetic Resonance Methods

1
School of Resources and Safety Engineering, Central South University, Changsha 410083, China
2
Department of Mining and Materials Engineering, McGill University, 3450 Rue University Montreal, Montreal, QC H3A 2A7, Canada
3
Research Center for Mining Engineering and Technology in Cold Regions, Central South University, Changsha 410083, China
4
Civil Engineering Research and Innovation for Sustainability, Department of Civil Engineering, Architecture and Georesources, Instituto Superior Técnico, University of Lisbon, Av. Rovisco Pais 1, 1049-001 Lisboa, Portugal
*
Author to whom correspondence should be addressed.
Minerals 2020, 10(7), 610; https://doi.org/10.3390/min10070610
Submission received: 8 June 2020 / Revised: 26 June 2020 / Accepted: 28 June 2020 / Published: 8 July 2020
(This article belongs to the Section Environmental Mineralogy and Biogeochemistry)

Abstract

:
This research combines a centrifugal test and nuclear magnetic resonance (NMR) technology to study the water retention capacity of the cemented paste backfill. Backfill samples with cement–tailings ratios of 1:4, 1:8, and 1:12, and solid concentrations of 71%, 74%, 77%, 80%, and 83% respectively, were prepared for the test. The relative centrifugal force ( RCF ) required for accurate testing and the T2 cutoff value that characterizes the water retention capacity were obtained through an NMR test on the backfill samples after centrifugation in saturated conditions. Based on the soil–water characteristic curve (SWCC), the NMR pore water characteristic distribution model was established, and the pore size distribution and effective water retention characteristics were analyzed. This study shows that when the rotating speed is between 1500 and 4000 rpm, the R C F of the backfill ranges from 125.8 to 894.4 g/min , and the T2 cutoff value will vary from 3 to 10 ms. With an increase in solid concentration of the backfill, both the RCF and T2 cutoff value decline. The Scanning Electron Microscope (SEM) analysis confirms that an increase in the solid concentration and cement–tailings ratio will lead to obvious bimodal characteristics of the pore size distribution curve of the backfill. In addition, the porosity will decrease, the critical pore value, which represents a value to distinguish pores with different movable fluid retention capabilities and characterizes the pore size classification, will become smaller, and the pore size distribution will become more diverse. These changes indicate that a high-concentration backfill can effectively reduce the flow of a fine-grained matrix with large pores.

1. Introduction

With the advancement of human society and civilization, sustainable resource development has become widely accepted. The water retention of a backfill may be disturbed by the groundwater environment, thereby affecting the stability of the stope [1,2]. What is more, the pore structure of cement-based materials, as an intrinsic property, plays a prominent role in both the mechanical properties and long-term durability [3]. The relationship between strength and pore structure in concrete has been studied for several decades [4]; however, there is a lack of literature that investigates the pore structure and the characteristics of cemented paste backfill in depth. In order to protect the mine water environment after backfilling, it is imperative to pay attention to the pore size distribution and water retention of the backfill. At present, there are few studies on the pore distribution of backfills related to water retention mechanisms. It is important to study the performance of backfill from the perspective of movable fluid transport, as the study of water retention characteristics and pore distribution is the basis for the study of related complex issues.
Many techniques have been applied to investigate the pore characteristics of hardened cement-based materials, such as mercury intrusion porosimetry (MIP), micro-computerized tomography (CT), and nuclear magnetic resonance (NMR) [5,6,7]. NMR has recently been proven to be a nondestructive and efficient technique that can provide information on T2 relaxation time versus signal intensity [8]. The reliable pore size distribution and pore fluid saturation of cement-based materials can be interpreted through NMR experimental results [9]. Moreover, NMR is an effective method for quantifying the full-range pore throat structure of rocks and concrete compared to other technologies, such as MIP and N2 adsorption [10,11]. To date, some researchers have applied the NMR technique to study the pore size distribution of cement-based materials. Liu et al. investigated the relationship between the pore characteristics and mechanical properties of cemented paste backfill [5]. Hu et al. explored the trans-scale relationship between the pore size distribution and macro parameters of backfill and slurry [12]. However, the interpretations of T2 relaxation in these studies are mainly concentrated on pore size distribution. Another promising utilization of the NMR technique is to link the water retention of cement-based materials to the soil–water characteristic curve (SWCC), which describes the relationship between soil moisture content and soil matric potential [13]. In other words, the T2 relaxation time distribution curve could be estimated by taking the SWCC as the theoretical basis. Several mathematical expressions have been successively derived to best fit the experimental data of SWCC [14,15,16], including the Fredlund and Xing SWCC model, which is widely known for fitting experimental SWCC data and provides a continuous equation that represents zero water content at a suction of 106 kPa [17]. Considering the rich meaning inherent to SWCC, many researchers have applied it to estimate the unsaturated properties of soil, such as its permeability function and unsaturated shear strength [18,19]. In order to improve the accuracy of SWCC, Li et al. [20] linked bimodal SWCC to physical parameters, and Ren et al. [21] obtained a reliable SWCC for unsaturated soils with limited experimental data. The NMR technique provides a large amount of data, which could serve as a fitting foundation for SWCC. On the other hand, the bound water and free fluid within specimens could be recognized and defined by the T2 relaxation distribution curve through a certification operation in accordance with the bimodal characteristics of the SWCC [22]. Given these reasons, it is useful to interpret T2 relaxation time distribution as water retention based on the SWCC.
For the analysis of pore water retention, researchers have conducted a large number of core T2 cutoff centrifugal calibration experiments. Most experts and scholars choose 100 psi as the best centrifugal force for calibrating core T2 cutoff values, but the relevant reports are rare in China. The Chinese industry standard Specification for Normalization Measurement of Core NMR Parameter in Laboratory (SY/T6490-2000) recommends 100 psi as the centrifugal force. Extensive core experiments show that a centrifugal force of 100 psi as the core T2 cutoff value is applicable for sandstone cores with good physical properties and high permeability, but it may not be possible for cementitious materials, such as a backfill medium. In NMR, when the nucleus resonates and is in a high-energy state, and the RF (radiofrequency) pulse stops, it will quickly return to the original low-energy state. The recovery time is known as the relaxation time (T2). By performing NMR experiments on the saturated material before and after centrifugation, a T2 value can be obtained. The fluid corresponding to this value resides in small pores and cannot be produced, which can be used as a boundary basis for pore size distribution. Therefore, a batch of optimal centrifugal force calibration experiments is needed to determine the best centrifugal force for backfill, accurately calibrate the T2 cutoff value of movable fluid, and calculate the bound water retention and movable fluid saturation in the backfill.
In this study, backfill samples with different solid concentrations and cement–tailings ratios were prepared (cement–tailings ratio refers to mass of cement to the mass of dry tailings). The relationship between the T2 cutoff value, optimal centrifugal force, porosity, and water retention of the pores in backfill were explored via centrifugal technology and NMR technology. In the meantime, theories of SWCC and NMR were combined to explore the relationship between the pore size distribution and water retention of the medium to obtain the proportion of large and small pores and lay a theoretical foundation for studying the probability density of the pore size of the backfill.

2. Materials and Methods

2.1. Testing Materials

Cemented paste backfill consists of a binder (e.g., Portland cement), mine tailings, and water. P.C42.5 Portland cement was employed to protect the internal pore structure of the samples from being destroyed under high-speed centrifugation. The tailings are taken from tailings produced in a mine concentrator in Hunan. The particle size of the tailings was analyzed using a laser particle size analyzer. The particle size distribution curve is shown in Figure 1, and the main chemical elements of the tailings are presented in Table 1.
According to the test results, the unevenness coefficient of the tailings is 10.3, which is greater than 5, and the curvature coefficient is 1.27, which is between 1 and 3, indicating that the particle size distribution of the tailings is wide and favorable for compaction [23,24,25], as backfill made of tailings with a wide particle size distribution offers good integrity. Therefore, this material is ideal for the experiment. The ratio in the text refers to the cement–tailings ratio, and other indicators, such as %, represent the solid mass fraction.

2.2. Sample Preparation

The solid concentration and cement–tailings ratio are two key factors that affect the pore size distribution of the backfill. The change in solid concentration means that the initial water content of the backfill body is different and will also lead to differences in the distribution of internal pores after molding. A difference in the cement–tailings ratio will produce a difference in the hydration reaction and affect the compactness of the backfill. The backfill samples were made with cement–tailings ratios of 1:4, 1:8, and 1:12, and solid concentrations of 71%, 74%, 77%, 80%, and 83%, respectively. Moreover, the mold with a sample size of 12 × 24 mm was customized. The geometric parameters and physical objects of the specimen are shown in Figure 2. Six samples of each concentration (a total of 90 samples) were prepared and labeled. Finally, after 24 h of production, the samples were placed in a curing box with a temperature of 20 °C and humidity of more than 95% for 28 days.

2.3. NMR Theories

2.3.1. NMR Technology

The AniMR-150 NMR analysis system was used for NMR testing. The system was manufactured by the Niumag Electronic Technology Co., Ltd., Suzhou, China. The NMR total relaxation (T2) time is related to surface relaxation, loose relaxation of fluid procession, and diffusion relaxation caused by gradient fields. During the nuclear magnetic resonance testing, 1H-NMR is used for isotope measurement and calibration. In water-saturated samples, the T2 relaxation time is directly proportional to the pore size and the magnitude of the T2 curve directly reflects the porosity of samples. The relationship between pore size and T2 time can be expressed using a simplified equation [26,27,28,29], which is as follows:
1 T 2 = ρ S V
The pore radius, r, is proportional to the pore throat radius; therefore, Equation (1) can be transformed into the following equation:
1 T 2 = F s ρ r
where ρ ( ρ = 12 n m m s 1 ) represents the surface relaxation rate [30], r is the pore radius, and F refers to the pore geometry factor (cylinder F s = 2 ).
Porosity is the sum of aerated pores and water-holding pores in the matrix, expressed as the percentage of pore volume to the total volume of the matrix. NMR was employed to measure the porosity of the samples. Generally, samples are saturated with water to fill their pores so that the amount of saturated water in samples with the same volume is directly proportional to porosity. The higher the porosity and the greater the water retention are, the stronger the nuclear magnetic signal is that can be measured. If the correlation curve between the NMR signal intensity and porosity is obtained by measuring the nuclear magnetic signal of a certain volume of samples with known porosity (generally 3 to 6 samples), we can use this curve as the basis to evaluate the porosity of samples of the same type that have not been measured. Furthermore, the pore distribution can be characterized by the ratio of the signal intensity of the water in each pore to the signal intensity in the total pores and the porosity of the sample.

2.3.2. Bound Volume Index (BVI) Cutoff Value

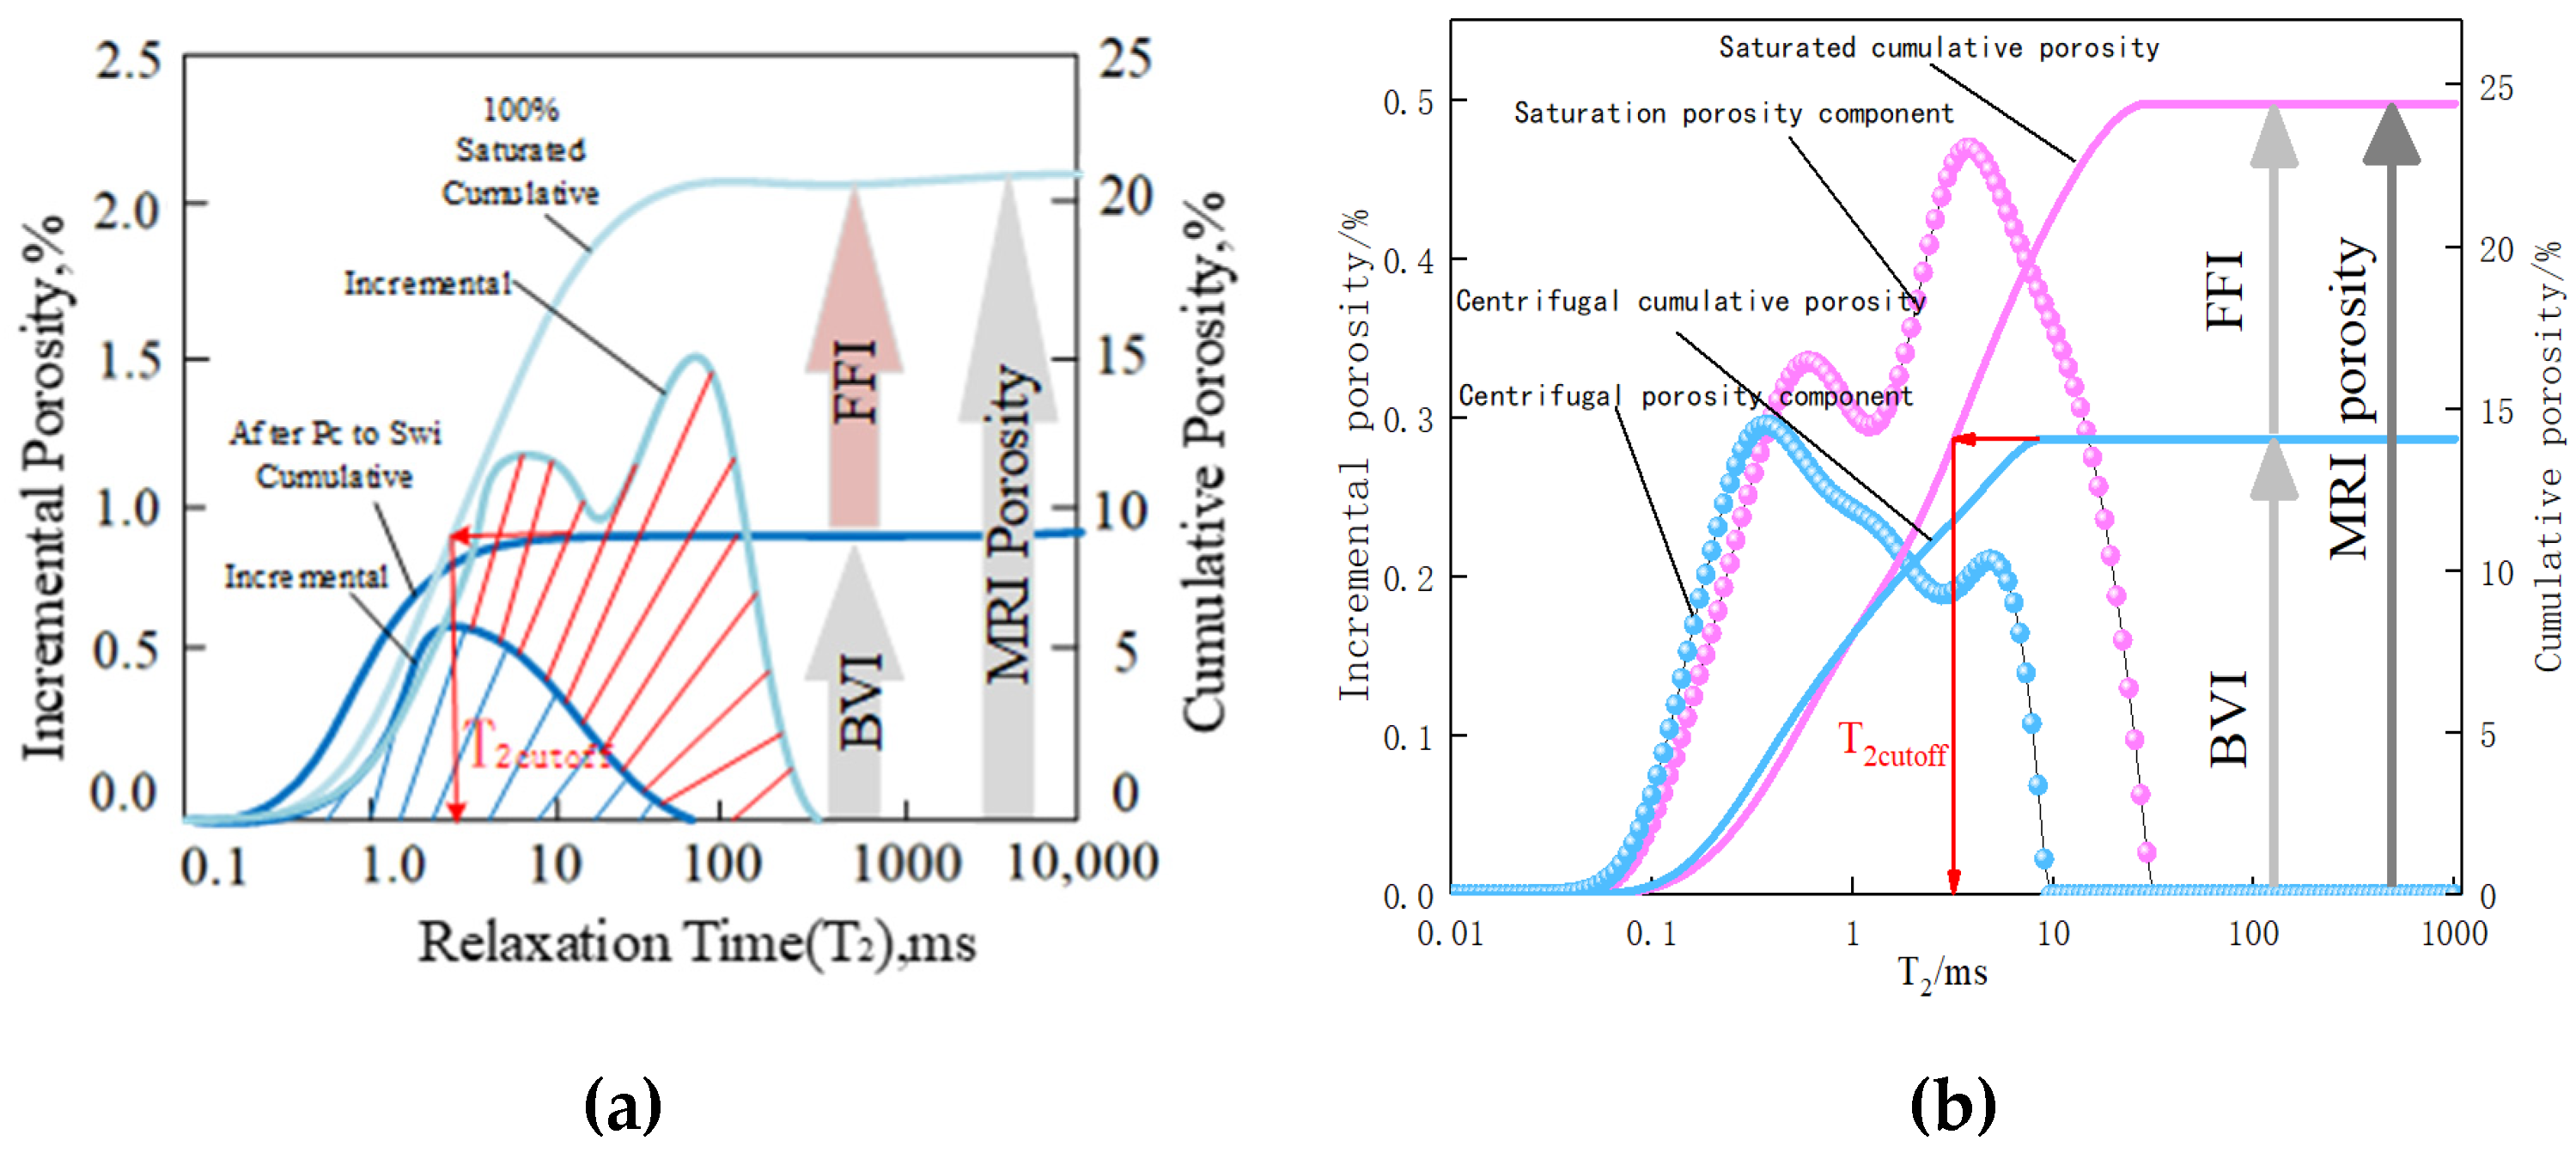
Fluid within cement-based material can be divided into free water and bound water [9]. Free water exists in large capillary pores. One property of free water is that its removal does not cause any volume change. The bound water exists in small capillary pores, gel pores, and interlayer pores, the removal of which may cause varying degrees of shrinkage of the material system [7,30]. The definition of critical pore size is introduced here as a criterion to distinguish free fluid and bound fluid, which means the free fluid exists in pores that have a diameter larger than the critical pore size and bound fluid exists in pores that have a diameter smaller than the critical pore size [10,11,12,13]. Because the properties of pores impact the shrinkage and strength of cement-based material, it is vital to decide the critical pore size. Based on the NMR technique and the corresponding relationship between the radius of pores and T2 relaxation time, the T2 cutoff is defined to represent critical pore size. A detailed explanation is given in Figure 3 and the following paragraph.
Figure 3 illustrates the cutoff bound volume index for the T2 cutoff [31]. This method estimates the BVI (bound volume index) based on the assumption that the bound fluid resides in the small pores, and the movable fluid resides in the large pores. This assumption is made because the pore throat size is related to the pore size. Since the T2 value is connected with the pore size, a T2 value can be selected while assuming that fluids smaller than this value reside in small pores and cannot be produced, while those larger than this value reside in large pores and can flow freely. This value is called the T2 cutoff. By dividing the T2 distribution, the T2 cutoff value will apply the MPHI (matrix porosity hydrogen index) value to represent effective saturation and divide it into two parts, namely the BVI, representing the saturation of bound fluid, and the FFI (free fluid index), which refers to the saturation of movable fluid.
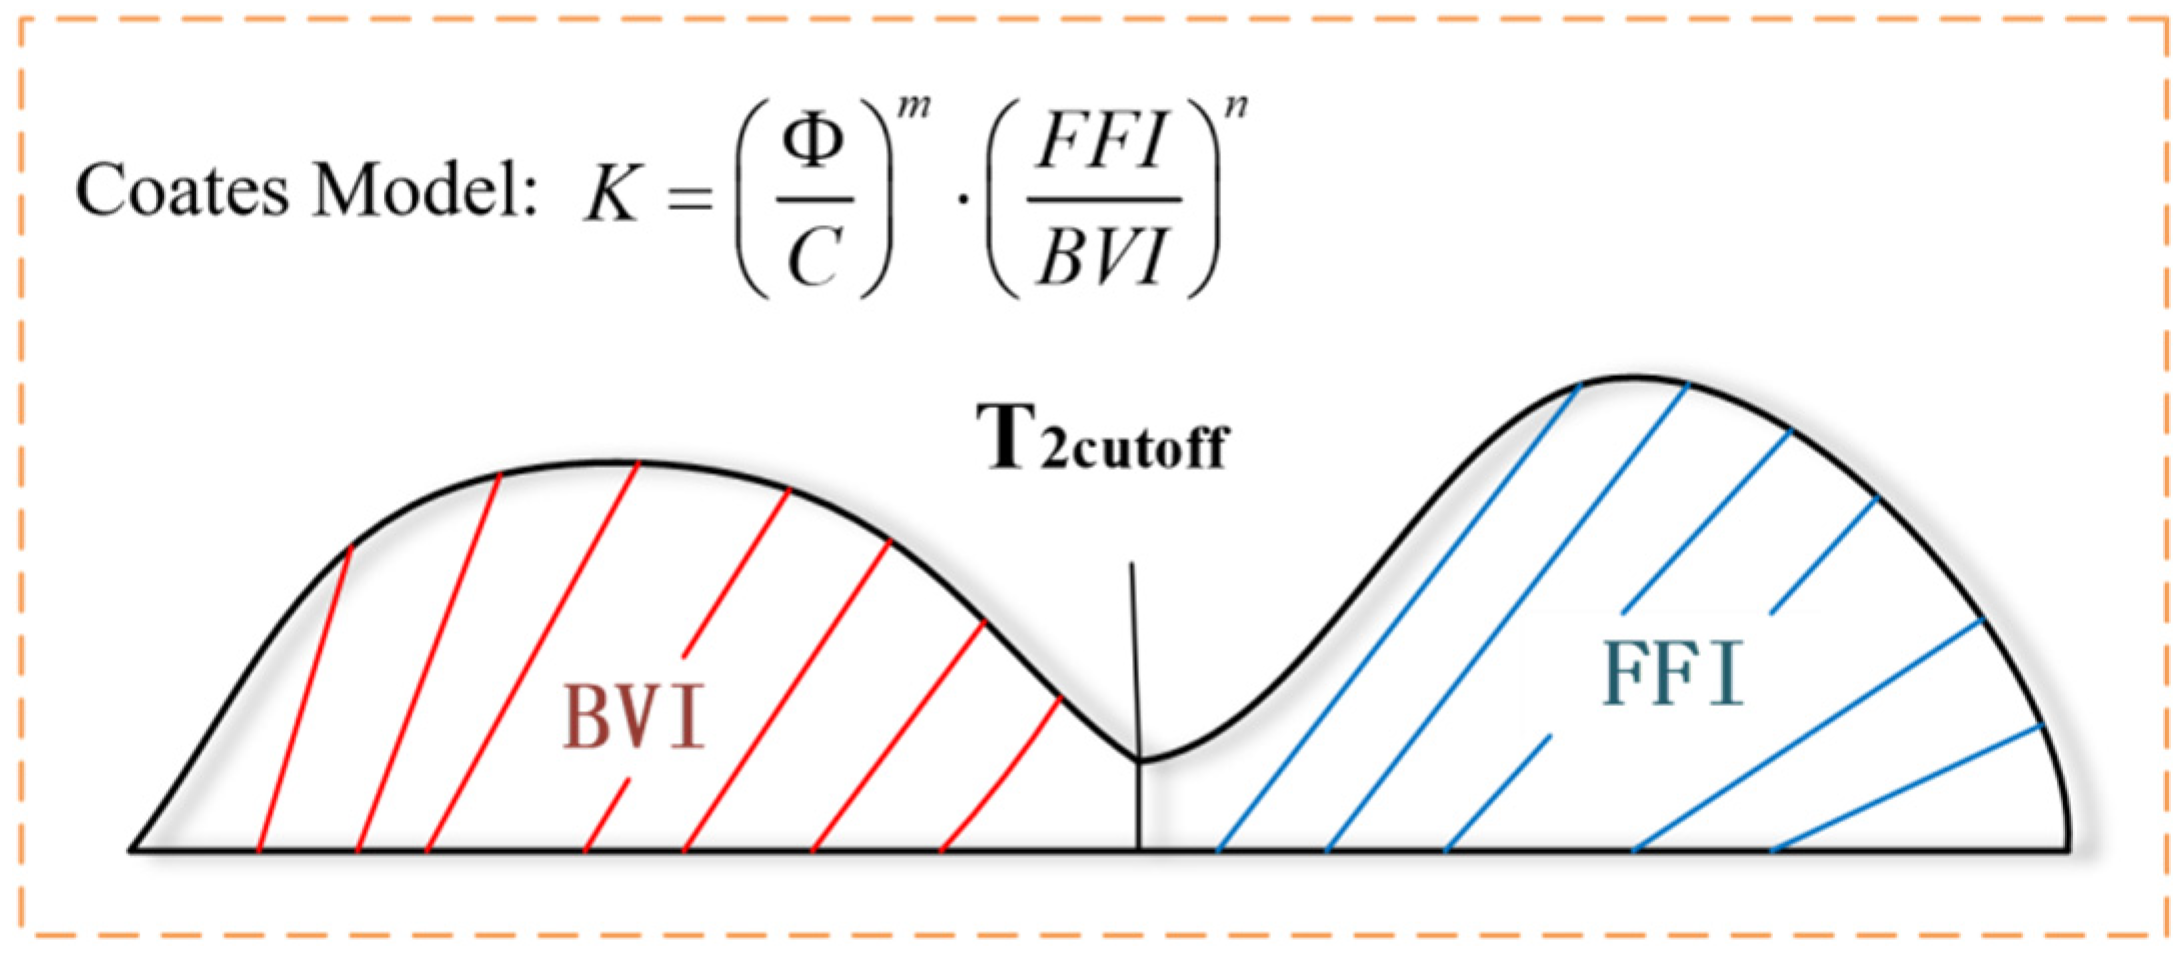
The T2 cutoff value is one of the important factors that affect the acquisition of accurate sample permeability through an NMR system. According to the free fluid model or the Coates model, the pore size is implied by the T2 cutoff, which determines the value of FFI/BVI and is an important parameter for pore size [13]. As shown in Figure 4, where Φ is porosity, C, m, and n are all relevant empirical parameters. The T2 cutoff is inversely proportional to the permeability, K. To distinguish between free water and bound water in the pores of samples, it is particularly important to determine the T2 cutoff.

2.3.3. Centrifugal Methods

The object of NMR research is the relaxation behavior of hydrogen nuclei at different resonance frequencies. After the backfill is saturated with water, the water will fill the pores and generate a response during the nuclear magnetic test [32]. A centrifugal test is carried out on the backfill after being saturated with water. Due to internal water migration, the relaxation behavior will be different, which will provide a basis for the water retention analysis. Extensive research on gas shale has been developed to investigate its optimal centrifugal force and T2 cutoff; however, little research has been conducted on these properties in backfill [10]. The importance of the T2 cutoff was explained in the last section. With the combination of centrifugal tests and the NMR technique, the T2 cutoff can be calibrated through an optimal centrifugal force. The theoretical foundation of centrifugal testing is presented as follows.
(1)
NMR test: After placing the backfill sample in the magnetic field, the hydrogen ion resonates by emitting a radio frequency (RF) pulse at a certain frequency and absorbs its energy. When the RF pulse is stopped, the hydrogen ion will release the absorbed energy, the process of which can be detected through the nuclear magnetic resonance signal. The energy release rates of samples with different properties are distinct, and the differences between the signals can intuitively reflect the variation of pore water retention.
(2)
Centrifugal separation: Centrifugal separation is used to encourage the moisture in the sample pores to pass out through the pore throat and channel and become a filtrate under the strong centrifugal force generated by high-speed rotating equipment, thereby achieving solid–liquid or liquid–liquid separation in a short time [33]. Usually, the relative centrifugal force ( R C F ) is used to express the magnitude of the centrifugal force, which is calculated as follows:
R C F = 1.118 × 10 5 × n 2 × r
where n and r denote the same meanings but in different units of r·s−1 and cm. The unit of R C F is gravitational acceleration :   g / min , g = 9.81 m/s2.

2.4. Testing Procedures

(1)
Before conducting subsequent tests, all backfill samples need to be saturated [34]. This study used the method of staged immersion saturation. The 28-day-old backfill sample was placed into the water tank. Water was next injected to 1/4 of the sample height, and then the same amount of water was injected every 2 h. All samples were completely submerged within 6 h.
(2)
After every four hours, the weights of the sample during the drying and wetting procedures were measured using an electronic balance (with an accuracy of 0.01 g). If the weight difference was less than 1%, the sample was considered to be saturated.
(3)
After the sample was completely saturated with water, an NMR analysis was performed to obtain the initial relaxation time spectrum. The NMR relaxation measurements were conducted on the AniMR-150 NMR system. The magnetic field strength of the NMR instrument was 0.3 T, the echo time was 0.301 ms, the waiting time was 1500 s, the sampling frequency was 200 KHz, and the magnet control temperature was 25–35 °C. After sampling and inversion operations were conducted in the NMR testing system itself, the spectrum was obtained as the T2 relaxation time versus signal intensity. The porosity calculated by the built-in program of the NMR system was output along with the spectrum.
(4)
The sample was taken out of the nuclear magnetic equipment and then centrifuged at an initial rotation speed of 1500 rpm. The instrument that was used for the centrifugation was an 80-1 Desktop Electric Centrifuge made by Changzhou Ronghua Instrument Manufacturing Co., Ltd., Changzhou, China. Following this, the sample was subjected to NMR analysis to obtain the relaxation time spectrum after centrifugation. If the difference ratio of water retention before and after the centrifugation was larger than 3%, the centrifugation operation was conducted again with the rotation speed increased by 500 rpm. The maximum limitation of rotation speed was set as 4000 rpm. The cycle of centrifugation and NMR analysis was repeated until the difference ratio of water retention was within 3%.
(5)
A specimen of approximately 1 mm3 was taken from the core of samples and dehydrated with absolute ethanol to stop the hydration. The specimen was dried at 45 °C to a constant weight and was used to conduct SEM scanning on the a Czech TESCAN MIRA3 field-emission SEM (Taisken Co., Ltd., Shanghai, China). In order to observe the pore structure, the scale of the SEM images was restricted to 2 μm.
(6)
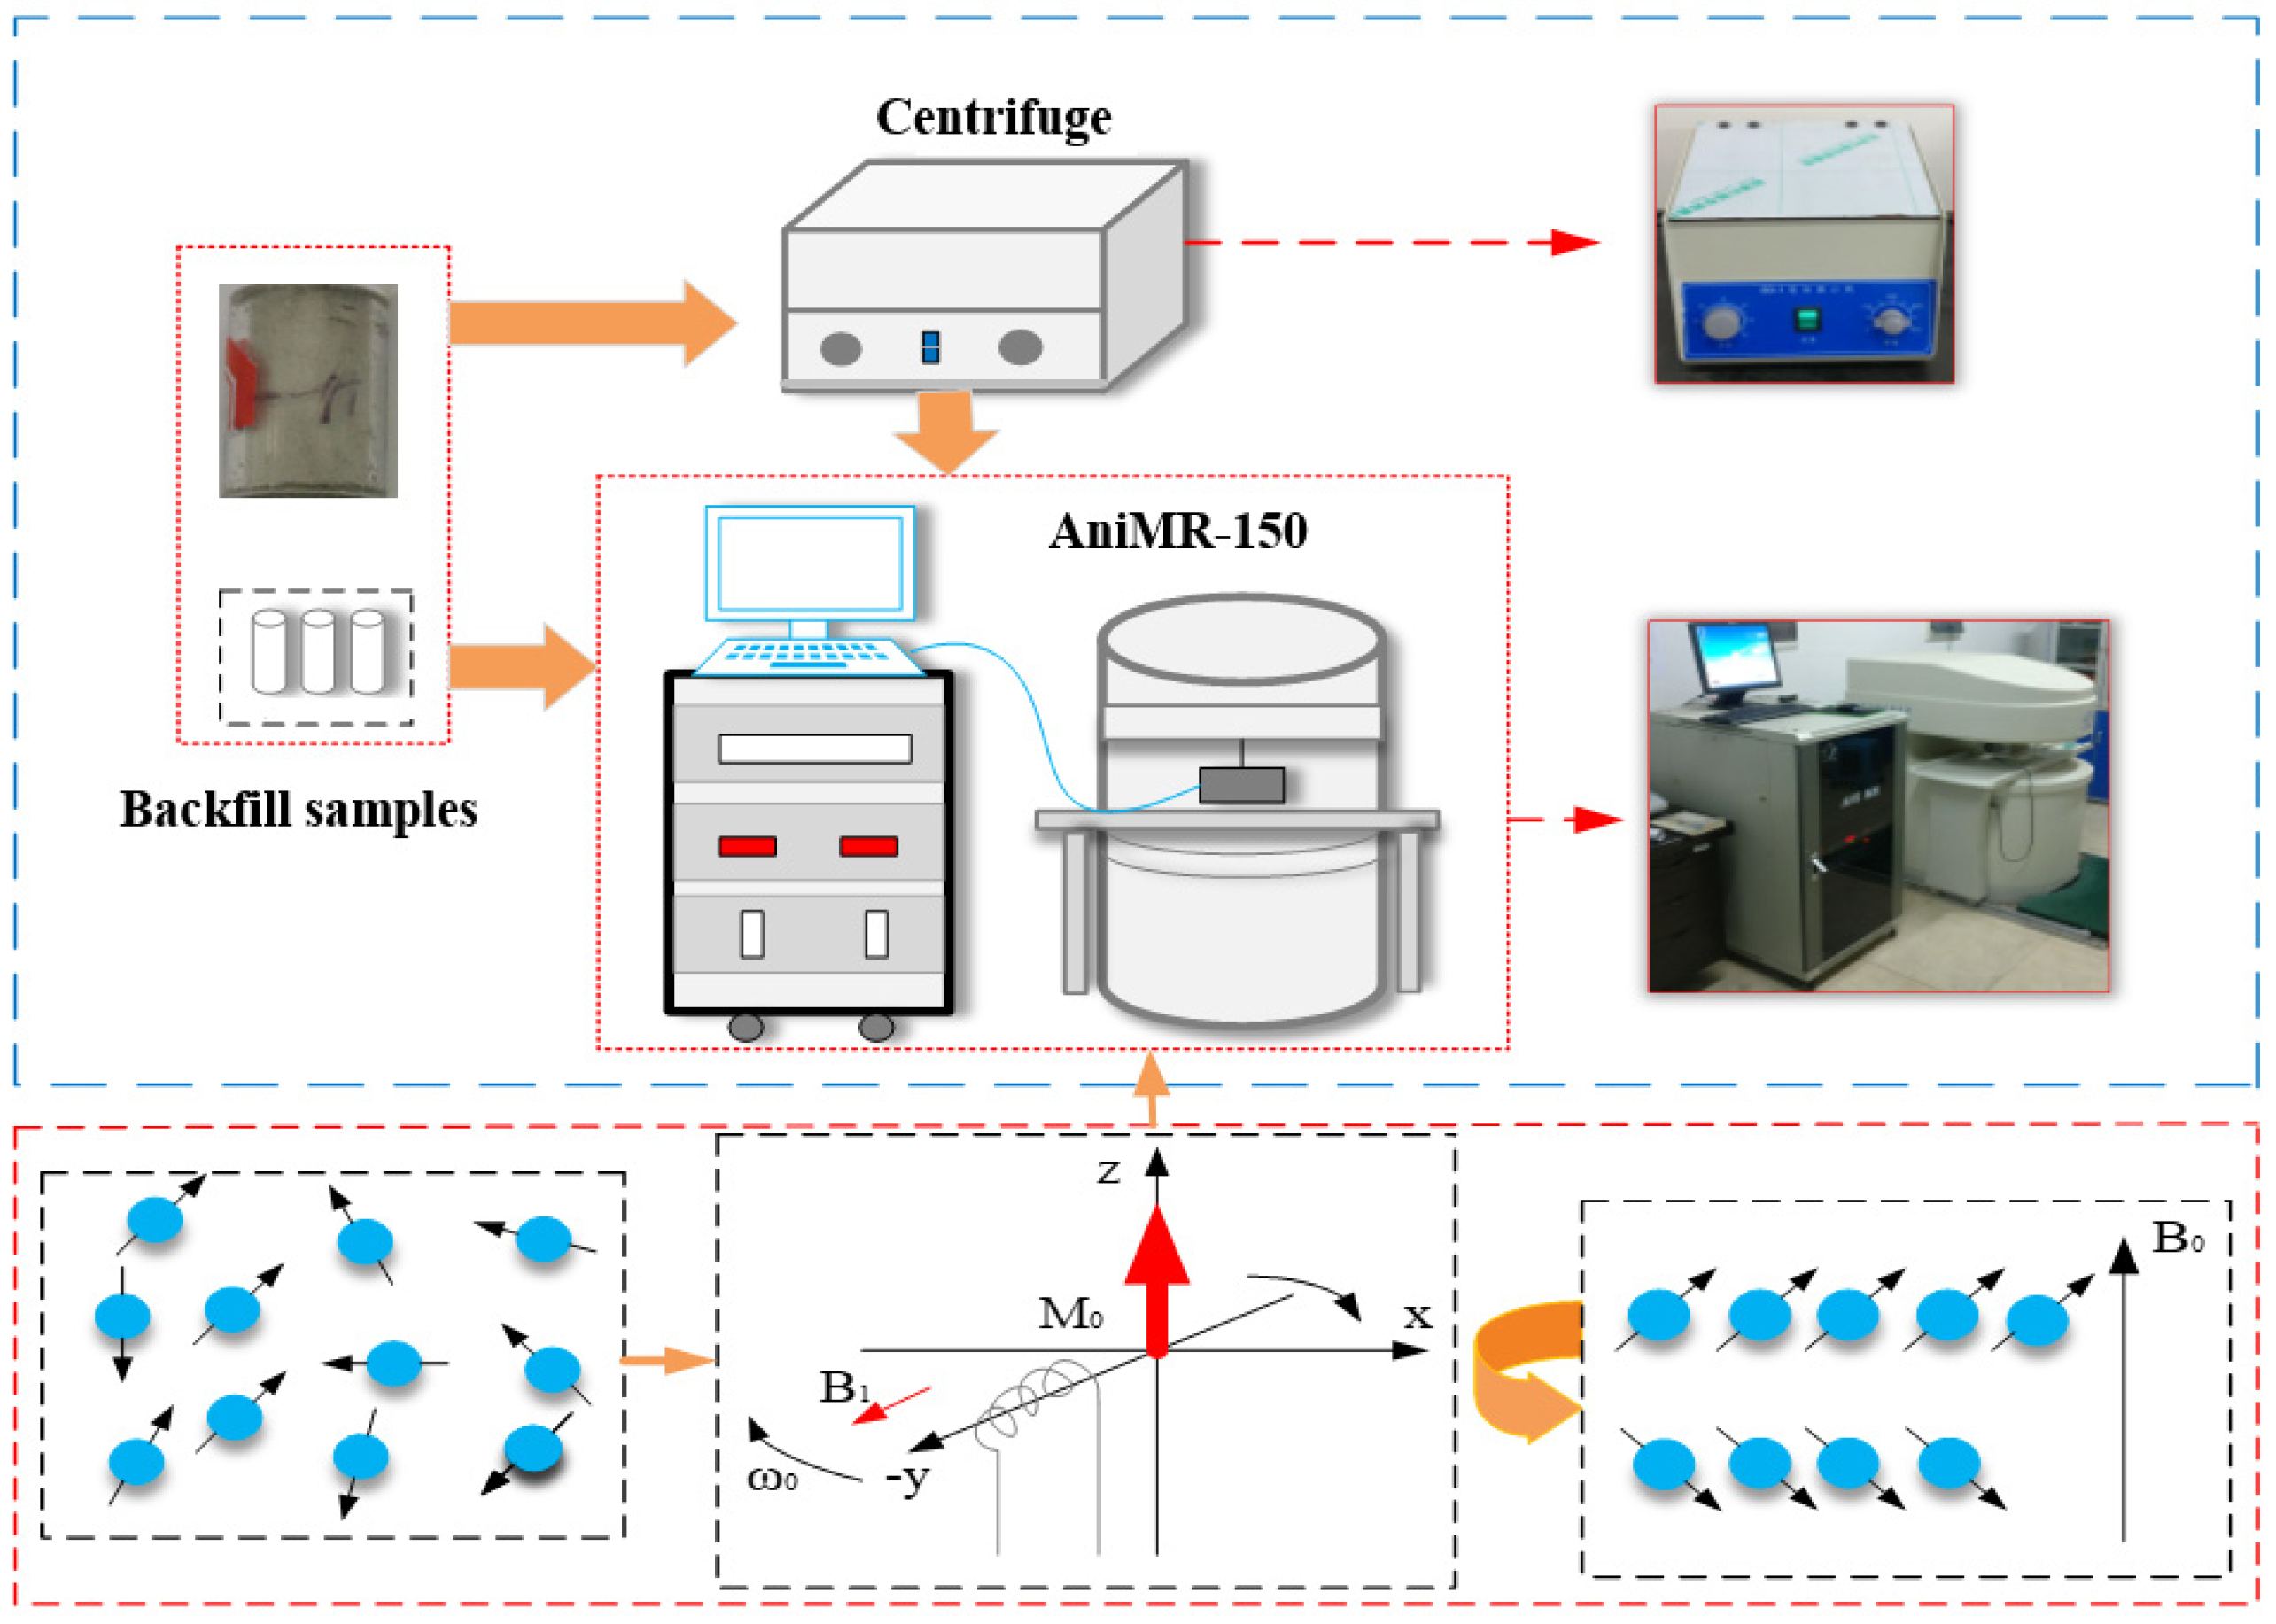
The above experimental procedures were repeated for all cemented paste backfill samples. The testing instruments and process are shown in Figure 5.

3. Results and Discussion

3.1. Porosity Analysis of the Backfills in a Water-Saturated State

Table 2 presents the saturated porosity indexes of the backfills with different concentrations and cement–tailings ratios. The NMR response was adopted to test the porosity of three groups (30 in each group, for a total of 90) of saturated backfill samples with different concentrations in a water-saturated state. The results suggest that the porosity of the backfill is proportionally related to the concentration; specifically, increasing the concentration of the backfill can effectively reduce its porosity. With an increase of the cement–tailings ratio, the saturated porosity of the backfill sample shows an increasing trend, indicating that the cement–tailings ratio affects the pore size distribution of the backfill. The lower the cement content, the poorer the internal cementation of the sample, the greater the porosity, and the higher the pore volume and water retention. In the case of a fixed solid concentration and cement–tailings ratio, the hydration and forming effects of the backfill are very similar. The results from the NMR test show that the porosity difference between the samples in the same group is very small, which means that the NMR test method is accurate and stable.

3.2. Analysis of Backfill Porosity before and after Centrifugation

After the backfill sample was saturated with water, the pores contained free water and bound water. The former existed between the pore throats and could be extracted, while the latter existed in the pores and could not be extracted. It can be seen from Figure 6 that at a concentration of 71%, the free water reduction after centrifugation was about 10–20%, while at a concentration of 83%, it was about 2–10%. Before centrifugation, the backfill porosity decreased together with an increase of the solid concentration. After centrifugation, the porosity remained largely stable at 15%. The test results show that the free water in the saturated sample was separated by centrifugal response technology, but the porosity of the specimen after centrifugation was relatively stable and did not vary with a change in concentration.

3.3. Analysis of the Optimal Centrifugal Force and T2 Cutoff Value

3.3.1. Calibration of the Optimal Centrifugal Force and T2 Cutoff

Based on the theory presented in Section 2.3.2, the centrifugal tests were conducted to study the changes in water retention in the samples after centrifugation with different centrifugal forces and, ultimately, to obtain the optimal centrifugal force of backfills with different concentration ratios through data analysis [35]. If the difference between the water saturation rate before and after centrifugation was within 3%, it was determined that there was no change in the water retention ratio.
Table 3 presents the reduction of pore water retention of the backfill samples under different centrifugal forces. Specifically, the reduction of pore water retention accelerates with the growth of centrifugal force and, eventually, becomes stable, since an increase of centrifugal force leads to a rise in osmotic pressure, causing the movable fluid in the pores to flow out. Meanwhile, when the osmotic pressure reaches a certain level, the movable fluid in the pores no longer flows out (this part is called the bound fluid), and the reduction in pore water retention no longer changes. It can be seen from Figure 7 that as the centrifugal force increases, the free water in the pores of the sample is extracted, and its porosity gradually decreases. Comparing the centrifugal test results of the backfill specimens with different cement–tailings ratios, it can be seen that as the solid concentration of the backfill declines, the degree of centrifugation increases. When it reaches the saturation state, a large amount of free water overflows, indicating that the saturation of pore water retention is relatively reduced. In actual engineering, such backfills are more likely to be destroyed.
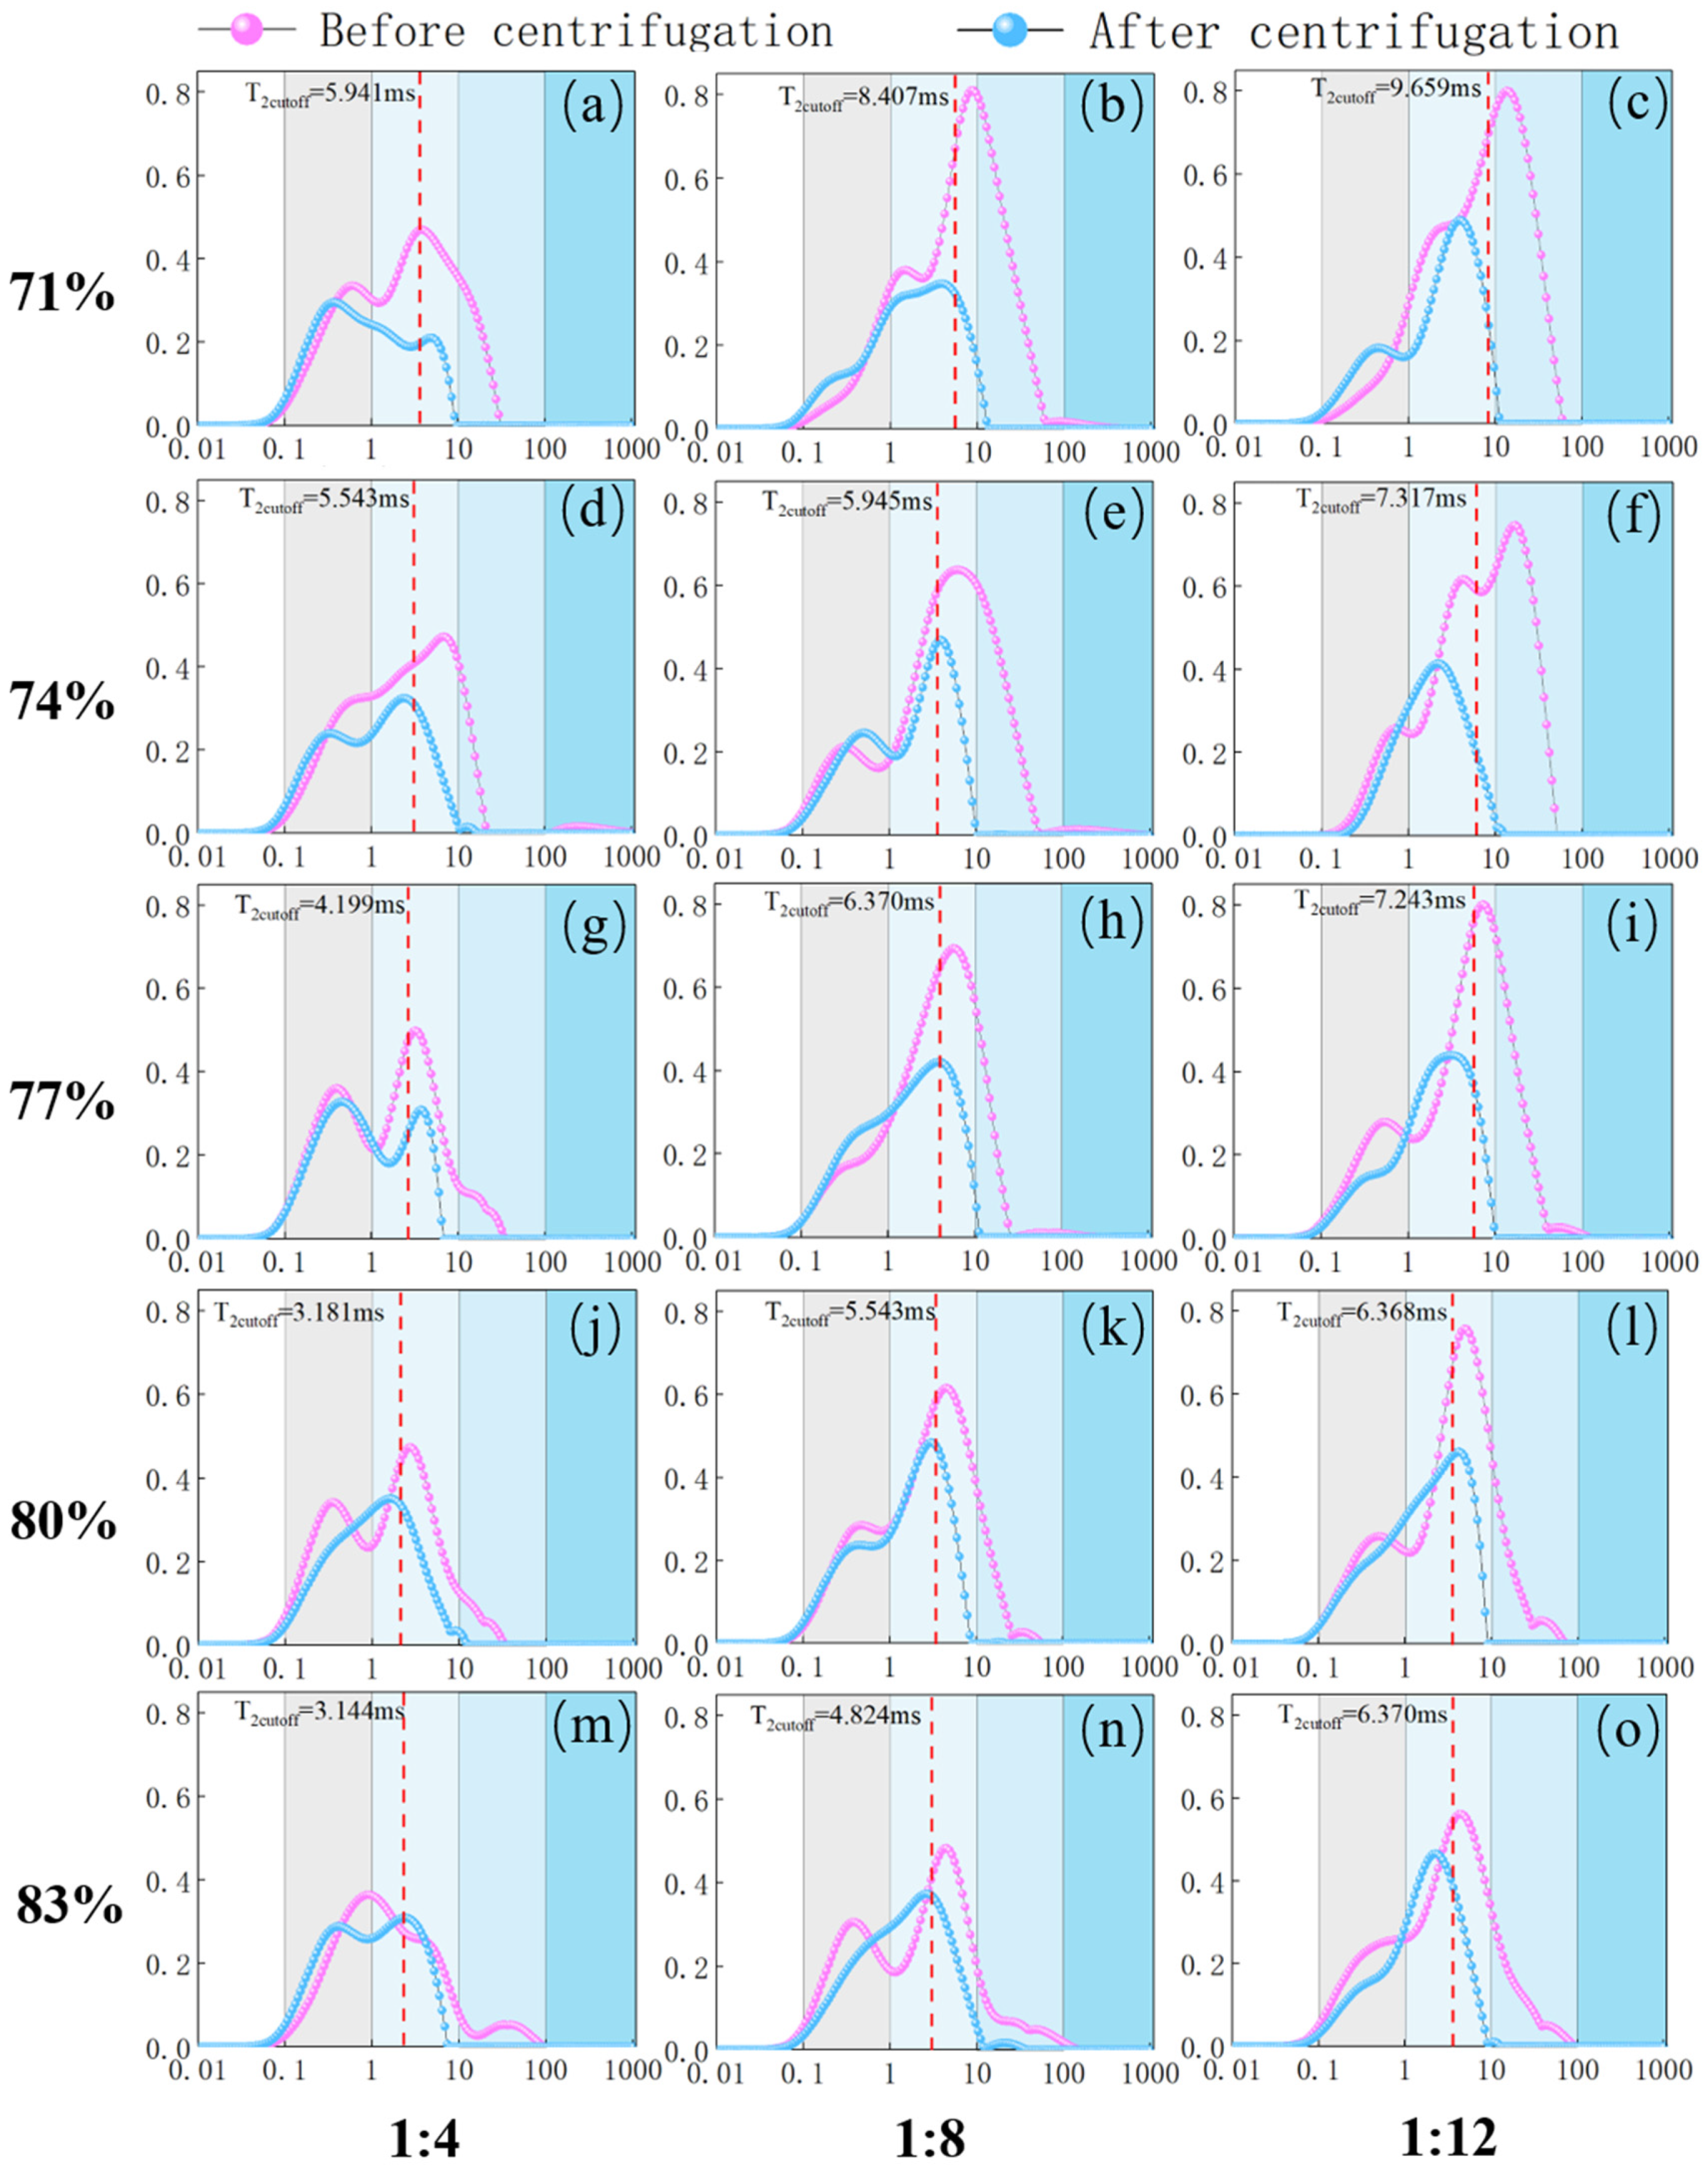
Figure 8 suggests the evolution characteristics of the porosity components before and after centrifugation. Through an analysis of centrifugal saturation and porosity variation, the optimal centrifugal force and T2 cutoff can be obtained, as shown in Table 4. It can be seen that the T2 cutoffs corresponding to the backfill samples of different concentrations and ratios are different. The overall trend of the optimal centrifugal force and T2 cutoff decreases as the concentration increases, implying that the pore size distributions differ greatly from each other. Consequently, it is necessary to establish a pore water retention model.
The overall trend of the optimal centrifugal force decreases with an increase of concentration. It can be seen from Figure 8 that before the T2 cutoff, the difference in the porosity components of each sample is not obvious, but after the T2 cutoff, this difference becomes apparent, which demonstrates the presence of small pores before the T2 cutoff and large pores after the T2 cutoff. As the concentration ratio goes up, the T2 cutoff declines, which is related to the pore distribution density, pore water retention, and pore size characteristics. In order to obtain an accurate T2 cutoff, most experts and scholars calibrate the optimal centrifugal force of volcanic rock, sandstone, marl, and other rock samples. However, few scholars have paid attention to the T2 cutoff of different solid concentrations of backfill samples. This study determined the T2 cutoff corresponding to different solid concentrations of backfill samples through a large number of experiments and then calibrated the optimal centrifugal force. Narrowing the calibration range of the optimal centrifugal force can be used as a basis for the backfill centrifugal test, which is also applicable to backfill with different elements, effectively reducing the workload.

3.3.2. Regression Analysis of Centrifugal Force, T2 Cutoff, and Water Retention Curve

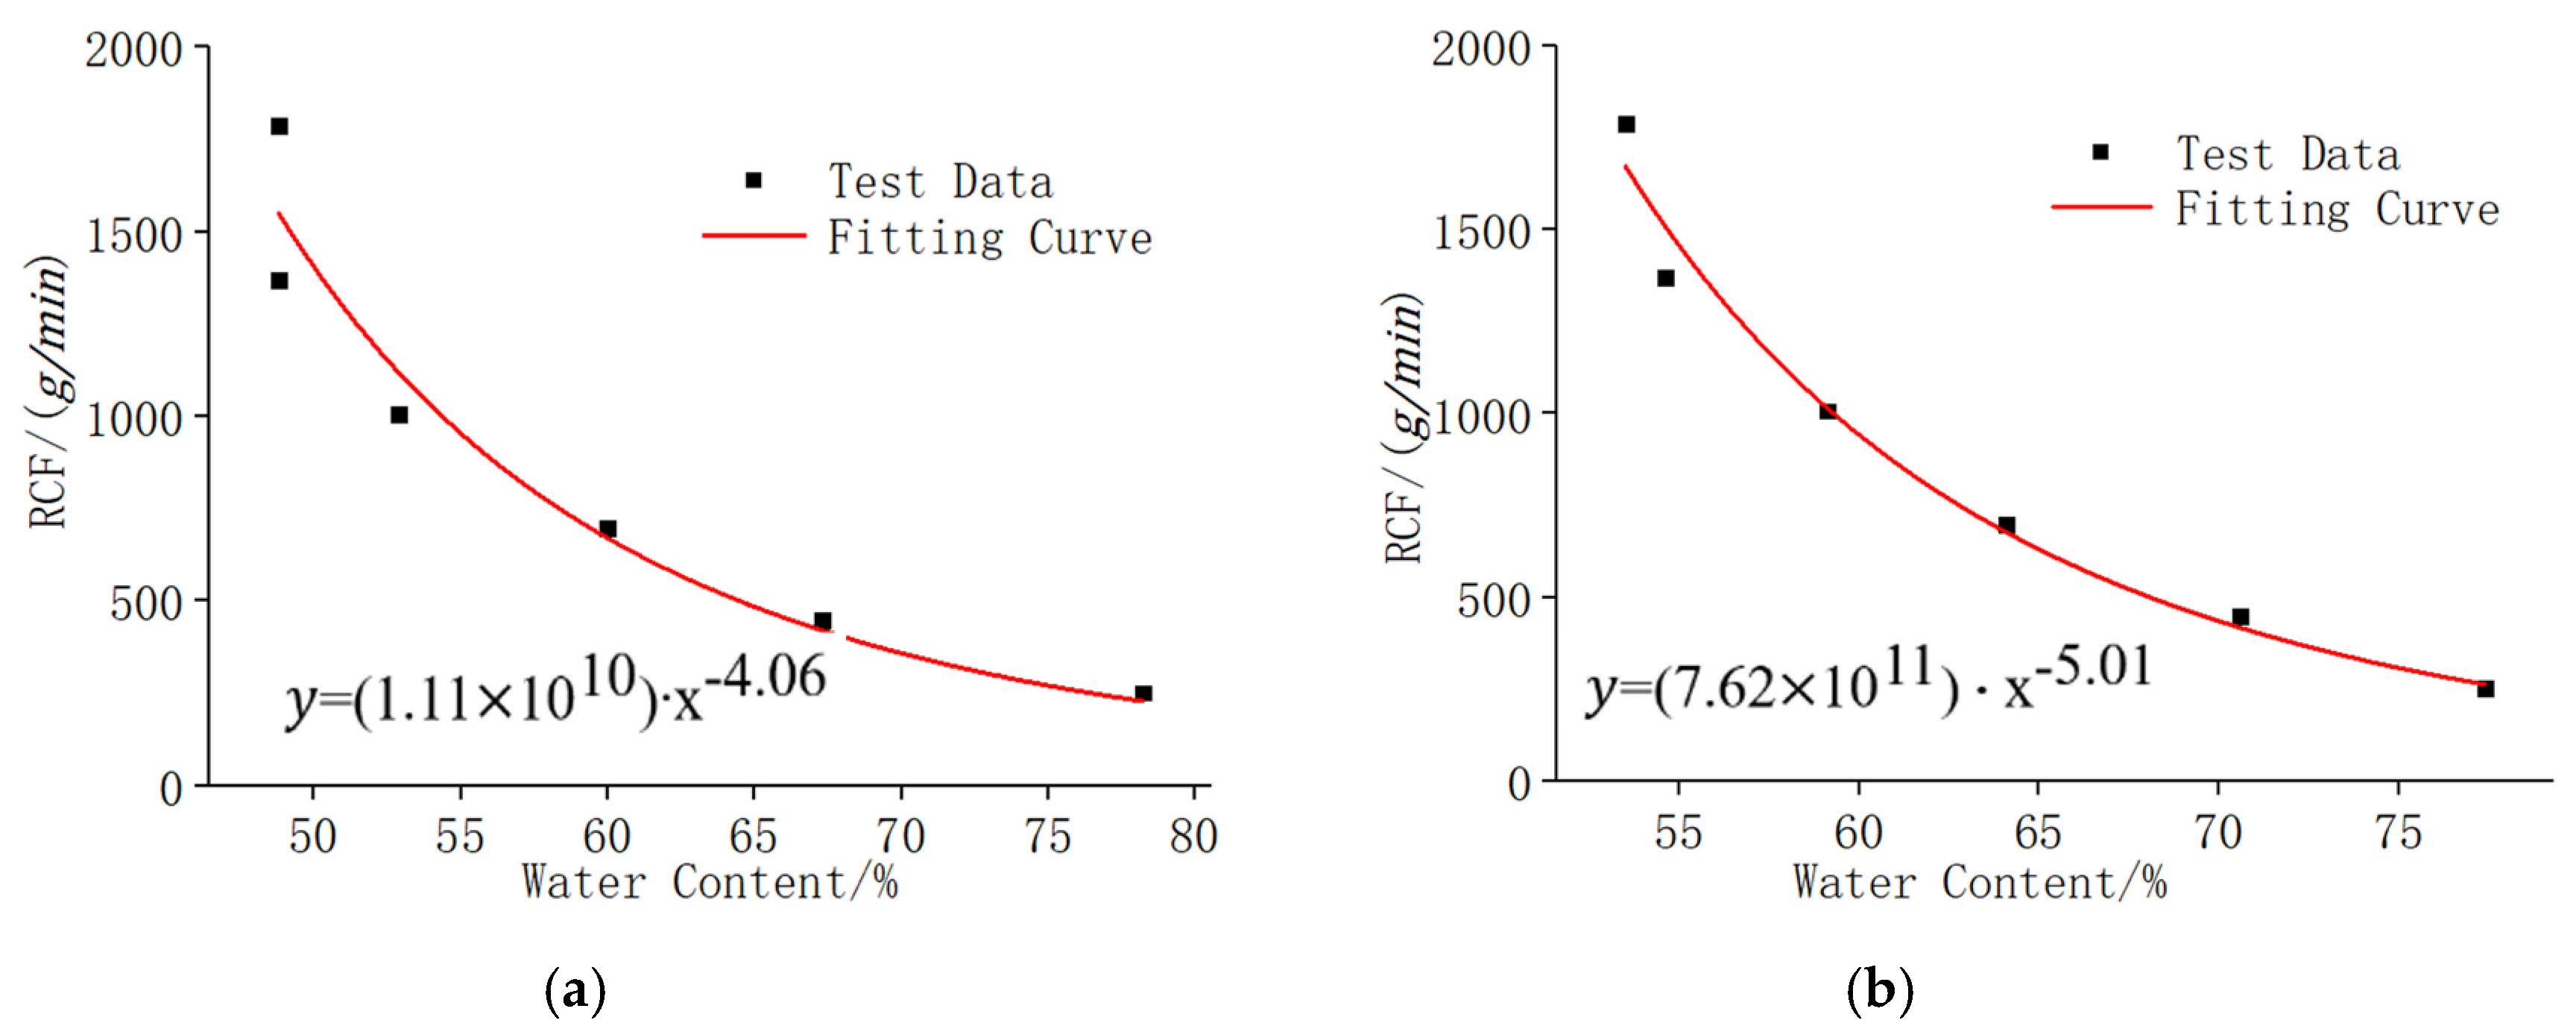
Taking the samples with a cement–tailings ratio of 1:8 and a solid concentration of 71% and 74% as examples, the experimental results suggest that the water retention of the sample decreases with an increase of the centrifugal force. The larger the centrifugal force, the greater the migration speed of the water droplets in the pores, leading to a better separation effect. Moreover, the higher the water migration ratio of the sample is, the lower the water retention. A regression analysis of the centrifugal force and water retention curve is presented in Figure 9, which conforms to a power function in an overall optimal centrifugal force range of 0.345–2.758 MPa.
y = a x b ,     x ( 0 , 1 )
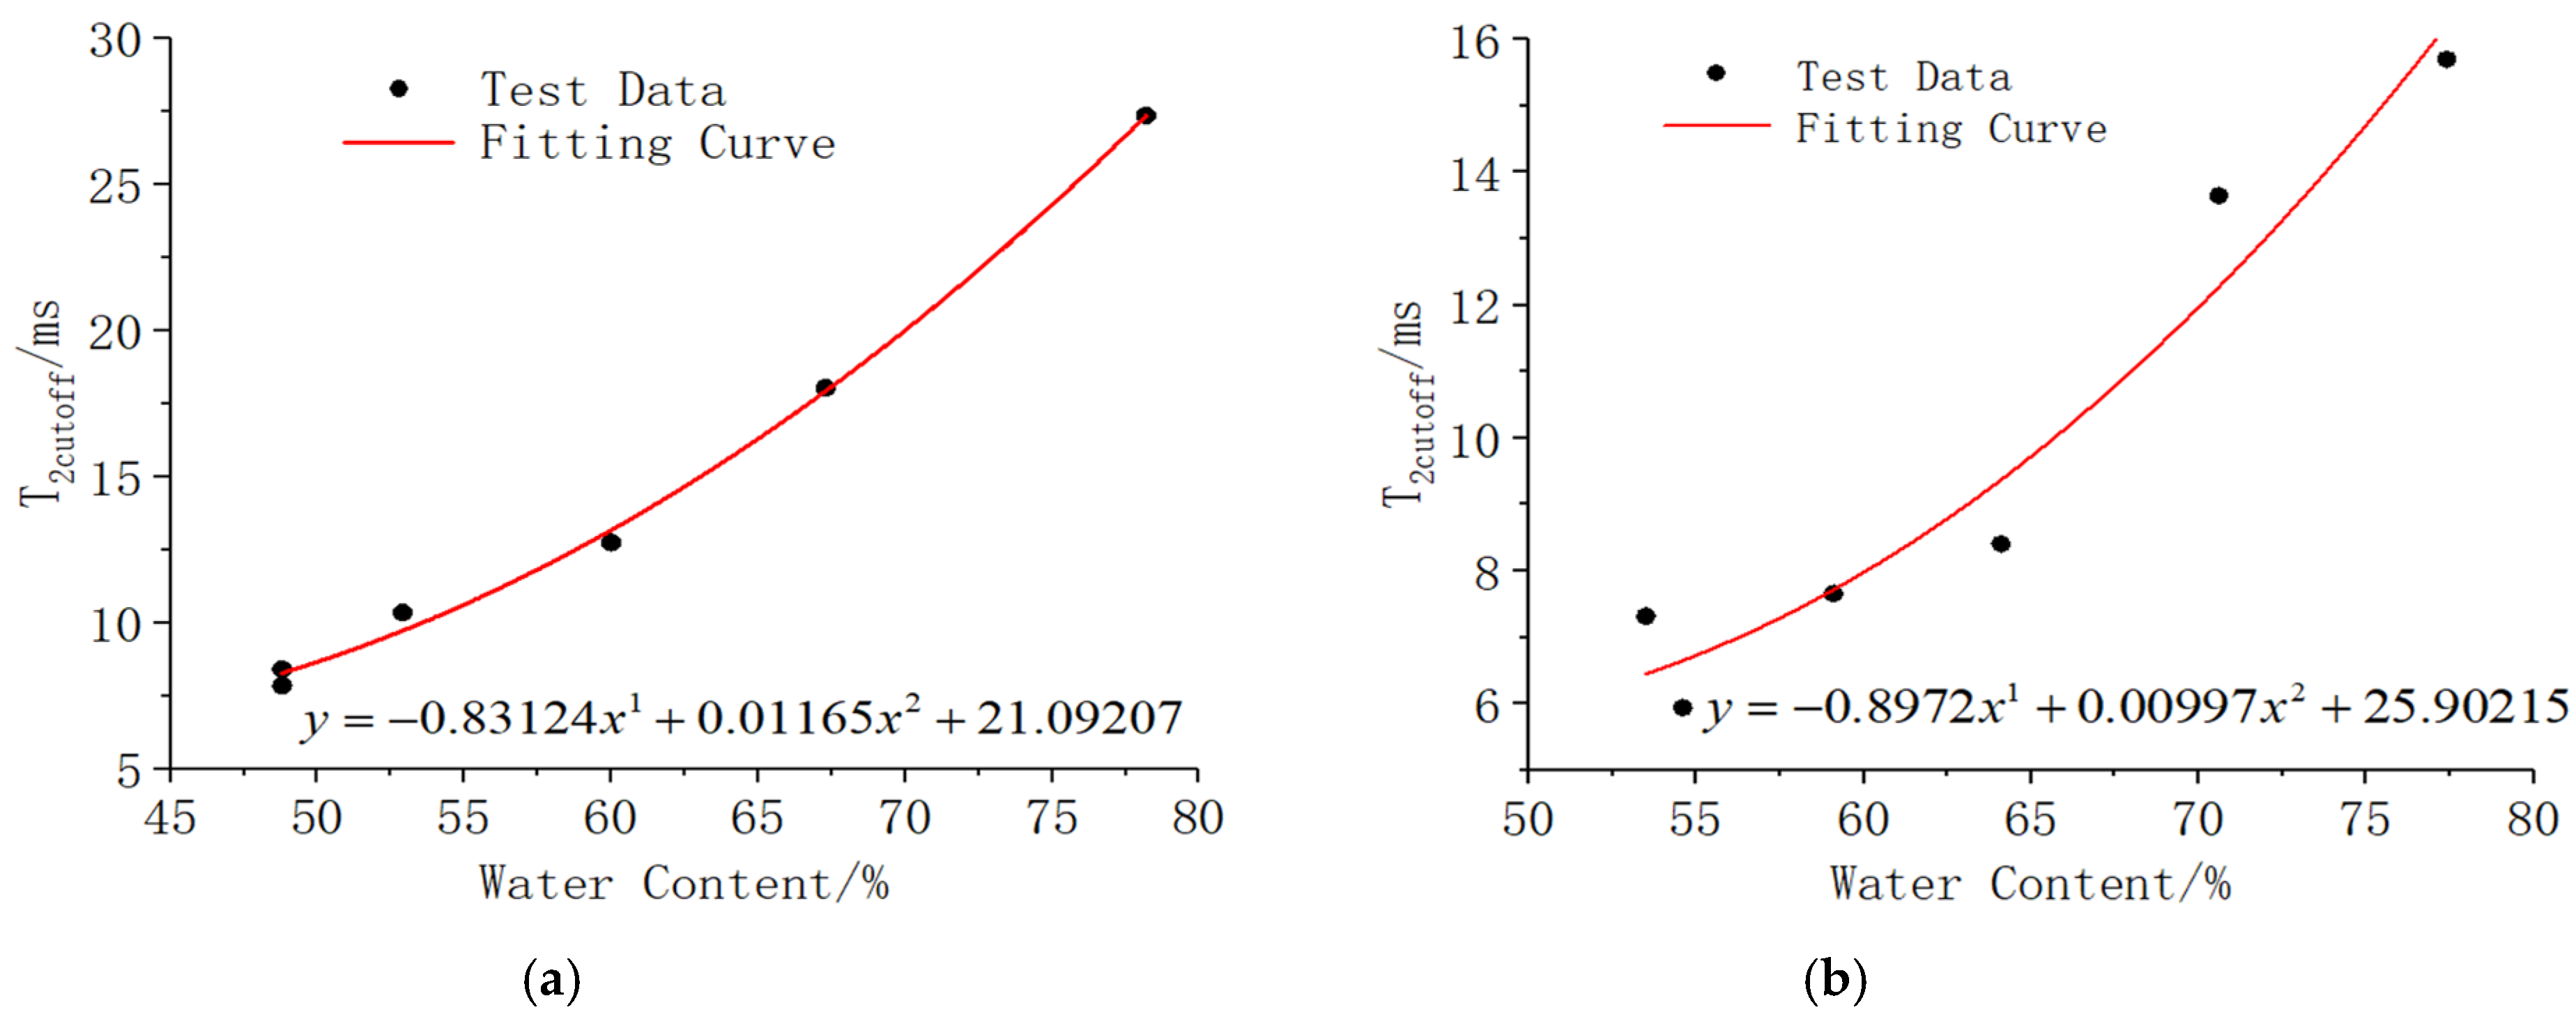
It can be concluded from the experimental results that the water retention of the sample decreases with a drop in the T2 cutoff since the smaller the T2 cutoff is, the less free water that remains in the pores after centrifugation; however, the bound water hardly changes, resulting in a decrease in water retention. The regression analysis of the T2 cutoff and water retention curve is shown in Figure 9 and Figure 10, respectively. When the T2 cutoff value ranges from 5 to 30 ms, the overall distribution conforms to the following quadratic polynomial function:
y = a x + b x 2 + c ,     x ( 0 , 1 )
In a well-connected material, the water in the pore is easily separated, the nuclear magnetic signal remains constant, and the optimal centrifugal force is weak. If the optimal centrifugal force is strong, the connectivity of the pore is poor, and the water molecules can only be separated after breaking through the throat bottleneck. With good pore connectivity, the free water molecules in the pores of the backfills can easily migrate, and the probability of pore water moving with free water increases; however, it decreases with poor pore connectivity. It can be seen from the regression analysis of the water retention curve that the optimal centrifugal force reduced with an increase in solid concentration of the backfill samples. Further, the connectivity between the sample pores was better, which is conducive to the migration of pore water. The effect of the cement–tailing ratio on centrifugal force is not significant and will not be discussed here. For the T2 cutoff, the higher the concentration and the greater the cement–tailings ratio are, the smaller the T2 cutoff and the greater the corresponding permeability are. This indicates that the higher the density and cement–tailings ratio of the backfill are, the better the pore connectivity will be, which is instrumental in pore water migration. The higher the cement–tailings ratio is, the higher the cost will be; conversely, the strength of the backfill will be limited, and if the concentration is too high, its liquidity will be reduced, which is unconducive to transportation. In field engineering, the actual demand should be taken into consideration to decide the proper concentration and proportion. The results of an NMR test can provide a reliable basis for the performance evaluation of backfills.

3.4. NMR Pore Water Retention Model Based on SWCC

In the process of water migration, both large and small pores serve as water migration channels where mass transfer mainly occurs. From nanopores to micro-pores and then to submillimeter pores, the range of pore size distribution is wide, and the internal structure of the backfill itself is heterogeneous, the water migration channel is discontinuous, and the network structure is complex. However, the movement of water in the backfill is related to porosity, pore distribution, and pore cross-linking characteristics [36,37].

3.4.1. Establishment of a Pore Water Retention Model

The soil–water characteristic distribution curve (SWCC) is based on the adsorption of matrix suction between soil pores on the water, reflecting the characteristic distribution of soil water retention [38]. On the basis of SWCC theory and NMR theory, this study proposes T2 cutoff as the key point for large and small pores and obtains the NMR pore water retention curve and pore size distribution curve. The details are as follows. The pores in the backfill are approximately regarded as a set of pores composed of cylinders with different apertures, and the volume water content (saturation) θ [15] in the pores can be expressed as follows:
θ ( R ) = R m i n R h ( r )
where θ ( R ) refers to the volume water retention of all pores with a radius less than or equal to R in a saturated state, R m i n   is the minimum pore radius in the backfill sample, and h ( r ) is the pore size probability density function.
By substituting Formula (2) into Formula (4), the following equation is obtained:
θ ( T ) = θ s 0 T 2 ϕ ( T ) d T
where ϕ ( T ) is the function of pore size distribution expressed by porosity, and θ s is the water retention of the total pore volume of the backfill sample in a saturated state.
There are dual pores in backfill, reflected in NMR as small pores before T2 cutoff and large pores after it. Supposing the pore size probability density function of the small pores of the backfill sample is h 1 ( r ) , and that of the large pores is h 2 ( r ) , then the linear superposition of the pore size probability density functions of the large and small pores is:
h ( r ) = h 1 ( r ) + h 2 ( r )
where h ( r ) is the pore size probability density function of the backfill sample. Assuming that the internal pores of the backfill sample are connected with each other, the volume water retention of the backfill sample θ ( T ) can be expressed as follows, according to capillary theory:
θ ( T ) = R min R f 1 ( r ) d r + R min R f 2 ( r ) d r = θ s 1 0 T 2 c u t o f f ϕ 1 ( T ) d T + θ s 2 T 2 c u t o f f T 2 ϕ 2 ( T ) d T
where θ s 1 and θ s 2 refer to the volume water retention of small pores in a saturated state and that of large pores in a saturated state, respectively. These values are based on the following formula:
θ s = ω 1 θ s 1 + ω 2 θ s 2
where ω 1   and ω 2 refer to the proportions of large and small porosity to the total porosity of the sample, and they meet the condition that 1 = ω 1 + ω 2 . Substituting Formula (8) into Formula (6), the following equation is obtained:
θ ( T ) = ω 1 θ s 0 T 2 c u t o f f ϕ 1 ( T ) d T + ω 2 θ s T 2 c u t o f f T 2 ϕ 2 ( T ) d T θ ( T ) = ω 1 θ s 0 T 2 c u t o f f ϕ 1 ( T ) d T + ω 2 θ s T 2 c u t o f f T 2 ϕ 2 ( T ) d T = ω 1 ( θ s θ r ) 0 T 2 c u t o f f ϕ 1 ( T ) d T + θ r 1     + ω 2 ( θ s θ r ) T 2 c u t o f f T 2 ϕ 2 ( T ) + θ r 2 = ω 1 ( θ s θ r ) ϕ 1 ( T ) + ω 2 ( θ s θ r ) ϕ 2 ( T ) + θ r = ( θ f c θ r ) ϕ 1 ( T ) + θ s 2 ϕ 2 ( T ) + θ r
where θ r is the residual water retention after centrifugation, and θ r = θ r 1 + θ r 2 . θ f c is the field capacity, which is close to the value of θ s 1 , hence the equation θ f c = θ s 1 .
In order to determine the distribution state of water retention and the numerical value of SWCC, Van Genuchten established a pore water retention model [14]. Combined with the T2 evolution characteristics of the water retention of the backfill, the following formula can be obtained according to the distribution law:
θ e = i 2 ω i [ 1 1 + α i x n i ] m i
where θ e refers to water retention, x is the variable related to relaxation time T, and x = 10 T .
Combining Formula (9) and Formula (10), the water retention model related to T2 evolution characteristics can be obtained by introducing the modified parameters:
θ ( T ) = a ω 1 [ 1 1 + α 1 10 ( T ) n 1 ] m 1 + a ( 1 ω 2 ) [ 1 1 + α 2 10 ( T ) n 2 ] m 2 + a b
where i = 1 refers to small pores and i = 2 represents large ones, α i is the parameter related to pore permeability, n i is the parameter related to pore size distribution, m i is the parameter reflecting curve asymmetry, and a and b are the correction coefficients of the curve, which here meet the condition that a = 6 ,   b = 1 .

3.4.2. Regression Analysis of the Pore Water Retention Model

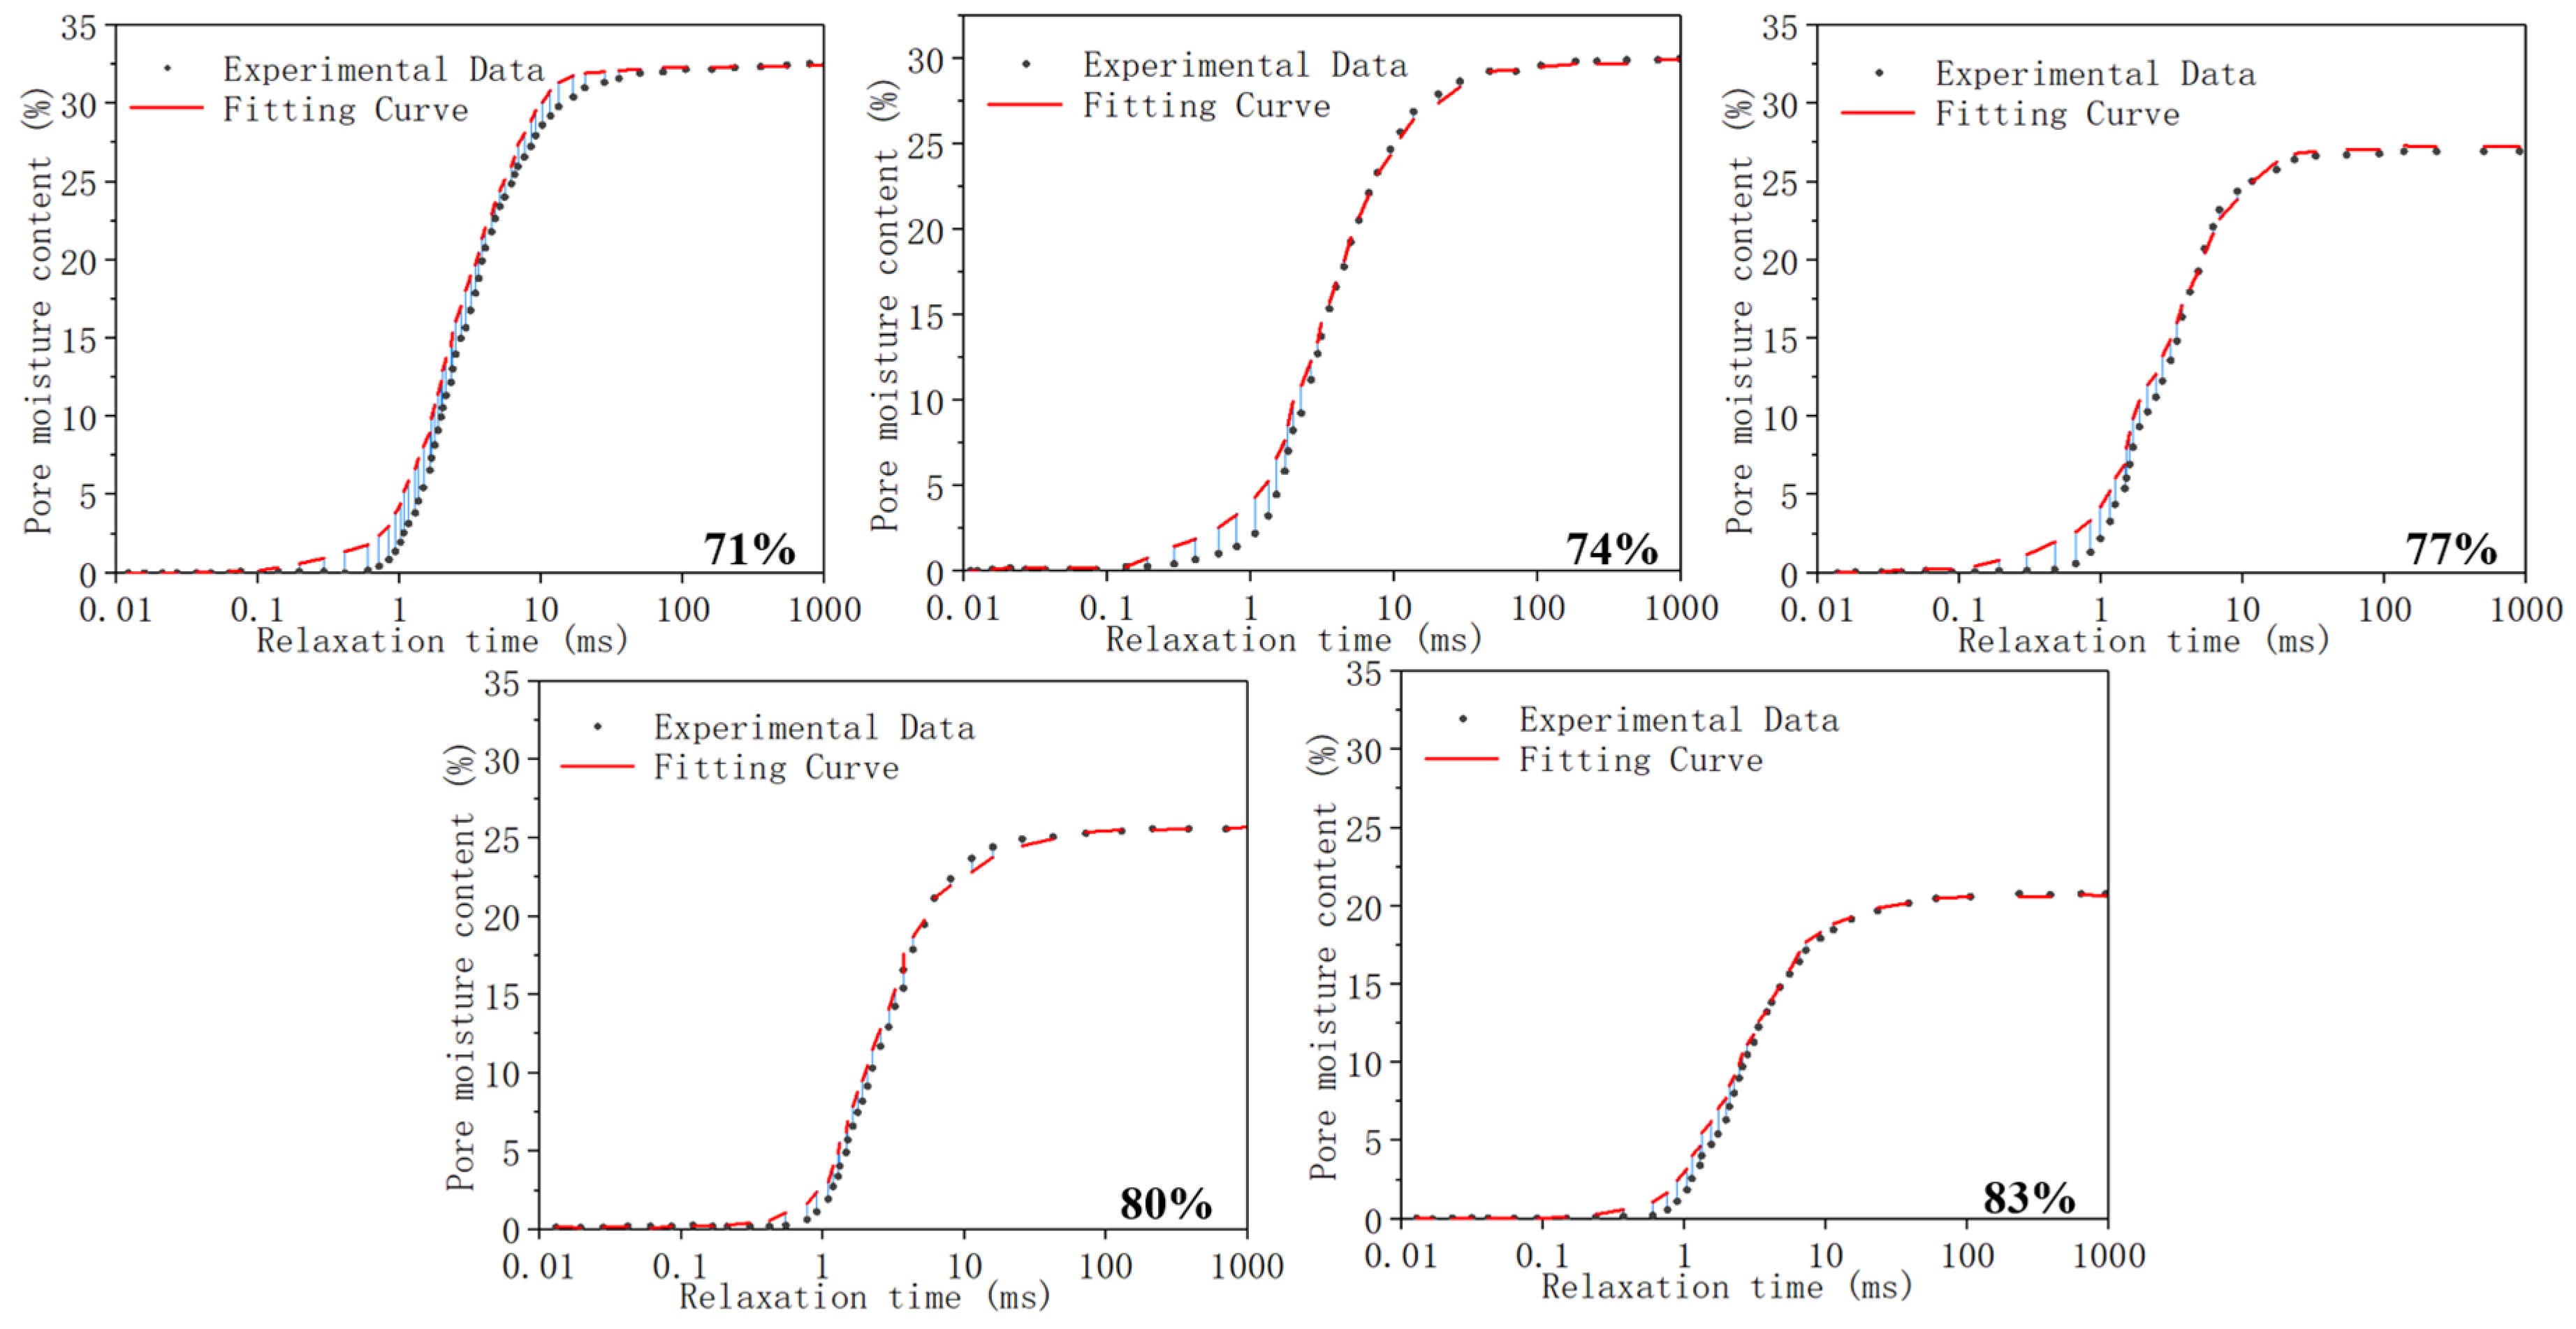
Based on the principle of the cutoff method in Figure 3, the regression analysis of the pore water retention (saturation) of backfill was carried out. The NMR test data was fit with the best centrifugal force according to the water retention model in Equation (11), as shown in Figure 11 (the abscissa is log10 T), and the relevant parameters are listed in Table 5.
Figure 11 and Table 5 indicate that the fitting degree of pore water retention in the samples of different concentrations was high ( R 2 > 0.98 ), which verifies that the NMR pore water retention model based on SWCC is feasible. Meanwhile, the small pores in the sample with 71% concentration account for 31.2% of the effective porosity, which increases slightly with an increase in concentration. According to the model, the proportions of the small pores to effective ones at a ratio of 1:4 with different concentrations accounts for 21.3%, 22.4%, 31.3%, 32.6%, and 38.3% respectively, while those of the sample at a ratio of 1:12 are 34.6%, 36.4%, 38.3%, 41.2%, and 42.4%, respectively.
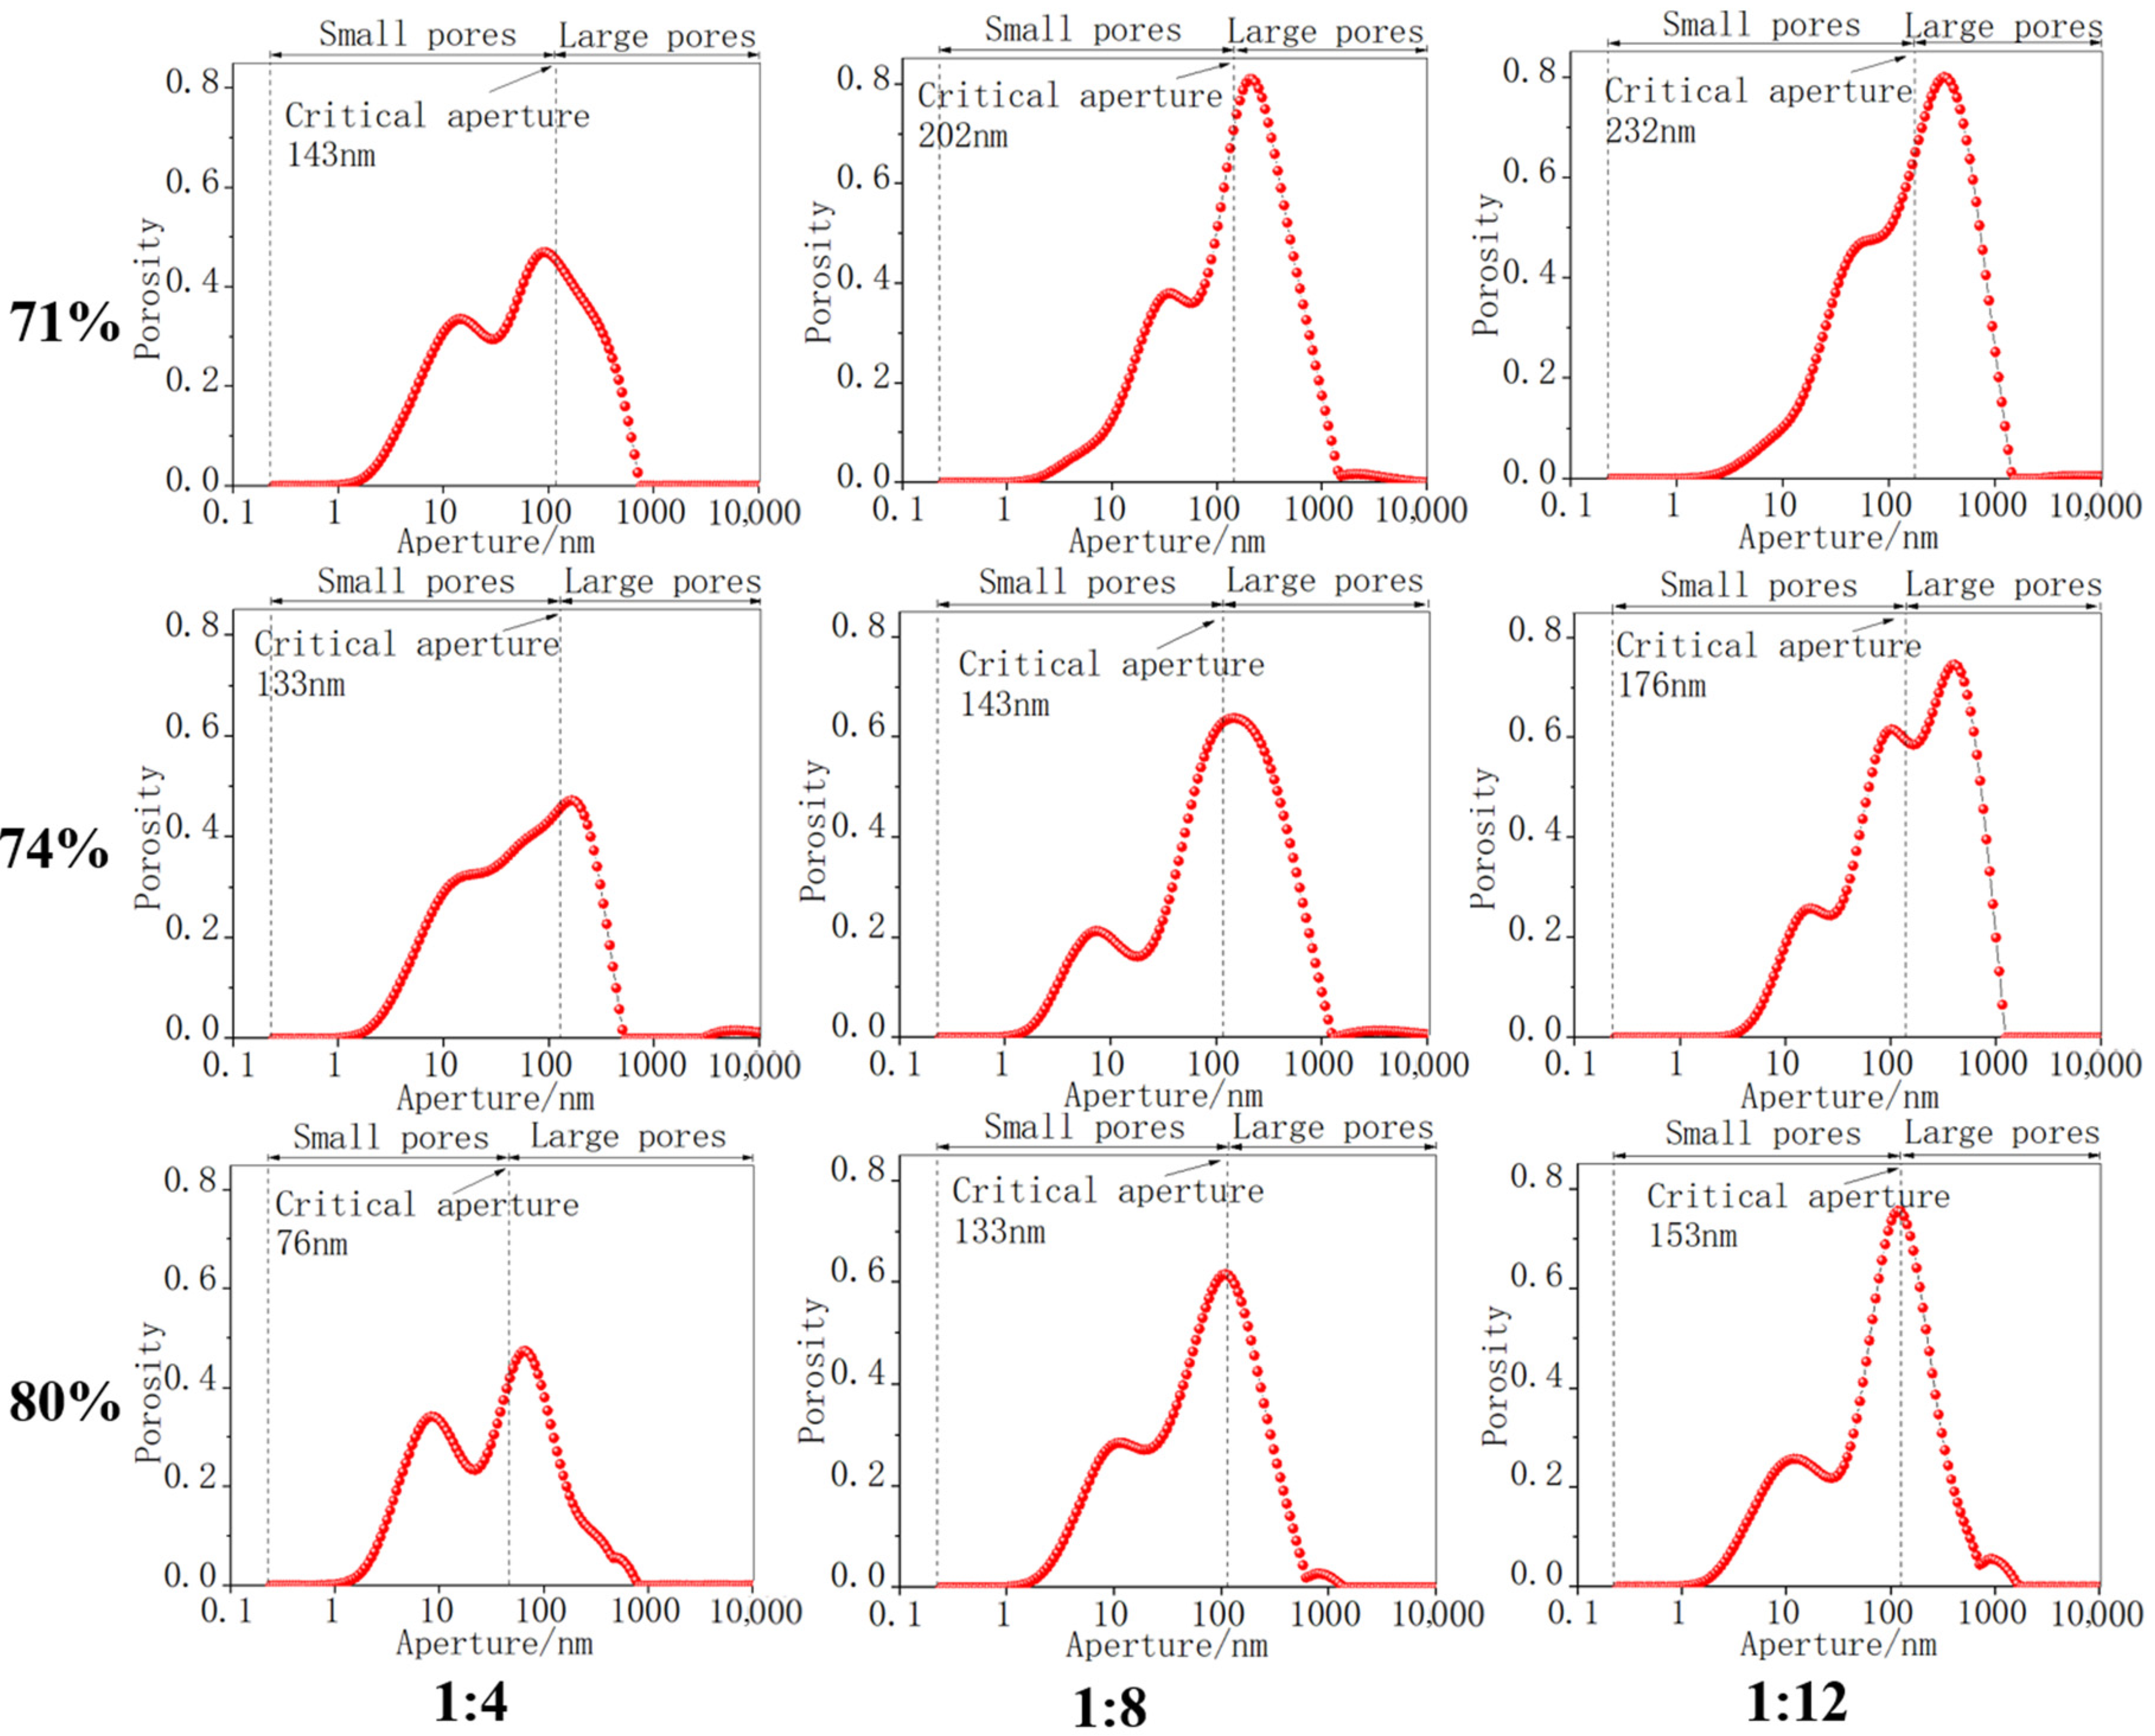
The relationship between the pore size distribution and the porosity component of the samples with a solid concentration of 71%, 74%, and 80% was analyzed. Figure 12 suggests critical pore sizes of the samples with different concentrations and ratios, following the law that the higher the concentration and the smaller the critical pore sizes are, the smaller the pore volume water retention will be. Moreover, the denser the distribution of small pores and the larger the pore size are, the greater the amount of bound water and water retention, and vice versa. Furthermore, as the cement–tailings ratio enlarges, the pore size distribution curve gradually exhibits bimodal characteristics. In addition to the spectral peaks of large pores, the characterization of small pores also tends to be distinct.
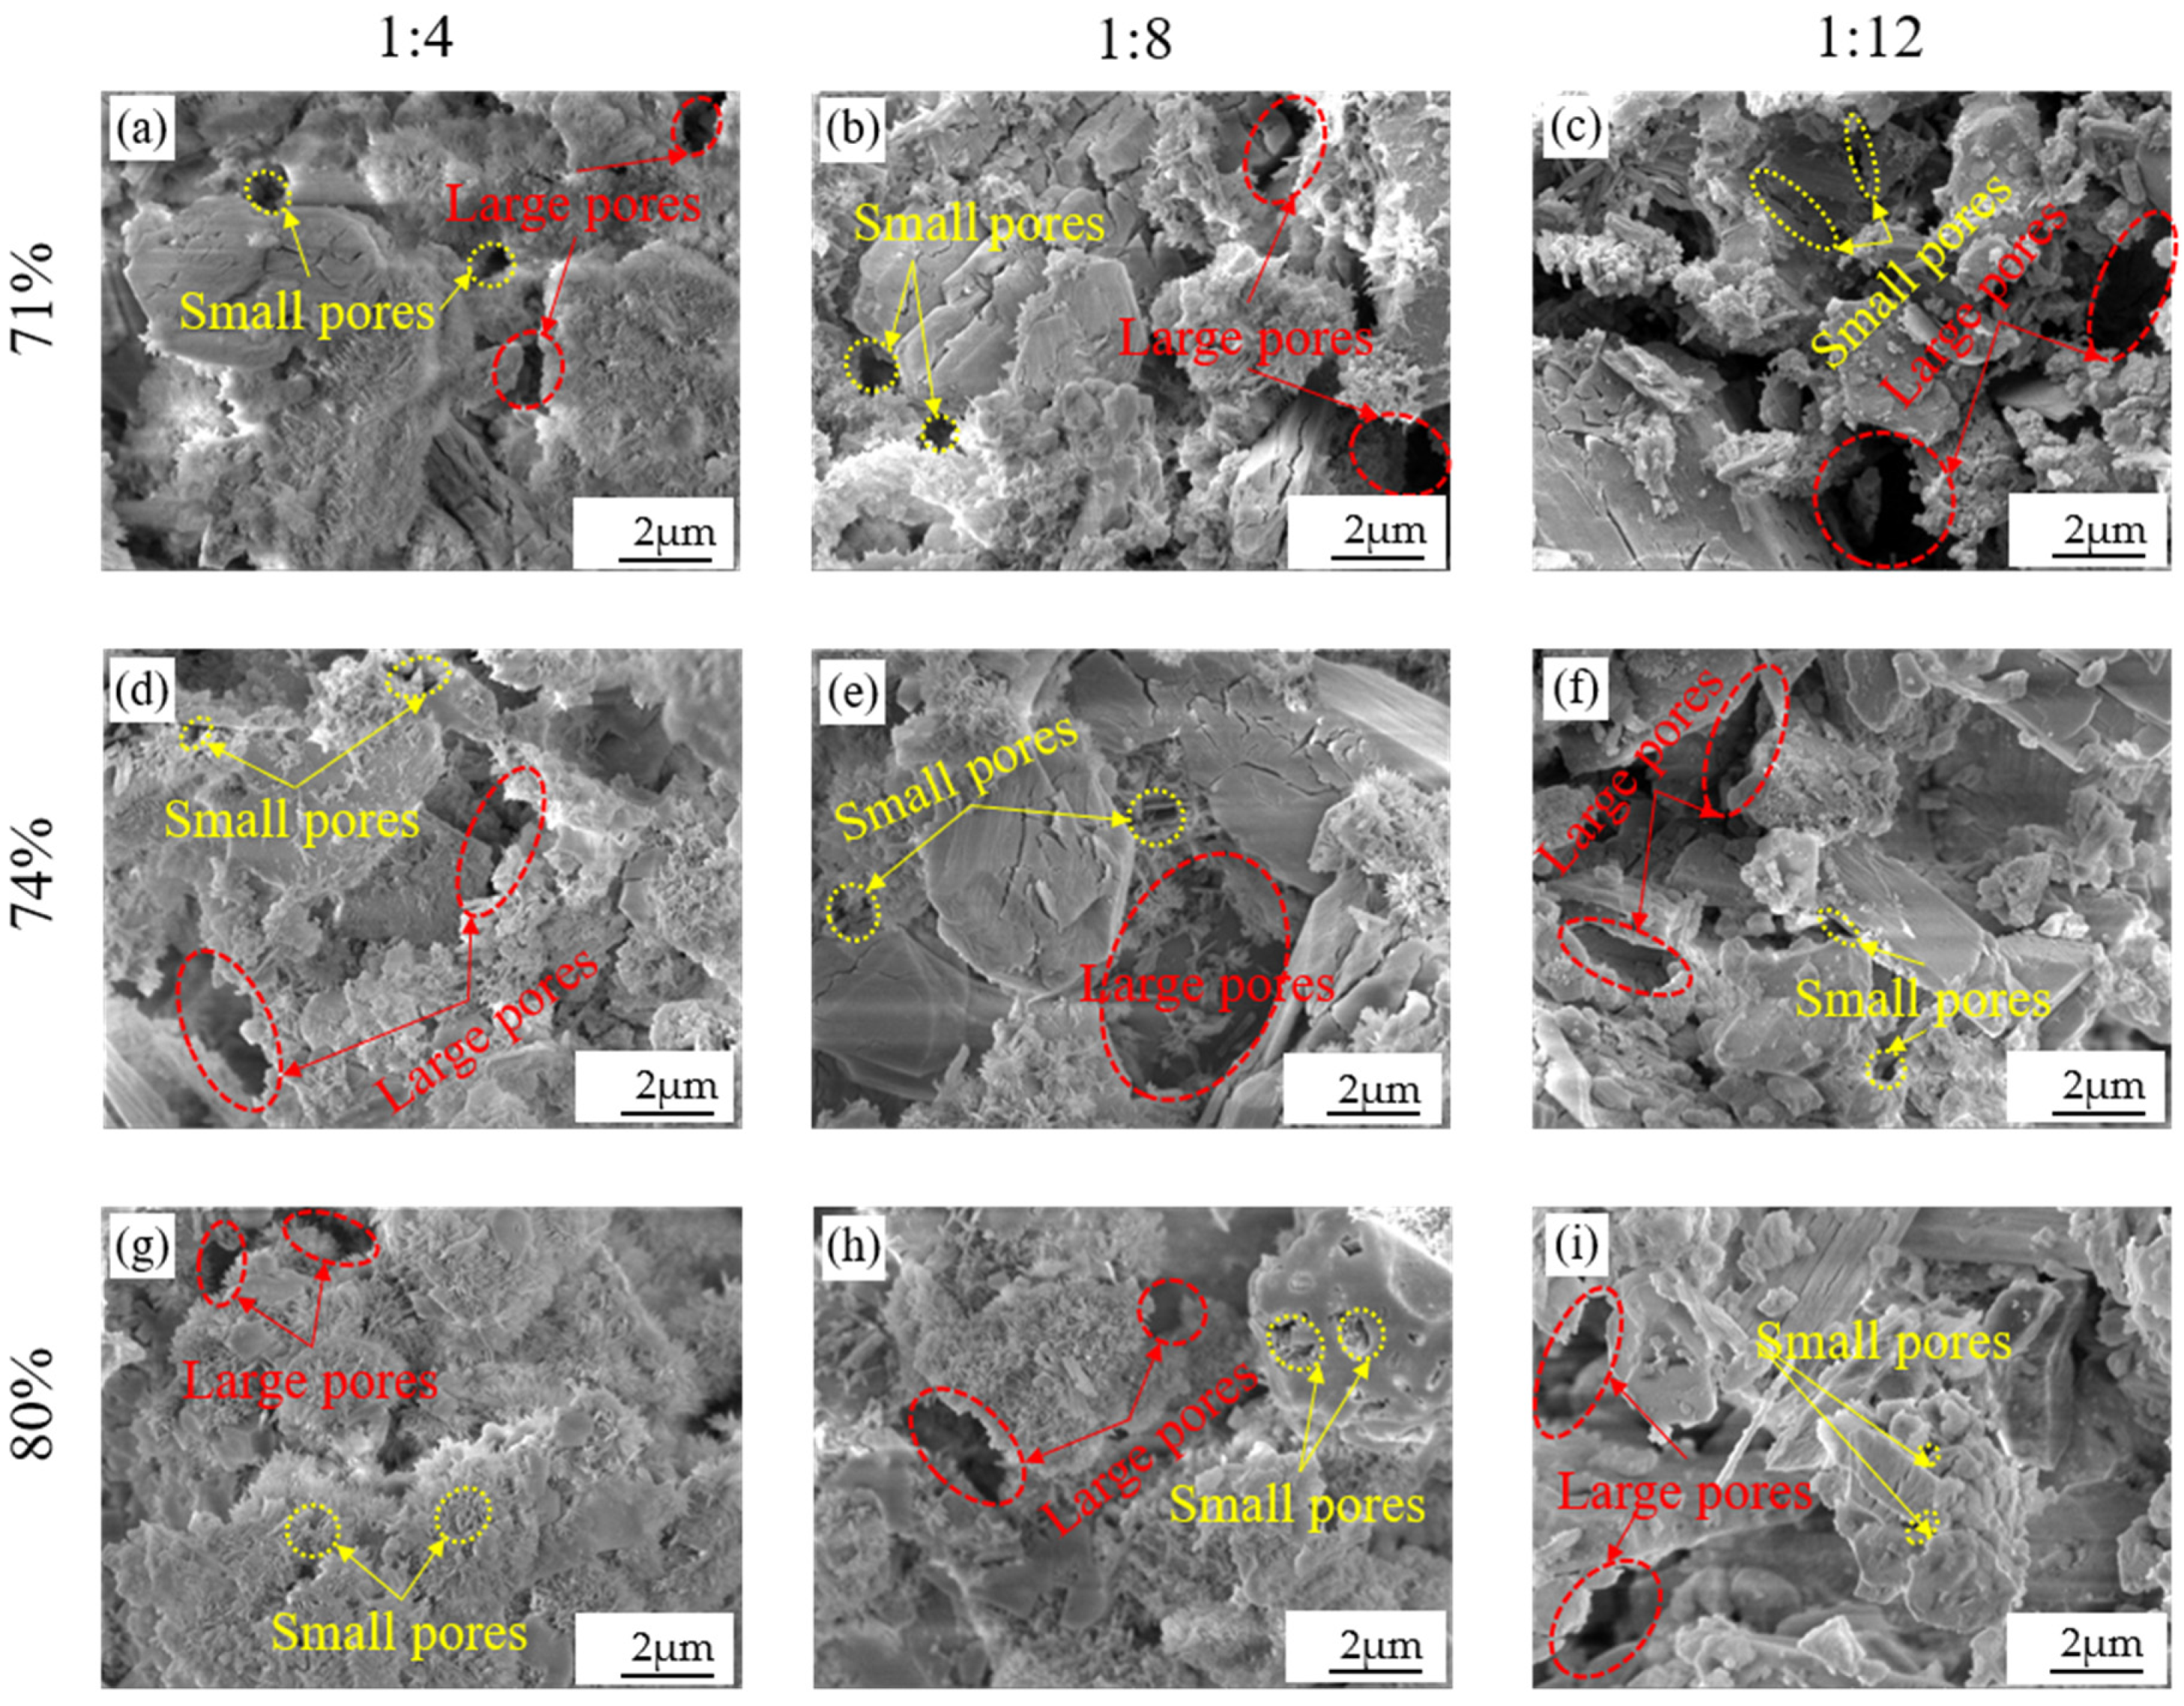
With an increase of the ratio, the T2 spectrum presents significant bimodal characteristics. The critical pore size becomes smaller, and the pore structure exhibits diversity. For the backfill samples with the same volume, the total water retention capacity reduces as the concentration and ratio increase, and the gelled product fills the pores inside as the hydration reaction occurs. The higher the cement–tailings ratio, the more intense the hydration reaction. SEM was employed to scan the microstructure of the backfill to evaluate the pore formation and curing state. Taking the backfill with a concentration of 71% as an example, as shown in Figure 13, after the same 28 day curing period, the higher the cement–tailings ratio was, the more obvious the bonding and filling effects of hydration products on the microstructure were. As shown in the figure, the microstructure formed by the backfill with a cement–tailings ratio of 1:4 was very dense. With a decrease in the cement–tailings ratio, the fine-grained tailings of the backfill and free water became stored in the internal channel, thereby they were unable to take part in hydration reactions and bonding. The tailings were deposited inside the structure with a loss of water after the curing was completed. However, the large pores were not filled, forming a loose structure. This result also verifies the bimodal characteristics of the T2 spectrum.
The transfer of pore water depends on the migration of the water molecules in the pores. Further, the degree of interpenetration between the pores and the sizes of the pores will affect the migration of pore water. In this study, an SWCC-based NMR pore water distribution model was established to analyze the pore water retention characteristics under a cement–tailings ratio of 1:8 and solid concentrations of 71%, 74%, 77%, 80%, and 83%. The distribution proportion of large and small pores was also obtained. The effective proportion of small pores in the sample increased with an increase in solid concentration, and the bimodal characteristics became more evident with an increase of the cement–tailings ratio. Moreover, the critical pore sizes of the backfill samples with different concentrations was obtained by combining the pore size distribution and pore volume water retention curve, revealing the state of water molecules inside the backfill in the centrifugal test.

4. Conclusions

(1)
The optimal centrifugal force of the backfills with different solid concentrations and cement–tailings ratios were analyzed by an NMR-centrifugation test. This test also achieved a comparison of the porosities of the backfill samples between the saturated water stage and the free water separation stage. The values were between 125.8 and 894.4 g / min when the concentration ranged from 71% to 83% at cement–tailings ratios of 1:4 and 1:8, respectively.
(2)
The range of the T2 cutoff of the backfill samples ranged from 3 to 10 ms. The centrifugal force and the water retention conformed to the overall power function distribution, and the T2 cutoff and the water retention conformed to the quadratic polynomial distribution. When the concentration and ratio accelerated, the T2 cutoff decreased; hence, the corresponding permeability increased, demonstrating that the higher the concentration and cement–tailings ratios are, the better the pore connectivity and guttation effect. The lower the concentration and cement–tailings ratio are, the more concentrated the occurrence of large pores, thereby forming long-term water retention.
(3)
By establishing an SWCC-based NMR pore water distribution model, the proportion distribution of large and small pores was obtained. Further, the pore size distribution curve presents bimodal characteristics. The higher the solid concentration and cement–tailings ratio, the smaller the critical pore size needed to reduce concentrated water retention in the area. This research lays a theoretical foundation for revealing the migration law of water molecules in backfill and to further study the probability density of pore size.

Author Contributions

R.G., K.Z., and W.L. conceived and designed the experiments; W.L. and R.G. performed the experiments; Q.R. analyzed the data; R.G. wrote the paper; Q.R. and W.L. improved the content of the thesis. All authors have read and agreed to the published version of the manuscript.

Funding

The authors would like to acknowledge that this work was supported by a project (No. 51774323) supported by the Natural Sciences Foundation of China

Conflicts of Interest

The authors declare no conflict of interest.

References

  1. Du, X.; Feng, G.; Zhang, Y.; Wang, Z.; Guo, Y.; Qi, T. Bearing mechanism and stability monitoring of cemented gangue-fly ash backfill column with stirrups in partial backfill engineering. Eng. Struct. 2019, 188, 876–881. [Google Scholar] [CrossRef]
  2. Wang, D.L.; Zhang, Q.L.; Chen, Q.S.; Qi, C.C.; Feng, Y.; Xiao, C.C. Temperature variation characteristics in flocculation settlement of tailings and its mechanism. Int. J. Min. Met. Mater. 2020. [Google Scholar] [CrossRef]
  3. Hou, D.; Li, D.; Hua, P.; Jiang, J.; Zhang, G. Statistical modelling of compressive strength controlled by porosity and pore size distribution for cementitious materials. Cem. Concr. Compos. 2019, 96, 11–20. [Google Scholar] [CrossRef]
  4. Chidiac, S.E.; Moutassem, F.; Mahmoodzadeh, F. Compressive strength model for concrete. Mag. Concr. Res. 2013, 65, 557–572. [Google Scholar] [CrossRef]
  5. Rong, H.; Zhou, M.; Hou, H. Pore structure evolution and its effect on strength development of sulfate-containing cemented paste backfill. Minerals 2017, 7, 8. [Google Scholar] [CrossRef] [Green Version]
  6. Li, J.-S.; Wang, D.; Kang, T.-H. Algorithmic study on rock pore structure based on micro-CT experiment. Chin. J. Geotech. Eng. 2010, 32, 1703–1708. [Google Scholar]
  7. Liu, L.; Fang, Z.; Qi, C.; Zhang, B.; Guo, L.; Song, K.I.I.L. Experimental investigation on the relationship between pore characteristics and unconfined compressive strength of cemented paste backfill. Constr. Build. Mater. 2018, 179, 254–264. [Google Scholar] [CrossRef]
  8. Yao, Y.; Liu, D.; Che, Y.; Tang, D.; Tang, S.; Huang, W. Petrophysical characterization of coals by low-field nuclear magnetic resonance (NMR). Fuel 2010, 89, 1371–1380. [Google Scholar] [CrossRef]
  9. Hu, J.H.; Ren, Q.F.; Jiang, Q.; Jiang, Y.J.; Shang, J.L.; Luo, Z.Q. Macroscopic and microscopic trans-scale characteristics of pore structure of mine grouting materials. Trans. Nonferr. Met. Soc. China 2019, 29, 1067–1081. [Google Scholar] [CrossRef]
  10. al Hinai, A.; Rezaee, R.; Esteban, L.; Labani, M. Comparisons of pore size distribution: A case from the Western Australian gas shale formations. J. Unconv. Oil Gas Resour. 2014, 8, 1–13. [Google Scholar] [CrossRef]
  11. Liu, L.; Xin, J.; Huan, C.; Qi, C.; Zhou, W.; Song, K.I.I.L. Pore and strength characteristics of cemented paste backfill using sulphide tailings: Effect of sulphur content. Constr. Build. Mater. 2020, 237, 117452. [Google Scholar] [CrossRef]
  12. Hu, J.; Ren, Q.; Ding, X.; Jiang, Q. Trans-scale relationship analysis between the pore structure and macro parameters of backfill and slurry. R. Soc. Open Sci. 2019, 6. [Google Scholar] [CrossRef] [PubMed] [Green Version]
  13. Huang, L.; Shao, M. Advances and perspectives on soil water research in China’s Loess Plateau. Earth Sci. Rev. 2019, 199, 102962. [Google Scholar] [CrossRef]
  14. van Genuchten, M.T. Closed-form equation for predicting the hydraulic conductivity of unsaturated soils. Soil Sci. Soc. Am. J. 1980, 44, 892–898. [Google Scholar] [CrossRef] [Green Version]
  15. Fredlund, D.G.; Xing, A.Q. Equations for the soil–water characteristic curve. Can. Geotech. J. 1994, 31, 521–532. [Google Scholar] [CrossRef]
  16. Gitirana, G.D.N.; Fredlund, D.G. Soil–water characteristic curve equation with independent properties. J. Geotech. Geoenvironmental. Eng. 2004, 130, 209–212. [Google Scholar] [CrossRef]
  17. Rahardjo, H.; Satyanaga, A.; D’Amore, G.A.R.; Leong, E.C. Soil–water characteristic curves of gap-graded soils. Eng. Geol. 2012, 125, 102–107. [Google Scholar] [CrossRef]
  18. Chen, R.P.; Liu, P.; Liu, X.M.; Wang, P.F.; Kang, X. Pore-scale model for estimating the bimodal soil–water characteristic curve and hydraulic conductivity of compacted soils with different initial densities. Eng. Geol. 2019, 260, 105199. [Google Scholar] [CrossRef]
  19. Zhai, Q.; Rahardjo, H.; Satyanaga, A.; Priono. Effect of bimodal soil–water characteristic curve on the estimation of permeability function. Eng. Geol. 2017, 230, 142–151. [Google Scholar] [CrossRef]
  20. Li, X.; Li, J.H.; Zhang, L.M. Predicting bimodal soil–water characteristic curves and permeability functions using physically based parameters. Comput. Geotech. 2014, 57, 85–96. [Google Scholar] [CrossRef]
  21. Ren, X.; Kang, J.; Ren, J.; Chen, X.; Zhang, M. A method for estimating soil water characteristic curve with limited experimental data. Geoderma 2020, 360, 114013. [Google Scholar] [CrossRef]
  22. Li, Z.; Liu, D.; Cai, Y.; Wang, Y.; Si, G. Evaluation of coal petrophysics incorporating fractal characteristics by mercury intrusion porosimetry and low-field NMR. Fuel 2020, 263, 116802. [Google Scholar] [CrossRef]
  23. Belem, T.; Benzaazoua, M. Predictive models for prefeasibility cemented paste backfill mix design. In Proceedings of the 3rd International Conference on Post-Mining, Nancy, France, 6–8 February 2008; Volume 8, pp. 6–8. [Google Scholar]
  24. Gao, R.; Zhou, K.; Zhang, J.; Guo, H.; Ren, Q. Research on the Dynamic Characteristics in the Flocculation Process of Mineral Processing Tailings. IEEE Access 2019, 7, 129244–129259. [Google Scholar] [CrossRef]
  25. Sadrossadat, E.; Basarir, H.; Luo, G.; Karrech, A.; Durham, R.; Fourie, A.; Elchalakani, M. Multi-objective mixture design of cemented paste backfill using particle swarm optimisation algorithm. Miner. Eng. 2020, 153, 106385. [Google Scholar] [CrossRef]
  26. Zhai, C.; Wu, S.; Liu, S.; Qin, L.; Xu, J. Experimental study on coal pore structure deterioration under freeze–thaw cycles. Environ. Earth Sci. 2017, 76, 507. [Google Scholar] [CrossRef]
  27. Li, J.L.; Zhou, K.P.; Zhang, Y.M.; Xu, Y.J. Study on freeze-thaw damage of rock pore structure based on nuclear magnetic resonance. Chin. J. Rock Mech. Eng. 2012, 31, 1208–1214. [Google Scholar]
  28. Li, J.; Liu, H.; Ai, K.; Zhu, L. An NMR-based experimental study on the pore structure of the hydration process of mine filling slurry. Adv. Civ. Eng. 2018, 2018. [Google Scholar] [CrossRef] [Green Version]
  29. Li, J.; Zhu, L.; Zhou, K.; Cao, S.; Liu, H. Experimental Investigation on the Effects of Ambient Freeze–Thaw Cycling on Creep Mechanical Properties of Sandstone Under Step Loading. IEEE Access 2019, 7, 108513–108520. [Google Scholar] [CrossRef]
  30. Liu, K.; Cheng, X.; Zhang, X.; Li, Z.; Zhuang, J.; Guo, X. Relationship between the microstructure/pore structure of oil-well cement and hydrostatic pressure. Transp. Porous Media 2018, 124, 463–478. [Google Scholar] [CrossRef]
  31. Testamanti, M.N.; Rezaee, R. Determination of NMR T2 cut-off for clay bound water in shales: A case study of Carynginia Formation, Perth Basin, Western Australia. J. Pet. Sci. Eng. 2017, 149, 497–503. [Google Scholar] [CrossRef]
  32. Ge, X.; Fan, Y.; Zhu, X.; Chen, Y.; Li, R. Determination of pore structure of rock based on nuclear magnetic resonance technique. J. Cent. South Univ. (Sci. Technol.) 2012, 43, 4796–4800. [Google Scholar]
  33. Wahhab, H.I.A.A.; Dalhat, M.A. Oil-Sludge Extended Asphalt Mastic Filled with Heavy Oil Fly Ash and Cement Waste for Waterproofing. J. Eng. Res. 2014, 11, 27–38. [Google Scholar] [CrossRef] [Green Version]
  34. Fall, M.; Célestin, J.C.; Pokharel, M.; Touré, M. A contribution to understanding the effects of curing temperature on the mechanical properties of mine cemented tailings backfill. Eng. Geol. 2010, 114, 397–413. [Google Scholar] [CrossRef]
  35. Lyu, C.; Ning, Z.; Wang, Q.; Chen, M. Application of NMR T2 to pore size distribution and movable fluid distribution in tight sandstones. Energy Fuels 2018, 32, 1395–1405. [Google Scholar] [CrossRef]
  36. Wu, T.; Li, X.; Zhao, J.; Zhang, D. Multiscale pore structure and its effect on gas transport in organic-rich shale. Water Resour. Res. 2017, 53, 5438–5450. [Google Scholar] [CrossRef]
  37. Liu, J.Z.; Zhu, J.F.; Cheng, J.; Zhou, J.H.; Cen, K.F. Pore structure and fractal analysis of Ximeng lignite under microwave irradiation. Fuel 2015, 146, 41–50. [Google Scholar] [CrossRef]
  38. Durner, W. Hydraulic conductivity estimation for soils with heterogeneous pore structure. Water Resour. Res. 1994, 30, 211–223. [Google Scholar] [CrossRef]
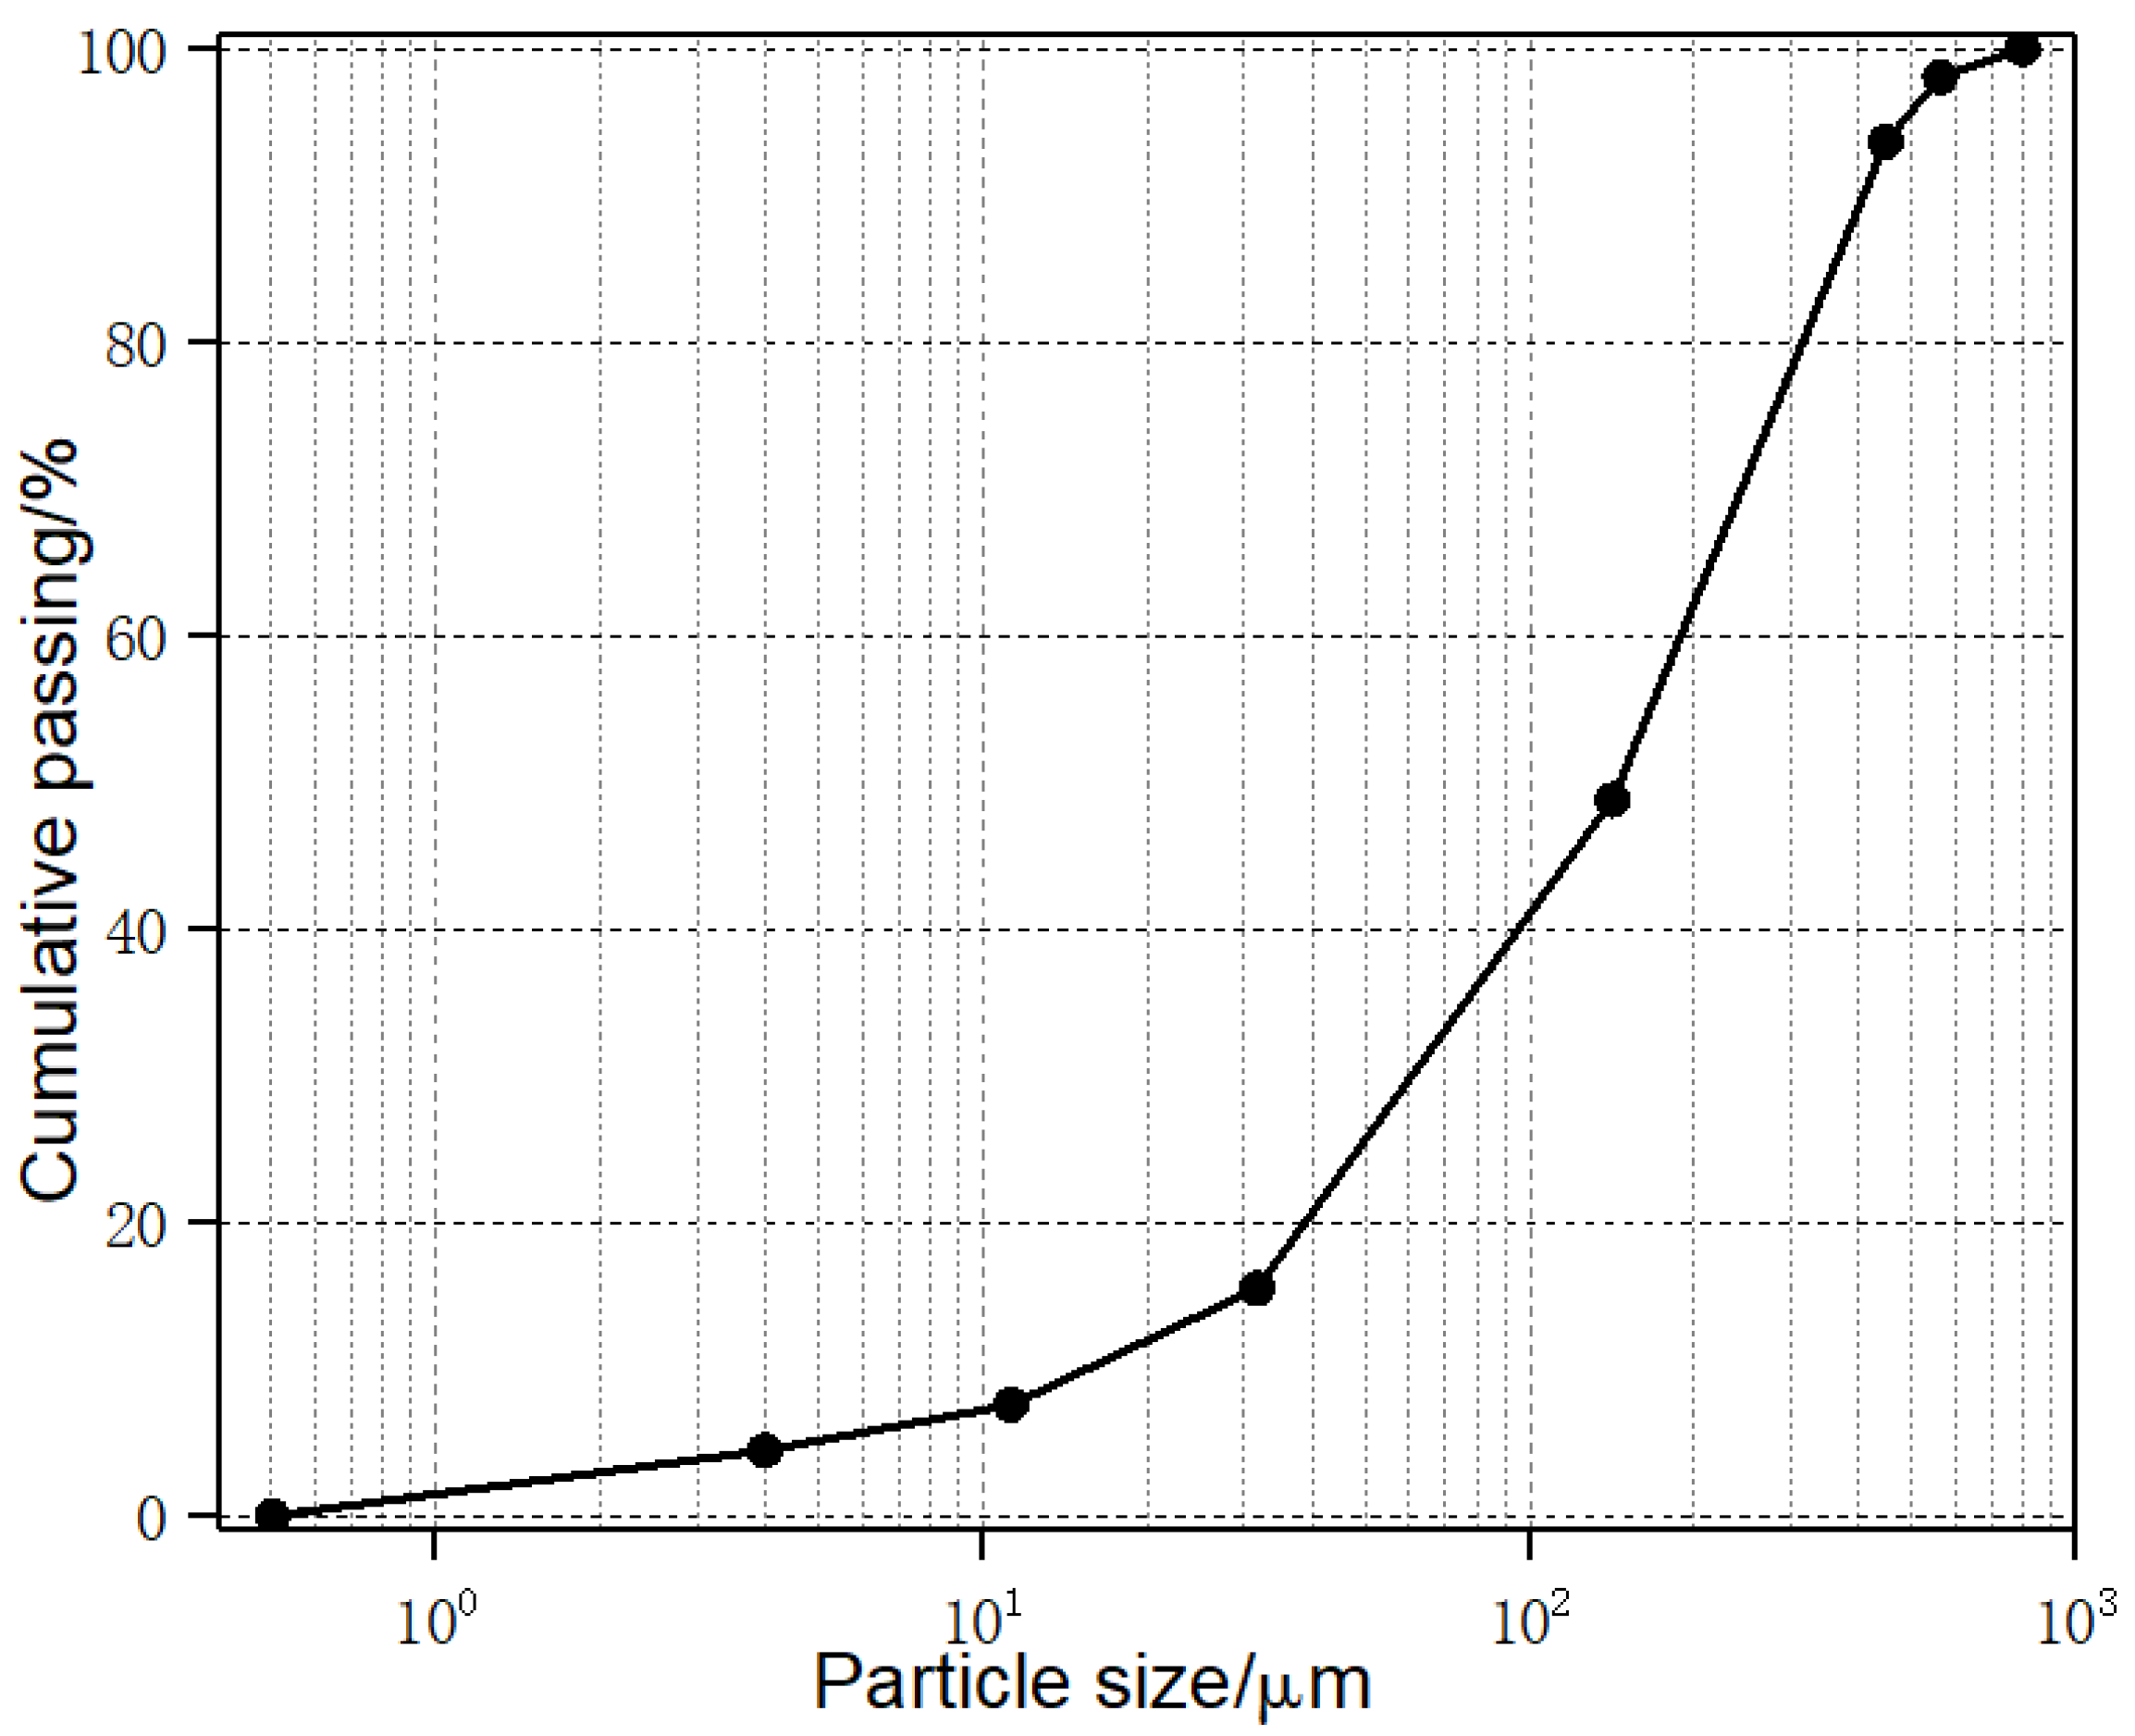
Figure 1. Tail sand particle size distribution curve.
Minerals 10 00610 g001
Figure 2. Specimen geometry and physical parameters.
Minerals 10 00610 g002
Figure 3. T2 spectrum diagram of samples before and after centrifugation. (a) Theoretical distribution model; (b) Measured distribution model.
Minerals 10 00610 g003
Figure 4. Coates model mechanism diagram.
Minerals 10 00610 g004
Figure 5. Nuclear magnetic resonance (NMR) test principle and field test device.
Minerals 10 00610 g005
Figure 6. Analysis of backfill porosity with different concentrations and ratios before and after centrifugation. (a) cement–tailings ratio of 1:4; (b) cement–tailings ratio of 1:8; (c) cement–tailings ratio of 1:12.
Minerals 10 00610 g006
Figure 7. Analysis of the centrifugal force and saturation of the backfills with different concentrations and ratios. (a) cement–tailings ratio of 1:4; (b) cement–tailings ratio of 1:8; (c) cement–tailings ratio of 1:12.
Minerals 10 00610 g007
Figure 8. Analysis of the porosity components of backfills with different concentrations and ratios before and after centrifugation (the horizontal axis is the T2 relaxation time, and the vertical axis is the porosity component). (ao) represent data of backfills with different cement–tailings ratio and solid mass concentration.
Minerals 10 00610 g008
Figure 9. The relationship between the T2 cutoff and the water retention of the samples at a cement–tailings ratio of 1:8. (a) concentration of 71%; (b) concentration of 74%
Minerals 10 00610 g009
Figure 10. The relationship between the T2 cutoff and the water retention of the samples. (a) concentration of 71%; (b) concentration of 74%.
Minerals 10 00610 g010
Figure 11. Regression analysis of the water retention model of backfill with the cement–tailings ratio of 1:8.
Minerals 10 00610 g011
Figure 12. Analysis and distribution of porosity and the critical pore sizes of backfills with different concentrations and ratios.
Minerals 10 00610 g012
Figure 13. Microstructure images of backfill with a concentration of 71%, 74%, and 80%. (a)–(i) represent SEM images of backfills with different cement–tailings ratio and solid mass concentration.
Minerals 10 00610 g013
Table 1. Tailings of the main chemical elements (mass concentration).
ElementONaMgAlSiSClKCaTi
Content42.50.0195.6950.7812.290.6760.0180.23933.020.037
ElementCrMnFeCuZnAsRbSrZrPb
Content0.0060.4681.3160.01410.1040.130.0020.02520.00130.179
Note: The content of other elements is 12.4794%.
Table 2. The saturated porosity of backfills with different concentrations and ratios.
Sample No.1:41:81:12
71%74%77%80%83%71%74%77%80%83%71%74%77%80%83%
Mean value24.6523.5821.6220.8717.2732.6230.3727.4226.1320.9034.3533.5434.2727.5524.72
Standard deviation0.170.220.300.230.190.150.100.120.190.240.170.220.130.300.30
Table 3. Results of the backfill centrifugal test.
Cement–Tailings RatioConcentration/%Φ/%Variation of Sample Porosity after Different Centrifugal Forces/%
Centrifuge Time/min125.8223.6349.4503.1684.8894.4 g/min
1:47124.646619.55718.06316.23415.54714.20614.203
7423.581520.31017.83716.74315.37114.990(-)
7721.618519.55917.83416.38515.16814.549(-)
8020.866618.99918.26017.13215.91515.07914.697
8317.266315.77815.29214.850(-)(-)(-)
1:87132.624625.51721.95819.57117.25915.93815.909
7430.365623.49121.42919.45117.94216.55816.242
7727.421323.16119.08518.487(-)(-)(-)
8026.128321.08718.34517.550(-)(-)(-)
8320.896317.91116.51215.988(-)(-)(-)
1:127134.347629.02923.97420.50119.08317.18516.155
7433.537626.62022.20418.11516.40114.43413.568
7731.265523.95221.99520.54616.35816.376(-)
8027.546422.55820.59818.46917.773(-)(-)
8324.723620.42918.99517.68316.86215.69315.437
Note: Φ is the average porosity of the samples.
Table 4. The optimal centrifugal force and T2 cutoff data.
Concentration1:41:81:12
R C F / g / m i n T2cutoff/ms R C F / g / m i n T2cutoff/ms R C F / g / m i n T2cutoff/ms
71%894.45.941894.48.407894.49.659
74%684.85.941894.47.317894.45.543
77%684.84.199349.47.843684.86.368
80%894.43.181349.45.543503.16.368
83%349.43.144349.46.368894.44.824
Table 5. Analysis of the fitting parameters of the water retention model of backfills at a cement–tailings ratio of 1:8 with different concentrations.
Fitting Parameters of Water Retention Model of Backfill
Concentration ω 1 α 1 n 1 m 1 α 2 n 2 m 2 R 2
71%0.3120.0620.9350.9381.6211.5242.2600.98
74%0.3240.0711.0351.1381.5811.2892.2400.99
77%0.3530.1200.6350.2381.6321.5682.1400.99
80%0.3860.7320.9350.6561.7211.5242.0400.99
83%0.4020.9650.8650.2341.8211.4241.8200.98