Article

Quantitative X-ray µCT Measurement of the Effect of Ore Characteristics on Non-Surface Mineral Grain Leaching

by
Mahdi Ghadiri
1,2,3,
Susan T.L. Harrison
3 and
Marijke A. Fagan-Endres
3,*
1
Institute of Research and Development, Duy Tan University, Da Nang 550000, Vietnam
2
The Faculty of Environment and Chemical Engineering, Duy Tan University, Da Nang 550000, Vietnam
3
Centre for Bioprocess Engineering Research, Department of Chemical Engineering, University of Cape Town, South Lane, Rondebosch, Cape Town 7700, South Africa
*
Author to whom correspondence should be addressed.
Minerals 2020, 10(9), 746; https://doi.org/10.3390/min10090746
Submission received: 30 June 2020 / Revised: 9 August 2020 / Accepted: 14 August 2020 / Published: 23 August 2020

Abstract

:
In heap (bio)leaching processes, a substantial fraction of the valuable mineral is positioned below the ore particle surface. X-ray micro-computed tomography (μCT) was used to quantify the effect of ore type and structure and operating temperature on the leaching of this mineral, to investigate the rate-controlling factors. Mini-leaching columns containing agglomerated chalcopyrite, pyrite, and malachite ores were scanned by X-ray μCT (13.40 µm resolution) at select time intervals. The leaching of a relatively porous malachite ore was reaction-controlled, with no leaching penetration limitation into the ore particles. For two less porous ore types, the structure and higher porosity of the agglomerate rim and conditions that resulted in the degradation of the full ore matrix structure were found to be the determining variables of the leaching extent and time. In the case of a chalcopyrite ore, an enhancement of copper recovery and sulphide mineral dissolution with increasing temperature was attributable to the increased leaching penetration distance and crack development in addition to thermodynamically expected increased leaching rate. Increasing temperature did not affect the maximum penetration distance for the waste rock containing pyrite, with no crack development observed. Overall increases in iron recovery were due to accelerated leaching rates, though diffusion or mineral access limitations were evident at a higher temperature.

1. Introduction

The efficiency of the chemical or microbial dissolution of mineral grains during heap leaching is strongly dependent on the ore nature. This includes its type, origin, and chemical composition [1,2]. Depending on these factors, different intermediates can be formed during metal dissolution and this affects mineral leaching kinetics [3]. Copper-bearing ores are found in various forms of oxides, primary and secondary sulphides. Oxides such as tenorite and malachite might need only hours of leaching to achieve a high extraction value, even at low temperatures, while secondary sulphides like chalcocite and covellite require months of leaching. Chalcopyrite, the world’s main copper resource, can require years of leaching [2].
In addition to knowledge of the main mineral of interest, an ore’s overall mineral composition is also important. Most copper ores contain pyrite and its presence can have some disadvantages such as the precipitation of potentially interfering ferri-hydroxides and jarosite. In aerated heaps, it can scavenge available oxygen. However, pyrite oxidation is also advantageous as it provides acid and heat in the heap [1]. The presence of gangue minerals such as silicate and limonite consume acid during initial leaching. Soluble silicate breakdown products may regenerate acid by reaction with each other during the formation of various precipitates and form new solid silicate alteration products [4]. Sulphide minerals also exhibit a surface rest potential and can therefore corrode by galvanic action [5]. For example, galvanic interaction between pyrite and copper sulphide minerals causes the copper minerals to corrode more rapidly than the pyrite and this effect is accelerated in the presence of micro-organisms [6].
Heap (bio)leaching reactions are exothermic and temperatures in heaps are typically higher than ambient, varying with position in an ore bed. Increasing temperature changes the microbial community in a bioleach from predominantly mesophilic to thermo-tolerant and moderate thermophilic microorganisms to thermophilic microorganisms [7]. Chalcopyrite leaching in particular is known to require higher temperatures to achieve a rapid copper leaching rate [2], due to the high values of activation energy (130.7 kJ mol−1 in the temperature range between 35 and 68 °C [8]) required to break down bonds in the chalcopyrite crystal lattice. Temperature, additionally, has an effect on the physical properties of the heap liquid, including the viscosity, density and solubility of copper sulphates in a saturated solution [9]. Increases in the temperature lead to the enhancement of density and solubility but the reduction of viscosity [9], with both of these factors affecting oxygen mass transfer from the gas phase to liquid phase in a heap [10].
The target mineral grain dissemination and size in large ore particles plays a vital role in heap leaching performance because the contact of mineral grains and leaching reagent is necessary for leaching of the mineral grain to occur [11]. The effect of temperature, ore type and the addition of chemicals on bulk metal recovery have long been quantified based on solution chemistry results and traditional mineralogical analyses (e.g., X-ray diffraction (XRD), quantitative evaluation of minerals by scanning electron microscopy (QEMSCAN), and scanning electron microscope (SEM)), but these techniques cannot be used to study the effect of interplay between these operating parameters and ore particle structure and the mineral grains’ position in particles. However, analytical tomographic techniques such as high-resolution X-ray micro-computed tomography (μCT) have opened new avenues for the study of non-surface grain leaching [12,13].
In the current study, the visualisation and quantitative analysis using X-ray μCT was used to track non-surface mineral grain leaching for different mineral ore types, selected because of their different physical and mineral leaching characteristics (malachite, pyrite and chalcopyrite). Critical to this is the inclusion of the effect of temperature on the leaching behaviour, as this operating parameter is intrinsically tied to the leaching system optimisation for the various ores. The aim of the work was to disaggregate the various potential effects of the conditions and identify the leaching rate controlling factors, and so to advise towards higher metal recoveries.

2. Experimental

2.1. Ores

Three different ores were used: a malachite (Cu2(OH)2CO3) ore provided by Mintek (South Africa), a waste rock containing pyrite (FeS2) obtained from the Gamsberg mine in South Africa, and a Pinto Valley (Arizona, USA) chalcopyrite (CuFeS2) ore.
The mineralogical characterisation of the ores was done through quantitative evaluation of minerals by scanning electron microscopy (QEMSCAN), using the unit located at the University of Cape Town (FEI QEMSCAN 650F with two Bruker silicon drift detector (SDD) detectors, Cape Town, South Africa). Operating conditions were set at 25 kV and 10 nÅ beam current. Individual ore particles (8 to 16 mm) were analysed using the Field Image analysis routine. A pixel spacing of 14.5 μm was used for the Field Image analysis and the determination of grain size distribution. Ore samples were mounted in epoxy resin and prepared into 30 mm diameter polished resin blocks. In the bulk mineralogy routine, used for quantitative mineral composition determination, all size fractions with a certain weight percentage were mixed and ground using a pulveriser and then the ground ore was mounted in epoxy resin [14].
The chalcopyrite ore comprised 1.5 wt% chalcopyrite, 0.7 wt% pyrite and 0.3 wt% other sulphide minerals, while the pyrite ore contained 29.4 wt% pyrite, 6.3 wt% sulphide trap and 3.5 wt% pyrrhotite. In the malachite ore, the dominant copper minerals were malachite (6.8 wt%) and bornite (2.4 wt%). The main gangue minerals found in the three ores are detailed in Table 1.

2.1.1. Ore Particle Size Distribution

The chalcopyrite ore sample, after primary crushing by a hydraulic rock splitter into small particles, was further reduced in size by the Sturtevant laboratory jaw-crusher. The waste rock and malachite ores were received ready crushed.
The ores were sieved into six fractions (<0.25 mm, 0.25–1 mm, 1–2 mm, 2–5.6 mm, 5.6–8 mm, 8–16 mm). Figure 1 shows the resulting cumulative particle size distribution (PSD) of the chalcopyrite, to which the other ores were matched.
Each ore size fraction was representatively split into small portions using a rotary splitter. The different size fractions were selectively recombined to create 50 g batches of representative samples for testing.

2.1.2. Ore Agglomeration

Ore was agglomerated using a ratio of 2 kg acid/ton ore and 5.5% moisture, where approximately 0.5% comes with the ore [15,16]. This corresponded to an acid water solution prepared at a ratio of 2.6 mL water to 0.1 mL H2SO4 combined with 50 g of ore. The acidified water was added to the ore and then agglomerated by rotating in a bucket drum, to ensure a homogeneous clumpy sludge. The agglomerated ore was immediately packed into the experimental apparatus.

2.2. Experimental Setup

2.2.1. Mini-Leaching Columns

Mini-leaching columns were designed based the X-ray µCT field of view (FOV) required to be able to accurately image the full chalcopyrite mineral grain size distribution, determined using QEMSCAN. Glass columns, with a diameter of 20 mm and a length of 150 mm, were constructed by Glasschem (Stellenbosch, South Africa). The ends were closed with screw-cap lids with a rubber stopper and glass nipple. A peristaltic pump (Masterflex Console Drive, 7521-57) was connected to the glass nipple to allow the solution to be pumped in from the top of the column, with a collection of liquid out the bottom. Glass wool and 50 glass beads (4 mm diameter, Lasec) were placed at the top and bottom of the column to ensure the uniform distribution of liquid in the column.

2.2.2. Incubators

Two four and eight mini-column incubators were designed and constructed, illustrated in Figure 2. They were fitted with a heater and a fan to circulate the air for uniform temperature distribution. An electronic controller was used to set the temperature by altering the power to the heater.

2.3. Solution Chemistry

A Metrohm 827 pH/redox lab meter with a Metrohm 6.0451.100 probe was used to measure the redox potential. The pH was monitored using a Metrohm 713 pH meter with a Metrohm 6.0258.000 probe. The ferrous and total iron concentrations were determined using the 1–10 phenanthroline method [17]. Copper concentrations were analysed using an atomic adsorption spectrophotometer (AAS) (Varian Spectra AA 110, Varian Inc., Palo Alto, CA, USA).

2.4. Flow-Through Leaching Experiments

The mini-columns were loaded with 50 g of an ore and operated as a continuous unsaturated flow-through system. The leaching operating conditions, summarised in Table 2, were based on typical, best-practice or optimised operating conditions for each mineral ore type.
The loaded mini-columns were washed and conditioned with acidified solution (pH = 1.15, prepared using concentrated H2SO4) prior to the introduction of feed solution. The leaching liquid feed was then pumped into the top of the mini-columns from a single drip emitter point source at a flowrate of 2.55 mL h−1 for a period of 26 days for malachite and 5.5 months for chalcopyrite and pyrite. An acidified solution with a pH of 1.20 was used during the malachite leaching. Pyrite leaching was conducted using a feed solution with a pH of 1.15 and 8.60 g L−1 Fe3+. For the chalcopyrite ore, the feed had a pH of 1.15 and contained 4.30 g L−1 Fe3+ and 8.33 g L−1 Fe2+, equivalent to 440 mV redox potential. Hiroyoshi et al. [18] and Peterson and Dixon [19] reported that chalcopyrite leaches more slowly at high potentials, while the pyrite oxidation rate increases with increasing redox potential. There is a range of critical redox potential from 410 to 490 mV at which chalcopyrite leaching is maximized. The lower redox potential was selected to maximise chalcopyrite leaching while maintaining low pyrite oxidation.
Experiments were conducted in incubators at 30 °C, 37 °C and 65 °C. The lower temperature was anticipated to be appropriate for the more readily leachable malachite ore. The two other temperatures correspond to conditions for mesophilic microorganisms (active at 37 °C) and thermophilic microorganisms (active at 65 °C) which are active in pyrite and chalcopyrite bioleaching.

2.5. X-ray µCT Image Acquisition

X-ray scans were performed at X-SIGHT X-RAY Services in Cape Town using a Nikon HMX ST 225, Metris X-Tek, London, UK which permits resolutions of 3–70 µm, depending on the sample size.
The mini-columns were imaged in their entirety at the start and end of an experiment. These images of the whole mini-columns were acquired as five separate sections from top (1) to bottom (5), because the division into small parts permitted a smaller FOV and thus a finer image resolution. Each section was individually scanned with X-ray µCT for 50 min at 100 kV and 150 mA using a 0.38 mm copper filter (to reduce the effect of beam hardening and noise caused by low level energy) and at a distance of 59.40 mm between X-ray source and specimen. The scans collected 3000 projections at 0.12 angular increments on a 1900 × 1500 pixel detector. All the scans were performed at the same resolution (voxels of approximately 13.40 μm × 13.40 μm × 13.40 μm). Copper wires were attached to the outside of the column for image registration.
During the leaching experiments, the mini-columns were removed periodically from the flow to allow the scanning of three regions (top, middle and bottom). This was done at four time points over the 165-day leaching period for pyrite and chalcopyrite and at 1 time point for malachite over the 26-day experimental period. The imaging time points were chosen based on the leaching rates observed in preliminary leaching experiments.
The advanced 3D analysis software Avizo® 9 (Thermo Fisher Scientific, Waltham, MA, USA) and ImageJ-Fiji (University of Wisconsin, Madison, WI, USA) [20] were used to visualize and analyse the image data.

3. Image Processing Design

3.1. Mineral Grain Segmentation

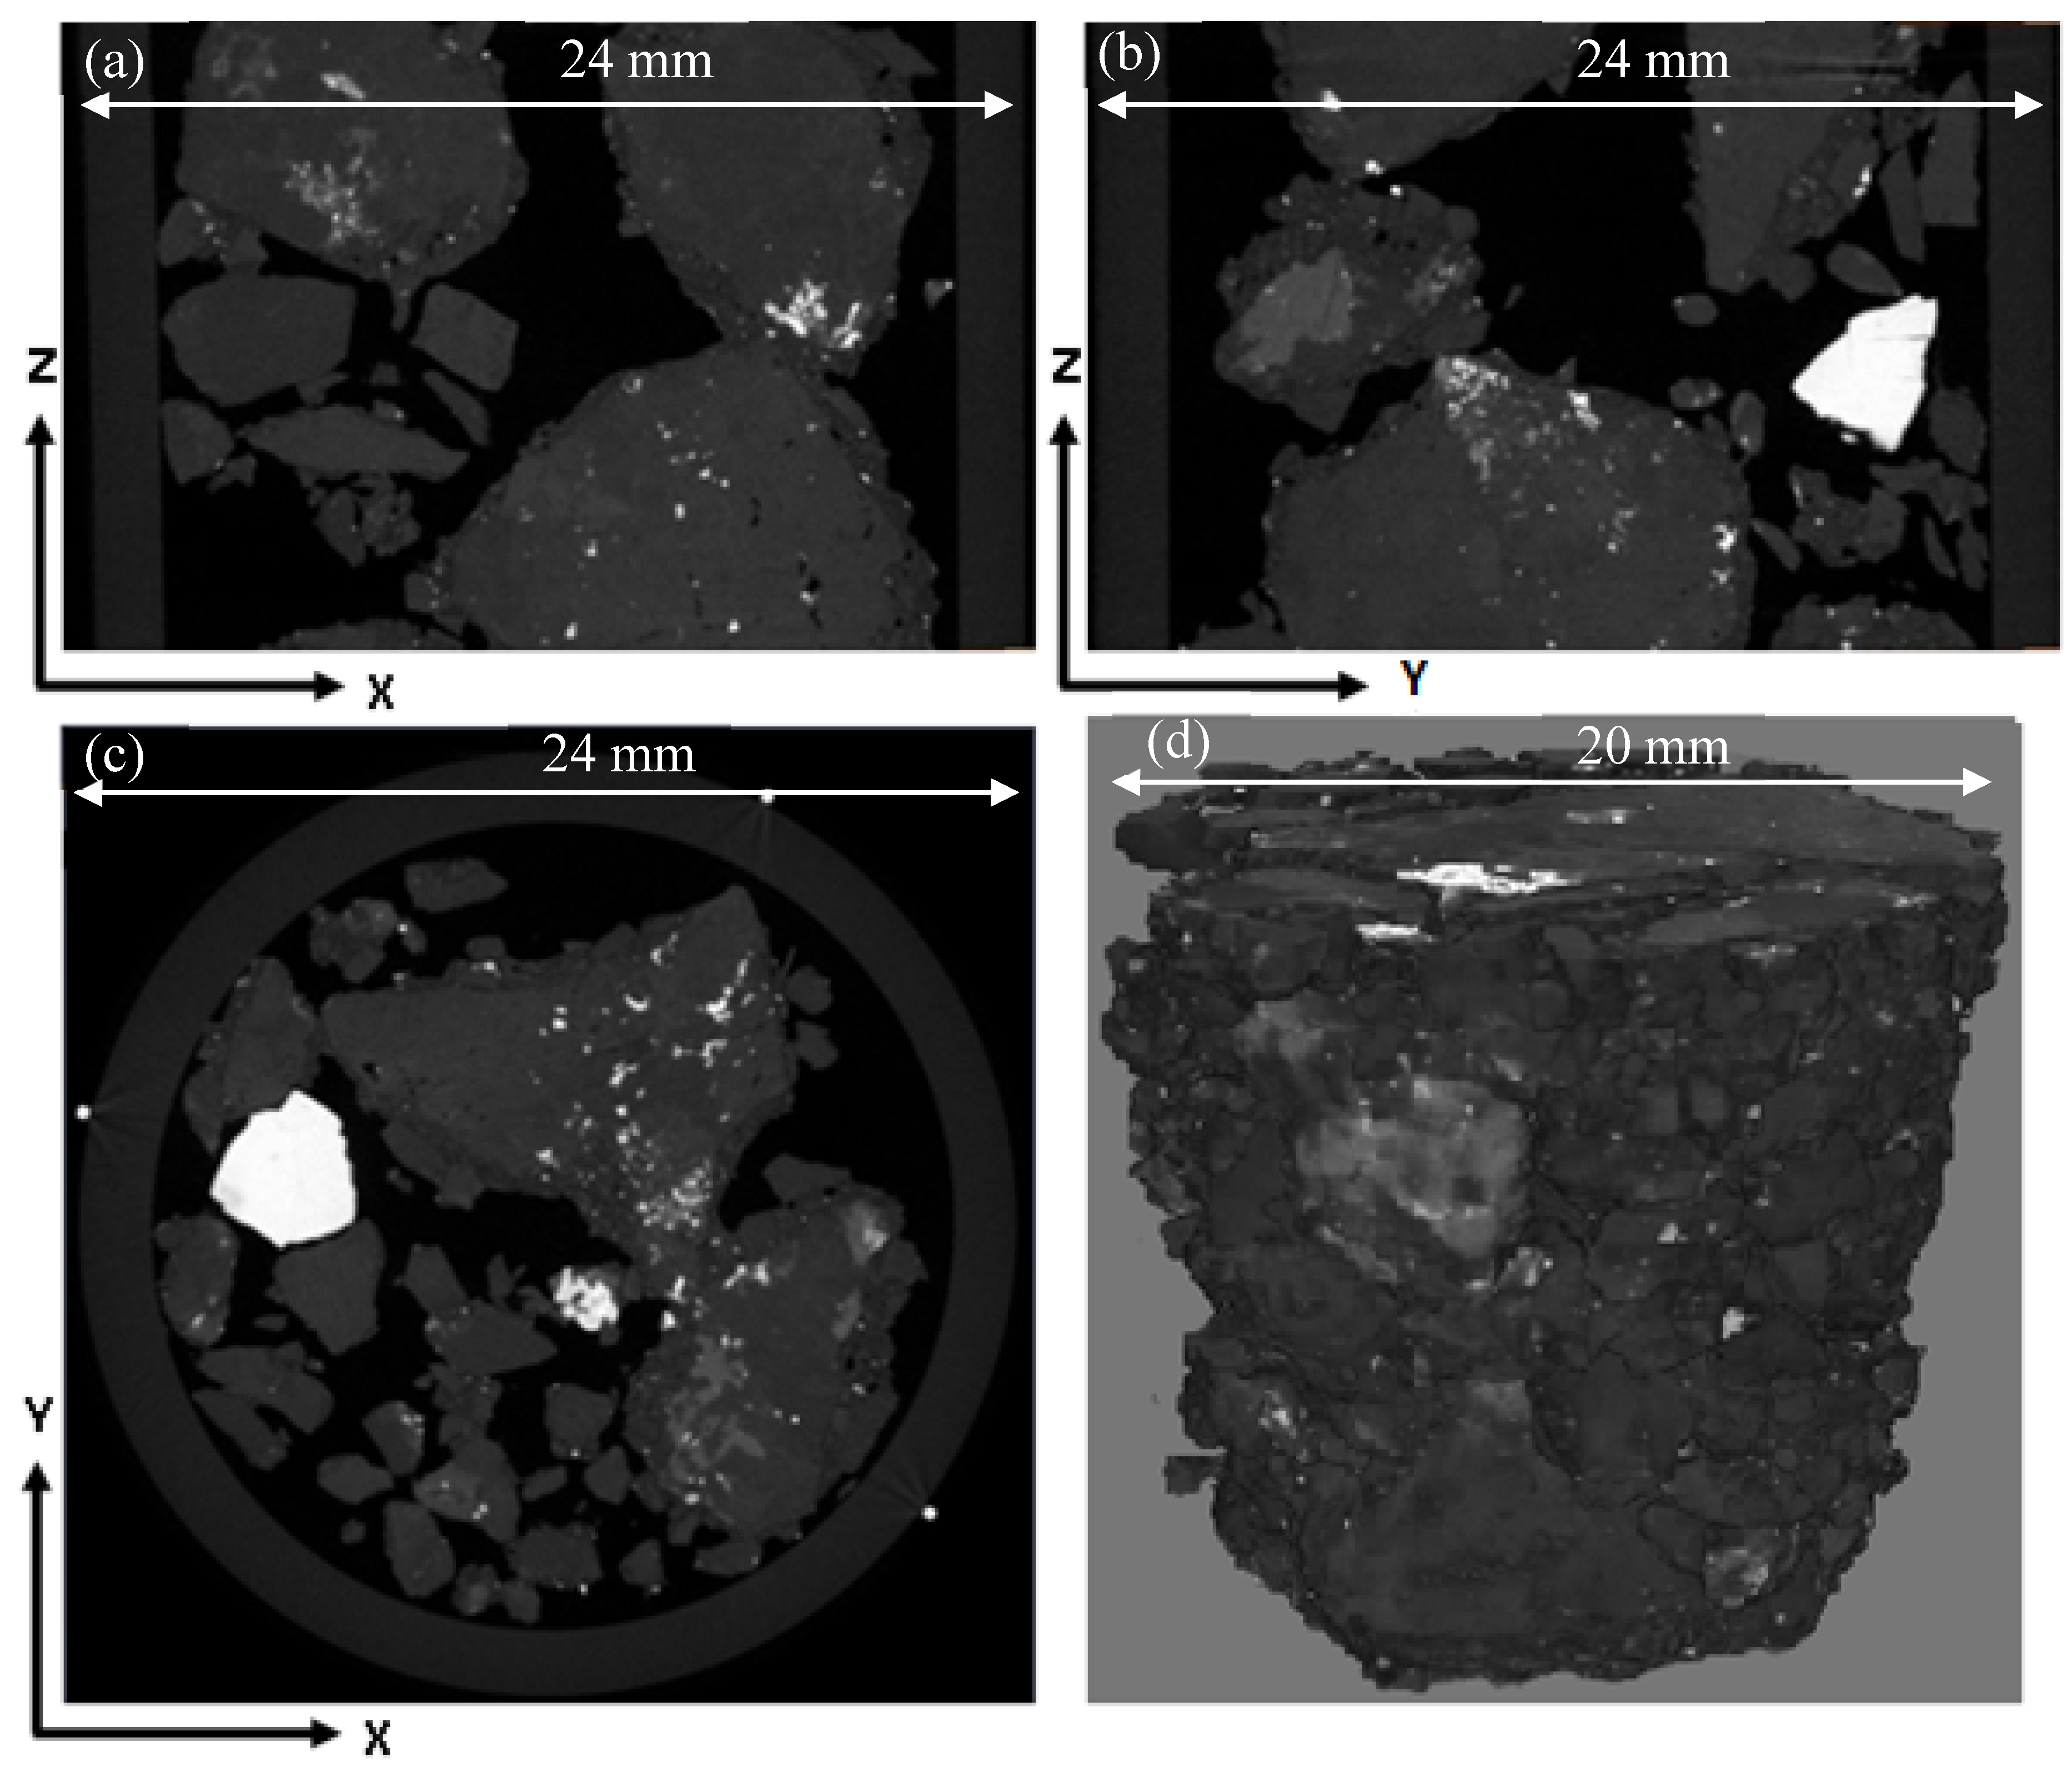
Figure 3 shows the example side and top views and a volume-rendered 3D view of a packed mini-column reconstructed data set. The metal oxide/sulphide mineral grains are represented by the brighter voxels, as they have high X-ray attenuation, attributed to their relatively high densities and atomic numbers. By tracking these voxels and converting this to the volume of target mineral present at a given point in time, the X-ray images can be used as a measure of leaching extent.
Segmentation involves assigning labels to image voxels to identify and separate objects in a 3D image. It is one of the most critical steps in the process of reducing images to more useful information. In mineral processing, segmentation allows the different minerals to be distinguished and for solid ore to be distinguished from any gaseous and/or liquid phases present. Additional information from other techniques including QEMSCAN, X-ray fluorescence (XRF) and SEM–EDS are often required to segment between different mineral phases in a X-ray µCT dataset effectively [21]. Furthermore, accurate and quantitative processing requires segmentation which clearly identifies the mineral boundaries. Correct or unique thresholds cannot be determined easily or accurately if the edges are blurred by noise or partial volume effects. Global and local thresholding techniques and feature-based classification are used to overcome this.
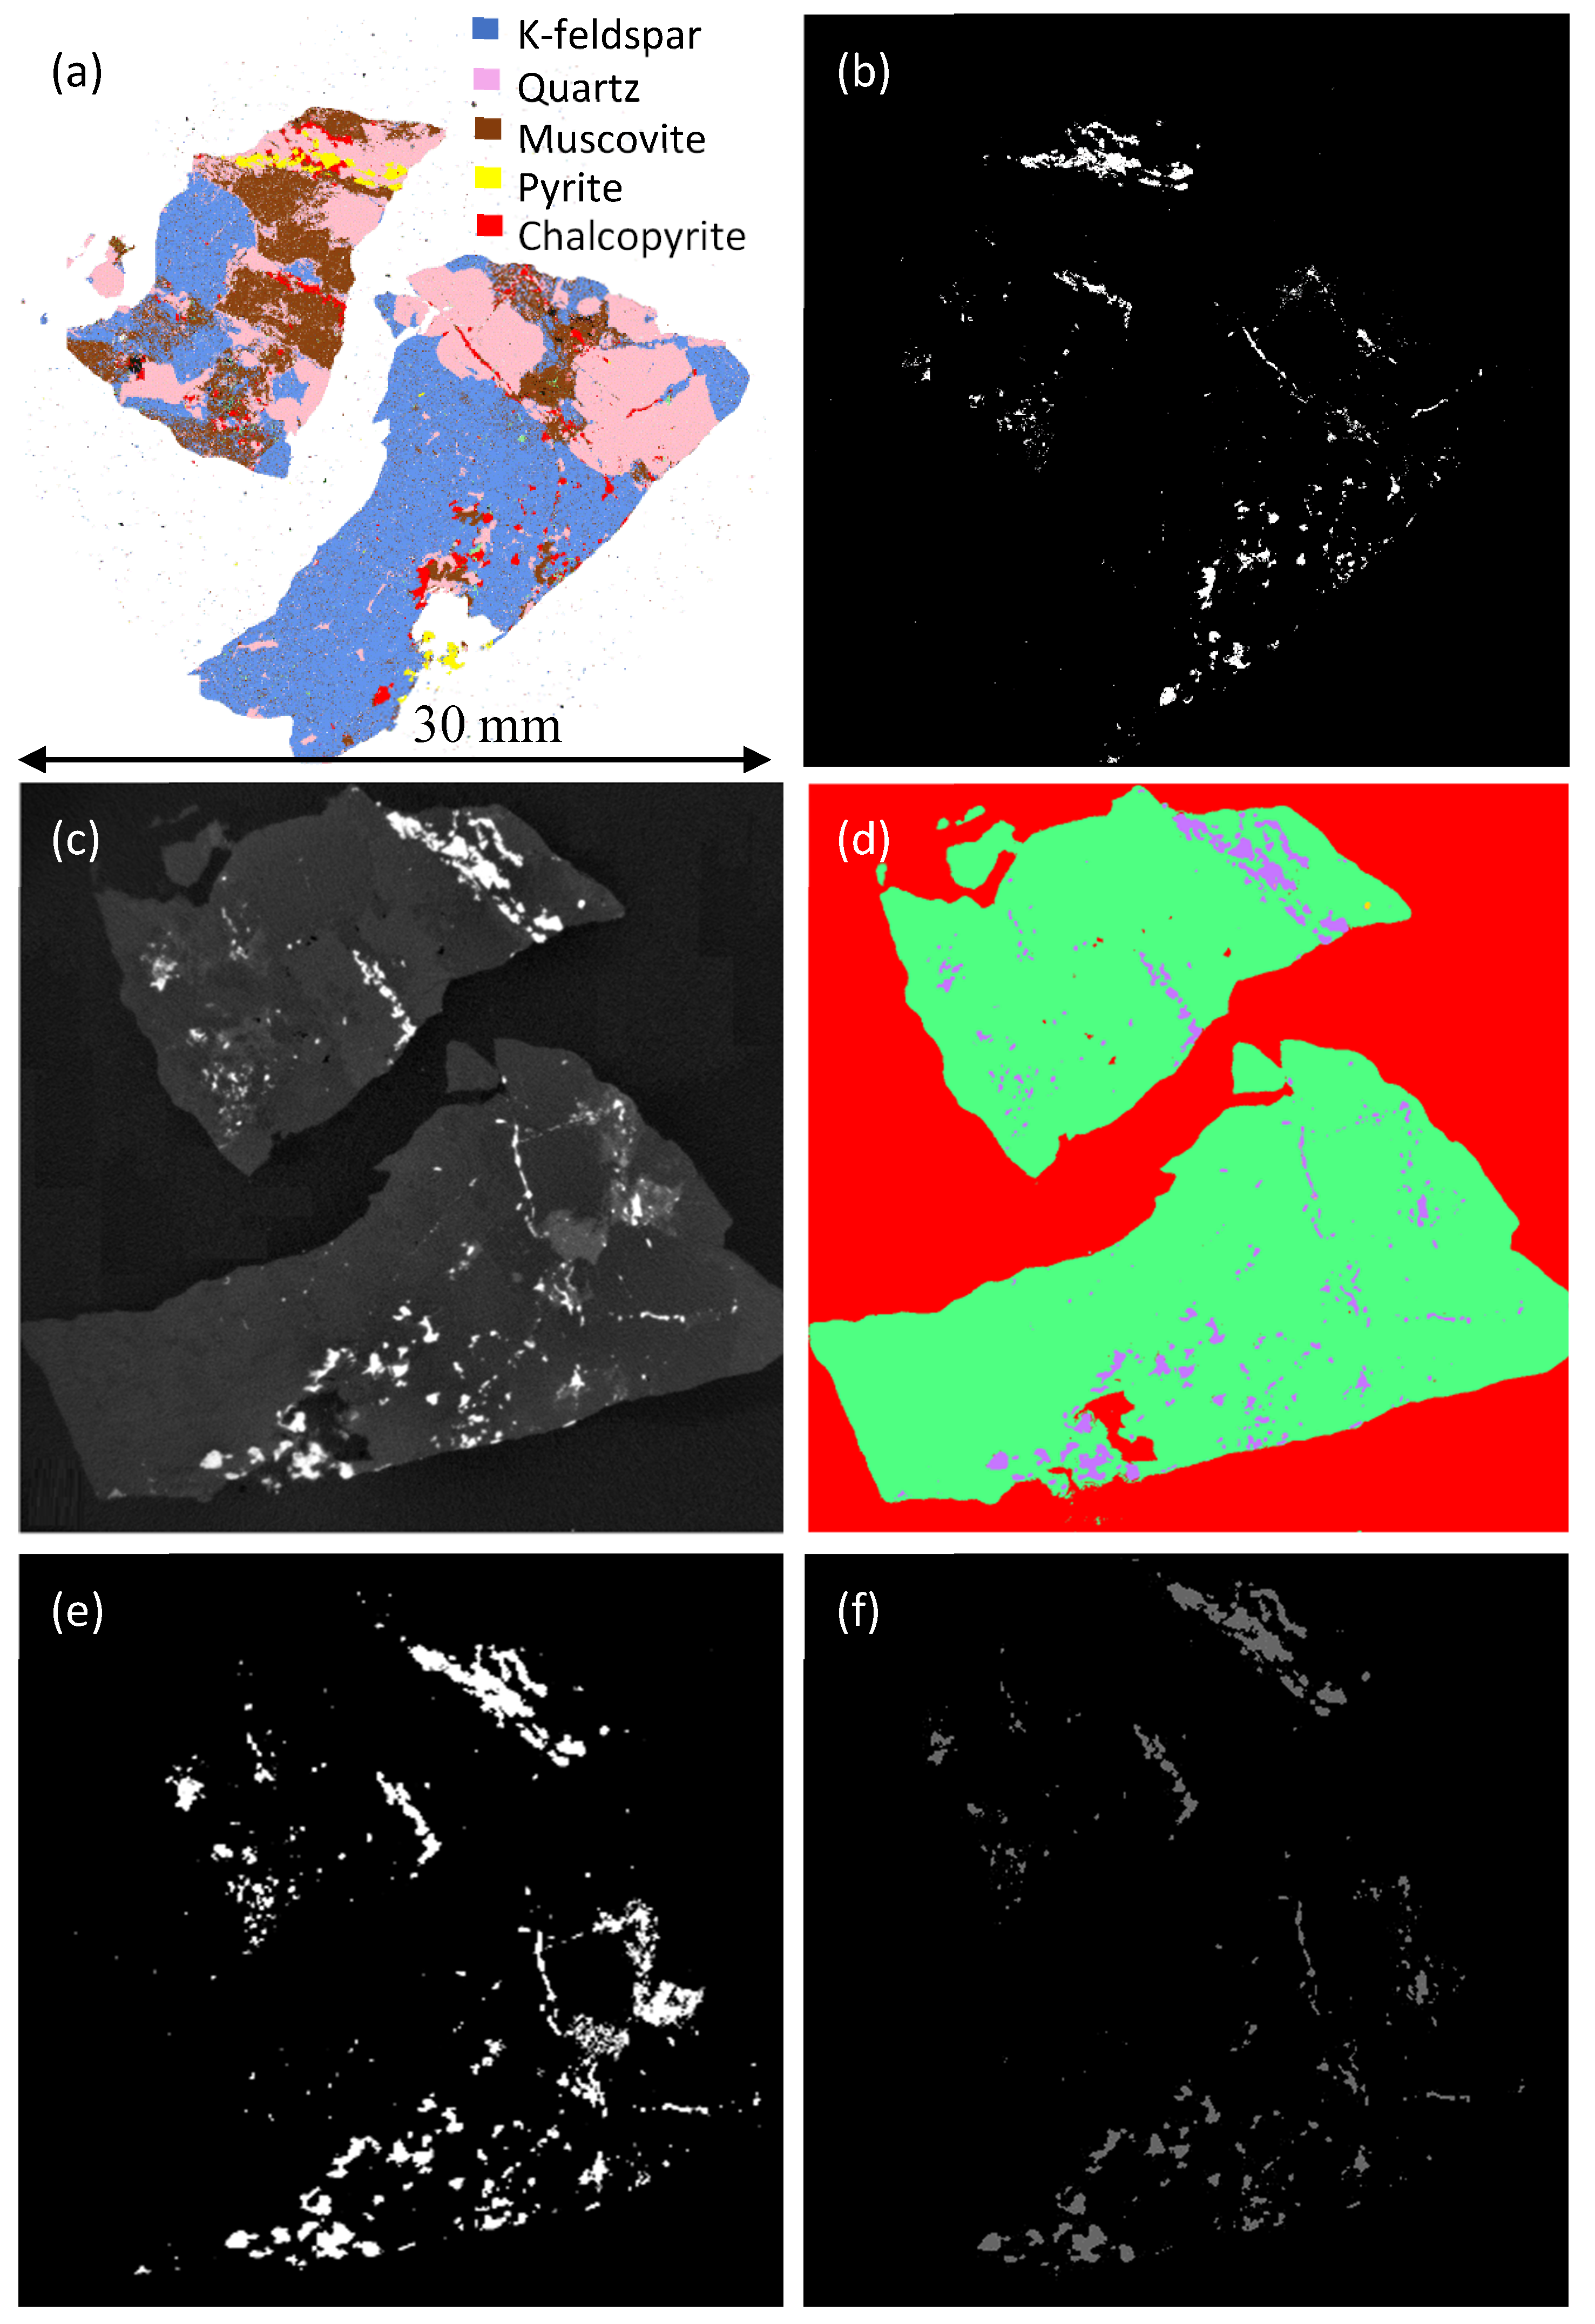
The suitability of different segmentation options for the thresholding of the metal oxide/sulphide mineral grains were evaluated by comparing the X-ray results to an equivalent QEMSCAN field image. Examples of the resulting 2D slices are presented in Figure 4. Table 3 gives a measure of the accuracy of the different methods by comparing the total target mineral area (and equivalent number of voxels) to the QEMSCAN field image.
The 3D watershed segmentation process is a local thresholding algorithm commonly used for multiphase mineral particles. It is appropriate for mineral grains with a scale parameter greater than 30 (mineral grain size/voxel size) and a density lower than 4000 kg/m3 [22]. The watershed segmentation’s strong gradient sensitivity leads to the over-segmentation of bright mineral grains, while it cannot pick small mineral grains [22,23]. Based on the resolution of the X-ray image (13.4 µm), the mineral grain size should be higher than 400 µm to accurately segment using watershed segmentation. However, in the chalcopyrite ore, more than 60% of pyrite and 90% of chalcopyrite grains are smaller than 400 µm, as is typical for low-grade sulphide ores. Furthermore, the sulphide mineral’s density is larger than 4000 kg/m3. Thus, the watershed segmentation method was not satisfactory to obtain accurate mineralogical data for the ores in this study.
Trainable Weka segmentation (TWS) or feature-based segmentation [24] combines a collection of machine learning algorithms with a set of selected image features to produce pixel-based segmentations. It has been suggested for the segmentation of fine or high density/high atomic number mineral grains [22] and can be used to correct partial volume effects in images. A good agreement between the TWS result (Figure 4d) and the QEMSCAN image was achieved (error of 2.62%). However, the TWS method is very computing memory intensive and hence time consuming for the quantitative evaluation of a large image dataset and requires high-speed computing.
Lin et al. [23] used algorithms based on the measurement of the maximum entropy of the sulphide mineral grain phase segmentation. The Maximum Entropy algorithm is similar to the Otsu Thresholding technique. However, rather than maximizing the inter-class variance, the inter-class entropy is maximized [25]. The accuracy of this method depends on the ore mineralogy. When applied, this method led to a number of gangue minerals with high intensity being identified as a sulphide mineral as well as causing over-segmentation (Figure 4e) and a high error of 21.32% resulted.
The Avizo® 9 Interactive Thresholding function is based on intensity range partitioning. When tested for the segmentation of the sulphide and high dense/atomic number mineral grains (Figure 4f), it resulted in accurate mineral grain phase segmentation (error of 3.3%) in comparison with the QEMSCAN results (Figure 4b). It was additionally less computing memory intensive and hence faster than local thresholding methods and TWS. It was thus found to be the best segmentation method for this study and is supported by its low error reported in Table 3.
This method was able to segment malachite and bornite from the gangue minerals in the malachite ore, chalcopyrite and pyrite from gangue minerals in the chalcopyrite ore, and pyrite from the gangue minerals in the waste rock.
The labelling of each sulphide mineral grain was done after segmentation to extract the statistical and numerical information, allowing the progression of leaching to be followed. Figure 5 shows 2D and 3D views of the segmented and labelled images.
The segmentation of different sulphide minerals from the X-ray µCT images was not possible because their grey level values were too similar. Therefore, the total sulphide or oxide mineral volume reduction was considered in order to investigate copper and iron leaching and the results were compared with the copper and iron leaching data obtained using conventional techniques.

3.2. Mineral Grain Distance Mapping

A mineral grain distance map analysis which quantifies the distance of the mineral grains from the ore particle surface was developed as a tool to understand the positional dependence of leach performance. The procedure is shown in Figure 6.
The Interactive Thresholding module was applied to create a binary image with the packed ore as the foreground and air as the background (Figure 6c). The distance map algorithm on a binary image gives a grey level image where each voxel intensity represents the minimum distance in voxels from the object boundary. Low-level intensity meant that the voxel was close to the object surface while high-level intensity meant that part of the object was far from the object surface. The Chamfer Distance Map module was applied to the thresholded binary image (Figure 6c) to create the distance map image. Another Interactive Thresholding module was used to separate the metal oxide/sulphide minerals from the gangue minerals and air (Figure 6e). The distance map image was masked with this second thresholded image (Figure 6e). This gave a grey image where each non-null intensity represented a voxel of the metal oxide/sulphide mineral grains and the intensity value was equal to the distance in voxels from the ore surface (Figure 6f). The mineral grain distance from the ore surface was calculated using the “Multiply By Value” module on the masked image. The accuracy of the distance values was affected by the position of the mineral grain edges relative to the voxel boundaries. An uncertainty interval of three times the voxel size resulted (±13.4 × 3 = ±40.2 μm).
The generated maps were used to extract a descriptor for the leaching solution penetration from the ore surface into the particles to leach the target mineral grains. The maximum linear distance from the nearest ore surface (interface with air/solution) at which a change in mineral grain content was measured is termed the leaching penetration distance. This descriptor can be tracked with time.
The separation of ore particles was not included as part of the analysis. Thus, agglomerated particles were considered as a single solid phase, should no clear interface with air or solution be evident between the particles.

4. Results and Discussion

4.1. Ore Structure Characterisation

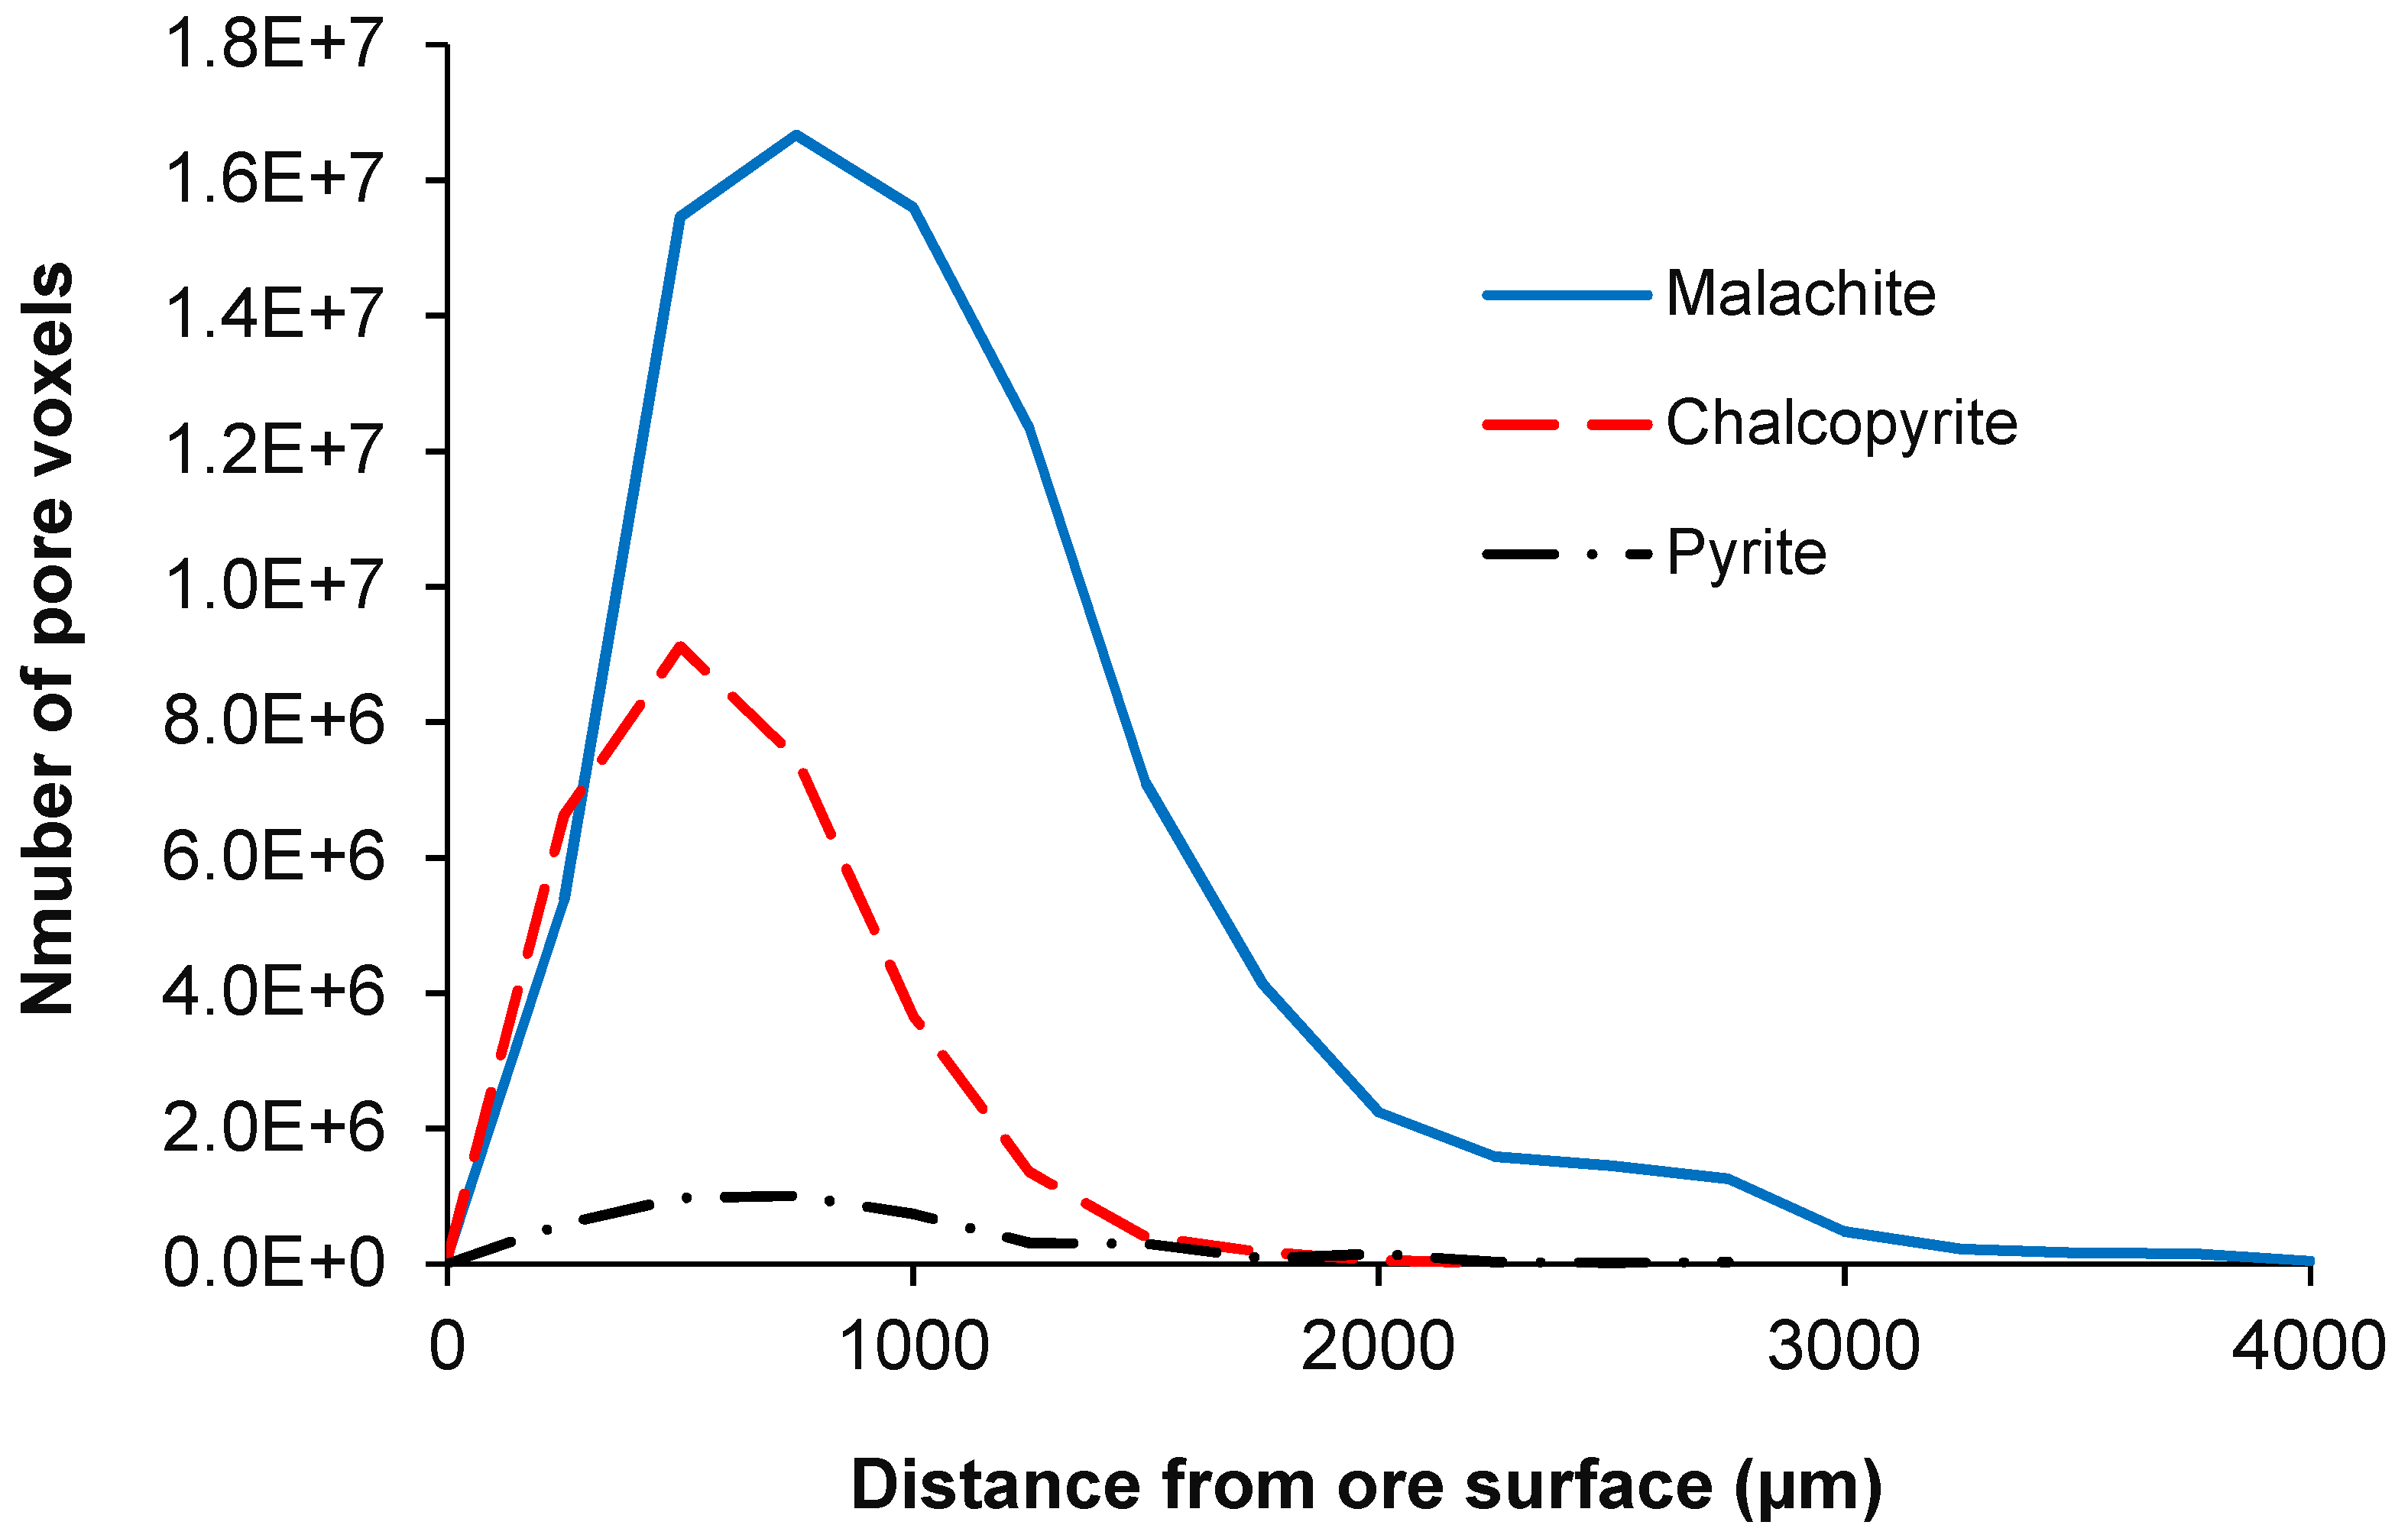
The number of pores with a dimension of 40 µm or greater (defined by resolution of 13.4 µm) present in the agglomerated pyrite, chalcopyrite and malachite ores are plotted as a function of distance from the agglomerate particle surface in Figure 7. The average porosities were 1.06% for the malachite ore, 0.066% for the pyrite ore, and 0.43% for the chalcopyrite ore.
In the case of the malachite agglomerates, a good porosity was maintained even beyond 3000 µm from the ore surface. This confirmed that the ore itself was porous in addition to high-porosity agglomerate rims having formed. The maximum porosity was observed ±750 µm from the ore surface.
The pyrite agglomerates had the lowest porosity, with the maximum occurring at ± 500 µm from the ore surface. A very low porosity was recorded beyond ±1500 µm from the surface. The low porosity of these agglomerates could be because pyrite is hydrophobic at pH values lower than 4 [26]. This would have caused the decreased adsorption of acidified solution onto the ore and consequently affected the formation of bridges and porous structures between the fine particles as well as fine particles around large particles.
The total porosity of the agglomerated chalcopyrite ore was less than half that of the malachite, however, it was an order of magnitude larger than the pyrite. The maximum distribution of the pores was ±500 µm from the ore surface. The porosity decreased with increasing distance until ±2000 µm, beyond which the pores were negligible. Images of non-agglomerated chalcopyrite yielded an average porosity of 0.0094%, confirming that the ore itself had a very low porosity. Therefore, the porosity seen in the agglomerated ore resulted from the pores formed between the particles in the aggregate, consistent with the porous region location.
The substantial differences in the pore availability and distribution for the three different ores supported the choice of ores for the investigation of particle structure and mineralogy on potential lixiviant contact.

4.2. Leaching Results

4.2.1. Malachite

Copper oxide minerals such as malachite contain copper in the divalent state. These are completely soluble in sulphuric acid at room temperature. The typical reaction of malachite with sulphuric acid is [27]:
Cu2(OH)2CO3 + 2H2SO4 → 2CuSO4 + CO2 + 3H2O,
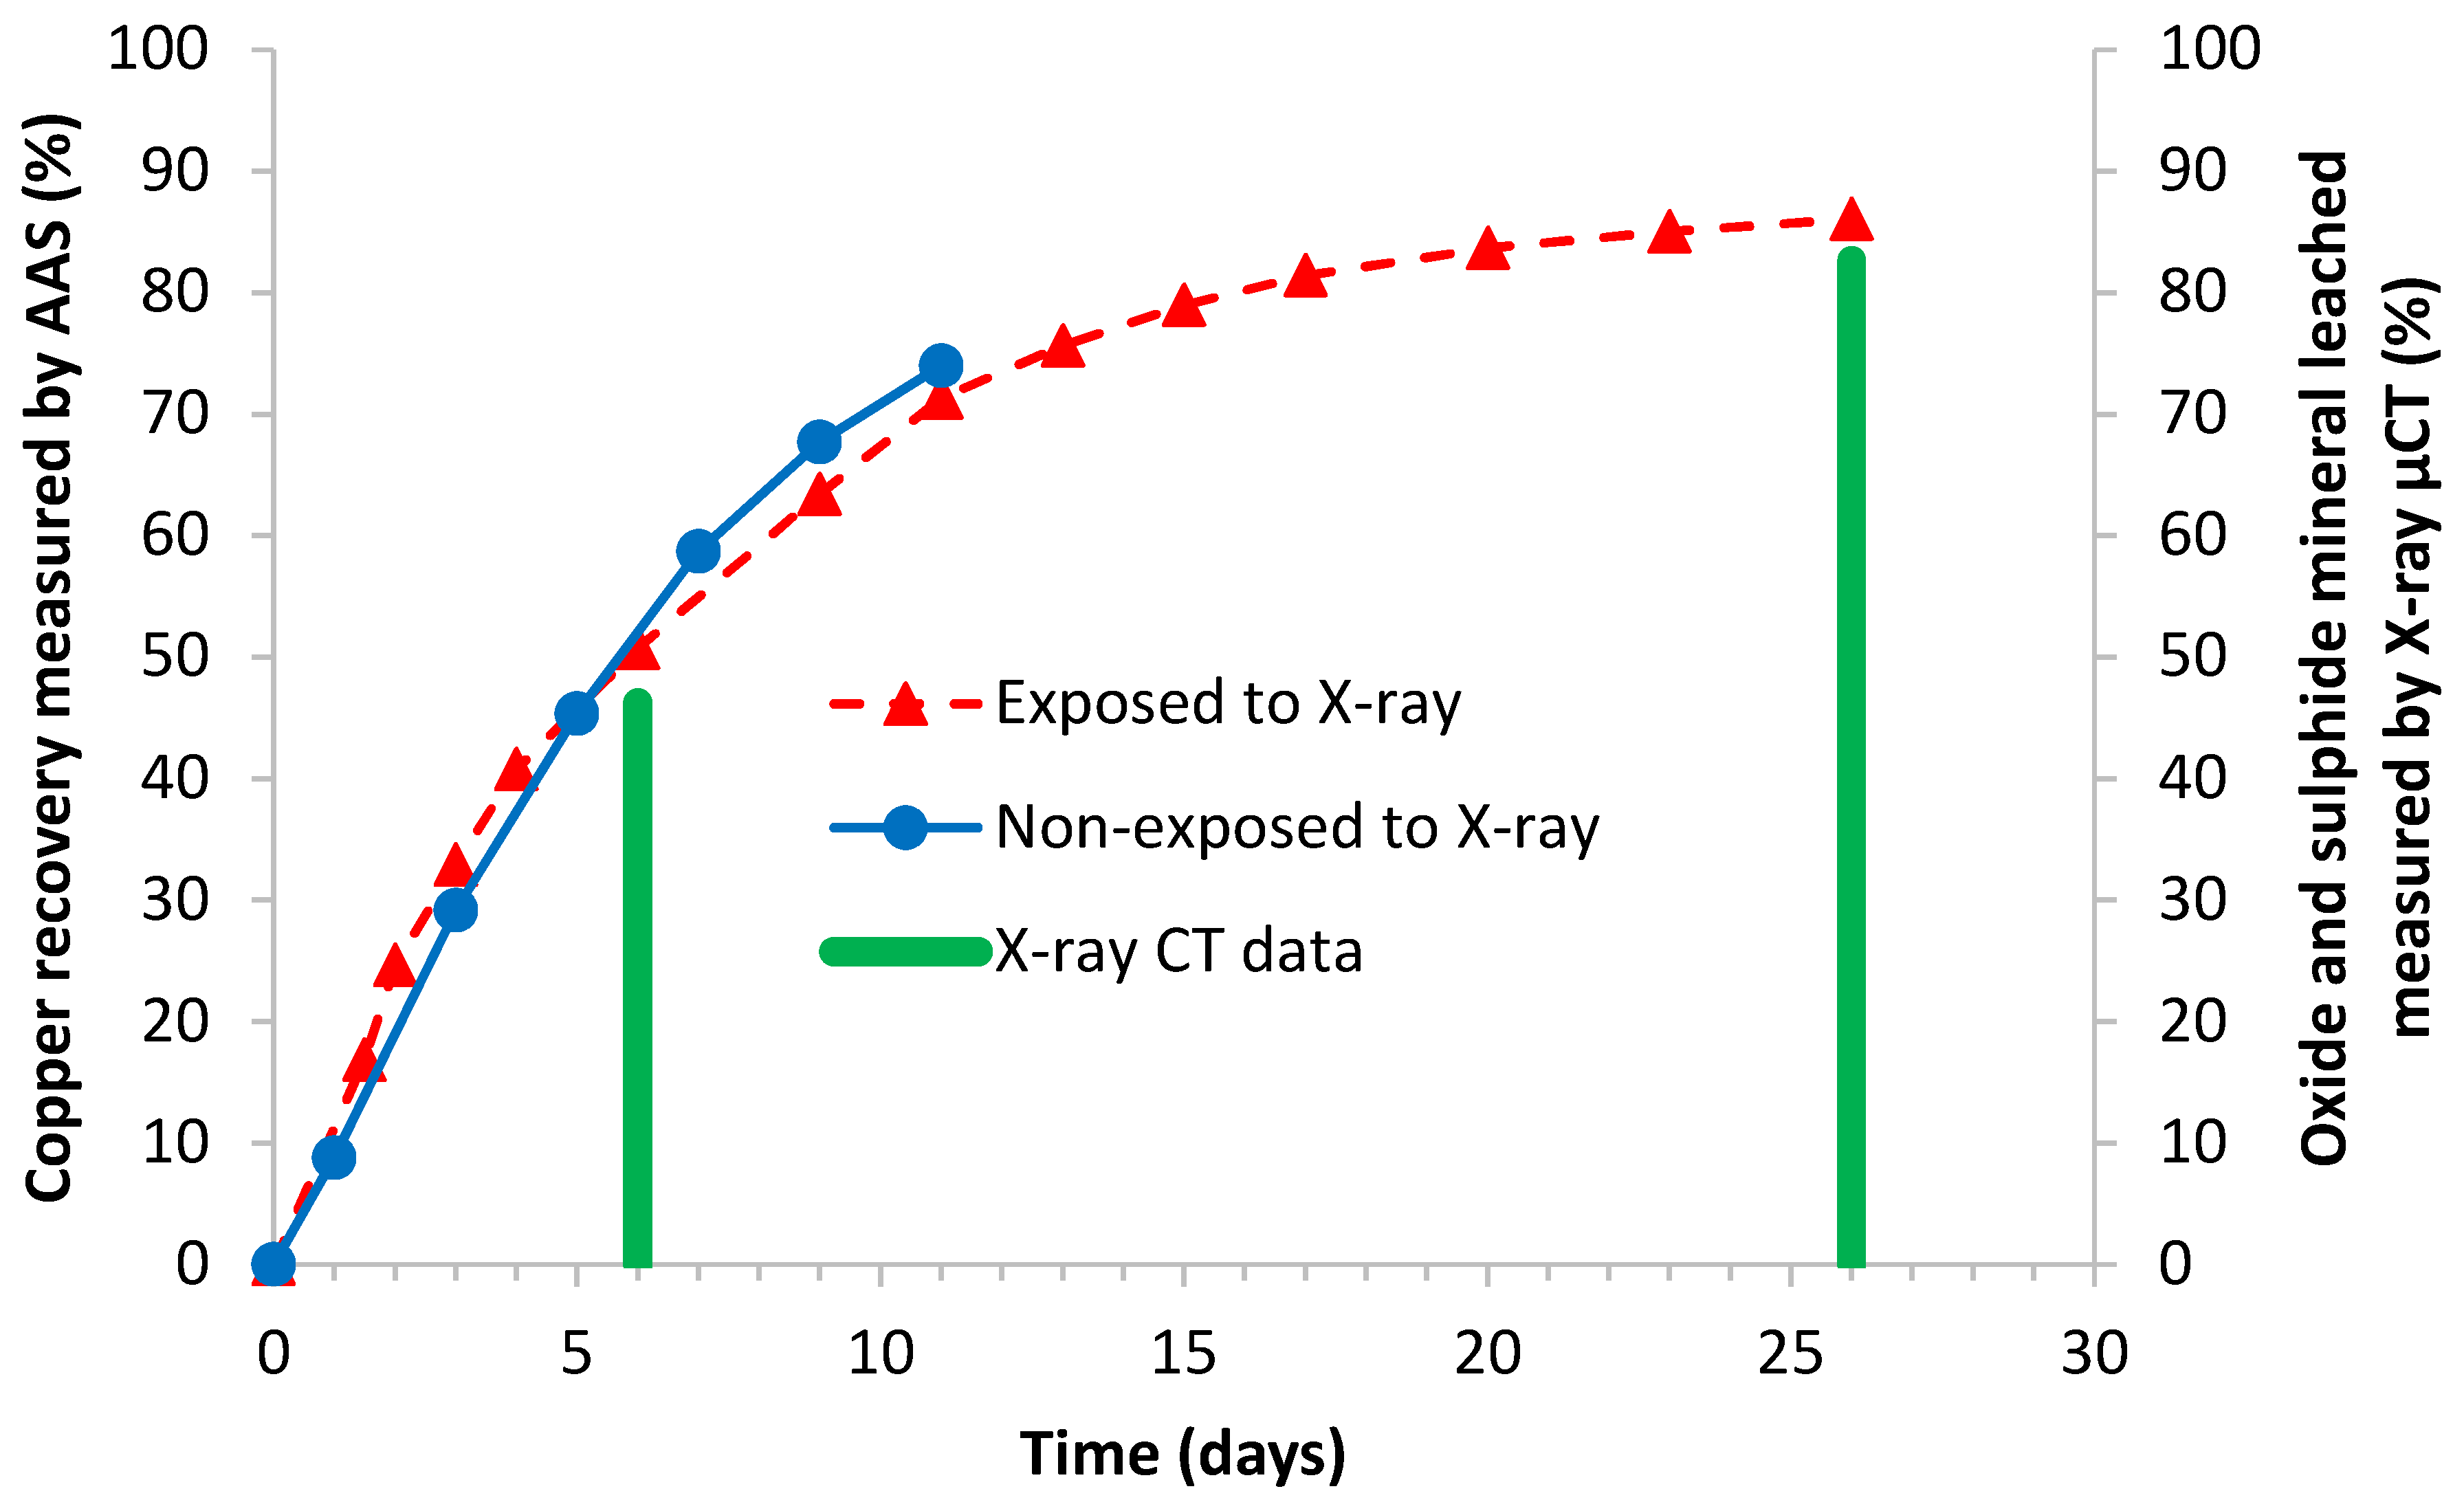
The effect of leaching time on the dissolution of malachite at 30 °C is shown in Figure 8. The copper leached quickly, with ±50% copper recovery achieved by day 6. There was a corresponding rapid decrease in pH from circa 4 to 1.84 during first 6 days, after which the pH gradually fell to 1.22. The recovery increased to 87% after 26 days.
The malachite ore contained 2.44% bornite, accounting for some 18% of the copper present in the ore. The leaching rate of bornite using acidified solution is slow [28]. The leach curve in Figure 8 shows the rapid leaching of some 70–80% of the copper over a 9 day period, followed by consistent slower leaching to recover >85% of the copper over 26 days. The slower leaching and hence the flattening of the copper recovery curve towards the end of the leaching period could thus be attributed to the leaching of bornite, assuming a small fraction of both minerals remain unliberated. The intensity of the X-ray µCT signal did not allow ready differentiation between these minerals.
The oxide and sulphide recovery measured using the X-ray µCT images was consistent with the copper recovery measured by AAS, though about 3% to 4% lower than the bulk measurement results. The 3D images of the copper mineral grains (Figure 9) make it evident that the remaining copper in the residue ore was mostly from large mineral grains.
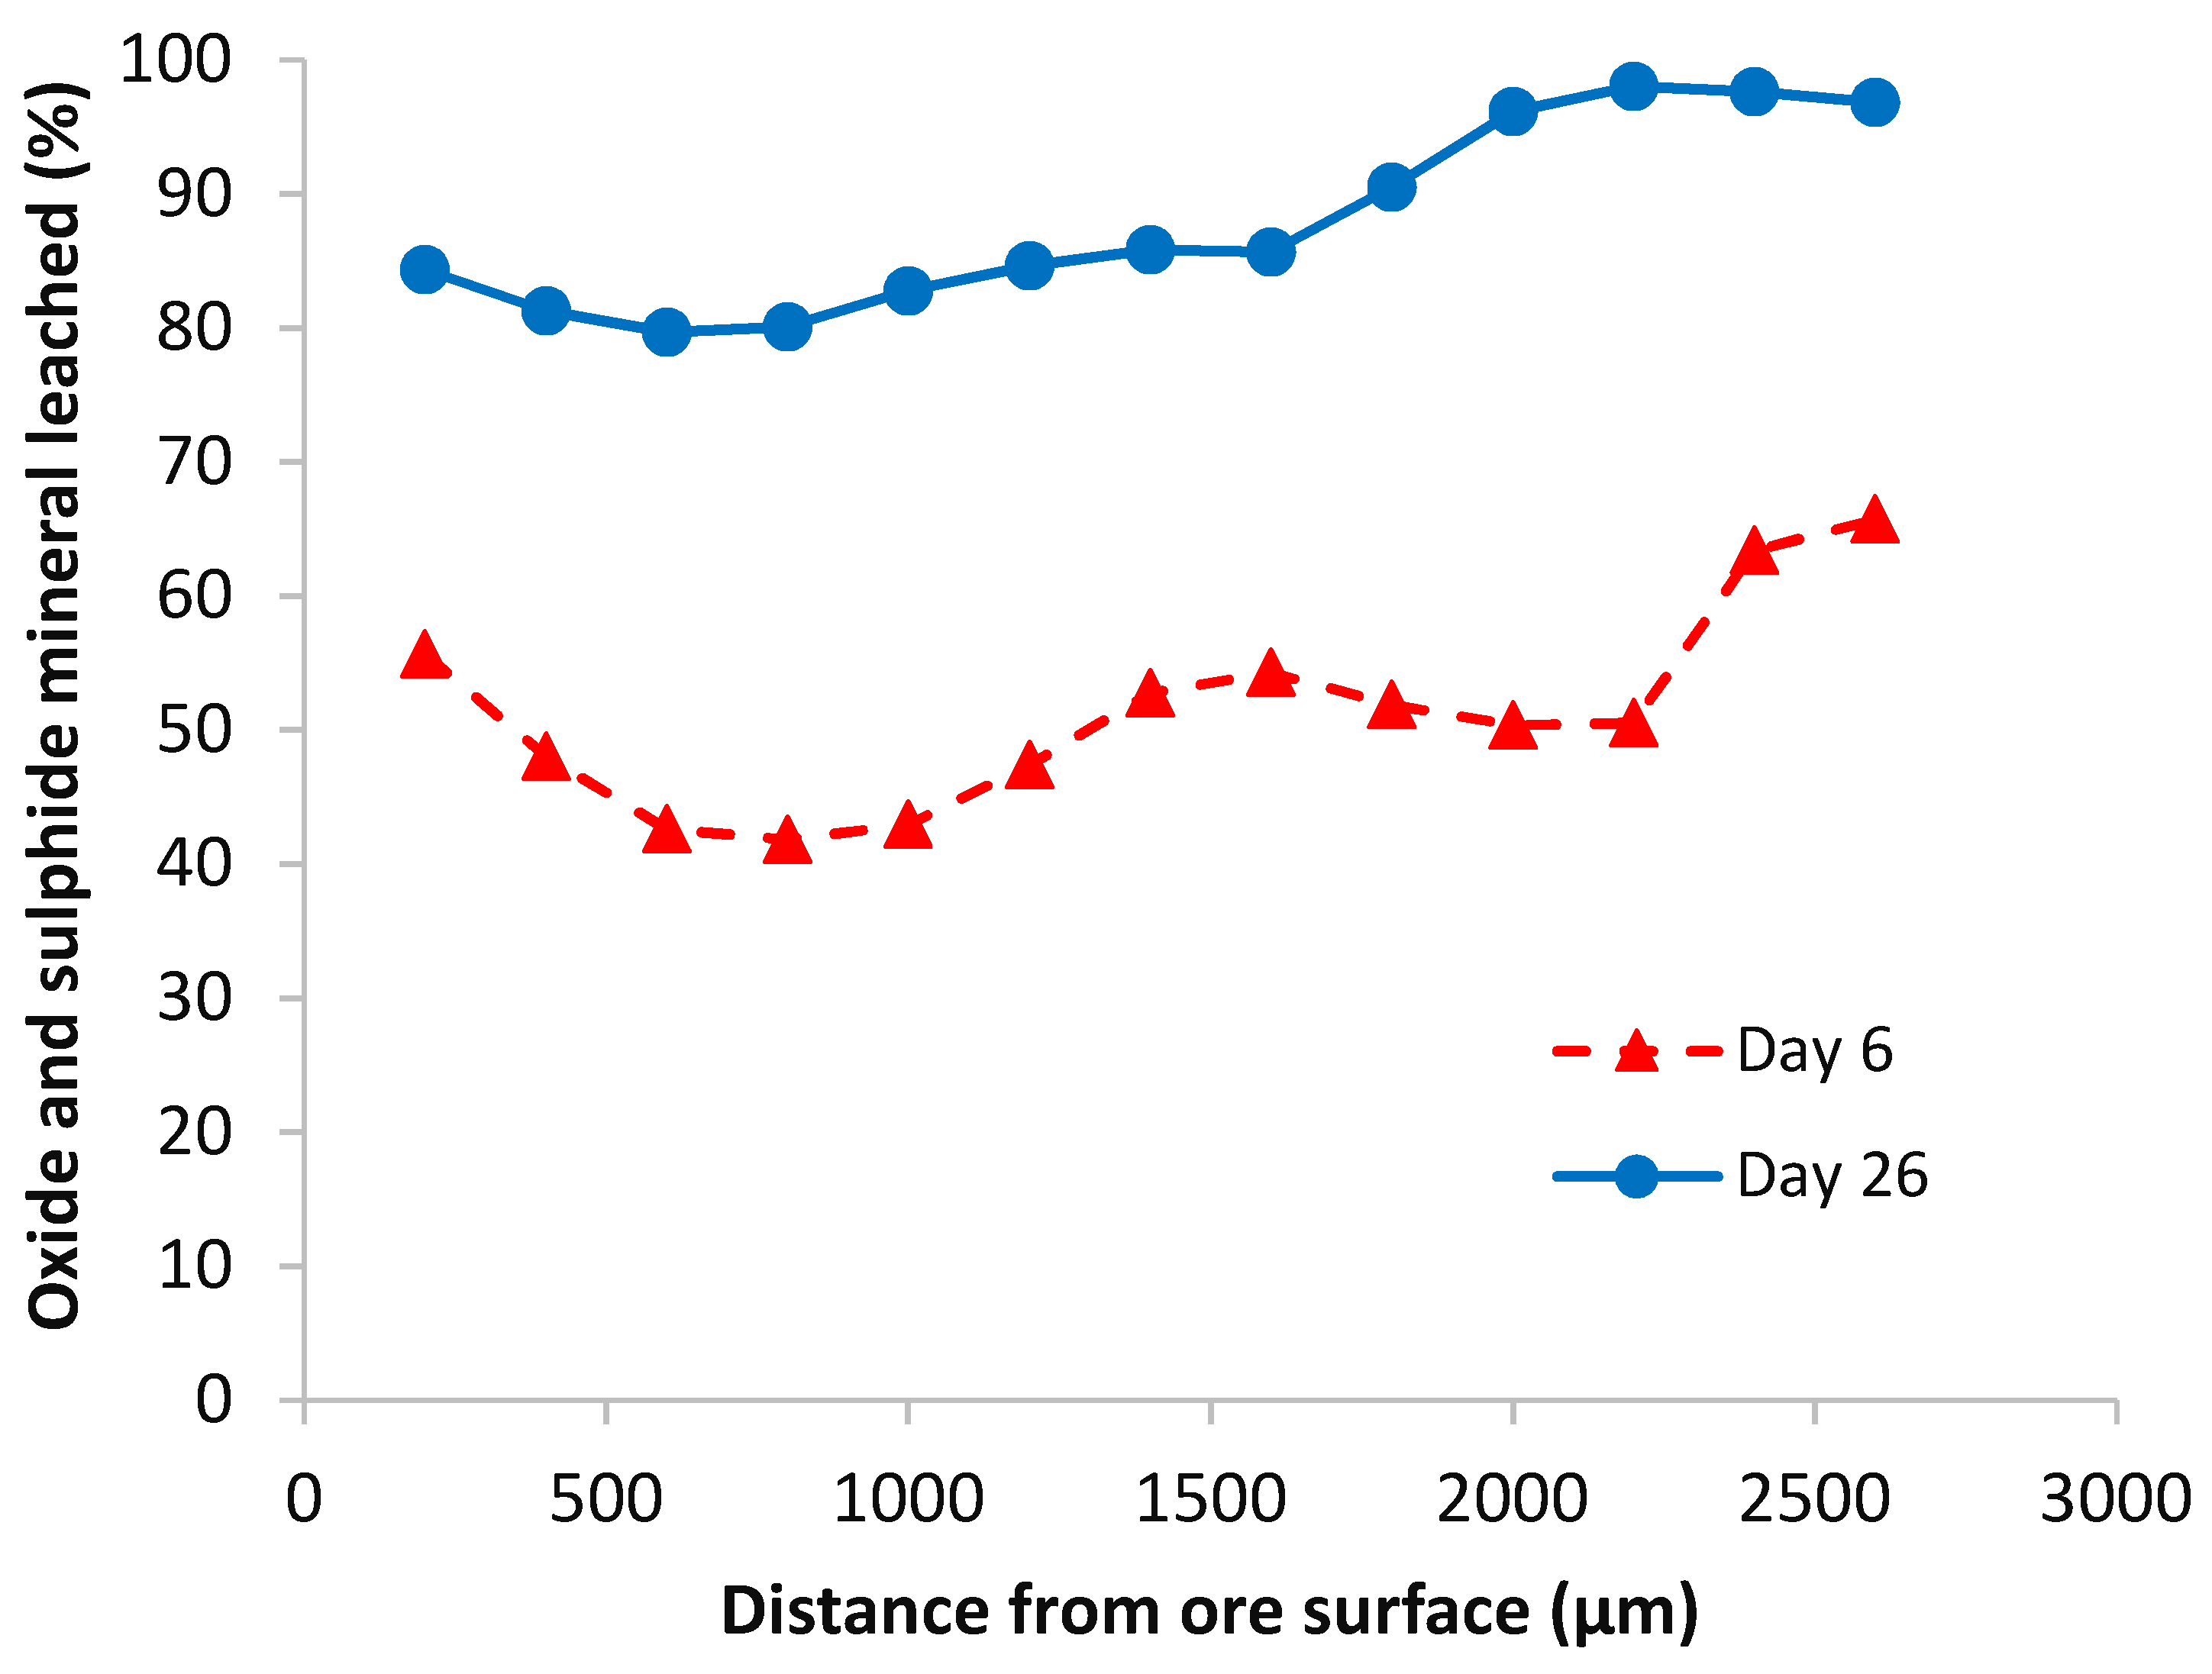
The distributions of the copper mineral distance from the ore particle surface at the different time points are shown in Figure 10. In Section 2, Section 3, Section 4 and Section 5, the copper mineral grains were positioned less than 2000 µm from the surface. The existence of large mineral grains in the top most section (evident in Figure 9) was responsible for the overall larger maximum distance from the ore surface. The maximum distance decreased to approximately 1800 µm over the experimental period. This meant that the deeper minerals had been leached, or that the large mineral grains became smaller as leaching progressed. Figure 11 confirms that the distance from the ore particle surface did not influence the rate of copper recovery, except initially at the farthest distance, which was attributed to the large grains in Section 1.
Therefore, ensuring contact between the mineral grains and leaching solution, even at increased distance from the surface, did not constrain leaching for this ore in accordance with the high measured porosity values. The dissolution of malachite was thus controlled by chemical reaction rather than diffusion. Another study by Nicol [27] also showed that the kinetics of malachite dissolution were governed by the rate-determining surface chemical reaction.

4.2.2. Pyrite

Changes in pH, redox potential, ferrous ion (Fe2+), and ferric ion (Fe3+) concentrations of the effluent solution of the pyrite agglomerate mini-columns over the leaching period are shown in Figure 12.
There was acid consumption by some gangue minerals such as calcite and limonite during the acid wash (pH = 1.15) over the first 7 days. The pH decreased from 2.04 to 1.71 for the 37 °C mini-column and from 2.75 to 1.88 for the 65 °C mini-column. Further decrease in pH to 1.1 for the 37 °C mini-column and 1 for the 65 °C mini-column occurred subsequently to the introduction of the feed solution containing 8.6 g L−1 ferric ion at a pH of 1.15. Equation (2) shows that this decrease may be accounted for by the ferric leaching of pyrite which produces a hydrogen ion and so reduces the pH of the solution [29]:
FeS2 + 14Fe3+ + 8H2O → 15Fe2+ + 16H+ + 2SO42−,
The solution redox potential was approximately 330 and 300 mV during the acid wash for the 37 °C and 65 °C mini-columns, respectively. Reduction in the pyrite oxidation rate over the experimental period results in an upward gradual trend of the redox potential. The redox potential for the 65 °C mini-column increased rapidly between days 7 and 15. There was then a gradual increase until the end of the experiment at which time the highest recorded redox potential of 464 mV was recorded. The increase in redox potential in the PLS corresponded to a decreased Fe2+ concentration in a solution coupled with an increase in the Fe3+ concentration, shown in Figure 12c,d. This meant that the pyrite oxidation rate decreased over the experimental period. In addition, the results showed that the redox values at 65 °C were lower than at 37 °C, indicating that increasing temperature increased pyrite ferric oxidation, producing more Fe2+ in the system.
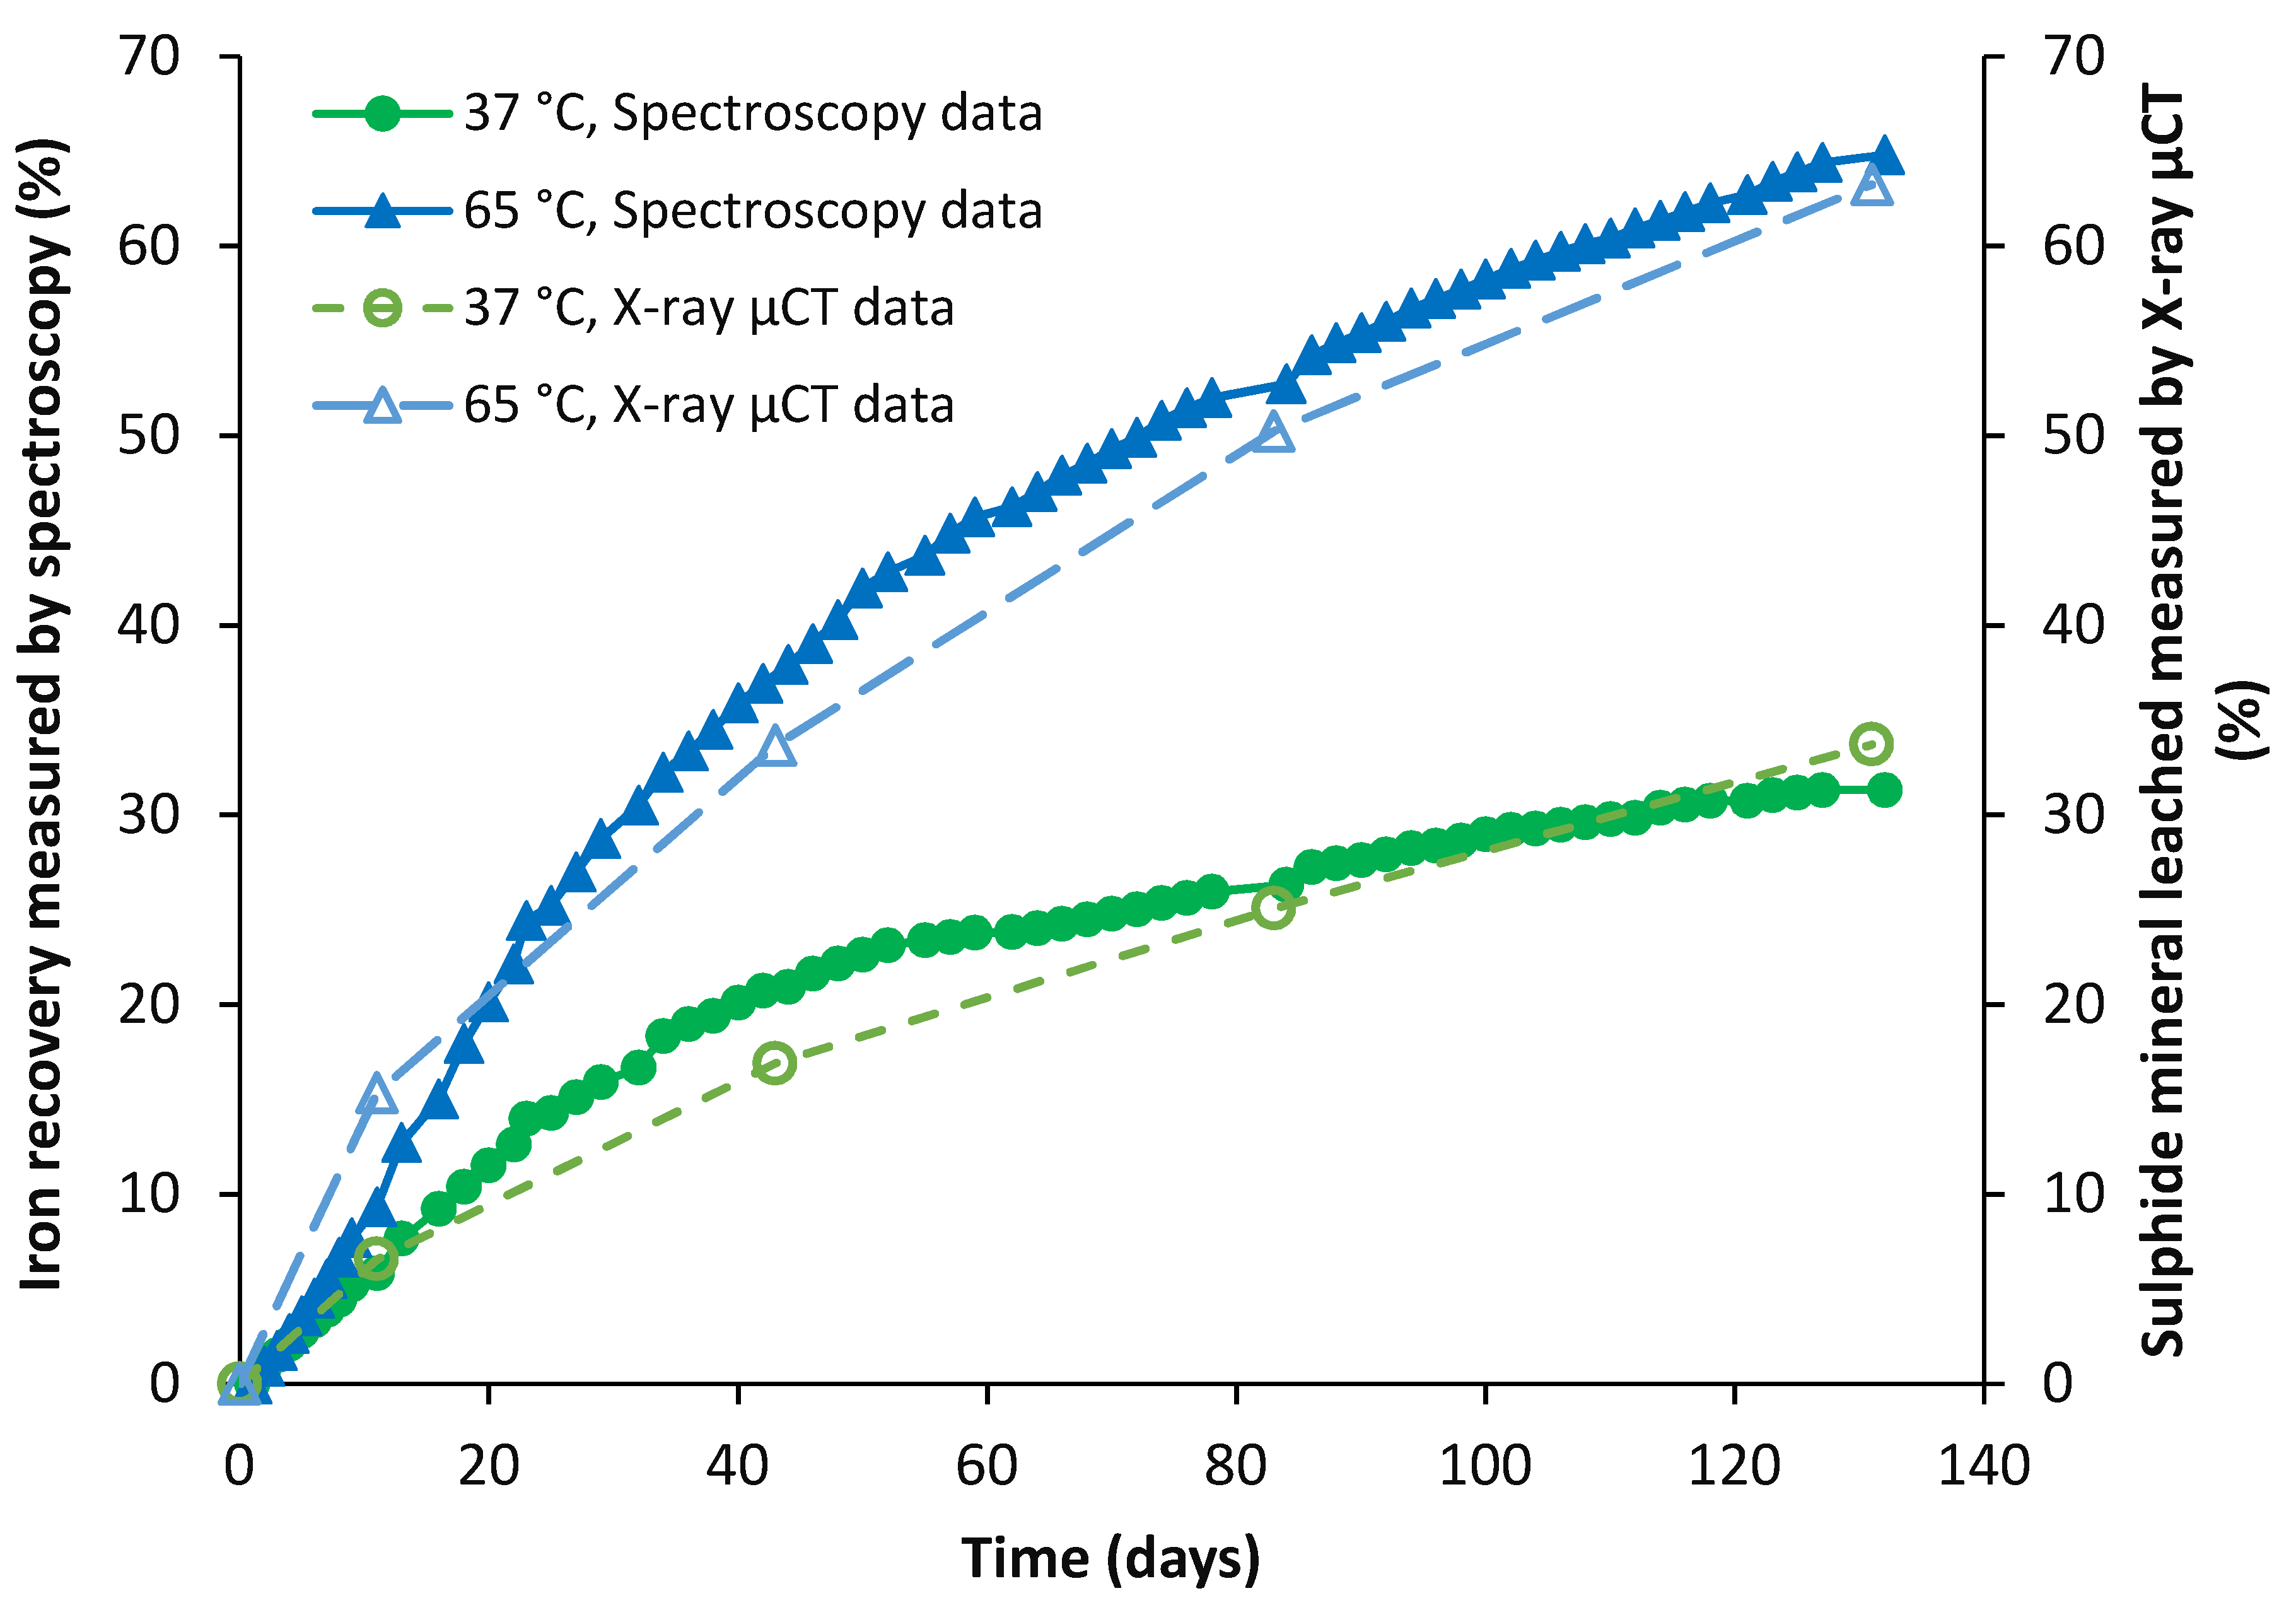
Iron recovery for the different temperature conditions is given as a function of time in Figure 13, based on the spectroscopy data as well as the overall percentage sulphide mineral leached calculated through the measurement of the mineral volume in the X-ray µCT images. Increasing the temperature accelerated the pyrite dissolution rate, consistent with thermodynamics [30]. Ahonen and Tuovinen [31] reported a strong temperature dependence for pyrite dissolution, showing a leaching rate enhancement from 0.11% day−1 to 4.54% day−1 when the temperature rose from 4 °C to 37 °C. Moreover, Dew et al. [32] and Nemati and Harrison [33] reported an increase in the pyrite dissolution with temperature increasing in the 37–65 °C range.
Rapid mineral dissolution occurred over the first 20 days. After this time, the dissolution rate decreased until the end of the experiment at both temperatures. The maximum recovery was 32% at 37 °C and 66% at 65 °C based on the chemistry data. The recovery was 33% at 37 °C and 68% at 65 °C according to image quantification data. Thus, the calculated percentage iron released showed consistency between the two quantification methods.
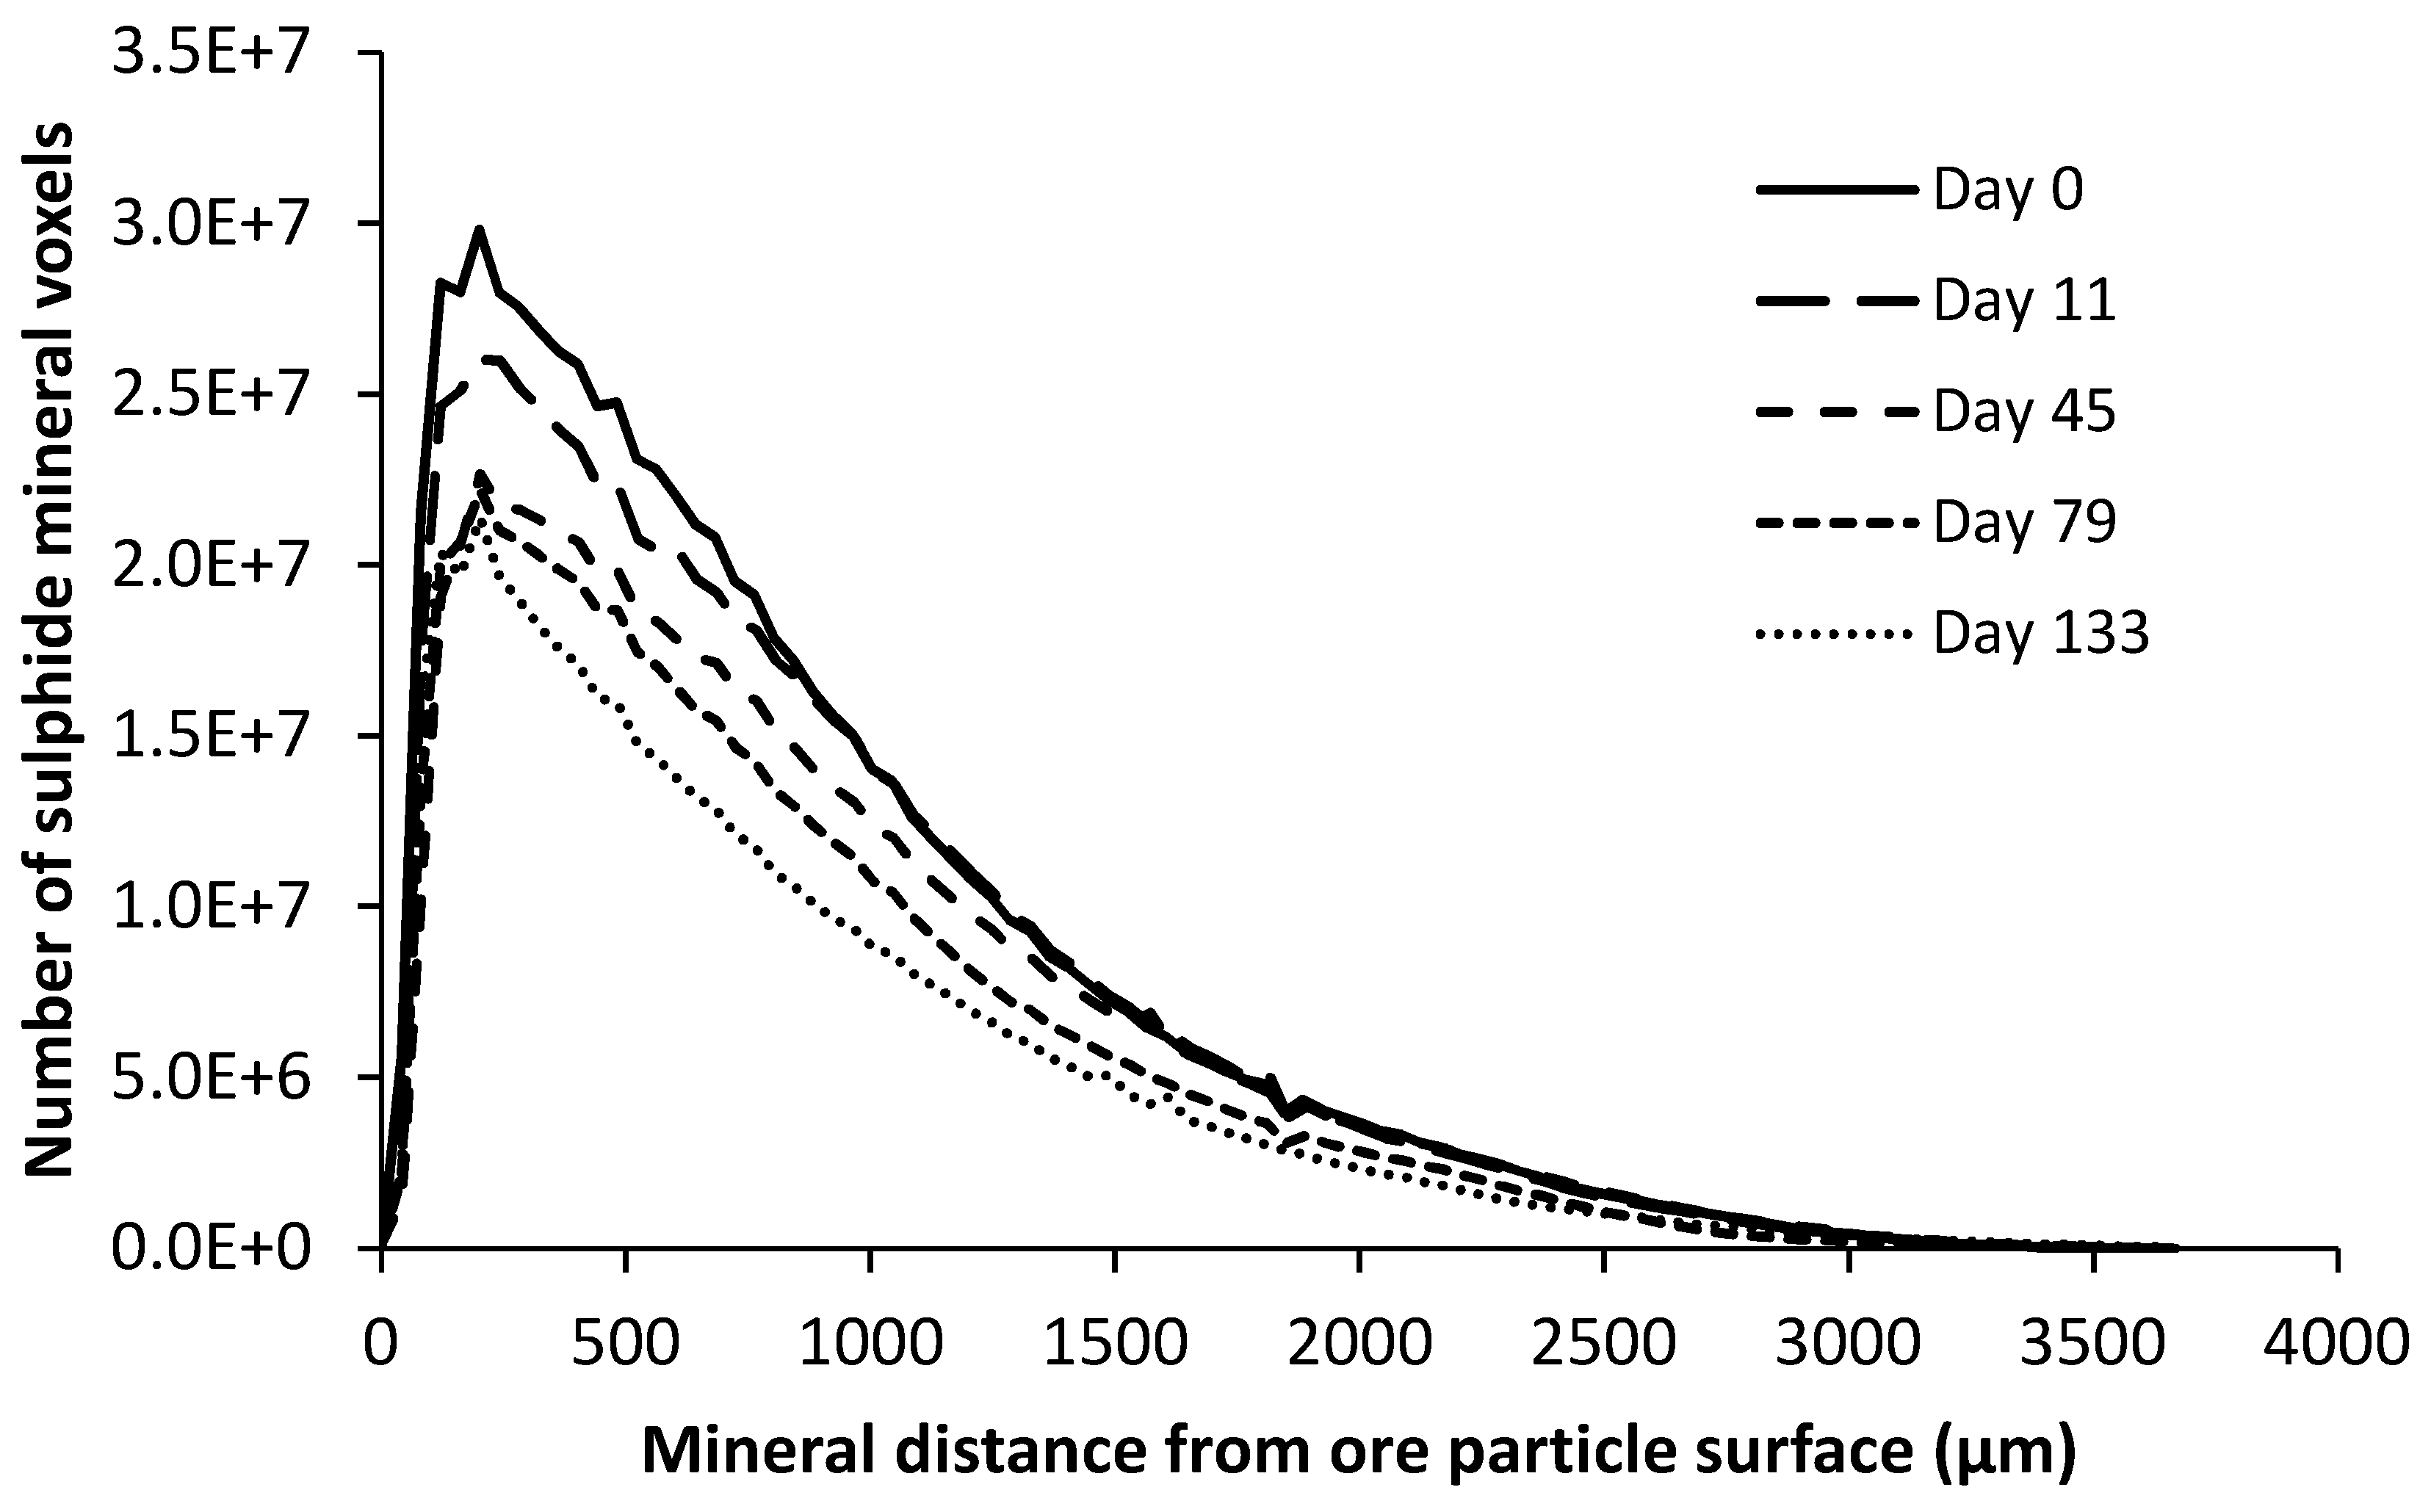
The distribution of the sulphide mineral grains as a function of distance from the ore particle surface at 37 °C on days 0 and 132 (at which point no further changes were observable) and at 65 °C on days 0 and 159 are given in Figure 14. The maximum leaching penetration distance was 2700 µm for both temperature conditions. Thus, an increase in temperature did not affect the maximum penetration distance.
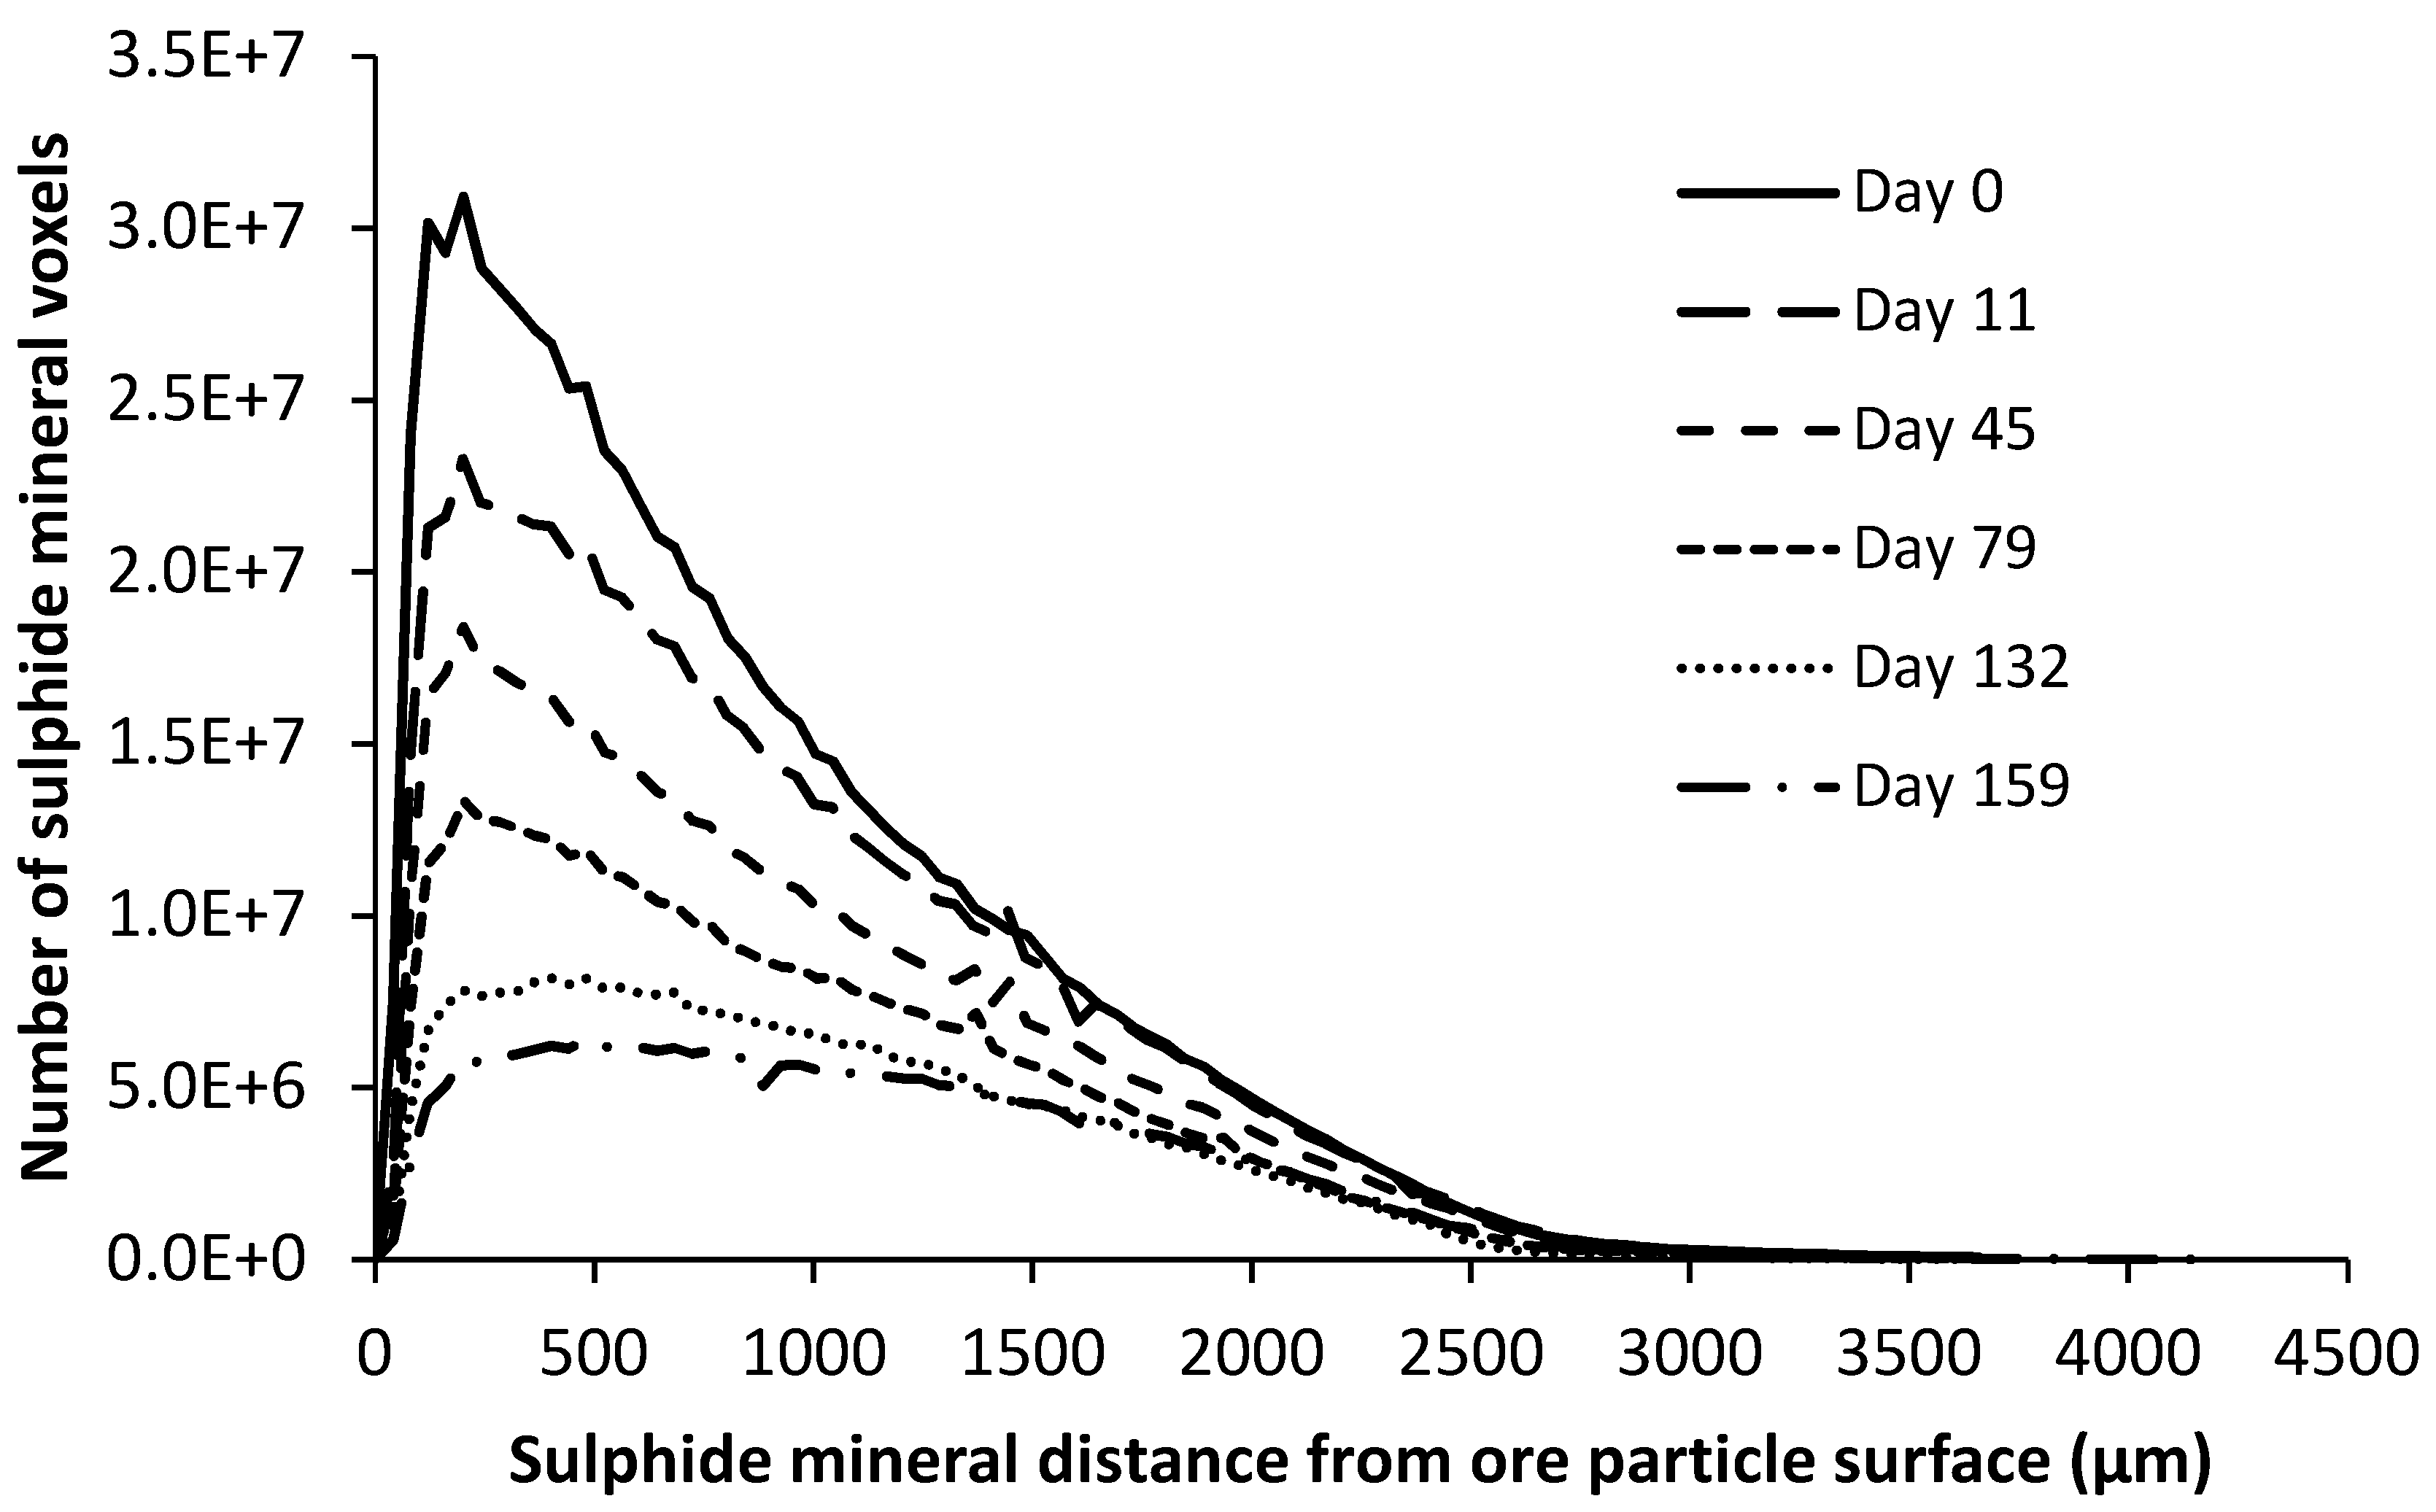
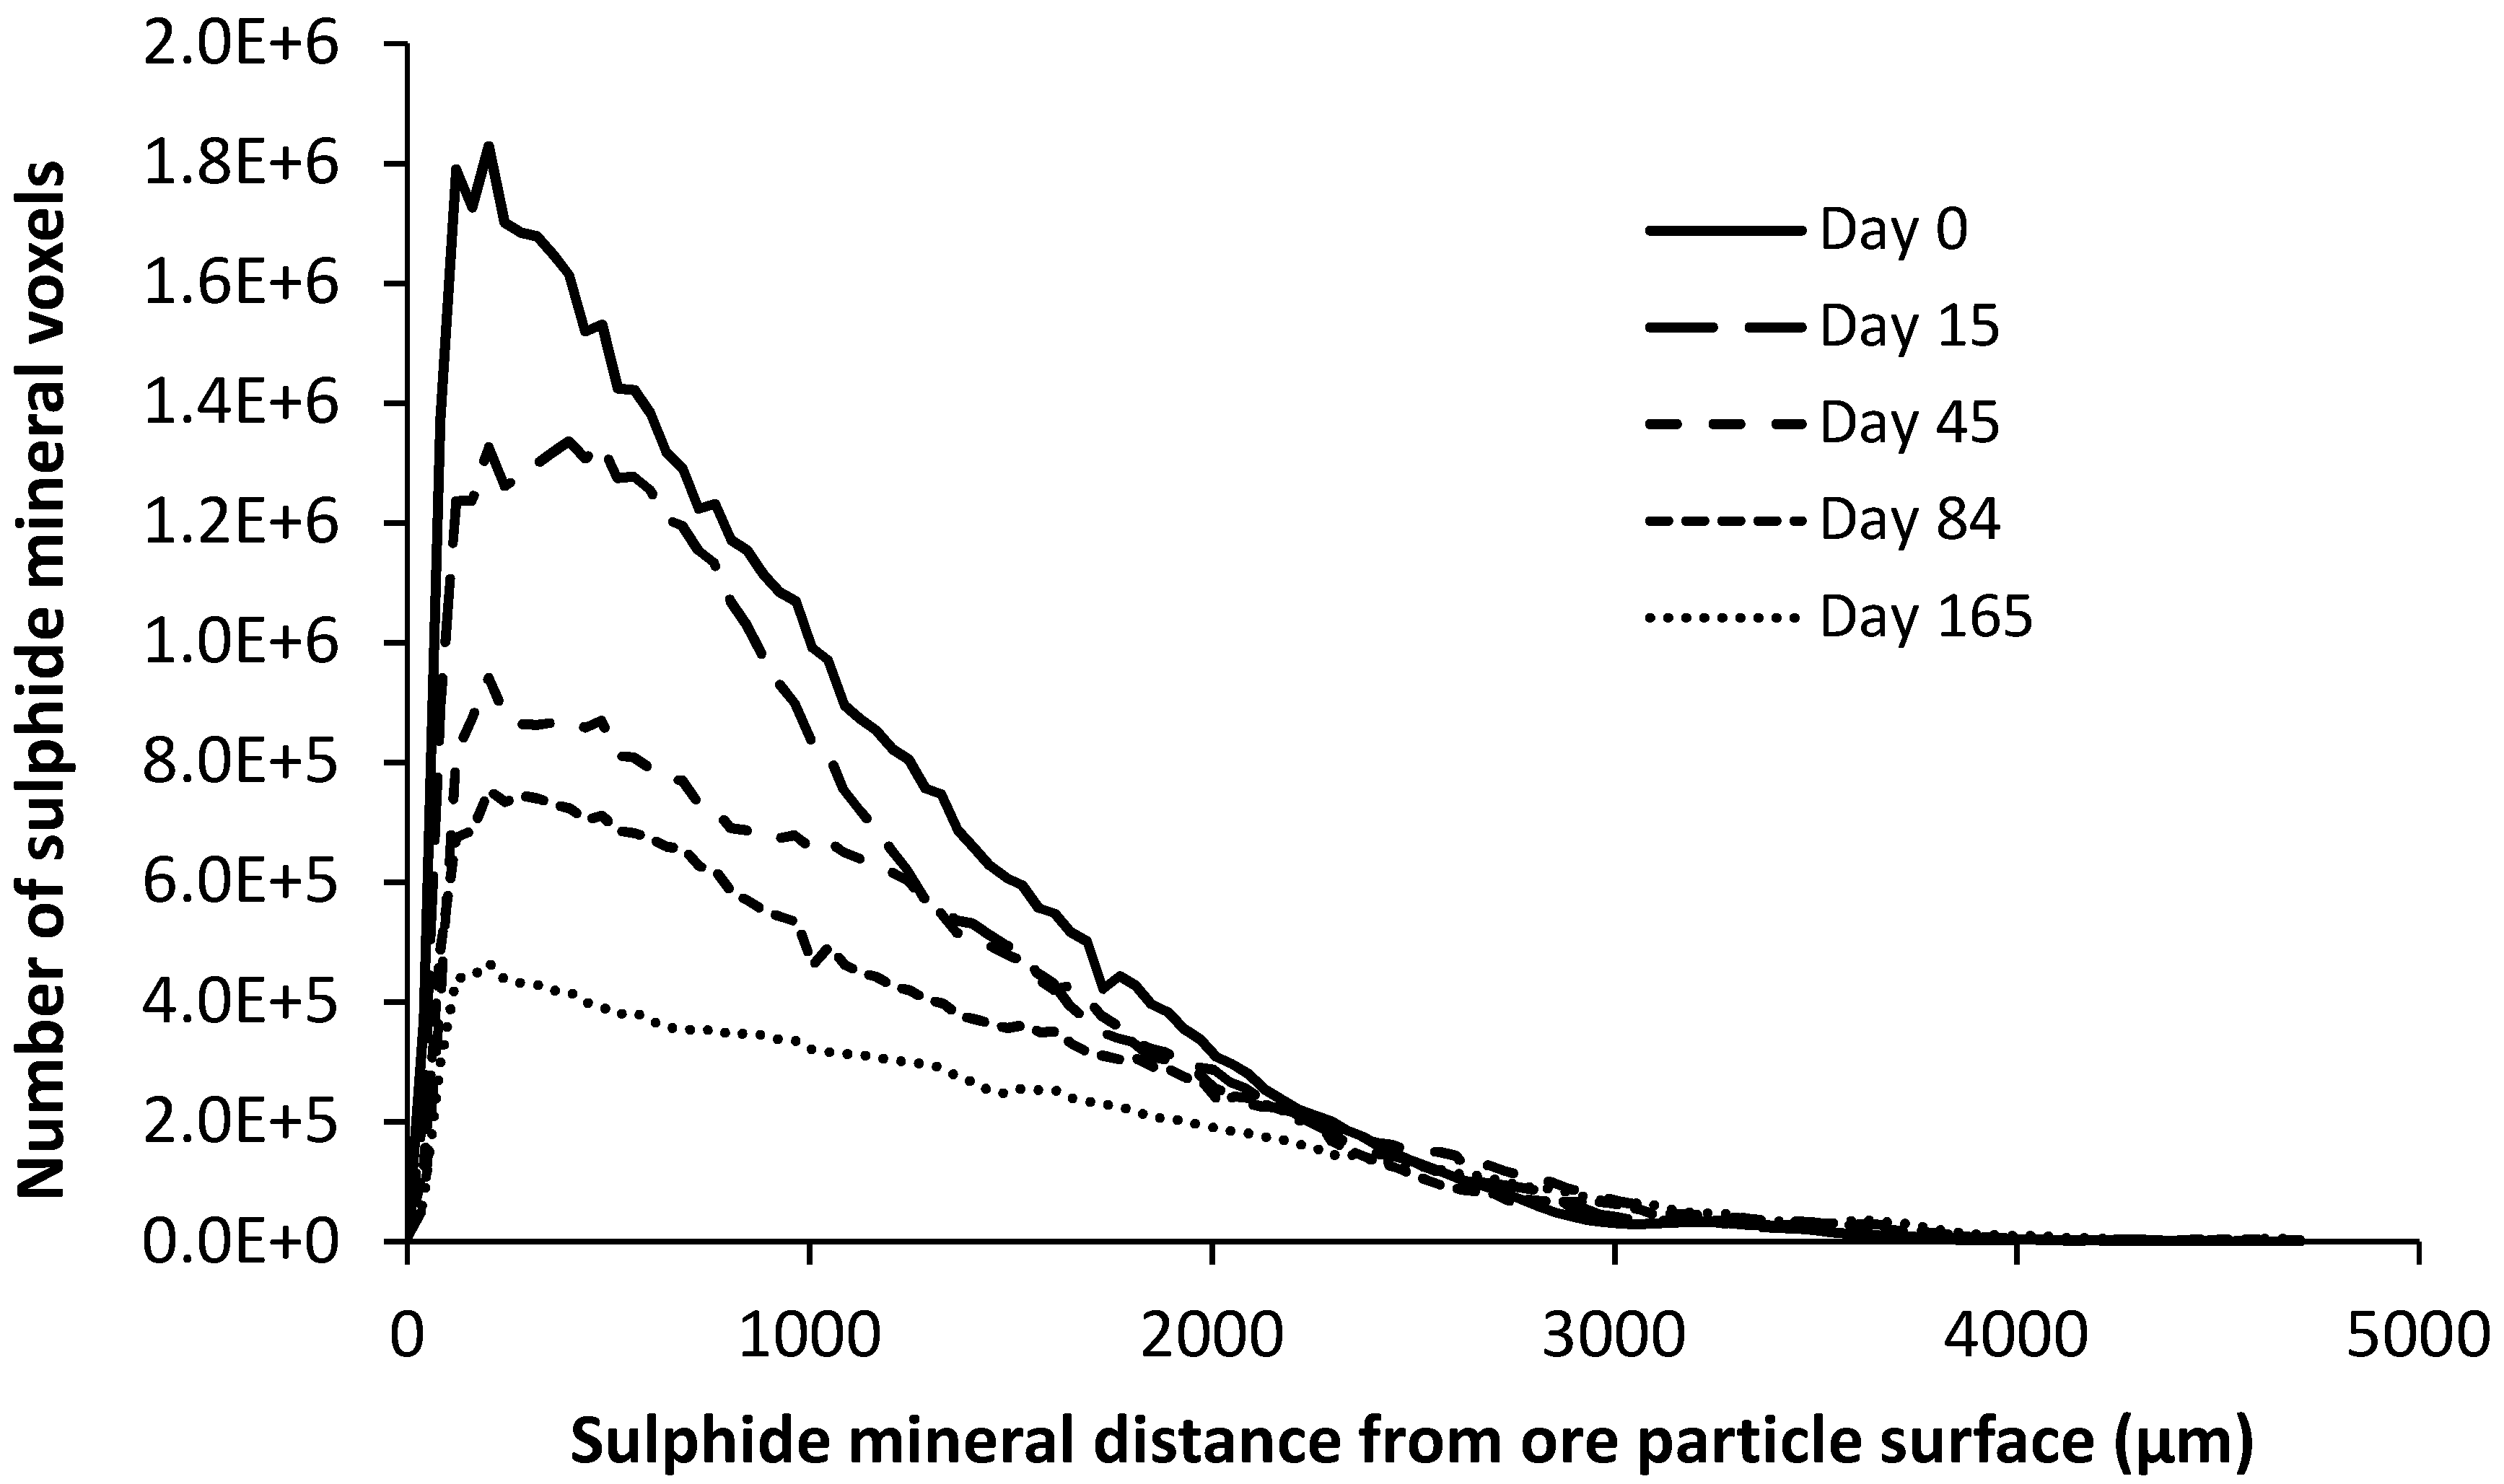
The sum of three mineral grain volumes in the tracked sections at different time points are shown in Figure 15 and Figure 16. The plots demonstrate that the leaching progressed deeper into the ore particles over time. At 37 °C, mineral leaching had progressed to a depth of ±0.75 mm by day 11 and to ±1.5 mm by day 45. However, in the 65 °C mini-column, the mineral was leached at the distance of ±1.5 mm from the ore edge by 11 days, with mineral recovery extending to a penetration of ±2.4 mm by day 45. The maximum leaching penetration was achieved by day 79 for both temperature conditions.
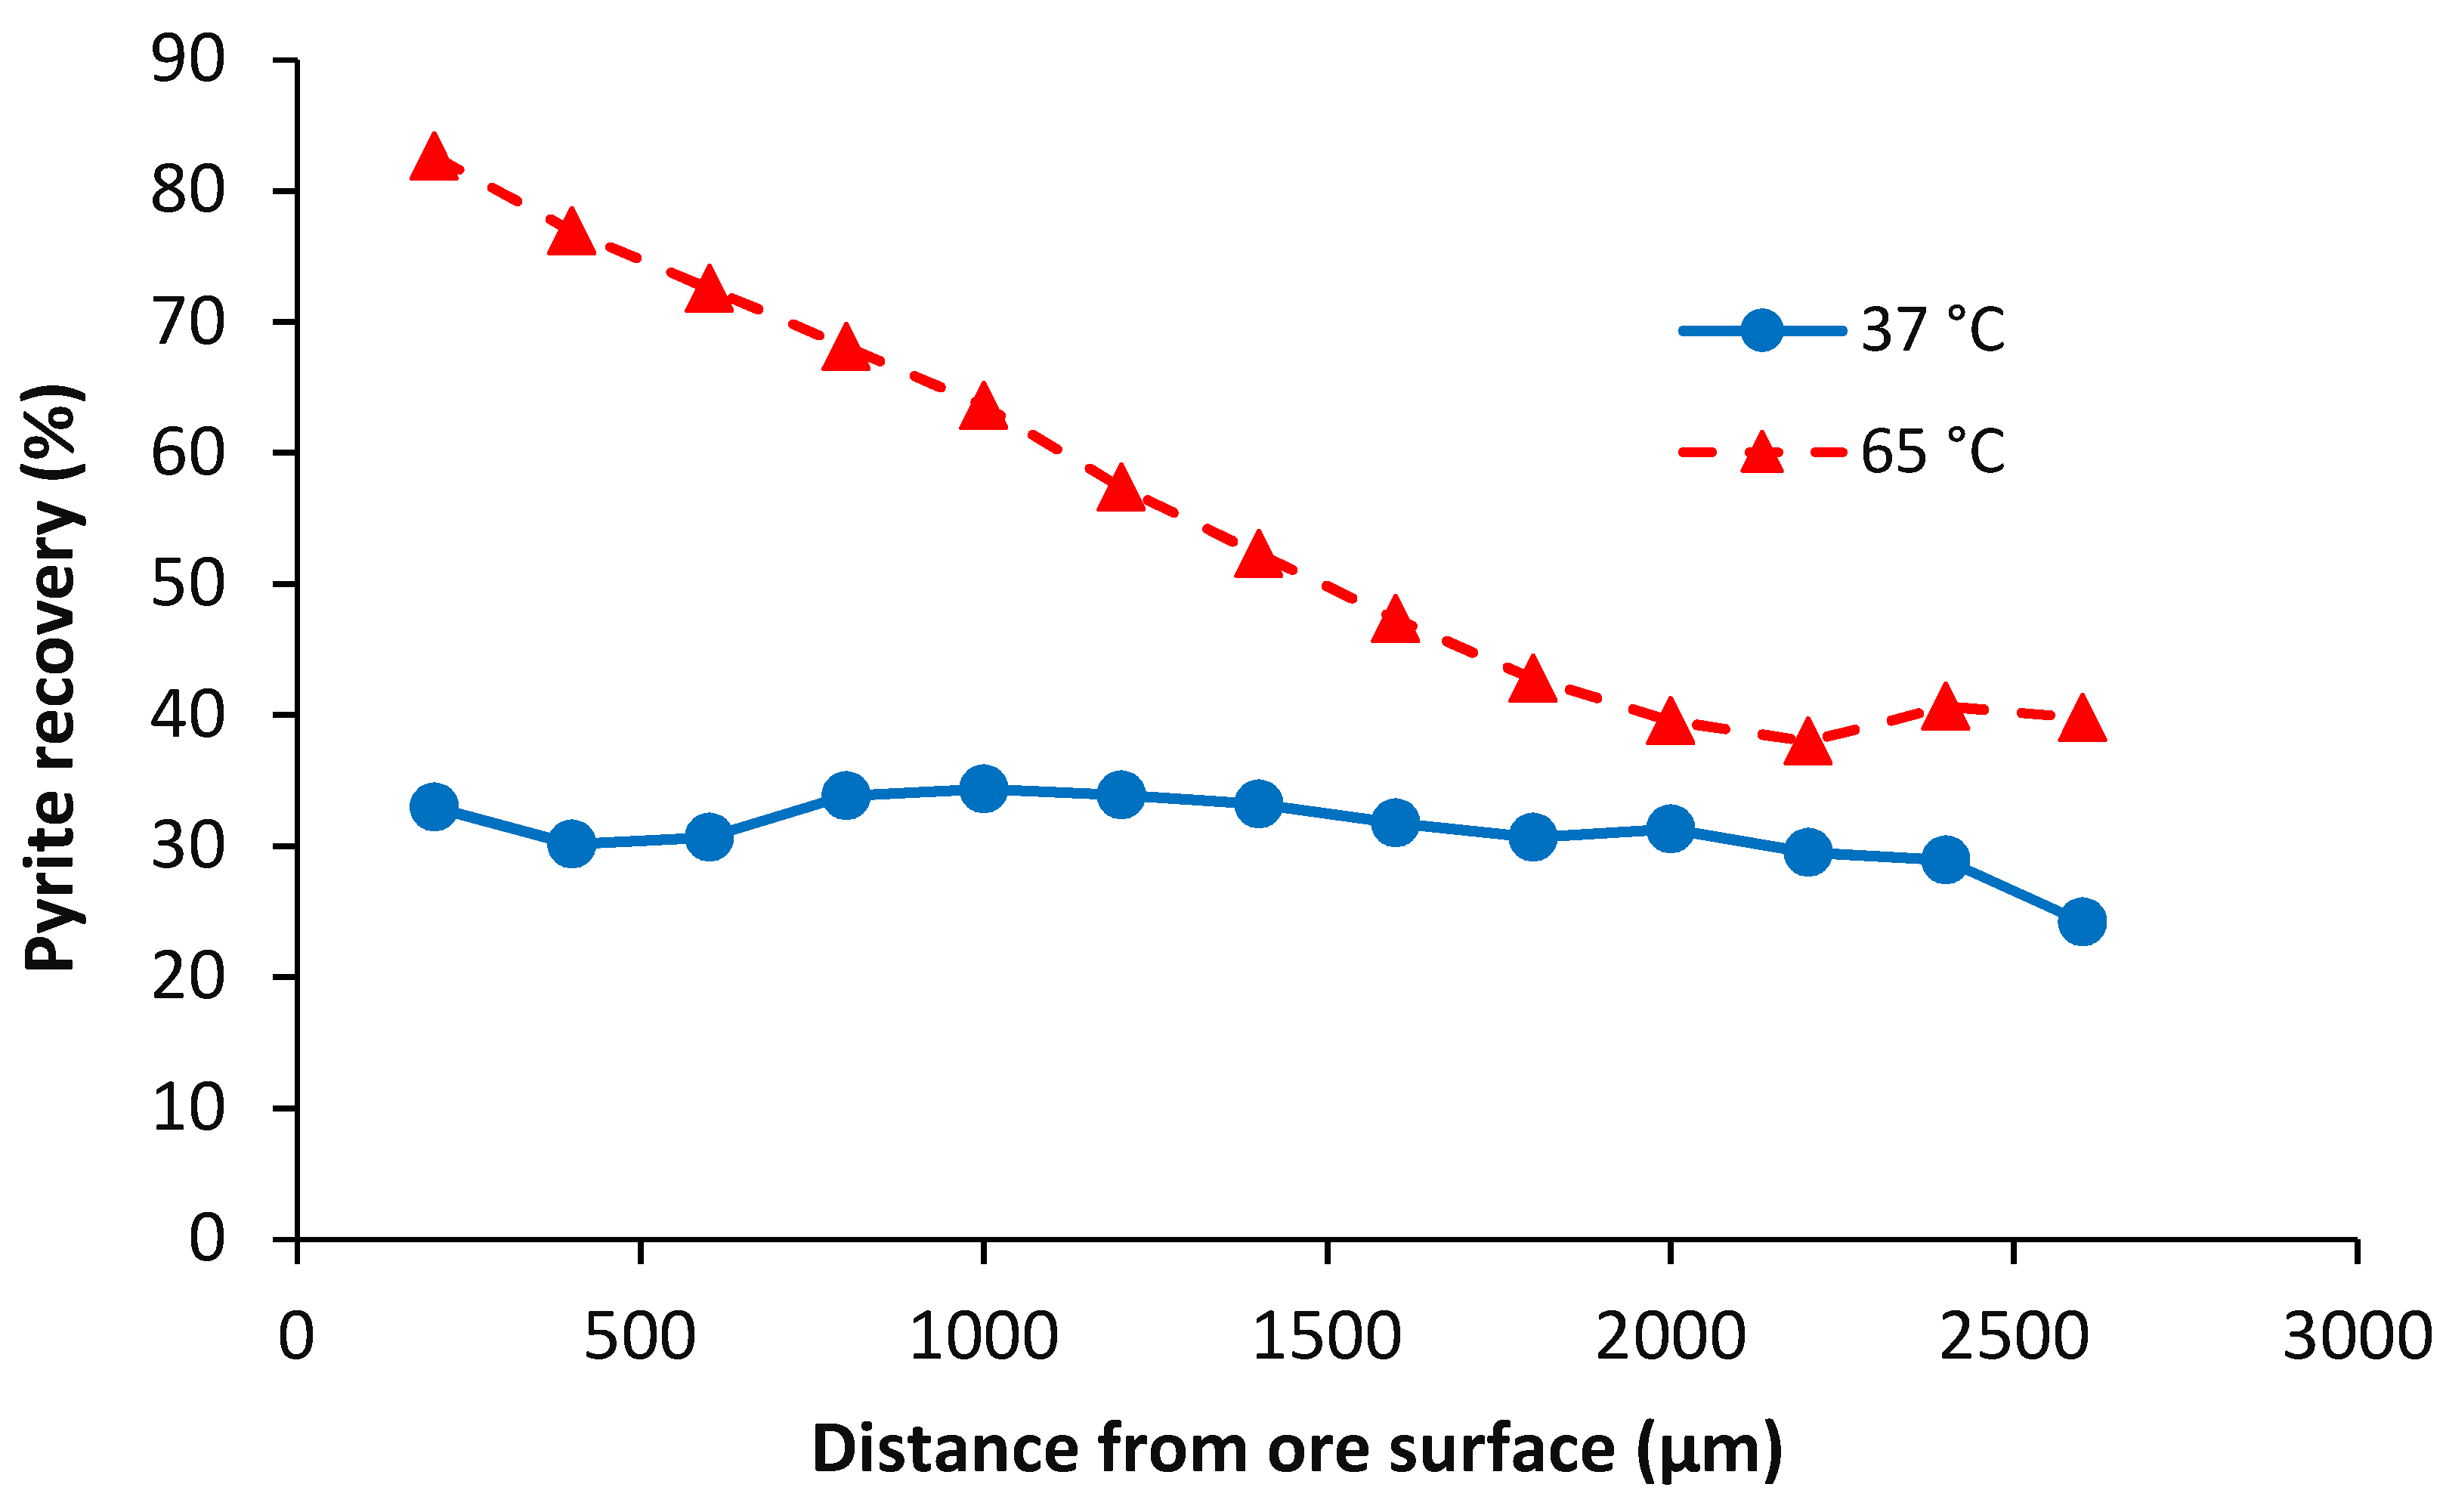
The percentage of iron recovery as a function of the distance from ore edge was plotted in Figure 17. The recovery at 37 °C remained between 29 and 34% at all distances less than the maximum penetration distance. However, at 65 °C the iron recovery was 83% at 200 µm and 32% at 2600 µm from the ore surface, with the recovery showing a steady trend at distances between these.
There are two kinetic regimes which can control the leaching process, namely the chemical reaction or diffusion of reagents through the ore matrix and reaction products. The regime is dependent on factors including operating conditions, ore type and size [34,35]. The chemical reactions are primarily a function of temperature and are influenced by the activation energy, concentration of reactants, and size of mineral. The waste rock used in the current study had about 30% disseminated pyrite. This meant that the inaccessibility of mineral grains should not have been initially rate-limiting with the rate of reaction being controlling at the early stage of the leaching process. However, the leaching kinetics are expected to shift to a combination of reaction–diffusion rate limitation following the depletion of accessible mineral grains. Diffusion of the lixiviant into the deeper subsurface zones then becomes the dominant kinetic factor in the leaching process.
The leaching from the mini-column operated at 37 °C was mainly reaction limited as the iron recovery was the same for the entire range of distance values. Increasing temperature did increase the rate of leaching, as demonstrated in Figure 13. However, the higher leaching rate at the ore particle surface compared to that at larger distances from the ore surface indicates that leaching at the higher temperature became limited by access to the lixiviant. This points to either a partially diffusion-controlled system or a bias due to more completely occluded (inaccessible) pyrite mineral grains existing further from the ore particle surface. This conclusion is supported by the rapid and slow leaching periods evident in Figure 13. In the first period, easy leachable minerals led to comparatively rapid iron extraction. The extraction rate then decreased in the second period, due to the depletion of rapidly leachable and more accessible minerals.

4.2.3. Chalcopyrite

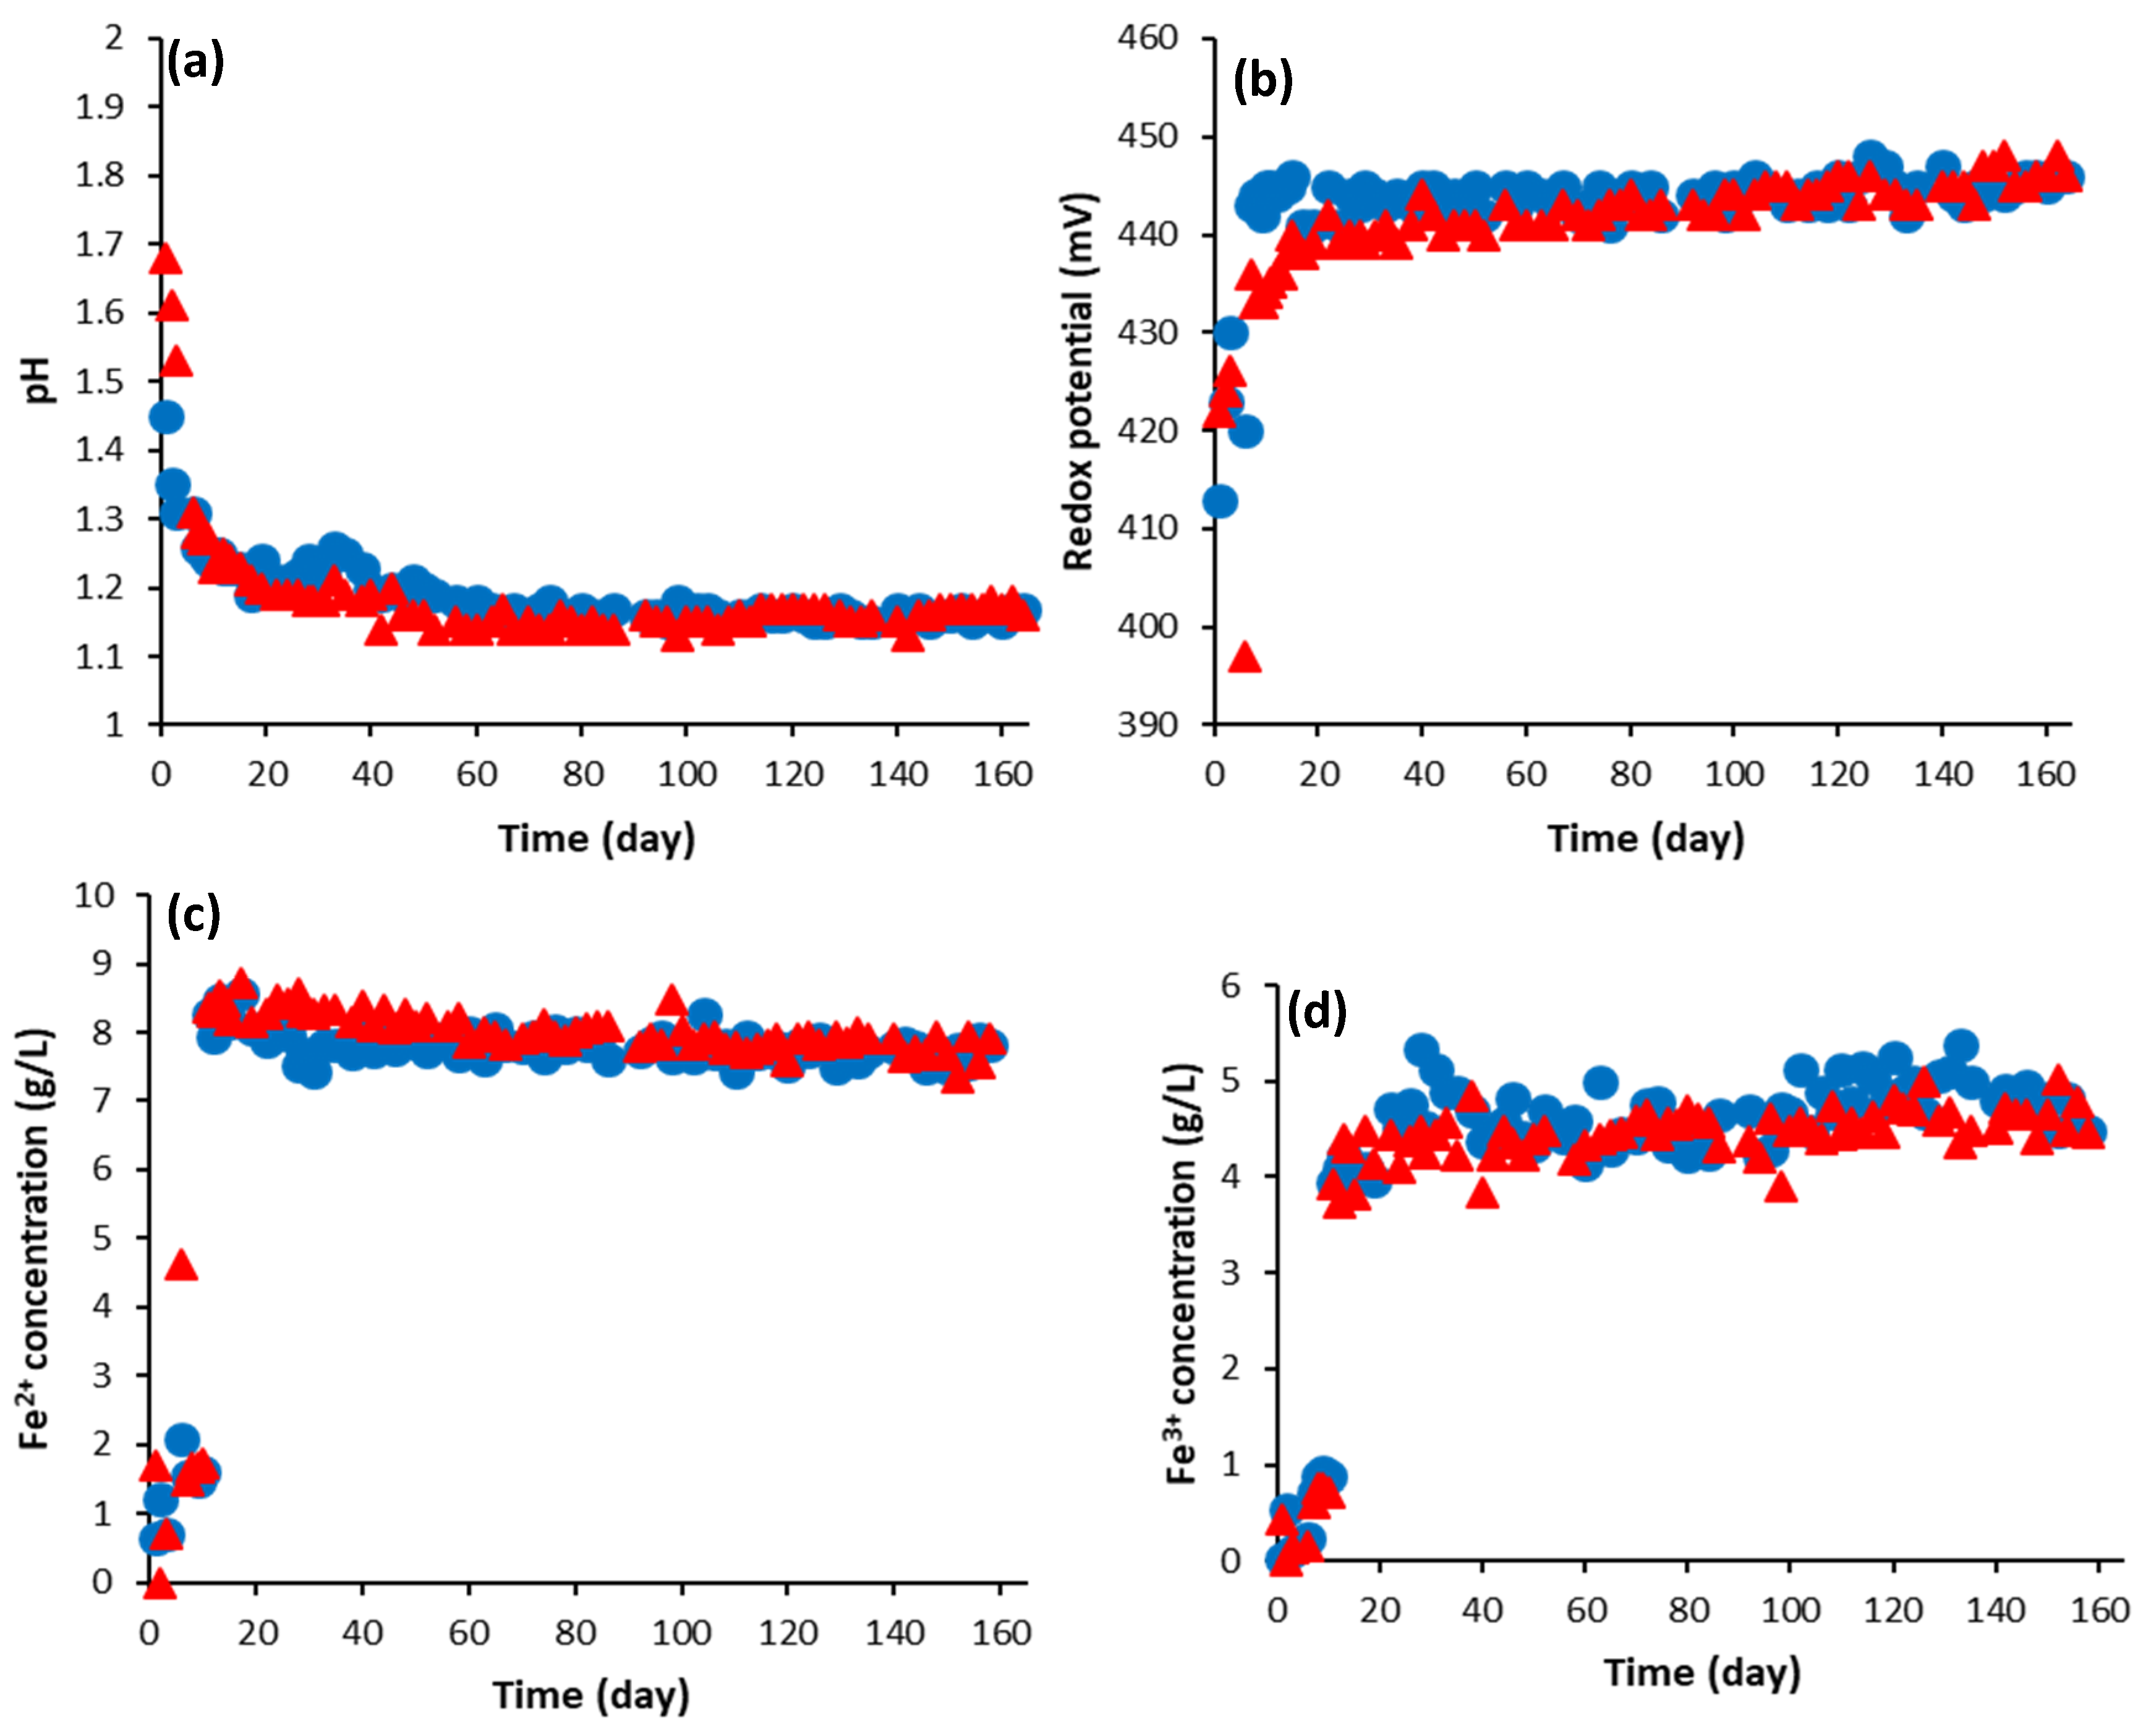
Changes in the pH, redox potential, ferrous ion (Fe2+) and ferric ion (Fe3+) concentrations of the effluent solution from the chalcopyrite leach are shown in Figure 18. There are no meaningful differences in these parameters at the two different temperatures because of the high concentration of ferric and ferrous ion in the solution and the relatively small amount of mineral in the mini-columns.
The pH of the effluent during the acid wash (first 5 days) was initially 1.8 and decreased to 1.25, owing to the dissolution of acid soluble gangue minerals in the ore. After the introduction of the lixiviant feed solution, the pH decreased further and reached approximately pH 1.15 on day 25. The pH subsequently remained between pH 1.14 and 1.17.
The redox potentials increased from 395–400 mV to about 430 mV during the acid washing. In the first 15 days of ferric leaching, the redox rose from 430 to 440 mV. This can be attributed to the fast leaching of exposed mineral grains and the precipitation of ferric ion because of the high temperature (65 °C). It subsequently remained in the range of 443–446 mV, slightly higher than the feed redox value of 440 mV. The redox changes were corroborated by ferrous and ferric ion concentrations in the effluent solution.
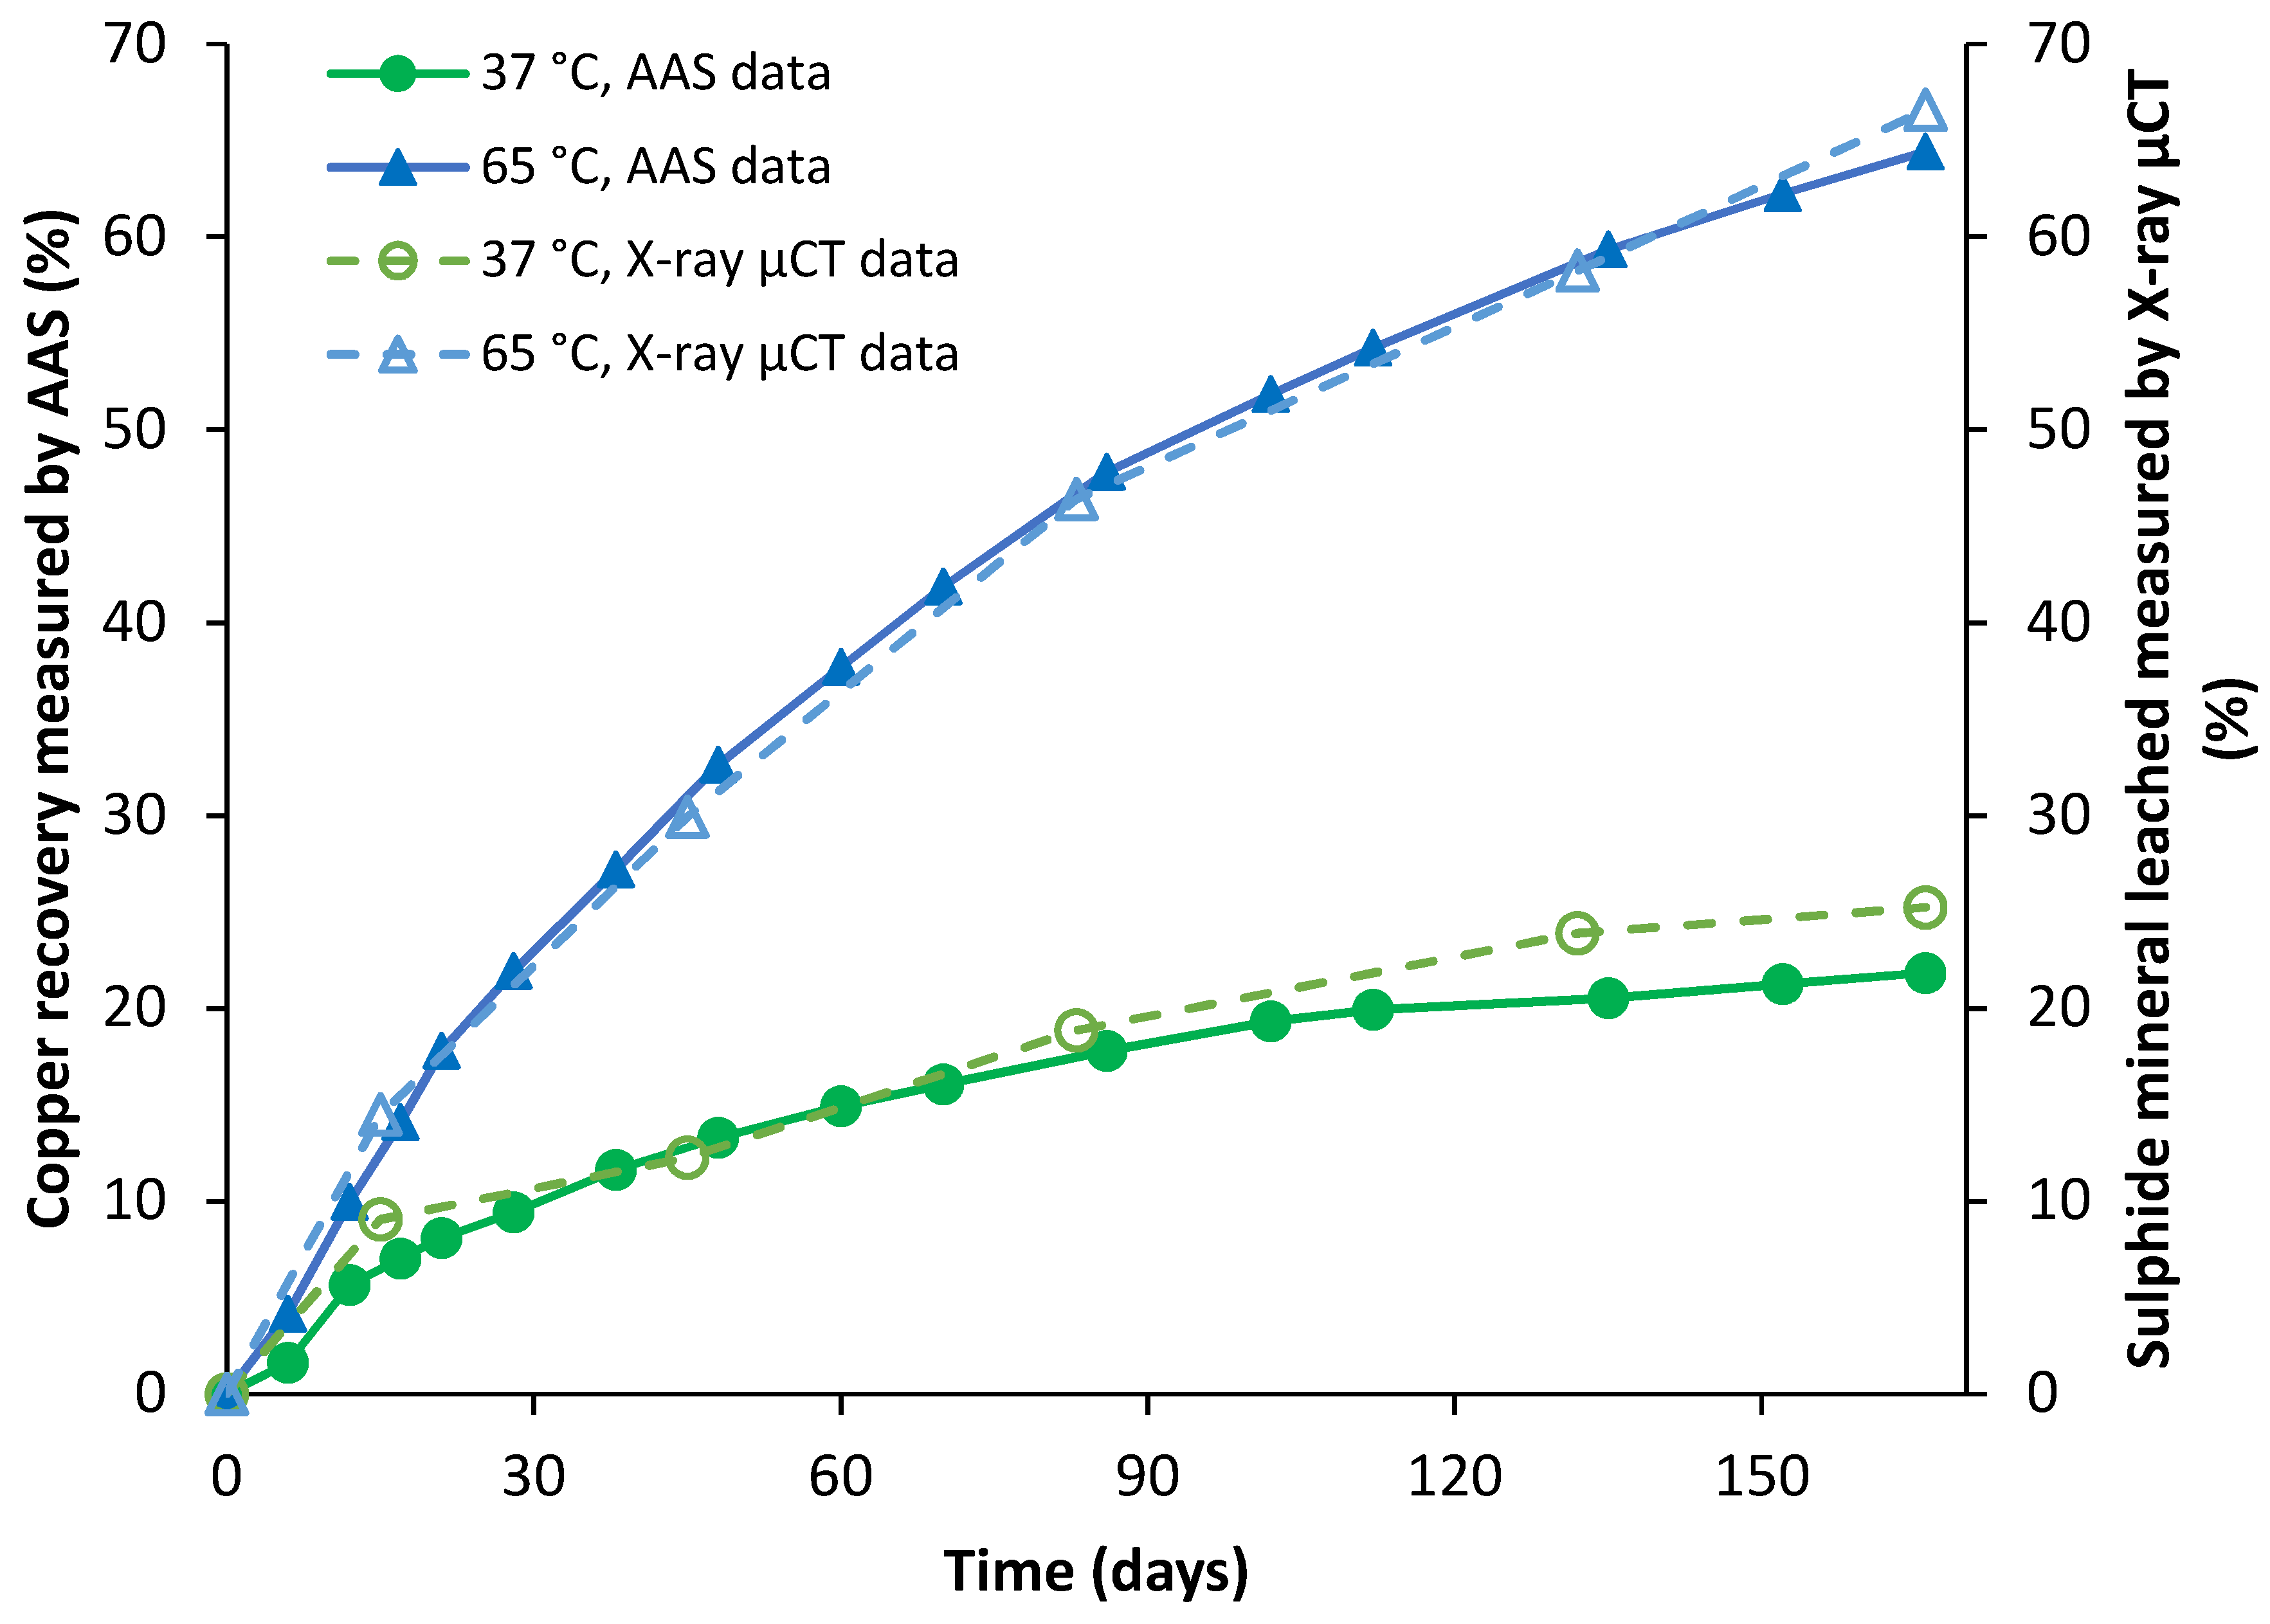
Figure 19 shows the copper recovery from the chalcopyrite ore, based on the chemistry measurements from AAS, as well as the overall percentage of sulphide mineral leached, calculated from the mineral volume in the X-ray µCT images. The results show the progression from rapid to slow ferric ion leaching periods. In the first period, easily leachable minerals led to rapid copper extraction. The copper extraction rate decreased in the second period, due to the depletion of the rapidly leachable and more accessible minerals. This corresponds to the effluent data, which indicated rapid leaching at the start, followed by little consumption of the leaching reagents provided in the feed from circa day 20.
There are only 3% and 2% differences between the chemistry results and the X-ray µCT imaging data at 37 °C and 65 °C, respectively. This confirms that the X-ray µCT images are a good measure of copper leaching. Larger deviations between the two analysis methods towards the end of the experimental period can be attributed to the cumulative effect of leaching of other non-copper-containing minerals present in the ore (e.g., pyrite) which are thresholded along with the chalcopyrite during the X-ray µCT image analysis.
Increasing the temperature from 37 °C to 65 °C resulted in the clear enhancement of leaching, with the copper recovery increasing from 20% at 37 °C to 64% at 65 °C by the end of the leaching period, and the overall sulphide mineral dissolution increasing from 24% to 67%.
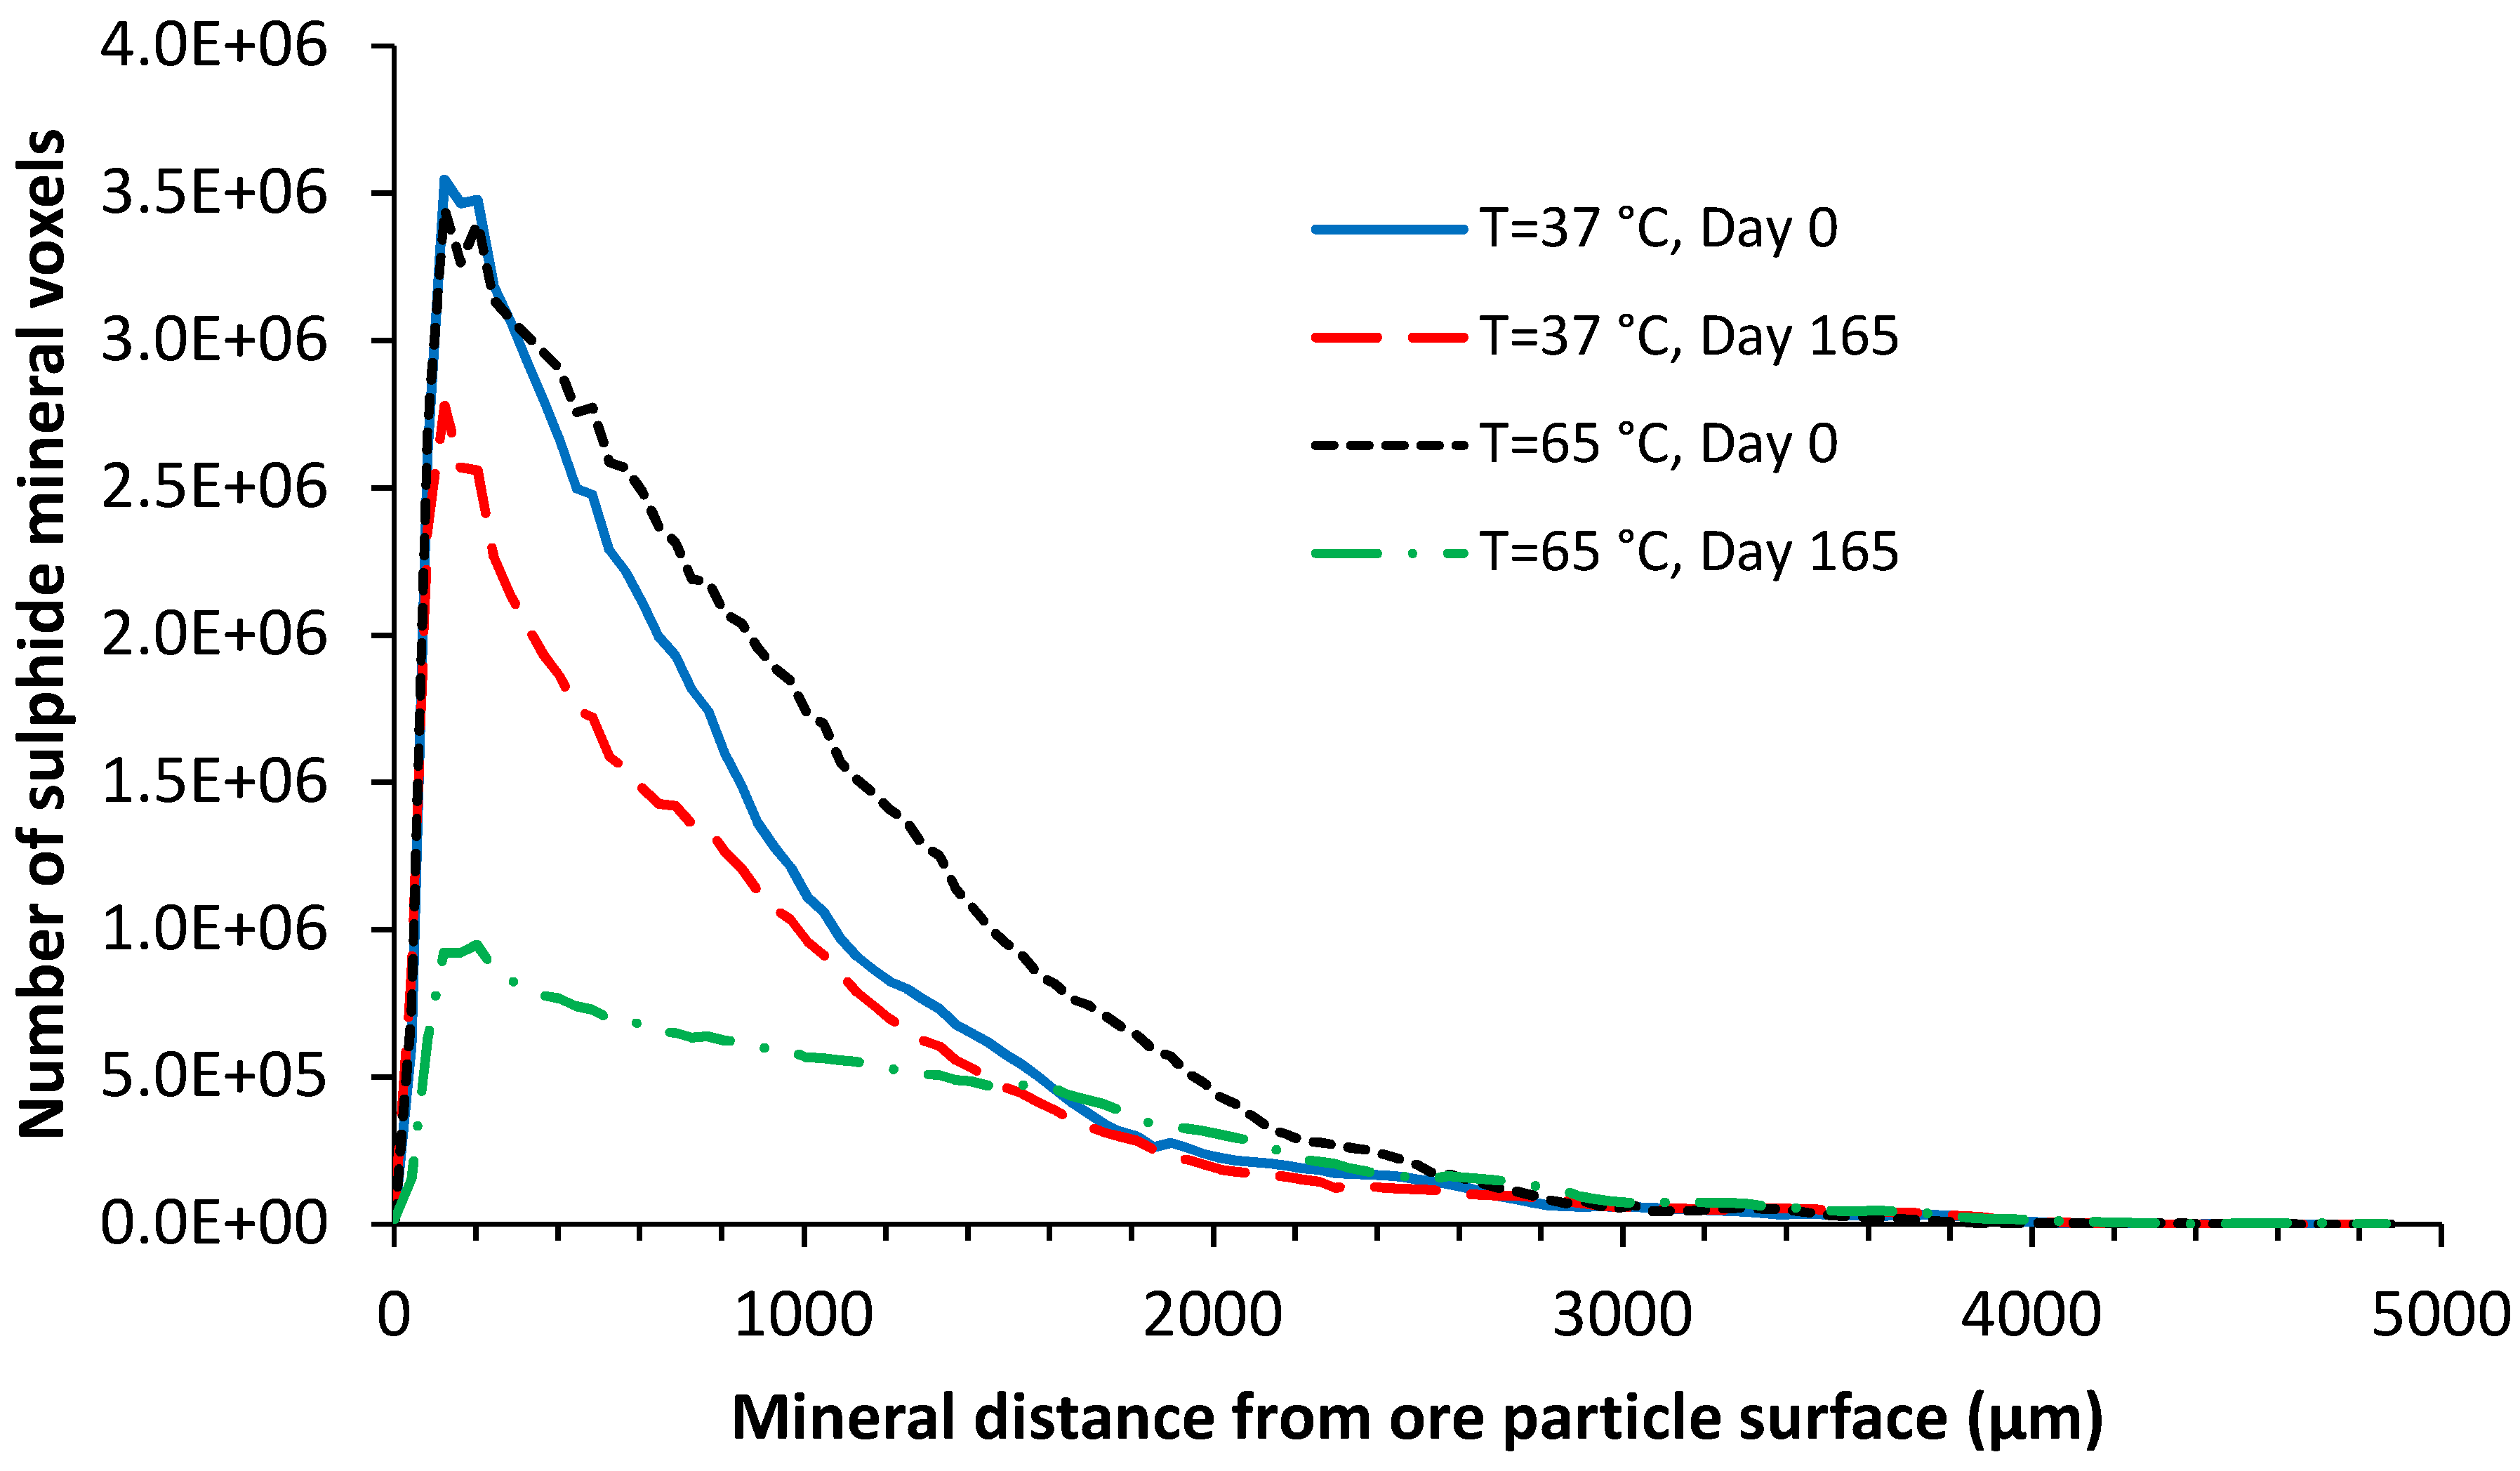
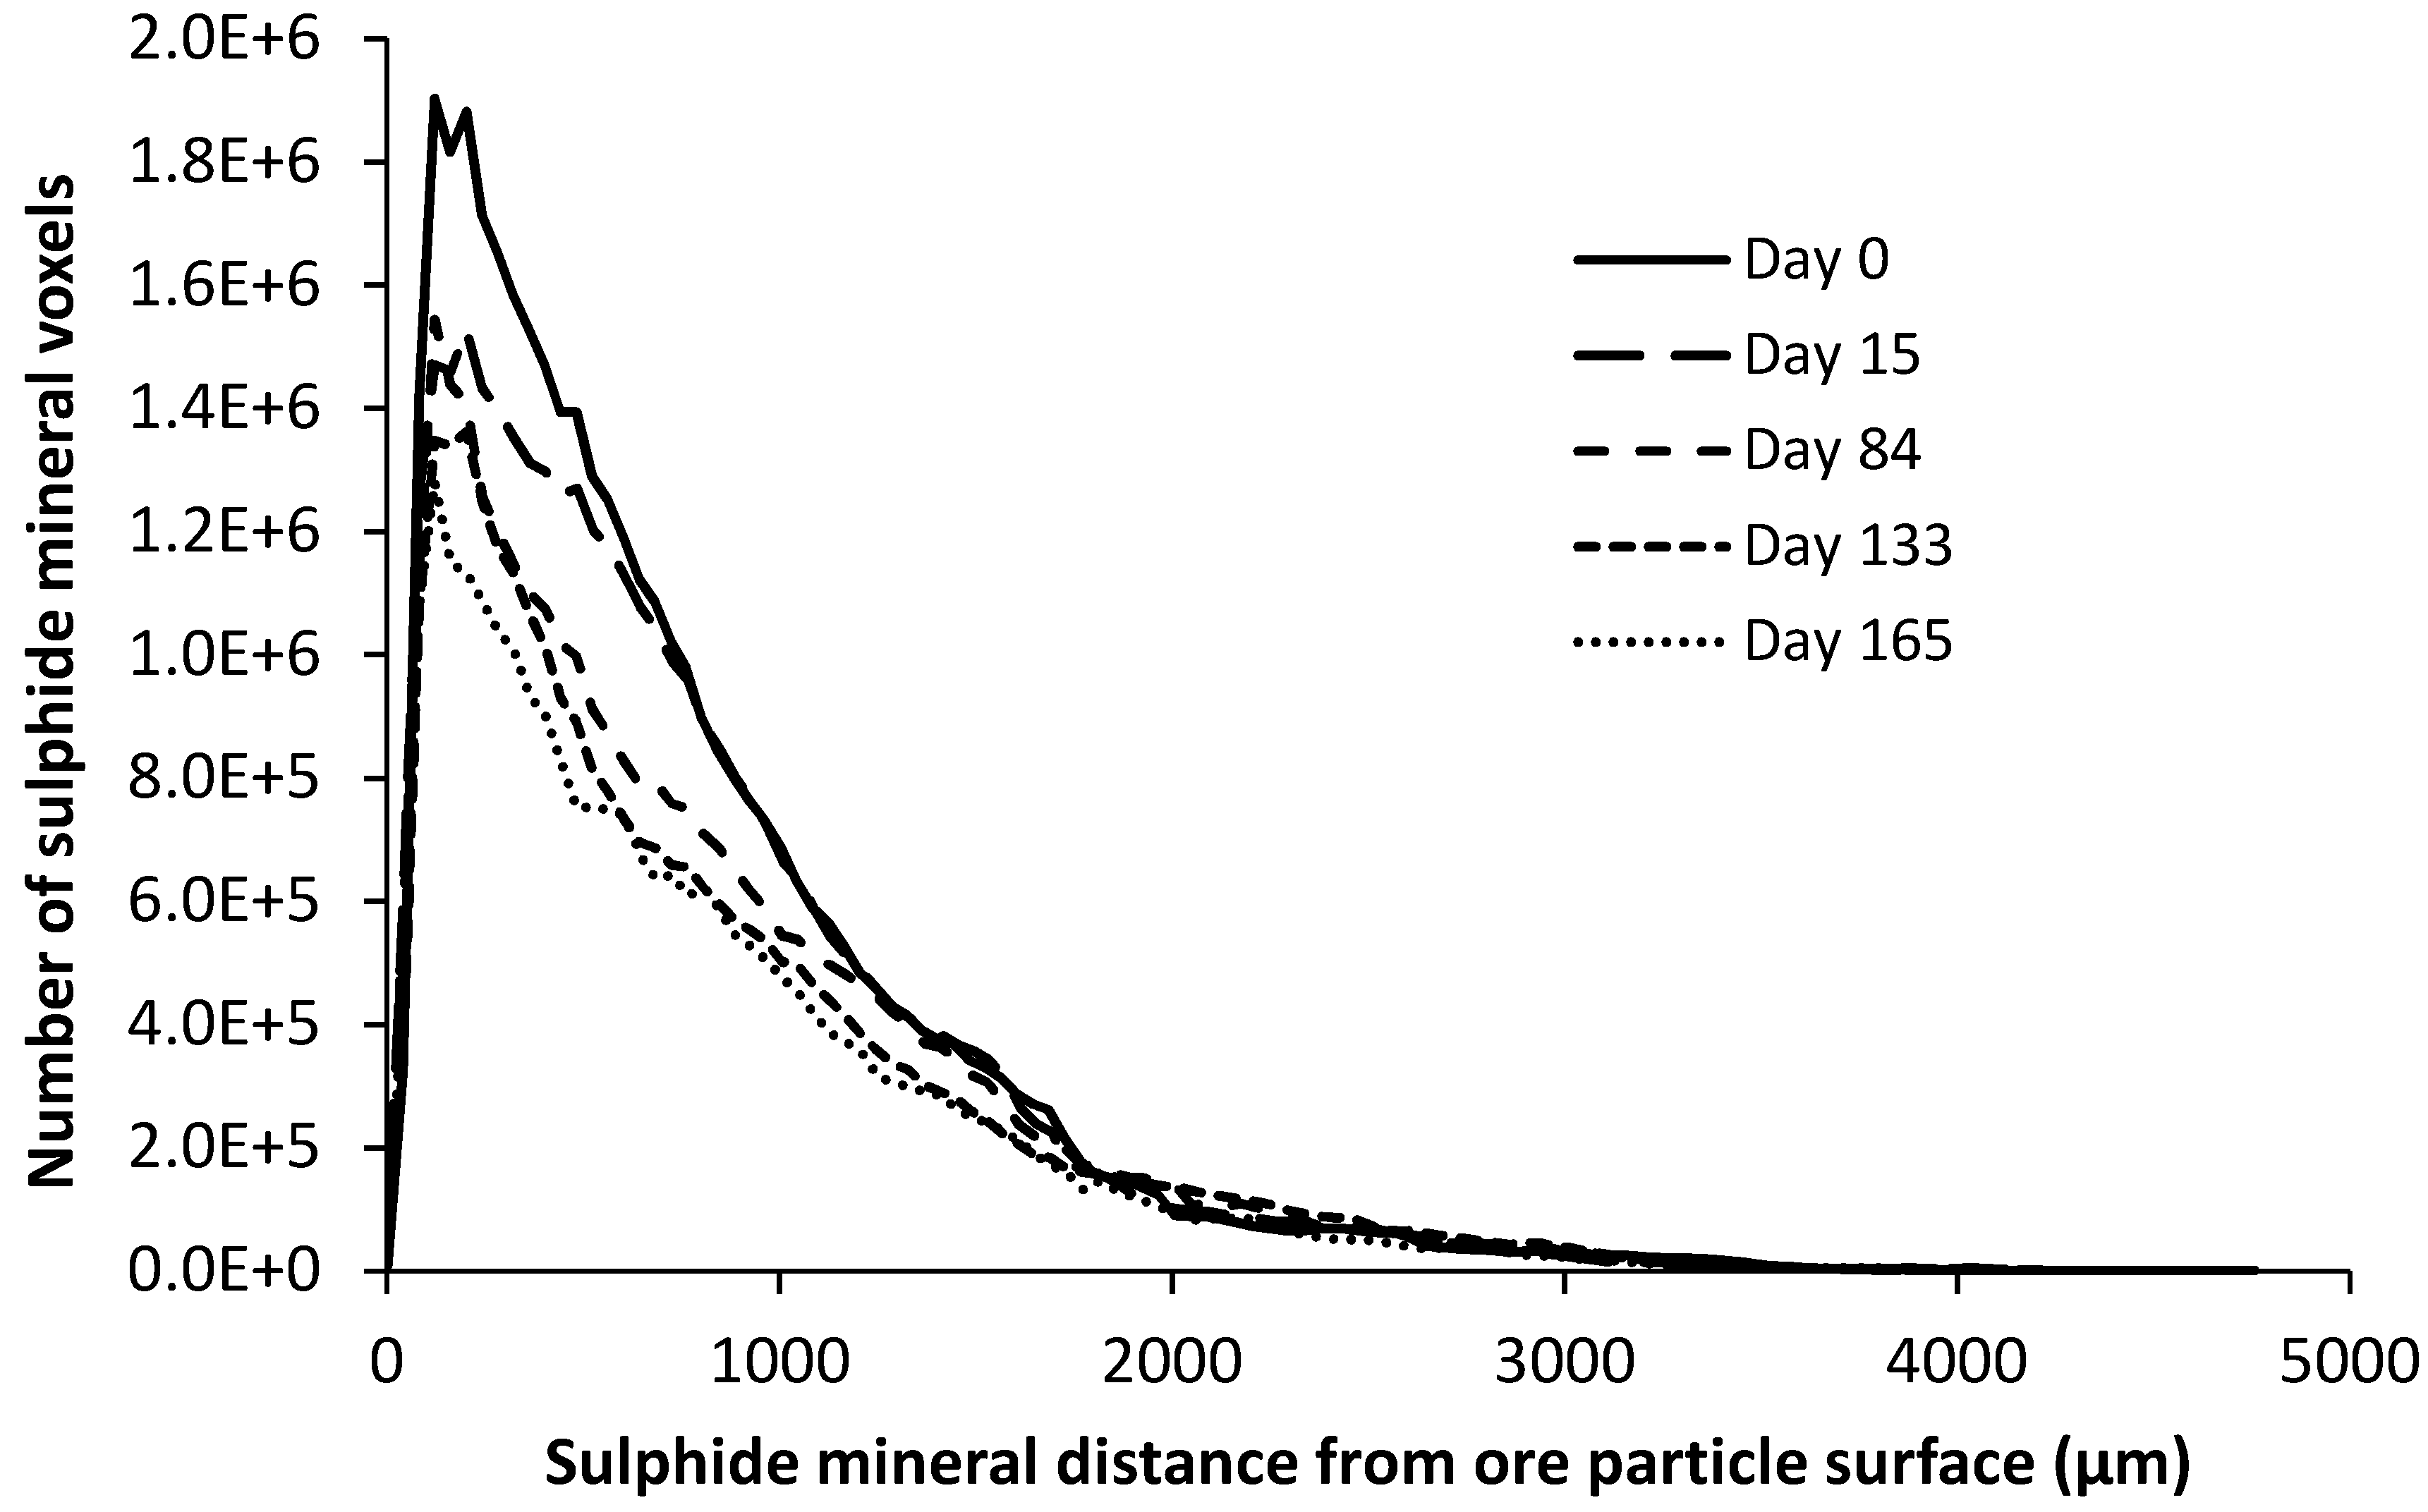
Figure 20 shows the distributions of the sulphide mineral within the ore, expressed as the distance from the ore particle surface, before the start of leaching (day 0) and at the end of the leaching (day 165) for the mini-columns operated at 37 °C and 65 °C. The sums of the three tracked sections at different time points are presented in Figure 21 and Figure 22.
The maximum leaching penetration distance was 1.7 mm at 37 °C, beyond which no mineral volume change was observed. This increased to 2.5 mm at 65 °C. At the lower temperature, minerals were leached within 0.6 mm of the ore particle surfaces during the first two weeks. The leaching penetration distance then increased to 1.2 mm by day 84, with the small amount of leaching at distances between 1.2 and 1.7 mm occurring during the later stages of leaching. Crack development was not observed at 37 °C and the majority of the leaching was carried out in the more porous rim section of the agglomerate structure, as presented in Figure 7. At 65 °C, changes in the mineral content were limited to a distances less than 2.1 mm until day 84. This distance corresponds to the higher porosity region of the agglomerates, as presented in Figure 7. By day 165, the mineral recovery was observed at distances greater than 2.1 mm from the ore surface.
The copper recoveries at different distances from the ore surface are presented in Figure 23. The mini-column at 37 °C had a copper recovery in the range of 30% to 14% across the range of distance values. The copper recovery first increased from 24% at the distance value of 200 μm to 30% in the range of 400–600 μm. It decreased to 14% at a distance value of 1.2 mm. It subsequently remained low, in the range of 14–17% between 1200 and 1700 μm. This is indicative of reaction kinetics, not lixiviant diffusion and contact, being the rate limiting factor for the chalcopyrite leaching at 37 °C, expected at this lower temperature. At 65 °C, there was a high recovery of the grains closer to the surface, with the same degree of leaching of >70% observed for the first 600 µm. There was no reagent limitation in this region, with the reaction being controlled by kinetics. This distance correlates to the maximum in the agglomerated ore porosity (Figure 7). Beyond 1 mm, the recovery decreased steadily from 69% to 19%, attributable to the increasing limitation to lixiviant accessibility as the distance from the ore surface increased.
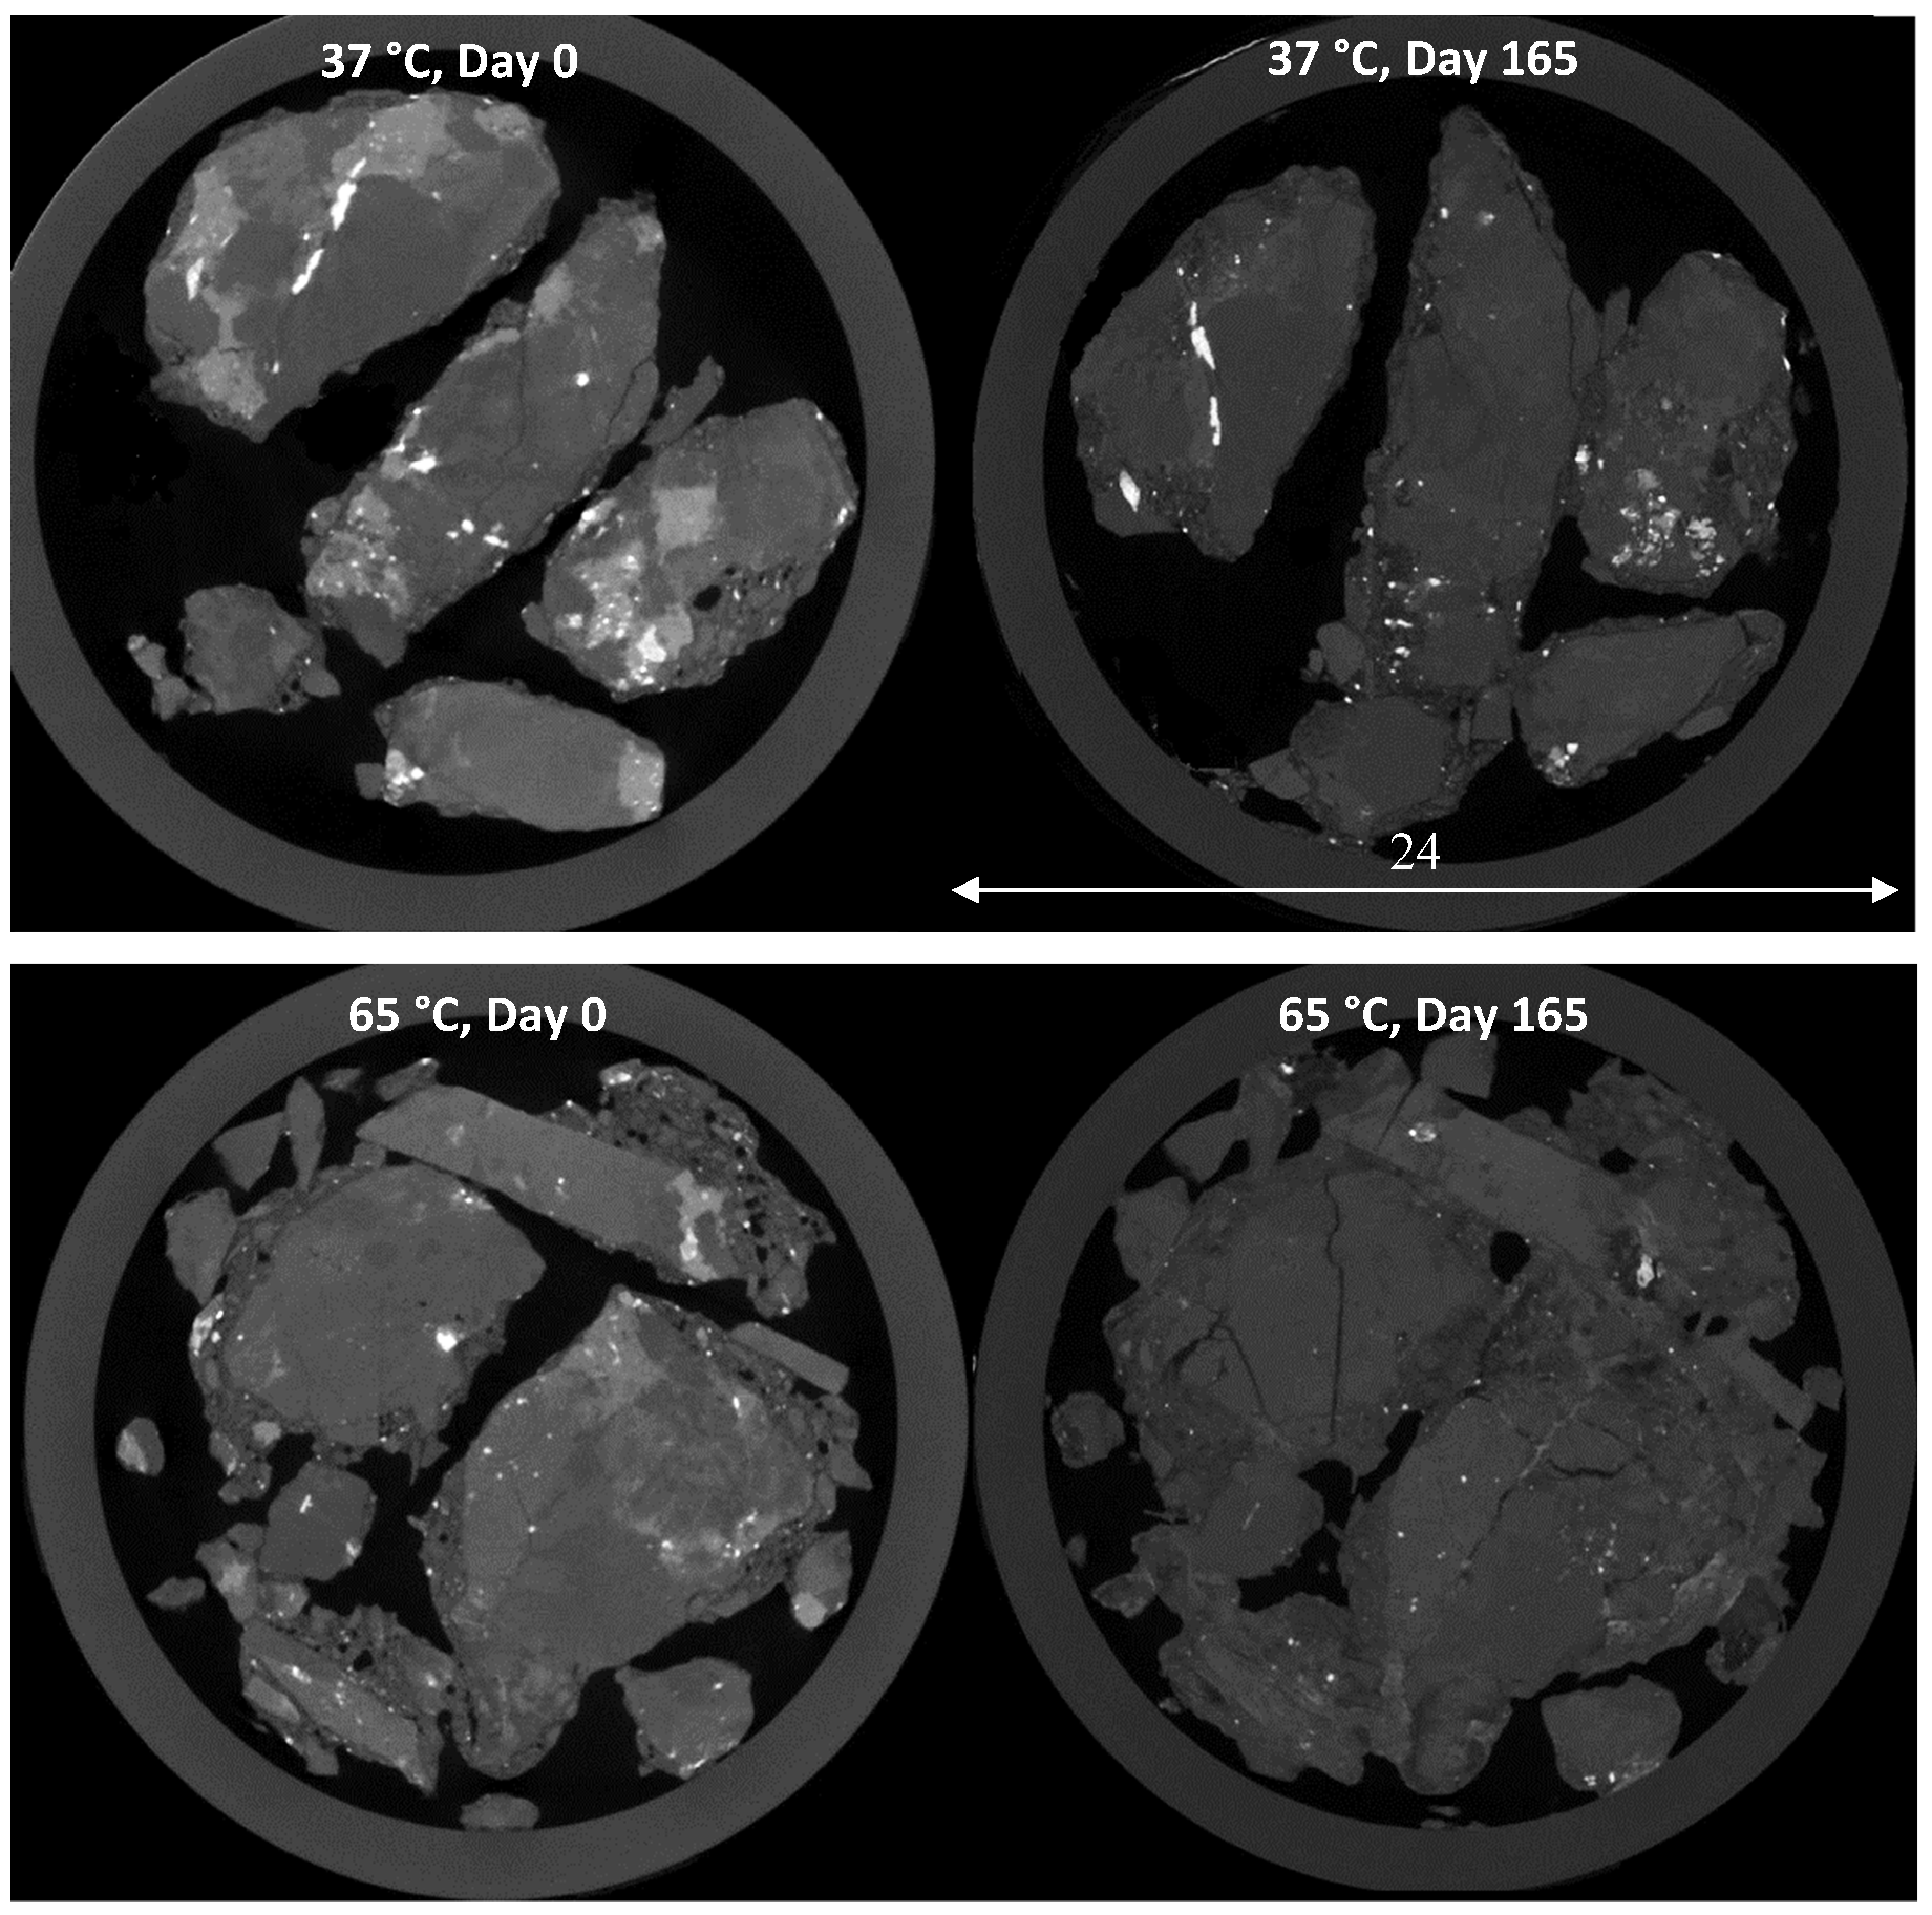
Example image slices from before and at the end of leaching at 37 °C and 65 °C are shown in Figure 24. Crack development in the ore particles is evident at the higher temperature, but not at 37 °C. The leaching of the deeper mineral at 65 °C may therefore reasonably be attributed to the formation of cracks during the later stages of ferric leaching. The formation of the cracks was most likely due to the dissolution of the mineral lattice, as no significant pressure on the ore particles was present in the mini-columns.
Significant enhancement of copper recovery with increased temperature, as presented in Figure 19, confirms the pronounced effect of temperature on chalcopyrite ferric leaching due to the high activation energies. However, the X-ray µCT acquisitions show that the enhanced recovery was not only due to the increased leaching rate, as the maximum penetration distance also increased by 0.8 mm at the higher temperature, increasing the availability of grains for leaching. Thus, an increasing temperature appears also to have reduced the diffusion limitation to leaching.

5. Conclusions

X-ray µCT was used successfully to quantify the leaching of non-surface mineral grains in three different ore types and at different operating conditions with the aim of improving the understanding of the limitations to their recovery.
For all three ore types, good agreement was demonstrated between the traditional chemistry-based analysis of the effluent to determine the metal leaching and quantification of the mineral volume changes from the X-ray µCT images segmented using the Avizo® 9 Interactive Thresholding function.
Chemical reaction-controlled leaching was demonstrated for the highly porous malachite ore. In cases such as this, there is no observed limitation on lixiviant access (diffusion) and thus no motivation to modify the operating conditions or ore preparation to improve recoveries.
The lower porosity pyrite and chalcopyrite-agglomerated ore systems showed more complex behaviour. In both cases, negligible changes in the leaching extent at different positions within the maximum penetration distances at the lower temperature condition were indicative of reaction-controlled leaching systems. Increasing the temperature saw increases in mineral leaching at the ore particle surfaces. However, the decreasing leaching extent with increasing distance from the agglomerated ore particle surface at the higher temperature indicated that leaching became limited by access to the lixiviant. This points to either a partially diffusion-controlled system or more completely occluded (inaccessible) mineral grains being located further from the ore particle surface i.e., in the centre of the ore particle compared with the agglomerated rim. In terms of chalcopyrite, the structure and higher porosity of the agglomerate rim and conditions that resulted in the degradation of the full ore matrix structure within the ore particle were found to be critical determining variables of the leaching rate and extent for the less porous ores.
In the pyrite system, no changes in the maximum penetration distance were observed with a temperature increase. Therefore, increasing the temperature decreases the leaching time for this particular ore, but not the total recoverable metal. However, in the chalcopyrite leaching system, the higher temperature leach resulted in crack development in the particles and an associated increase in the leaching penetration distance, leading to an enhancement in copper recovery and sulphide mineral dissolution. Thus, increased chalcopyrite recovery was due to improved mineral access owing to change in the gangue-supporting matrix, as well as more favourable thermodynamic conditions for leaching.
X-ray µCT has been demonstrated as an excellent tool for the investigation of these factors. Further development of the segmentation techniques for the improved identification of the various mineral types (including gangue phases) should be sought in line with this observation.

Author Contributions

Conceptualization, M.A.F.-E. and S.T.L.H.; methodology, M.G., M.A.F.-E. and S.T.L.H.; validation, M.G., M.A.F.-E. and S.T.L.H.; formal analysis, M.G., M.A.F.-E. and S.T.L.H.; investigation, M.G.; resources, M.A.F.-E. and S.T.L.H.; data curation, M.G., M.A.F.-E. and S.T.L.H.; writing—original draft preparation, M.G.; writing—review and editing, M.G., M.A.F.-E. and S.T.L.H.; supervision, M.A.F.E. and S.T.L.H.; project administration, M.A.F.-E.; funding acquisition, M.A.F.-E and S.T.L.H. All authors have read and agreed to the published version of the manuscript.

Funding

This research was funded by South African Minerals to Metals Research Institute (SAMMRI), grant number S1510. The X-ray µCT imaging was additionally funded by the University of Cape Town (UCT) University Research Committee Start-up and Block Grant programmes. STLH gratefully acknowledges the DST and NRF of South Africa for funding through the SARChI National Research Chair in Bioprocess Engineering, grant UID 64778.

Acknowledgments

We thank Mintek for granting permission to use their malachite ore for this study. We further thank Paul Keanly (X-Sight X-ray Services) and Dr Megan Becker (UCT) respectively for their assistance and guidance in the acquisition of the X-ray and QEMSCAN images.

Conflicts of Interest

The authors declare no conflict of interest.

References

  1. Ghorbani, Y.; Franzidis, J.-P.; Petersen, J. Heap leaching technology—current state, innovations, and future directions: A review. Miner. Process. Extract. Metallur. Rev. 2016, 37, 73–119. [Google Scholar] [CrossRef] [Green Version]
  2. Watling, H.R. The bioleaching of sulphide minerals with emphasis on copper sulphides—A review. Hydrometallurgy 2006, 84, 81–108. [Google Scholar] [CrossRef]
  3. Ruan, R.; Zou, G.; Zhong, S.; Wu, Z.; Chan, B.; Wang, D. Why Zijinshan copper bioheapleaching plant works efficiently at low microbial activity—Study on leaching kinetics of copper sulfides and its implications. Miner. Eng. 2013, 48, 36–43. [Google Scholar] [CrossRef]
  4. Jansen, M.; Taylor, A. Overview of gangue mineralogy issues in oxide copper heap leaching. In Proceedings of the ALTA Conference, Perth, Australia, 19–24 May 2003; p. 32. [Google Scholar]
  5. Khoshkhoo, M.; Dopson, M.; Shchukarev, A.; Sandström, Å. Chalcopyrite leaching and bioleaching: An X-ray photoelectron spectroscopic (XPS) investigation on the nature of hindered dissolution. Hydrometallurgy 2014, 149, 220–227. [Google Scholar] [CrossRef]
  6. Berry, V.K.; Murr, L.E.; Hiskey, J.B. Galvanic interaction between chalcopyrite and pyrite during bacterial leaching of low-grade waste. Hydrometallurgy 1978, 3, 309–326. [Google Scholar] [CrossRef]
  7. Acosta, M.; Galleguillos, P.; Ghorbani, Y.; Tapia, P.; Contador, Y.; Velásquez, A.; Espoz, C.; Pinilla, C.; Demergasso, C. Variation in microbial community from predominantly mesophilic to thermotolerant and moderately thermophilic species in an industrial copper heap bioleaching operation. Hydrometallurgy 2014, 150, 281–289. [Google Scholar] [CrossRef]
  8. Córdoba, E.M.; Muñoz, J.A.; Blázquez, M.L.; González, F.; Ballester, A. Leaching of chalcopyrite with ferric ion. Part I: General aspects. Hydrometallurgy 2008, 93, 81–87. [Google Scholar] [CrossRef]
  9. Justel, F.J.; Claros, M.; Taboada, M.E. Solubilities and physical properties of saturated solutions in th copper sulphate+sulfuric acid+seawater system at different temperatures. Braz. J. Chem. Eng. 2015, 32, 629–635. [Google Scholar] [CrossRef]
  10. Petersen, J. Determination of oxygen gas–liquid mass transfer rates in heap bioleach reactors. Miner. Eng. 2010, 23, 504–510. [Google Scholar] [CrossRef]
  11. Ghorbani, Y.; Becker, M.; Mainza, A.; Franzidis, J.-P.; Petersen, J. Large particle effects in chemical/biochemical heap leach processes—A review. Miner. Eng. 2011, 24, 1172–1184. [Google Scholar] [CrossRef]
  12. Dhawan, N.; Safarzadeh, M.S.; Miller, J.D.; Moats, M.S.; Rajamani, R.K.; Lin, C.-L. Recent advances in the application of X-ray computed tomography in the analysis of heap leaching systems. Miner. Eng. 2012, 35, 75–86. [Google Scholar] [CrossRef]
  13. Lin, C.L.; Garcia, C. Microscale characterization and analysis of particulate systems via cone-beam X-ray microtomography (XMT). In Innovations in Natural Resource Processing: Proceedings of the Jan D. Miller Symposium; Young, C.A., Kellar, J.J., Free, M.L., Drelich, J., King, R.P., Eds.; Society for Mining, Metallurgy and Exploration: Englewood, CO, USA, 2005; pp. 421–432. [Google Scholar]
  14. Ghorbani, Y.; Becker, M.; Petersen, J.; Mainza, A.N.; Franzidis, J.P. Investigation of the effect of mineralogy as rate-limiting factors in large particle leaching. Miner. Eng. 2013, 52, 38–51. [Google Scholar] [CrossRef] [Green Version]
  15. Chiume, R.; Minnaar, S.H.; Ngoma, I.E.; Bryan, C.G.; Harrison, S.T.L. Microbial colonisation in heaps for mineral bioleaching and the influence of irrigation rate. Miner. Eng. 2012, 39, 156–164. [Google Scholar] [CrossRef]
  16. Van Hille, R.P.; van Zyl, A.W.; Spurr, N.R.L.; Harrison, S.T.L. Investigating heap bioleaching: Effect of feed iron concentration on bioleaching performance. Miner. Eng. 2010, 23, 518–525. [Google Scholar] [CrossRef]
  17. Komadel, P.; Stucki, J.W. Quantitative assay of minerals for Fe2+ and Fe3+ using 1,10 phenanthroline; III, A rapid photochemical method. Clays Clay Miner. 1988, 36, 379–381. [Google Scholar] [CrossRef]
  18. Hiroyoshi, N.; Miki, H.; Hirajima, T.; Tsunekawa, M. Enhancement of chalcopyrite leaching by ferrous ions in acidic ferric sulfate solutions. Hydrometallurgy 2001, 60, 185–197. [Google Scholar] [CrossRef]
  19. Petersen, J.; Dixon, D.G. Competitive bioleaching of pyrite and chalcopyrite. Hydrometallurgy 2006, 83, 40–49. [Google Scholar] [CrossRef]
  20. Schindelin, J.; Arganda-Carreras, I.; Frise, E.; Kaynig, V.; Longair, M.; Pietzsch, T.; Preibisch, S.; Rueden, C.; Saalfeld, S.; Schmid, B. Fiji: An open-source platform for biological-image analysis. Nat. Methods 2012, 9, 676. [Google Scholar] [CrossRef] [Green Version]
  21. Istiadi Guntoro, P.; Ghorbani, Y.; Koch, P.H.; Rosenkranz, J. X-ray microcomputed tomography (µCT) for mineral characterization: A review of data analysis methods. Minerals 2019, 9, 183. [Google Scholar] [CrossRef] [Green Version]
  22. Wang, Y.; Lin, C.L.; Miller, J.D. Improved 3D image segmentation for X-ray tomographic analysis of packed particle beds. Miner. Eng. 2015, 83, 185–191. [Google Scholar] [CrossRef]
  23. Lin, Q.; Neethling, S.J.; Courtois, L.; Dobson, K.J.; Lee, P.D. Multi-scale quantification of leaching performance using X-ray tomography. Hydrometallurgy 2016, 164, 265–277. [Google Scholar] [CrossRef]
  24. Arganda-Carreras, I.; Kaynig, V.; Schindelin, J.; Cardona, A.; Seung, H.S. Trainable Weka Segmentation: A machine learning tool for microscopy image segmentation. In Neuroscience 2014 Short Course 2; Sebastian Seung: Princeton, NJ, USA, 2014; pp. 73–80. [Google Scholar]
  25. Kapur, J.N.; Sahoo, P.K.; Wong, A.K.C. A new method for gray-level picture thresholding using the entropy of the histogram. Comput. Vis. Graph. Image Process. 1985, 29, 273–285. [Google Scholar] [CrossRef]
  26. Kocabag, D.; Shergold, H.L.; Kelsall, G.H. Natural oleophilicity/hydrophobicity of sulphide minerals, II. Pyrite. Int. J. Miner. Process. 1990, 29, 211–219. [Google Scholar] [CrossRef]
  27. Nicol, M.J. The kinetics of the dissolution of malachite in acid solutions. Hydrometallurgy 2018, 17, 214–217. [Google Scholar] [CrossRef] [Green Version]
  28. Pesic, B.; Olson, F.A. Dissolution of bornite in sulfuric acid using oxygen as oxidant. Hydrometallurgy 1984, 12, 195–215. [Google Scholar] [CrossRef]
  29. Li, L.; Bergeron, I.; Ghahreman, A. The effect of temperature on the kinetics of the ferric-ferrous redox couple on pyrite. Electrochim. Acta 2017, 245, 814–828. [Google Scholar] [CrossRef]
  30. Antonijević, M.M.; Dimitrijević, M.; Janković, Z. Leaching of pyrite with hydrogen peroxide in sulphuric acid. Hydrometallurgy 1997, 46, 71–83. [Google Scholar] [CrossRef]
  31. Ahonen, L.; Tuovinen, O.H. Temperature effects on bacterial leaching of sulfide minerals in shake flask experiments. Appl. Environ. Microbiol. 1991, 57, 138. [Google Scholar] [CrossRef] [Green Version]
  32. Dew, D.W.; Van Buuren, C.; McEwan, K.; Bowker, C. Bioleaching of base metal sulphide concentrates: A comparison of high and low temperature bioleaching. J. S. Afr. Inst. Min. Metall. 2000, 409, 31. [Google Scholar]
  33. Nemati, M.; Harrison, S.T.L. A comparative study on thermophilic and mesophilic biooxidation of ferrous iron. Miner. Eng. 2000, 13, 19–24. [Google Scholar] [CrossRef]
  34. Ghorbani, Y.; Petersen, J.; Becker, M.; Mainza, A.N.; Franzidis, J.-P. Investigation and modelling of the progression of zinc leaching from large sphalerite ore particles. Hydrometallurgy 2013, 131–132, 8–23. [Google Scholar] [CrossRef] [Green Version]
  35. Dixon, D.G.; Hendrix, J.L. A general model for leaching of one or more solid reactants from porous ore particles. Metallur. Trans. B 1993, 24, 157–169. [Google Scholar] [CrossRef]
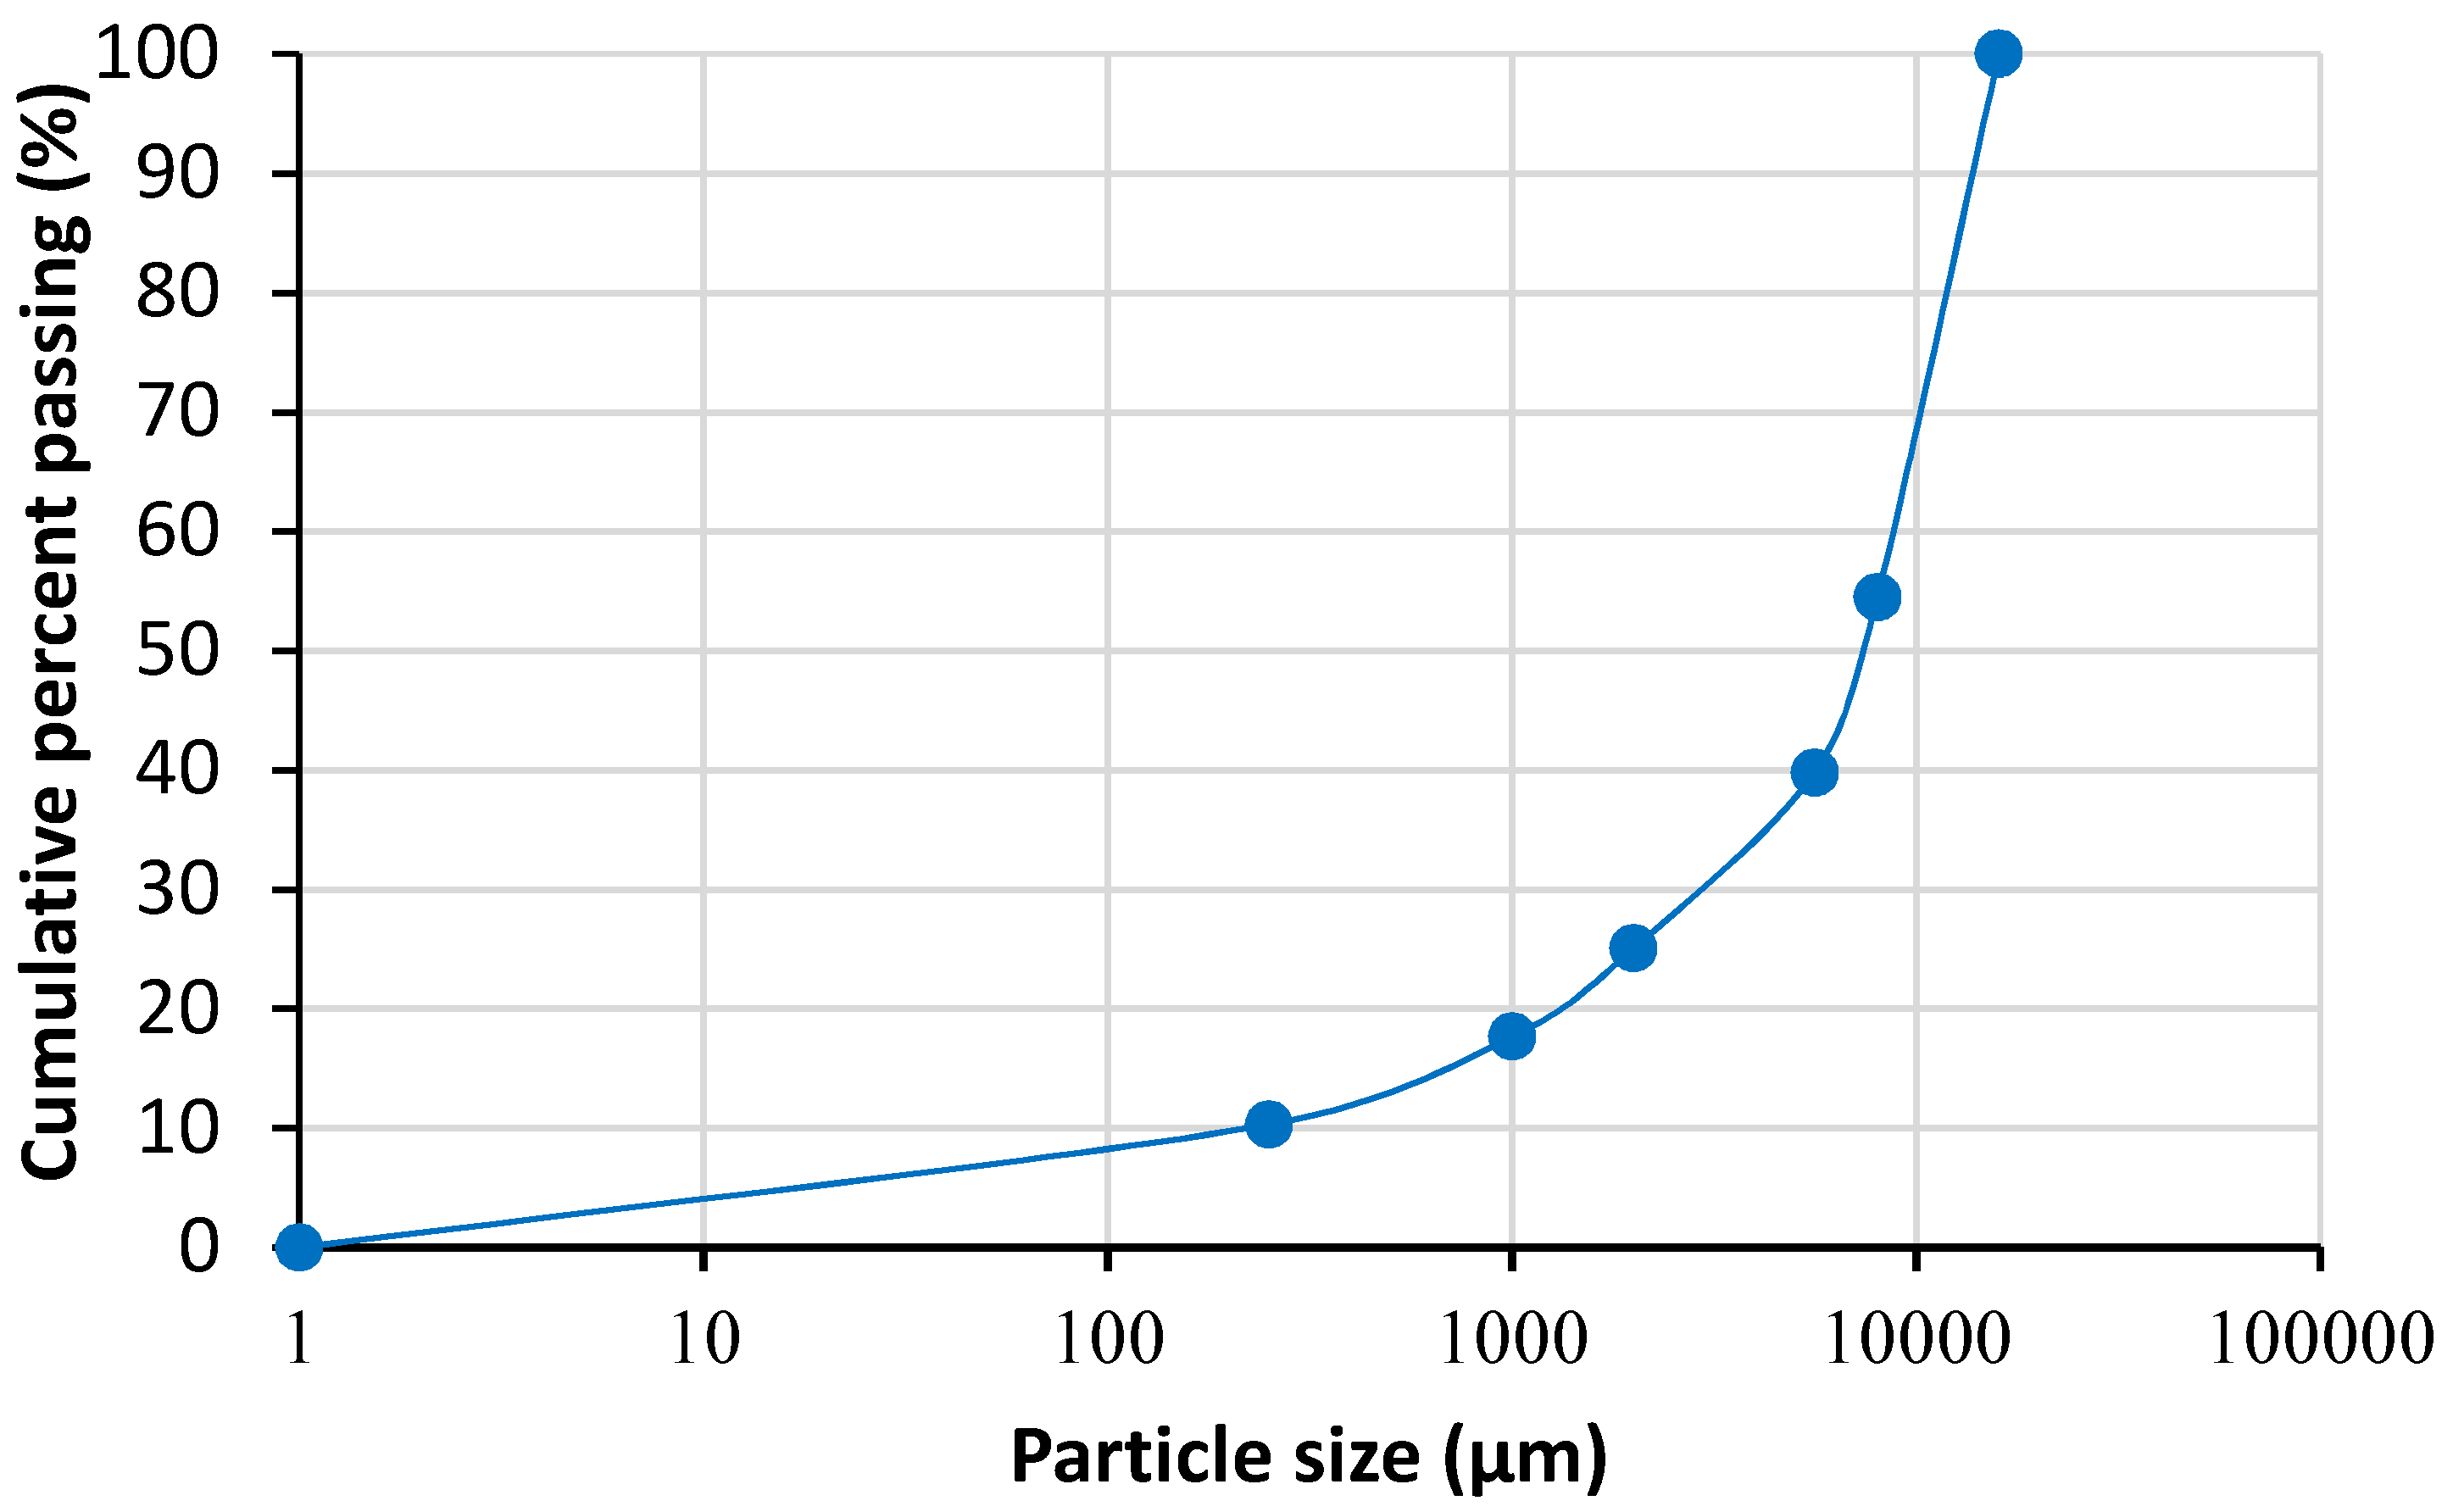
Figure 1. Particle size distributions of the chalcopyrite ore.
Minerals 10 00746 g001
Figure 2. Schematic of the 8 mini-column incubator from the front, side, and top views.
Minerals 10 00746 g002
Figure 3. Example X-ray micro-computed tomography (μCT) side and top views and a volume-rendered 3D view of a mini-column packed with the low-grade chalcopyrite ore. (a) side view in X and Z direction; (b)side view in Y and Z direction; (c) top view; (d) 3D volume.
Minerals 10 00746 g003
Figure 4. Comparison of the different segmentation methods to threshold target mineral grains. A (a) reference quantitative evaluation of minerals by scanning electron microscopy (QEMSCAN) image is used to (b) identify the target mineral grains identified. This was used as a comparison for the (c) original X-ray µCT image after having been segmented using (d) trainable Weka segmentation (TWS), (e) Max Entropy and (f) Interactive Thresholding modules.
Minerals 10 00746 g004
Figure 5. The 2D (a–c) and 3D (d–e) views of the segmented and labelled images of mineral grains. The (a) original X-ray grey level image has the mineral grains segmented in (b) and (d). Images (c) and (e) demonstrate the labelling of individual mineral grains.
Minerals 10 00746 g005
Figure 6. Procedure for the calculation of mineral grain distance from the ore surface. The (a) original image has (b) the column wall removed. The (c) solid ore was thresholded from the background and the (d) distance of each voxel from the ore surface was found. The (e) metal oxide/sulphide mineral grains were thresholded from (b), and mapped onto (d), to produce (f), which gave the distance map of the target mineral from the ore surface.
Minerals 10 00746 g006
Figure 7. Comparison of the pore distribution of the three ores at a different distance to the surface values. The uncertainty in the pore distance from the ore surface is ±40.2 µm.
Minerals 10 00746 g007
Figure 8. Comparison of the copper recovery measured by atomic adsorption spectrophotometer (AAS) (solid and dashed lines) and the oxide and sulphide mineral leached based on image measurement (green columns) for the malachite ore.
Minerals 10 00746 g008
Figure 9. The 3D views of the malachite copper mineral grain volumes in the 5 sections of the mini-column (from top to bottom) on days 0, 6, and 26.
Minerals 10 00746 g009
Figure 10. Change in the distance of mineral grains from the edge of the ore particle as a function of time for the malachite ore. The uncertainty in the grain distance from the ore surface is ±40.2 µm.
Minerals 10 00746 g010
Figure 11. The oxide and sulphide mineral leached at different distances against the average initial mineral grain size on days 6 and 26.
Minerals 10 00746 g011
Figure 12. Changes in the effluent (a) pH, (b) redox potential (mV), (c) ferrous ion (g L−1) and (d) ferric ion concentration (g L−1) for pyrite leaching at 37 °C () and 65 °C ().
Minerals 10 00746 g012
Figure 13. Comparison of iron recovery measured by spectroscopy (solid lines) and sulphide mineral leached based on image measurement (dashed lines) for the pyrite containing waste rock.
Minerals 10 00746 g013
Figure 14. Change in the distribution of sulphide minerals as a function of position and time for the waste rock containing pyrite at 37 and 65 °C. The uncertainty in the grain distance from the ore surface is ±40.2 µm.
Minerals 10 00746 g014
Figure 15. Change in the distribution of sulphide minerals as a function of position and time for the waste rock containing pyrite at 37 °C (the sum of three tracked sections). The uncertainty in the grain distance from the ore surface is ±40.2 µm.
Minerals 10 00746 g015
Figure 16. Change in the distribution of sulphide minerals as a function of position and time for the waste rock containing pyrite at 65 °C (the sum of three tracked sections). The uncertainty in the grain distance from the ore surface is ±40.2 µm.
Minerals 10 00746 g016
Figure 17. Comparison of the final iron recovery at different distances to the ore particle surface at 37 °C and 65 °C.
Minerals 10 00746 g017
Figure 18. Changes of the effluent (a) pH, (b) redox potential (mV), (c) ferrous ion (g L−1) and (d) ferric ion concentration (g L−1) for chalcopyrite leaching at 37 °C () and 65 °C ().
Minerals 10 00746 g018
Figure 19. Comparison of the copper recovery measured by AAS (solid lines) and the sulphide mineral leached based on image measurement (dashed lines) for chalcopyrite.
Minerals 10 00746 g019
Figure 20. Change in the distribution of sulphide minerals as a function of position and time for the chalcopyrite ore at 37 °C and 65 °C. The uncertainty in the grain distance from the ore surface is ±40.2 µm.
Minerals 10 00746 g020
Figure 21. Change in the distribution of sulphide minerals as a function of position and time for the chalcopyrite ore at 37 °C (the sum of three tracked sections). The uncertainty in the grain distance from the ore surface is ±40.2 µm.
Minerals 10 00746 g021
Figure 22. Change in the distribution of sulphide minerals as a function of position and time for the chalcopyrite ore at 65 °C (the sum of three tracked sections). The uncertainty in the grain distance from the ore surface is ±40.2 µm.
Minerals 10 00746 g022
Figure 23. Comparison of the copper recovery at different distance to surface values for the low-grade chalcopyrite ore.
Minerals 10 00746 g023
Figure 24. Example slices of the chalcopyrite leaching columns before and at the end of leaching at 37 °C and 65 °C, as evidence of crack development at the higher temperature.
Minerals 10 00746 g024
Table 1. Main gangue mineral constituents of the three ores.
ChalcopyritePyriteMalachite
MineralAmount (wt%)MineralAmount (wt%)MineralAmount (wt%)
Quartz37.6Quartz16.5Quartz76.8
Muscovite19.1Muscovite29.6Muscovite3.6
K-feldspar37.5Limonite5.0Fe–Ti oxide4.5
Other3.3Other9.7Other5.9
Table 2. Operating conditions of the mini-columns and feed solution characteristics.
Ore TypeFeedpHTemperature
MalachiteAcidified water1.2030 °C
PyriteFe3+ solution1.1537 °C
PyriteFe3+ solution1.1565 °C
ChalcopyriteFe3+ and Fe2+ solution1.1537 °C
ChalcopyriteFe3+ and Fe2+ solution1.1565 °C
Table 3. The total target mineral area, number of voxels and error compared to the QEMSCAN field image calculated for the different thresholding techniques.
Thresholding TechniqueArea (µm2)Number of PixelsError (%)
QEMSCAN10,490,42449895-
Weka segmentation10,764,53438,5982.62
Max Entropy12,727,44745,63621.32
Interactive Thresholding10,839,48838,8673.30