Article

Improving the Flocculation Performance of Clay-Based Tailings in Seawater: A Population Balance Modelling Approach

1
Water Research Center for Agriculture and Mining (CRHIAM), Concepción 4030000, Chile
2
Faculty of Engineering and Architecture, Universidad Arturo Prat, Almirante Juan José Latorre 2901, Antofagasta 1244260, Chile
3
Departamento de Ingeniería Química y Procesos de Minerales, Facultad de Ingeniería, Universidad de Antofagasta, Av. Angamos 601, Antofagasta 1240000, Chile
4
Escuela de Ingeniería Química, Pontificia Universidad Católica de Valparaíso, Valparaíso 2340000, Chile
5
Departamento de Ingeniería Metalúrgica y Minas, Universidad Católica del Norte, Antofagasta 1270709, Chile
6
Department of Mining, Geological and Cartographic Department, Universidad Politécnica de Cartagena, 30203 Murcia, Spain
*
Authors to whom correspondence should be addressed.
Minerals 2020, 10(9), 782; https://doi.org/10.3390/min10090782
Submission received: 1 July 2020 / Revised: 1 September 2020 / Accepted: 3 September 2020 / Published: 4 September 2020
(This article belongs to the Special Issue Cleaner Production in Mineral Processing)

Abstract

:
A population balance model described the flocculation of clay-based mining tailings in treated seawater with reduced magnesium content. For the treatment, 0.06 M of lime was added to the liquor, generating solid magnesium complexes that were subsequently removed by vacuum filtration. Magnesium content varied between 10–1440 ppm when mixing raw seawater with treated seawater. The aggregate size was analysed by the Focused Beam Reflectance Measurement (FBRM) technology. The model follows the dynamics of the aggregation-rupture and it provides a good approximation to the temporal evolution. A decrease in collision efficiency was implemented as an indicator of the polymer depletion, describing the size reduction. Lower magnesium content makes larger aggregates with a higher fractal dimension, but an increase in the concentration of clays reduces both the size of aggregates and the fractal dimension, indicating more open and porous structures, with higher permeability to the passage of fluid. The model efficiently illustrates the experimental data, with R-square (R2) greater than 0.9 and Goodness of Fit (GoF) greater than 95% in most cases, wherein the fitting parameters allowed for analysing the impact of magnesium and clays on the collision efficiency, collision frequency, and fragmentation rate. The model is predictive with few parameters, and it is potentially a powerful tool for water management optimisation.

1. Introduction

The efficient reuse of water within mining operations is key to ensuring the sustainability of industries whose deposits are located in arid areas. Some plants have limited access to freshwater and even compete with nearby populations that rely on agriculture, which has generated considerable economic, social, and environmental debates [1]. In this context, different strategies have been sought to face this challenge, whose efforts are focused on maximising the efficiency of the water recovering, especially in thickening stages, to later be used in upstream operations. Several thickening technologies include conventional, high-rate, high-density, and paste thickeners. All of them provide a discharge with different characteristics, especially in their solid concentration and rheological behaviour of thick slurries [2].
The thickeners concentrate the solids by promoting the mineral sedimentation, generating two output streams: (i) the underflow corresponding to a thickened tailings pulp, which is transported (usually by pumping) to the tailings storage facilities (TSF) and (ii) the overflow corresponding to clarified water, which is reused in upstream operations. The settling is accelerated through polymeric reagents, called flocculants, which are capable of adhering to several particles simultaneously, generating massive structures that settle due to gravitational effects [3]. The microscopic properties of these aggregates, such as their size and structure, largely determine the efficiency of the process and they are influenced by factors, such as the type of reagents, mineralogy of the deposits that usually involve a significant presence of clays, thickening technology, and industrial water quality. This last point is of particular importance in industries located near the sea coast, which have access to the use of seawater.
Although the use of seawater is expensive, it is a resource that has allowed the sustainability of several mining industries [4]. However, the challenges that are involved in the presence of salts are a recurring topic of research. The options are desalination by reverse osmosis [5,6] or using it directly as raw seawater [7,8]. In this study, we focus on the latter method, since it involves economic and environmental advantages by avoiding the construction of a desalination plant [9,10]. However, a highly saline environment leads to significant changes in the interaction forces between surfaces and reagents [11], causing operational challenges, mainly when the divalent ion precipitate under highly alkaline conditions. In this regard, several studies have shown how the solid complexes of divalent ions can damage the recovery of valuable minerals in the sulphide ore flotation [12,13] and the recovery of water from flocculated tailings [14]. Some treatments have been carried out in order to remedy the presence of these solid complexes. Recently, Jeldres et al. [15] used lime to remove magnesium cations, obtaining attractive sedimentation rates of tailings flocculated with anionic polyacrylamides, where the results were even better than at natural pH, which represents the current situation of operation in plants that use seawater [16]. Similarly, Arias et al. [17] proposed a biotechnological approach using a fluidized bed bioreactor (FBB) that was completed with halotolerant ureolytic strain Bacillus subtilis LN8B.
The flocculation performance fundamentally depends on the properties of the aggregate, like their size and structure. However, their characterization is quite complex, since most techniques, such as light diffraction or image analysis, require the sampling and dilution of the sample. An attractive technology is to quantify aggregate growth by the focused beam reflectance measurement (FBRM). The method is especially advantageous, because it allows measurements in-situ, without diluting the sample, avoiding sampling that can alter the aggregate and, therefore, can represent conditions similar to a feedwell of a thickener [18,19]. This methodology can reveal the evolution of size growths in flocculated systems, which is generally characterised by rapid growth until reaching a maximum and then a monotonous decrease due to the fragmentation of the structures until reaching a stationary value [20,21].
There have been many attempts to describe the properties of aggregates and the aggregation process through numerical methods techniques that are based on population balance models (PBM). This modelling at a simple one-dimensional level can not only provide valuable information on the factors influencing the performance of aggregation, but when incorporated into computational fluid dynamics (CFD), the combined predictions in three-dimensional flow patterns with growth and breakage can become a powerful tool for large-scale unit design and operation optimisation, such as for flocculation processes in mining thickeners [22,23]. Such outputs are now being used in order to generate the surrogate model as accurately as possible over the entire design space of interest using as few simulation points as possible: once built, the surrogate can be quickly reused for sensitivity analysis or control PBM is a model to describe aggregation that was proposed by Smoluchowski [24], which is useful for describing spherical structures that maintain their shape throughout the process; therefore, its application to irregular structures is limited. However, many researchers have implemented this method to describe the growth of particle aggregates by polymeric bridge mechanisms, which has forced the mathematical expressions to be modified to represent the different aggregation mechanisms better.
The physicochemical nature that controls the interactions between the reagents and particles is complex. Therefore, it is difficult to make a mathematical description that is based on fundamental principles, and many models require a high level of empiricism, seeking fitting parameters that allow for reconciling the model’s outcomes to the experimental data. This limits the range of validity of the equations, so their selection must be appropriate for the characteristics of the system. Researchers must know the main phenomena that are involved in the process to make an adequate representation [25,26], establishing the flocculation mechanisms (coagulation, bridge flocculation, permeability and breakage of the aggregate structure, etc.), as well as the critical conditions, like flow regime, particle size, and solids concentration.
The fractal dimension represents the structure of aggregates. This parameter is interesting, because it informs about the structural changes that arise during the process, which, depending on the system conditions, have shown that the aggregates can follow compaction [27,28], keep their shape constant [29,30], or generate a more open and porous arrangement as the process progresses [31]. Recently, Quezada et al. [31] showed that the aggregates of mine tailings flocculated with high molecular weight anionic polyacrylamides could preserve their structure when the shear rate is less than 200 s−1. Under these conditions, the fractal dimension may be considered to be constant. This finding is essential for the purpose of the present study, which recognises an experimental system that is similar to that worked by Quezada et al. [31].
In the present study, the population balance models were used to describe the flocculation of clay-based tailings in seawater, when considering the mixing conditions during the flocculation that are similar to an industrial thickener feedwell [32]. The flocculation assays were done in treated seawater, with the removal of magnesium ions to improve the recovery of water from mining tailings, which is then recycled in upstream operations, reducing the required hydric make-up. However, the treated seawater was mixed with raw seawater at different proportions to control the magnesium concentration in liquor. The model parameters allow for investigating the main phenomena of aggregation and fragmentation, as well as intrinsic properties of the aggregates, like their permeability. The effect of magnesium concentration in the liquor and clay content in the tailings were analysed at high pH, which is a condition that the copper mining industry seeks to operate in a sustainable way.

2. Materials and Methods

2.1. Materials

Seawater was obtained from San Jorge Bay in Antofagasta (Chile), and it was filtered using a UV filter system (1 μm) to eliminate all bacterial activity. The chemical conductivity was 50.3 mS/cm, while its ionic composition was determined with different methods, depending on the type of ion analysed. The following composition Na+ 10.8 g/L, Ca2+ 0.42 g/L, Mg2+ 1.41 g/L, and K+ 0.4 g/L was obtained by atomic absorption spectrometry. The composition of Cl was determined using the argentometric method, which was 19.6 g/L, while the HCO3 concentration was determined by acid-base volumetry, whose value was 0.15 g/L.
The synthetic tailings were composed of quartz and kaolin that were obtained from Donde Capó and Ward’s Science, respectively. XRD analysis determined 99% of purity for quartz, and kaolin was composed by kaolinite with impurities of quartz and halite. A high molecular weight anionic polyacrylamide (SNF704) that was provided by SNF Chile S.A. was used. This reagent has a molecular weight greater than 18 × 106 Da. High purity lime was used to form the magnesium precipitates in the seawater treatment.

2.2. Seawater Treatment

The treatment of seawater consisted of removing the magnesium ions before their application in the flocculation process. For this, lime was added at a concentration of 0.06 M, which generated a highly alkaline environment that favoured the formation of solid magnesium complexes, which were then removed by vacuum filtration. The magnesium concentration was measured by inductively coupled plasma mass spectrometry (ICP-MS, Varian 220 FS Atomic Absorption Spectrophotometer, Varian, Palo Alto, CA, USA) and it was less than 10 g/L. Flocculation tests were performed at different magnesium levels, which were controlled by mixing row seawater with treated seawater at different proportions.

2.3. Flocculation Tests

The suspension was prepared in two steps: (i) adding 39 g of solid mineral to a fixed amount of seawater (231 g) to achieve a suspension mass of 270 g and (ii) adding the flocculant solution (30 g) until obtaining 15 g/t and the volume of remaining water to reach 300 g. For this, a 1 L capacity flocculating vessel, 100 mm in diameter, and a 30 mm diameter turbine impeller at the end of a vertical axis (4 mm diameter) were used to keep the particles suspended. This methodology ensured the same concentration of solids (13 wt%) for all flocculation experiments. The base of the impeller was placed 20 mm above the bottom surface of the container. The liquid composed of a mixture of treated and raw seawater was mixed with the synthetic tailings at 600 rpm for five minutes, and the pH was regulated to 11 with sodium hydroxide. After this time, the stirring was reduced to 180 rpm and the flocculant was added.
The evolution of the average floc size was measured with the FBRM system (Particle Track E25, Mettler Toledo, Greifensee, Switzerland), which consists of a processing unit and a probe with a 19 mm diameter tip that has a window of sapphire (14 mm diameter) at the end. The probe was vertically inserted into the reaction vessel, and the aggregate characterisation continued. Initially, the data of the non-flocculated suspension were obtained, but then the flocculant was added, and the measurement was continued for 2 min. Full chord length distributions (0.25 to 1000 μm, 100 logarithmically distributed channels) were recorded every 2 s. As our previous work [31], we found that time has little effect on fractal dimension when shear rate is below 200 s−1 and, therefore, this can be constant over the process. At the same time, a suspension was flocculated for two minutes, to later allow it to settle. This allowed for obtaining the fractal dimension by applying the methodology that was proposed in Heath et al. [20]. The authors used the hindered settling rate from the sedimentation tests and the size of the aggregates from the FBRM probe.

2.4. PBM Modelling

The population balance model has been described in our previous works [31,33,34]. Here the flocculation kinetics of the structures by polymeric bridge were considered with different physical phenomena such as the growth and rupture of fractal aggregates. We evaluated the fracture as a result of mixing the pulp with the flocculant. The effect of polymer wear was considered, which means a gradual loss of collision efficiency.
The equations are based on the particle size discretization following a geometric progression for the particle volume V i + 1 = 2 V i . The principal equation of PBM is given by:
d N i d t = j = 1 i 2 2 j ( i 1 ) Q i 1 , j N i 1 N j + 1 2 Q i 1 , j 1 N i 1 N i 1 j = 1 i 1 2 j i Q i , j N i N j j = 1 i m a x 1 Q i , j N i N j S i N i + j = 1 i m a x 2 Γ i , j S j N j
Q i , j = β i , j α i , j
In Equation (1), N i is the number concentration of the aggregates in bin i , whereas N 1 is the number concentration of primary particles in bin 1. Every term on the right of the equation represents a physical process:
  • The first and second terms describe the aggregate formation of size i from smaller aggregates.
  • The third and fourth terms describe the aggregation death of size i to higher aggregates.
  • The fifth term represents the breakage formation of size i from the rupture of a higher aggregate.
  • The sixth term represents the breakage death of size i by creating smaller aggregates.
  • The superscript max1 is the maximum number of intervals used to represent the complete aggregate size spectrum; max2 corresponds to the largest interval from which the aggregates in the current range are produced.

2.4.1. Aggregation Kernel

For the collision efficiency α, we use an expression to represent the effect of high-weight polymers; this is the polymer depletion, and it rearranges on the adsorbed surface of the particles given by the work of Vajihinejad and Soares [30]. For the collision frequency β, our previous works had been using the related equations from Li & Logan [35] by incorporating a dimensionless term that accounts for the permeability effects. We have found out that for our systems fractal dimension and aggregate grow to behave differently than is proposed by the fluid collection efficiency η. The η parameter is related to permeability effects. Therefore, low fractal dimension gives full collision frequencies values for larger sizes, and this means that the parameter η promote big sizes for small fractal dimensions. For our cases, when a low fractal dimension is found, the aggregates grow very little, and the model equations cannot follow this trend. Because of that, slow or none convergence are obtained by this approach. We propose a dimensionless function where at low d f smaller sizes are prioritized promoted and for higher d f the larger sizes also are considered. A simple decay gaussian-like function was fitted for our system:
f i = exp ( ( i 1 ) 2 K k d f 4 )
In this case, this expression is related to the size index i and the fractal dimension only, and a fixed constant K k .

2.4.2. Breakage Kernel

The breakage rate S is difficult to predict, since there is no fundamental theory that can describe it, so the function is usually fitted to the size distribution data. For this, we used the expression of Pandya and Spielman [36]. The distribution breakage Γ was described by a binary distribution that means an aggregate break into two pieces of equal mass.

2.4.3. Model Expressions

Table 1 summarized the expression that is used for every variable in the Equation (1) and the input data used in PBM modelling. For the dimensionless frequency function, the constant K k was set as 25 for all experiments, which give optimal results for these systems. The initial number concentration is calculated from the volume distribution data v ( d i ) , the volume of every particle V i , and the initial volume fraction ϕ . A modification is done concerning the methodology that is presented in previous works [31,33] is the choice of the size of the primary particle ( d 0 ). Although the probe does not capture sizes smaller than 1 µm in terms of construction of the size vectors, it generates a set of diameters capable of capturing the slight variations that occur for cases where the fractal dimension is low. As stated in Table 1, when the fractal dimension is higher than 1.7, d 0 is 1 µm, but for fractal dimension lower than 1.7, d 0 is 0.1 µm. Particle volume is calculated based in the d 0 assuming a sphere particle. Table 1 also includes the calculation of shear rate, where N p is the impeller power number (0.6 in our case for a plane disk with gentle agitation [37]), N is the rotation speed, and D and V are the diameter of the impeller and the volume of the vessel, respectively. The density of the suspension also need calculation, where w is the solid mass fraction of the solution, ρ s and ρ w are the solid and water density. Finally, the viscosity of the solution μ s u s is measured experimentally. We have included porosity and permeability expressions for calculating these properties over time, we use a C equal to 0.65 following a compact body-centered cubic (bcc) configuration.

2.4.4. Model Optimisation

We used a solver based on the numerical differentiation formula for stiff ODEs (ode15s or ode23s depending on the accuracy required) in MATLAB (version R2018a) to resolve the PBM in Equation (1). This step was to obtain unique model outputs by optimising some parameters with the expressions in Table 2. The optimised parameters (or fitted parameters) then can be utilised for prediction. The optimisation was performed with the MATLAB function fminsearch, which uses the Nelder–Mead direct search to find the minimum in an unconstrained multivariable function. Table 2 summarized the expression used to optimise the PBM equation to the experimental data. The objective function relates the experimental diameter d e x p with the model volume-based diameter d m o d (see Table 2). FBRM provides a distribution of particle chords, unlike a normal distribution based on diameters, however, Heath et al. [19] proved that the mean or mode averages of the square weighted chord lengths are comparable to conventional sizing over the range from 50 to 400 μm that is in the range of our study. Two criteria validate the model’s fit: the coefficient of determination ( R 2 ), which measures the closeness of the model values to the experimental values, and the goodness of fit that measures whether the model is capable of predicting the behaviour of the data. A GoF of 90% or higher means that the proposed model can predict the flocculation kinetics. In the GoF, a standard error is required; in Table 2 it is shown the equation where n is the number of data values and f is the number of parameters to be fitted.
Finally, the conservation of the total volume of particles is verified after every integration to ensure that the simulations maintain the particle population.

3. Results

3.1. Fractal Dimension and Initial Volume Distribution

The fractal dimension and the distribution of initial volumes are plotted in Figure 1 at different proportions of quartz/kaolin and treated seawater/raw seawater. When 100% is reported, it indicates that the liquid is composed only of treated seawater (Mg2+ 10 mg/L), but when 0% is reported, it corresponds to raw seawater (Mg2+ 1420 mg/L). The fractal dimension increases by increasing the proportion of treated water, which is directly related to a lower presence of solid magnesium complexes that affect the selectivity of the flocculant [14]. Interestingly, the presence of kaolin also leads to more open and porous aggregates, lowering the fractal dimension. This can be accounted for the affinity that flocculant has toward solid magnesium complexes and the fine nature of kaolin. When both are present, the polymer adsorption is stable on their surfaces, making branched aggregates. When magnesium and/or kaolin diminished, the aggregates are mainly composed by quartz, where the polymer affinity is lower, creating spherical-like structures.
The initial particle size distribution also showed sensitivity to the type of water. While the proportion of treated water increases, the average size of flocculant-free aggregates decreases, which indicates that magnesium and their complexes contribute to particle coagulation.

3.2. Flocculation Kinetics

In the study of Ramos et al. [14], it was shown that the formation of solid magnesium complexes at alkaline pH substantially damage the flocculation performance. The authors suggested that these precipitates have a high affinity for the polyelectrolyte, generating selectivity issues, wherein the molecules tend to go to the surface of the magnesium precipitates. Those outcomes agree with the results of this work: while the proportion of treated seawater (TSW) increase (lower magnesium level), more prominent structures are generated (see Figure 2).
This course is repeated for the three types of synthetic tailings, which vary in clay content. As expected, increasing the kaolin concentration causes a reduction of the aggregate sizes. For example, for a 50/50 of quartz/kaolin ratio, a peak of 220 µm is observed, while, for 75/25, the maximum size was around 290 µm. For pure quartz, the peak was around 350 µm. Clays are fine minerals with a heterogeneous surface of high surface area [41]. This leads to higher flocculant consumption and lowers sedimentation rates [42,43]. Overall, the aggregates formed with treated seawater achieve a higher size with higher fractal dimension. This cause more compacted and less impervious structures.

3.3. Optimized PBM Model Parameters

The curves obtained after the optimisation were plotted together with the experimental data in Figure 2. The model is capable of correctly describing the kinetics for all of the conditions analysed. In most cases, the GoF presents values higher than 95%, which shows its effectiveness in capturing the trend of the experimental data. Likewise, most of the cases R2 are higher than 0.95, so the model provides little deviation concerning the experimental results (Table 3).
Finally, referring to the fitting constants, these were plotted in Figure 3 for the aggregation kernel and Figure 4 for the fragmentation kernel. When observing the constants α m a x in Figure 3, it can be seen that the higher the percentage of treated seawater (TSW), the constant increases in a direct proportion, but the behaviour is contrary to increasing the kaolin concentration. A similar trend presents the constant α m i n . In the case of 100/0 appears the most significant difference regarding α m a x , while for the other types of tailings, the values are similar. When considering the constant k d that represents the decay of the collision efficiency ( α ) in the aggregation kernel, it is observed from Figure 3 that the continuous decreases for a higher proportion of treated water, especially when the amount is higher than 75%, which would represent a magnesium content of less than 0.4 g/L. This indicates that the presence of magnesium leads to a further reduction in collision efficiency as the process proceeds. The presence of kaolin causes the collision efficiency to be reduced with less intensity; however, the coefficients α m a x and α m i n are lower as compared to the clay-free case.
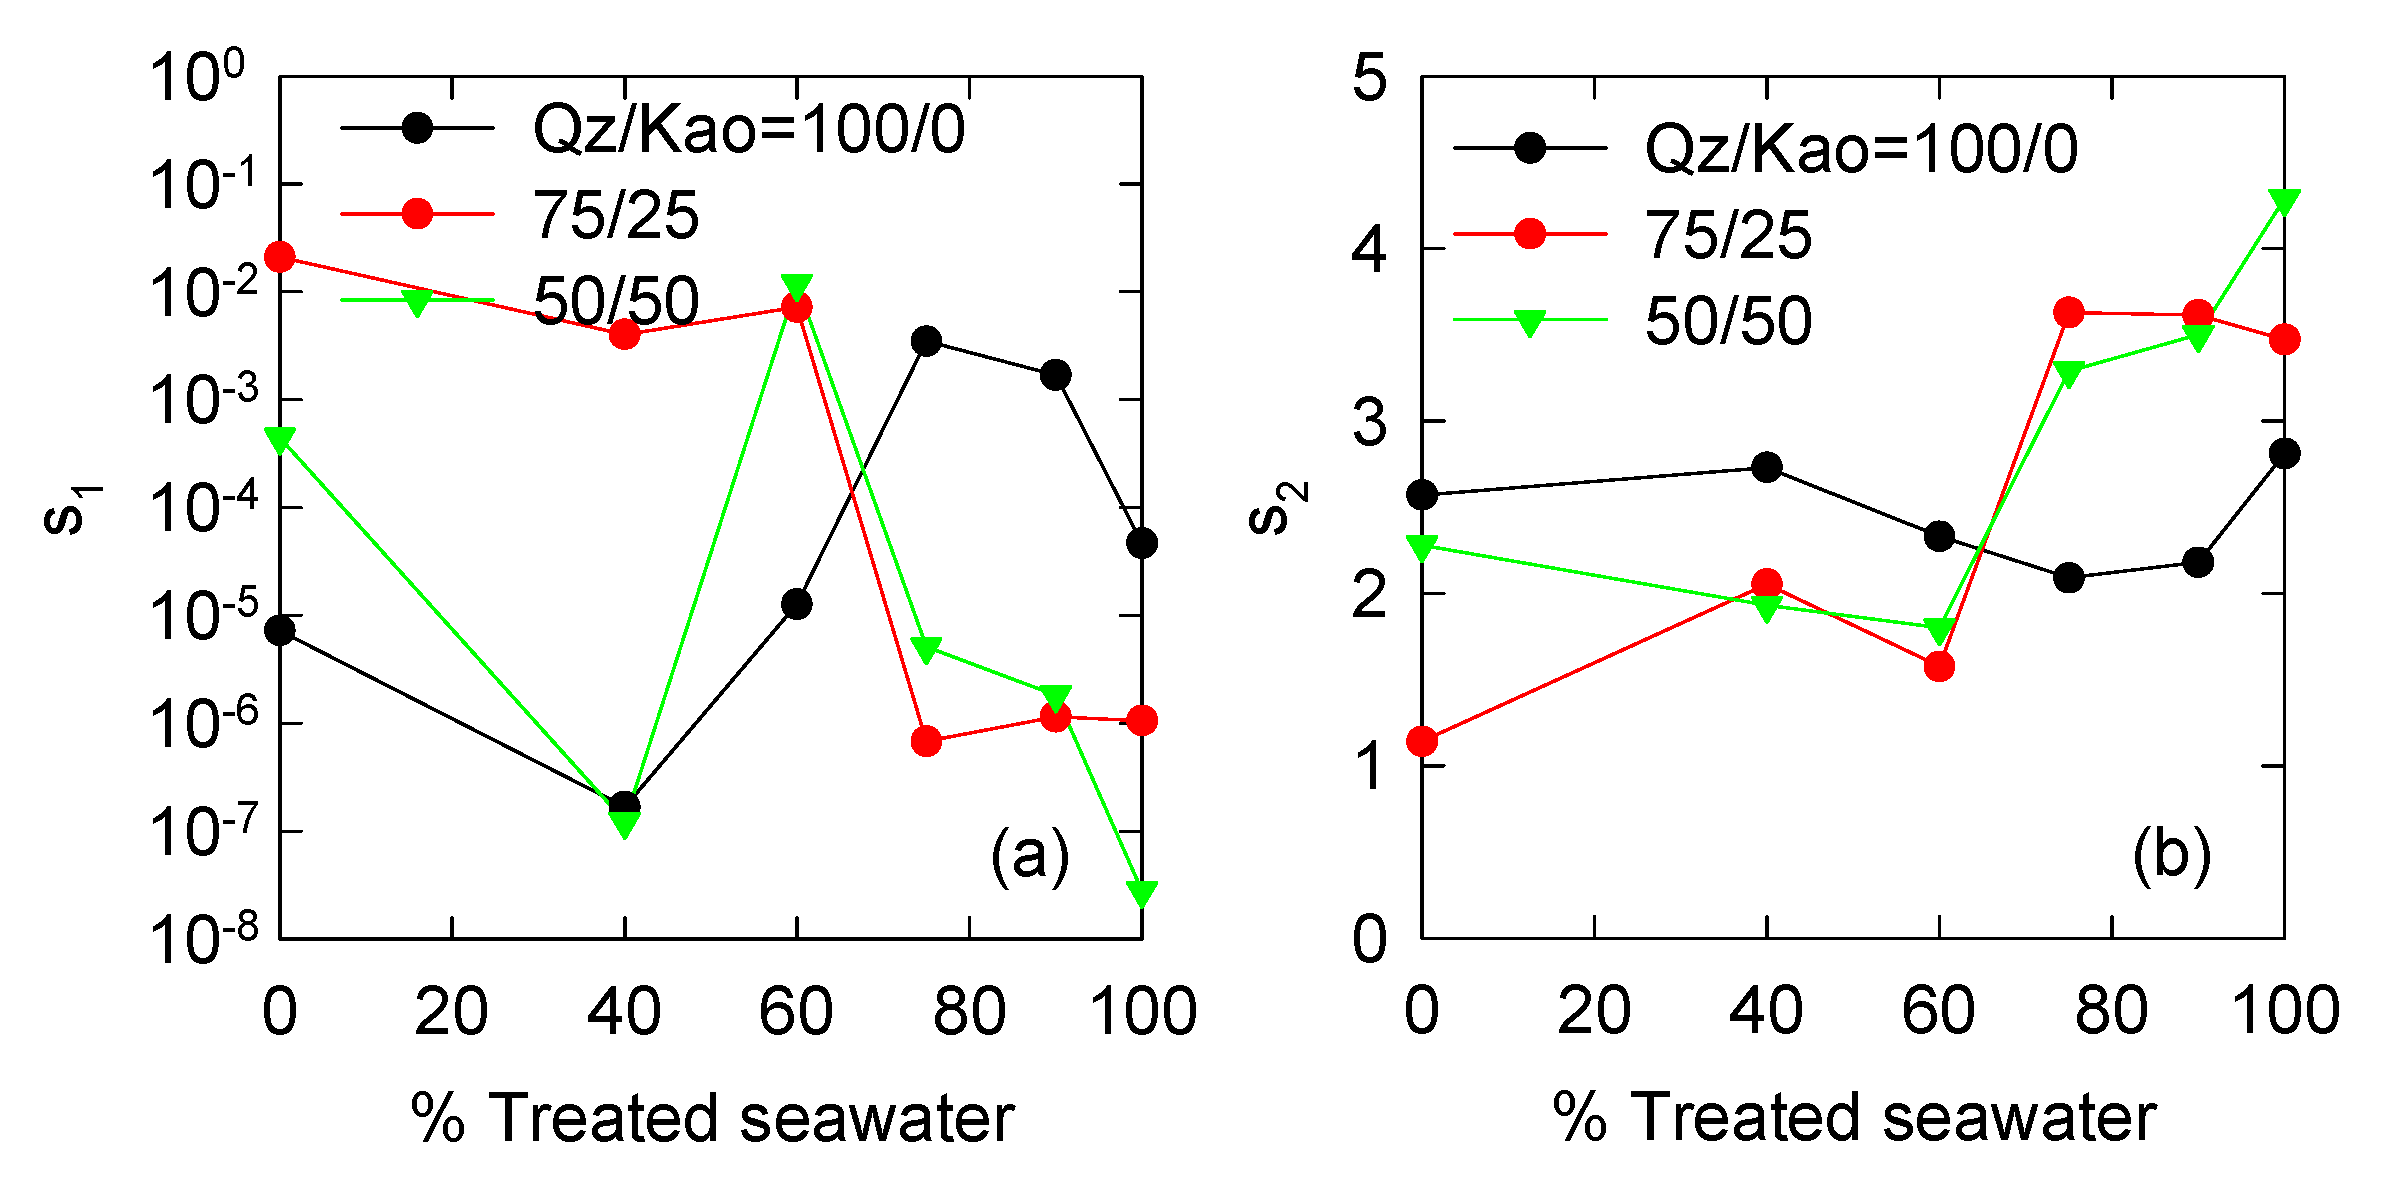
Figure 4 describes the breakage parameters, s1 and s2. The higher these parameters, the structure presents a greater willingness to fragment. There is a particular trend for the studied systems, showing that the aggregation kernel dominates the kinetics and, therefore, there is more noise in the patterns of s1. Even so, it is inferred that the higher the magnesium content, the greater the fragmentation. The result is satisfying, since the structures are considerably smaller; however, the low fractal dimension suggests open and porous structures, which are more prone to fragmentation.

3.4. Physical Parameters Calculations

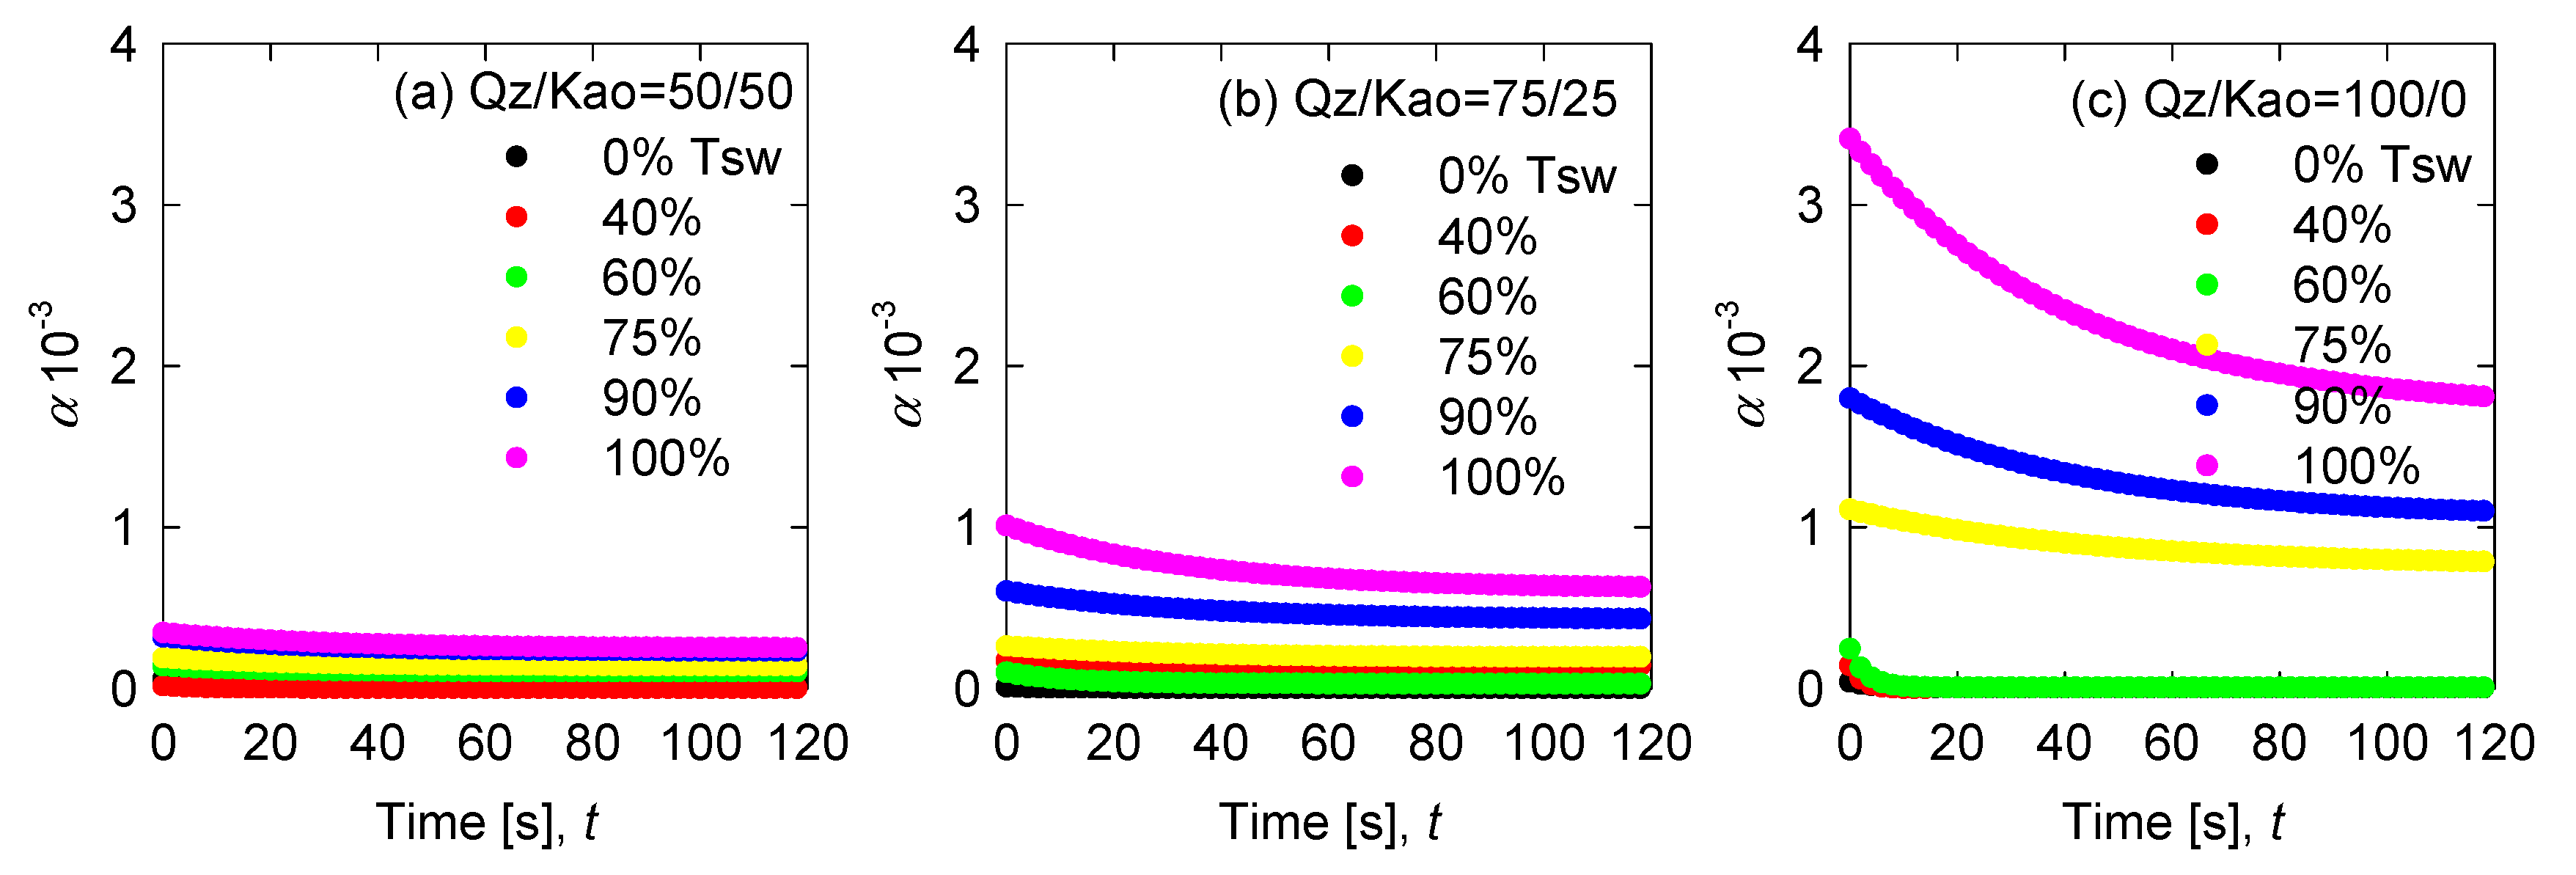
In this section, the calculation of the physical parameters derived from PBM modelling is discussed. Figure 5 shows the evolution of collision efficiency. A higher proportion of kaolin reduces collision efficiency since it is naturally expected to require higher flocculant doses to keep acceptable flocculation. Furthermore, the collision efficiency is more significant when there is a greater magnesium removal. From this, it is observed that both kaolin and magnesium precipitates have similar effects in hindering particle aggregation. The collision frequency (Figure 6) shows similar outcomes to the collision efficiency. A higher proportion of treated water (less magnesium) and a lower percentage of kaolin increase the contact between the particles and aggregates.
The fragmentation rate (Figure 7) indicates that the three types of tailings generate similar fragmentation patterns when the proportion of treated water is high (treated water over 75%). In general, the rupture of the structures is higher, which would be influenced by the larger size of the aggregates, since their breakage is in direct proportion to the diameter (see Table 1). There is no clear trend between fragmentation and water type, but it must be considered that the fragmentation of the aggregate is determined by variables, such as its resistance, which does not necessarily follow a monotonous law regarding the amount of magnesium in seawater. It appears that the flocs most prone to breakage are those formed in seawater of ‘best quality’ (lower magnesium concentration), since the aggregates are considerably larger than in the other conditions. These trends would probably be cleaned up by considering a more robust expression to describe the fragmentation of aggregates, which directly includes the resistance of the structures. Unfortunately, that expression is not available in the literature.
Finally, the permeability was determined with the expressions of Li & Logan [35], when considering the average size over time (Figure 8). A maximum is observed when the percentage of treated water is around 60–75%. This is explained, because two phenomena compete, on the one hand, the average diameter increases with the proportion of treated water, but at the same time the fractal dimension decreases, which contribute to the appearance of an area that maximises the fragmentation rate. Besides, the increase in clays generates an increase in the permeability of the aggregate, with more open and porous structures.

3.5. Modelling Validation

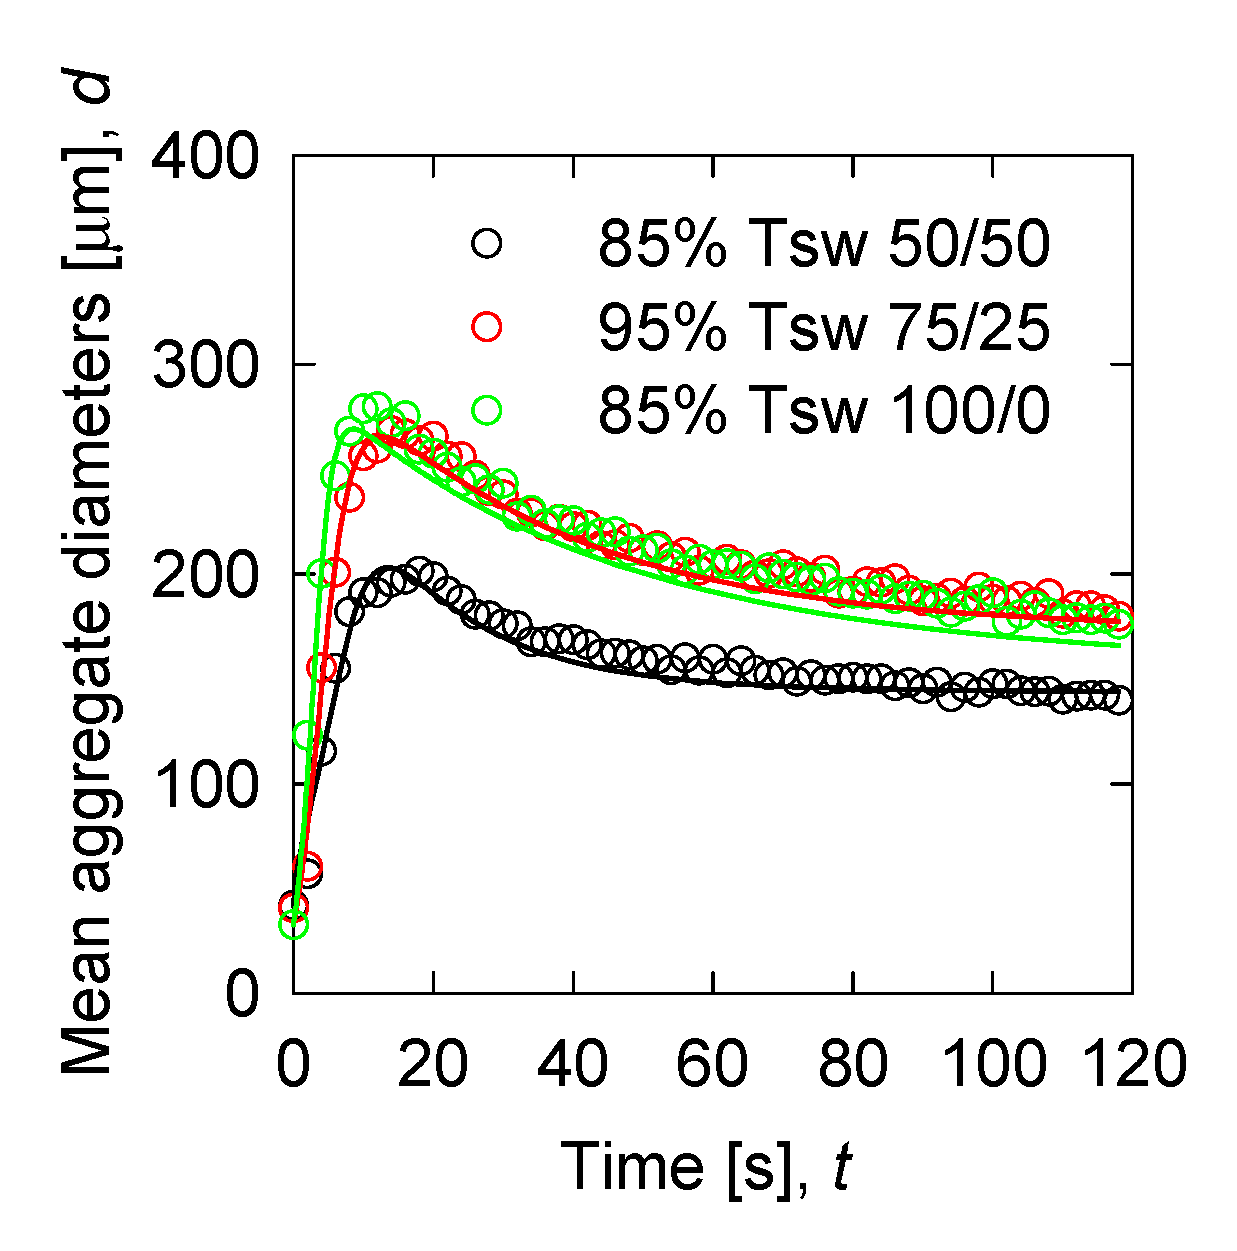
Figure 9 gives the experimental results and model prediction of the flocculation of synthetic tailings with different proportions of quartz/kaolin and treated water/seawater. The amount of magnesium in the liquid was lower than 210 ppm, thus offering an attractive condition for flocculation. This amount is insufficient to form solid complexes at pH 11 that alter the behaviour of the flocculant, obtaining a peak size of around 200 μm for the system composed by quartz/kaolin 50/50 (85% of treated seawater), while, for quartz/kaolin 100/0 (85% of treated seawater), the peak was over 270 μm. The required fitting parameters were interpolated, according to the data from Figure 4 and Figure 5. Subsequently, the values used for these particular systems and the descriptors GoF and R2 are listed in Table 4.

4. Conclusions

A population balance model was used to describe the flocculation of clay-based tailings in treated seawater with reduced magnesium content. For the treatment, 0.06 M of lime was added to the seawater, generating solid complexes that were subsequently removed by vacuum filtration. The model follows the dynamics of the processes of aggregation and rupture and it provides a good approximation to the temporal evolution of size. The aggregates increase until reaching a peak after a few seconds of flocculation. A decrease in collision efficiency was implemented as an indicator of the polymer depletion. Lower magnesium content generated larger aggregates with a higher fractal dimension. An increase of clays reduces both the size and fractal dimension, indicating the formation of more open and porous structures, with higher permeability to the passage of fluid. The outcomes of the model efficiently describe the experimental data, with R2 values that are greater than 0.9 and GoF greater than 95% in most cases, wherein the analysis of the fitting parameters suggests that, by reducing the magnesium content, there is greater efficiency of particle collision and a greater collision frequency, as a result of the greater radius of gyration of the aggregates. However, fragmentation rates are slightly higher, especially since larger structures are more prone to breakage.

Author Contributions

Conceptualization, G.R.Q. and R.I.J; methodology, M.J.; software, G.R.Q.; validation, M.J., P.R., D.T., and N.T.; formal analysis, G.R.Q. and R.I.J.; resources, R.I.J. and G.R.Q.; data curation, M.J.; writing—original draft preparation, G.R.Q.; writing—review and editing, G.R.Q., M.J., P.R., N.T., D.T., R.I.J.; funding acquisition, R.I.J. All authors have read and agreed to the published version of the manuscript.

Funding

This research was funded by ANID PIA ACM 170005 and the Centro CRHIAM Project Anid/Fondap/15130015.

Acknowledgments

R.I.J. is grateful for the support of ANID PIA ACM 170005. G.R.Q. thanks ANID FONDECYT 3200978. G.R.Q. and R.I.J. are grateful for the support of Centro CRHIAM Project Anid/Fondap/15130015. P.R. thanks the Pontificia Universidad Católica de Valparaíso for the support provided. M.J. acknowledge the infrastructure and support of the Programa de Doctorado en Ingeniería de Procesos de Minerales of the Universidad de Antofagasta.

Conflicts of Interest

The authors declare no conflict of interest.

References

  1. Northey, S.A.; Mudd, G.M.; Saarivuori, E.; Wessman-Jääskeläinen, H.; Haque, N. Water footprinting and mining: Where are the limitations and opportunities? J. Clean. Prod. 2016, 135, 1098–1116. [Google Scholar] [CrossRef]
  2. Wang, C.; Harbottle, D.; Liu, Q.; Xu, Z. Current state of fine mineral tailings treatment: A critical review on theory and practice. Miner. Eng. 2014, 58, 113–131. [Google Scholar] [CrossRef]
  3. de Kretser, R.; Scales, P.J.; Boger, D.V. Improving clay-based tailings disposal: Case study on coal tailings. AIChE J. 1997, 43, 1894–1903. [Google Scholar] [CrossRef]
  4. Cisternas, L.A.; Gálvez, E.D. The use of seawater in mining. Miner. Process. Extr. Metall. Rev. 2018, 39, 18–33. [Google Scholar] [CrossRef]
  5. Belessiotis, V.; Kalogirou, S.; Delyannis, E.; Belessiotis, V.; Kalogirou, S.; Delyannis, E. Water, the raw material for desalination. Therm. Sol. Desalin. 2016, 21–102. [Google Scholar] [CrossRef]
  6. Sadhwani, J.J.; Veza, J.M.; Santana, C. Case studies on environmental impact of seawater desalination. Desalination 2005, 185, 1–8. [Google Scholar] [CrossRef]
  7. Jeldres, R.I.; Forbes, L.; Cisternas, L.A. Effect of seawater on sulfide ore flotation: A review. Miner. Process. Extr. Metall. Rev. 2016, 37, 369–384. [Google Scholar] [CrossRef]
  8. Hernández, P.; Taboada, M.; Herreros, O.; Graber, T.; Ghorbani, Y. Leaching of chalcopyrite in acidified nitrate using seawater-based media. Minerals 2018, 8, 238. [Google Scholar] [CrossRef] [Green Version]
  9. Cornejo, P.K.; Santana, M.V.E.; Hokanson, D.R.; Mihelcic, J.R.; Zhang, Q. Carbon footprint of water reuse and desalination: A review of greenhouse gas emissions and estimation tools. J. Water Reuse Desalin. 2014, 4, 238–252. [Google Scholar] [CrossRef]
  10. Cambridge, M.L.; Zavala-Perez, A.; Cawthray, G.R.; Statton, J.; Mondon, J.; Kendrick, G.A. Effects of desalination brine and seawater with the same elevated salinity on growth, physiology and seedling development of the seagrass posidonia australis. Mar. Pollut. Bull. 2019, 140, 462–471. [Google Scholar] [CrossRef]
  11. Israelachvili, J. Intermolecular and Surface Forces, 3rd ed.; Elsevier: Santa Barbara, CA, USA, 2011; ISBN 9780123919274. [Google Scholar]
  12. Qiu, Z.; Liu, G.; Liu, Q.; Zhong, H. Understanding the roles of high salinity in inhibiting the molybdenite flotation. Colloids Surf. A Physicochem. Eng. Asp. 2016, 509, 123–129. [Google Scholar] [CrossRef]
  13. Li, W.; Li, Y.; Wei, Z.; Xiao, Q.; Song, S. Fundamental studies of shmp in reducing negative effects of divalent ions on molybdenite flotation. Minerals 2018, 8, 404. [Google Scholar] [CrossRef] [Green Version]
  14. Ramos, J.; Leiva, W.H.; Castillo, C.; Ihle, C.F.; Fawell, P.D.; Jeldres, R.I. Seawater flocculation of clay-based mining tailings: Impact of calcium and magnesium precipitation. Miner. Eng. 2020, 154, 106417. [Google Scholar] [CrossRef]
  15. Jeldres, M.; Piceros, E.C.; Toro, N.; Robles, P.; Nieto, S.; Quezada, G.R.; Jeldres, R.I. Enhancing the sedimentation of clay-based tailings in seawater by magnesium removal treatment. Sep. Purif. Technol. 2020, 116762. [Google Scholar] [CrossRef]
  16. Castellón, C.I.; Piceros, E.C.; Toro, N.; Robles, P.; López-Valdivieso, A.; Jeldres, R.I. Depression of pyrite in seawater flotation by guar gum. Metals 2020, 10, 239. [Google Scholar] [CrossRef] [Green Version]
  17. Arias, D.; Villca, G.; Pánico, A.; Cisternas, L.A.; Jeldres, R.I.; González-Benito, G.; Rivas, M. Partial desalination of seawater for mining processes through a fluidized bed bioreactor filled with immobilized cells of bacillus subtilis LN8B. Desalination 2020, 482, 114388. [Google Scholar] [CrossRef]
  18. Biggs, C.A.; Lant, P.A. Activated sludge flocculation: On-line determination of floc size and the effect of shear. Water Res. 2000, 34, 2542–2550. [Google Scholar] [CrossRef]
  19. Heath, A.R.; Fawell, P.D.; Bahri, P.A.; Swift, J.D. Estimating average particle size by focused beam reflectance measurement (FBRM). Part. Part. Syst. Charact. 2002, 19, 84. [Google Scholar] [CrossRef]
  20. Heath, A.R.; Bahri, P.A.; Fawell, P.D.; Farrow, J.B. Polymer flocculation of calcite: Experimental results from turbulent pipe flow. AIChE J. 2006, 52, 1284–1293. [Google Scholar] [CrossRef]
  21. Owen, A.T.; Fawell, P.D.; Swift, J.D.; Labbett, D.M.; Benn, F.A.; Farrow, J.B. Using turbulent pipe flow to study the factors affecting polymer-bridging flocculation of mineral systems. Int. J. Miner. Process. 2008, 87, 90–99. [Google Scholar] [CrossRef]
  22. Nguyen, T.; Farrow, J.; Smith, J.; Fawell, P. Design and development of a novel thickener feedwell using computational fluid dynamics. J. South. Afr. Inst. Min. Metall. 2012, 112, 105–119. [Google Scholar]
  23. Ebrahimzadeh Gheshlaghi, M.; Soltani Goharrizi, A.; Aghajani Shahrivar, A. Simulation of a semi-industrial pilot plant thickener using CFD approach. Int. J. Min. Sci. Technol. 2013, 23, 63–68. [Google Scholar] [CrossRef]
  24. Von Smoluchowski, M. Versuch einer mathematischen theorie der koagulationskinetik kolloider Lösungen. Z. Phys. Chem. 1917. [Google Scholar] [CrossRef] [Green Version]
  25. Jeldres, R.I.; Fawell, P.D.; Florio, B.J. Population balance modelling to describe the particle aggregation process: A review. Powder Technol. 2018, 326, 190–207. [Google Scholar] [CrossRef]
  26. Thomas, D.N.; Judd, S.J.; Fawcett, N. Flocculation modelling: A review. Water Res. 1999, 33, 1579–1592. [Google Scholar] [CrossRef]
  27. Selomulya, C.; Bushell, G.; Amal, R.; Waite, T.D. Understanding the role of restructuring in flocculation: The application of a population balance model. Chem. Eng. Sci. 2003, 58, 327–338. [Google Scholar] [CrossRef]
  28. Antunes, E.; Garcia, F.A.P.; Ferreira, P.; Blanco, A.; Negro, C.; Rasteiro, M.G. Modelling PCC flocculation by bridging mechanism using population balances: Effect of polymer characteristics on flocculation. Chem. Eng. Sci. 2010, 65, 3798–3807. [Google Scholar] [CrossRef]
  29. Heath, A.R.; Bahri, P.A.; Fawell, P.D.; Farrow, J.B. Polymer flocculation of calcite: Population balance model. AIChE J. 2006, 52, 1641–1653. [Google Scholar] [CrossRef]
  30. Vajihinejad, V.; Soares, J.B.P. Monitoring polymer flocculation in oil sands tailings: A population balance model approach. Chem. Eng. J. 2018, 346, 447–457. [Google Scholar] [CrossRef]
  31. Quezada, G.R.; Ayala, L.; Leiva, W.H.; Toro, N.; Toledo, P.G.; Robles, P.; Jeldres, R.I. Describing mining tailing flocculation in seawater by population balance models: Effect of mixing intensity. Metals 2020, 10, 240. [Google Scholar] [CrossRef] [Green Version]
  32. Fawell, P.D.; Nguyen, T.V.; Solnordal, C.B.; Stephens, D.W. Enhancing gravity thickener feedwell design and operation for optimal flocculation through the application of computational fluid dynamics. Miner. Process. Extr. Metall. Rev. 2019, 1–15. [Google Scholar] [CrossRef]
  33. Quezada, G.R.; Ramos, J.; Jeldres, R.I.; Robles, P.; Toledo, P.G. Analysis of the flocculation process of fine tailings particles in saltwater through a population balance model. Sep. Purif. Technol. 2020, 237, 116319. [Google Scholar] [CrossRef]
  34. Quezada, G.R.; Jeldres, M.; Toro, N.; Robles, P.; Jeldres, R.I. Reducing the magnesium content from seawater to improve tailing flocculation: Description by population balance models. Metals 2020, 10, 329. [Google Scholar] [CrossRef] [Green Version]
  35. Li, X.-Y.; Logan, B.E. Permeability of fractal aggregates. Water Res. 2001, 35, 3373–3380. [Google Scholar] [CrossRef]
  36. Pandya, J.D.; Spielman, L.A. Floc breakage in agitated suspensions: Effect of agitation rate. Chem. Eng. Sci. 1983. [Google Scholar] [CrossRef]
  37. Pretorius, C.; Wicklein, E.; Rauch-Williams, T.; Samstag, R.; Sigmon, C. How oversized mixers became an industry standard. Proc. Water Environ. Fed. 2015, 11, 4379–4411. [Google Scholar] [CrossRef]
  38. Veerapaneni, S.; Wiesner, M.R. Hydrodynamics of fractal aggregates with radially varying permeability. J. Colloid Interface Sci. 1996, 177, 45–57. [Google Scholar] [CrossRef]
  39. Mandelbrot, B.B. Self-affine fractals and fractal dimension. Phys. Scr. 1985, 32, 257. [Google Scholar] [CrossRef]
  40. Vainshtein, P.; Shapiro, M.; Gutfinger, C. Mobility of permeable aggregates: Effects of shape and porosity. J. Aerosol Sci. 2004, 35, 383–404. [Google Scholar] [CrossRef]
  41. Herrington, T.M.; Clarke, A.Q.; Watts, J.C. The surface charge of kaolin. Colloids Surf. 1992, 68, 161–169. [Google Scholar] [CrossRef]
  42. Shaikh, S.M.R.; Nasser, M.S.; Magzoub, M.; Benamor, A.; Hussein, I.A.; El-Naas, M.H.; Qiblawey, H. Effect of electrolytes on electrokinetics and flocculation behavior of bentonite-polyacrylamide dispersions. Appl. Clay Sci. 2018, 158, 46–54. [Google Scholar] [CrossRef]
  43. Chaiwong, N.; Nuntiya, A. Influence of pH, electrolytes and polymers on flocculation of kaolin particle. Chiang Mai J. Sci. 2008, 35, 11–16. [Google Scholar]
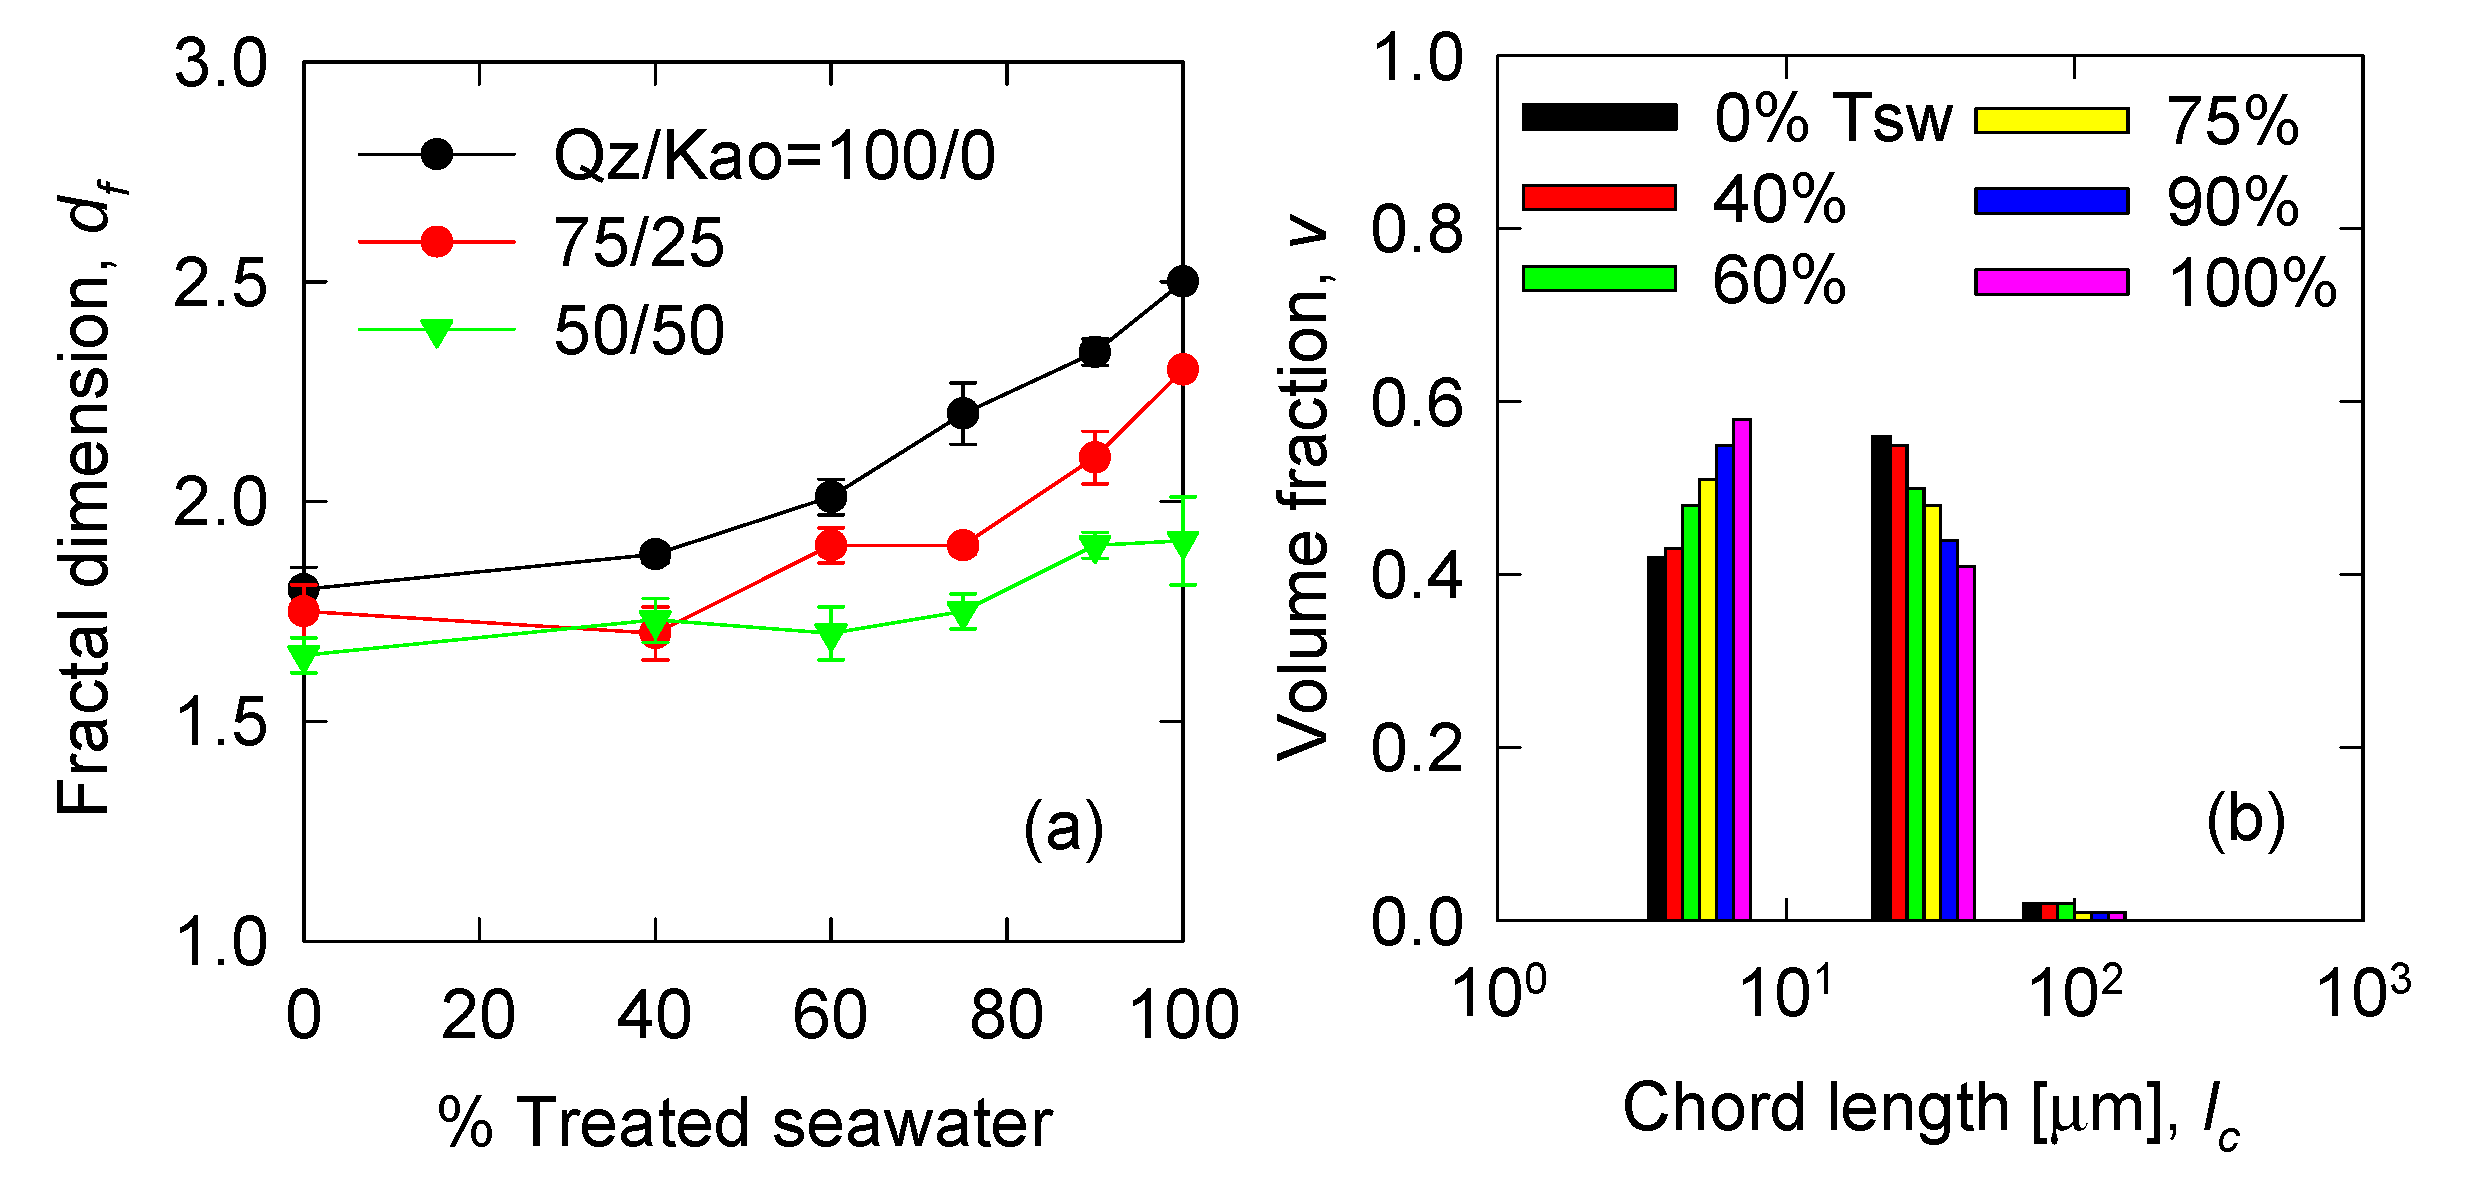
Figure 1. (a) Fractal dimension of flocculated aggregates and (b) initial volume particle distribution of qz/kao 75/25. Solid concentration 13 wt%, flocculant dose 15 g/t (for fractal dimension), mixing intensity 188 s−1.
Minerals 10 00782 g001
Figure 2. Experimental (symbol) vs. calculated (lines) evolution of the aggregates at varied proportions of quartz/kaolin (Qz/Kao) and treated seawater (Tsw). Solid concentration 13 wt%, flocculant dose 15 g/t, mixing intensity 188 s−1. Quartz/Kaolinite ratio (a) 50/50; (b) 75/25; (c) 100/0.
Minerals 10 00782 g002
Figure 3. Kernel aggregation parameters. (a) α m a x   ; (b) α m i n ; (c) k d .
Minerals 10 00782 g003
Figure 4. Kernel beakage parameters. (a) s 1 ; (b) s 2 .
Minerals 10 00782 g004
Figure 5. Collision efficiency for the mean chord length over time. Quartz/Kaolinite ratio (a) 50/50; (b) 75/25; (c) 100/0.
Minerals 10 00782 g005
Figure 6. Collision frequency for the mean chord length over time. Quartz/Kaolinite ratio (a) 50/50; (b) 75/25; (c) 100/0.
Minerals 10 00782 g006
Figure 7. Breakage rate for the mean chord length over time. Quartz/Kaolinite ratio (a) 50/50; (b) 75/25; (c) 100/0.
Minerals 10 00782 g007
Figure 8. Permeability of aggregates for the mean chord length over time. Quartz/Kaolinite ratio (a) 50/50; (b) 75/25; (c) 100/0.
Minerals 10 00782 g008
Figure 9. Experimental (symbol) vs. calculated (lines) flocculation kinetic. Solid concentration 13 wt%, flocculant dose 15 g/t, mixing intensity 188 s−1. Three conditions are evaluated according Table 4.
Minerals 10 00782 g009
Table 1. Numeric expressions used for population balance models (PBM) Equation (1).
VariableExpressionInput ParametersReference
Collision efficiency α i , j = ( α m a x α m i n ) e k d t + α m i n Vajihinejad and Soares [30]
Collision frequency β i , j = 1 6 ( f i d i + f j d j ) 3 G Veerapaeni and Wiesner [38]
Breakage rate S i = s 1 G s 2 d i Pandya and Spielman [36]
Distribution breakage Γ i , j = { V j / V i   f o r   j = i + 1       0           f o r   j i + 1
Dimensionless frequency function f i = exp ( ( i 1 ) 2 K k d f 4 ) This work
Initial number concentration N 0 , i = ϕ v ( d i ) V i ϕ = 0.054
Particle diameter d i = d 0 ( 2 i 1 C ) 1 d f d 0   ( d f > 1.7 ) = 1   μ m
d 0   ( d f < 1.7 ) = 0.1   μ m
Mandelbrot [39]
Particle volume V i = V 0 2 i 1 = 4 3 π d 0 3 2 i 1
Shear rate G = ( N p N 3 D 5 V ρ s u s μ s u s ) 1 2 μ s u s = 5   10 3 kg / ( ms )
N p = 0.6
D = 8   cm
V = 0.25   L
Suspension density ρ s u s = ( w ρ s + 1 w ρ w ) 1 w = 0.08
ρ s = 2600   kg / m 3
ρ w = 1000 kg / m 3
Porosity ϕ i = 1 C ( d i d 0 ) d f 3 C = 0.65 Vainshtein et al. [40]
Permeability K i = d i 2 72 ( 3 + 4 1 ϕ i 3 8 1 ϕ i 3 ) Li and Logan [35]
Table 2. Expressions used for PBM optimisation procedure.
VariableExpression
Objective function O F ( α m a x , α m i n , k d , s 1 , s 2 ) = t i t f ( d e x p d m o d ) 2
Model diameter d m o d = i = 1 m a x N i d i 4 i = 1 m a x N i d i 3
Coefficient of determination R 2 = 1 i = 1 m a x ( d a g g , e x p , i d a g g , m o d , i ) 2 i = 1 m a x ( d a g g , e x p , i d a g g ,   e x p ) 2
Goodness of fit G o F ( % ) = 100 d a g g ,   e x p std d a g g ,   e x p
Standard error std = ( 1 n f t i t f ( d a g g ,   e x p d a g g ,   m o d ) 2 ) 1 2
Table 3. Quantitative results of GoF and R2 when the PBM model is used.
SystemTreated Seawater, %R2GoF, %
50/5000.76094.9
400.94996.5
600.91895.8
750.95496.3
900.89993.9
1000.97697.5
75/2500.88595.8
400.90095.6
600.96496.3
750.95796.0
900.96396.4
1000.98497.2
100/000.94695.8
400.93995.6
600.94596.0
750.98497.7
900.95795.7
1000.96695.7
Table 4. Parameters used to the model description, GoF, and R2.
System
Qz/Kao, Tsw/Rsw
α m a x α m i n k d s 1 s 2 GoFR2
85/25, 50/503.07 × 10−42.64 × 10−46.55 × 10−21.81 × 10−63.6995.4%0.933
95/5, 75/258.07 × 10−45.23 × 10−43.01 × 10−21.37 × 10−63.4996.9%0.978
85/5, 100/01.32 × 10−49.41 × 10−42.21 × 10−22.63 × 10−32.2293.6%0.890