
Geophysical Properties of Precambrian Igneous Rocks in the Gwanin Vanadiferous Titanomagnetite Deposit, Korea

Abstract
:1. Introduction
2. Materials and Methods
2.1. Geology
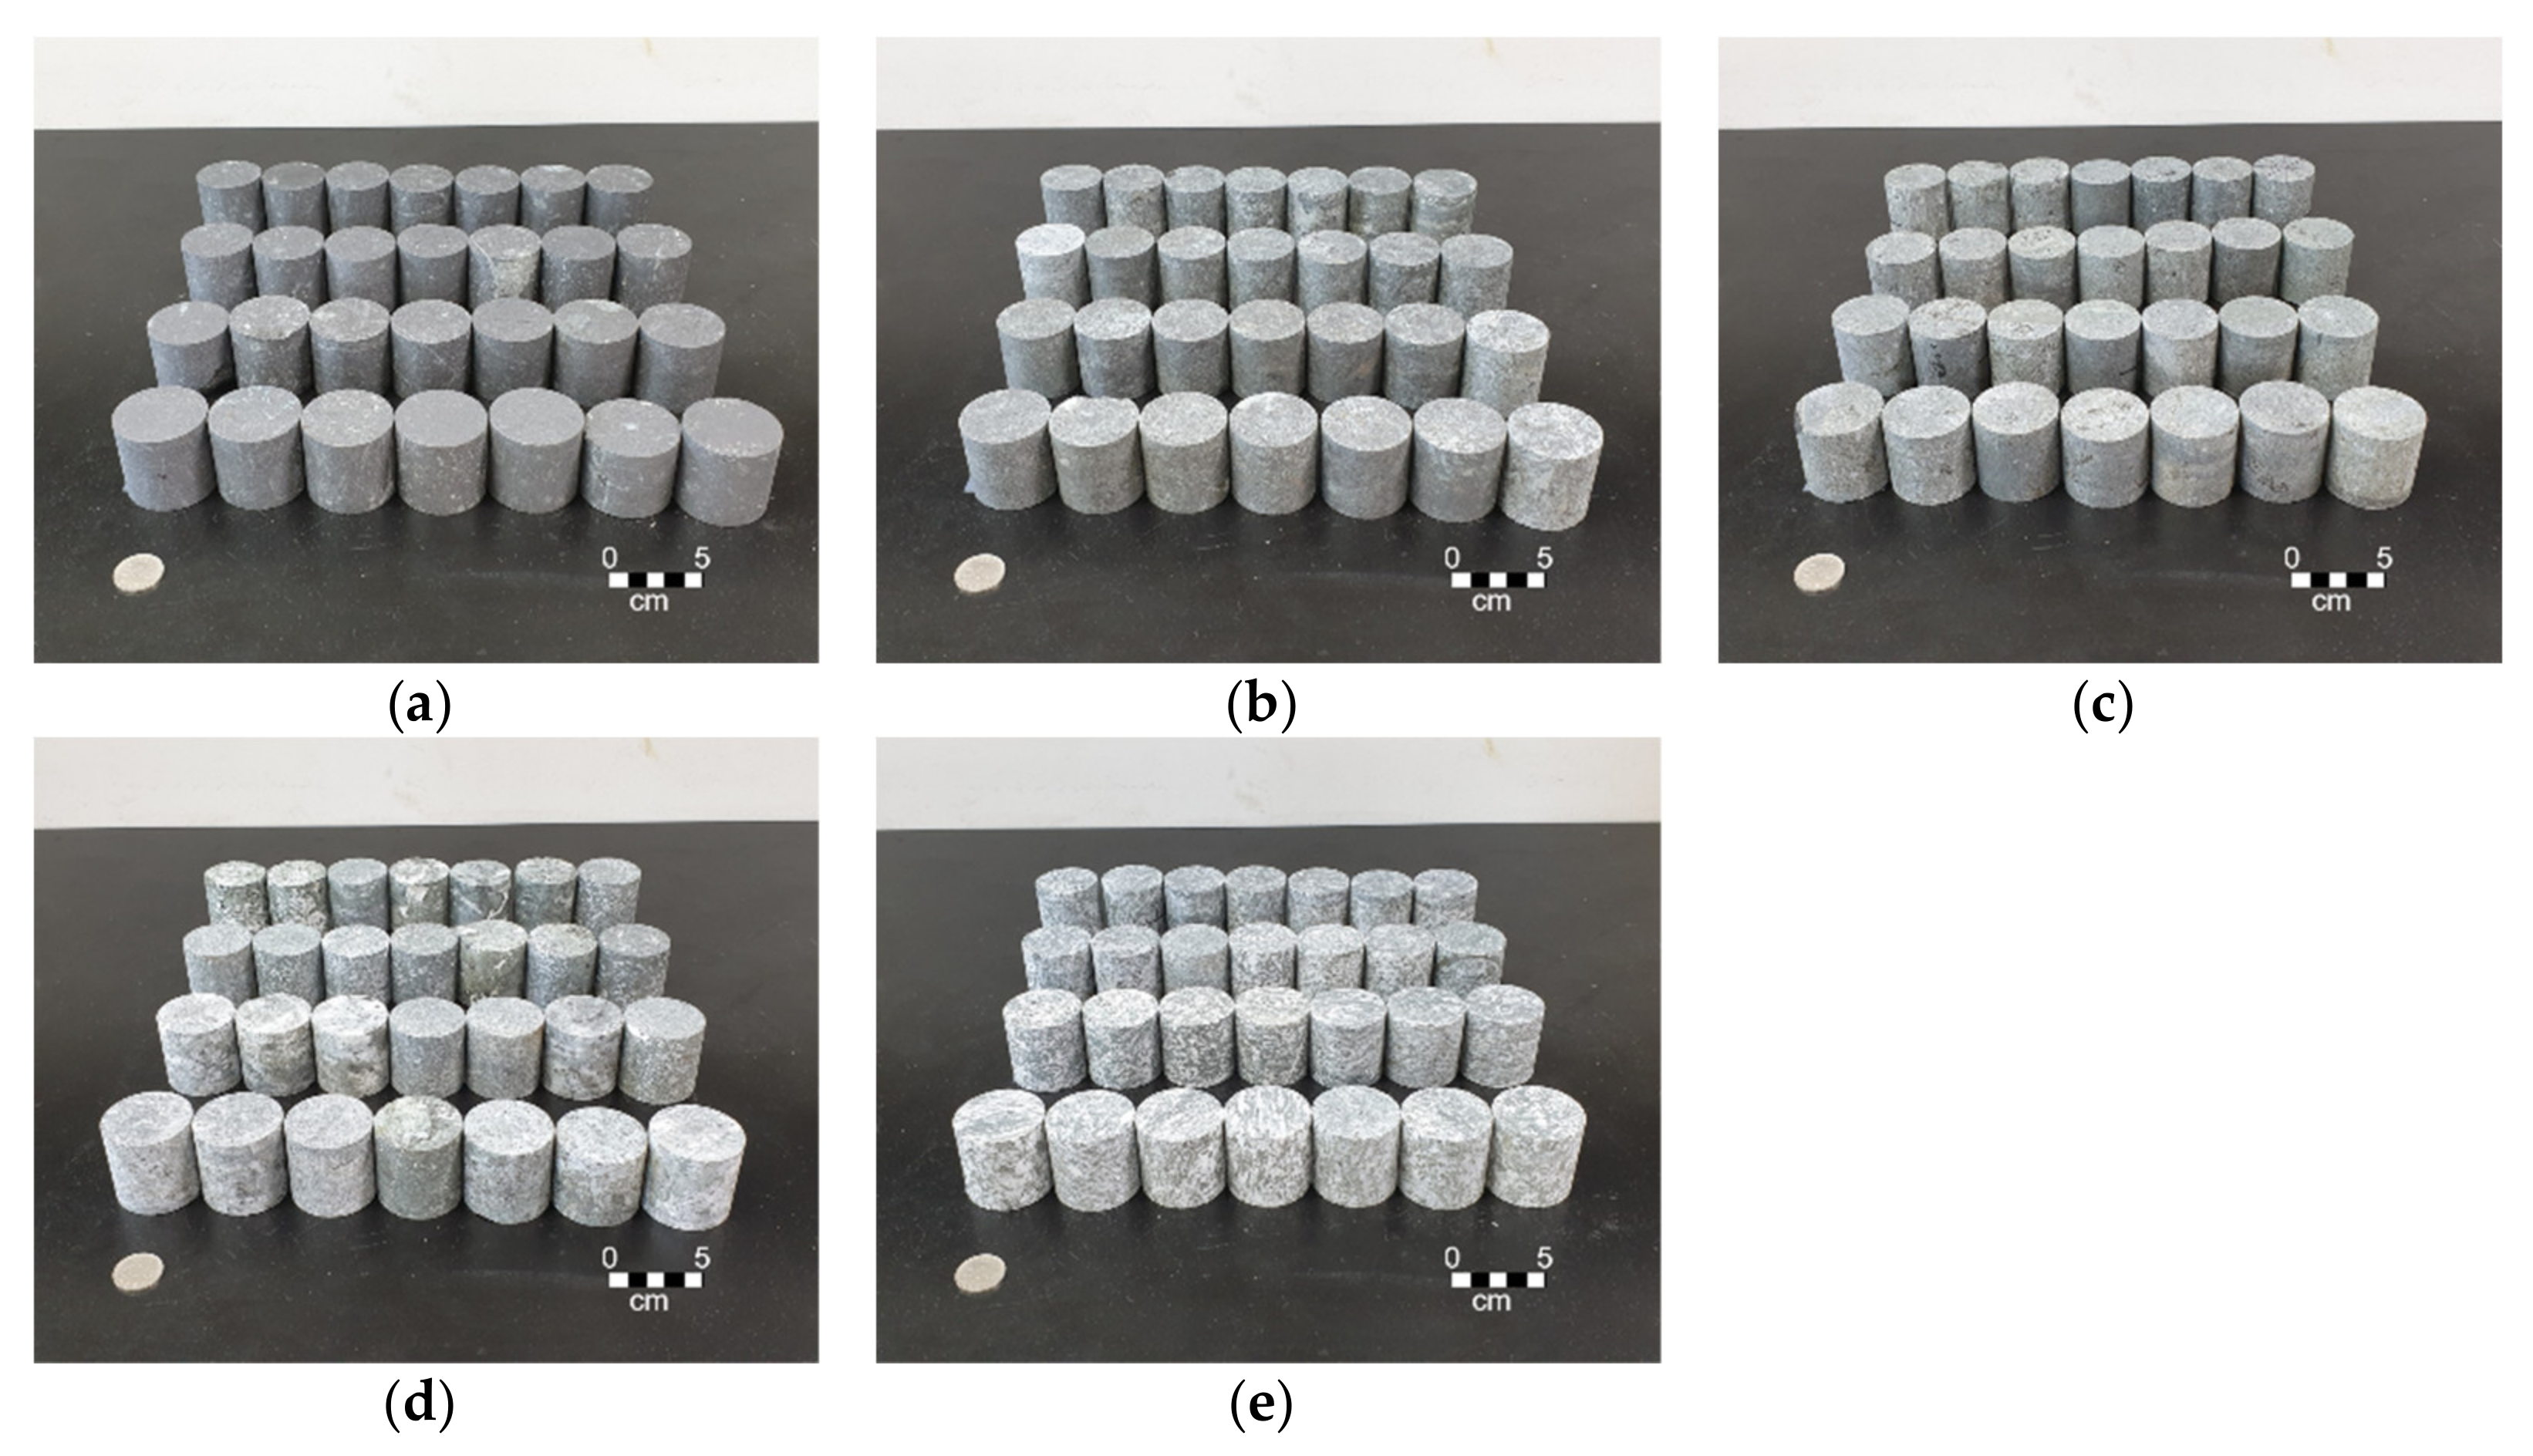
2.2. Rock Samples
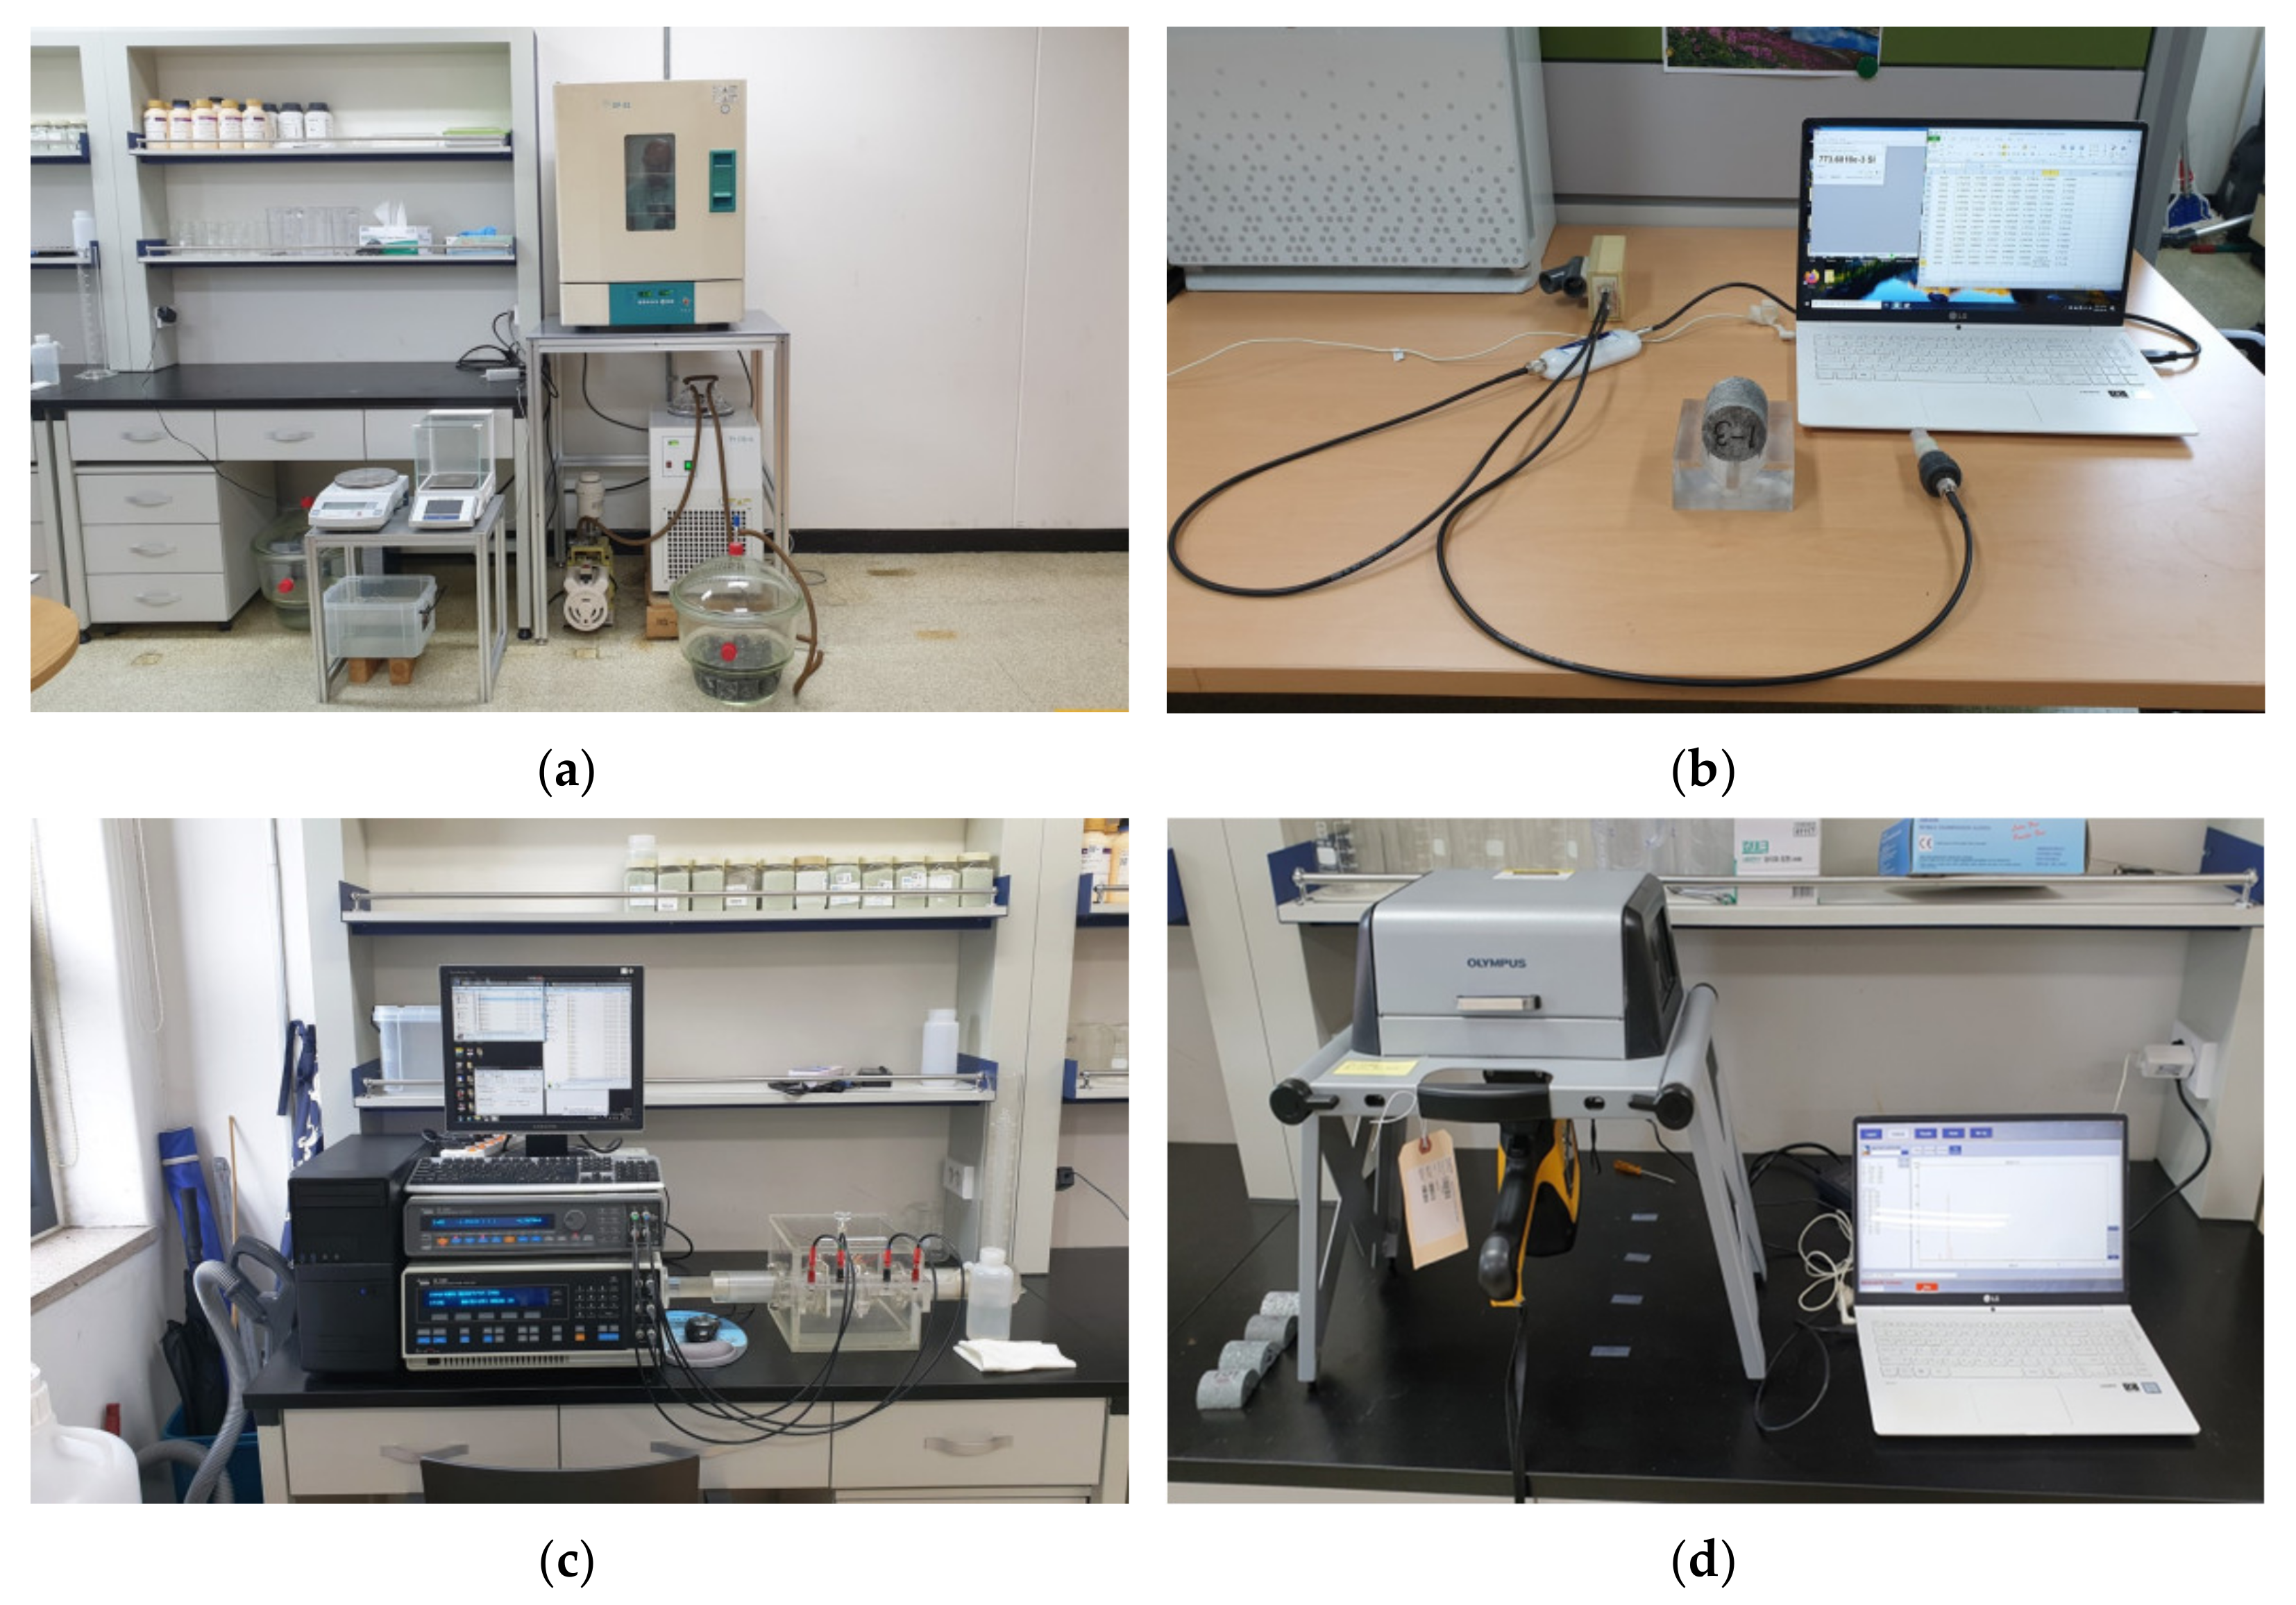
2.3. Laboratory Measurement System
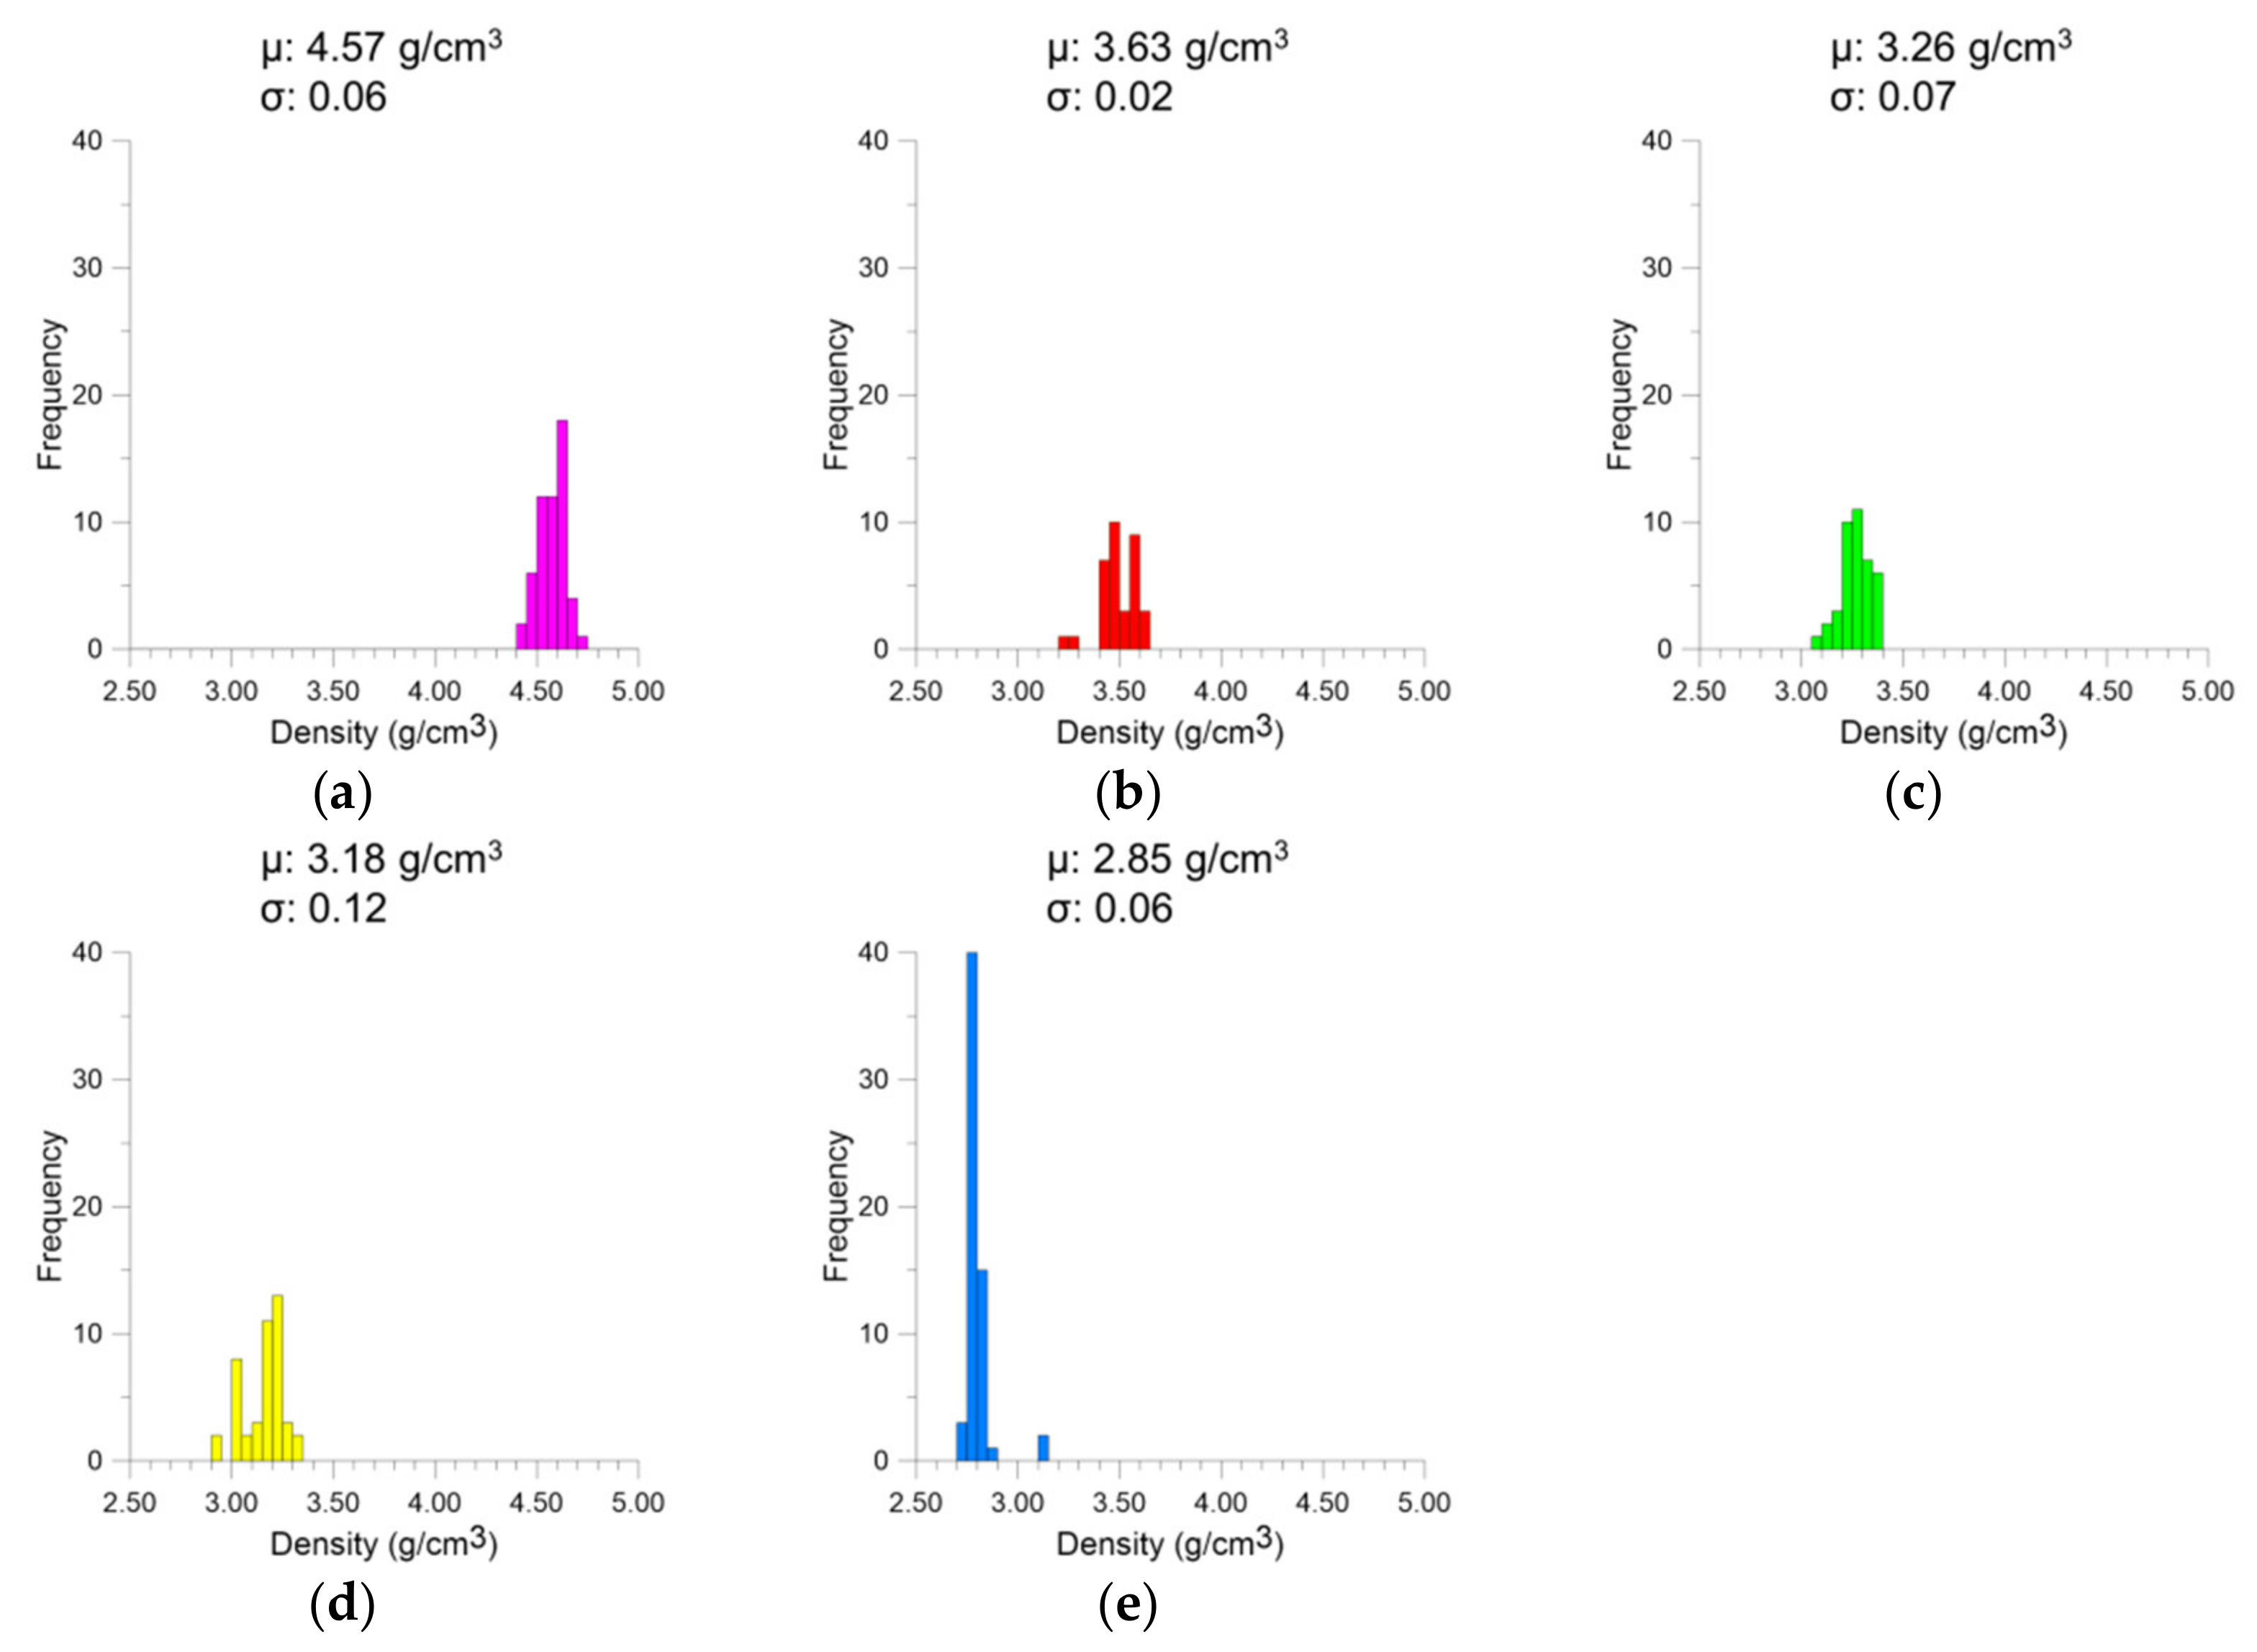
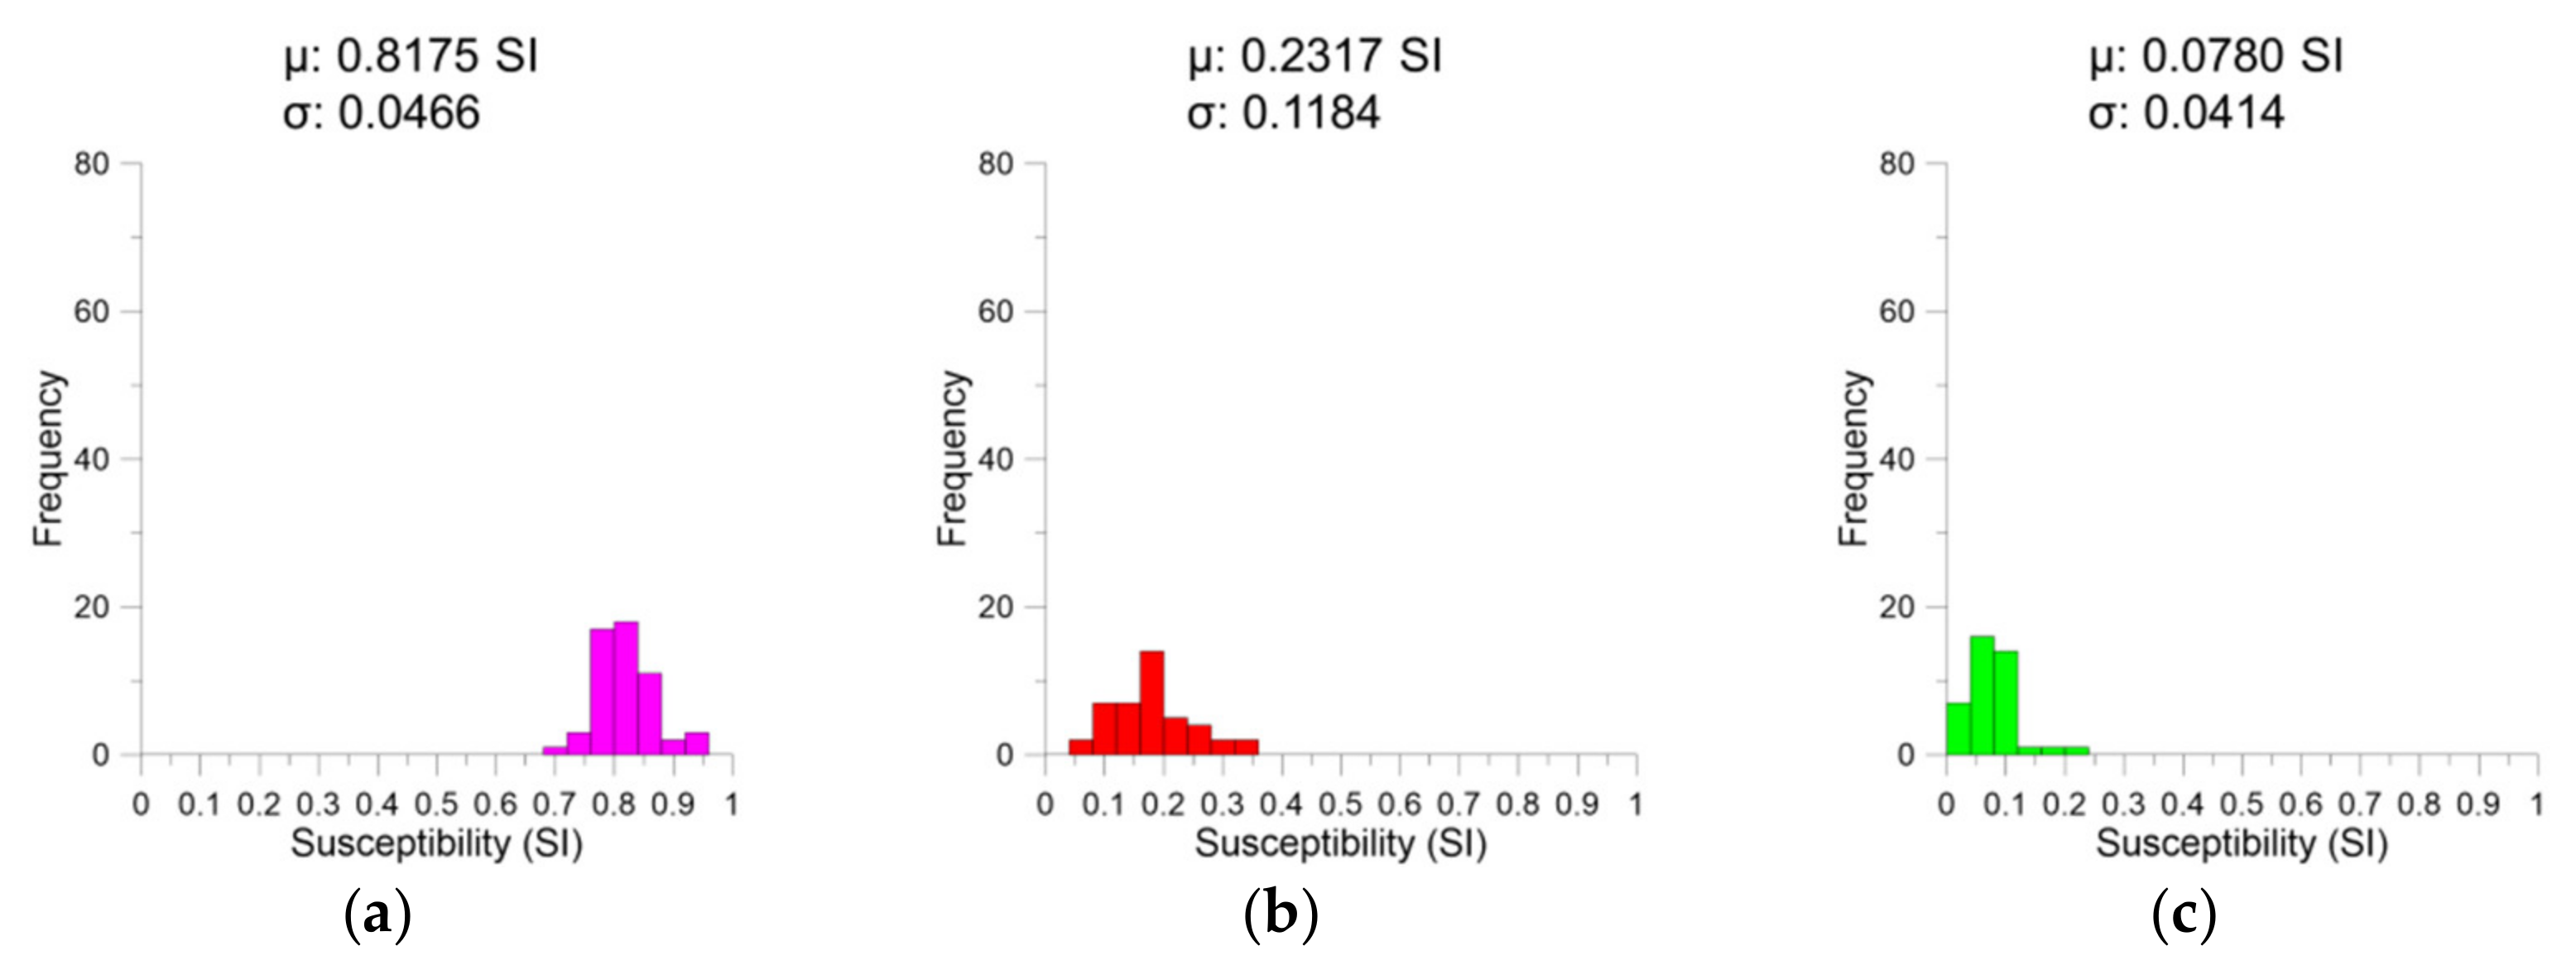
3. Results and Discussion
4. Conclusions
Author Contributions
Funding
Data Availability Statement
Acknowledgments
Conflicts of Interest
References
- Lee, B.Y.; Oh, C.W.; Lee, S.H.; Seo, J.; Yi, K. Ages and tectonic settings of the neoproterozoic igneous rocks in the gyeonggi massif of the southern Korean peninsula and the correlation with the neoproterozoic igneous rocks in China. Lithos 2020, 370–371, 105625. [Google Scholar] [CrossRef]
- Schulz, K.J.; DeYoung, J.H.; Seal, R.R.; Bradley, D.C. Critical Mineral Resources of the United States: Economic and Environmental Geology and Prospects for Future Supply; United States Geological Survey: Washington, DC, USA, 2018. [Google Scholar]
- Aramendia, I.; Fernandez-Gamiz, U.; Martinez-San-Vicente, A.; Zulueta, E.; Lopez-Guede, J.M. Vanadium redox flow batteries: A review oriented to fluid-dynamic optimization. Energies 2021, 14, 176. [Google Scholar] [CrossRef]
- Arndt, N.; Fontboté, L.; Hedenquist, J.; Kesler, S.E.; Thompson, J.F.; Wood, D.G. Future global mineral resources. Geochem. Perspect. 2017, 6, 1–171. [Google Scholar] [CrossRef] [Green Version]
- Kim, B.; Jeong, S.; Bang, E.; Shin, S.; Cho, S. Investigation of iron ore mineral distribution using aero-magnetic exploration techniques: Case study at Pocheon, Korea. Minerals 2021, 11, 665. [Google Scholar] [CrossRef]
- Shin, Y.; Shin, S.; Cho, S.-J.; Son, J.-S. Application of 3D electrical resistivity tomography in the Yeoncheon titanomagnetite deposit, Korea. Minerals 2021, 11, 563. [Google Scholar] [CrossRef]
- Kee, W.; Lim, S.; Kim, H.; Kim, B.; Hwang, S.; Song, K.; Kim, Y. Geological Report of the Yeoncheon Sheet (1:50,000); Korea Institute of Geoscience and Mineral Resources (KIGAM): Daejeon, Korea, 2008. [Google Scholar]
- Lee, J. Iron-Ti (-V) Oxide Mineralization Related to Magmatic Fractionation of the Gonamsan Intrusion in Pocheon, South Korea; Konju National University: Gongju, Korea, 2021. [Google Scholar]
- Telford, W.M.; Telford, W.M.; Geldart, L.P.; Sheriff, R.E. Applied Geophysics; Cambridge University Press: Cambridge, UK, 1990. [Google Scholar]
- Bieniawski, Z.T.; Bernede, M.J. Suggested methods for determining the uniaxial compressive strength and deformability of rock materials: Part 1. Suggested method for determining deformability of rock materials in uniaxial compression. Int. J. Rock Mech. Min. Sci. Geomech. Abstr. 1979, 16, 138–140. [Google Scholar] [CrossRef]
- Archie, G.E. The electrical resistivity log as an aid in determining some reservoir characteristics. Petroleum development and technology. Proc. Amer. Inst. Min. Met. Eng. 1942, 146, 54–62. [Google Scholar]
- Shin, S.W.; Park, S.; Shin, D.B. Spectral-induced polarization characterization of rocks from the Handuk iron mine, South Korea. Environ. Earth Sci. 2016, 75, 827. [Google Scholar] [CrossRef]
- Han, M.-H.; Shin, S.W.; Park, S.; Cho, S.-J.; Kim, J.-H. Induced polarization imaging applied to exploration for low-sulfidation epithermal au–ag deposits, Seongsan mineralized district, South Korea. J. Geophys. Eng. 2016, 13, 817. [Google Scholar] [CrossRef]
- Ashwal, L.D.; Webb, S.J.; Knoper, M.W. Magmatic stratigraphy in the bushveld northern lobe: Continuous geophysical and mineralogical data from the 2950 m bellevue drillcore. S. Afr. J. Geol. 2005, 108, 199–232. [Google Scholar] [CrossRef]
- Xue, Y.; Jing, L.; Song, T. A study of taihe iron deposit in sichuan, china based on magnetic anomalies. In Proceedings of the International Geophysical Conference, Qingdao, China, 17–20 April 2017; pp. 477–480. [Google Scholar]
- Lawton, D.C.; Hochstein, M.P. Physical properties of titanomagnetite sands. Geophysics 1980, 45, 394–402. [Google Scholar] [CrossRef]
- Hunt, C.P.; Moskowitz, B.M.; Banerjee, S.K. Magnetic properties of rocks and minerals. Rock Phys. Phase Relat. 1995, 3, 189–204. [Google Scholar]


Publisher’s Note: MDPI stays neutral with regard to jurisdictional claims in published maps and institutional affiliations. |
© 2021 by the authors. Licensee MDPI, Basel, Switzerland. This article is an open access article distributed under the terms and conditions of the Creative Commons Attribution (CC BY) license (https://creativecommons.org/licenses/by/4.0/).
Share and Cite
Shin, S.; Cho, S.; Kim, E.; Lee, J. Geophysical Properties of Precambrian Igneous Rocks in the Gwanin Vanadiferous Titanomagnetite Deposit, Korea. Minerals 2021, 11, 1031. https://doi.org/10.3390/min11101031
Shin S, Cho S, Kim E, Lee J. Geophysical Properties of Precambrian Igneous Rocks in the Gwanin Vanadiferous Titanomagnetite Deposit, Korea. Minerals. 2021; 11(10):1031. https://doi.org/10.3390/min11101031
Chicago/Turabian StyleShin, Seungwook, Seongjun Cho, Euijun Kim, and Jihyun Lee. 2021. "Geophysical Properties of Precambrian Igneous Rocks in the Gwanin Vanadiferous Titanomagnetite Deposit, Korea" Minerals 11, no. 10: 1031. https://doi.org/10.3390/min11101031
APA StyleShin, S., Cho, S., Kim, E., & Lee, J. (2021). Geophysical Properties of Precambrian Igneous Rocks in the Gwanin Vanadiferous Titanomagnetite Deposit, Korea. Minerals, 11(10), 1031. https://doi.org/10.3390/min11101031