Article

Lithium Potential Mapping Using Artificial Neural Networks: A Case Study from Central Portugal

1
Beak Consultants GmbH, Am St. Niclas Schacht 13, 09599 Freiberg, Germany
2
Department of Geosciences, Environment and Spatial Planning, Faculty of Sciences, University of Porto, 4169-007 Porto, Portugal
3
Institute of Earth Sciences (ICT), Pole of University of Porto, 4169-007 Porto, Portugal
*
Author to whom correspondence should be addressed.
Minerals 2021, 11(10), 1046; https://doi.org/10.3390/min11101046
Submission received: 13 August 2021 / Revised: 14 September 2021 / Accepted: 22 September 2021 / Published: 27 September 2021
(This article belongs to the Special Issue Remote Sensing-based Mineral Exploration)

Abstract

:
The growing importance and demand of lithium (Li) for industrial applications, in particular rechargeable Li-ion batteries, have led to a significant increase in exploration efforts for Li-bearing minerals. To ensure and expand a stable Li supply to the global economy, extensive research and exploration are necessary. Artificial neural networks (ANNs) provide powerful tools for exploration target identification. They can be cost-effectively applied in various geological settings. This article presents an integrated approach of Li exploration targeting using ANNs for data interpretation. Based on medium resolution geological maps (1:50,000) and stream sediment geochemical data (1 sample per 0.25 km2), the Li potential was calculated for an area of approximately 1200 km2 in the surroundings of Bajoca Mine (Northeast Portugal). Extensive knowledge about geological processes leading to Li mineralisation (such as weathering conditions and diverse Li minerals) proved to be a determining factor in the exploration model. Furthermore, Sentinel-2 satellite imagery was used in a separate ANN model to identify potential Li mine sites exposed on the ground surface by analysing the spectral signature of surface reflectance in well-known Li locations. Finally, the results were combined to design a final map of predicted Li mineralisation occurrences in the study area. The proposed approach reveals how remote sensing data in combination with geological and geochemical data can be used for delineating and ranking exploration targets of almost any deposit type.

1. Introduction

Lithium (Li) is on the European Union’s (EU) list of critical raw materials [1], is an important element in modern technology applications, and plays a key role in the realisation of electromobility and effective energy storage. The supply of Li to the global industry depends on expanding the supply of resources. Therefore, the exploration of new Li deposits is vital to the establishment of a stable Li supply in the global economy. At present, about 50% of the global Li production is used in batteries, while 30% is used in the ceramics and glass sector. Minor shares are used in pharmaceuticals and the production of specialised lubricating grease [2]. Li-rich minerals (mainly from Li pegmatites) now account for more than half of the world’s lithium production.
Li pegmatites have been extensively studied from an economic, petrographical, and geochemical point of view. The relative importance of pegmatite, brine, and other deposits is discussed by [3], leading to the conclusion that Li pegmatites, while certainly much smaller in tonnage than brine deposits, are a valuable asset to the global Li market due to their widespread occurrence. Li pegmatites could therefore lead to a geographical diversification in lithium production that would counteract the geopolitically restricted distribution of brine deposits [4]. General characteristics for such Li pegmatites are enrichment in distinct elements (Rb, Cs, Be, Ta, Nb, Sn, Li, P, F, and B) and distinct geochemical composition, but limited volumes. Economic pegmatitic lithium mineralisations are dominated by the minerals spodumene (LiAlSi2O6), petalite (LiAlSi4O10), and lepidolite group minerals (K[Li,Al]3[Si,Al]4O10[F,OH]2), and [5] improved the understanding of the crystallisation conditions of rare-element pegmatites by constructing a lithium aluminosilicate phase diagram. However, mechanisms for Li predictivity are only rarely addressed [5].
Portugal hosts considerable Li resources [3,6] and is the first Li-producing European country, but represents only 1.3% of world production [6]. Recent exploration by different mining companies increased the Portuguese reserves multiple times and significant research was performed to enhance the understanding of Li mineralisation types and deposits. An overview of Li-rich mineral occurrences in northern Portugal is provided by [7], and [8] covered the different styles of Li mineralisations (aplite–pegmatite dykes occurring in pegmatitic fields, Li mineralisation associated with leucogranitic cupolas, beryl–phosphate pegmatites, and quartz–montebrasite veins).
Artificial neural networks (ANNs) are powerful in the early stages of resource exploration. In recent years, several studies proved the potential of ANNs and their uses in geological contexts, e.g., [9,10,11,12]. Neural networks have several advantages over existing methods, including the ability to respond to critical combinations of parameters, the combination of datasets without the loss of information inherent in existing methods, and results that are relatively unaffected by redundant data, spurious data, and data containing multiple populations [9]. A Geographic Information System (GIS), in concert with ANN software, offers great potential by providing a range of tools to query, manipulate, visualise, and analyse geological, geochemical, and geophysical data in mineral exploration applications [11]. Mineralisation potential maps can be easily produced to delineate areas for further exploration and therefore reduce the size of the actual fieldwork areas (thus time and expenditure) significantly.
This study aims to use ANNs to process classical geological data (maps and geochemical analyses) reliably and cost-effectively to enhance exploration targeting. As part of the LIGHTS project (Lightweight Integrated Ground and Airborne Hyperspectral Topological Solution; http://lights.univ-lorraine.fr/; accessed on 23 June 2021), this study aims to design a new exploration process chain at the target scale. Prospective areas with previously unknown Li mineralisations will then strengthen the geological understanding of the area and refine geological and minerogenetic maps. Moreover, this study assesses for the first time the potential use of different datasets and their combination according to known metallogenic aspects of the study area. Similar approaches could be extended to other areas of the Iberian Peninsula or even the European Variscides, allowing an increase in the knowledge on Li pegmatite distribution.

1.1. Geological Overview of the Test Area

Li mineralisation can be traced across the whole Central Iberian Zone (CIZ) of the Iberian Massif [8,13]. The CIZ represents parts of the westernmost segment of the Variscan Orogenic Belt of Europe, the latter extending from the Bohemian Massif across the Massif Central and the Armorican Massif to the north-western tip of the Iberian Peninsula, e.g., [14]. Geologically, the CIZ is dominated by S-type Variscan granitoid batholith complexes and adjacent metasedimentary zones (e.g., [13,15,16]). The main Li mineralisation in the CIZ is associated with pegmatitic to aplitic textured intrusive dykes of granitic composition [8]. The most Li-enriched dykes are unzoned and exhibit aplitic textures, often showing host-rock-contact parallel layering [13]. Additionally, Li occurrences of subsequent economic importance appear as quartz–phosphate veins and metasomatic modified cupolas of albite granites [8].
The approximate 1200 km2 study area is located in north-western Portugal and covers major parts of the Fregenedra–Almendra pegmatitic field (FAF), CIZ (c.f. [17,18,19]) (Figure 1). The area is characterised by various pegmatite and aplite textured dykes hosted by Precambrian to Cambrian metasediments of the schist–metagreywacke complex (Complexo Xisto-Grauváquico, [20,21]) north of the Meda-Penedono-Lumbrales Granitoid Complex [22], recently designated as the Figueira de Castelo Rodrigo–Lumbrales Anatectic Complex [23,24]. The metasedimentary rocks of the schist–metagreywacke complex may contain quartz, white mica, biotite, plagioclase, K-feldspar, chlorite, zircon, apatite, tourmaline, calcite, epidote, sphene, actinolite, monazite, and opaque minerals [25]. The Granitoid Complex is mainly composed of syn-Variscan two-mica granites [26,27] composed of quartz, plagioclase, potassic feldspar, biotite, muscovite, chlorite, sillimanite, zircon, apatite, rutile, and opaque minerals [24]. The Li-rich dykes are predominated by aplitic textures, with some exhibiting layering of Li-mica+quartz alternating with albite + quartz sequences [8]. The mainly sub-vertical bodies display simple mineralogy including albite, k-feldspar, quartz, and muscovite (barren type) associated with spodumene, petalite, and Li-micas in variable proportions (intermediate and rare-element type) [8]. Common accessory minerals are Li-phosphates, cassiterite, and Nb–Ta oxides [8]. The FAF is bounded at the northeast by the Lower Ordovician quartzites from the Poiares’ syncline. Alternating Ordovician quartzites and phyllites occur in the smaller Castelo Melhor’s syncline. Cenozoic sedimentary deposits of diverse origins occur throughout the region [26,27,28,29,30,31].

1.2. Remote Sensing Data

Remote sensing is a powerful and cost-effective data source to collect up-to-date and historical information about the ground surface. In recent years, remote sensing data have been intensively used in geology applications for the exploration and identification of different mineralisation types and related mining activities, e.g., [32,33,34].
In the framework of the LIGHTS project, several methodological approaches have been developed to identify Li pegmatite areas through optical remote sensing data, including different types of satellite products such as ASTER, Landsat-5, Landsat-8, and Sentinel-2 [35,36]. In this regard, different machine learning algorithms have been employed to allow the automatic identification of Li pegmatites [37,38].
In this study, we elaborate on the potential of new Sentinel-2 derivatives to improve the automatic detection of Li-bearing mineralisation and introduce a new approach to differentiate Li-bearing mineralisation from other features with similar spectral signatures. The use of Sentinel-2 satellite imagery brings three main advantages compared to the other free-of-charge optical remote sensing data: (1) low-to-medium spatial resolution (4 × 10 m Bands, 6 × 20 m Bands, 3 × 60 m Bands); (2) multispectral data from the Visible (VNIR) and Near Infra-Red (NIR) to the Short Wave Infra-Red (SWIR), in 13 compressed JPEG-2000 images covering the total spectral range between 0.443 μm and 2.190 μm; (3) a temporal resolution of 5 days at the Equator since 2015. Additional information may be found in guides available on the ESA Sentinel website: https://sentinel.esa.int/web/sentinel/technical-guides/sentinel-2-msi (accessed on 23 June 2021).

2. Data and Processing

2.1. Geological Data

Geological maps of the study area [28,29,30,31] provide the geological framework for this study and were used to identify and digitise pegmatites using ArcGIS software (ArcGIS 10.6, Environmental Systems Research Institute, Redlands, CA, USA). Based on the Portuguese Geological Surveys 1:50,000 geological maps of Portugal [28,29,30], and, when not available, using the 1:80,000 geological map from the Côa Valley Archaeological Park [31], a unified geological map was created covering the entire study area. Afterwards, a simplified map (Figure 1) was produced by grouping the Variscan granitoids, the Precambrian and Paleozoic metasediments, and the Cenozoic sedimentary cover into distinct classes, to aid the masking and processing stages. Finally, topological data analysis was performed to check any mistakes committed during all the processes created in ArcGIS software (ArcGIS 10.6, Environmental Systems Research Institutery, Redlands, CA, USA). These digital maps were used to create rastered data of individual geological units for further use in the prediction software.

2.2. Stream Sediment Data Processing

Stream sediment geochemical data (survey spot position and geochemical analysis) were obtained from earlier studies [39,40,41] carried out on campaigns in the early 1980s by the French Bureau de Recherches Géologiques et Minières (BRGM) with the Portuguese institution Serviço de Fomento Mineiro (SFM). A total of 3.715 stream sediment samples, including 298 samples from a more detailed campaign near Bajoca Mine, were collected in the FAF region covering an area of >1.250 km2 in NE Portugal. The catchment creation was based on digital elevation model (DEM) data and the flow direction network. During the following procedure, center points of the catchment polygons were calculated using ArcGIS v10.6 software. Subsequently, raster datasets for various elements were created applying inverse distance weighting (IDW) interpolation on the catchment center points containing related geochemical information. Stream sediment data included analyses of the elements/compounds Ag, Al2O3, As, B, Ba, Be, Bi, CaO, Cd, Co, Cr, Cu, Fe2O3, K2O, La, Li, MgO, MnO, Mo, Na2O, Nb, Ni, P2O5, Pb, Sb, SiO2, Sn, Sr, TiO2, V, W, Y, Zn, and Zr. The multi-element quantification was achieved on the fine fraction below 60 mesh (250 microns or 0.25 mm) by optical emission spectrometry (quantometer studies, [39,40,42]). There is no information on the digestion methods and analytical precision of the analyses in the historical reports available.

2.3. Exploration Model

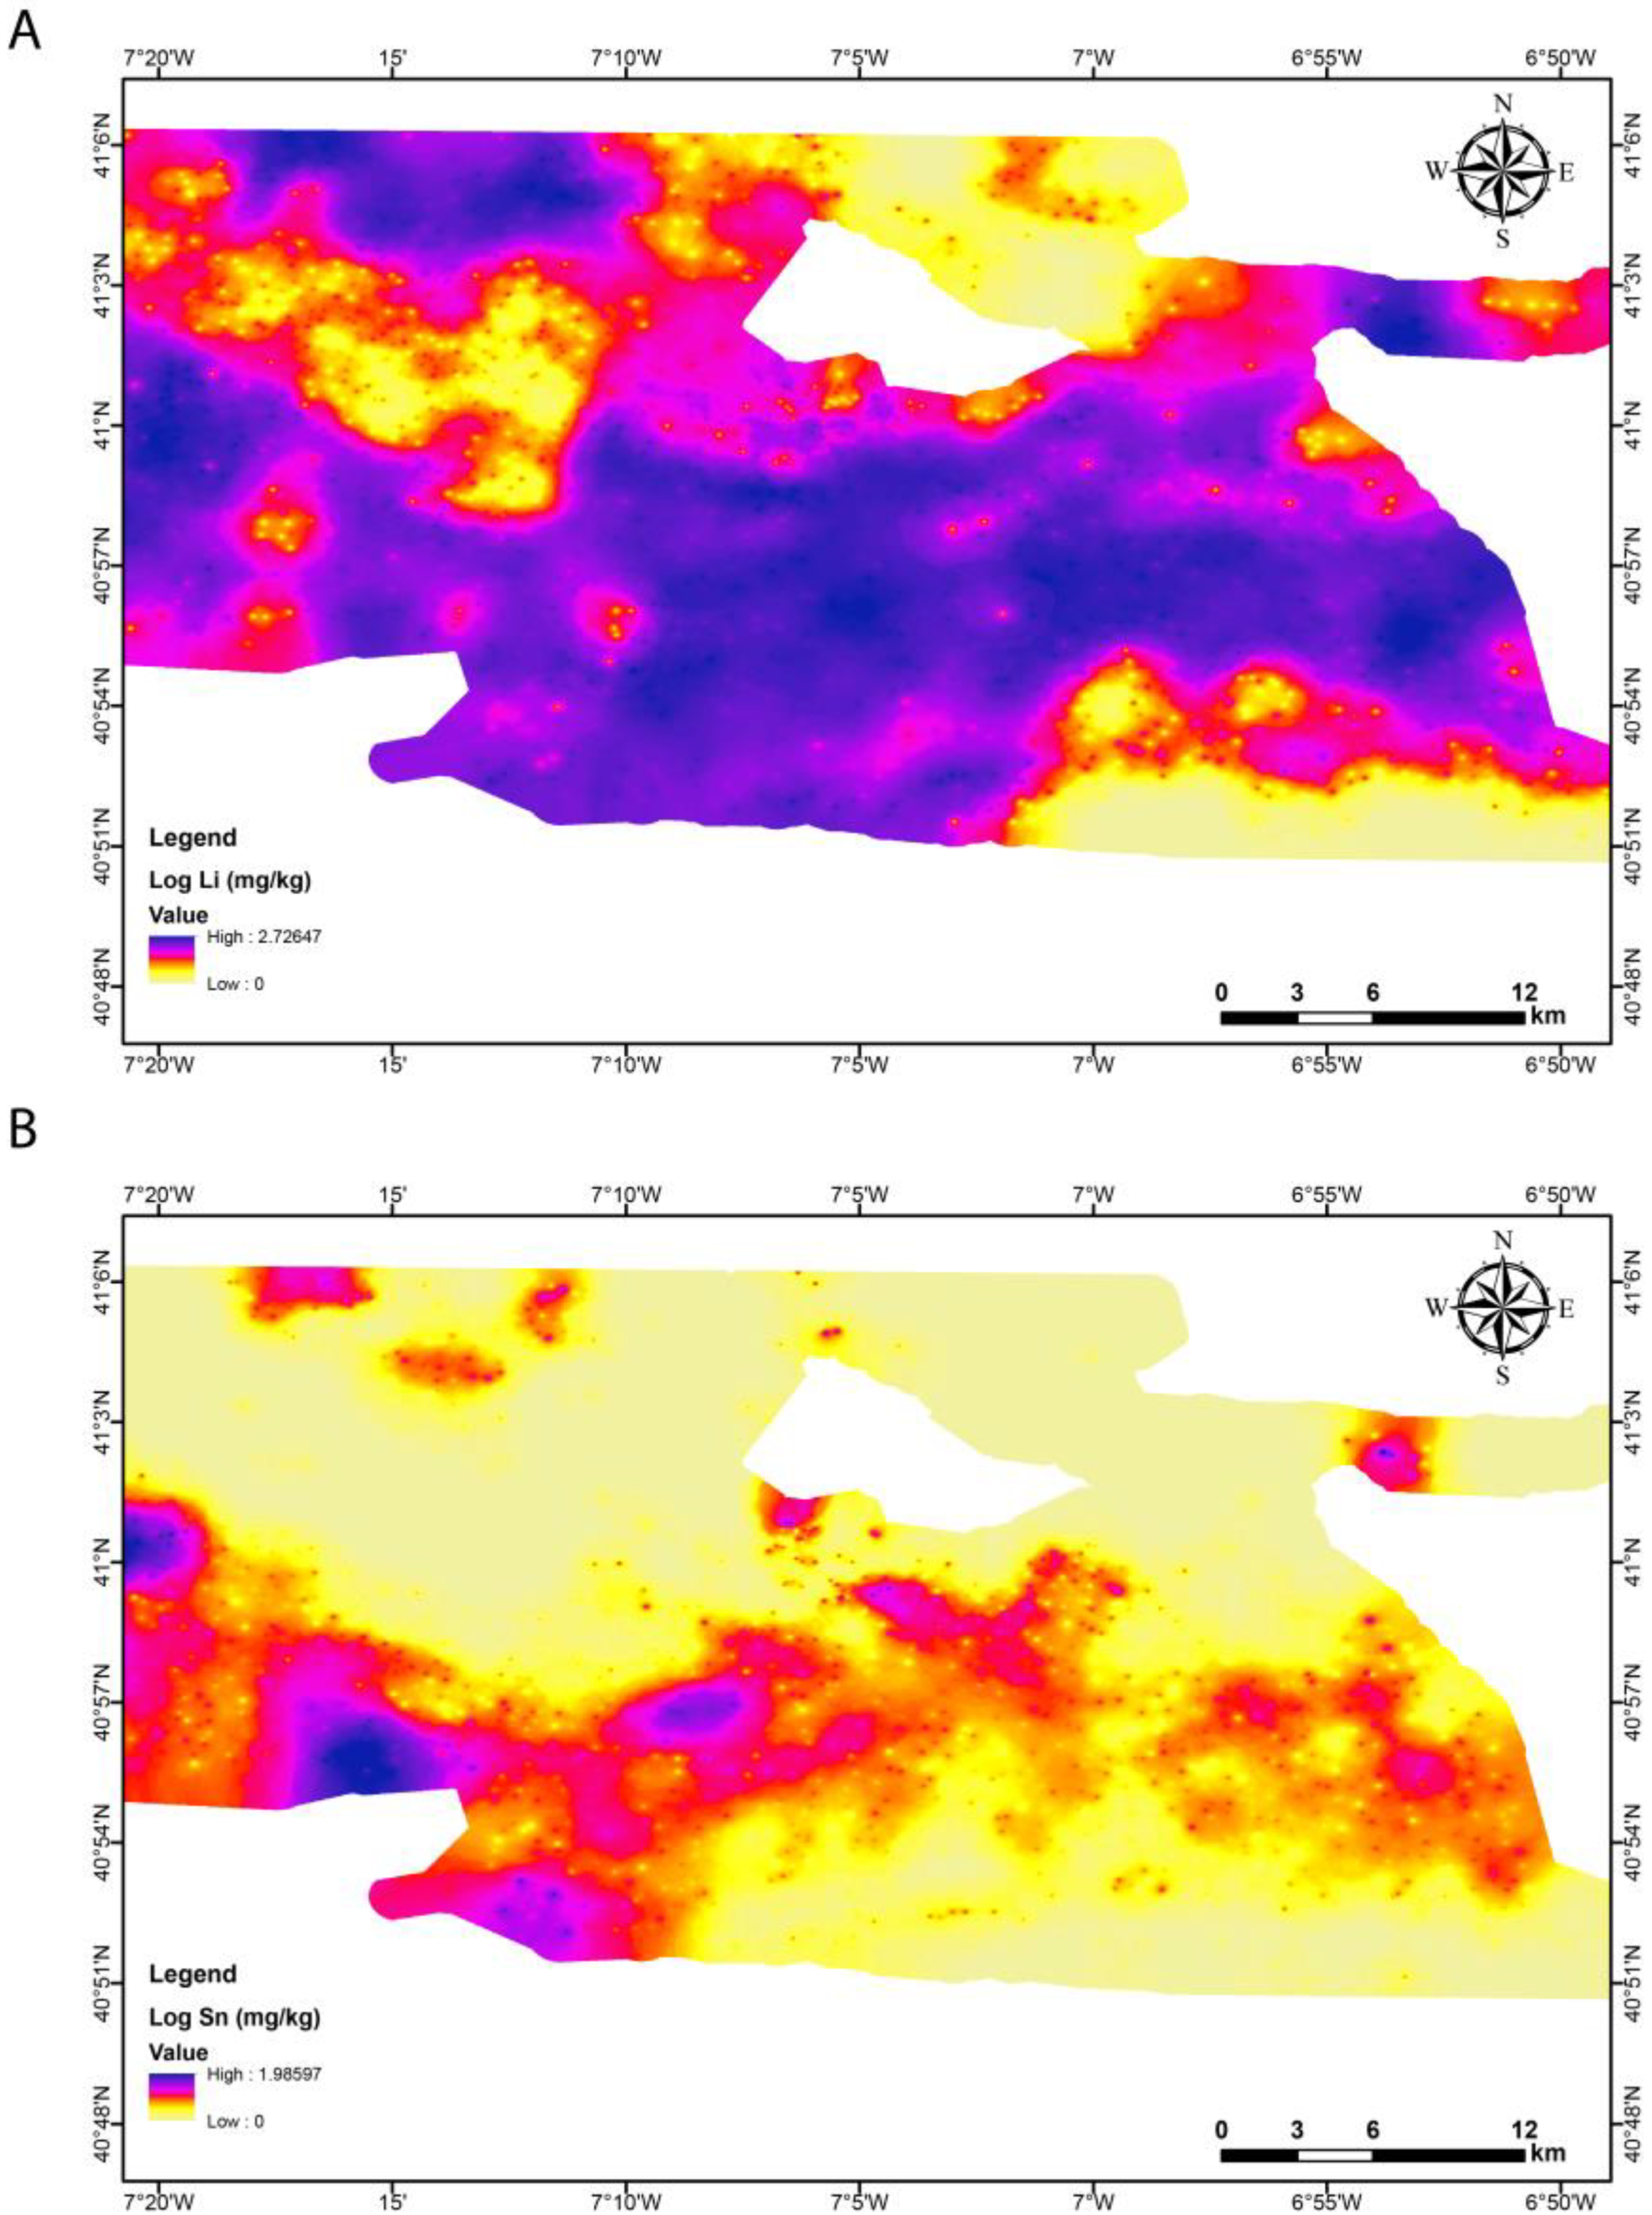
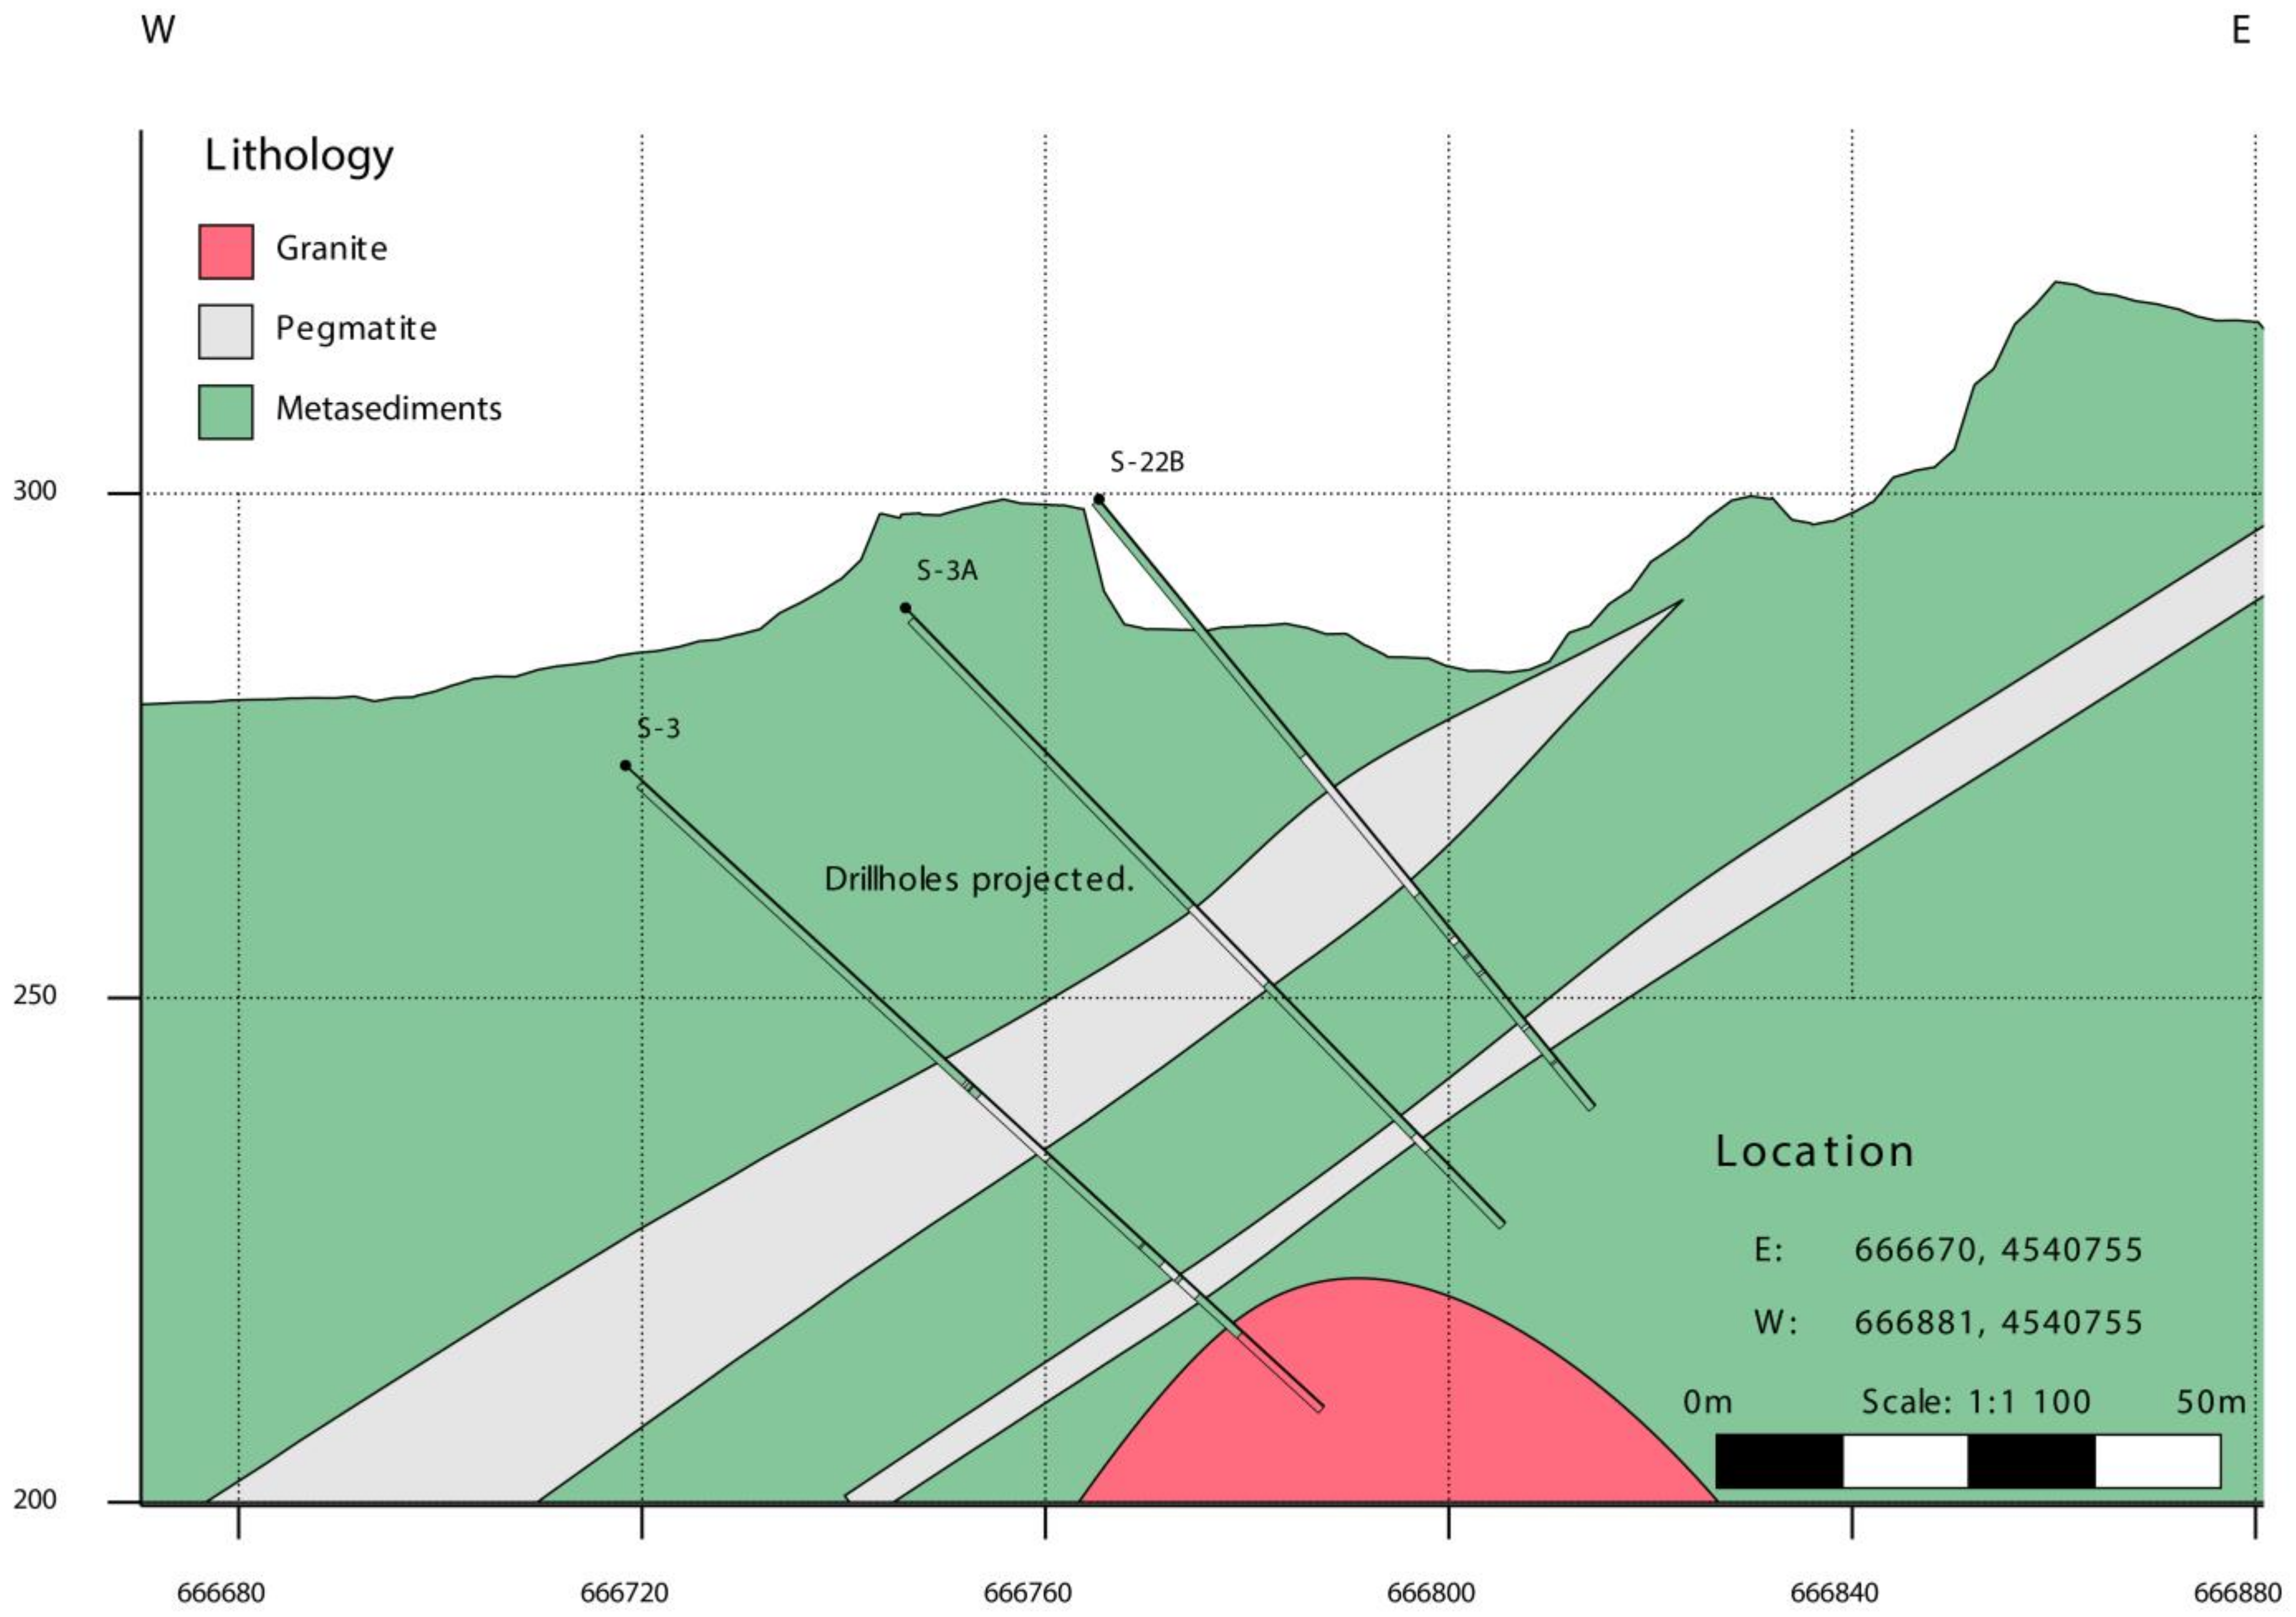
Li mineralisations in the study area occur principally in aplite–pegmatite bodies and hydrothermal veins [8], all with spatial relation to a granitic body (Figure 2). Regionally, Li mineralisation occurs in highly evolved aplite–pegmatite dykes hosted within metasedimentary rocks, with an increasing fractionation degree as the distance to the granite increases [8,42]. However, the regional granites are enriched in elements such as Li, P, or Rb when compared with the metasediments [13]. It is therefore important to separate these two lithologies, since Li signals could occur both in granites from their initial Li content (low Li content but huge volume) or Li pegmatites (high Li content but low volume), but cannot be clearly distinguished in the stream sediment data (Figure A1; Appendix A). Hence, we excluded stream sediment data from granite areas since pegmatitic Li mineralisations (in the study area) are commonly hosted only by metasedimentary rocks and apical or marginal areas of granitic intrusions hosted by metasediments [42]. Therefore, the prediction models will not cover the granitic areas (which are of low interest for Li-bearing pegmatites).

2.4. Unclassified Factor Analysis

Unclassified factor analyses of the stream sediment data were conducted using the statistical software Statgraphics Centurion XV to obtain a preliminary overview of the elements related to local Li mineralisation and to reduce the overall input data for the prediction software. The stream sediment data were clipped by the buffered extent of the mapped pegmatites (buffer 1000 m) to reduce the obscuring influence of samples from granitic and metamorphic rocks on pegmatitic samples.
Seven factor classes (with Eigenvalues > 1) could be identified and attributed: (1) metamorphic signature, (2) granitoid signature, (3) polymetallic signature, (4) siliceous signature, (5) Li-emphasised, (6) Sn(–Nb)-emphasised, and (7) W–Ti-emphasised. The Li-emphasised class has relatively high Li contents and shows coherent enrichments in Sn, As, Mo, Cu, and Ag. The data from these elements were subsequently used in the ANN model.

2.5. Sentinel-2 Imagery

Sentinel-2 image data were freely downloaded from the online data archive of the European Space Agency (ESA) (https://scihub.copernicus.eu/dhus; accessed on 23 June 2021). Their properties are described in Table 1. The selected acquisition meets the following criteria: (1) complete coverage of the study area; (2) cloud-free image over the study area; (3) good exposure of the Li mineralisation on the ground surface during the acquisition time.
The proposed approach for the identification of Li-bearing pegmatites with optical images applies only to vegetation-free or -less areas, and ideally to regions with visually exposed bedrock. In the present study case, the study area is dominated by poor vegetation coverage and therefore represents adequate conditions for the identification of Li pegmatites exposed on the ground surface.
The selected satellite image is available as a Bottom-of-Atmosphere product (Level 2A), i.e., the reflectance values are already atmospherically corrected and refer to the surface reflectance. The raw spectral reflectance values were further pre-processed as denoted in the following steps:
  • Super-resolving Sentinel-2 Multispectral Imagery to 10 m spatial resolution
    The low-resolution spectral reflectance bands (20 m and 60 m) were super-resolved to 10 m ground sample distance, using a convolutional neural network (CNN) as introduced by Lanaras et al. [43]. This approach extracts details from pixels with the highest resolution (four bands at 10 m resolution) and propagates these details to all other spectral bands (eight bands at 20 m and 60 m resolution) using the local consistency between neighbour pixels, to obtain an image where all spectral bands have a resolution of 10 m while preserving the spectral characteristics. This pre-processing step is useful for detecting features at the size of 200–250 m2.
  • Dimensionality Expansion for Sentinel-2 Multispectral Imagery
    In order to increase the multispectral data dimensionality and the performance of analysis (see Section 3), a method described in [44] to generate nonlinearly correlated spectral band images is implemented. For this purpose, suitable Sentinel-2 spectral bands for geological applications [33] are taken into consideration (Table 2).

2.6. External Data

In order to reduce spectral variability, urban areas, transport infrastructure, and main water bodies were masked out using the Open Street Map (OSM) database. The OSM topographical dataset was downloaded at (https://download.geofabrik.de/; accessed on 23 June 2021). The used OSM layers included:
-
Polygon features of urban areas, stored in the “landuse” layer;
-
Polygon features of water bodies, stored in the “water” layer, and;
-
Polyline features of the road infrastructure, stored in the “roads” layer.
The OSM features in the study area were corrected accordingly using the underlying Sentinel-2 image. They were used as controlling parameters to mask out these features from the remote sensing models.

2.7. Training Patterns

The study area is well-known for the presence of Li-bearing mineralisation (pegmatites). Typically, training patterns of exposed Li pegmatites over the ground surface have been collected at three open-pit mines over the study area: the Bajoca (located in Portugal), Feli, and Alberto mines (located in Spain) (Figure 1). All data are projected to the Lisboa_Hayford_Gauss_IGeoE coordinate system (WKID: 102164; EPSG:20790). A geographical grid projected into WGS_1984 is inserted into all presented maps for illustration purposes. The transformation succeeded with the transformation parameters integrated with the ArcGIS Software (ArcGIS 10.6, Environmental Systems Research Institutery, Redlands, CA, USA).
In this context, it is important to consider that the reflection intensity of Li-bearing pegmatites (albedo) is expected to be slightly different at various locations due to the dominance of diverse Li minerals (petalite in Bajoca Mine, lepidolite in Feli Mine, and spodumene in Alberto Mine). Furthermore, the sample colour, rock surface structure, and weathering conditions of Li minerals might represent controlling factors too. For example, reflectance spectroscopy studies of petalite, spodumene, and lepidolite from the Bajoca, Alberto, and Feli mines, respectively, have shown that even fresh petalite and spodumene samples present diagnostic features of illite and/or other clay minerals (Supplementary Figure S2) [45,46,47]. Oppositely, lepidolite presented diagnostic absorption features that allowed its identification in the collected spectra from Feli Mine. Detailed petrographic, mineralogical, and geochemical studies conducted in Bajoca Mine showed that the same alteration minerals can be present in samples with distinct degrees of alteration [48]. This is reflected in the spectral signatures (reflectance values as a function of the wavelength) for all three mines (Supplementary Figure S2). Obviously, the Li-bearing minerals in Alberto Mine depict slightly different properties, explained through the different exposure conditions of Li minerals in the mine, respectively. Nonetheless, it is noteworthy that Li-bearing minerals show relevant hydroxyl-related absorption features that coincide with Sentinel-2 Band 12 (Supplementary Figures S1 and S2). This absorption is also observed on the spectral signature collected in the pixels of the training areas (Supplementary Figure S2).
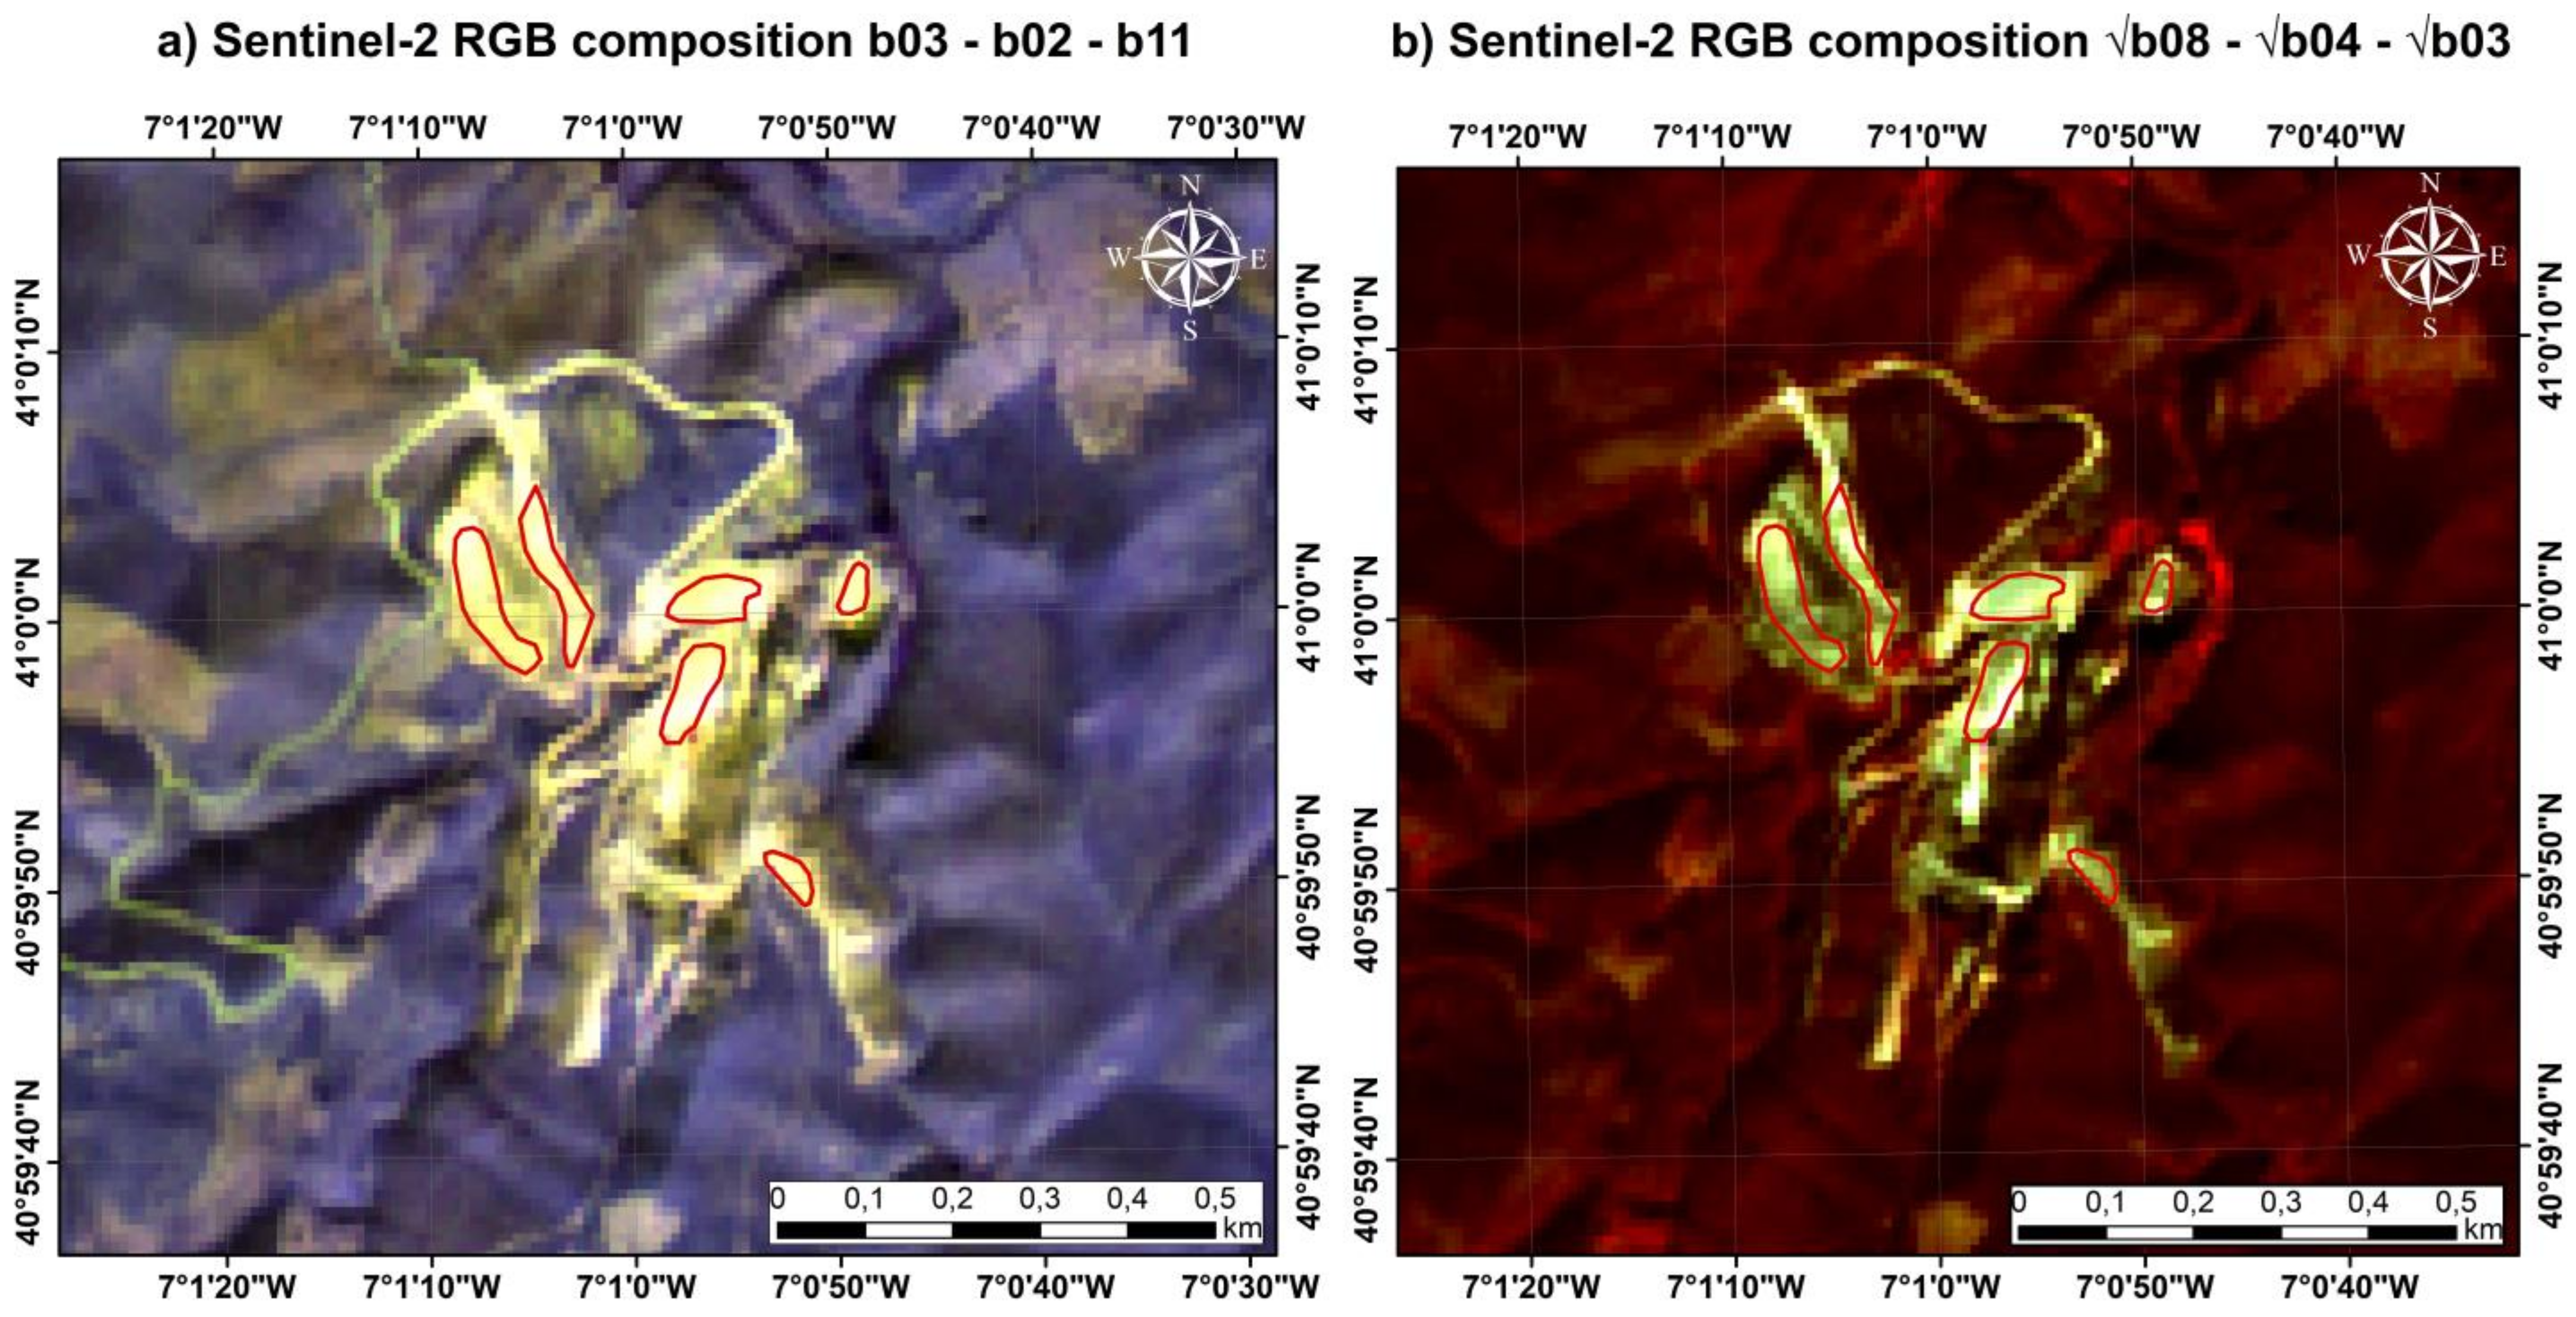
Taking this into account, the training patterns for the supervised machine learning algorithm were only collected in Bajoca Mine, due to its size and exposure on the ground surface and the representative spectra of the Li pegmatites. The polygons were digitised based on the Sentinel-2 image to represent the actual state of the mine site during the acquisition time of satellite imagery. For this purpose, different RGB combinations, suitable for geologic applications, were used as background images (Figure 3). The three stockpiles at the centre are from the Li pegmatite itself, whereas the two westernmost and the southmost piles are waste piles from the host rock and feature lower Li contents. Waste rock piles were used as additional training areas to simulate the metasomatism of host rocks.

3. Methods: Prediction Modelling

The ANNs of multilayer perceptron type are implemented in the advangeo® Prediction Software from Beak Consultants GmbH (www.advangeo.com; accessed on 23 June 2021). The modelling and prediction software is developed to model spatial data and analyse complex relationships between a wide variety of spatial influencing parameters and a given prognostic event or occurrence, by using methods of artificial intelligence within a familiar GIS environment. The base principle is the ability of artificial neural networks to generalise and learn from non-linear relationships and model natural complex processes and events, which are difficult or impossible to be described with analytical mathematics [49]. The software is available as a standalone application with a user-friendly interface, which enables the user to flexibly create and build parametrised models.
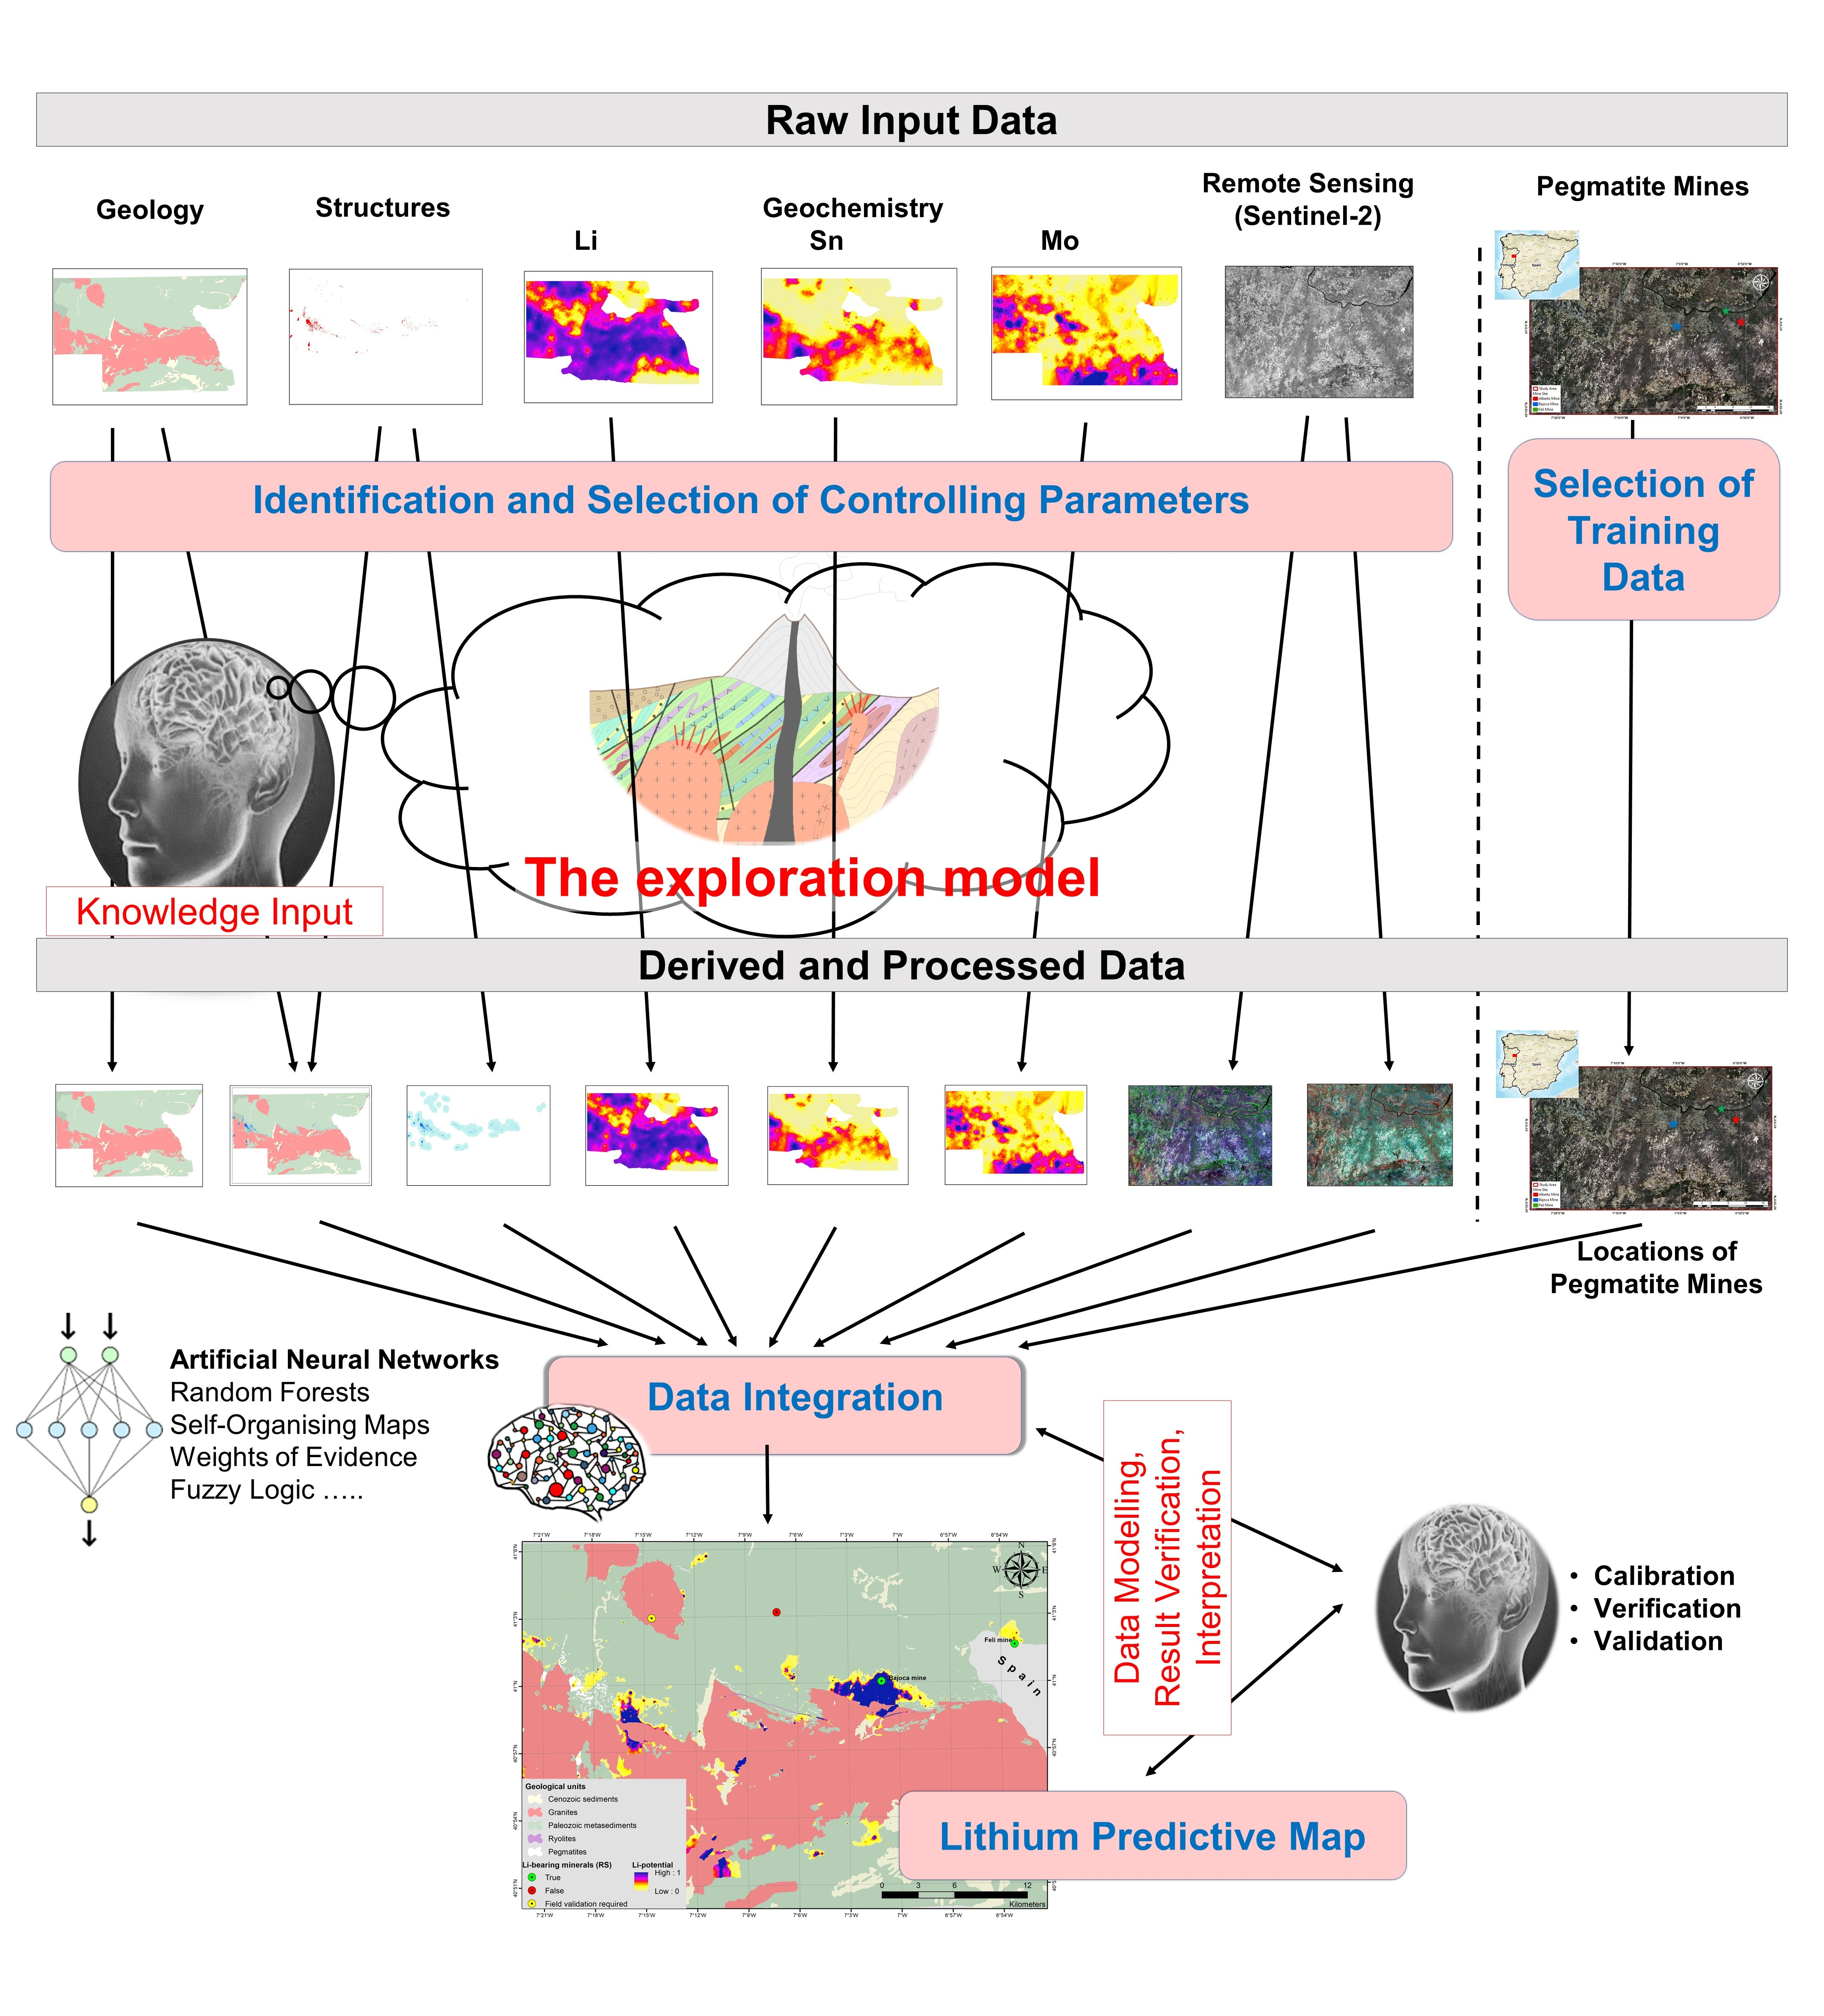
In this study, the prediction software is used to perform artificial neural networks of multilayer perceptron type to identify Li mineralisation over the given study area according to the processing schema in Figure 4.
The main workflow is described through the following steps:
  • Collection of model input data, i.e., data that control the modelled feature (here the Li mineralisation) including geological units and structures (e.g., granite bodies, metamorphic sequences, pegmatites), selected stream sediment data, cloud-free pre-processed Sentinel-2 satellite imagery, and OSM topographical data (settlements, infrastructure, water bodies, etc.).
  • Data processing of the spatial data to become suitable for use in analysing models, including the projection of input data to the project coordinate system, resampling to the specified spatial resolution according to project requirements, and clipping of input datasets to the extent of the project area as well as linear scaling of continuous raster data values between 0 and 1 and the conversion of discrete vector data into a binary raster with 0 and 1 value.
  • Design of ANN models in the prediction software for different use cases, i.e., using different controlling parameters and suitable training patterns. The training patterns for remote sensing modelling are ideally in obvious spectral contrast to the surrounding environment and with distinctive spectral reflectance characteristics. The training scenario comprises the controlling and the network parameters (number of hidden layers, number of neurons for each layer, the maximum number of training epochs, etc.).
  • Training of the ANN models using collected training patterns at the Bajoca Mine site, a well-known location for the presence of Li-bearing minerals. Other known locations (Feli and Alberto Mine) were used to validate the application model. The trained ANN will serve to identify similar Li-bearing pegmatite locations in unknown locations over the study area.
  • Validation of the trained ANNs: There are several possibilities to evaluate the accuracy and reliability of a trained ANN by the identification of known locations that have not been used for network training (Feli and Alberto Mine), considerations of the network (MSE) error including statistical evaluation (histograms, all pixels vs. the positive pixels), and analysis of the model parameter weights. Typically, MSE errors below 0.2, balanced parameter weights, and a high probability of modelled pixels are indicators of stable and good neural network quality.
  • Model application: After successful validation, the training network can be used in unknown locations for the prediction of similar events over the entire study area. The result is a distribution probability raster map.
  • Refinement and presentation: The ANN classification results are irregular pixel-based raster data. In many cases, the classification results have to be further refined and processed to improve the cartographic representation of the result.
  • The final distribution map of Li-bearing mineralisation: Combination of the distribution map result based on remote sensing data with the result obtained from modelling with geological and geochemical data. The combination of both geological and remote sensing data into one ANN model was tested, but it resulted in many false interpretations, as the controlling parameters refer to/explain different targets. Therefore, we chose the approach to merge the two ANN models only as a final step once distribution maps of Li-bearing mineralisation were created.

4. Results

Several prediction models with different controlling parameters have been designed with the described principles and workflow. Here, the most significant models and results are presented.

4.1. Geological Model

Controlling parameters of the geological model include digitised geological units (1:50,000), digitised pegmatites (1:50,000), and selected stream sediment data. The modelling was carried out using ANNs of multilayer perceptron type. The model accuracy is evaluated by the following quality parameters:
  • The network (MSE) error: The model error is shown in Supplementary Figure S3. Clearly, the model error converges after approximately 20 iterations and the final error is below 0.2, indicating that the neural network is stable and accurate. This means that the designed model was able to find correlations between the controlling parameters and the training data.
  • Statistical evaluation: Additionally, the histograms (Supplementary Figure S3) reveal that the algorithm was able to identify >80% of the pixels in the training patterns with a scale better than 0.9.
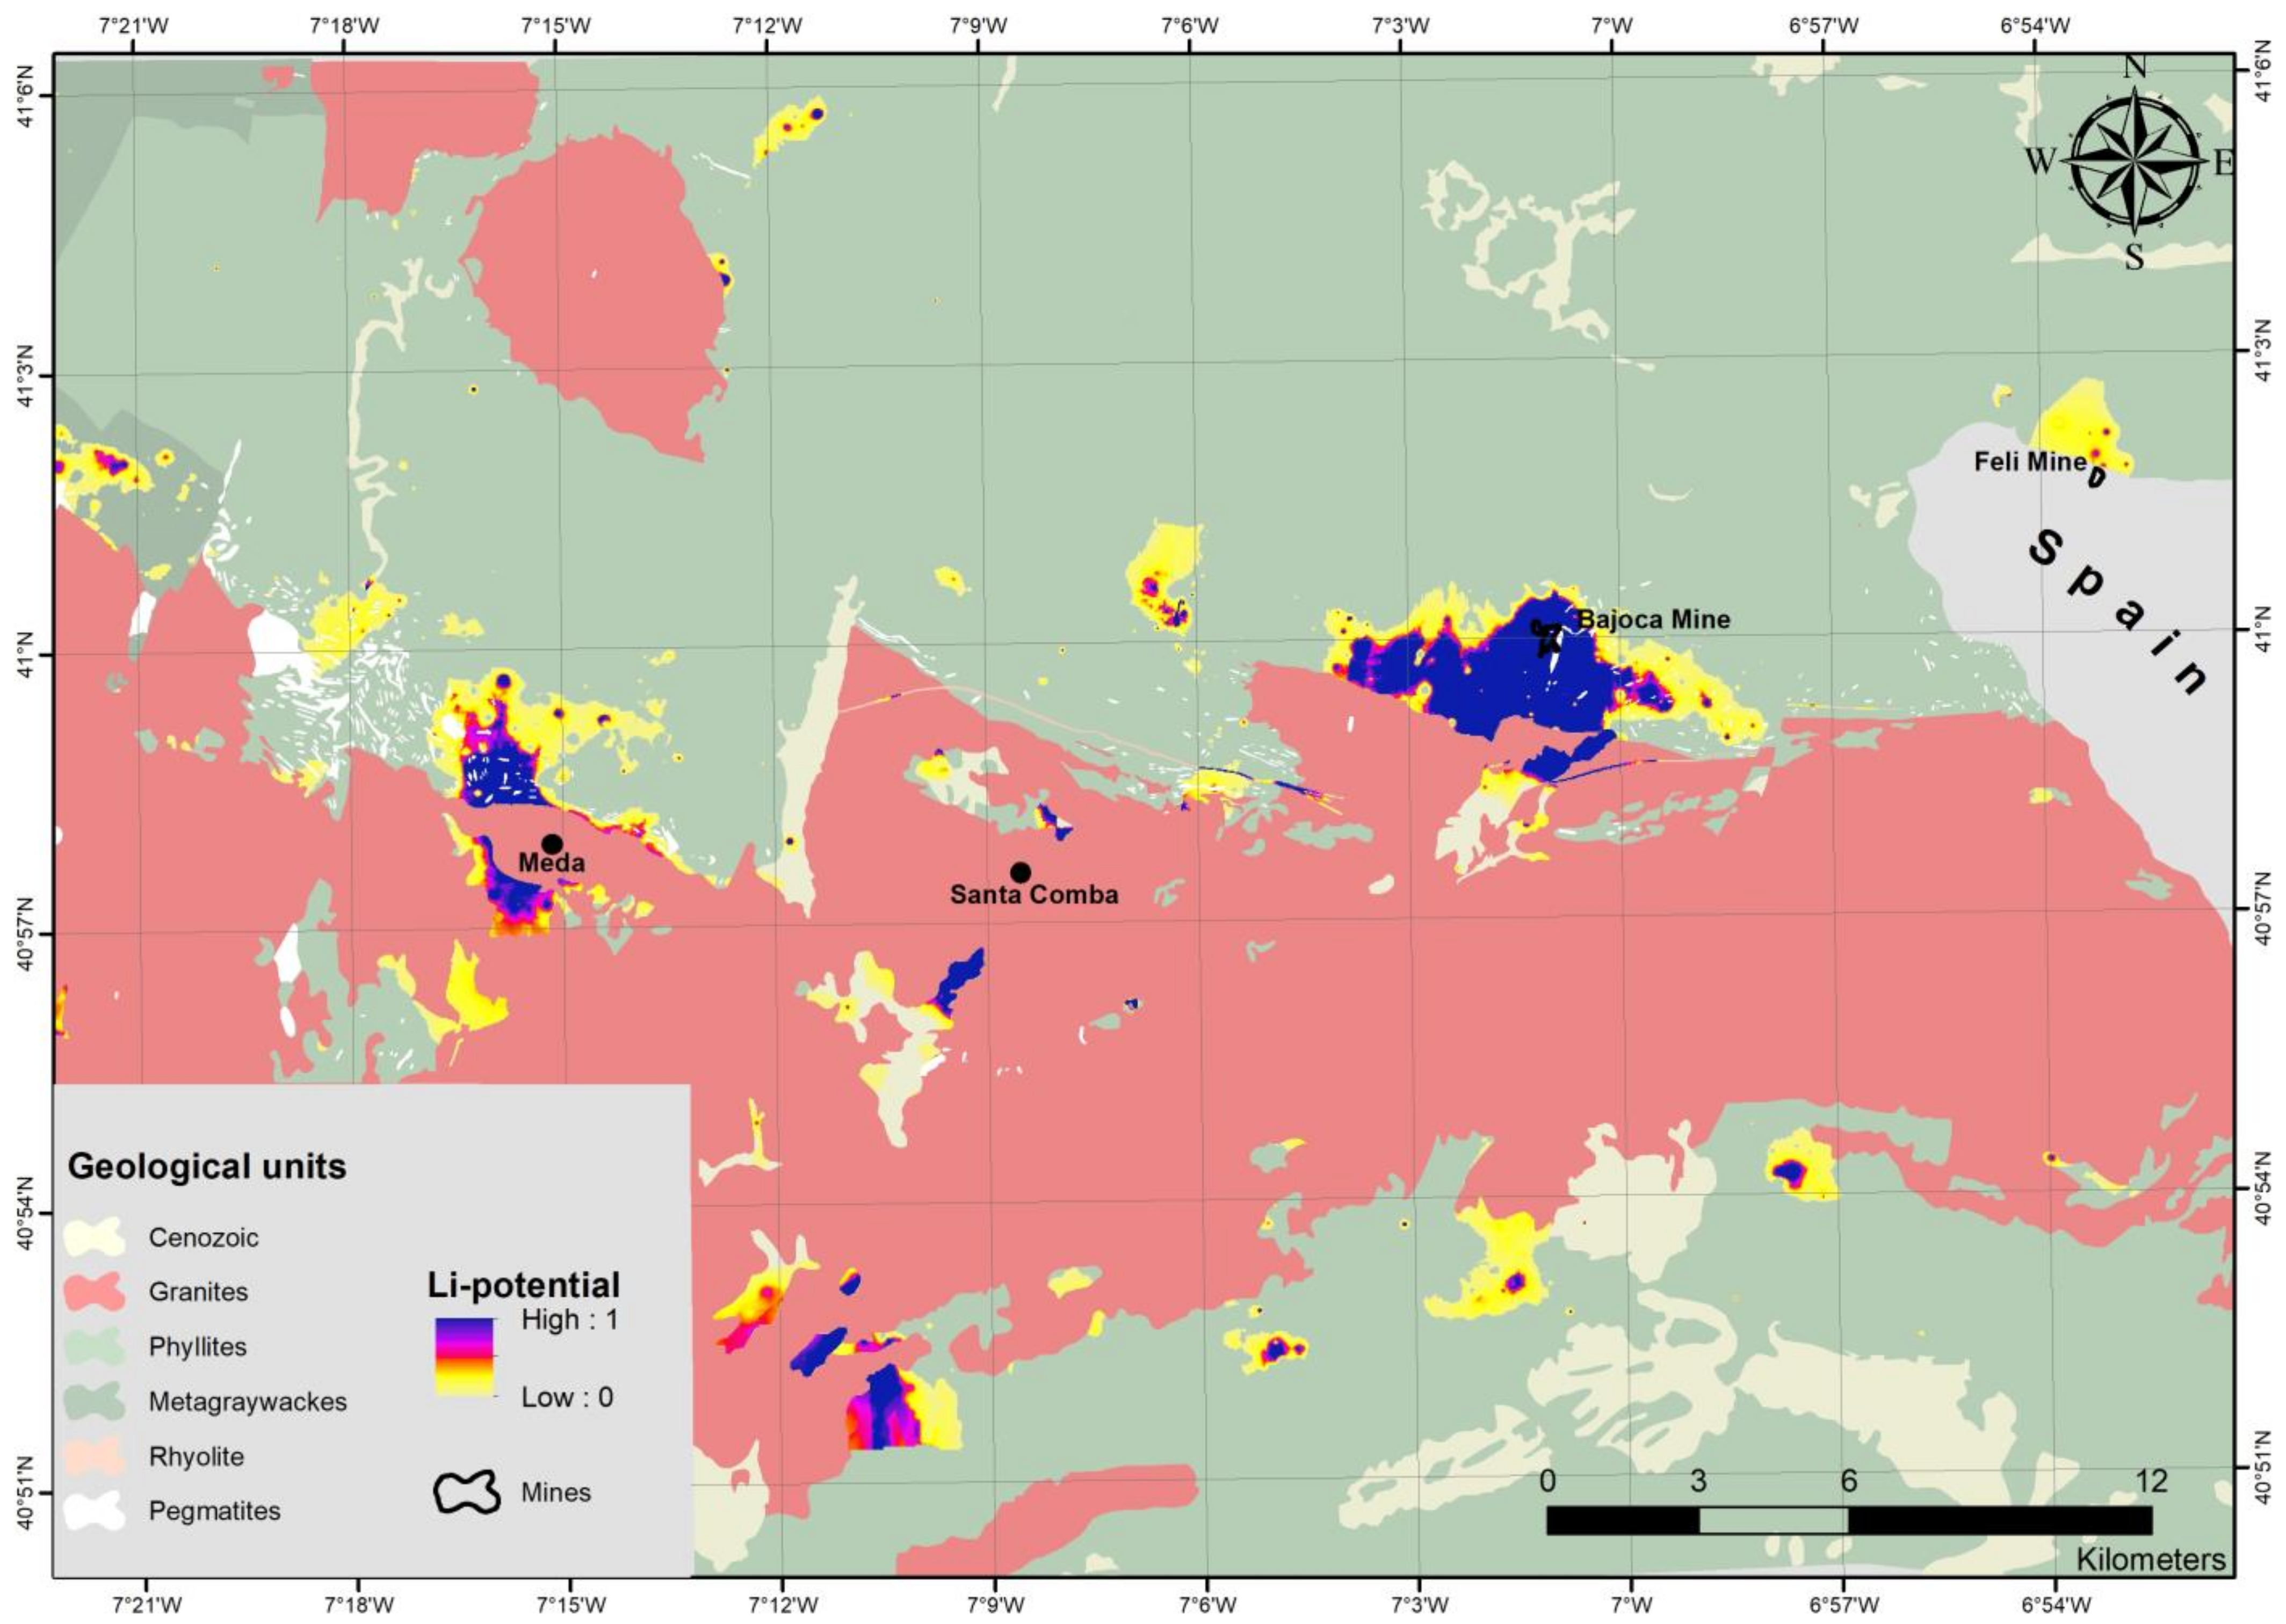
The prediction software delivers a distribution probability map in the value range of 0–1, illustrating the Li potential over the study area (Figure 5). Areas depicted with 1 or close to 1 are the areas with the highest probability of Li-bearing rocks. Within the study area (approximately 1200 km2), 50 km2 are mapped with Li potential between 0.1 and 1 (Figure 5). These areas are mainly located in regions of metamorphic rocks in the vicinity of granite intrusions, compatible with possible greisen cupolas or pegmatites and their host rocks. High predictive areas (>0.5 Li probability) extend over 6.4 km2 and are mainly located directly to the south/southwest of Bajoca Mine (5.6 km2) and to a lesser extent north of the town of Meda (0.47 km2) as well as southwest of Santa Comba village (0.35 km2).

4.2. Remote Sensing Models

4.2.1. Remote Sensing Model 1

Controlling parameters of Remote Sensing Model 1 include: Sentinel-2 super-resolved spectral bands (visible, NIR, red-edge, and SWIR) and OSM topographical dataset.
The modelling was carried out using ANNs of multilayer perceptron type. The model accuracy is evaluated by the following quality parameters:
  • The network (MSE) error: The model error converges after approximately 40 iterations and the final error is below 0.2 (Supplementary Figure S4), indicating that the ANN is stable and accurate. This means that the designed model was able to find correlations between the controlling parameters and the training data.
  • Statistical evaluation: The histograms (Supplementary Figure S4) reveal that the algorithm was able to identify about 90% of the pixels in the training patterns with a scale better than 0.9.
  • The model parameter weights: The model weights confirm the Sentinel-2 visible (b2, b3, b4), NIR (b8, b8A), and SWIR (b11) spectral bands to be the most suitable for geological applications. On the other hand, the spectral bands in the red-edge part of the electromagnetic spectrum seem to be irrelevant for this application. The spectral bands with the highest weight contribution in the designed model are b2, b3, and b11. This is in accordance with Cardoso-Fernandes et al. (2019), who proposed the RGB combination Green–Blue–SWIR for the identification of Li mineralisation in the same region. The RGB composition out of b3–b2–b11 was further analysed in ArcGIS software 10.6 (Figure 6). Indeed, the well-known areas for Li mineralisation are successfully identified and highlighted compared to their surrounding environment. However, similar symbology is also assigned to other features with similar spectral properties as the target features.
  • The distribution probability raster map: The prediction software delivers a distribution probability map in the value range of 0–1, illustrating locations of potentially identified Li-bearing pegmatites in the study area (Figure 6). With 1 are depicted areas with the highest probability to represent Li-bearing mineralisation. In the resulting map, pixel values with a probability value higher than 95% were assigned as “positive” locations. The threshold value is defined based on the histograms in Supplementary Figure S4.
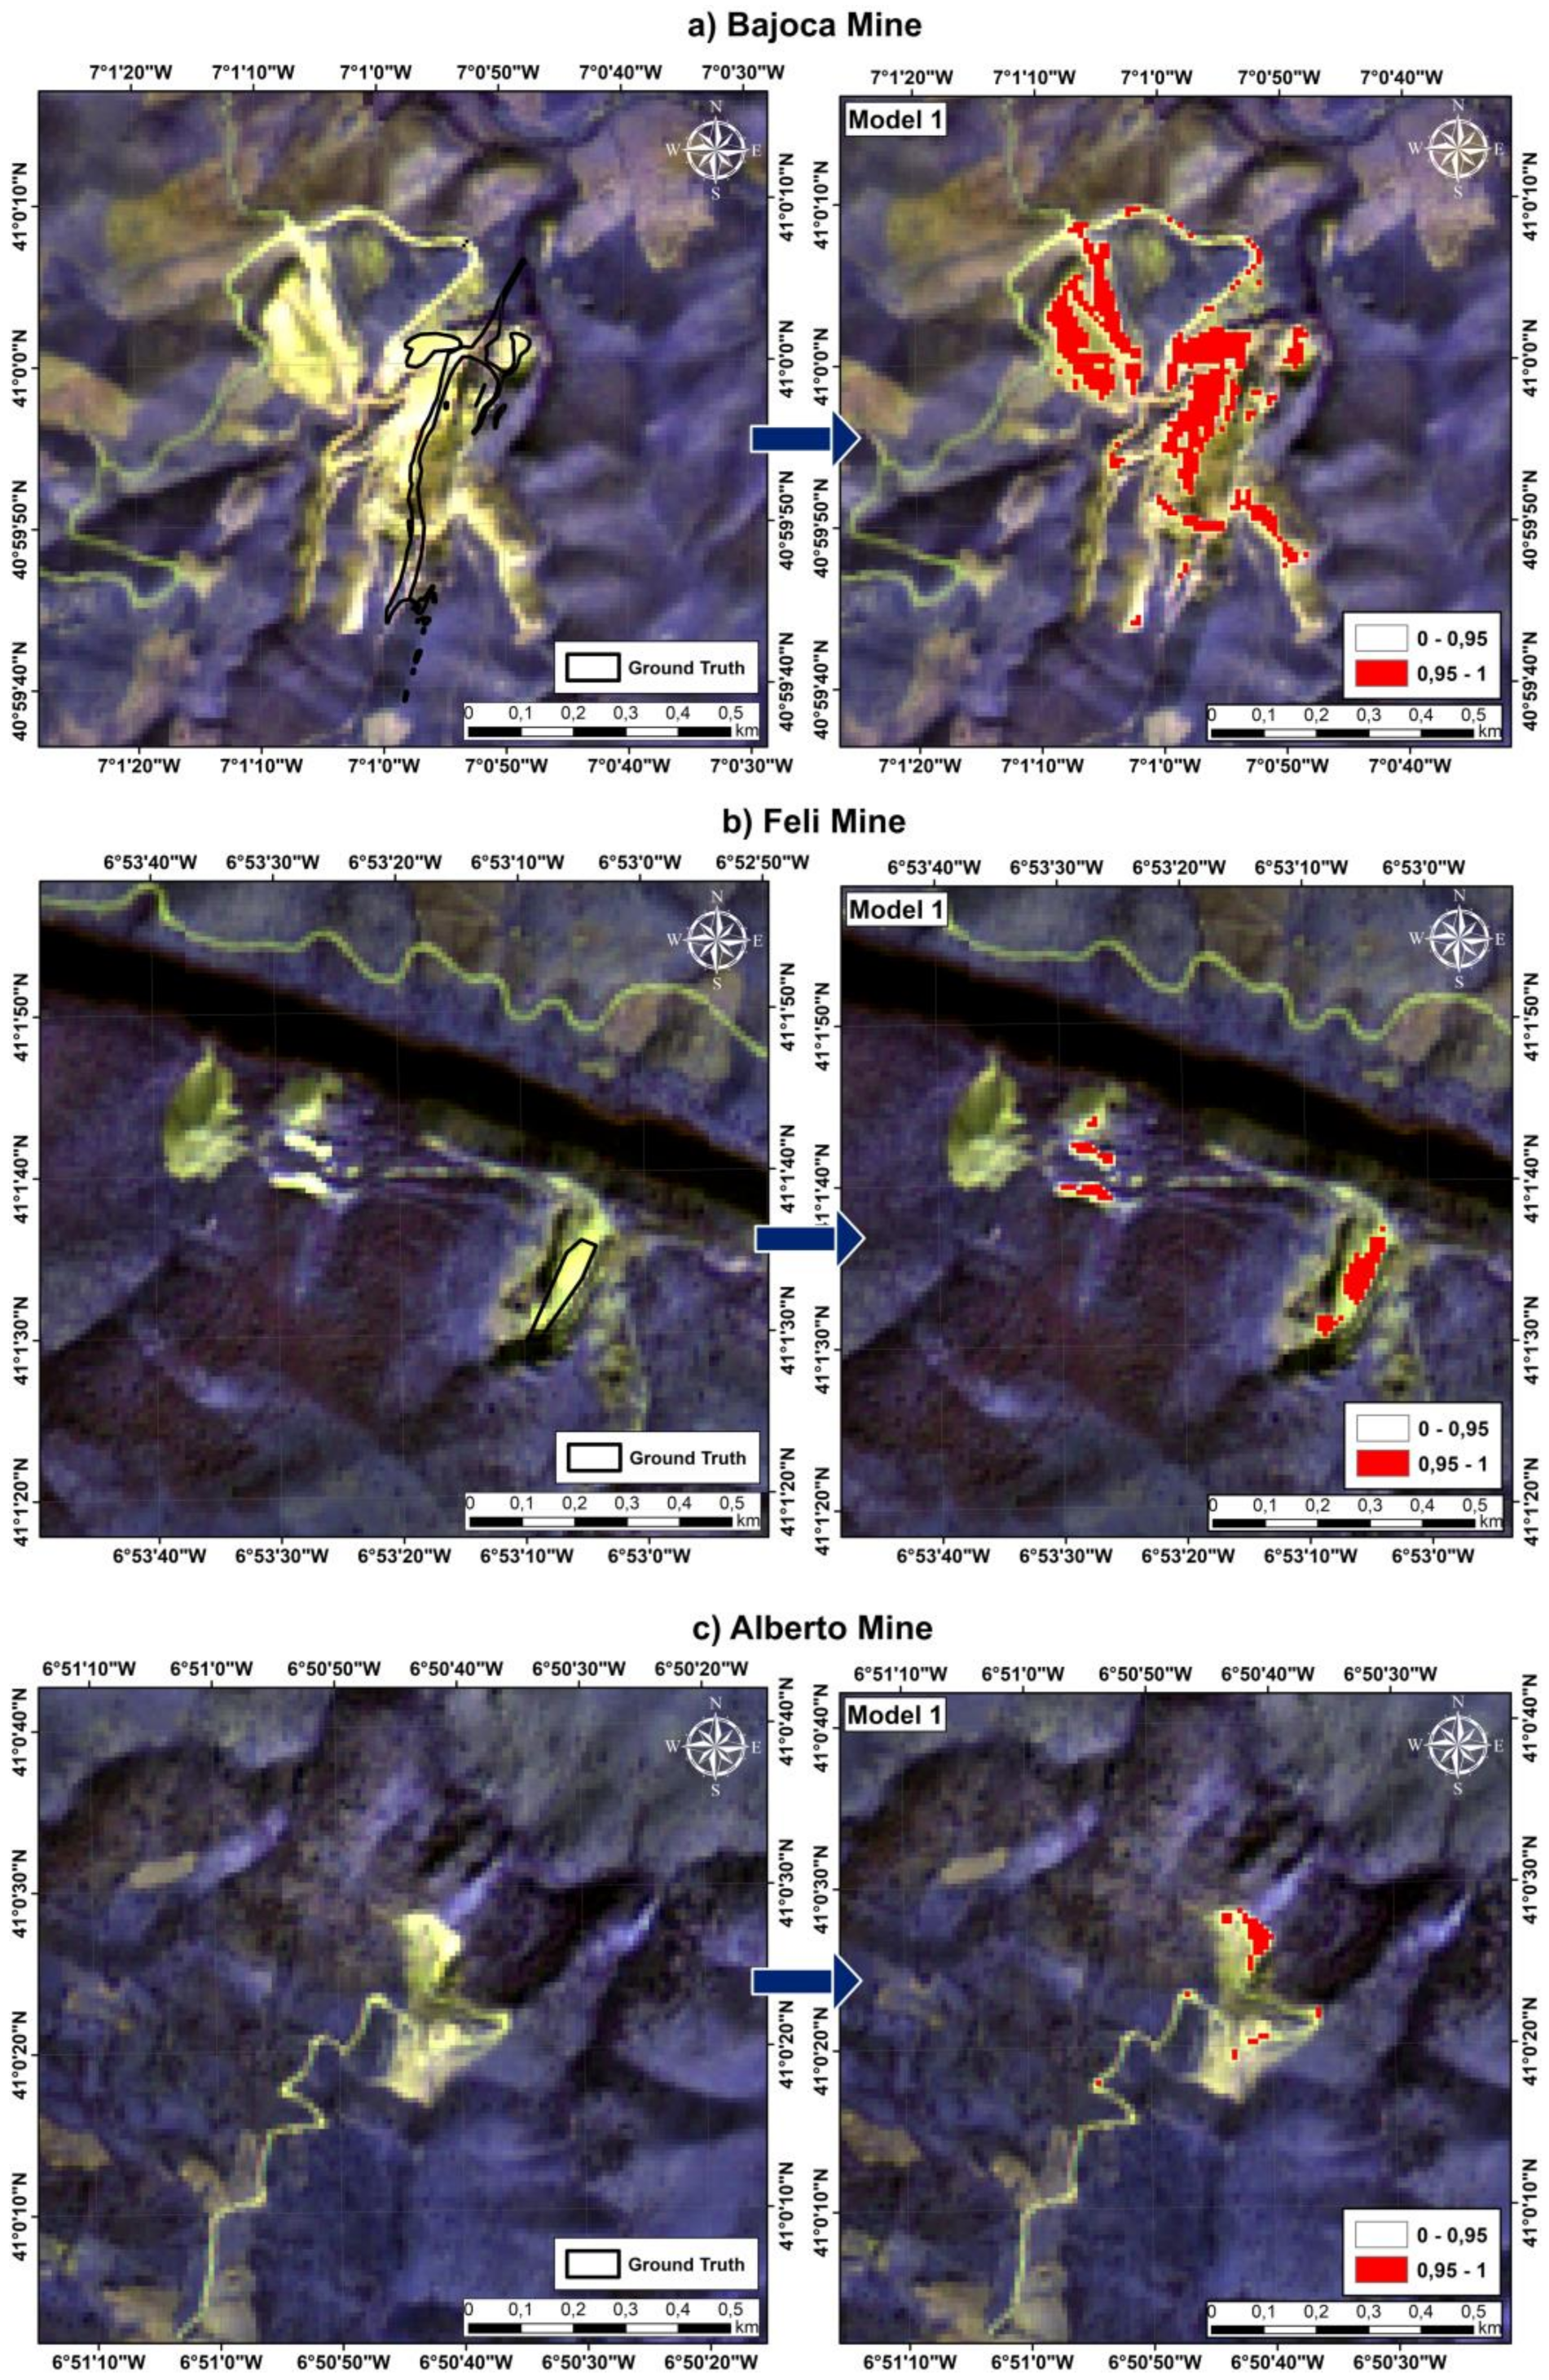
The validation of the identified areas in the resulting map with the underlying Sentinel-2 image revealed that all known locations of the open-pit mines with exposed Li pegmatites were successfully detected (Figure 7). As expected from the results of spectral analysis (Supplementary Figure S2), Li-bearing mineralisation at Alberto Mine was only partially detected due to the different mineralogical composition in contrast to Bajoca Mine.
However, the validation of the distribution map over the entire study area revealed that other features with no evidence of Li presence (other mine sites, barren areas with exposed bedrock, etc.) but with similar spectral reflectance properties were also classified as “positive” pixels. Some examples are highlighted in Figure 8.
For a more detailed investigation, samples of “positive” classified pixels were randomly collected and their spectral reflectance properties were further analysed using the extended spectral bands described in Table 2.

Analysis of Spectral Signatures

The misclassified areas with similar surface reflectance properties as the target features (Li pegmatites) were further analysed to depict the most suitable bands to differentiate them. For this purpose, samples of features with similar spectral properties based on Model 1 were collected and their spectral signatures were graphically analysed and compared. These analyses revealed the most suitable extended bands to identify Li pegmatites and differentiate them from other features with similar spectral properties. The graphs are illustrated in Supplemental Figure S5. The reference spectral signature of the main outcropping lithologies (Li pegmatites, metasediments, and granitoid rocks) is presented in Supplemental Figure S6. In the case of the spectra of the metasedimentary rocks, they correspond to samples collected in the false positive area identified with an orange circle in Figure 8.
These analyses revealed that some of the extended bands were more likely to provide the best class separability between the selected patterns. The relevant bands are highlighted in Table 3 and were used in a second prediction model to better identify Li pegmatites.

4.2.2. Remote Sensing Model 2

Controlling parameters of Remote Sensing Model 2 include selected Sentinel-2 extended bands (Table 3), the distribution probability map from Model 1, and the OSM topographical dataset. The modelling was carried out using ANNs of multilayer perceptron type. The model accuracy is evaluated by the following quality parameters:
  • The network MSE error: A stable network MSE error that converges after 20 iterations and exceeds a final error lower than 0.001 (Supplementary Figure S7);
  • Statistical evaluation: Similar plausible histograms as shown in Supplementary Figure S7;
  • The model parameter weights: Distributed weights of controlling parameters. The combinations (b32), (b3 × b4), and (b8 × b11) were revealed to be significantly decisive for the prediction model.
Furthermore, the well-known locations for the presence of Li pegmatites were successfully detected in the distribution probability map of Remote Sensing Model 2 (Figure 9). The validation of the distribution map over the entire study area revealed that noises were drastically reduced compared to the results from Model 1. This is reflected through the following statistics (Table 4).
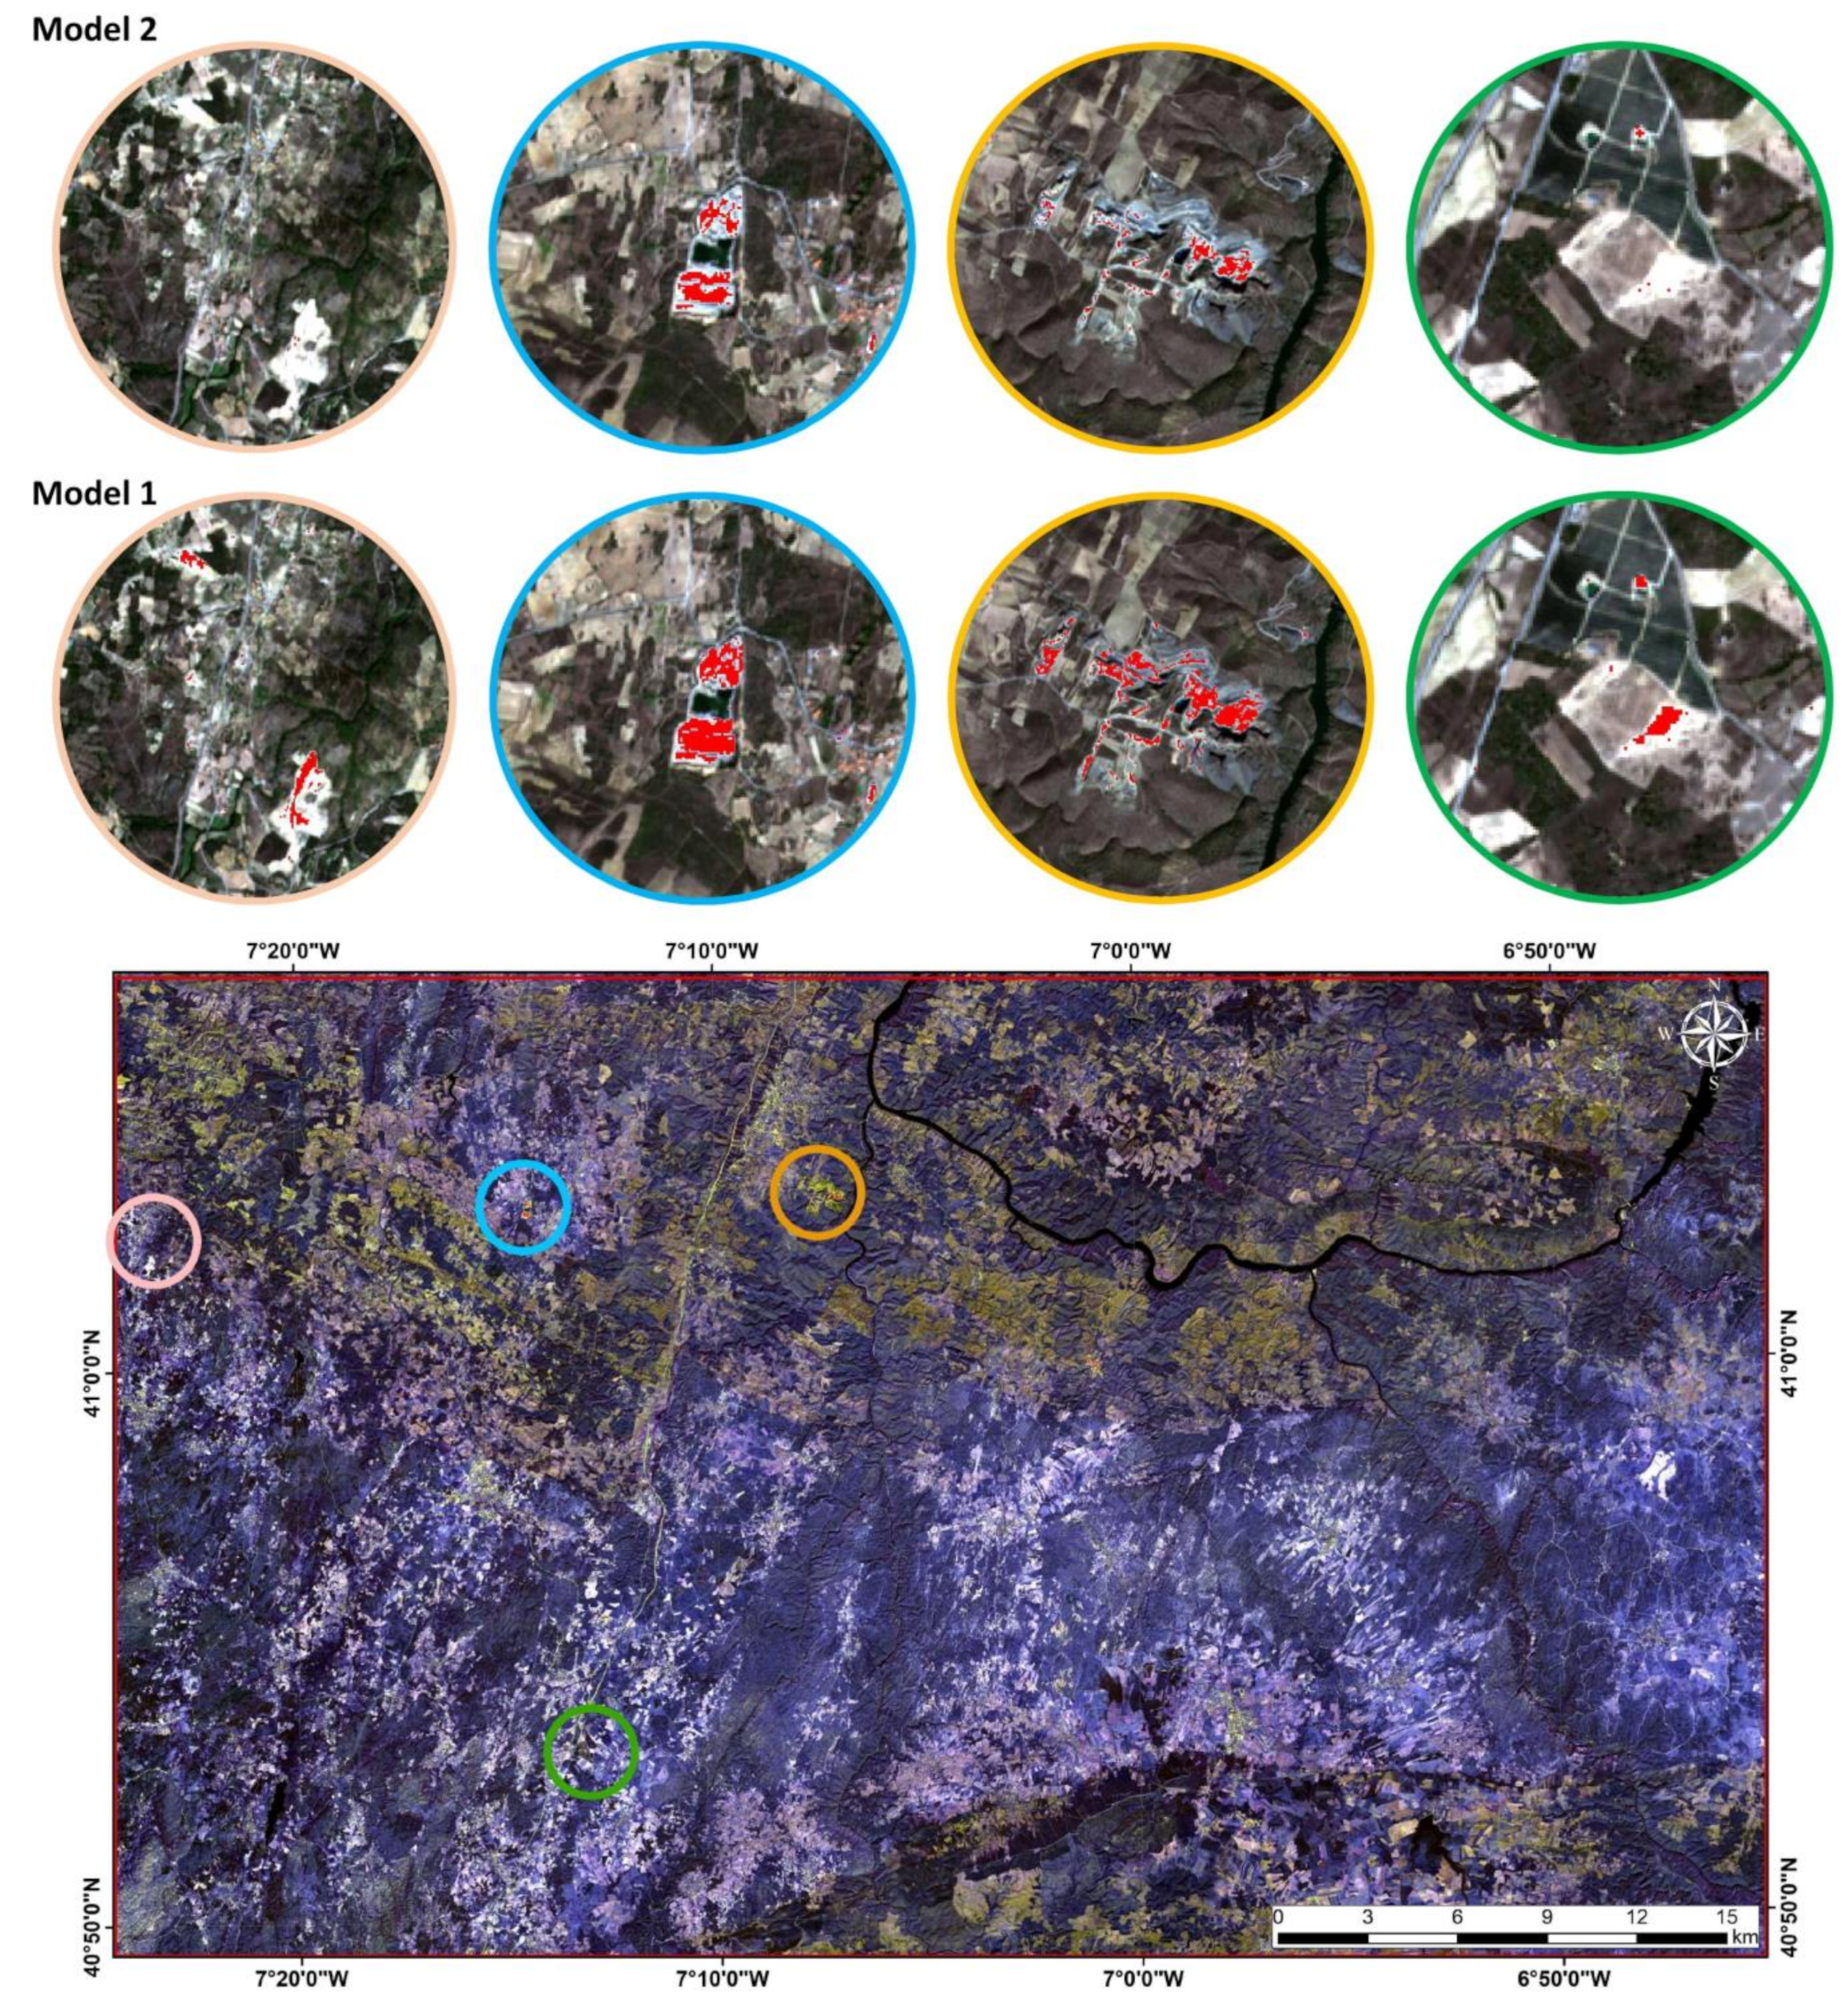
Analogously to Model 1, the results were validated using the underlying Sentinel-2 RGB composition from the visible bands. The selected areas for the illustration of misclassified pixels in Figure 6 were re-validated with the results obtained from Model 2 (Figure 10). These sections show an obvious reduction/elimination of the misclassified pixels over the study area and thus an improved distribution map based only on remote sensing data.
The distribution raster map was further refined using GIS tools available in ArcGIS software, such as Boundary Clean, Majority Filter, etc., to remove the isolated pixels to improve the cartographic representation of the map.
The resulting raster was converted into vector data and further refined using tools such as Aggregate Polygons to cluster near-lying polygons representing the same physical feature.
The actual designed map (Figure 11) illustrates high-probability locations for Li mineralisation, exposed to the ground surface, based only on remote sensing data.
In the next step, this result was combined with the model based on geological datasets to finally conclude on the location of Li-bearing minerals over the study area. The final map result based only on remote sensing data is shown in Figure 11.

4.3. Combination of the Geological- and Remote Sensing Models

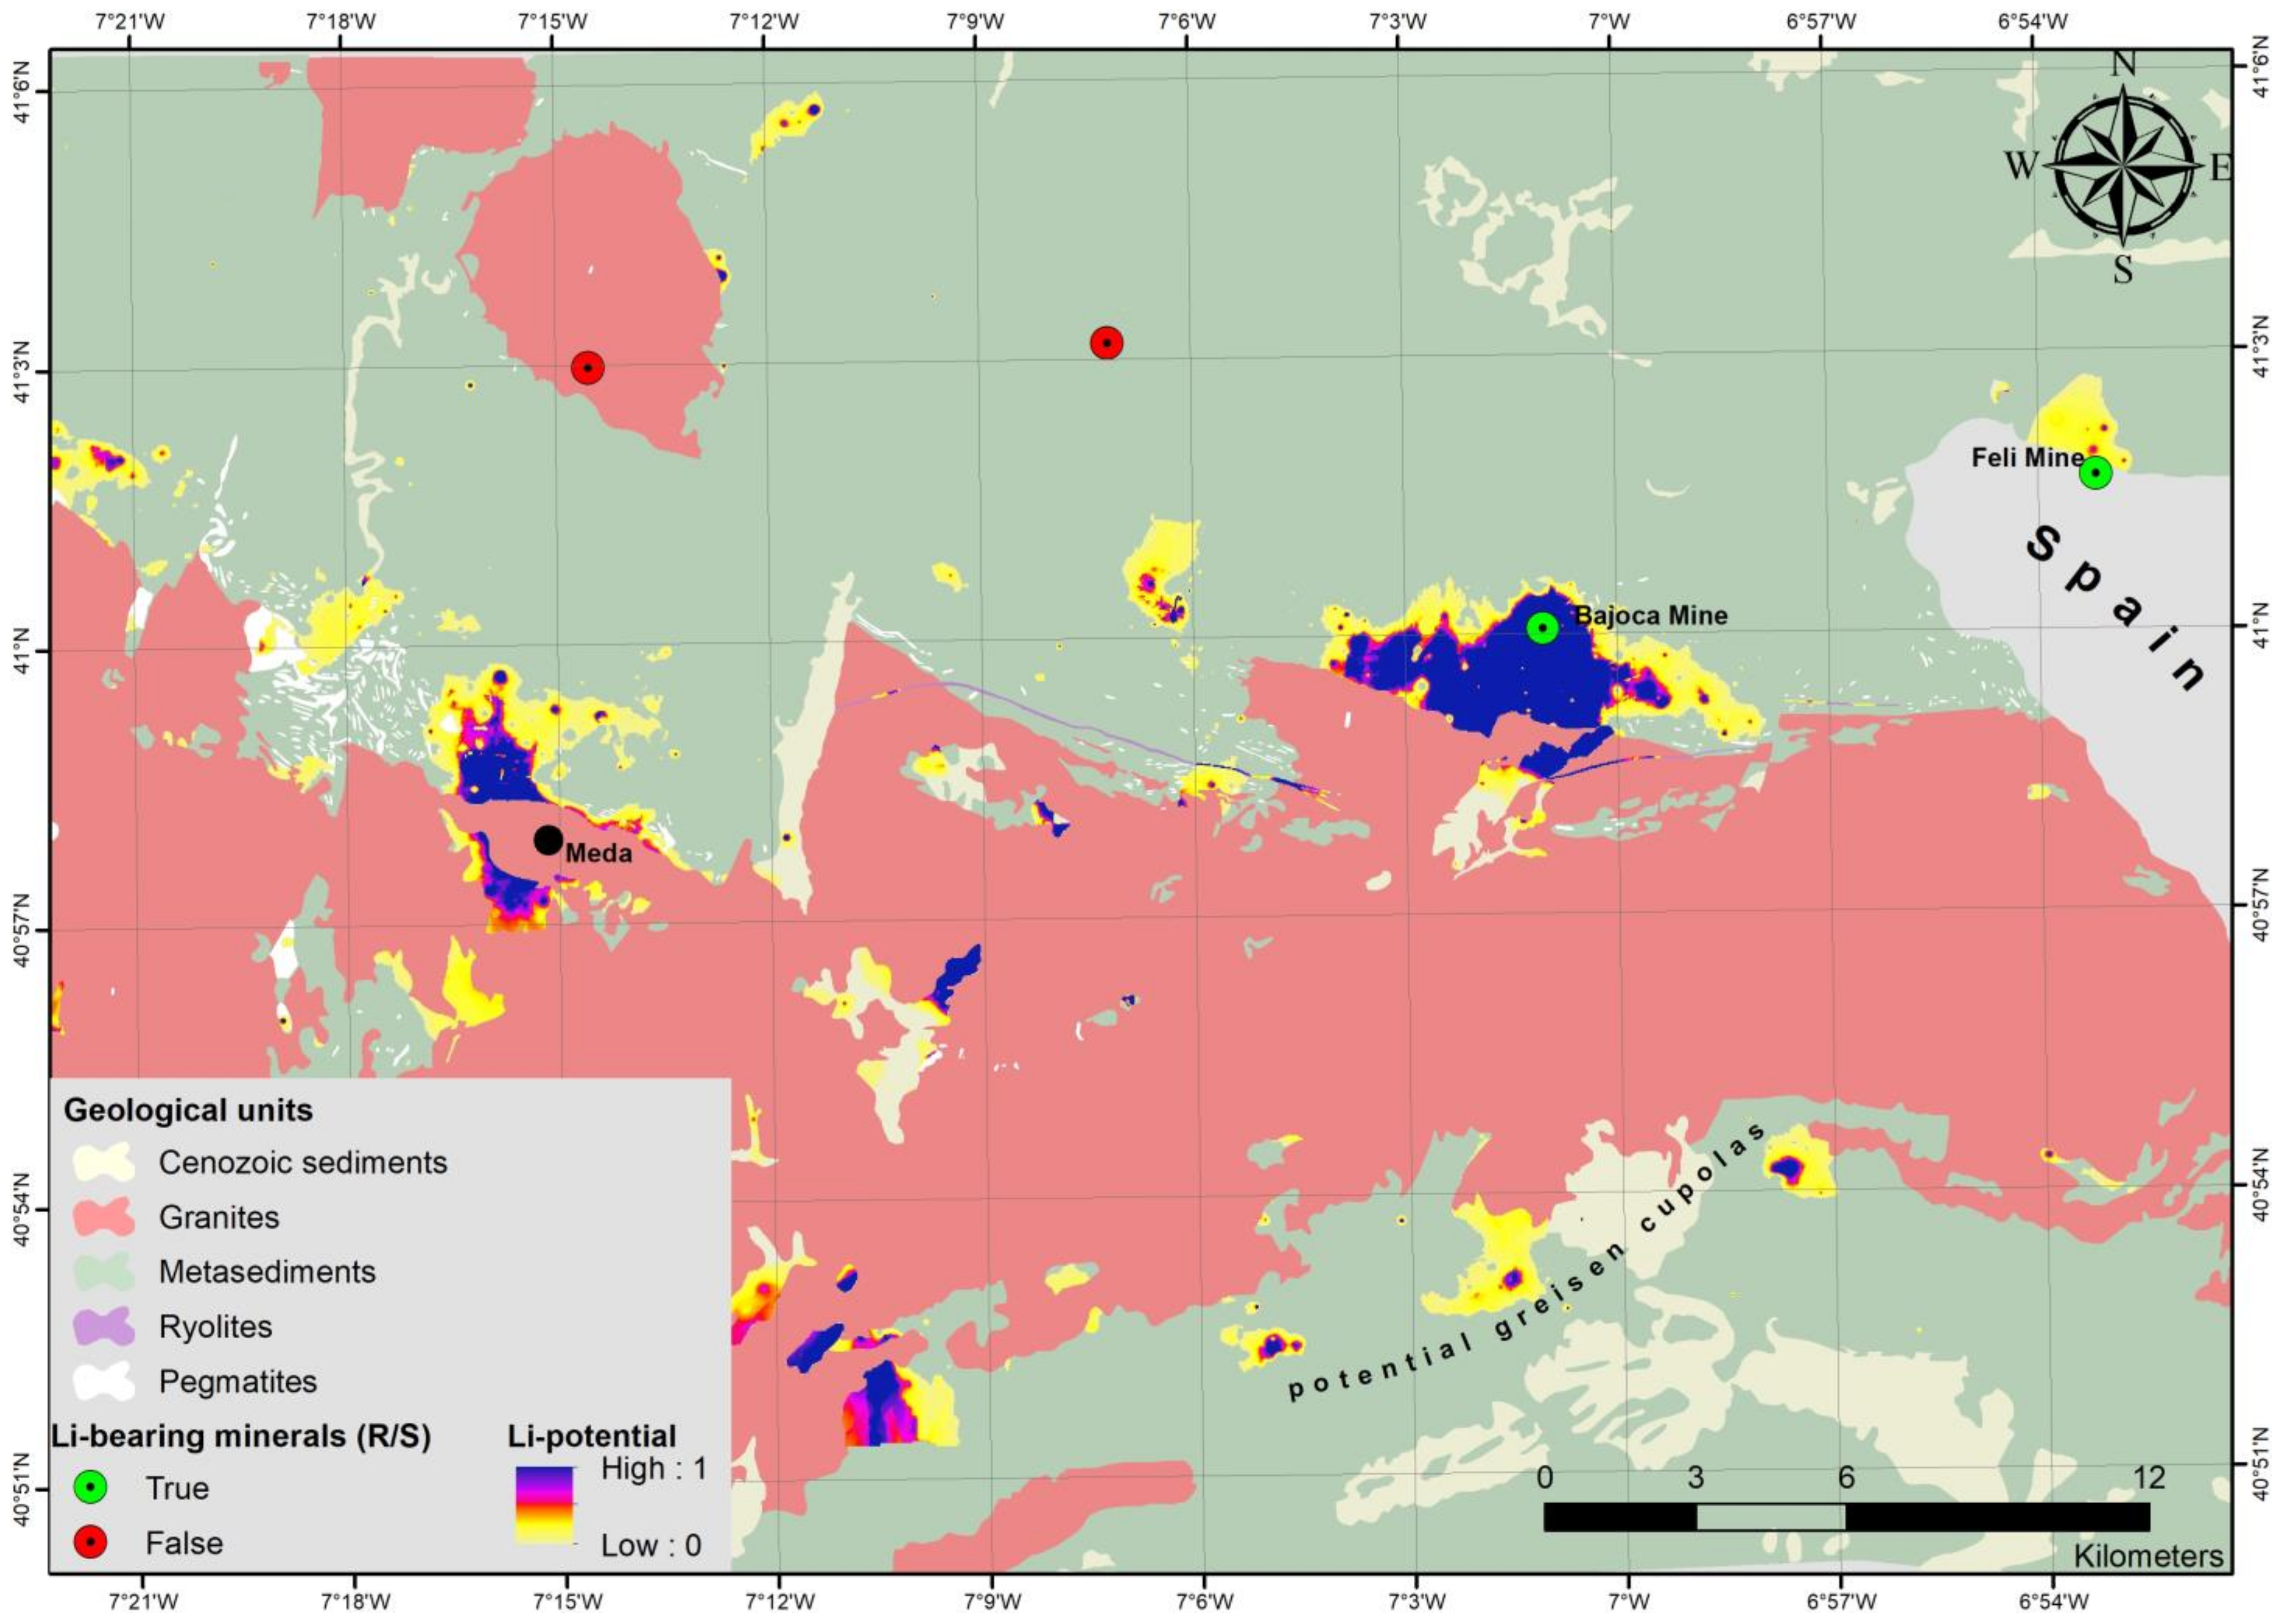
The prediction model result based on geological data (Figure 5) was further combined with the improved classification results based on remote sensing data to design a final map of Li mineralisation occurrences in the study area (Figure 12). The remote sensing models are limited to the detection of features of similar spectral characteristics exposed to the ground surface. On the other hand, the geological model is based on data related to the geological formations and geochemical characteristics (not always exposed on the ground surface). The combination of geological and remote sensing data into one ANN model resulted in many false interpretations, as the controlling parameters refer to/explain different targets. The results of the geological model and the knowledge from previous field campaigns helped us to exclude locations such as the Li-barren quarry at the Coa River (marked as False in Figure 12). The resulting map shows that the Bajoca and Feli mines, with a confirmed presence of Li pegmatites, could be successfully identified in both ANN models. Other potential areas identified from the geological-based model are not exposed to the ground surface and therefore could not be identified from the remote sensing data.
Through a combination of result maps, the identified location near the Coa River based on remote sensing data (marked as False in Figure 12) was automatically excluded. Further research allied with a previous field campaign revealed that this is a schist quarry without the confirmed presence of Li at the mine site (https://www.solicel.pt/site/index.php/produtos; accessed on 02 February 2021). Additionally, in the case of the westernmost location identified using Sentinel-2 (Figure 11), the integration with available geological maps allowed us to identify it as another false positive since in the FAF the Li-bearing pegmatites are not emplaced within the granitoid rocks [17,18,19]. It is worth mentioning that a combination of the models based on geological data and remote sensing data could only succeed in areas where all data are available. The lack of geology information throughout the entire study area made it impossible to draw conclusions for the other identified locations in Figure 11.

5. Discussion

The potential of low-to-medium resolution Sentinel-2 images was evaluated to automatically detect Li-bearing pegmatites exposed on the ground surface, depending on the weathering conditions of the Li-bearing rocks. Besides the raw spectral reflectance bands, dimensionality expansion techniques can be integrated to improve the classification workflows and distinguish features with similar spectral signatures to the Li-bearing minerals. Despite the potential to give insights on other locations with similar surface reflectance to Li pegmatites, the remote sensing data only allowed the identification of Li-bearing rocks at known mines. These results show the limitations of the remote sensing data since most unexploited pegmatite bodies are often covered by vegetation, thus preventing their identification using only remote sensing data. On the other hand, integration with the geological and geochemical data was crucial to identify false positive areas resulting from the satellite-based approach. This indicates that the remote sensing model alone was not sufficient for prospectivity mapping. Field campaigns also helped to exclude some of the potential areas identified using the remote sensing models. The spectral signature of the rocks of one of the identified false positive areas (orange circle of Figure 8) was confronted with the spectra of Li-bearing pegmatites (Supplementary Figure S6c). Overall, the spectral behaviour of the two rocks is distinct enough to allow their spectral discrimination using hyperspectral data. Since this discrimination was not achieved using Sentinel-2 data, this may indicate that their spectral resolution may not be adequate. Moreover, even the spatial resolution of the images may have limited the identification of some of the smaller Li pegmatite bodies of the FAF that only reach less than 5 m in thickness [24].
These results are in line with previous research for the identification of Li pegmatites based only on remote sensing data and using traditional methods as well as machine learning algorithms such as ANN, Random Forest, Support Vector Machines, etc., [36,37,38] that have shown that the results are limited to features with similar spectral properties to Li-bearing mineralisations. For instance, Li mine sites could not be distinguished from the other within-scene elements in the study area using multispectral data due to their similar spectral properties. Despite this, field validation campaigns, the improvement of training areas, and algorithm parameterisation allowed us to decrease the number of false positive areas and increase the separability of Li mine sites [50]. In this paper, the knowledge acquired from previous field campaigns was integrated, including the insights provided by the reference spectra of the main outcropping lithologies (Supplementary Figure S6). Taking this into account, we investigated how the fusion of remote sensing data and geology knowledge improved the identification results and provided a more realistic approach, by allowing us to exclude false positive areas with no further interest for Li exploration
The presence of Li-bearing minerals is strongly related to specific geological formations such as pegmatites. For this reason, in this study, the prediction of Li mineralisation resulted in a combination of models based on remote sensing data (related to the ground surface) and geological/geochemical data (related to the geological formations at the ground surface). The proposed approach requires available geological data and remote sensing data over the entire study area; otherwise, a combination of the models is not made possible. Geophysical data could further enhance the model, e.g., gravimetry could aid in the detection of hidden granite cupolas and related Li mineralisations, and pegmatite modelling could be enhanced by induced polarisation (IP) to measure contacts with the metasediments.
The prediction modelling based only on geological data was limited to the Portuguese side of the study area due to the availability of the geological and stream sediment data. The results shown in Figure 12 provide information on the spatial distribution of predicted Li mineralisation potential across the study area. The spatial distribution of Li-predictive areas in the transition of metasediments and granites could be a result of possible (hidden) greisen cupolas or pegmatites (Figure 5). As a result of the strong generalisation of geological units (metamorphics, intrusives, etc.), the areas with Li potential are mainly related to stream sediment geochemistry. Particularly straight area borders are caused by the boundaries of the main geological formations. Comparing the distribution of different elements across the study area (Sn, W, Li, Mo, As), several areas could be ruled out regarding Li mineralisation sensu stricto (pegmatites). As a result, only Bajoca Mine was used to validate the ANN model. However, the model was able to also predict the Li mineral deposits located near the cross-boundary of Portugal and Spain in the north-east part of the study area. The presence of Li mineralisation in this area is confirmed from the mining activities in the Riba D’Alva mine [51]. Further research is needed to validate the proposed approach in other areas, i.e., to check the high-potential areas identified through the mineral prospectivity mapping for the occurrence of unknown mineralisation. In the end, the resultant Li mineralisation prediction map (Figure 12) can be a useful tool for future exploration campaigns for exploration and mining companies, since it can help to delineate smaller interest areas in a large geographic area (>1.250 km2). We recommend focusing future exploration activities on the following locations with high predicted Li potential: areas surrounding Bajoca Mine, Li anomalies in the west Meda, possible greisen cupolas in the south of the study area, and areas north of Feli Mine.

6. Conclusions

In this study, geological/geochemical data and remote sensing data (Sentinel-2 images) were used to create separate geological and remote sensing models using the ANN algorithm, respectively. In the end, the best remote sensing model was integrated with the geological one to delineate a Li mineralisation potential map for the FAF.
Using the ANN algorithm and Sentinel-2 multispectral data, it was possible to identify mine site locations and bare soil with similar reflectance properties to the training data. Overall, the Sentinel-2 data on their own are not enough to delineate other Li pegmatite occurrences, since only the known mine sites were correctly identified. The remaining highlighted areas corresponded to false positives. The exclusion of these false positive areas was only possible due to the knowledge obtained from field campaigns but also through the integration with the obtained geological model. The analysis of the reflectance spectra of selected pixels and reference samples (collected in field surveys) revealed that the coarse spectral resolution of Sentinel-2 is not able to reflect all significant characteristics of Li-bearing minerals and pegmatites. Therefore, the identification of Li pegmatite bodies specifically based only on Sentinel-2 data seems to be challenging due to the limited spectral and spatial resolution of the used satellite data and also the existing vegetation coverage (although sparse).
However, the combination of the satellite data with the geological model provides a potential approach to automatically predict the location of Li-bearing mineralisation using ANNs. Careful consideration of training patterns, spectral bands, and geological data proved to be key factors in establishing a working model. The proposed combined approach is a first step towards expeditious Li mineralisation prediction. The integration of the models allowed us to enrich the remote sensing classification results, since the geological prediction model gives insights on formations that are suitable to host Li pegmatites. Thus, the approach of combining the modelling results based on geological and remote sensing data is promising, not only to identify the known exposed Li pegmatites on the ground surface and exclude false features with similar signatures in the spectral reflectance, but also to reveal potential locations for further exploration. Nonetheless, Li pegmatite prediction needs to be improved in the future through the use of high spectral and spatial resolution data in the remote sensing modelling step. The proposed approach can also be used for other metals or raw materials and will make a cost-efficient contribution to raw material exploration in general.

Supplementary Materials

The following are available online at https://www.mdpi.com/article/10.3390/min11101046/s1, Figure S1: Reference spectral signatures of (a) petalite samples from Bajoca Mine, (b) spodumene samples from Alberto Mine, and (c) lepidolite samples from Feli Mine; Figure S2: Spectral signatures for Alberto, Bajoca and Feli mines based on Sentinel-2 data; Figure S3: Histogram (a) and Network MSE error (b) for the Geological Model; Figure S4: Histogram (a) and Network MSE error (b) for Remote Sensing Model 1; Figure S5: Spectral signatures for the extended spectral bands: (a) 1–6, (b) 7–12, (c) 13–32; Figure S6: Reference spectral signatures of (a) lepidolite-bearing pegmatites, (b) pet-alite-bearing pegmatites (Bajoca Mine), (c) schist–metagreywacke complex (CXG) metasediments, and (d) granitoid rocks; Figure S7: Histogram (a) and Network MSE error (b) for Remote Sensing Model 2.

Author Contributions

Conceptualisation, M.K., D.H., A.B., and S.S.; methodology, M.K., D.H., and S.S.; software, P.H.; validation, M.K., D.H., S.S., J.C.-F., A.L., and A.C.T.; formal analysis, M.K., D.H., and S.S.; investigation, M.K., D.H., and S.S.; resources, M.K., D.H., S.S., and A.L.; data curation, M.K., D.H., S.S., J.C.-F., and A.L.; writing—original draft preparation, M.K., D.H., and S.S.; writing—review and editing, M.K., D.H., S.S., J.C.-F., A.L., and A.C.T.; visualisation, M.K. and D.H.; supervision, M.K.; project administration, S.S., A.K., and A.B.; funding acquisition, S.S., A.K., and A.B. All authors have read and agreed to the published version of the manuscript.

Funding

(1) The investigations in this paper were performed under the LIGHTS (Lightweight Integrated Ground and Airborne Hyperspectral Topological Solution; ERA-MIN/0001/2017–LIGHTS) research project funded by national research agencies under the EU H2020 ERAMIN-2 network. ERA-MIN2 is a global, innovative, and flexible pan-European network of research funding organisations, supported by EU Horizon 2020, that builds on the experience of the FP7ERA-NETERA-MIN (2011 to 2015). The national funding agencies supporting the project are: ANR—Agence Nationale de la Recherche (France), BMBF Jülich—Bundesministerium für Bildung und Forschung (Germany), and FCT—Fundação para a Ciência e a Tecnologia (Portugal). (2) The work was also supported by Portuguese National Funds through the FCT project UIDB/04683/2020—ICT (Institute of Earth Sciences). (3) Joana Cardoso-Fernandes is financially supported within the compass of a Ph.D. Thesis, ref. SFRH/BD/136108/2018, by national funds from MCTES through FCT, and co-financed by the European Social Fund (ESF) through POCH—Programa Operacional Capital Humano—and NORTE 2020 regional program.

Data Availability Statement

The spectral data presented in this study are openly available in Zenodo at http://doi.org/10.5481/zenodo.4575375 (accessed on 23 June 2021), Reference [45]. Restrictions may apply to the availability of stream sediment data and to part of the geological data since they correspond to third party data obtained from the French Bureau de Recherches Géologiques et Minières (BRGM) and the Portuguese National Laboratory of Energy and Geology (LNEG), respectively.

Acknowledgments

The authors gratefully acknowledge the comments of three anonymous reviewers, which led to a substantial improvement in the manuscript.

Conflicts of Interest

The authors declare no conflict of interest. The funders had no role in the design of the study; in the collection, analyses, or interpretation of data; in the writing of the manuscript, or in the decision to publish the results.

Appendix A

Figure A1. Geochemical anomaly maps for Li (a) and Sn (b) before excluding the granitic areas.
Minerals 11 01046 g0a1

References

  1. European Commission: DG Internal Market Industry Entrepreneurship and SMEs. Critical Raw Materials Resilience: Charting a Path towards Greater Security and Sustainability; COM(2020) 474 final; European Commission: DG Internal Market Industry Entrepreneurship and SMEs: Brussels, Belgium, 2020; p. 23.
  2. Brooks, K. Lithium Minerals. Geol. Today 2020, 36, 192–197. [Google Scholar] [CrossRef]
  3. Kesler, S.E.; Gruber, P.W.; Medina, P.A.; Keoleian, G.A.; Everson, M.P.; Wallington, T.J. Global lithium resources: Relative importance of pegmatite, brine and other deposits. Ore Geol. Rev. 2012, 48, 55–69. [Google Scholar] [CrossRef]
  4. Silva, D.; Lima, A.; Gumiaux, C.; Glouguen, E.; Deveaud, S. Spatial Geostatistical Analysis Applied to The Barroso-Alvão Rare-Elements Pegmatite Field (Northern Portugal). In GIS—An Overview of Applications; Teodoro, A.C., Ed.; Bentham eBooks: Sharjah, United Arab Emirates, 2018. [Google Scholar]
  5. Linnen, R.L.; Van Lichtervelde, M.; Černý, P. Granitic Pegmatites as Sources of Strategic Metals. Elements 2012, 8, 275–280. [Google Scholar] [CrossRef]
  6. Gourcerol, B.; Gloaguen, E.; Melleton, J.; Tuduri, J.; Galiegue, X. Re-assessing the European lithium resource potential—A review of hard-rock resources and metallogeny. Ore Geol. Rev. 2019, 109, 494–519. [Google Scholar] [CrossRef] [Green Version]
  7. Carvalho, J.M.F.; Farinha, J.A.L.B. Lithium potentialities in Northern Portugal. In Proceedings of the 17th Industrial Minerals International Congress, Barcelona, Spain, 28–31 March 2004; pp. 1–10. [Google Scholar]
  8. Roda-Robles, E.; Pesquera, A.; Gil-Crespo, P.P.; Vieira, R.; Lima, A.; Olave, I.G.; Martins, T.; Torres-Ruiz, J. Geology and mineralogy of Li mineralization in the Central Iberian Zone (Spain and Portugal). Miner. Mag. 2016, 80, 103–126. [Google Scholar] [CrossRef] [Green Version]
  9. Brown, W.M.; Gedeon, T.D.; Groves, D.I.; Barnes, R.G. Artificial neural networks: A new method for mineral prospectivity mapping. Aust. J. Earth Sci. 2000, 47, 757–770. [Google Scholar] [CrossRef]
  10. Rigol-Sanchez, J.P.; Olmo, M.C.; Abarca-Hernández, F. Artificial neural networks as a tool for mineral potential mapping with GIS. Int. J. Remote Sens. 2003, 24, 1151–1156. [Google Scholar] [CrossRef]
  11. Oh, H.-J.; Lee, S. Application of Artificial Neural Network for Gold–Silver Deposits Potential Mapping: A Case Study of Korea. Nat. Resour. Res. 2010, 19, 103–124. [Google Scholar] [CrossRef]
  12. Rodriguez-Galiano, V.; Sanchez-Castillo, M.; Olmo, M.C.; Chica-Rivas, M. Machine learning predictive models for mineral prospectivity: An evaluation of neural networks, random forest, regression trees and support vector machines. Ore Geol. Rev. 2015, 71, 804–818. [Google Scholar] [CrossRef]
  13. Roda-Robles, E.; Villaseca, C.; Pesquera, A.; Gil-Crespo, P.P.; Vieira, R.; Lima, A.; Olave, I.G. Petrogenetic relationships between Variscan granitoids and Li-(F-P)-rich aplite-pegmatites in the Central Iberian Zone: Geological and geochemical constraints and implications for other regions from the European Variscides. Ore Geol. Rev. 2018, 95, 408–430. [Google Scholar] [CrossRef]
  14. Catalán, J.R.M. The Central Iberian arc, an orocline centered in the Iberian Massif and some implications for the Variscan belt. Acta Diabetol. 2011, 101, 1299–1314. [Google Scholar] [CrossRef]
  15. Dias, R.; Ribeiro, A. The Ibero-Armorican Arc: A collision effect against an irregular continent? Tectonophysics 1995, 246, 113–128. [Google Scholar] [CrossRef]
  16. Bea, F.; Montero, P.; Zinger, T. The Nature, Origin, and Thermal Influence of the Granite Source Layer of Central Iberia. J. Geol. 2003, 111, 579–595. [Google Scholar] [CrossRef] [Green Version]
  17. Roda, E. Distribución, Caracteristicas y Petrogenesis de las Pegmatitas de La Fregeneda (Salamanca). Ph.D. Thesis, UPV/EHU, Bilbao, Spain, 1993. [Google Scholar]
  18. Roda-Robles, E.; Perez, A.P.; Roldan, F.V.; Fontan, F. The granitic pegmatites of the Fregeneda area (Salamanca, Spain): Characteristics and petrogenesis. Miner. Mag. 1999, 63, 535–558. [Google Scholar] [CrossRef]
  19. Vieira, R. Aplitopegmatitos com Elementos Raros da Região Entre Almendra (V.N. de Foz Côa) e Barca d’Alva (Figueira de Castelo Rodrigo). Campo Aplitopegmatítico da Fregeneda-Almendra. Ph.D. Thesis, Faculdade de Ciências da Universidade do Porto, Porto, Portugal, 2010. [Google Scholar]
  20. Costa, J.C.S. Notícia Sobre uma Carta Geológica do Buçaco, de Nery Delgado; Serviços Geológicos de Portugal: Lisboa, Portugal, 1950.
  21. Teixeira, C. Notas Sobre Geologia de Portugal o Complexo Xisto-Grauváquico ante-Ordoviciano; Empresa Literaria Fluminense Lda.: Lisboa, Portugal, 1955; p. 48. [Google Scholar]
  22. Bea, F.; Herrero, J.G.S.G.; Pinto, M.S.; Barrera, J.L.; Brandle, J.L.; Corretgé, L.G.; Suárez, O. Una compilación geoquímica (elementos mayores) para los granitóides del Macizo Hespérico. In Geología de los Granitóides y Rocas Asociadas del Macizo Hesperico; Bea, F., Carnicero, A., Gonzalo, J.C., López-Plaza, M., Rodríguez Alonso, M.D., Eds.; Libro de Homenaje a L. C. García de Figuerola, Editorial Rueda: Alcorcon, Madrid, Spain, 1987. [Google Scholar]
  23. Pereira, I.; Dias, R.; Bento dos Santos, T.; Mata, J. Exhumation of a Migmatite Complex along a Transpressive Shear Zone: Inferences from the Variscan Juzbado–Penalva Do Castelo Shear Zone (Central Iberian Zone). J. Geol. Soc. 2017, 174, 1004–1018. [Google Scholar] [CrossRef]
  24. Ferreira, J.A.; Bento dos Santos, T.; Pereira, I.; Mata, J. Tectonically Assisted Exhumation and Cooling of Variscan Granites in an Anatectic Complex of the Central Iberian Zone, Portugal: Constraints from LA-ICP-MS Zircon and Apatite U–Pb Ages. Int. J. Earth Sci. 2019, 108, 2153–2175. [Google Scholar] [CrossRef]
  25. Aires, S.C.M. Petrofísica e Litogeoquímica de Formações do “Complexo Xisto-Grauváquico” (Grupo do Douro) Estudo do Potencial do “Xisto” para Exploração como Pedra Natural. Ph.D. Thesis, Faculdade de Ciências da Universidade do Porto, Porto, Portugal, 2018. [Google Scholar]
  26. Silva, A.F.d.; Ribeiro, M.L. Notícia Explicativa da Folha 15-A Vila Nova de Foz Côa; Serviços Geológicos de Portugal: Lisboa, Portugal, 1991; p. 52.
  27. Silva, A.F.d.; Ribeiro, M.L. Notícia Explicativa da Folha 15-B Freixo de Espada à Cinta; Instituto Geológico e Mineiro: Lisboa, Portugal, 1994; p. 48.
  28. Silva, A.F.; Santos, A.J.; Ribeiro, A.; Ribeiro, M.L. Carta Geológica de Portugal na Escala 1/50.000—Folha 15-A—Vila Nova de Foz Côa; Serviços Geológicos de Portugal: Lisboa, Portugal, 1990.
  29. Silva, A.F.; Santos, A.J.; Ribeiro, A.; Cabral, J.; Ribeiro, M.L. Carta Geológica de Portugal na Escala 1/50.000—Folha 15-B—Freixo de Espada à Cinta; Serviços Geológicos de Portugal: Lisboa, Portugal, 1990.
  30. Carvalhosa, A. Carta Geológica de Portugal à Escala 1:50.000, Folha 15-D (Figueira de Castelo Rodrigo); Serviços Geológicos de Portugal: Lisboa, Portugal, 1960.
  31. Ribeiro, M.L. Carta Geológica Simplificada Do Parque Arqueológico Do Vale Do Côa Na Escala 1:80.000; Parque Arqueológico do Vale do Côa: Vila Nova de Foz Côa, Portugal, 1990. [Google Scholar]
  32. Al-Rawashdeh, S.; Saleh, B.; Hamzah, M. The Use of Remote Sensing Technology in Geological Investigation and Mineral Detection in El Azraq-Jordan. Cybergeo Eur. J. Geogr. 2006, 358, 1–17. [Google Scholar] [CrossRef]
  33. van der Meer, F.D.; van der Werff, H.M.A.; van Ruitenbeek, F.J.A. Potential of ESA’s Sentinel-2 for Geological Applications. Remote Sens. Environ. 2014, 148, 124–133. [Google Scholar] [CrossRef]
  34. Beiranvand Pour, A.; Park, T.-Y.; Park, Y.; Hong, J.; Zoheir, B.; Pradhan, B.; Ayoobi, I.; Hashim, M. Application of Multi-Sensor Satellite Data for Exploration of Zn–Pb Sulfide Mineralization in the Franklinian Basin, North Greenland. Remote Sens. 2018, 10, 1186. [Google Scholar] [CrossRef] [Green Version]
  35. Cardoso-Fernandes, J.; Teodoro, A.; Lima, A. Potential of Sentinel-2 Data in the Detection of Lithium (Li)-Bearing Pegmatites: A Study Case. In Proceedings of the Earth Resources and Environmental Remote Sensing/GIS Applications IX, Berlin, Germany, 10–13 September 2018. [Google Scholar] [CrossRef]
  36. Cardoso-Fernandes, J.; Teodoro, A.C.; Lima, A. Remote Sensing Data in Lithium (Li) Exploration: A New Approach for the Detection of Li-Bearing Pegmatites. Int. J. Appl. Earth Obs. Geoinf. 2019, 76, 10–25. [Google Scholar] [CrossRef]
  37. Cardoso-Fernandes, J.; Teodoro, A.C.M.; Lima, A.; Roda-Robles, E. Evaluating the Performance of Support Vector Machines (SVMs) and Random Forest (RF) in Li-Pegmatite Mapping: Preliminary Results. In Proceedings of the Earth Resources and Environmental Remote Sensing/GIS Applications X, Strasbourg, France, 9–12 September 2019. [Google Scholar] [CrossRef]
  38. Cardoso-Fernandes, J.; Teodoro, A.C.; Lima, A.; Roda-Robles, E. Lithium (Li) Pegmatite Mapping Using Artificial Neural Networks (ANNs): Preliminary Results. In Proceedings of the IEEE International Geoscience and Remote Sensing Symposium, Waikoloa, HI, USA, 26 September–2 October 2020; pp. 557–560. [Google Scholar] [CrossRef]
  39. Angel, J.M.; Viallefond, L. Prospection Géochimique Portugal. Résultats Analytiques et Interprétation de l’échantillonnage Réalisé Par Le S.F.M. Sur La Feuille 15A, Région de Almendra; NOTE/GMX-748; BRGM: Orléans, France, 1981; p. 6.
  40. Viallefond, L. Prospection Géochimique Portugal: Résultats Analytiques et Interprétation de l’Échantillonnage Réalisé par le S.F.M. sur la Feuille 15B; NOTE/GMX-732; BRGM: Orléans, France, 1981; p. 27.
  41. Viallefond, L.; Angel, J.M. Portugal Nord—Feuille 15A-15C—Interprétation des Données Analytiques; NOTE/GMX-738; BRGM: Orléans, France, 1981; p. 17.
  42. Vieira, R.; Roda-Robles, E.n.; Pesquera, A.; Lima, A. Chemical variation and significance of micas from the Fregeneda-Almendra pegmatitic field (Central-Iberian Zone, Spain and Portugal). Am. Mineral. 2011, 96, 637–645. [Google Scholar] [CrossRef]
  43. Lanaras, C.; Bioucas-Dias, J.; Galliani, S.; Baltsavias, E.; Schindler, K. Super-Resolution of Sentinel-2 Images: Learning a Globally Applicable Deep Neural Network. J. Photogramm. Remote Sens. 2018, 146, 305–319. [Google Scholar] [CrossRef] [Green Version]
  44. Bahr, T.; Heinz, D.C. Creating Models Of Hyperspectral Classification Workflows Integrating Dimensionality Expansion For Multispectral Imagery. In Proceedings of the 10th Workshop on Hyperspectral Imaging and Signal Processing: Evolution in Remote Sensing (WHISPERS), Amsterdam, The Netherlands, 24–26 September 2019. [Google Scholar] [CrossRef]
  45. Cardoso-Fernandes, J.; Silva, J.; Lima, A.; Teodoro, A.C.; Perrotta, M.; Cauzid, J.; Roda-Robles, E.; Ribeiro, M.A. Reflectance spectroscopy to validate remote sensing data/algorithms for satellite-based lithium (Li) exploration (Central East Portugal). In Proceedings of the SPIE Remote Sensing, Earth Resources and Environmental Remote Sensing/GIS Applications XI, Online, 21–25 September 2020. [Google Scholar] [CrossRef]
  46. Cardoso-Fernandes, J.; Silva, J.; Lima, A.; Teodoro, A.C.; Perrotta, M.; Cauzid, J.; Roda-Robles, E. Characterization of lithium (Li) minerals from the Fregeneda-Almendra region through laboratory spectral measurements: A comparative study. In Proceedings of the SPIE Remote Sensing, Earth Resources and Environmental Remote Sensing/GIS Applications XI, Online, 21–25 September 2020. [Google Scholar] [CrossRef]
  47. Cardoso-Fernandes, J.; Silva, J.; Dias, F.; Lima, A.; Teodoro, A.C.; Barrès, O.; Cauzid, J.; Perrotta, M.; Roda-Robles, E.; Ribeiro, M.A. Tools for Remote Exploration: A Lithium (Li) Dedicated Spectral Library of the Fregeneda-Almendra Aplite-Pegmatite Field. Version 1. Zenodo. 2021. Available online: https://zenodo.org/record/4575375#.YUGmx30RVPY (accessed on 9 March 2021).
  48. Cardoso-Fernandes, J.; Dias, F.; Lima, A.; Anjos Ribeiro, M.; Perrotta, M.; Roda-Robles, E.; Teodoro, A.C. Petalite alteration products from the Bajoca pegmatite (Central Portugal): A multiapproach for lithium exploration. In Proceedings of the EGU General Assembly 2021, Online, 19–30 April 2021. [Google Scholar] [CrossRef]
  49. Haykin, S.S. Neural Networks: A Comprehensive Foundation; Prentice Hall: Englewood Cliffs, NJ, USA, 1999; ISBN 978-0-13-273350-2. [Google Scholar]
  50. Cardoso-Fernandes, J.; Teodoro, A.C.; Lima, A.; Roda-Robles, E. Semi-Automatization of Support Vector Machines to Map Lithium (Li) Bearing Pegmatites. Remote. Sens. 2020, 12, 2319. [Google Scholar] [CrossRef]
  51. Gaspar, L.M.; Inverno, C.M.C. Mineralogy and Metasomatic Evolution of Distal Strata-BoundScheelite Skarns in the Riba de Alva Mine, Northeastern Portugal. Econ. Geol. 2000, 95, 1259–1275. [Google Scholar] [CrossRef] [Green Version]
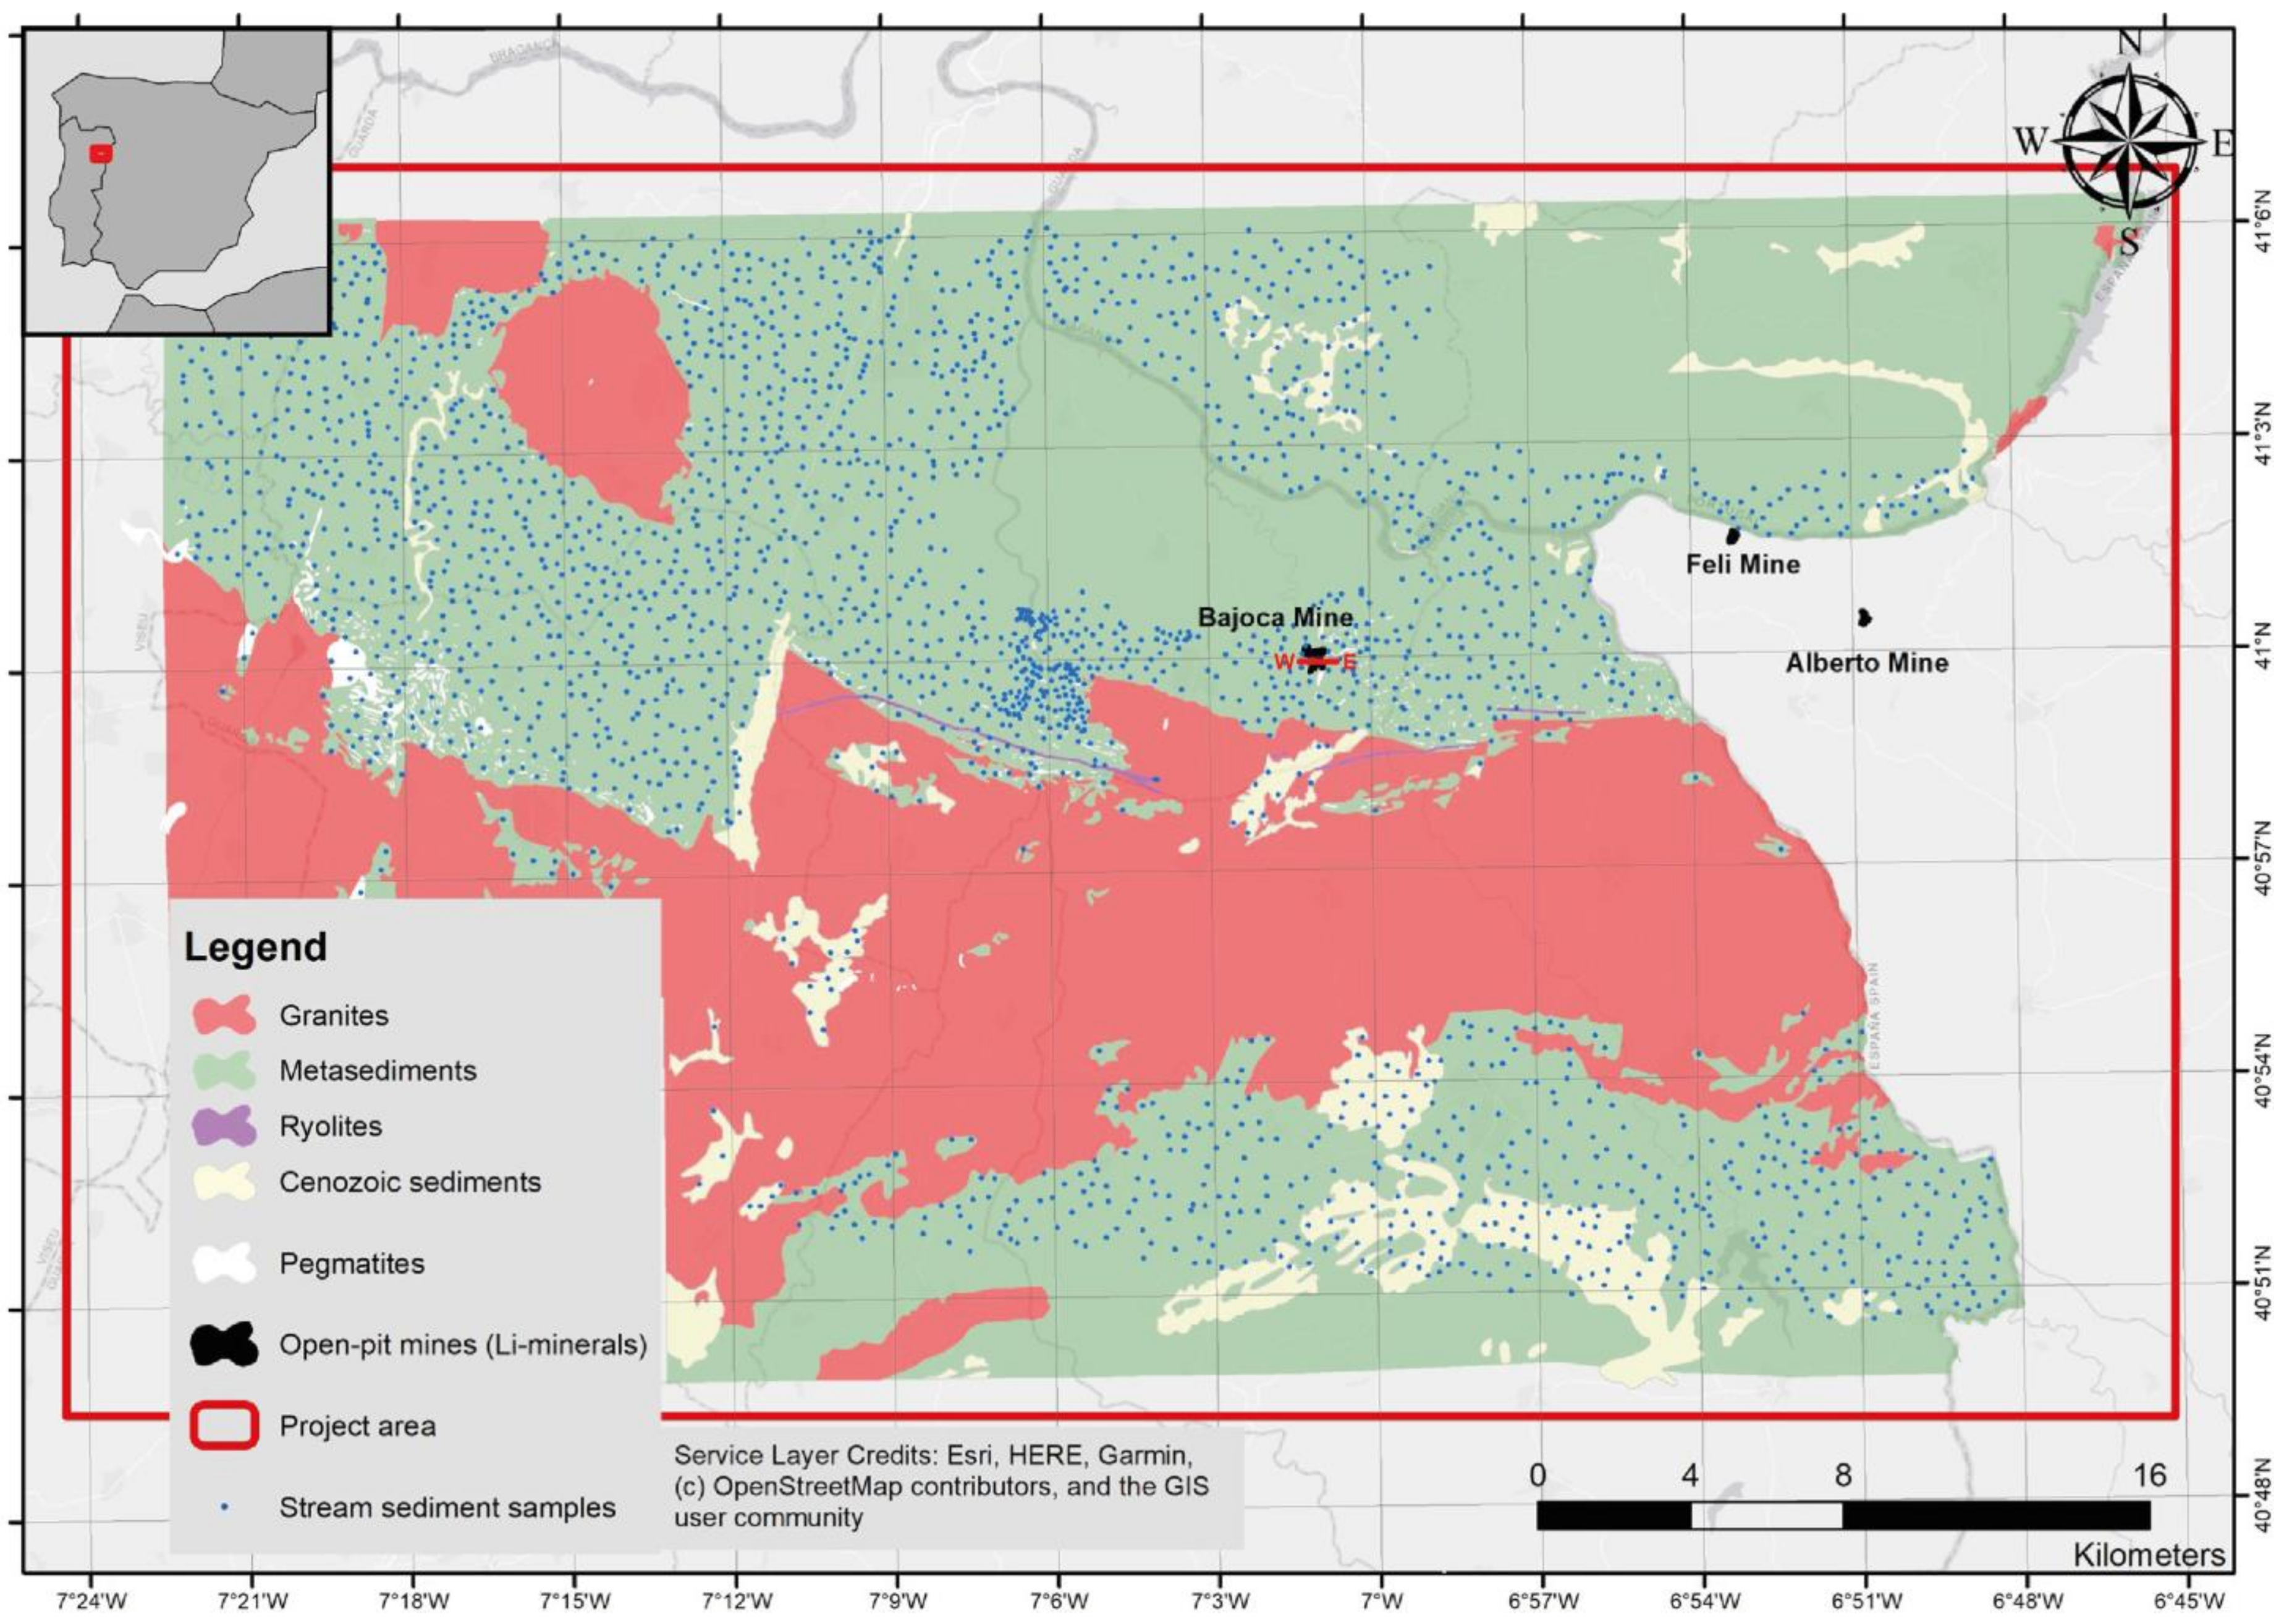
Figure 1. Extent of the simplified digitised geological maps, open-pit mines exploiting Li minerals, and the stream sediment data within the study area in NE Portugal (Coordinate System: Lisboa Hayford Transverse Mercator, Projection: Transverse Mercator).
Minerals 11 01046 g001
Figure 2. Geological profile of Bajoca Mine featuring Li-bearing pegmatite dykes with spatial relation to a granitic body hosted within metasedimentary rocks. The Li mineralisation is heterogeneously distributed within the dykes, since there is no internal zoning [13], while Sn mineralisation is concentrated along the aplite–pegmatite contact borders. The drillholes are projected in the profile, each one presenting variable directions and dips (from N115° E to N118° E; 39° to 45° S for S3; N125° E; 40° to 45° S for S3A; and from N124° E to N127° E; 41° to 45° S for S22B).
Minerals 11 01046 g002
Figure 3. Training patterns (red outlines) with different RGB compositions in the background: (a) Sentinel-2 RGB composition b03–b02–b11, (b) Sentinel-2 RGB composition √b08–√b04–√b03. The yellow and greenish pixels in subfigure a and b, respectively, correspond to areas hosting Li mineralisation exposed on the ground surface.
Minerals 11 01046 g003
Figure 4. General processing schema in the advangeo® prediction software.
Minerals 11 01046 g004
Figure 5. Probability map of Li mineralisation across the study area as a result of the geological/geochemical modelling approach (without remote sensing data).
Minerals 11 01046 g005
Figure 6. Results of Remote Sensing Model 1: (a) RGB composition detail using the super-resolved bands b3–b2–b11 in which mines with known Li mineralisation patterns are shown in light yellow, (b) Distribution probability map of Remote Sensing Model 1.
Minerals 11 01046 g006
Figure 7. Li distribution probability map of Remote Sensing Model 1 for the three training areas: (a) Bajoca Mine, (b) Feli Mine, (c) Alberto Mine. High potentials are in red. Ground truths are marked with black polygons.
Minerals 11 01046 g007
Figure 8. Example areas of possible false positives (misclassified pixels) from Remote Sensing Model 1: Póvoa de Penela, Touça (light brown), Touça (blue), Poio’s quarry (orange), and Marialva (green).
Minerals 11 01046 g008
Figure 9. Reduction/elimination of misclassified pixels of Li distribution probabilities when comparing Remote Sensing Model 1 and 2 for the three training areas: (a) Bajoca Mine, (b) Feli Mine, (c) Alberto Mine.
Minerals 11 01046 g009
Figure 10. Reduction/elimination of misclassified pixels when comparing Remote Sensing Model 1 and 2.
Minerals 11 01046 g010
Figure 11. Result map of possible locations of Li pegmatites based only on remote sensing data.
Minerals 11 01046 g011
Figure 12. Predicted Li mineralisation based on geological and remote sensing data.
Minerals 11 01046 g012
Table 1. Downloaded Sentinel-2 satellite image data over the study area.
TileData ProductSpatial
Resolution
Data
Source
Reference
System
Date of
Acquisition
Cloud Coverage
T29TPF2A10m, 20m, 60mESAUTM29N / WGS84201910022.3%
Table 2. Dimensionality expansion for Sentinel-2 multispectral imagery (√ = square root).
Dimensionality ExpansionFormula
eB01–eB06√ (B2, B3, B4, B8, B11, B12)
eB07–eB12Log (B2, B3, B4, B8, B11, B12)
eB13–eB18(B2, B3, B4, B8, B11, B12)2
eB19–eB33B02 × B03, B02 × B04, B02 × B08, B02 × B11, B02 × B12
B03 × B04, B03 × B08, B03 × B11, B03 × B12
B04 × B08, B04 × B11, B04 × B12
B08 × B11, B08 × B12
B11 × B12
Table 3. Suitable extended bands (eB) for automatic identification of Li-bearing pegmatites.
Extended BandeB14eB15eB16eB24eB25eB28eB29eB31
Formulab3²b4²b8²b3 × b4b3 × b8b4 × b8b4 × b11b8 × b11
Table 4. Statistics of the identified “positive” pixels in Models 1 and 2.
ParameterModel 1Model 2
Number of “positive” pixels12,0883526
Publisher’s Note: MDPI stays neutral with regard to jurisdictional claims in published maps and institutional affiliations.