Article

Worth a Closer Look: Raman Spectra of Lead-Pipe Scale

1
Department of Earth and Planetary Sciences, Washington University in St. Louis, St. Louis, MO 63130, USA
2
Department of Energy, Environmental, and Chemical Engineering, Washington University in St. Louis, St. Louis, MO 63130, USA
3
Department of Chemistry, Franklin and Marshall College, Lancaster, PA 17603, USA
4
Department of Civil & Environmental Engineering, University of Houston, Houston, TX 77004, USA
*
Author to whom correspondence should be addressed.
Current address: Department of Preventive Medicine, Northwestern University, Chicago, IL 60611, USA.
Current address: Department of Earth Sciences, University of Oregon, Eugene, OR 97403, USA.
§
Current address: College of Environmental Sciences and Engineering, Peking University, Beijing 100871, China.
Current address: State Environmental Protection Key Laboratory of All Material Fluxes in River Ecosystems, Beijing 100871, China.
Minerals 2021, 11(10), 1047; https://doi.org/10.3390/min11101047
Submission received: 24 August 2021 / Revised: 24 September 2021 / Accepted: 24 September 2021 / Published: 27 September 2021
(This article belongs to the Section Environmental Mineralogy and Biogeochemistry)

Abstract

:
The identification and characterization of lead-bearing and associated minerals in scales on lead pipes are essential to understanding and predicting the mobilization of lead into drinking water. Despite its long-recognized usefulness in the unambiguous identification of crystalline and amorphous solids, distinguishing between polymorphic phases, and rapid and non-destructive analysis on the micrometer spatial scale, the Raman spectroscopy (RS) technique has been applied only occasionally in the analysis of scales in lead service lines (LSLs). This article illustrates multiple applications of RS not just for the identification of phases, but also compositional and structural characterization of scale materials in harvested lead pipes and experimental pipe-loop/recirculation systems. RS is shown to be a sensitive monitor of these characteristics through analyses on cross-sections of lead pipes, raw interior pipe walls, particulates captured in filters, and scrapings from pipes. RS proves to be especially sensitive to the state of crystallinity of scale phases (important to their solubility) and to the specific chemistry of phases precipitated upon the introduction of orthophosphate to the water system. It can be used effectively alone as well as in conjunction with more standard analytical techniques. By means of fiber-optic probes, RS has potential for in situ, real-time analysis within water-filled pipes.

1. Introduction

Millions of lead service lines (LSLs) still deliver water to premises in the United States despite the long recognition of the health hazards of lead ingestion [1]. The high cost of pipe removal and substitution means that water treatment facilities continue to deal with the risks of lead release into drinking water. The selection of treatment methods to reduce lead-pipe corrosion relies on the well-supported assumption that plumbosolvency is a major key in mitigating lead release. The model is that the solubility of individual lead-bearing minerals that form scales on the inner pipe walls will control lead concentration in the enclosed pipe water [2,3]. The corollary to this reasoning is that changes in the properties of the water will cause different minerals to form and/or destabilize pre-existing mineral scales.
The compositions of the most frequently occurring lead minerals (e.g., lead (II) carbonates and lead (II) and (IV) oxides) in scales and the results of multiple experimental studies indicate that the most important variables in scale formation and stability are the pH and alkalinity, together with the concentrations of inorganic ions, Fe-Mn-oxide particulates, and natural organic matter, as well as the type of disinfection and corrosion-control treatments applied [2,3,4]. The fact that lead pipes continue to reliably deliver water after 100+ years of service attests to the effectiveness of passivation through the development of mineral scales, which prevents failure of the pipes due to extensive corrosion. Recent tragic episodes of widespread elevated lead release into the water supplies of several U.S. cities, however, remind us how sensitive the solubility of the solids that comprise the scale is to human-controlled changes in the water source or treatment methods. Such sensitivity makes many municipal water supplies vulnerable to lead release, for instance, as has been experienced in Washington, DC [5], Flint, MI [3,6,7,8], and Newark, NJ [9], in the past 20 years. The fact that recognized elevations in lead concentration have persisted in some areas for months to years is a reflection of the challenge to passivating the inner surfaces of lead pipes from which the mineral scales have been totally or partially dissolved.
As numerous research groups and publications have demonstrated, the identification of the mineralogy and specific chemistry of pipe scales is essential. Both mineral scales in harvested lead pipes and those precipitated in laboratory experiments emulating municipal water systems must be identified and fully characterized. This information will guide the selection of water-treatment options in individual municipalities and highlight water conditions that could cause pipe scales to be especially vulnerable to dissolution and/or particle release. Analytical techniques typically applied to the scales include optical microscopy (OM), X-ray diffraction (XRD), (field-emission) scanning electron microscopy (SEM or FE-SEM), transmission electron microscopy (TEM), energy-dispersive spectroscopy (EDS), and inductively coupled-plasma mass spectrometry (ICP-MS), as demonstrated, e.g., in [9,10,11,12]. Synchrotron-based X-ray absorption near-edge structure (XANES) and extended X-ray absorption fine structure (EXAFS) techniques also have been applied [13,14], but they require access to facilities outside the typical laboratory. Infrared spectroscopy [15,16,17] and Raman spectroscopy have also been applied in some studies [4,16,18,19,20,21,22,23]. The present paper is motivated by the low number of Raman studies on lead-pipe scale and related experimental products before our group’s work was published in 2018 and 2020.
The analysis and interpretation of lead-pipe scales (see Figure 1) from harvested LSLs, as well as from experimental products in pipe-loop/recirculation reactors, pose significant analytical challenges. The LSL samples typically are layered, representing “legacy scales” in the bottom layer(s) near the lead pipe and more recent scales near or at the water interface. Ideally, all of these phases should be identified and characterized—referenced to their spatial positions—so as to reveal the aqueous history of the system, including intermediate/precursor phases and evidence of replacement, e.g., [12]. The combination of analysis with imaging is especially useful. The degree of sample preparation is important to the integrity of the analysis, as well as to its cost and availability. Non-destructive analysis, which permits multiple techniques to be applied to the same material, is especially desirable for complete characterization. In addition to phase identification and chemical composition, the degree of crystallinity and chemical purity of a phase are essential to the assessment of its solubility, which can be approached experimentally or through computational models [2,4,17,24]. RS can provide information on all of these issues in a way that complements other techniques.
Compositional changes in the scales precipitated in a pipe over time or compositional differences in scales from one lead pipe to the next are important to the evaluation of how readily lead has been mobilized in the drinking-water supply. After the initial stabilization of scales in LSLs, two important causes of change in the mineral species and mineral chemistry of the scales are (1) changes in the conditions of the water source between the earliest years of service-line use and the present and (2) the introduction of chemicals selected to improve water quality, including disinfectants and chemicals used to (re-)stabilize the protective scales on the lead pipes. In principle, one can calculate which phase will be stable under specific compositional and pH conditions in the drinking/synthetically produced water. However, bulk XRD analyses of scale material in some cases show deviations from the predicted scale minerals [2,4,11,12], which means that the predicted lead concentrations in the water will be in error [25]. These deviations should be investigated.
Raman spectroscopy (RS) via laser Raman microprobe is a point-source analytical technique that has been used all too infrequently to identify mineral scales in harvested LSLs, as well as precipitates formed on lead pipes during laboratory simulations of LSLs [4,16,18,19,20,21,22,23]. The technique is non-destructive and offers more than just mineral/compound identification (see Supplementary Information). Requiring limited sample preparation and offering simultaneous micrometer-scale spatial resolution and visualization, RS significantly enhances characterization of the chemistry, structure, crystallinity, and growth conditions of the scales while also preserving the spatial context of the minerals/compounds studied. RS can characterize on a micrometer spatial scale (unlike XRD) individual layers of precipitates, both lead-rich and lead-absent. Similar to XRD, RS can be applied to evaluate the degree of crystallinity of solid phases, but beyond XRD, also to definitively identify X-ray amorphous solids. RS can be applied equally well to lead scales in situ on pipes and to powders of scraped material (as illustrated in various mineral studies, e.g., [26,27,28,29,30,31]). Unlike almost any other microanalytical technique, RS can also be applied to in situ, real-time analysis of mineral formation underwater [32,33,34]. The RS technique and its spectral data, therefore, warrant a closer look for application to LSL-scale studies.
The goal of this paper and its accompanying Supplementary Information (SI) is to highlight and expand upon some of the recognized capabilities of RS for the study of lead-pipe scales and to illustrate and explain in more detail further capabilities that have not been widely applied. Guidance is also provided for how to avoid some possible pitfalls (e.g., laser heating) in the Raman analysis of lead-bearing phases and those associated with them.

2. Methods

The examples discussed in this paper augment studies published by our group [4,20,21,22,23], in which RS was used primarily for identification purposes only. Details of the samples, experiments, and analytical instrumentation are available in the articles cited here and further explained in the Supplementary Information. The Supplementary Information begins with supplementary figures and their captions (SI Section S1), followed by details of the analytical conditions and additional sample information for all of the figures (SI Section S2). Further supplementary discussions include a brief introduction to RS (SI Section S3), details on the Raman instrument used for this study (SI Section S4), and an explanation of the accuracy and reproducibility of the analyses in this study (SI Section S5). SI Section S6 describes procedures for experiments not previously published, and SI Section S7 summarizes practical aspects of dealing with unwanted laser-induced luminescence.

2.1. Instrumentation

Raman analyses were carried out with a laboratory-based Raman microprobe (HoloLab series 5000, Kaiser Optical Systems, Inc. Ann Arbor, MI, USA). See SI Section S4 for instrumental details. In summary, a research-grade Leica microscope is fiber-optically connected to the spectrometer, in a configuration producing essentially confocal analysis. The excitation wavelength was 532 nm, and the laser typically was operated at 0.5–1 mW power at the sample surface, unless indicated otherwise. Spectra routinely were obtained using an Olympus MSPlan 50× ultra-long-working-distance (ULWD) objective with a numerical aperture (N.A.) of 0.55 or an Olympus MSPlan 80× ULWD objective with N.A. = 0.75. The spectral resolution was approximately 2.5 cm−1, and the reproducibility of the Raman shift position was ±0.1 cm−1 (SI Section S5). For these studies, the instrument was operated in a single-point mode, which permitted reliable analysis on relatively rough (scale of several micrometers to a millimeter) surfaces. More details on instrumental configuration, calibration, and spectral band reproducibility are presented in the Supplementary Information (Sections S4 and S5, respectively).
Each of the articles cited below provides detailed information on the analytical techniques applied in addition to Raman spectroscopy (basis of the RS technique briefly covered in SI Section S3). The main ones were FE-SEM, EDS, XRD, ICP-MS (of digested powders of individual layers), and OM on the thicker scales. The configurations of some other Raman systems and their capabilities are listed at the end of the paper (see also [29,35]).

2.2. Samples

Several of these studies addressed mineral scales precipitated via laboratory-based pipe-rig systems through which synthetically formulated water was recirculated. For new lead pipes, the scales needed to be developed ab initio. For harvested pipes, the scales had already developed, but the pipes needed to be reconditioned with water simulating that of the municipal water system before their removal from service. Experiments could be carried out on the pipes after their reconditioning. In one set of experiments, new lead pipes were conditioned for 110 weeks in a recirculation system using synthetic water of a composition similar to that of Washington, D.C.’s before 2000. The experiment showed that lead release after switching the disinfectant from free chlorine to monochloramine could be avoided by introducing orthophosphate before and during the switch rather than waiting until after the switch [21]. In a second set of experiments, LSLs were harvested from Providence, RI, after approximately 100 years of service, and placed in recirculation systems using synthetic water of a composition similar to that of recent-day Providence [22]. Introduction of orthophosphate into the recirculation water demonstrated successful development of Ca-Pb-phosphate scales in water of high pH and low alkalinity. A pipe from this same suite of LSLs from Providence had regions of iron-rich scale. In fill-and-dump experiments, the latter pipe was associated with anomalous decreases in pH and elevations in total lead concentration in the water [23]. Natural pipe scales from the above suite of harvested LSLs from Providence were analyzed by Raman microprobe and electron microprobe [36].
Laboratory experiments also were carried out to test the effects of water chemistry, pH, homogeneous vs. heterogeneous nucleation, and presence of organic matter on the precipitation and aggregation of lead phosphate phases ([4,20]; SI Section S6). These precipitates typically were analyzed on gold-coated silicon wafers or glass plates.

2.3. Preparation of Samples for Raman Analysis

Lead pipes sawed longitudinally revealed scales on their inside walls for direct, in situ RS analysis. In some cases, the latter pipes were further sawed into 1 cm2 tablets with their adhering scale, which could be analyzed even more easily under the Raman microprobe. Cross-sections were sawed perpendicular to the length of some lead pipes, exposing scale layers for RS analysis.
Layer-by-layer scrapings of scale off the pipe walls, resulting in powders (primarily for XRD and ICP-MS analyses), were also analyzed by RS, as were sub-millimeter particles collected on filters in the recirculation systems. The particles were analyzed while in place on the filters.
Representative portions and regions of interest in some pipes were filled with epoxy (Figure 1) in order to fix the scale in place before the pipes were sawed [21]. Careful polishing of perpendicular cross-sections sawed through epoxy-filled regions, in preparation for SEM and EDS analyses, more clearly revealed the spatial–temporal distribution of the mineral phases (Figure 1B). RS was applied to some of the polished cross-sections.

3. Results and Discussion

The results presented and discussed below are organized according to the Raman spectroscopic capability or the analytical concern they illustrate. The figures that accompany the text illustrate the broad outcomes of the RS analyses; more detailed examples are provided in SI Section S1.

3.1. Why Consider Using Raman Spectroscopy?

Raman spectroscopy is an effective way to distinguish among the most common lead oxide phases encountered in many LSL systems (see Figure 2), including our pipe-loop recirculation systems used to monitor the progress of the pipe-conditioning process [21,22]. The latter included documenting the ramifications of changing the disinfectant from free chlorine to chloramine in the presence and absence of an orthophosphate additive [21]. Figure 2, panel B reveals the spectral distinctions among the two PbO polymorphs, litharge and massicot, the two PbO2 polymorphs, scrutinyite and plattnerite, and the less commonly found Pb3O4 phase, minium. Figure 2, panel A in turn illustrates the ability of RS to identify and distinguish phases with a low degree of crystallinity, such as the scrutinyite here. The very minor phase litharge, recognized by its most diagnostic Raman peak (see label) in the synthetic scrutinyite sample (panel A, upper spectrum), most likely would not have been detected by bulk XRD on scraped powders. RS also characterizes non-lead phases of significance to lead mobility in pipes, for instance iron- [23], manganese-, and iron-manganese-dominated [36] oxides that are in intimate contact with lead-dominated scales.
Some of the important cautions and limitations of Raman microprobe spectroscopy are addressed in the next section and in the Supplementary Information, before additional advantages of the technique are explored.

3.2. Detecting and Dealing with the Effects of Laser Heating

The major challenges to Raman analysis and interpretation of lead-pipe scales are (1) the complexity (Figure 1B) and typical low degree of crystallinity of the samples, (2) wavelength-dependent, laser-induced luminescence in the sample [37] (in the literature, frequently referred to as fluorescence; see SI Section S7), which obscures the Raman signal, and (3) possible thermal alteration of the sample by the exciting laser beam. The last issue will be dealt with immediately below, and the former two concerns will be addressed in examples in later text sections and in SI Section S7. In order to better represent the kind of raw data that other researchers would collect, the luminescence effects have not been removed by background correction in the spectra presented in this paper (except where noted).
The dark color of many of the lead and other metal oxide phases that occur in pipe scale may induce (intense) heating of the sample via absorption of the focused laser energy during analysis. The possible effects of both sample destruction and phase alteration/transformation, therefore, must be considered. The wavelength dependence of absorption means that the degree of heating is strongly affected by the wavelength of the exciting radiation [38], which can be changed in some Raman instruments. Heating effects can also be reduced by decreasing the power of the laser source and using a microscope objective of lower N.A. (typically accompanying lower magnification), which broadens the focused beam and lowers the power density on the sample. With regard to in situ analysis of pipe scale, heating is particularly problematic for the surficial precipitates, which can lack good thermal contact with surrounding grains or the lead pipe. In polished cross-sections, the grains surrounding the phase under analysis will act as heat sinks to some degree. The heat-sink effect likely accounts for why the RS of lead pipes can be done with even 488 nm to 532 nm lasers at powers up to about 0.5 mW on the sample surface without experiencing visual burn spots or spectral distortions (our experience). In contrast, the use of RS to identify the finely ground minerals used over the centuries as pigments in paints typically demands longer wavelengths and lower laser powers for non-destructive analysis of opaque and reddish phases that are dispersed within the paint on the surface of an art object [38,39].
There are four major results of laser heating, which should be recognized so as to avoid damaging the sample or complicating the spectral interpretation. (1) Spectral peaks are shifted to lower wavenumbers (mechanism discussed by [40] and further illustrated, e.g., by [41]). As a result of this downshifting, (2) the peaks also become artificially broadened and typically asymmetrically extended toward lower wavenumbers. This broadening effect can be misinterpreted as an indication of atomic disorder in the sample. The peak shapes and positions must be monitored during analysis to distinguish between the inherent atomic disorder in a sample and the effects of temporary, localized heating. (3) Formation or stabilization of a new phase may occur via (perhaps temporary) polymorphic transformation or (permanent) chemical reaction, such as oxidation. (4) Localized destruction of the sample may occur, leaving an obvious crater and/or black spot.
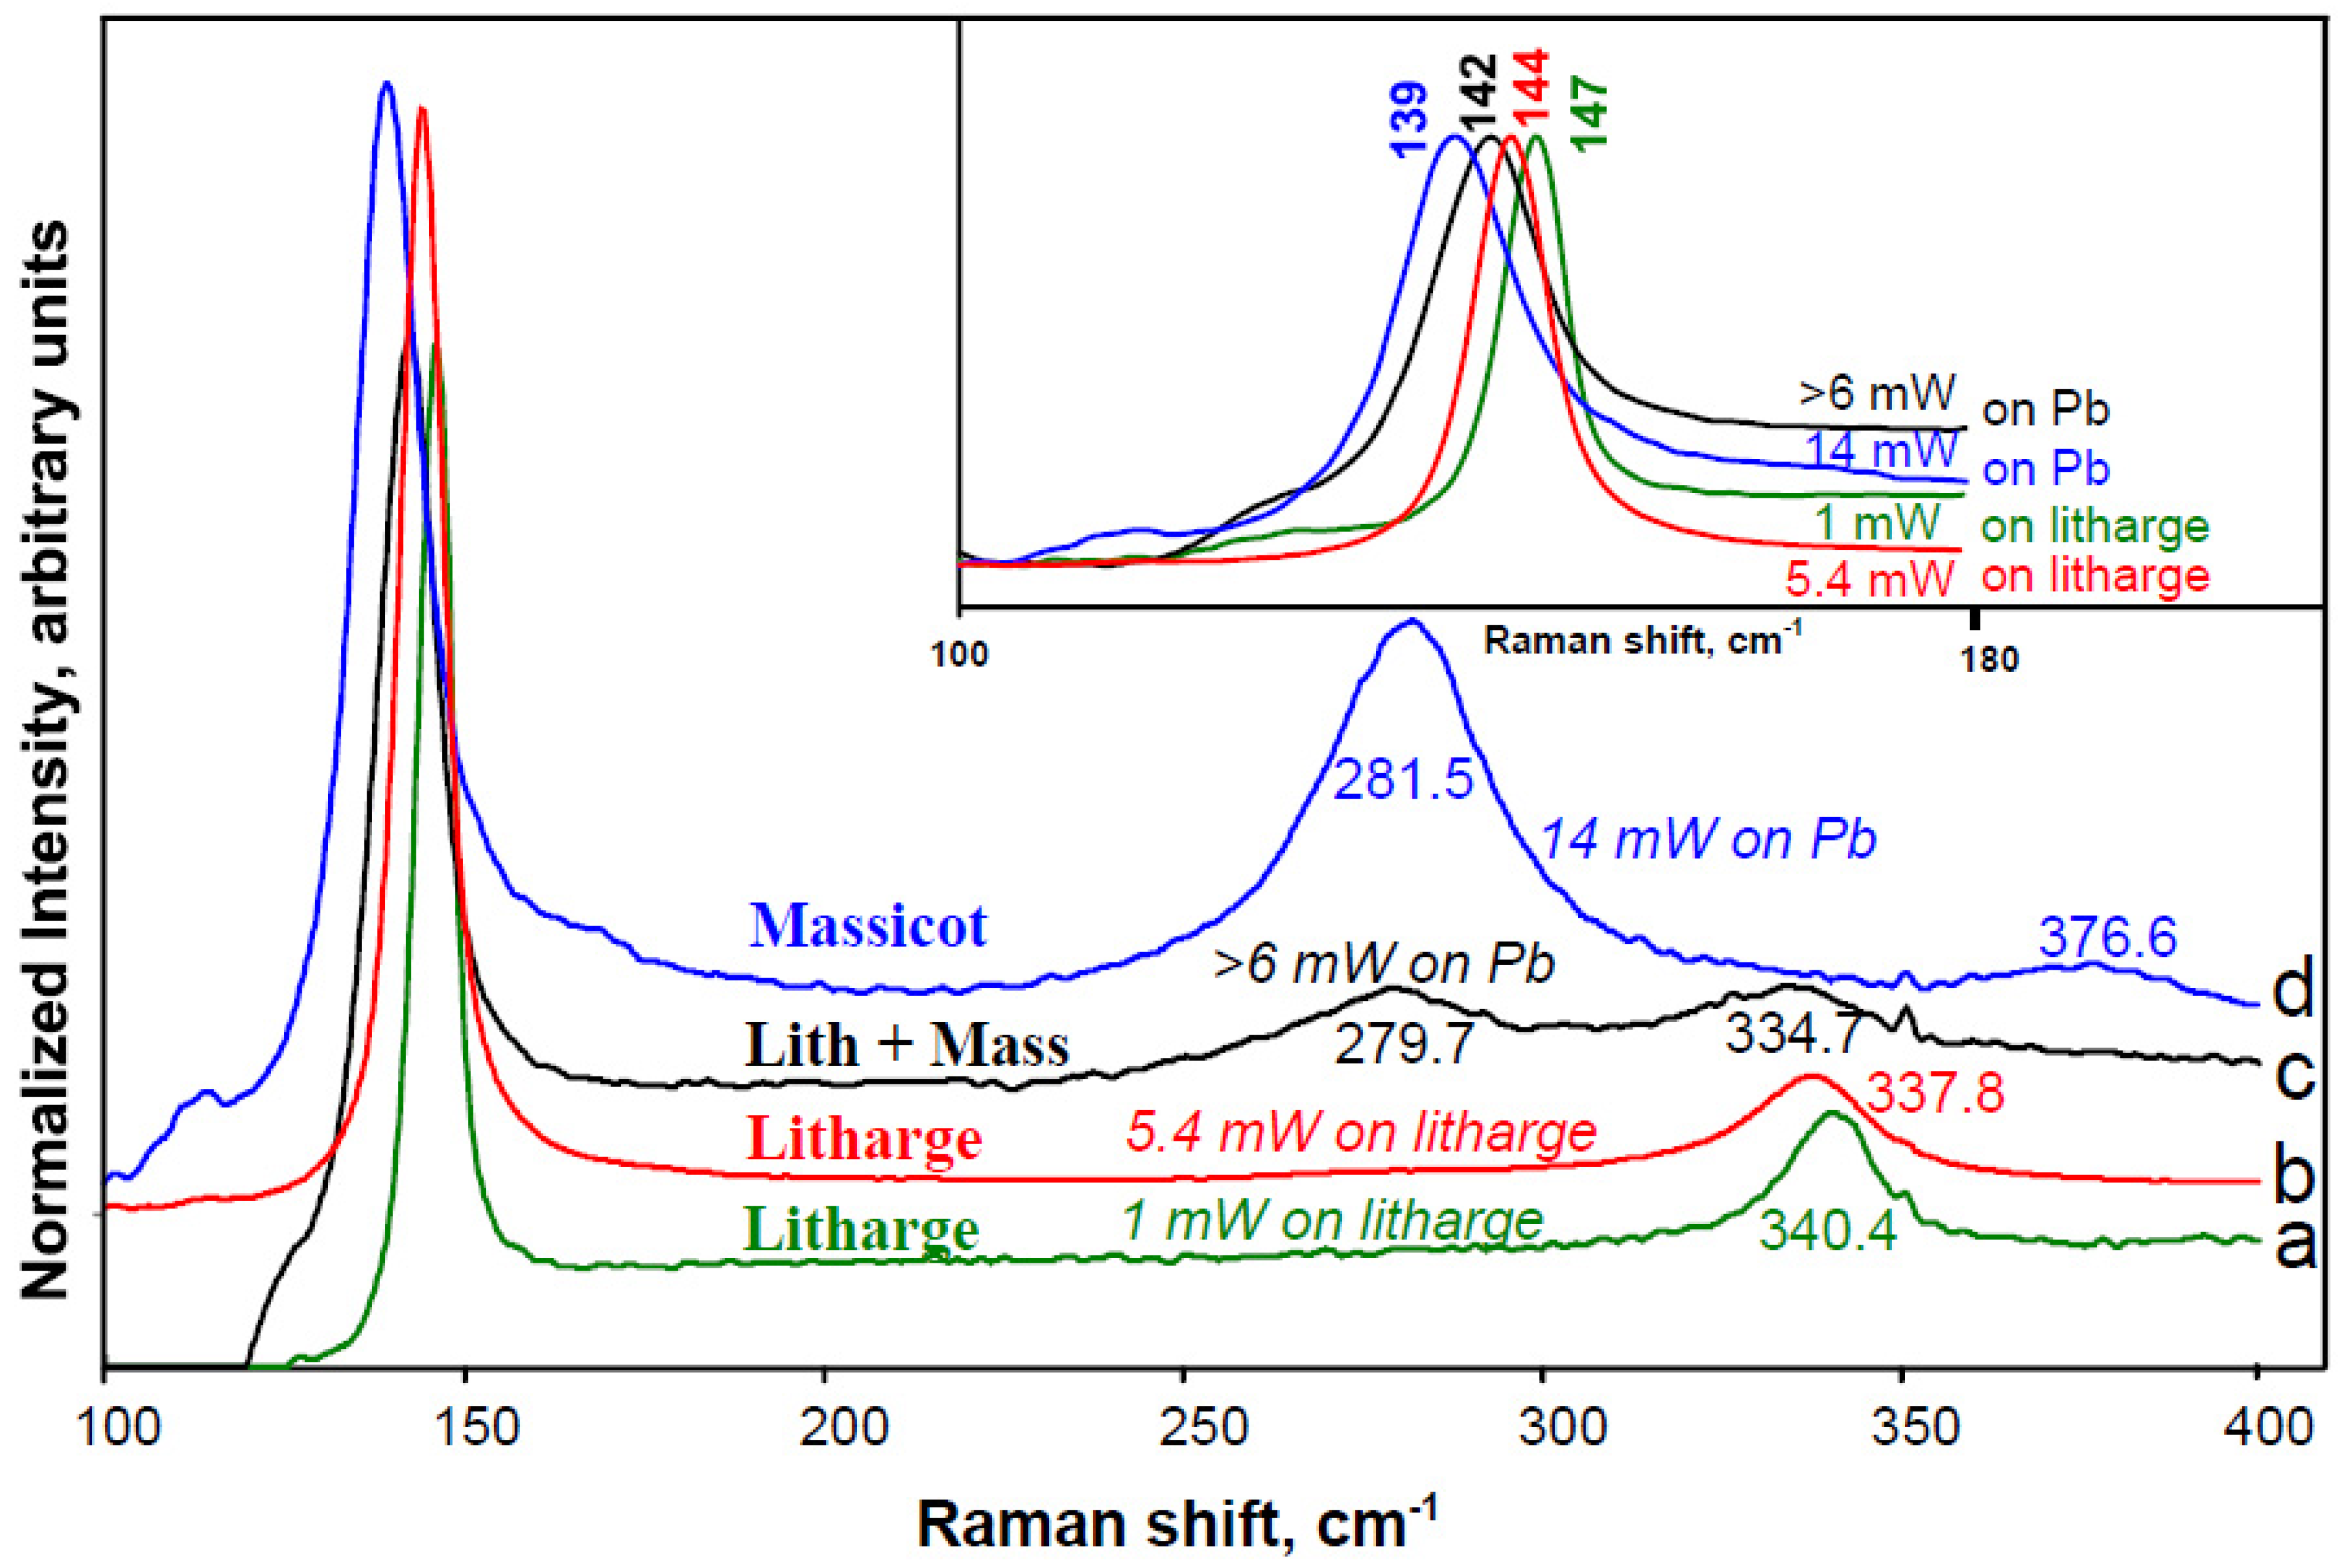
Heating artifacts are especially problematic on powdered samples but may be decreased by firmly pressing the powders onto a clean metal surface such as aluminum foil. Densification of the powder not only increases thermal contact among grains but also increases the signal intensity. Heating artifacts also can occur during in situ analysis of mineral scales on a lead pipe, but they can typically be minimized as described above. Litharge (α-PbO, tetragonal) is one of the earliest scale minerals to develop in many LSLs, adhering directly to the lead pipe (see Figure 3 spectra a and b). As laser heating proceeded on a red to black litharge grain, its main (ν1) peak at about 147 cm−1 has downshifted by 3 cm−1 (Figure 3, inset). A different litharge peak at 340.4 cm−1 (spectrum a) not only downshifts to 334.7 cm−1 (spectrum c) but also increasingly broadens as the laser power increases. When the local temperature due to laser irradiation reaches about 486 °C, the litharge converts partially or fully to the high-temperature β-PbO polymorph massicot (Figure 3d). Analogously, increasing laser power on a clean lead pipe causes progression from no spectral response at 1 mW (our experience) to the development of massicot + litharge (spectrum c) or massicot alone (spectrum d) at increasing powers (Figure 3). For graphitic/carbonaceous (black, opaque) material, laser heating can produce downshifts of more than 10 cm−1 [40], an offset sufficient to interfere with phase identification.
In principle, the translucent white to colorless lead carbonates cerussite (PbCO3) and hydrocerussite [Pb3(CO3)2(OH)2] are much less susceptible to laser-induced heating than opaque (efficiently light-absorbing) red to black litharge, especially if they are in good thermal contact with surrounding light-colored phases. The carbonates can still be destroyed by high laser power, however, especially if they exist as highly porous (“fluffy,” therefore offering low thermal conductivity) surface coatings on pipe scale.
Fortunately, spectra obtained at low laser powers (our typical analyses at ≤0.5 mW at the sample) are remarkably diagnostic. Although the photon count rate is lower at decreased laser power, the resulting signal: noise (S:N) ratio still supports useful spectral interpretation, e.g., within 8–10 s. Averaging multiple spectral acquisitions will increase the S:N.

3.3. Raman Spectroscopy (RS) as a Compositional–Structural Probe

The number of spectral bands detected and their positions within a Raman spectrum, both absolutely and with respect to each other, are controlled by the strength and symmetry of the (covalent) bonds between the atoms in the pertinent molecule and the relative masses of those atoms (see SI Section S3). Therefore, the combination of composition and structure of individual solids yields definitive Raman spectral fingerprints and ensures the usefulness of RS to both identify and further characterize phases in lead-pipe scale (see SI Section S3).
To understand what controls the concentrations of dissolved and particulate lead in drinking water requires knowledge of what phase is precipitating on the walls of the LSLs. The precipitating phase is not always that which has been calculated to be in equilibrium with the composition, pH, and Eh of the water [3,4,11]. RS can help determine if this apparent discrepancy between theory and observation is due to the development of an unpredicted phase or simply the ability of an earlier-precipitated phase to adjust its composition via chemical substitution, i.e., to exhibit solid solution. It is especially important to characterize the most surficial, i.e., presently precipitating, scale in order to evaluate its ability to buffer the concentration of dissolved lead in the water. Our experience is that RS typically can produce an interpretable spectrum even if the surface layer of precipitates is on the order of 2–4 micrometers in thickness. The capabilities of RS in spatial resolution, detection limits, and the ability to provide analyses in situ on a pipe wall exceed those of XRD analyses of materials scraped (10s of µm thick) from scale layers. Phase identification by RS also complements compositional analysis provided by SEM-EDS or electron microprobe, which do have high spatial resolution.
In studies of lead-pipe scale, not only the lead oxide but also the lead carbonate minerals cerussite (PbCO3) and hydrocerussite [Pb3(CO3)2(OH)2] are distinguishable by RS. In the latter, this is shown by the peak position of their dominant ν1 C-O bands, with cerussite at ~1055 and hydrocerussite at ~1050 cm−1, as well as by their weaker bands (see Figure 4). If the signal is strong enough and the luminescence (seen as a rising background in spectra a and b) is not too great at higher wavenumbers, not only the C-O band at ~1050 cm−1 is detected for hydrocerussite, but also its O-H stretch at ~3539 cm−1 (Figure 4). The stabilities of these two carbonate phases reflect differences in pH conditions, so the ability to distinguish them provides useful information.

3.3.1. Phosphate Phases

Beyond simple phase identification, Raman spectra reflect compositional characteristics, as well illustrated by phosphate phases. The spectral sensitivity to compositional differences within a given mineral species or within a group of species depends strongly on the nature of the mineral, i.e., its atomic bonding. Raman spectra exhibit various degrees of sensitivity to compositional differences among one and the same mineral species (i.e., atomic substitution/solid solution), which is particularly useful in the characterization of lead-bearing phases that precipitate in response to the addition of corrosion inhibitors. Metal phosphates are regarded as sparingly soluble salts, but whose individual solubilities differ by many orders of magnitude. Solubilities differ significantly even among the lead-bearing phosphates [42]. Many water utilities add orthophosphate in an effort to form these low-solubility solids, but very few of them have actually analyzed scale samples to determine if such solids are forming and, if so, which ones and of what specific chemical composition. In those cases in which analyses have been made, the results can be unexpected [11].
Phosphate minerals within the apatite [(X2+)5(PO4)3(Y−)] family play an important role in a number of environmental issues. Of importance to stabilizing mineral scales in LSLs are the Ca-apatite [(Ca2+)5(PO4)3(Cl,OH,F)], Pb-apatite or pyromorphite [(Pb2+)5(PO4)3(Cl,OH,F)], and phosphohedyphane [(Ca2+)2(Pb2+)3(PO4)3(Cl,F,OH)] groups. The solubilities (in many cases not well known) of individual mineral species in the latter two groups, and thus, their Pb-buffering capacities, are controlled by their chemistries. Therefore, the specific compositions of such phases are important to the stabilization of pipe scales and the lead concentrations in the surrounding water. With the introduction in January, 2021, of the revised Lead and Copper Rule, which reduces the Pb action limit to 10 µg/L (from 15 µg/L), many more water utilities will be adding orthophosphate to their water. Experimental studies of pyromorphite have shown its ability to bring aqueous lead concentrations below the new Pb action level [43].
The un-prefixed terms “pyromorphite” and “phosphohedyphane” are used by mineralogists both to designate a mineral group and to specify the chlor-species member of each group. For clarity in this paper, however, those species will be called chlorpyromorphite and chlorphosphohedyphane.
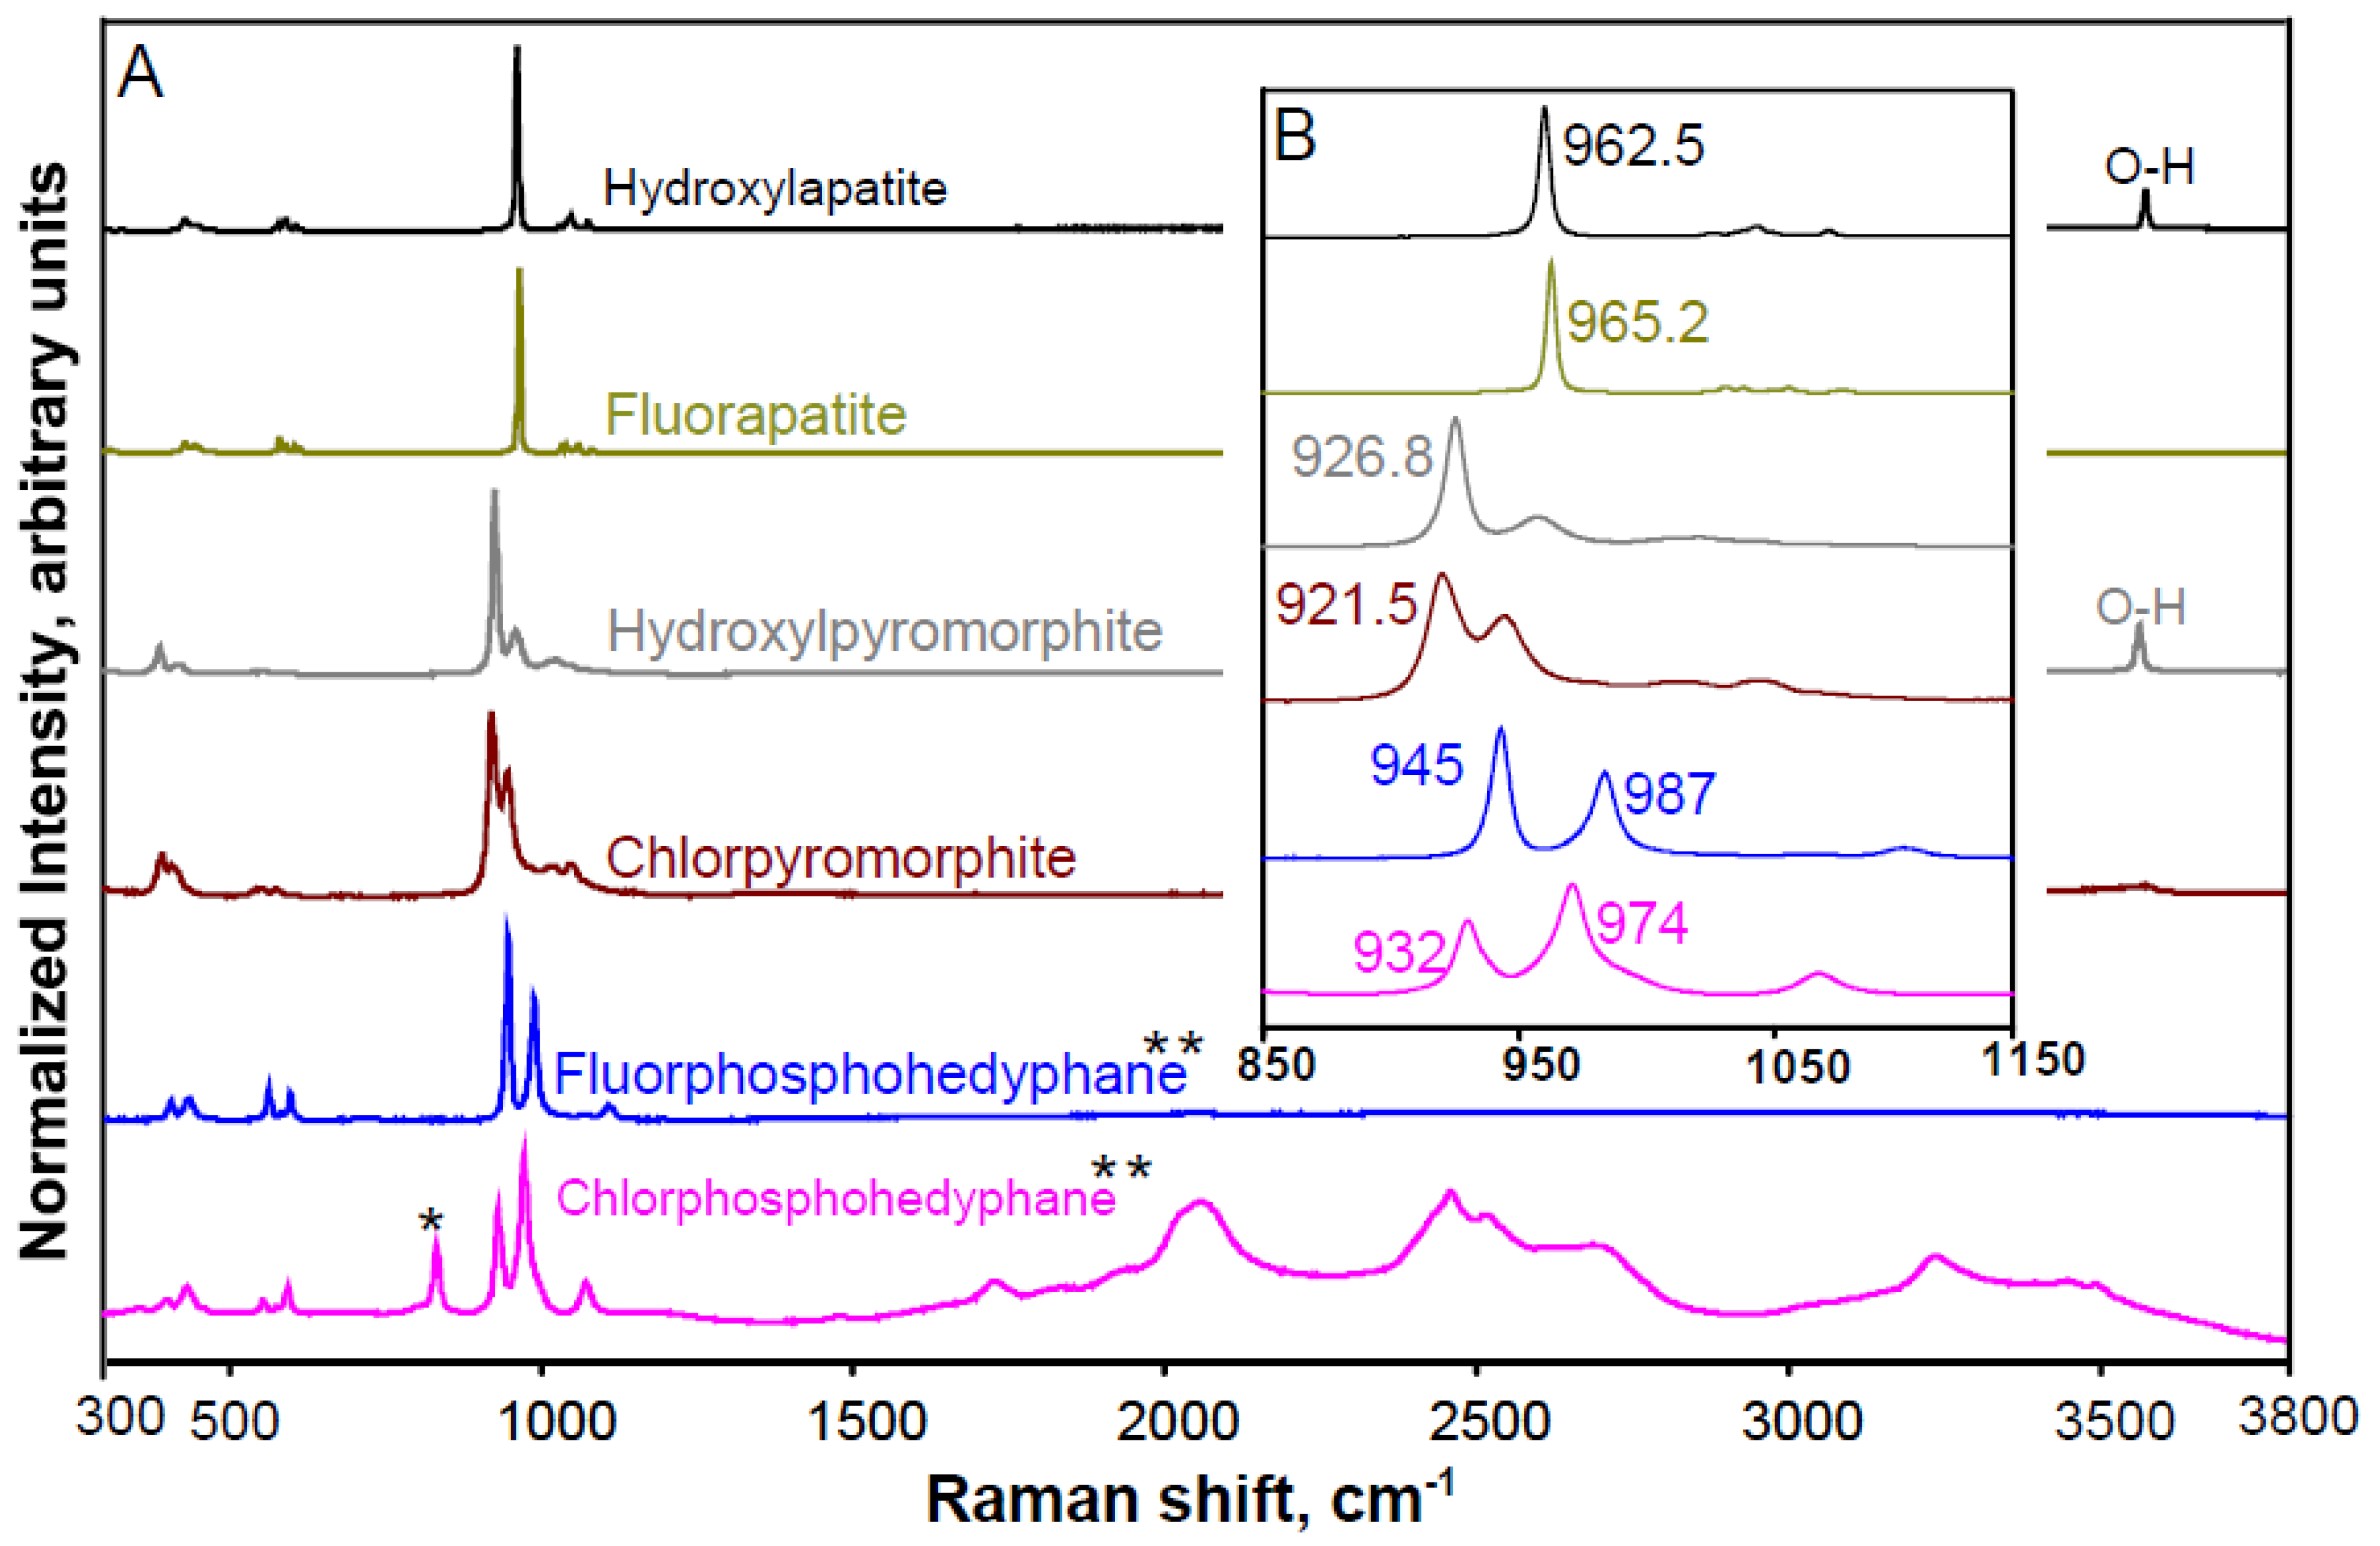
The Raman spectral fingerprints of species within the Ca-apatite, pyromorphite, and phosphohedyphane [44,45,46,47,48] mineral groups indicate their chemical–structural similarities (see Figure 5). The overall spectral patterns clearly differentiate the individual mineral groups from each other (Figure 5, panel A), as would XRD. However, the specific Raman peak positions further distinguish individual species/members within the same mineral group (panel B). Such distinctions may be less clear from XRD patterns than from Raman spectra in some cases, because RS explores the nature of the bonding at an atomic level. This accounts for the latter’s spectral sensitivity to atomic substitutions and other effects that alter the vibrational environment of the covalent bond (see SI Section S3).
An example pertinent to the analysis of lead-pipe scale is the ability to distinguish between chlorpyromorphite and hydroxylpyromorphite [49]. The Ksp of the former is about seven orders of magnitude less than that of the latter [42,50], although it is the hydroxyl member that is usually identified in lead pipes. The XRD distinction is typically based on the presence of a single vs. a double-peak at about 30° 2Θ [50] and/or the presence of two vs. three peaks in the 45–47° 2Θ region [42] for hydroxyl- vs. chlorpyromorphite, respectively. However, structural incorporation of carbonate in chlorpyromorphite or other mechanisms for lessening the degree of crystallinity in the solid can cause the apparent loss of one peak for chlorpyromorphite in each of those two spectral regions, making its XRD pattern difficult to distinguish from that of hydroxylpyromorphite (see Sternlieb et al. (2010) [50], their Figure 2 and Figure 3). Raman spectra in Figure 5 demonstrate more clearly the distinction between these two species of pyromorphite. The spectral distinction remains just as clear in the presence of significant carbonate substitution within the pyromorphite structure (Sternlieb et al., 2010 [50], their Figures 6 and 8).
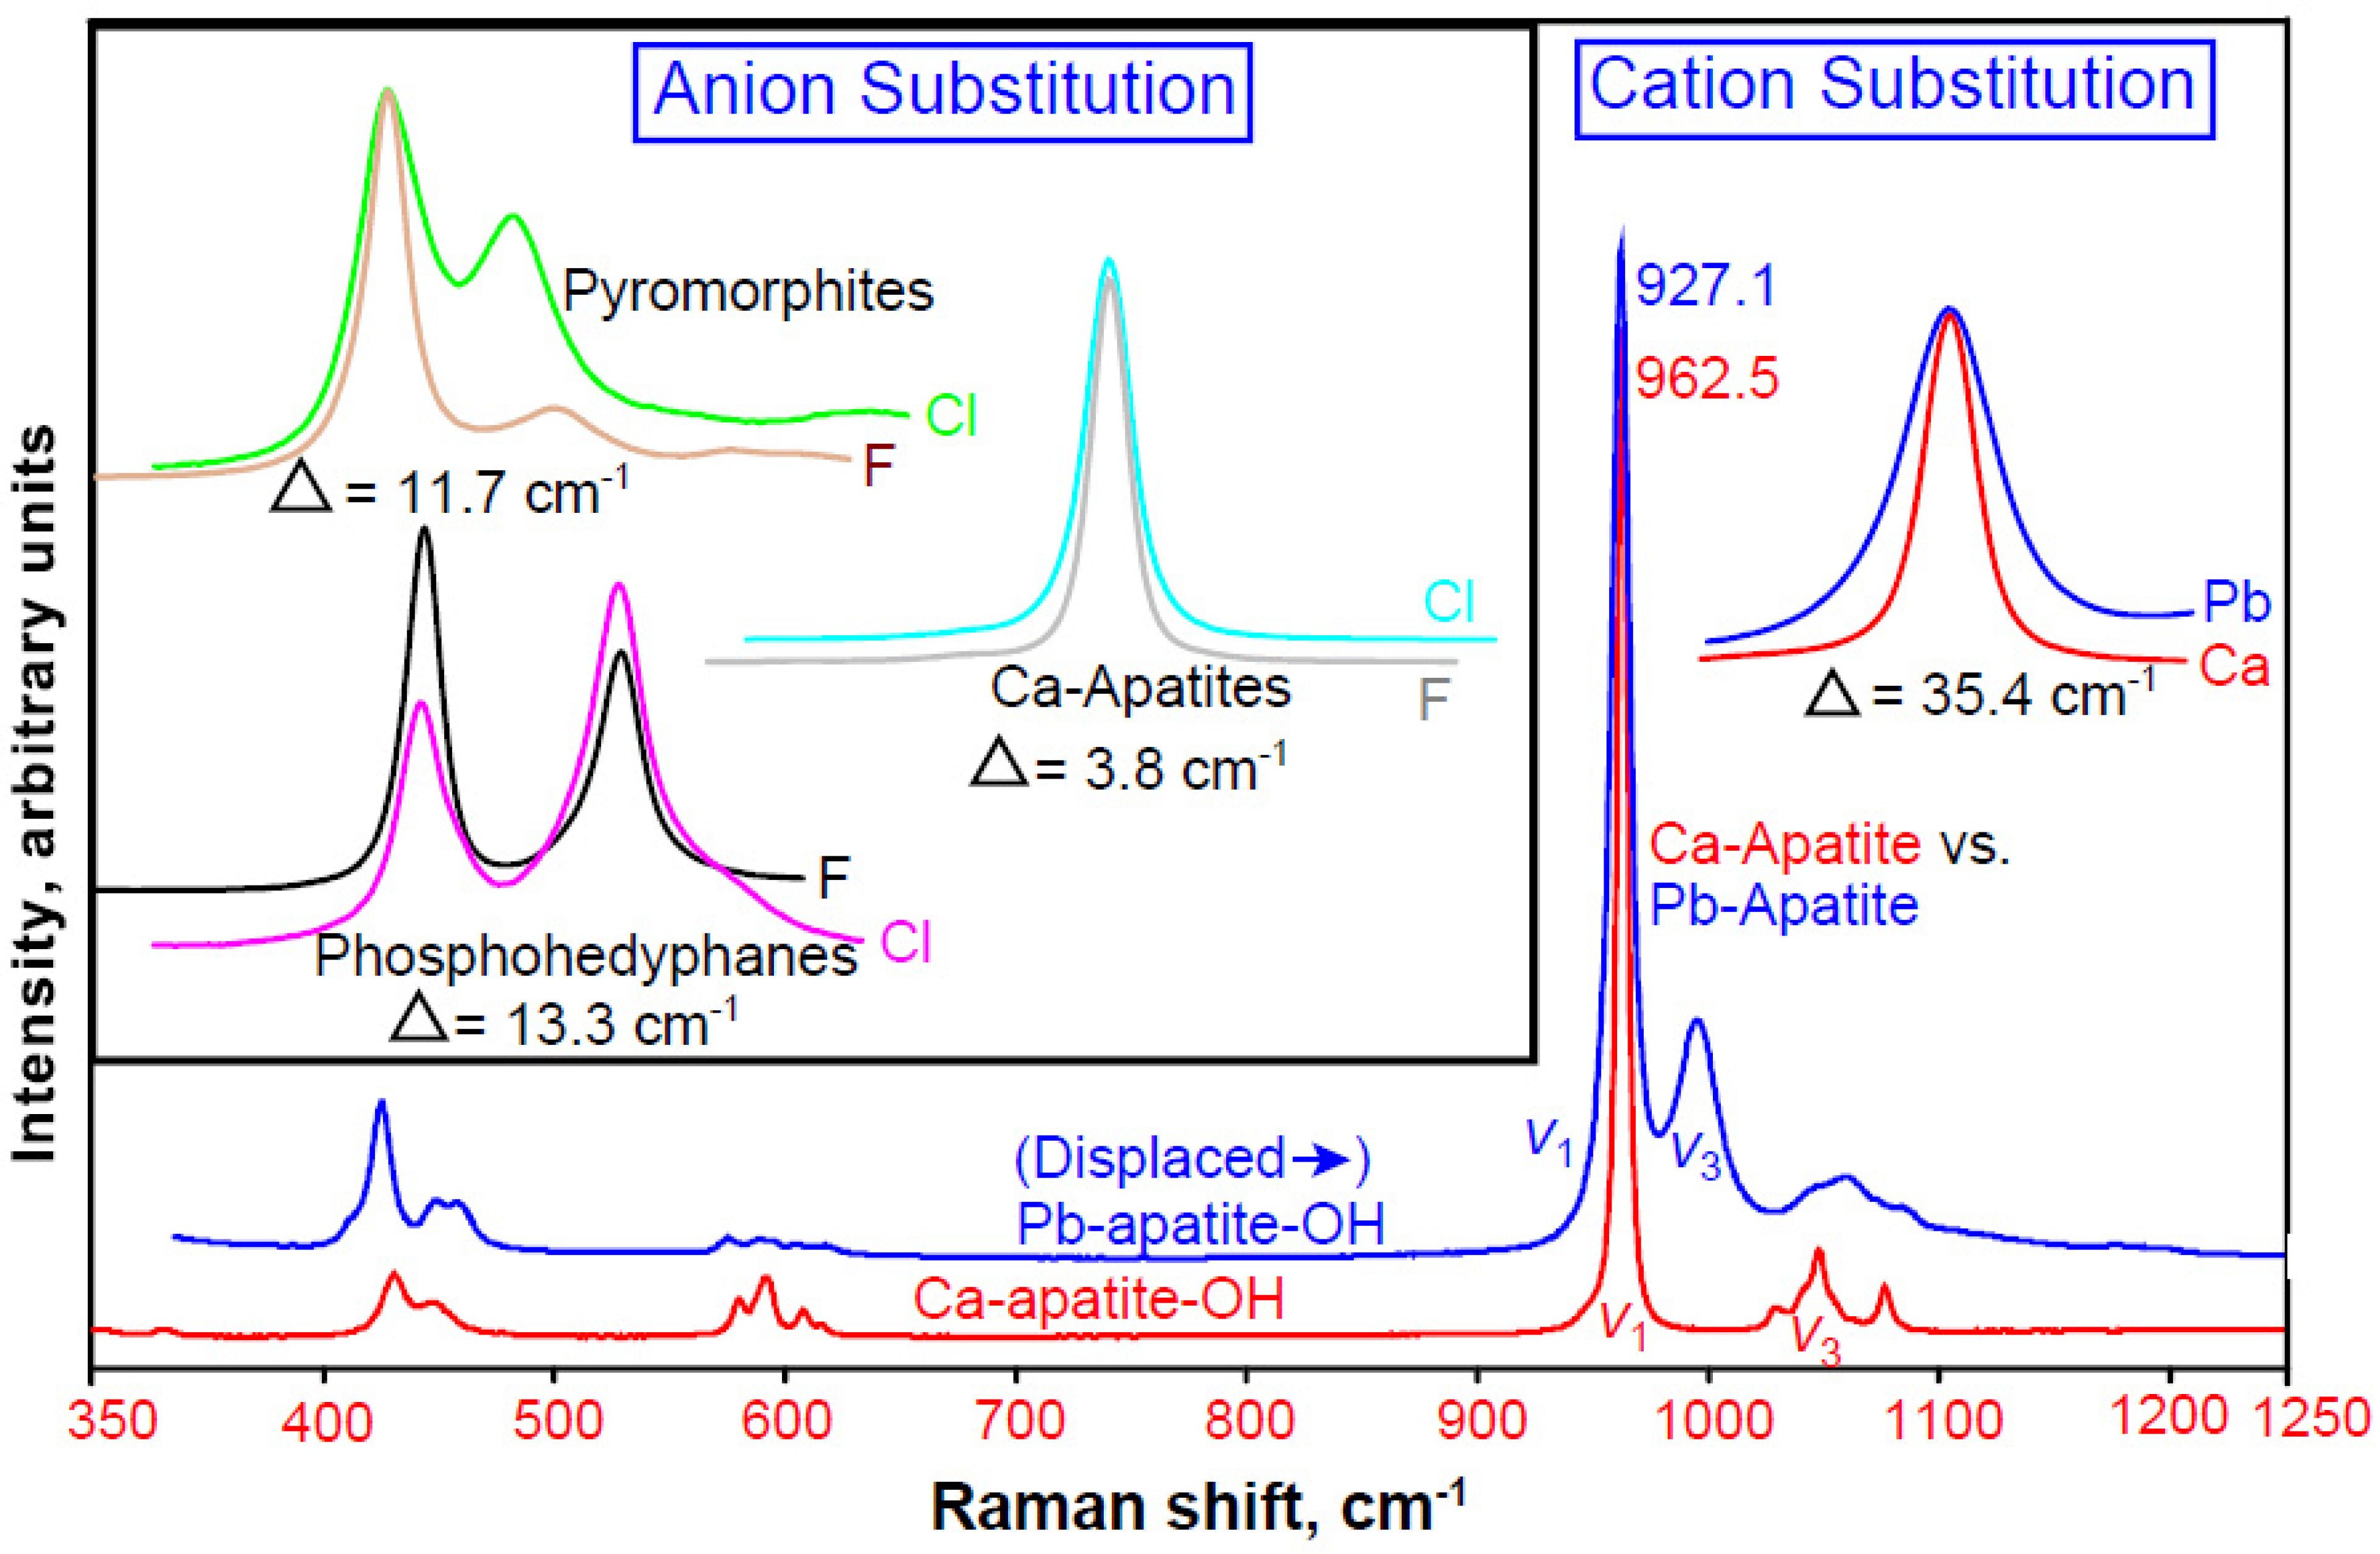
As exemplified in the above paragraph, an evaluation of the pertinent solubilities of mineral scales requires assessment of the chemical sensitivity within each of these three phosphate mineral groups (i.e., Ca-apatite, pyromorphite, phosphohedyphane) to substitution of their cation and anion components. Figure 6, in turn, demonstrates the analytical capability of RS to distinguish subtle chemical differences in each of the three groups. The two stacked spectra at the bottom of Figure 6 illustrate how the “apatite-family template” of the spectrum is very similar for the Ca-apatite and Pb-apatite (i.e., pyromorphite) groups. There is, however, a huge spectral offset that accompanies this Ca-Pb cation substitution (in large part due to the much greater atomic mass of lead), as illustrated by the lateral shifting required (35.4 cm−1) in order to overlay the two spectra. Analogously, anion substitutions (typically among OH, F, and Cl) within the three groups in the apatite family (Figure 6, inset) reveal readily detectable (some, very large) effects on band positions in their Raman spectra. The amount of spectral shifting in the ν1 P-O band is indicated by the Δ value shown in the inset. Fortunately for application to LSL issues, the Pb-bearing phosphates, i.e., pyromorphites and phosphohedyphanes, show the greatest sensitivity to anion substitution. Figure S1 shows these relations in more detail.
The chemistries of natural drinking-water sources differ (e.g., pH, alkalinity, and concentrations of Ca, Al, and dissolved inorganic carbon) and, thus, may require site-specific optimization of the approaches to their corrosion-control treatment. For instance, with respect to orthophosphate additives, it is important to understand how chemical differences in the precipitation solutions will affect the identity, chemical–structural properties, and thus, solubility of the phosphate phases that form [25]. In order to explore some of the compositions of phosphohedyphane-like phases identified in studies of harvested LSLs [12,17,18], our group initiated synthesis experiments (experimental details in SI Section S6) using phosphate solutions with different molar ratios of Ca/Pb and (Ca+Pb)/P in the presence or absence of NaCl. Note that fluoride and chloride components are important to consider due to the common addition of fluoride to municipal water systems to ensure dental health and some soluble compound of chlorine for the purpose of disinfection.
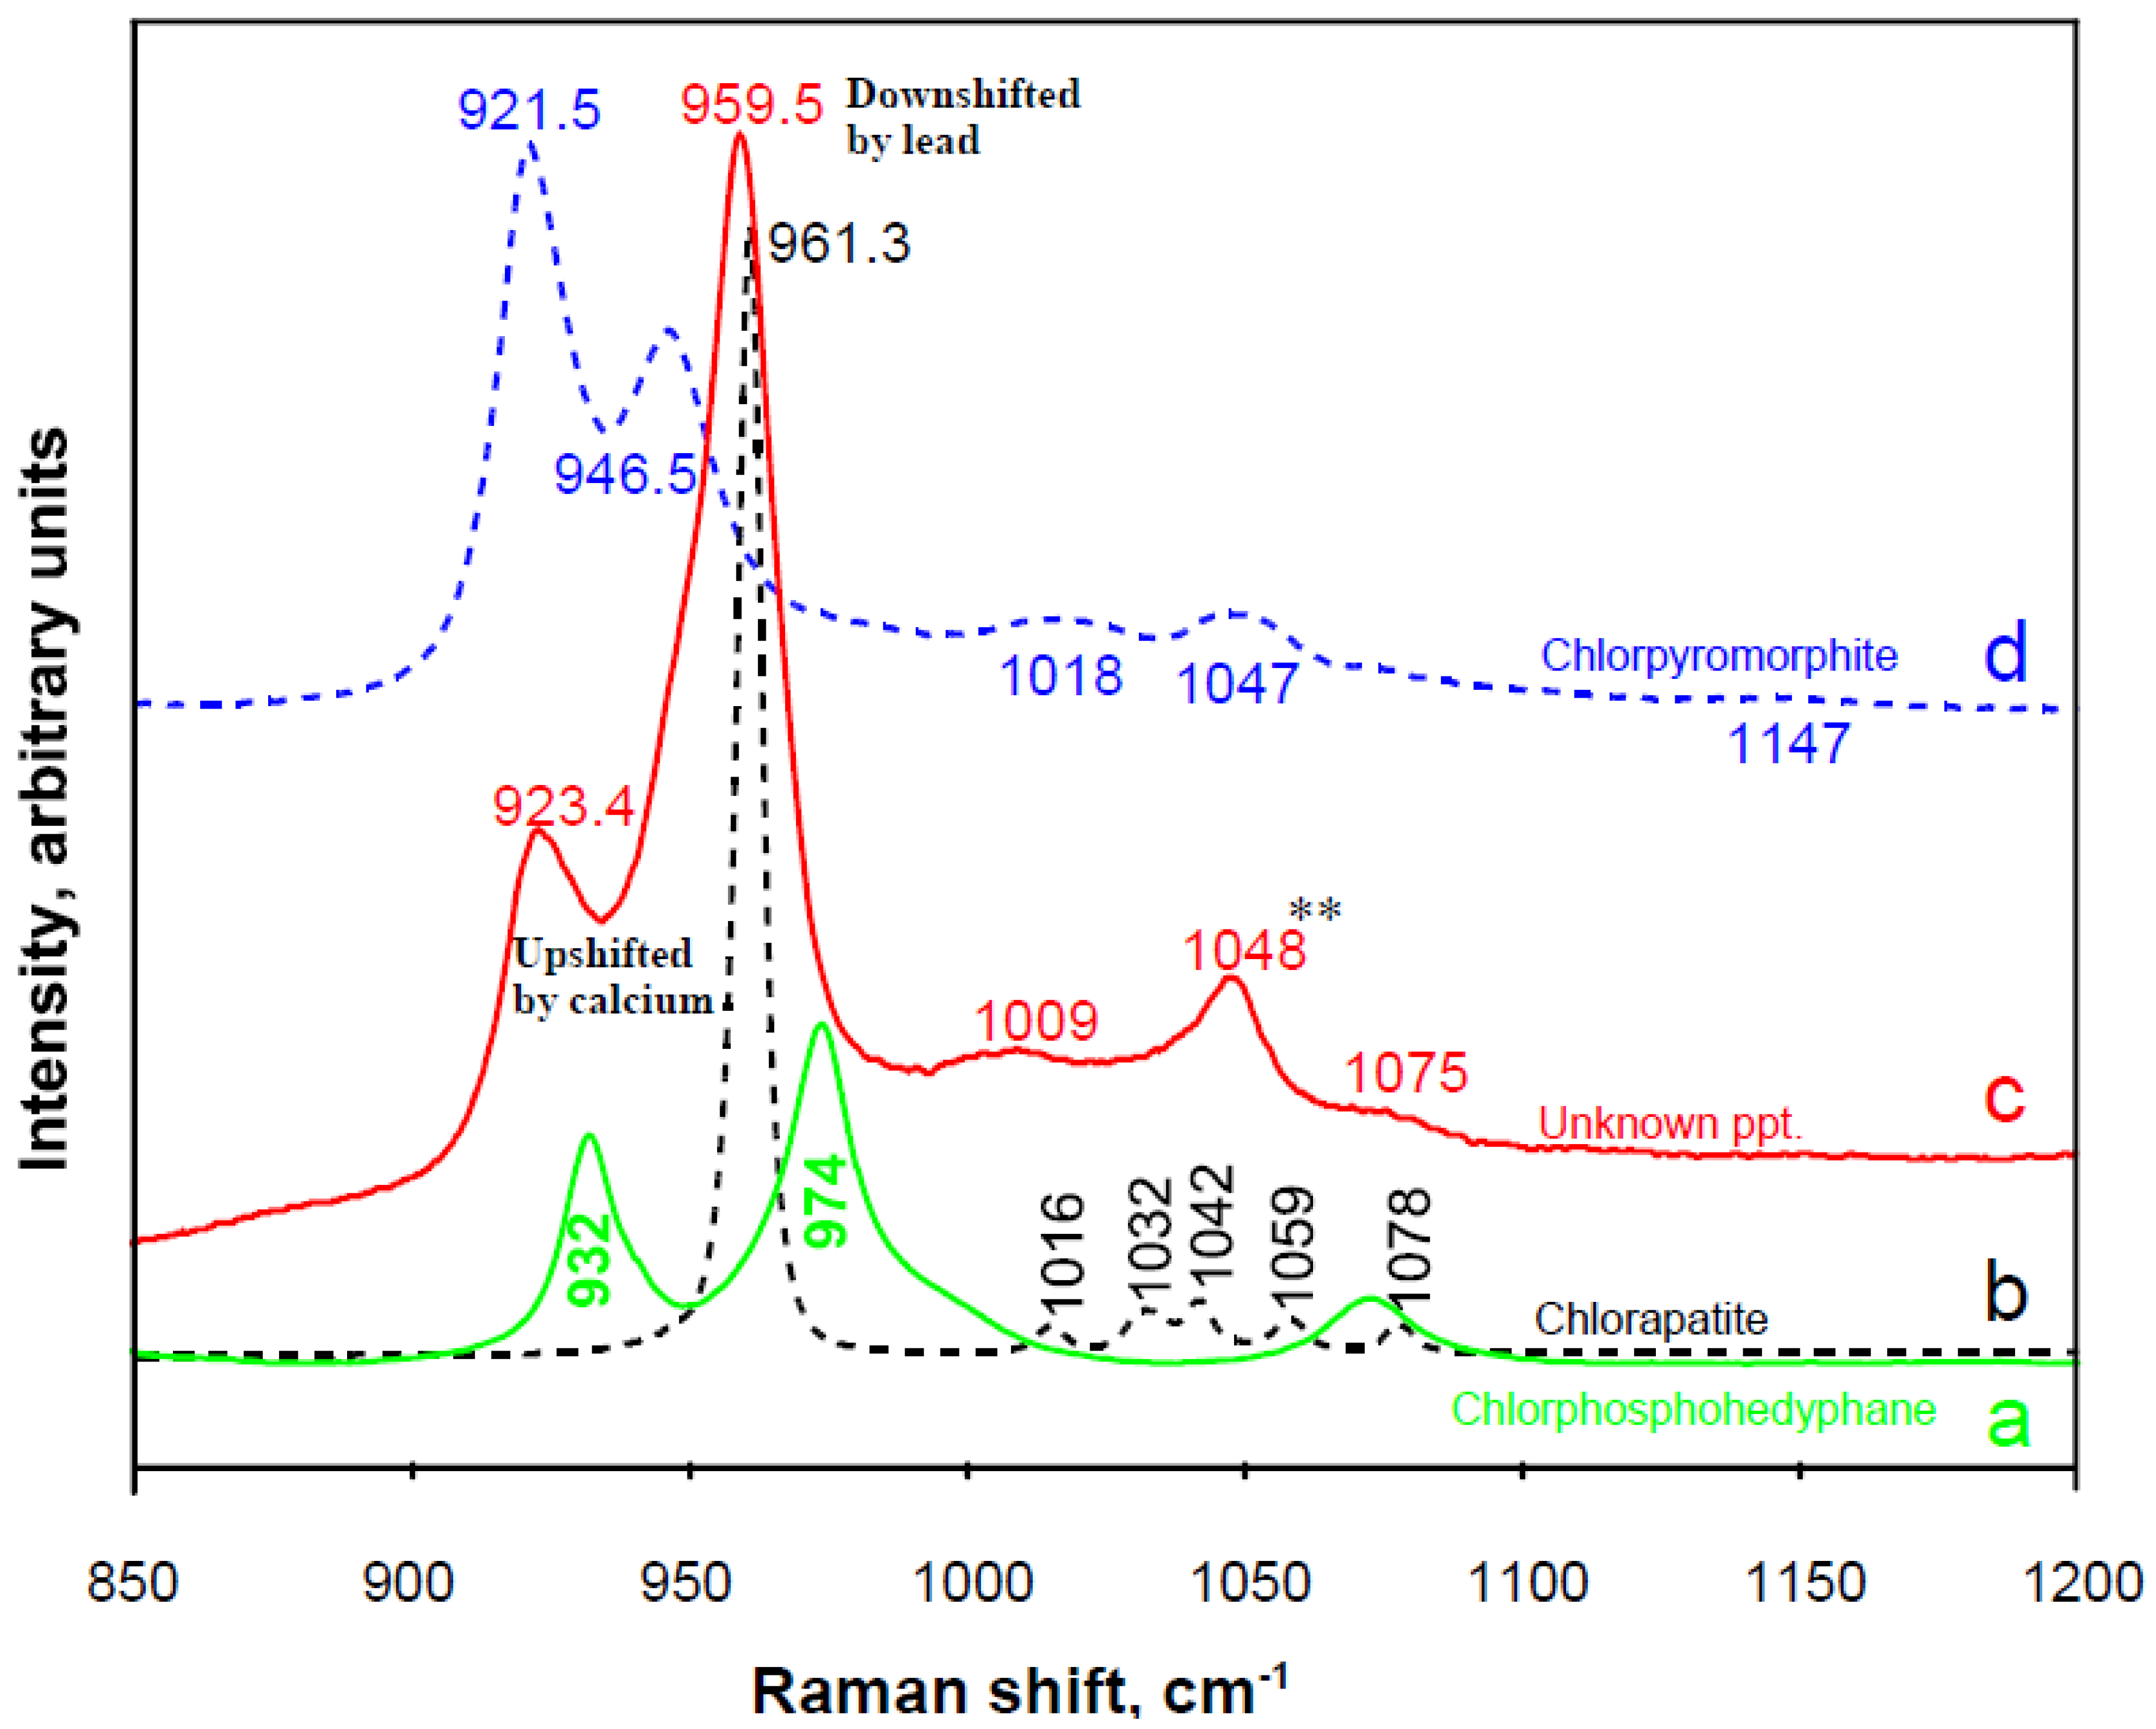
In the above study, Raman spectroscopy provided insights into the effects of solid solution and relative nucleation efficiency on the phosphate precipitates. Figure 7′s Raman spectrum (c) of the precipitate from a Cl-bearing phosphate solution with a Ca/Pb atomic ratio of 20 (see SI Section S6) clearly shows the effects of lead incorporation into the structure of the phosphate mineral. A comparison of spectra of chlorapatite (Ca-P-Cl), chlorpyromorphite (Pb-P-Cl), and chlorphosphohedyphane (Ca-Pb-P-Cl) standards with the spectrum of the precipitate highlights the sensitivity of the Raman spectrum to substitution of Pb into the apatitic structure. It also documents the effectiveness of the chemical partitioning of Pb from the solution (with its molar ratio of Ca: Pb = 20) into the solid phase (with its molar ratio of Ca: Pb = 0.51). The dominance of a single (ν1) peak, as in Ca-apatite, has been modified in this precipitate to the double-peak (ν1 and ν3) prominence of a Pb-apatite (pyromorphite, phosphohedyphane), and not even the peak positions and relative intensities of the ν1 and ν3 peaks match those of chlorapatite (compare to relations in Figure 6). The spectrum of the precipitate instead indicates a Ca-enriched analog of stoichiometric chlorphosphohedyphane (see Figure 7 (a), a spectrum of a geological sample).
Based on chemical analyses of geological minerals in the apatite family, Kampf et al. (2006) [44] inferred probable complete solid solution between chlorpyromorphite (Pb-P) and chlorphosphohedyphane (Ca-Pb-P). Zhu et al. (2016) [43] carried out a detailed experimental study of the solubility of multiple members of the (PbxCa1−x)5(PO4)3OH solid solution series (even more pertinent to LSL scales) at pH 2–9. They documented Pb-apatite (pyromorphite) with a solubility 23 orders of magnitude less than that of Ca-apatite; solubilities of compositionally intermediate members decreased proportionally as the Pb/(Pb + Ca) molar ratio increased. It is, therefore, important to know this molar ratio when estimating the aqueous lead concentration in equilibrium with a specific phosphohedyphane scale. Spectral calibration against Ca-Pb-phosphate phases of known composition would be very useful for such compositional determinations.
In one pipe-conditioning experiment, a synthetic water source was recirculated through decades-old, lead pipes harvested from Providence, RI [22]. At the time when phosphate was introduced into the synthetic water, the dissolved lead concentrations decreased, but in situ RS of the most recently precipitated (i.e., most surficial) pipe scale did not initially detect a pyromorphite or phosphohedyphane phase. Rather, F-bearing hydroxylapatite was the phosphate phase found on the scale surface [22]. Given the high Ca/Pb ratios in typical water systems, a Ca-apatite phase is not unexpected, and a lead phosphate was subsequently detected elsewhere in this pipe. Kinetic factors, including those controlling mineral nucleation, can affect the order in which the solids precipitate [3]. Such low-solubility, non-lead phases might be important as temporary stabilizers of underlying lead-bearing scales in times of compositional fluctuation in the water supply. Additionally of importance in this case was that the F-bearing apatite was shown spectroscopically to have a significant component of carbonate in solid solution (see Figure S2). RS also clarified the identity of the phosphate phase induced by the addition of orthophosphate in the pipe-loop experiment with initially new lead pipes and synthetic water simulating that in Washington, D.C. before 2000 [21]. The phase was found to be a type of phosphohedyphane.
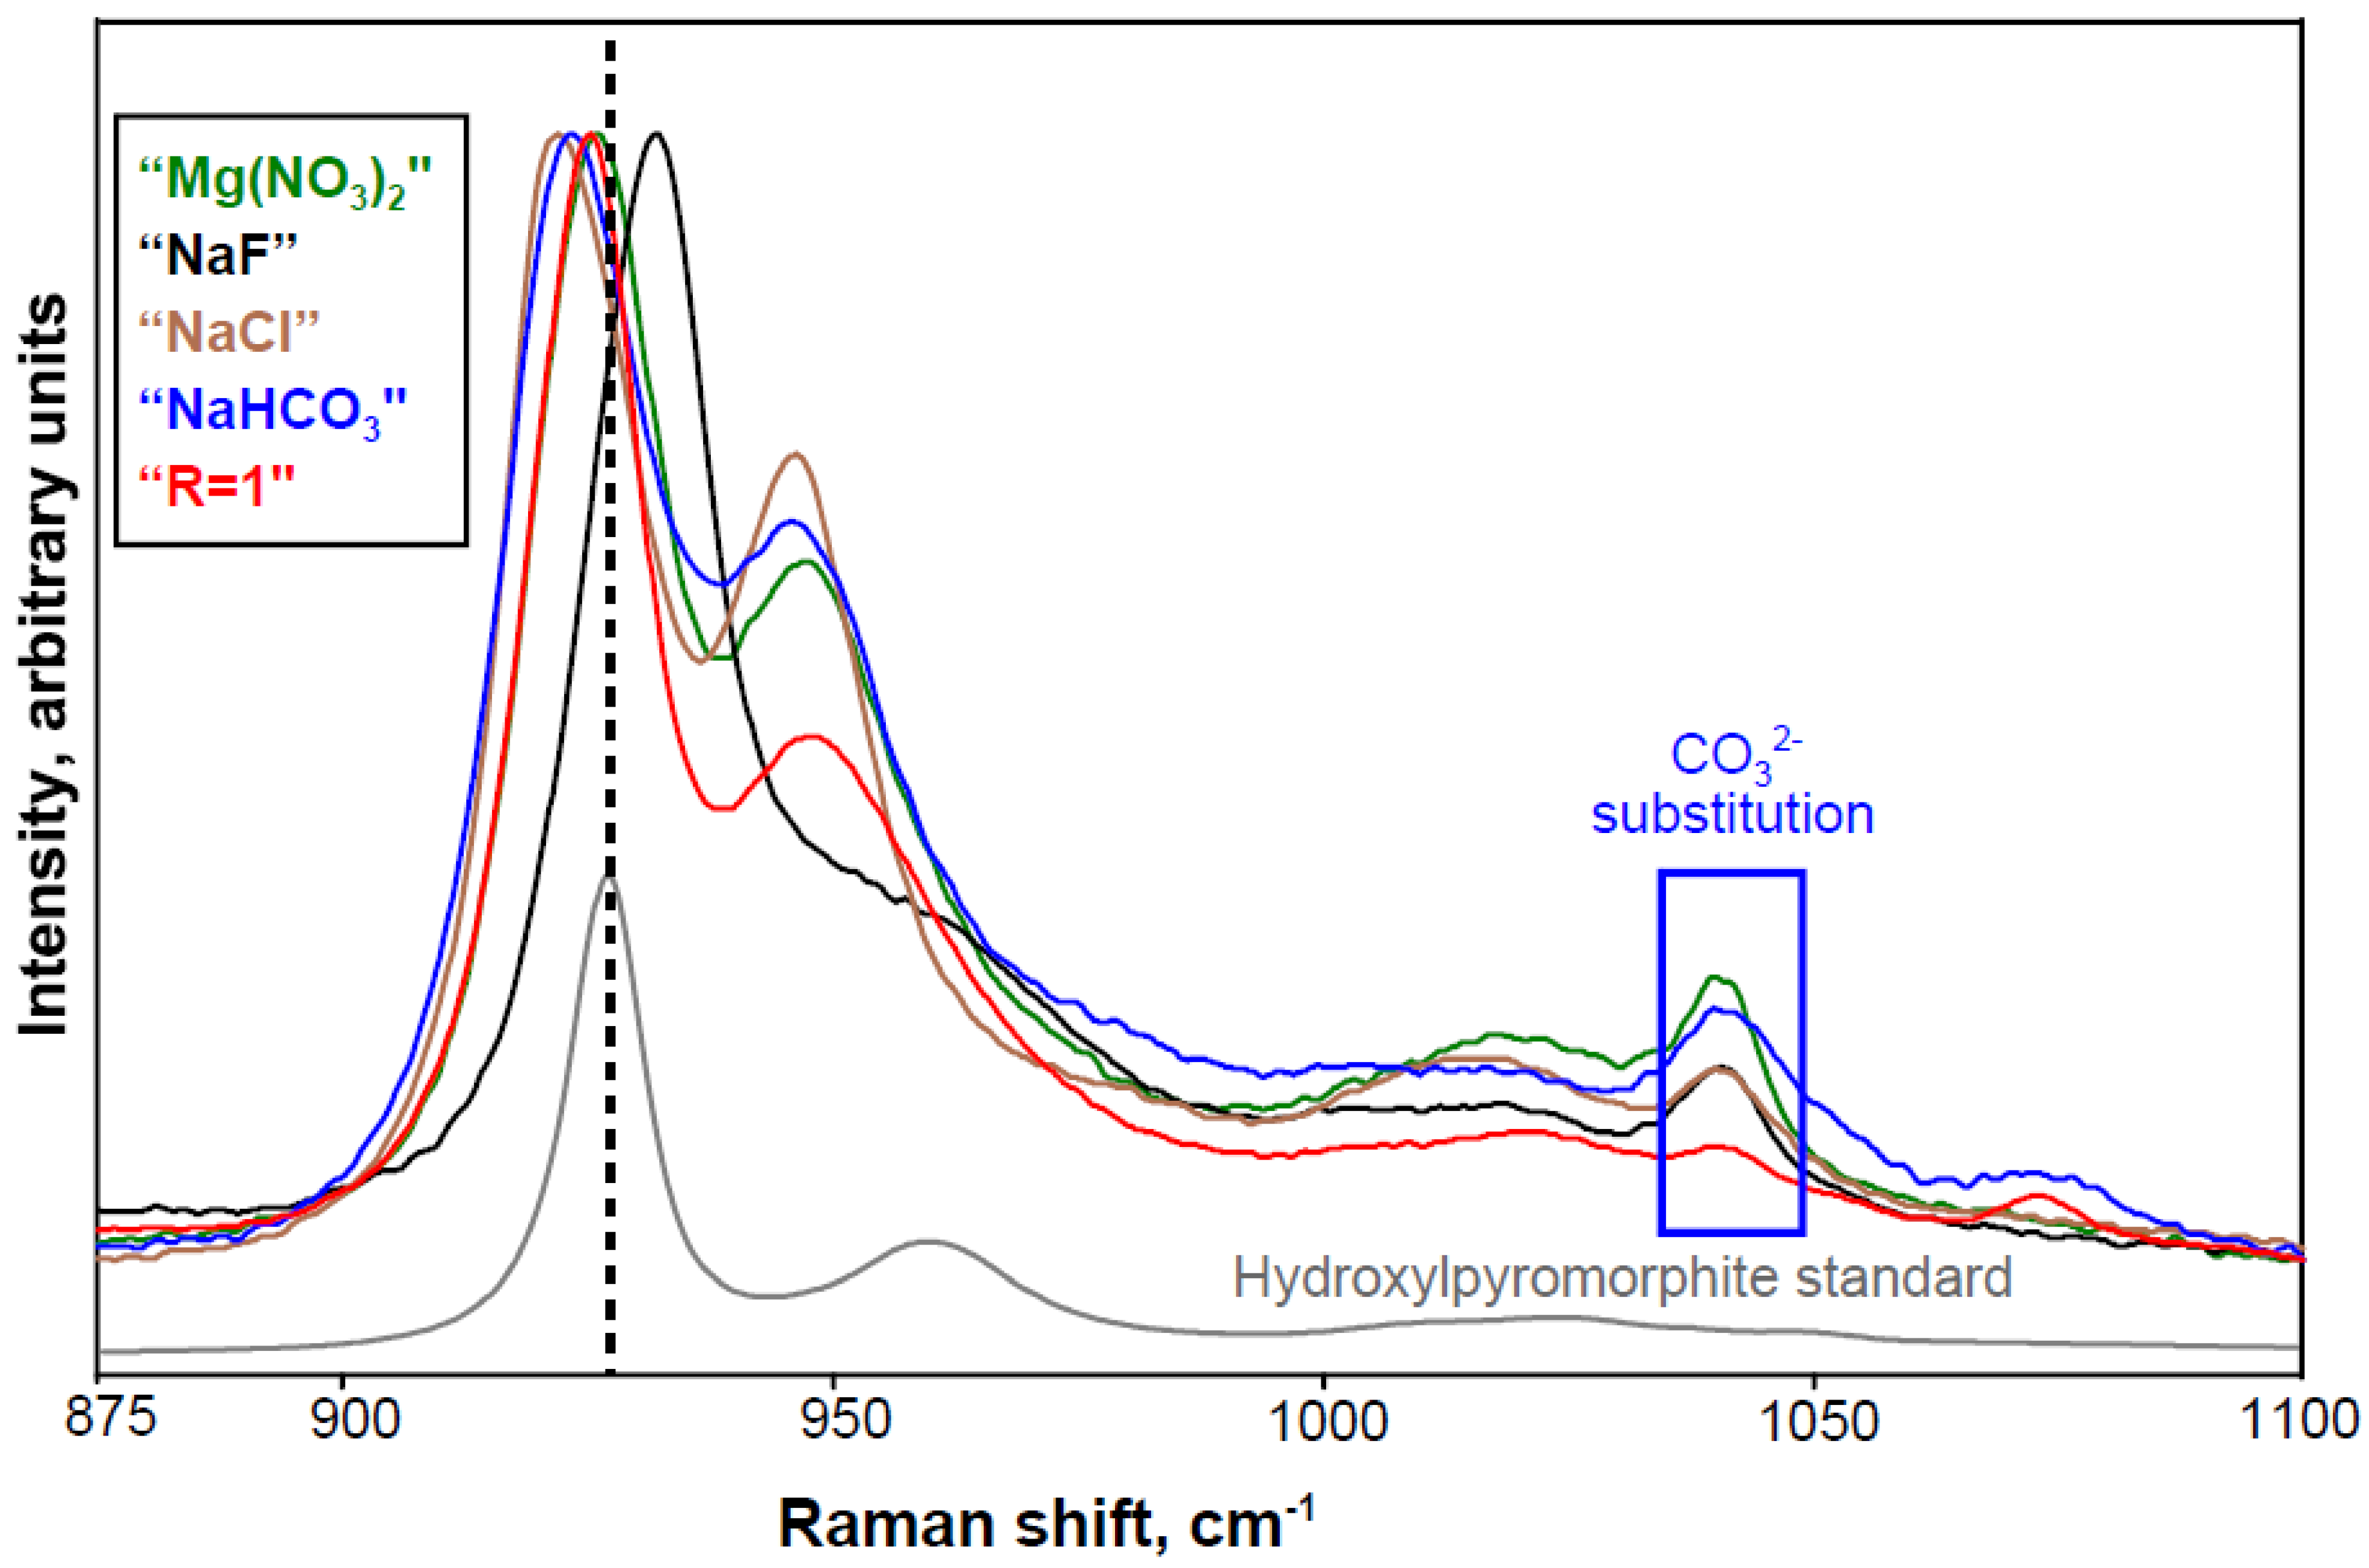
A separate synthesis study [4] provided a test for distinguishing between the adsorption (less stable sequestration) of cations onto pyromorphite particles and the structural/crystallographic incorporation (more stable sequestration) of such ions into the pyromorphite structure. RS was done on precipitates from aqueous solutions with total P/Pb molar ratios of 1 and 100 and to which the cations Ca2+, Mg2+, or Na+ (in the form of soluble fluorides, chlorides, bicarbonates, or nitrates) had been individually added. Synchrotron-based, grazing-incidence wide-angle X-ray scattering (GIWAXS) analysis could not definitively distinguish between hydroxylpyromorphite and chlorpyromorphite in the filtered precipitates of the mostly sub-micrometer to nanometer-scale particles [4]. The presence of different cations and anions, however, clearly affected the Raman spectra of individual, micrometer-scale particles of the phosphate precipitates (Figure 8), i.e., confirming solid solution (structural incorporation of ions) rather than only simple adsorption. A comparison of these spectra with those taken on synthetic pyromorphites of a wide range of known compositions [50,51] enables the interpretation of the pyromorphite precipitates with regard to anionic substitution of OH−, Cl, F, and CO32− (see Figure S3 for details). Such compositional variations affect mineral solubility [42,50,52].
Zhao et al. (2018) [4] used multiple characterization techniques on their precipitates and also did equilibrium calculations to predict the expected product phases. Both Raman (see Figure 8) and GIWAXS data identified a pyromorphite phase as the only precipitate in each synthesis experiment, although one or both of the carbonates cerussite and hydrocerussite were calculated to be supersaturated together with pyromorphite in the initial solutions (Figure S3, panel B table). All the solutions had been equilibrated with atmospheric CO2, as is true of many municipal water supplies, or contained a known concentration of introduced HCO3. RS of Zhao et al.’s (2018) [4] precipitates (Figure 8) confirms not only that pyromorphite was the only mineral detected, but also that the pyromorphite solids are spectrally distinguishable from each other and that all of them contain structurally incorporated carbonate. In this case, pyromorphites of various OH-Cl-F chemistries demonstrated the ability to accommodate within their structures some of the carbonate dissolved in the water, thereby precluding formation of a separate lead carbonate phase (cf. [25]). The differences in anion content among the pyromorphites is spectroscopically detectable (especially in the OH-region of the spectrum; see inset in Figure S3, panel A), and some cation substitution also probably accounts for the visible shifts in the ν1 peak positions (Figure 8).

3.3.2. Other Polyatomic Ions

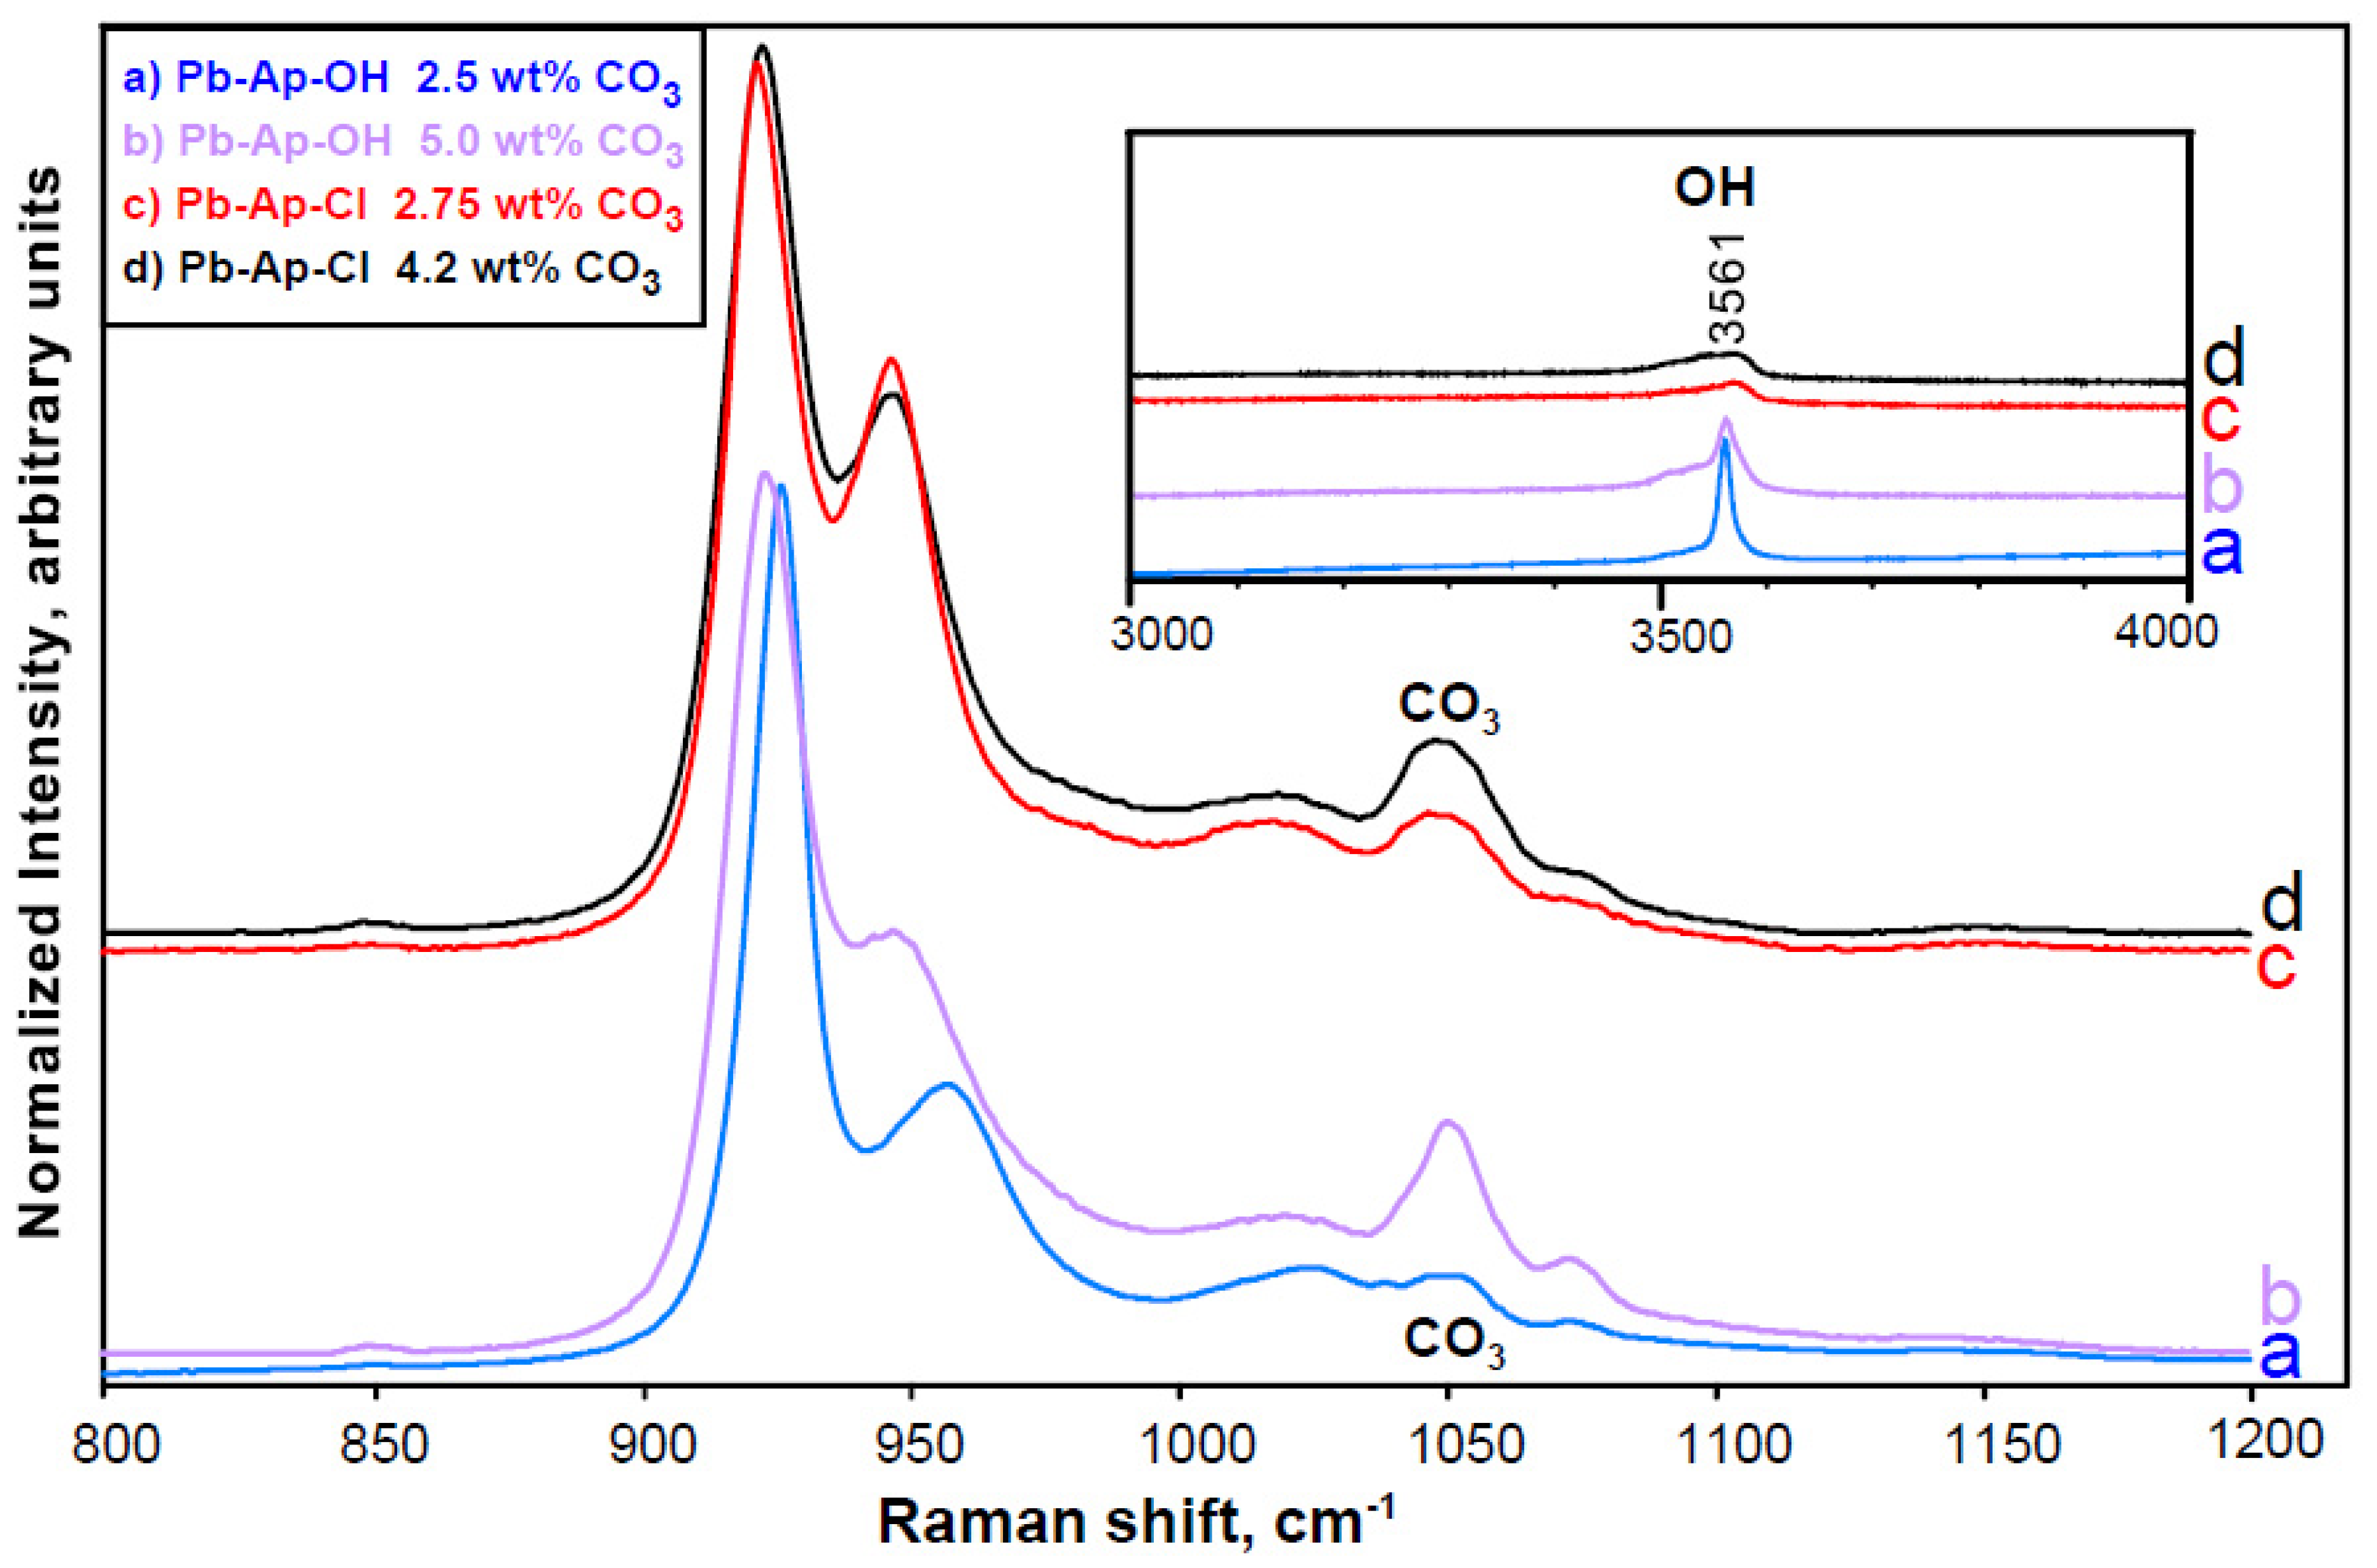
Raman spectroscopy cannot definitively identify single atoms or monatomic ions, but only demonstrate their effects on the vibrational modes of covalent bonds in the mineral, as seen in shifts in peak positions in Figure 6 and Figure 8. However, polyatomic ions exhibiting covalent bonding, such as OH and CO32−, can be identified unambiguously. This accounts for the appearance in the Raman spectra of specifically identifiable peaks for those two species (Figure 8 and Figure S3). According to comparisons with our pyromorphite standards (e.g., see Figure 9), Zhao et al.’s (2018) [4] precipitates in some cases contained as much as 3–4 wt.% CO3 in solid solution. Figure 9 also illustrates the usefulness of calibration standards, using compounds/minerals of well-known composition and structure, for purposes of interpreting more quantitatively the spectra of unknown samples (Figure S3).
Dissolved carbonate is a common component in drinking-water sources, as revealed by the high frequency of the carbonate minerals cerussite and hydrocerussite, especially in the scales of lead pipes that have not been treated with phosphate. There should be some consideration of the possible elevation in the solubility of pyromorphite scale due to carbonate incorporation. In contrast to Ca-apatite, which shows a strong increase in solubility with increasing carbonate substitution (Baig et al., 1999 [53]; Deymier et al., 2017 [54], their supplementary information), pyromorphite does not show an appreciable increase until it has several weight percent carbonate substitution [50]. The large difference in carbonate solubility effects between the Ca-apatites and Pb-apatites leaves open the question of how carbonate substitution would affect the solubility of natural phosphohedyphane-like phases, whose Pb-to-Ca ratio is quite variable [17,43,55,56,57]. There is evidence in several studies that carbonate is incorporated in or associated with phosphohedyphane-like phases in lead-pipe scale and its synthetic analogs [17,56,58], as well as geological phosphohedyphane (over 4 wt.% CO3, calculated, by Ondrejka et al., 2020 [57]).
Lead phosphate minerals can also act to remove other unwanted toxic components in geological and drinking-water environments. Both (AsO4)3− and (VO4)3− are well recognized geologically as substituents for (PO4)3− in apatite-group minerals because of the chemical, size, and shape similarities among the three [59]. Experiments indicate the ease of aqueous precipitation of V-apatite and As-apatite solids [60]. Solid solution varieties of phosphohedyphane occur geologically as well as in some LSLs [17,18,42,55,61]. As shown in Figure S4, significant amounts of (AsO4)3− can be incorporated in phosphohedyphane, and this complex ion species can be identified unambiguously by its Raman peak position [45,47,57].
Recent reports of vanadium in lead-pipe scale, especially in the inner layers [10,13,62], have caused some health concern. In at least one case [13], small amounts of the separate mineral vanadinite [Pb5(VO4)3Cl, another member of the apatite family] were identified in pipe scale. Tarr (2019) [36] documented by electron microprobe the enrichment in vanadium of some of the scales in our pipes harvested from Providence, RI. In other cases, chemical analyses of pipe scale revealed close spatial association of V and Pb ± P [10,36,62]. The RS technique can definitively identify both arsenate and vanadate substitutions in pyromorphite and phosphohedyphane minerals, as well as separate arsenate and vanadate minerals. It also distinguishes between adsorption (chemically, “close association”) and solid solution (single mineral, structurally incorporating “foreign” components). The presence of V and/or As in a drinking-water system clearly is of concern, but their structural incorporation within an insoluble phosphate host illustrates another benefit of phosphate treatment of drinking water.

3.4. Detecting More Than Meets the Eye

Using water that was synthetically formulated to emulate that of Washington, D.C., prior to 2000, mineral scales were grown by recirculating the water through new lead pipes [21]. After 15 weeks of treatment in a pipe rig, a segment of one such pipe was removed and sawed longitudinally. Reflected-light microscopy (see photo inset in Figure S5) revealed three major types of surface texture and color on the inside surface of the treated pipe: (1) dark gray with a matte finish, (2) brownish-bronze as a halo around the dark gray core, and (3) silver-colored with a very high luster similar to that of raw lead.
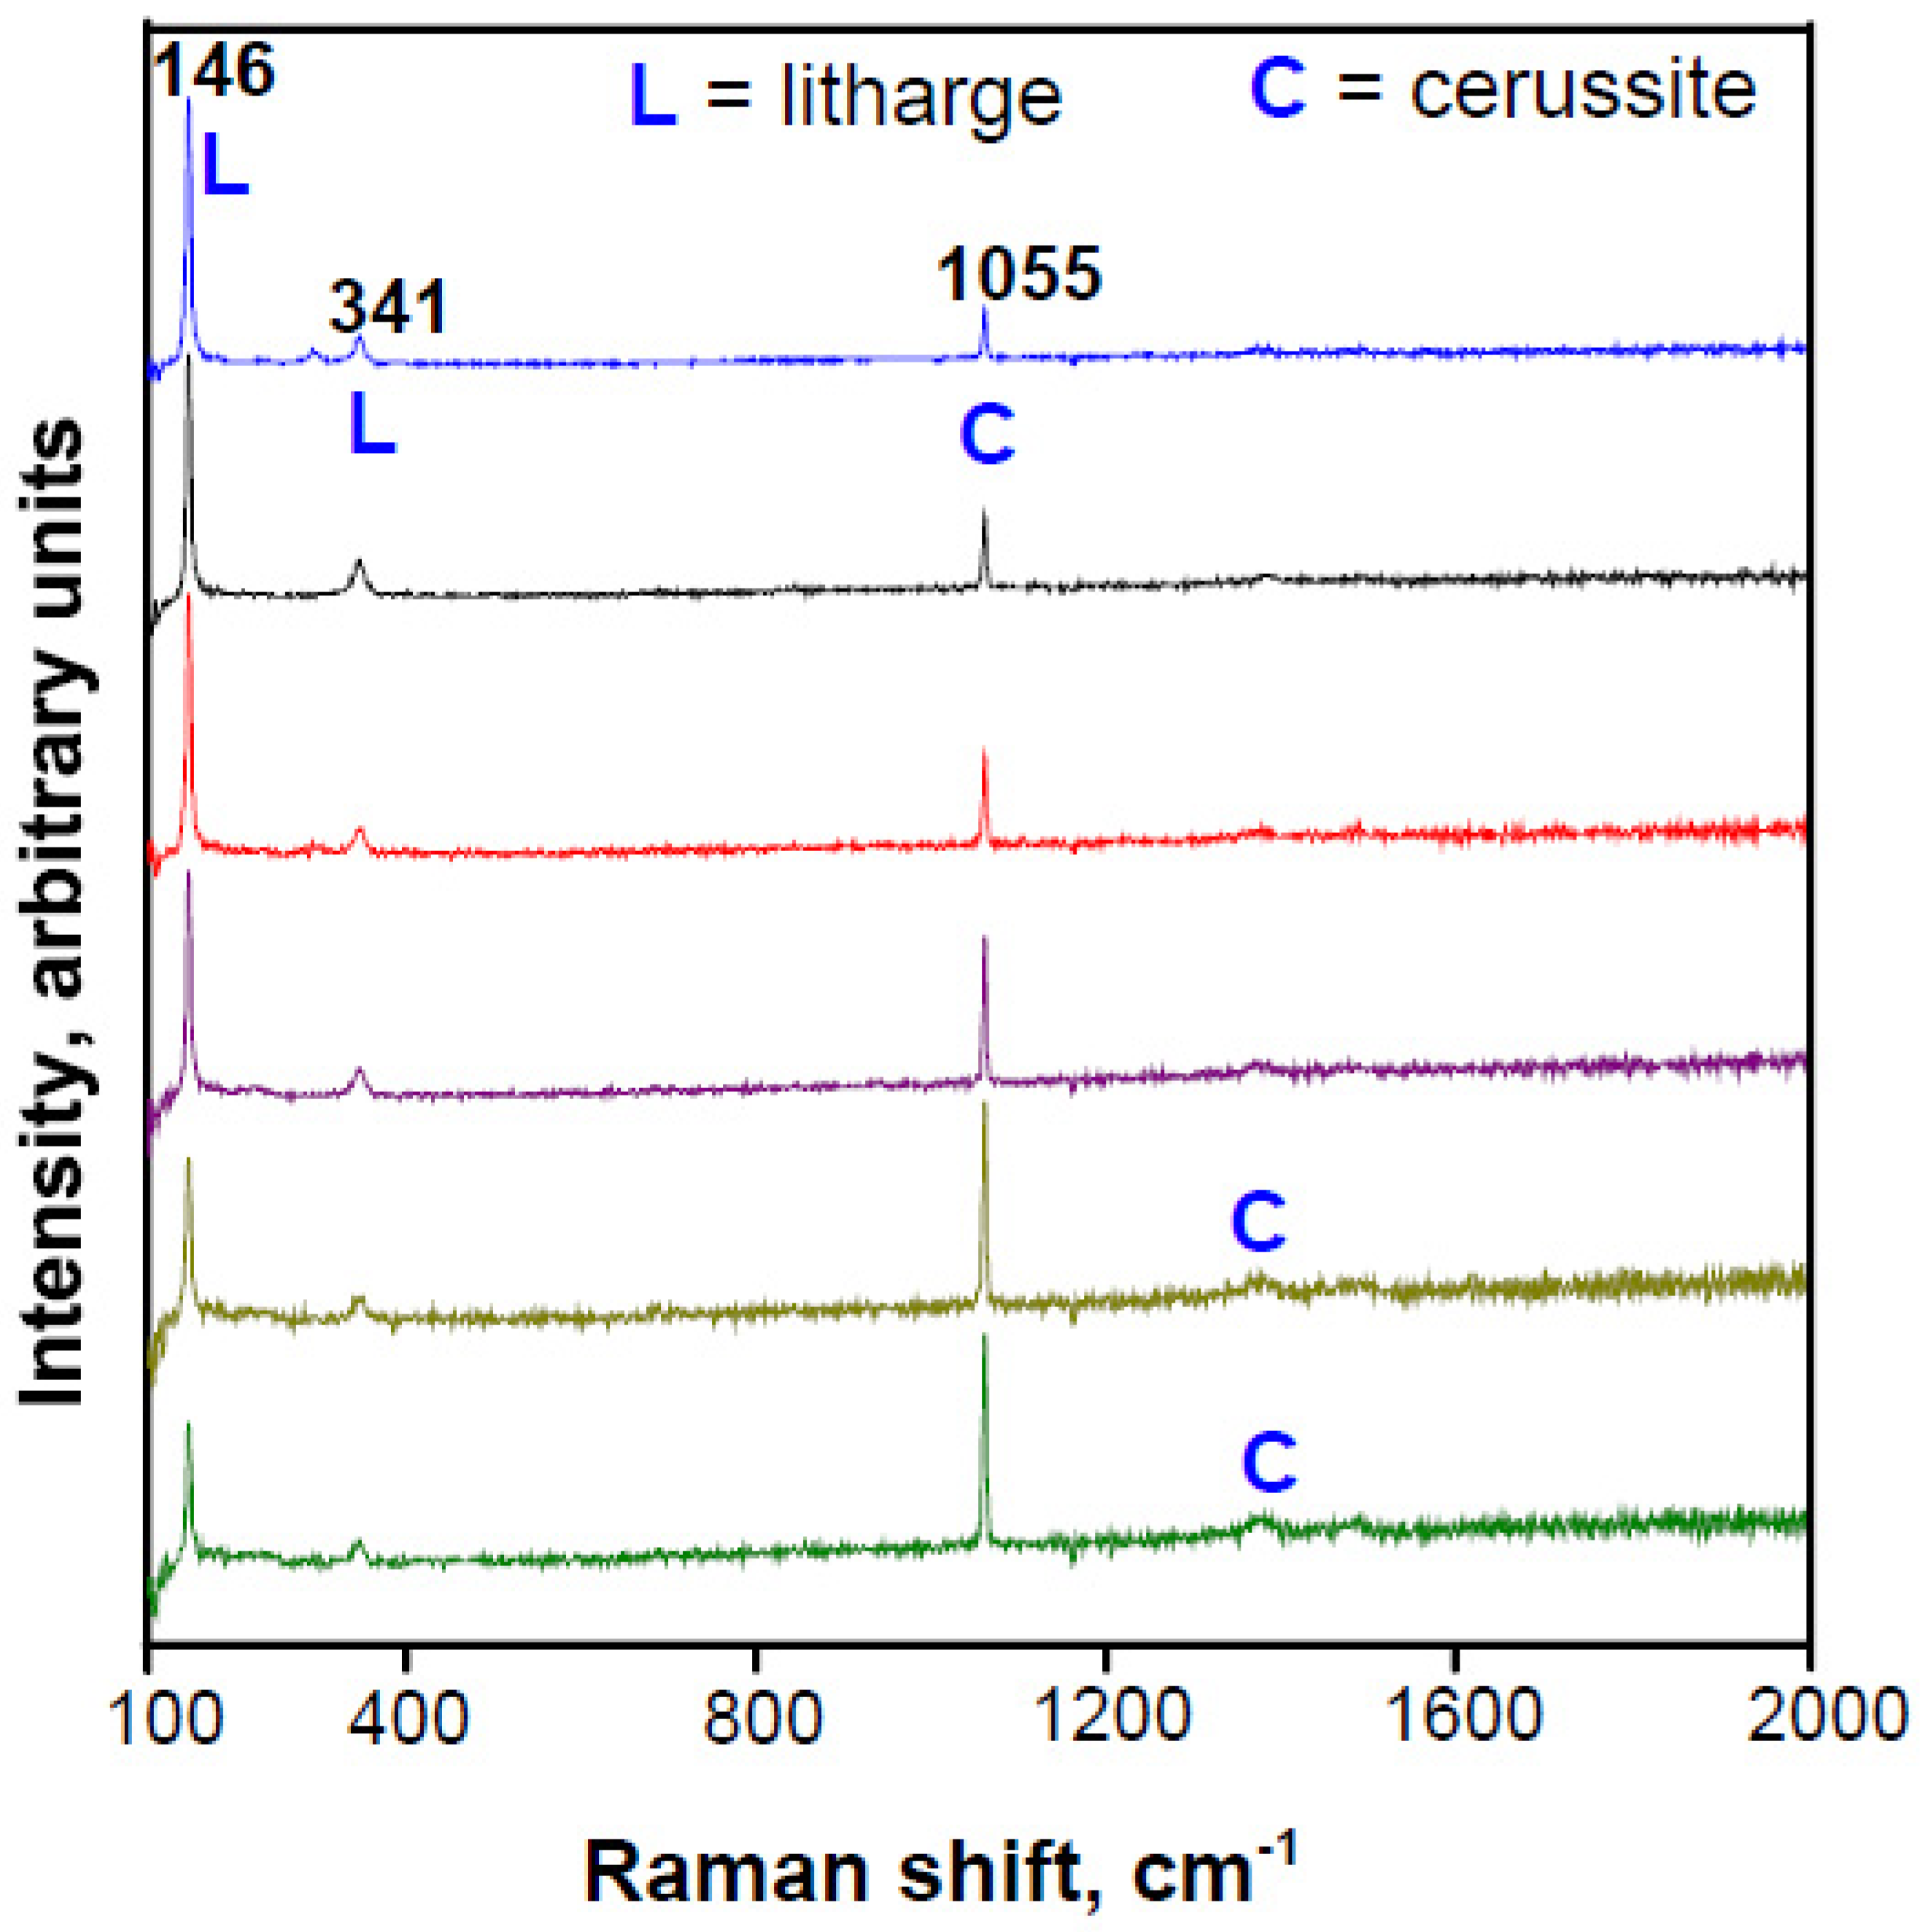
The most unexpected results came from multiple Raman analyses on the #3 high-luster, apparently uncoated lead regions. All spectra (admittedly with low signal strength) of this apparently clean lead indicate either litharge (PbO) or litharge plus cerussite (PbCO3). The six spectra with highest S:N (see Figure 10) show intensity ratios that vary from extreme spectral dominance of litharge to significant spectral dominance of cerussite. More to the point, neither the optically visible mixtures of litharge and cerussite that were spectroscopically identified in areas #1 and #2 (Figure S5) nor the optically invisible scale layer in area #3 were detected by SEM-EDS analyses on polished cross-sections of this same pipe. Both the nature of Raman analysis and the fact that it could be applied directly to the unprepared surface of the pipe permitted detection of the earliest scale phases formed and their spatial distribution on the optically splotchy inner surface of the pipe (see Figure S5, photo inset; Figure S6 for comparison).

3.5. Assessing the Most Recent Precipitate; Dealing with Amorphous Material

In a harvested LSL, determination of the mineral precipitating immediately before pipe retrieval would contribute to an understanding of the scale currently precipitating in the contiguous neighborhood. Analogously, in an experiment to produce and study lead-pipe scales approaching water–solid equilibrium, it is essential to document the timing, identity, and specific composition of the precipitates. For most analytical techniques, it could be difficult to acquire definitive analyses on the couple-micrometer-thick final precipitate before pipe removal. Sawing of a longitudinal pipe section, however, enables a top-down analysis of the undisturbed, last-deposited minerals by Raman microprobe spectroscopy. Information on the raw pipe surface is particularly important in that the uppermost surface of the scale is not only in constant contact with the water (helping buffer its lead concentration), but also the most vulnerable to the release of dissolved and particulate lead.
In situ analysis also permits RS identification of materials that are regarded as amorphous, as well as semi-quantitative characterization of differences in their degree of crystallinity. The lower the degree of crystallinity of the solid, the less well-resolved the spectral peaks are with respect to each other and the broader they are individually. Figure 2 shows a spectrum of scrutinyite (PbO2) that has a very low degree of crystallinity, perhaps a candidate for classification as amorphous. In this example, the Raman spectrum still provides unambiguous identification of scrutinyite, whose low spectral resolution stands in contrast to that of the synthetic commercial plattnerite.
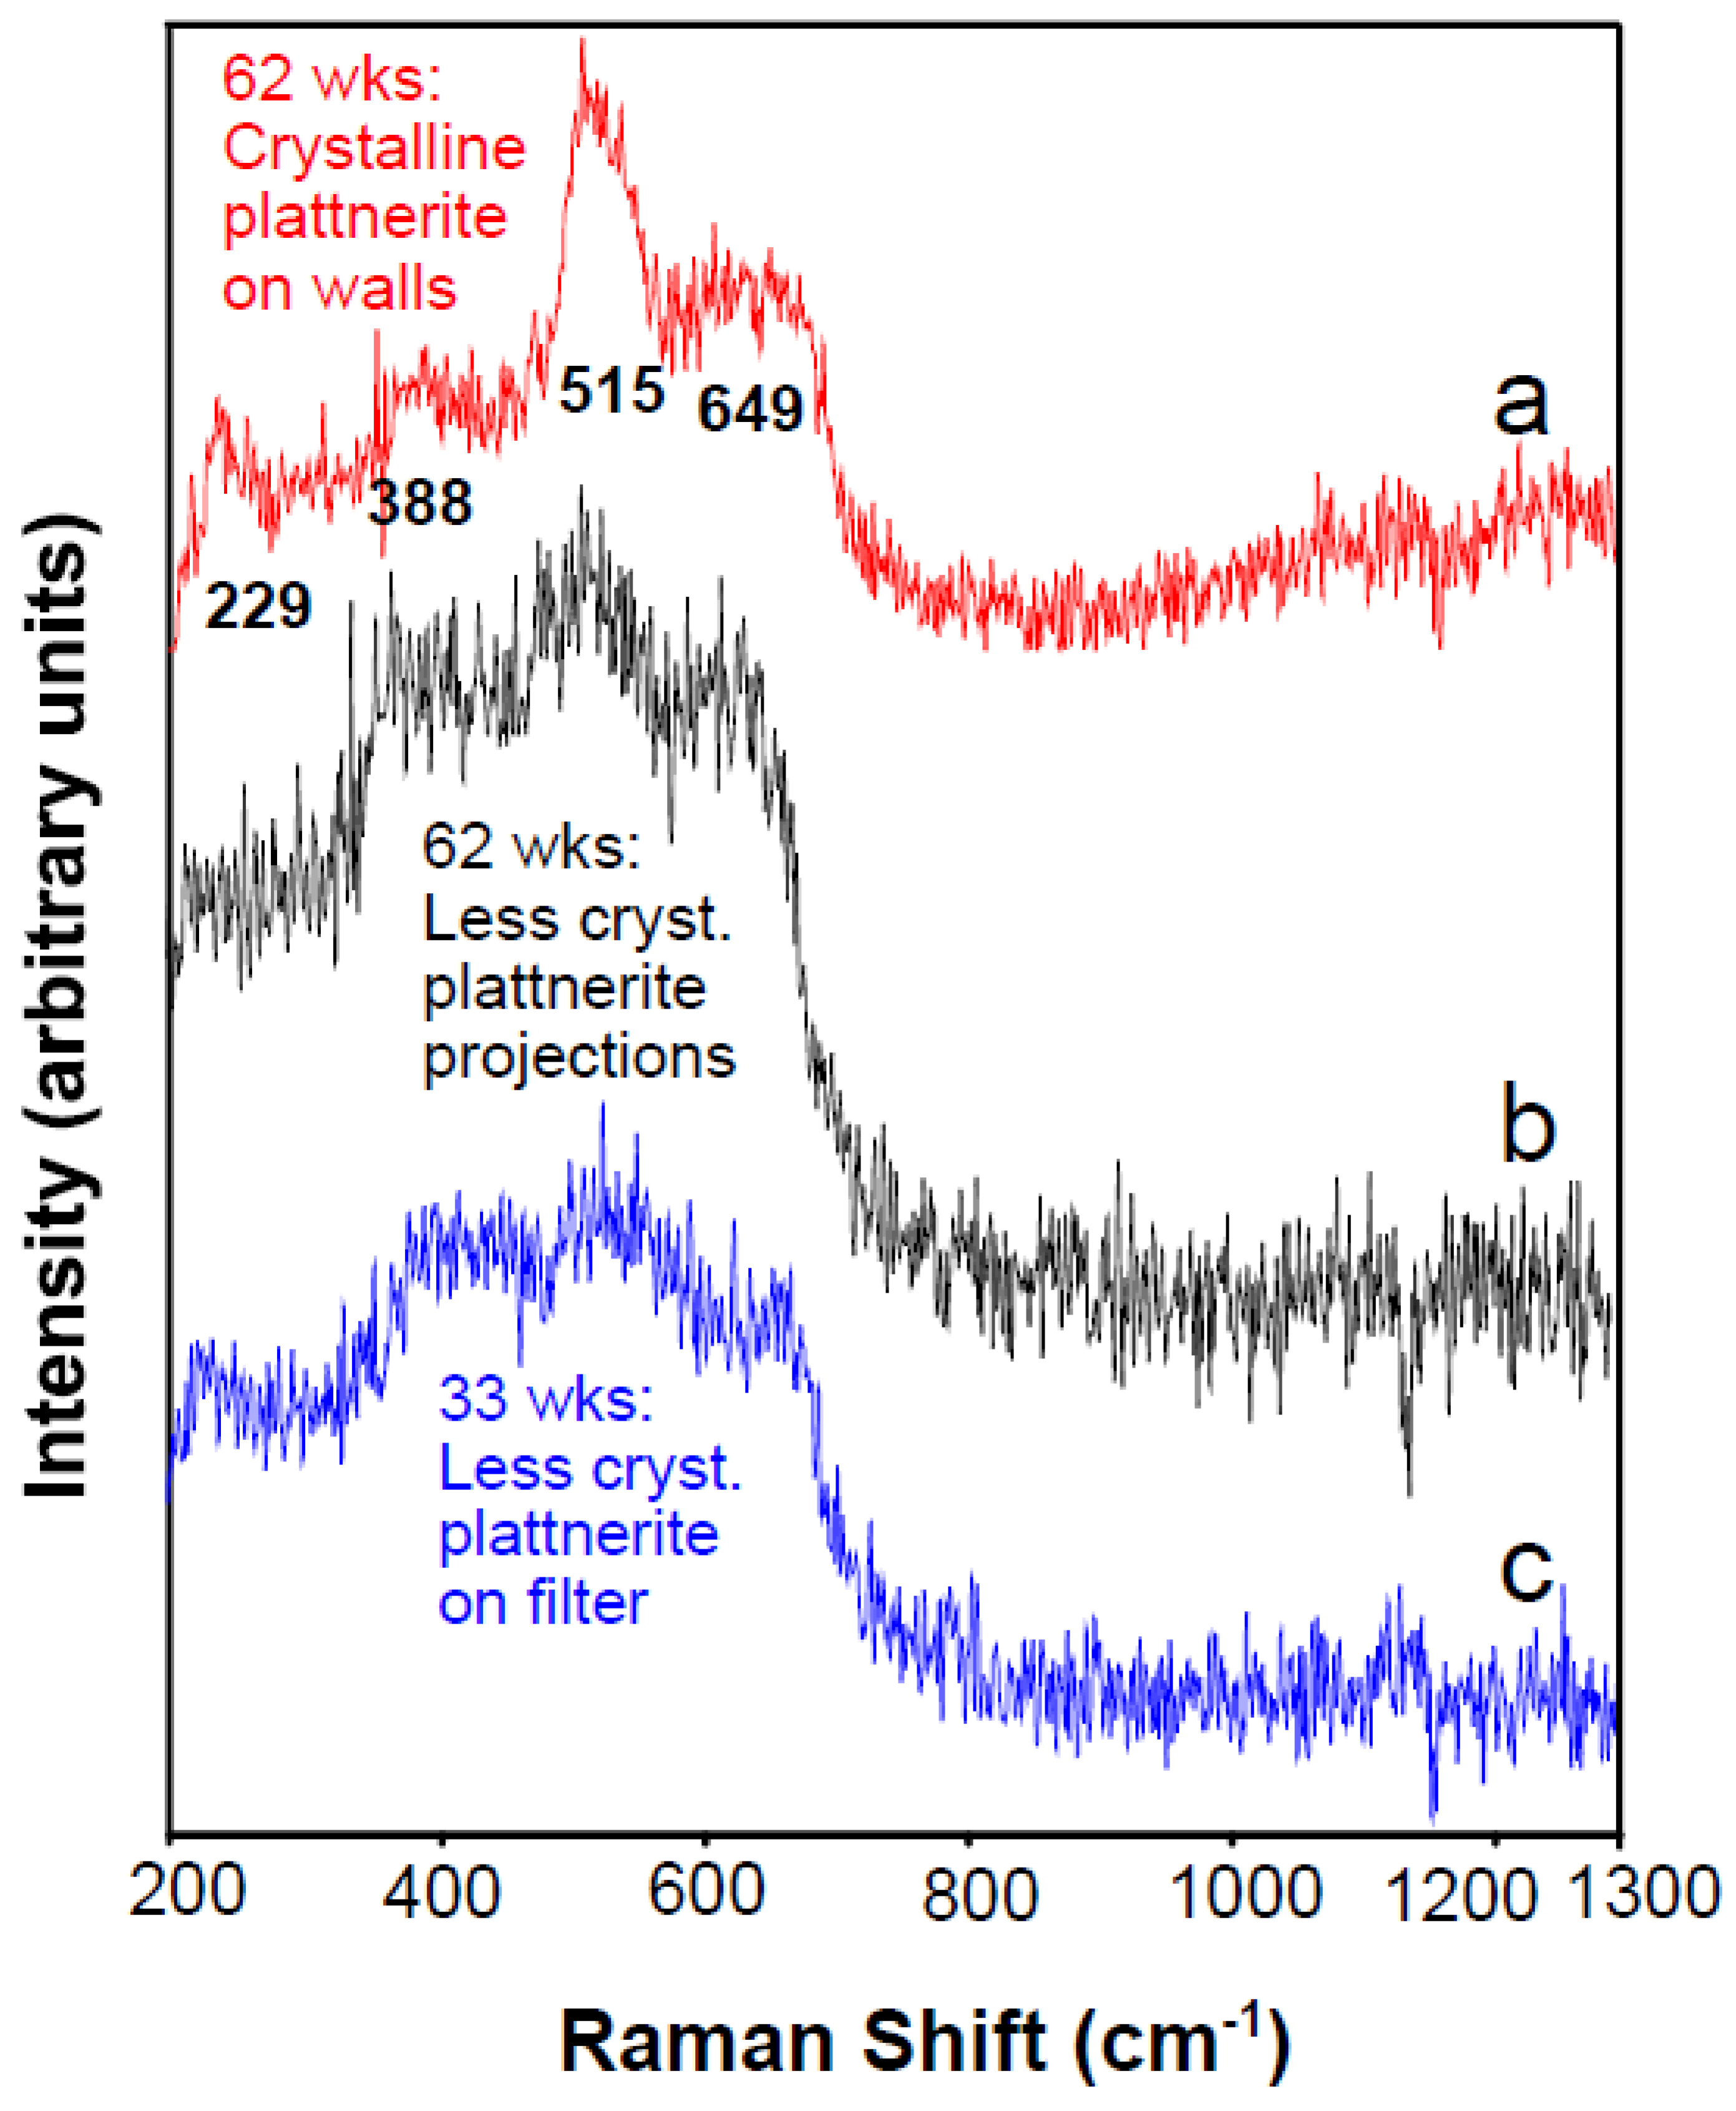
Raman spectra can also reveal variations in crystallinity of the same scale mineral. As seen in Figure 11, fine-grained plattnerite on the walls of lead pipes after 62 weeks of conditioning with Washington, D.C.-synthetic water [21] shows a moderate degree of crystallinity, with definable and reproducible peaks (spectrum a). Still recognizable as plattnerite, but showing less well-defined peaks, is the spectrum of sub-millimeter particles captured on filters in the same lead pipes after only 33 weeks of conditioning (Figure 11, spectrum c). The latter material clearly is less well crystalline than that in spectrum (a). In fact, the 33-week filtered particles (c) have a spectrum almost identical to that of the most recently precipitated scale in the 62-week pipe (Figure 11, spectrum b), i.e., fragile material that resides on thin projections protruding from the plattnerite layer on the pipe wall. The fact that type (b) material directly overlies type (a) suggests that the spectra have captured plattnerite in the process of maturation from recent precipitate (b) into a more ordered, more stable crystalline solid (a) as it grows outward from the pipe wall over time.
There is repeated recognition in the literature [3,11,63] of a large component of retrieved scale material that is called amorphous, which typically means undefinable by XRD. Both the chemical composition (in many cases rich in Al, Si, and P, in addition to Pb, which may be minor) and the degree/lack of crystallinity of such material are important to its physical and chemical stability and, therefore, important to define. As illustrated above, RS can aid in specifying both of those factors in lead-bearing as well as lead-free solids. There is a wide range in the degree of atomic ordering between fully crystalline and X-ray amorphous forms of a solid phase, and specification within that range is attainable by Raman spectroscopy (well exemplified in carbonaceous material: e.g., [64,65]; see Figure S7). When chemically identical solids exist in both atomically more ordered and less ordered/amorphous forms, the amorphous one is always more soluble than the well-crystalline one [3,66]. Recognition of differences in crystallinity among mineral scales of identical composition, therefore, is important to the assessment of expected lead concentrations in the water. Optical microscope observation of the examples in Figure 11 also suggest that the less crystalline form of a given phase may be more fragile and, thus, more susceptible not only to chemical dissolution but also to mechanical removal from the pipe wall than its more crystalline analog.

4. Conclusions and Future Raman Application to Lead-Pipe Scales

4.1. Conclusions

Raman microprobe spectroscopy is one of several analytical techniques that can yield important compound-specific information about the scales in lead pipes. The above examples illustrate how this non-destructive, micrometer-scale probe can be used in conjunction with different techniques that provide bulk-scale information and better quantification of amounts of phases, such as XRD powder diffraction and ICP-MS chemical analysis of dissolved scales. Due to its basis in an optical scattering phenomenon, RS is limited in its ability to quantify relative amounts of solid phases, but it does provide unambiguous identification (and typically additional characterization) of even microscopic samples. The spatial selectivity of RS is comparable to that of standard SEM-EDS or electron-probe microanalysis, but RS does not require the intensity of sample preparation (e.g., sawing, polishing, carbon-coating, operation in a vacuum) of those chemical techniques. It also does not provide the chemical specificity and compositional accuracy of those two.
The specific analytical niche of RS is its ability to operate on untreated surfaces, provide combined chemical–structural characterization of phases in a matter of minutes or less, and leave the sample (usually) undamaged and ready for subsequent analyses. Because of the sensitivity of the Raman spectrum to structural and/or chemical variations in a mineral, RS also acts well as a preview tool to pinpoint which regions of a sample should be subjected to additional analytical techniques. Raman spectra on polished cross-sections of a pipe can be compared with SEM-EDS and electron microprobe analyses performed at similar spatial scales on the same sections, bringing visualization together with structural and compositional information on the scale minerals.
Multiple Raman databases of natural minerals and other compounds are available on the Web. The one most cited by mineralogists is the RRUFF database (https://rruff.info/about/about_general.php (accessed on 26 September 2021)). This provides Raman, IR, and XRD spectra/patterns to be viewed online and also available in over 14,000 high-resolution files that can be downloaded at no cost. The database can be searched by mineral name as well as by major elements. The identities of many of the mineral samples whose Raman spectra are shown in RRUFF are confirmed by accompanying XRD patterns and electron microprobe chemical analyses [67].

4.2. Moving Forward with Raman Spectroscopy on Lead Issues

This article has been limited to the application of the Raman microprobe to point-based analyses, but uncoated polished sections such as lead pipe cross-sections offer the possibility of Raman mapping. Maps can be constructed on the basis of phase identity and/or selected characteristics (e.g., degree of crystallinity, solid solution, physical intergrowth) within individual grains while displaying them in their spatial context [31,68,69]. The confocal nature of many modern Raman systems even permits a form of depth-controlled, non-destructive microtomography under appropriate optical conditions (e.g., Schiavi et al.’s (2020) [68] multi-mineral inclusions).
Despite the absence of large numbers of previous Raman studies concerning lead-pipe scales, there are many published applications of RS in studies of analogous materials and situations, whose procedures could act as templates for further Raman applications to lead pipes. (1) Metal corrosion: RS frequently has been used to detect corrosion of pipes constructed of various other metals [32,70] and of an ancient Chinese bronze artifact [71]. Sandvig et al.’s (2008) monograph [72] highlights the need to address corrosion issues in not just lead pipe, but also in the accompanying plumbing fixtures, including solder, fittings, and faucet components. Copper and its alloys are among the metal components. Leban et al.’s (2017) [70] ex situ analyses on corrosion products of steel pipes demonstrates the capability of the Raman microprobe to identify and characterize individual minerals on raw cross-sections of compositionally zoned scale deposits. Iron- and iron-manganese oxide phases, commonly found in the scales of lead and other metal pipes, typically have a low degree of crystallinity or are X-ray amorphous. Reference to the RRUFF database and other published articles permits their Raman identification [23]. (2) Fine-grained, dispersed lead minerals: Lanfranco et al. (2003) [73] compared the applicability of RS vs. XRD in the identification and characterization of mixed-metal (including lead) phosphate phases in soils using careful experimental design and providing excellent documentation. RS came out the winner in this study. There is also considerable Raman work on the types of fine-grained mineral particles that were used as pigments in paintings that are centuries old. (3) Field-deployable Raman systems: Both portable Raman systems (for in situ analysis) and laboratory instruments (operating on minute retrieved samples) have been employed successfully to identify pigment minerals, which include several lead carbonate and lead oxide phases as well as iron oxides [39,74,75]. Gazquez et al. (2017) [30] used portable Raman systems to identify minerals in situ in several cultural and geological heritage sites, including the pigment minerals in the famous Paleolithic rock-wall art in the Altamira Cave in north-central Spain. (4) Lead batteries: The sensitivity of RS to a wide range of lead-bearing compounds has been explored in the RS identification and Raman mapping of intermediate lead compounds formed during repeated charge-cycling in lead-acid batteries [76].
The spectroscopic recognition and quantification of minor changes in mineral chemistry (through shifts in peak position) are of importance in gaining more information from Raman spectra. Samples of known atomic ratios of the elements in question could be synthesized in order to use them as Raman calibration standards (e.g., Sternlieb et al. (2010) [50] on the carbonate concentration in pyromorphite; Breitenfeld et al. (2018) [77] on the Fe/(Fe + Mg) ratio in the olivine silicate mineral group). Analogous structural standards, using TEM and XRD for independent analysis, could be developed to define the degree of crystallinity of a particular phase, such as litharge (as done for the degree of crystallinity of carbonaceous materials, e.g., [64,78]; see Figure S7).
The issue of organic compounds, including natural organic matter that typically occurs in municipal water systems, was not discussed above. Many organic compounds have readily identifiable Raman spectra, which could be used to interpret analyses of natural pipe scales. For instance, the Raman spectra of humic acid and fulvic acid [79], frequently used as stand-ins for organic matter in experimental systems [4,20], are distinctive. Even some of the synthetic materials used as examples in the present paper exhibited small amounts of organic contamination, recognized most readily by C-H vibrational bands in the spectral region around 2800–3100 cm−1.
Laser irradiation of natural samples often induces luminescence [36], especially if excitation wavelengths in the blue and green region are used (see SI Section S7), and such luminescence in many cases is attributable to organic compounds. On the one hand, luminescence of a mineral can interfere with detection of its (much weaker) Raman signal, but on the other, luminescence can also act as a sensitive detector of the presence of organic molecules (Fritsch et al.’s 2012 [28] Section S5). Most of the spectra included in this article and its Supplementary Information were not baseline corrected to remove accompanying luminescence/fluorescence signatures, although such removal is typical in published articles. The fluorescence signatures of natural scale samples could be explored to gain more information about how the chemistry of the water supply changed over time and might have affected the development and stabilization of the lead-pipe scales.
Raman spectroscopy has much more to offer to the study of lead-pipe scales. Development of synthetic samples for spectral calibration of chemical variations would be straightforward and immediately useful to implement. Other existing Raman technologies could be applied with almost certain benefit, e.g., (1) Raman mapping using lab-based systems and (2) deployment of hand-held/mobile RS units in the field, especially ones using fiber-optically connected probe heads that could monitor pipe samples and changes in them in situ. Our group already has published proof-of-concept applications for the latter, which demonstrate Raman monitoring of the real-time development of Ca and Pb phosphate minerals while in solution [33,34]. Further useful enhancements in RS technology are on the way, as the technique is increasingly applied commercially and even on Mars rovers [29,35].
Raman spectroscopy can be not only an excellent “silent partner” in the multi-technique characterization of Pb-pipe scales. In many cases, it can take the lead in identifying the scale compounds at high spatial resolution and in the first recognition of a new scale layer. The development of appropriate calibration standards can greatly enhance the level of quantification of RS analyses. This is an excellent tool to help keep the lead out of drinking water.

Supplementary Materials

The following are available online at https://www.mdpi.com/article/10.3390/min11101047/s1, Section S1: Supplementary figures and captions, Figure S1: Comparison among Raman peak positions in Ca-, Pb-, and Ca-Pb-phosphates, Figure S2: Raman spectra of carbonated fluorapatites, Figure S3: Raman spectra of carbonated Pb phosphates with cation substitutions, Figure S4: Raman spectra of geological phosphohedyphane phases, Figure S5: Raman spectra of litharge and cerussite in synthetically treated lead pipes, Figure S6: Raman spectra of litharge and hydrocerussite on a weathered lead ingot, Figure S7: Raman spectra of a wide range of geological carbonaceous materials; Section S2: Sample information, file information, and spectral acquisition parameters keyed to all figures; Section S3: Brief introduction to Raman spectroscopy; Section S4: Instrumental details of the Raman microprobe system used in this study; Section S5: Accuracy and reproducibility in Raman spectroscopic analyses; Section S6: Precipitation experiments with Ca: Pb molar ratio of 20; Section S7: Luminescence encountered during Raman spectroscopic analysis.

Author Contributions

Writing—original draft preparation: J.D.P.; conceptualization: J.D.P., Y.B., D.E.G.; sample analysis: J.D.P., S.N.D., Y.B.; sample preparation: Y.B., C.H.Y., J.Z.; discussion: all authors; writing—review, editing: all authors. All authors have read and agreed to the published version of the manuscript.

Funding

Giammar, Bae, Pasteris, and Dybing collected data presented in this manuscript in research supported by the National Science Foundation (CBET-1603717) and the Water Research Foundation (Project 4686). Zhao acknowledges funding from the National Science Foundation (NSF awards #1604042 and #1603717) for collection of data presented here.

Data Availability Statement

All the data presented in this study are provided in the manuscript and Supplementary Information.

Acknowledgments

Anthony Kampf and Lyle Gordon are thanked for providing samples used as standards. Jeremy Pomerantz, Jake Tarr, and Chong Dai provided and/or analyzed samples in a related study. Weiyi Pan and Chao Pan synthesized lead compounds analyzed for two of the figures, as noted. Comments by Greg Ledingham and John Freeman on parts of an earlier version of the manuscript are appreciated. The authors also thank three anonymous reviewers for their comments.

Conflicts of Interest

The authors declare no conflict of interest.

References

  1. Rabin, R. The lead industry and lead water pipes: “A modest campaign”. Am. J. Public Health 2008, 98, 1584–1592. [Google Scholar] [CrossRef] [PubMed]
  2. Schock, M.R. Understanding corrosion control strategies for lead. J. AWWA 1989, 81, 88–100. [Google Scholar] [CrossRef]
  3. Santucci, R.J.; Scully, J.R. The pervasive threat of lead (Pb) in drinking water: Unmasking and pursuing scientific factors that govern lead release. Proc. Natl. Acad. Sci. USA 2020, 117, 23211–23218. [Google Scholar] [CrossRef]
  4. Zhao, J.; Giammar, D.E.; Pasteris, J.D.; Dai, C.; Bae, Y.; Hu, Y. Formation and aggregation of lead phosphate particles: Implications for lead immobilization in water supply systems. Environ. Sci. Technol. 2018, 52, 12612–12623. [Google Scholar] [CrossRef] [PubMed]
  5. Renner, R. Plumbing the depths of D.C.’s drinking water crisis. Environ. Sci. Technol. 2004, 38, 224A–227A. [Google Scholar] [CrossRef] [PubMed] [Green Version]
  6. Olson, T.M.; Wax, M.; Yonts, J.; Heidecorn, K.; Haig, S.-J.; Yeoman, D.; Hayes, Z.; Raskin, L.; Ellis, B.R. Forensic estimates of lead release from lead service lines during the water crisis in Flint, Michigan. Environ. Sci. Technol. Lett. 2017, 4, 356–361. [Google Scholar] [CrossRef]
  7. Pieper, K.J.; Tang, M.; Edwards, M.A. Flint water crisis caused by interrupted corrosion control: Investigating “ground zero” home. Environ. Sci. Technol. 2017, 51, 2007–2014. [Google Scholar] [CrossRef]
  8. Pieper, K.J.; Martin, R.; Tang, M.; Walters, L.A.; Parks, J.; Roy, S.; Devine, C.; Edwards, M.A. Evaluating water lead levels during the Flint water crisis. Environ. Sci. Technol. 2018, 52, 8124–8132. [Google Scholar] [CrossRef]
  9. Lytle, D.A.; Schock, M.R.; Formal, C.; Bennett-Stamper, C.; Harmon, S.; Nadagouda, M.N.; Williams, D.; DeSantis, M.K.; Tully, J.; Pham, M. Lead particle size fractionation and identification in Newark, New Jersey’s drinking water. Environ. Sci. Technol. 2020, 54, 13672–13679. [Google Scholar] [CrossRef]
  10. Nadagouda, M.N.; White, C.; Lytle, D. Lead pipe scale analysis using broad-beam argon ion milling to elucidate drinking water corrosion. Microsc. Microanal. 2011, 17, 284–291. [Google Scholar] [CrossRef]
  11. Tully, J.; DeSantis, M.K.; Schock, M.R. Water quality--pipe deposit relationships in Midwestern lead pipes. AWWA Water Sci. 2019, 2019, e1127. [Google Scholar] [CrossRef]
  12. DeSantis, M.K.; Schock, M.R.; Tully, J.; Bennett-Stamper, C. Orthophosphate interactions with destabilized PbO2 scales. Environ. Sci. Technol. 2020, 54, 14302–14311. [Google Scholar] [CrossRef] [PubMed]
  13. Gerke, T.L.; Scheckel, K.G.; Schock, M.R. Identification and distribution of vanadinite (Pb5(V5+O4)3Cl) in lead pipe corrosion by-products. Environ. Sci. Technol. 2009, 43, 4412–4418. [Google Scholar] [CrossRef] [PubMed]
  14. Avasarala, S.; Orta, J.; Schaefer, M.; Abernathy, M.; Ying, S.; Liu, H. Effects of residual disinfectants on the redox speciation of lead(II)/(IV) minerals in drinking water distribution systems. Environ. Sci. Water Res. 2021, 7, 357–366. [Google Scholar] [CrossRef] [PubMed]
  15. Peters, N.J.; Davidson, C.M.; Britton, A.; Robertson, S.J. The nature of corrosion products in lead pipes used to supply drinking water to the city of Glasgow, Scotland, UK. Fresen. J. Anal. Chem. 1999, 363, 562–565. [Google Scholar] [CrossRef]
  16. Kim, E.J.; Herrera, J.E. Characteristics of lead corrosion scales formed during drinking water distribution and their potential influence on the release of lead and other contaminants. Environ. Sci. Technol. 2010, 44, 6054–6061. [Google Scholar] [CrossRef]
  17. Hopwood, J.D.; Derrick, G.R.; Brown, D.R.; Newman, C.D.; Haley, J.; Kershaw, R.; Collinge, M. The identification and synthesis of lead apatite minerals formed in lead water pipes. J. Chem. 2016, 2016, 9074062. [Google Scholar] [CrossRef] [Green Version]
  18. Grimes, S.M.; Johnston, S.R.; Batchelder, D.N. Lead carbonate-phosphate system: Solid-dilute solution exchange reactions in aqueous systems. Analyst 1995, 120, 2741–2746. [Google Scholar] [CrossRef]
  19. Guo, D.; Robinson, C.; Herrera, J.E. Mechanism of dissolution of minium (Pb3O4) in water under depleting chlorine conditions. Corros. Sci. 2016, 103, 42–49. [Google Scholar] [CrossRef]
  20. Dai, C.; Zhao, J.; Giammar, D.E.; Pasteris, J.D.; Zuo, X.; Hu, Y. Heterogeneous lead phosphate nucleation at organic-water interfaces: Implications for lead immobilization. ACS Earth Space Chem. 2018, 2, 869–877. [Google Scholar] [CrossRef]
  21. Bae, Y.; Pasteris, J.D.; Giammar, D.E. The ability of phosphate to prevent lead release from pipe scale when switching from free chlorine to monochloramine. Environ. Sci. Technol. 2020, 54, 879–888. [Google Scholar] [CrossRef] [PubMed]
  22. Bae, Y.; Pasteris, J.D.; Giammar, D.E. Impact of orthophosphate on lead release from pipe scale in high pH, low alkalinity water. Water Res. 2020, 177, 115764. [Google Scholar] [CrossRef] [PubMed]
  23. Bae, Y.; Pasteris, J.D.; Giammar, D.E. Impact of iron-rich scale in service lines on lead release to water. AWWA Water Sci. 2020, 2020, e1188. [Google Scholar] [CrossRef]
  24. Wang, Y.; Xie, Y.; Li, W.; Wang, Z.; Giammar, D.E. Formation of lead (IV) oxides from lead (II) compounds. Environ. Sci. Technol. 2010, 44, 8950–8956. [Google Scholar] [CrossRef]
  25. Li, X.; Azimzadeh, B.; Martinez, C.E.; McBride, M.B. Pb mineral precipitation in solutions of sulfate, carbonate and phosphate: Measured and modeled Pb solubility and Pb2+ activity. Minerals 2021, 11, 620. [Google Scholar] [CrossRef]
  26. Nasdala, L.; Smith, D.C.; Kaindl, R.; Ziemann, M.A. Raman spectroscopy: Analytical perspectives in mineralogical research. In Spectroscopic Methods in Mineralogy; Beran, A., Libowitziky, E., Eds.; Eotvos University Press: Budapest, Hungary, 2004; pp. 281–343. [Google Scholar]
  27. Nasdala, L.; Beyssac, O.; Schopf, J.W.; Bleisteiner, B. Application of Raman-based images in the Earth sciences. In Raman Imaging; Zoubir, A., Ed.; Springer Nature: Cham, Switzerland, 2012; pp. 145–187. [Google Scholar]
  28. Fritsch, E.; Rondeau, B.; Hainschwang, T.; Karampelas, S. Raman spectroscopy applied to gemology. In Applications of Raman Spectroscopy to Earth Sciences and Cultural Heritage; Dubessy, J., Caumon, M.-C., Rull, F., Eds.; European Mineralogical Society of Great Britain and Ireland: Cambridge, UK, 2012; pp. 455–489. [Google Scholar]
  29. Chou, I.-M.; Wang, A. Application of laser Raman micro-analyses to Earth and planetary materials. J. Asian Earth Sci. 2017, 145, 309–333. [Google Scholar] [CrossRef]
  30. Gazquez, F.; Rull, F.; Sanz-Arranz, A.; Medina, J.; Calaforra, J.M.; de las Heras, C.; Lasheras, J.A. In situ Raman characterization of minerals and degradation processes in a variety of cultural and geological heritage sites. Spectrochim. Acta Part A Mol. Biomol. Spectrosc. 2017, 172, 48–57. [Google Scholar] [CrossRef] [PubMed]
  31. Pasteris, J.D.; Beyssac, O. Welcome to Raman spectroscopy: Successes, challenges, and pitfalls. Elements 2020, 16, 87–92. [Google Scholar] [CrossRef]
  32. Simard, S.; Odziemkowski, M.; Irish, D.E.; Brossard, L.; Menard, H. In situ micro-Raman spectroscopy to investigate pitting corrosion product of 1024 mild steel in phosphate and bicarbonate solutions containing chloride and sulfate ions. J. Appl. Electrochem. 2001, 31, 913–920. [Google Scholar] [CrossRef]
  33. Noel, J.D.; Nading, T.M.; Pasteris, J.D.; Shah, V.; Suresh, A.K.; Giammar, D.E. The influence of water chemistry on lead release rates of lead (II) carbonate solids found in water distribution systems. In Proceedings of the 2009 Water Quality Technology Conference (WQTC), Seattle, WA, USA, 15 November 2009; American Water Works Association: Denver, CO, USA, 2009. [Google Scholar]
  34. Pasteris, J.D.; Ding, D.Y. Experimental fluoridation of nanocrystalline apatite. Am. Mineral. 2009, 94, 53–63. [Google Scholar] [CrossRef]
  35. Beyssac, O. New trends in Raman spectroscopy: From high-resolution geochemistry to planetary exploration. Elements 2020, 16, 117–122. [Google Scholar] [CrossRef]
  36. Tarr, J. Visual Characterization, Raman Spectroscopy, and Electron Probe Microanalysis of Lead Pipe Scale from Providence, Rhode Island. Bachelor’s Thesis, Washington University in St. Louis, Saint Louis, MO, USA, 2019. [Google Scholar]
  37. Rakovan, J.; Waychunas, G. Luminescence in minerals. Mineral. Rec. 1996, 27, 7–19. [Google Scholar]
  38. Burgio, L.; Clark, R.J.H.; Firth, S. Raman spectroscopy as a means for the identification of plattnerite (PbO2), of lead pigments and of their degradation products. Analyst 2001, 126, 222–227. [Google Scholar] [CrossRef]
  39. Marucci, G.; Beeby, A.; Parker, A.W.; Nicholson, C.E. Raman spectroscopic library of medieval pigments collected with five different wavelengths for investigation of illuminated manuscripts. Anal. Methods UK 2018, 10, 1219–1236. [Google Scholar] [CrossRef] [Green Version]
  40. Everall, N.J.; Lumsdon, J.; Christopher, D.J. The effect of laser-induced heating upon the vibrational Raman-spectra of graphites and carbon-fibers. Carbon 1991, 29, 133–137. [Google Scholar] [CrossRef]
  41. Bryant, R.N.; Pasteris, J.D.; Fike, D.A. Variability in the Raman spectrum of unpolished growth and fracture surfaces of pyrite due to laser heating and crystal orientation. Appl. Spectrosc. 2018, 72, 37–47. [Google Scholar] [CrossRef]
  42. Hopwood, J.D.; Davey, R.J.; Jones, M.O.; Pritchard, R.G.; Cardew, P.T.; Booth, A. Development of chloropyromorphite coatings for lead water pipes. J. Mater. Chem. 2002, 12, 1717–1723. [Google Scholar] [CrossRef]
  43. Zhu, Y.; Huang, B.; Zhu, Z.; Liu, H.; Huang, Y.; Zhao, X.; Liang, M. Characterization, dissolution and solubility of the hydroxypyromorphite-hydroxyapatite solid solution [(PbxCa1-x)5(PO4)3OH] at 25 °C and pH 2–9. Geochem. Trans. 2016, 17, 2. [Google Scholar] [CrossRef] [PubMed] [Green Version]
  44. Kampf, A.R.; Steele, I.M.; Jenkins, R.A. Phosphohedyphane, Ca2Pb3(PO4)3Cl, the phosphate analog of hedyphane: Description and crystal structure. Am. Mineral. 2006, 91, 1909–1917. [Google Scholar] [CrossRef]
  45. Kampf, A.R.; Housley, R.M. Fluorphosphohedyphane, Ca2Pb3(PO4)3F, the first apatite supergroup mineral with essential Pb and F. Am. Mineral. 2011, 96, 423–429. [Google Scholar] [CrossRef]
  46. Frost, R.L.; Palmer, S. A Raman spectroscopic study of the phosphate mineral pyromorphite Pb5(PO4)3Cl. Polyhedron 2007, 26, 4533–4541. [Google Scholar] [CrossRef] [Green Version]
  47. Frost, R.L.; Bouzaid, J.M.; Palmer, S. The structure of mimetite, arsenian pyromorphite and hedyphane—A Raman spectroscopic study. Polyhedron 2007, 26, 2964–2970. [Google Scholar] [CrossRef] [Green Version]
  48. Frost, R.L.; Scholz, R.; Lopez, A.; Firmino, B.E.; Lana, C.; Xi, Y. A Raman and infrared spectroscopic characterisation of the phosphate mineral phosphohedyphane, Ca2Pb3(PO4)3Cl from the Roote mine, Nevada, USA. Spectrochim. Acta Part A Mol. Biomol. Spectrosc. 2014, 127, 237–242. [Google Scholar] [CrossRef]
  49. Olds, T.A.; Kampf, A.R.; Rakovan, J.F.; Burns, P.C.; Mills, O.P.; Laughlin-Yurs, C. Hydroxylpyromorphite, a mineral important to lead remediation: Modern description and characterization. Am. Mineral. 2021, 106, 922–929. [Google Scholar] [CrossRef]
  50. Sternlieb, M.; Pasteris, J.D.; Williams, B.R.; Krol, K.A.; Yoder, C.H. The structure and solubility of carbonated hydroxyl and chloro lead apatites. Polyhedron 2010, 29, 2364–2372. [Google Scholar] [CrossRef]
  51. Wilt, Z.; Fuller, C.; Bachman, T.; Weidner, V.; Pasteris, J.D.; Yoder, C.H. Synthesis and structure of carbonated barium and lead fluorapatites: Effect of cation size on A-type carbonate substitution. Am. Mineral. 2014, 99, 2176–2186. [Google Scholar] [CrossRef]
  52. Yoder, C.H.; Pasteris, J.D.; Worcester, K.N.; Schermerhorn, D.V. Structural water in carbonated hydroxylapatite and fluorapatite: Confirmation by solid state 2H NMR. Calcif. Tissue Int. 2012, 90, 60–67. [Google Scholar] [CrossRef] [PubMed]
  53. Baig, A.A.; Fox, J.L.; Young, R.A.; Wang, Z.; Hsu, J.; Higuchi, W.I.; Chhettry, A.; Zhuang, H.; Otsuka, M. Relationships among carbonated apatite solubility, crystallite size, and microstrain parameters. Calcif. Tissue Int. 1999, 64, 437–449. [Google Scholar] [CrossRef] [PubMed]
  54. Deymier, A.C.; Nair, A.K.; Depalle, B.; Qin, Z.; Arcot, K.; Yoder, C.H.; Buehler, M.J.; Thomopoulos, S.; Genin, G.M.; Pasteris, J.D. Protein-free formation of bone-like apatite: New insights into the key role of carbonation. Biomaterials 2017, 127, 75–88. [Google Scholar] [CrossRef] [PubMed] [Green Version]
  55. Stalder, M.; Rozendaal, A. Graftonite in phosphatic iron formations associated with the mid-Proterozoic Gamsberg Zn-Pb deposit, Namaqua Province, South Africa. Mineral. Mag. 2002, 66, 915–927. [Google Scholar] [CrossRef]
  56. Mavropoulos, E.; Rocha, N.C.C.; Soares, G.A.; Moreira, J.C.; Rossi, A.M. Effects on calcium phosphate ceramics stability. Key Eng. Mater. 2004, 254–256, 123–126. [Google Scholar] [CrossRef]
  57. Ondrejka, M.; Bacik, P.; Putis, M.; Uher, P.; Mikus, T.; Luptakova, J.; Ferenc, S.; Smirnov, A. Carbonate-bearing phosphohedyphane-“hydroxylphosphohedyphane” and cerussite: Supergene products of galena alteration in Permian aplite (Western Carpathians, Slovakia). Can. Mineral. 2020, 58, 347–365. [Google Scholar] [CrossRef]
  58. Davidson, C.M. Surface analysis and depth profiling of corrosion products formed in lead pipes used to supply low alkalinity drinking water. Water Sci. Technol. 2004, 49, 49–54. [Google Scholar] [CrossRef]
  59. Markl, G.; Marks, M.A.W.; Holzapfel, J.; Wenzel, T. Major, minor, and trace element composition of pyromorphite-group minerals as recorders of supergene weathering processes from the Schwarzwald mining district, SW Germany. Am. Mineral. 2014, 99, 1133–1146. [Google Scholar] [CrossRef]
  60. Yoder, C.H.; Havlusch, M.D.; Dudrick, R.N.; Schermerhorn, J.T.; Tran, L.K.; Deymier, A.C. The synthesis of phosphate and vanadate apatites using an aqueous one-step method. Polyhedron 2017, 127, 403–409. [Google Scholar] [CrossRef] [Green Version]
  61. Cotter-Howells, J. Lead phosphate formation in soils. Environ. Pollut. 1996, 93, 9–16. [Google Scholar] [CrossRef]
  62. Orta, J.E. The Effects of Changing Water Chemistry on the Stability of Lead Service Lines. Master’s Thesis, University of California at Riverside, Riverside, CA, USA, 2019. [Google Scholar]
  63. Wasserstrom, L.; Miller, S.A.; Triantafyllidou, S.; DeSantis, M.K.; Schock, M.R. Scale formation under blended phosphate treatment for a utility with lead pipes. J. AWWA 2017, 109, E464–E478. [Google Scholar] [CrossRef] [PubMed]
  64. Wopenka, B.; Pasteris, J.D. Structural characterization of kerogens to granulite-facies graphite: Applicability of Raman microprobe spectroscopy. Am. Mineral. 1993, 78, 533–557. [Google Scholar]
  65. Beyssac, O.; Goffe, B.; Chopin, C.; Rouzaud, J.N. Raman spectra of carbonaceous material in metasediments: A new geothermometer. J. Metamorph. Geol. 2002, 20, 859–871. [Google Scholar] [CrossRef]
  66. Stukelj, J.; Svanback, S.; Agopov, M.; Lobmann, K.; Strachan, C.J.; Rades, T.; Yliruusi, J. Direct measurement of amorphous solubility. Anal. Chem. 2019, 91, 7411–7417. [Google Scholar] [CrossRef] [PubMed] [Green Version]
  67. Lafuente, B.; Downs, R.T.; Yang, H.; Stone, N. The power of databases: The RRUFF project. In Highlights in Mineralogical Crystallography; Armbruster, T., Danisi, R.N., Eds.; W. De Gruyter: Berlin, Germany, 2015; pp. 1–30. [Google Scholar]
  68. Schiavi, F.; Bolfan-Casanova, N.; Buso, R.; Laumonier, M.; Laporte, D.; Medjoubi, K.; Venugopal, S.; Gomez-Ulla, A.; Cluzel, N.; Hardiagon, M. Quantifying magmatic volatiles by Raman microtomography of glass inclusion-hosted bubbles. Geochem. Perspect. Lett. 2020, 16, 17–24. [Google Scholar] [CrossRef]
  69. Das Gupta, S.; Killenberger, M.; Tanner, T.; Rieppo, L.; Saarakkala, S.; Heikkila, J.; Anttonen, V.; Finnila, M.A.J. Mineralization of dental tissues and caries lesions detailed with Raman microspectroscopic imaging. Analyst 2021, 146, 1705–1713. [Google Scholar] [CrossRef]
  70. Leban, M.B.; Kosec, T. Characterization of corrosion products formed on mild steel in deoxygenated water by Raman spectroscopy and energy dispersive X-ray spectroscopy. Eng. Fail. Anal. 2017, 79, 940–950. [Google Scholar] [CrossRef]
  71. McCann, L.I.; Trentelman, K.; Possley, T.; Golding, B. Corrosion of ancient Chinese bronze money trees studied by Raman microscopy. J. Raman Spectrosc. 1999, 30, 121–132. [Google Scholar] [CrossRef]
  72. Sandvig, A.; Kwan, P.; Kirmeyer, G.; Maynard, B.; Mast, D.; Trussell, R.R.; Trussell, S.; Cantor, A.; Prescott, A. Contribution of Service Line and Plumbing Fixtures to Lead and Copper Rule Compliance Issues; Awwa Research Foundation: Denver, CO, USA, 2008. [Google Scholar]
  73. Lanfranco, A.M.; Schofield, P.F.; Murphy, P.J.; Hodson, M.E.; Mosselmans, J.F.W.; Valsami-Jones, E. Characterization and identification of mixed-metal phosphates in soils: The application of Raman spectroscopy. Mineral. Mag. 2003, 67, 1299–1316. [Google Scholar] [CrossRef]
  74. Burgio, L.; Clark, R.J.H.; Hark, R.R. Raman microscopy and x-ray fluorescence analysis of pigments on medieval and Renaissance Italian manuscript cuttings. Proc. Natl. Acad. Sci. USA 2010, 107, 5726–5731. [Google Scholar] [CrossRef] [Green Version]
  75. Stanzani, E.; Bersani, D.; Lottici, P.P.; Colomban, P. Analysis of artist’s palette on a 16th century wood panel painting by portable and laboratory Raman instruments. Vib. Spectrosc. 2016, 85, 62–70. [Google Scholar] [CrossRef] [Green Version]
  76. Boerger, A.; Ebner, E.; Ruehl, E.; Flesch, R.; Burow, D. On the use of Raman microscopy for sulfation analysis in lead-acid battery research. J. Energy Storage 2017, 12, 305–310. [Google Scholar] [CrossRef]
  77. Breitenfeld, L.B.; Dyar, M.D.; Carey, C.J.; Tague, T.J.; Wang, P.; Mullen, T.; Parente, M. Predicting olivine composition using Raman spectroscopy through band shift and multivariate analyses. Am. Mineral. 2018, 103, 1827–1836. [Google Scholar] [CrossRef]
  78. Buseck, P.R.; Beyssac, O. From organic matter to graphite: Graphitization. Elements 2014, 10, 421–426. [Google Scholar] [CrossRef]
  79. Liang, E.R.; Yang, Y.; Kiefer, W. Surface-enhanced Raman spectra of fulvic and humic acids adsorbed on copper electrodes. Spectrosc. Lett. 1999, 32, 689–701. [Google Scholar] [CrossRef]
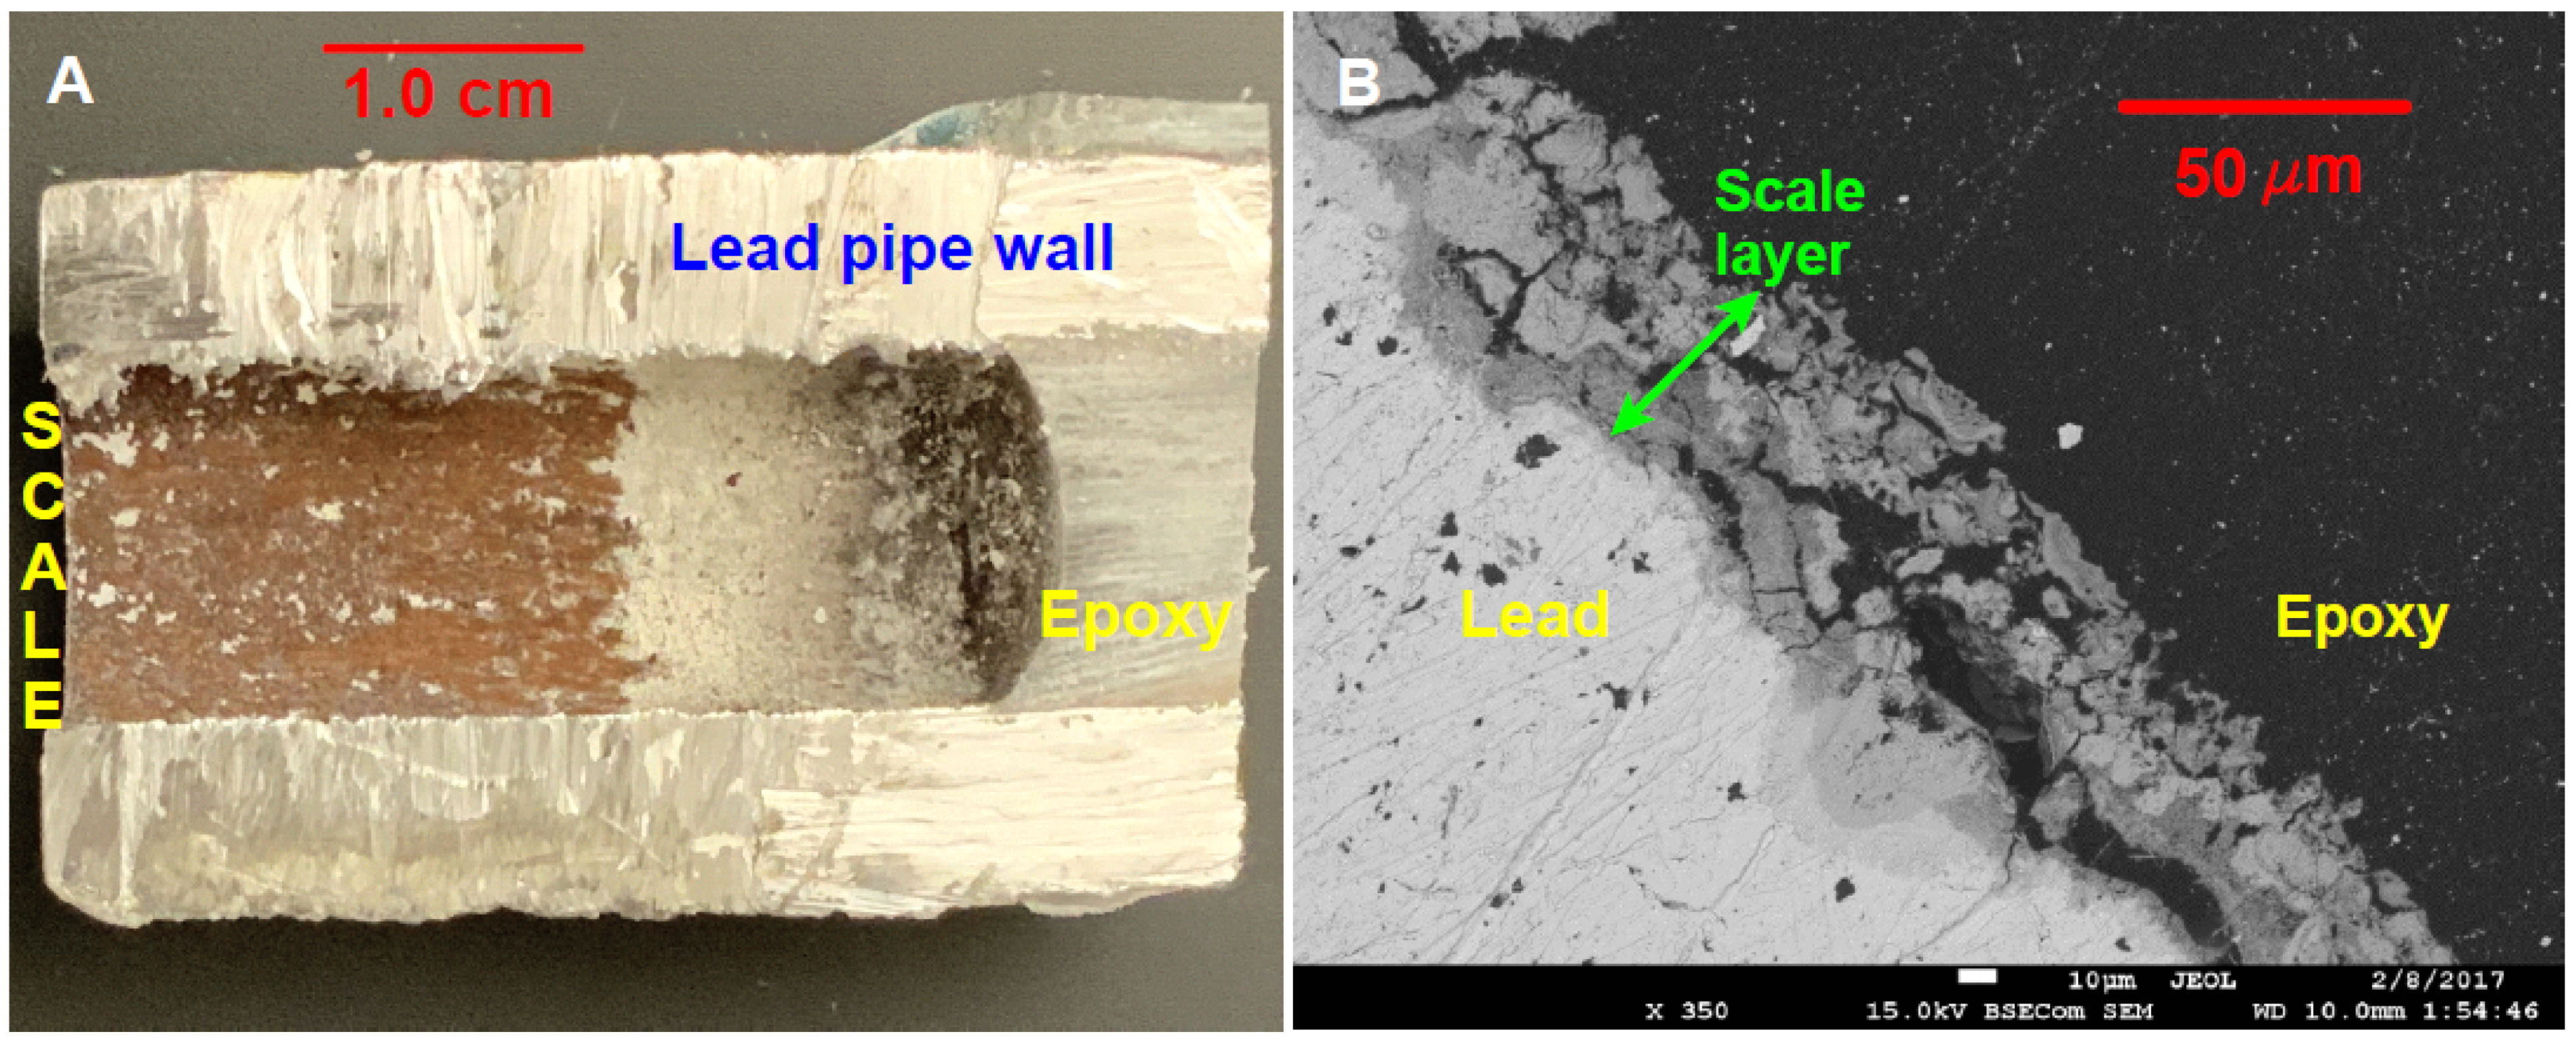
Figure 1. Images taken (A) at macroscopic scale of a longitudinally sawed half-cylinder segment of lead pipe harvested from Providence, Rhode Island, and then experimentally run in a pipe-loop reactor for 75 weeks and (B) at microscopic scale via SEM of a cross-section of an as-harvested lead pipe collected from Providence after approximately one hundred years of service. Image (A) shows two layers of scale, i.e., the reddish precipitate is the inner layer next to the pipe wall and contains lead (II) and lead (IV) oxides; the white precipitate is the outer layer (directly in contact with water) that mainly contains Ca-apatite. Image (B) shows the scale layer as indicated by a green arrow. The scale comprises lead carbonate (darker gray) and lead oxide (medium gray), directly formed on the lead (lightest gray) pipe.
Minerals 11 01047 g001
Figure 2. Raman spectra of the lead oxide minerals most frequently occurring in lead-pipe scale. (A) Black spectrum of plattnerite (synthetic); red spectrum of scrutinyite (from pipe scale). One diagnostic peak for litharge (far left) indicates this mineral as a minor contaminant in scrutinyite. (B) Raman spectra (not to same intensity scale) of PbO2 polymorphs plattnerite and scrutinyite, PbO polymorphs litharge and massicot, and mixed-valence minium Pb3O4. * indicates presence of small amount of lead carbonate.
Minerals 11 01047 g002
Figure 3. Comparison of Raman spectra taken on clean lead or on a litharge layer on lead using different laser intensities, as measured at the sample surface (further acquisition details are in SI Section S2). Spectra: (a) Litharge formed as an oxidation product on an air-weathered lead ingot; 1 mW laser power. (b) Litharge corrosion on lead pipe harvested from Providence, RI; 5.4 mW laser power. (c) >6 mW laser power on a clean ingot of lead, producing litharge and massicot (both PbO). (d) 14 mW laser power on clean lead, producing massicot. Downshifting and broadening of “340.4 cm−1 peak” of litharge due laser heating (a,b,c). Inset: Spectral downshifting effect on the “147 cm−1 peak” of opaque litharge due to laser heating and formation of massicot (139.3 cm−1).
Minerals 11 01047 g003
Figure 4. (a,b) Clean new lead pipe had been undergoing a long-term recirculation experiment (35 weeks at the time of this removal) using synthetic water matching that of pre-2000 Washington, D.C. Both spectra a and b reveal litharge [L] and a lead carbonate phase. In spectrum a, the lead carbonate is cerussite [C], whereas spectrum b shows hydrocerussite [H]. The “O” label indicates the position of C-H stretching bands for a hydrocarbon/organic compound. (c,d) Spectra of synthetic standards of cerussite (PbCO3) and hydrocerussite [Pb3(CO3)2(OH)2], confirming the labeling in spectra a and b (see inset for enlargement: 1000 to 1100 cm−1).
Minerals 11 01047 g004
Figure 5. Comparison of peak positions from pairs of Ca-apatite, Pb-apatite (i.e., pyromorphite), and Ca-Pb phosphate (i.e., phosphohedyphane) phases. (A) full spectra. (B) enlargement of the spectral window of the most diagnostic peaks (ν1 and ν3). * indicates a peak for (AsO4)3− substitution in chlorphosphohedyphane. ** indicates spectra that have been background corrected to eliminate effects of luminescence.
Minerals 11 01047 g005
Figure 6. Raman spectra for pairs of Ca-apatite, pyromorphite, and phosphohedyphane OH, F, or Cl species. These examples illustrate the “apatite spectral template” (see two stacked spectra at the bottom of the figure) and the “spectral peak shifts” in response to anion or cation substitution. The relative peak positions (i.e., spectral fingerprints) within the OH-pyromorphite and OH-apatite species are very similar, as illustrated at the bottom of the figure, where the Pb-apatite spectrum has been artificially upshifted to overlay that of the Ca-apatite. The anion- and cation-substitution panels indicate how much spectral shifting is necessary to bring one species into superposition on the other. These shifts (listed as Δ values) in the ν1 or the ν1 + ν3 bands indicate the different spectral sensitivities to cation or anion substitution, illustrating the especially high sensitivity of the lead-bearing phosphates.
Minerals 11 01047 g006
Figure 7. Red spectrum (c) of a room-temperature precipitate from a phosphate solution with NaCl and an atomic Ca:Pb ratio of 20. See SI Section S6 for experimental methods. For comparison, two spectra are shown in dashed format: blue spectrum (d) is of a room-temperature synthetic Cl-OH pyromorphite (Pb-phosphate) with 2.75 wt.% CO3 in solid solution, and black spectrum (b) of a high-temperature synthetic chlorapatite (Ca-phosphate) standard. The prominence of two, rather than just one of the P-O stretching bands in spectrum c, suggests a considerable effect from Pb incorporation. The best spectral match to precipitate (c) is of a natural, geological chlorphosphohedyphane (spectrum (a)), shown in green. An XRD pattern and interpretation of sample c are in SI Section S6. ** indicates a peak from residual Pb(NO3)2 reactant.
Minerals 11 01047 g007
Figure 8. Raman spectra of room-temperature precipitates from Pb-phosphate solutions to which specific cations or anions have been added (see table in Figure S3) to emulate the effects of chemical differences among various municipal water supplies. The spectrum at the bottom is of a synthetic hydroxylpyromorphite standard. The spectra of the different pyromorphite precipitates clearly reflect cation and anion substitutions. Additionally of note is that the spectra of all the samples display the peak (see “CO3” label) for the chemical–structural substitution of CO32− into the pyromorphite precipitates; Figure 8 is a redrawing of some of the spectra in Figure 1B of Zhao et al. (2018) [4]. More detailed interpretations are given in Figure S3.
Minerals 11 01047 g008
Figure 9. Raman spectra illustrating the ability to calibrate the CO32− concentration in unknown pyromorphite samples based on reference to independently analyzed compounds (see legend), such as the synthetic carbonated hydroxylpyromorphite (spectra (a) and (b)) and carbonated chlorpyromorphite (spectra (c) and (d)) standards. Inset shows the spectral region for the O-H stretch vibration of the hydroxyl ion, a small concentration of which was even incorporated into both chlorpyromorphite samples. The “CO3” label indicates the band that confirms structural incorporation (i.e., substitution) of carbonate within the pyromorphite.
Minerals 11 01047 g009
Figure 10. Raman spectra of an experimental lead pipe that had undergone conditioning for 15 weeks with synthetic, pre-2000 Washington, D.C. water. As illustrated in the inset to Figure S5, the pipe does not appear fully coated, but rather shows a tri-color patchiness. These six spectra (1 mW laser power; each one shows the average of 20 1-s acquisitions) were taken of different silvery patches that optically appeared to be clean lead. They are stacked from the highest (at top) to the lowest spectral intensity ratio of litharge: cerussite, illustrating the large range in relative concentrations across the pipe’s surface.
Minerals 11 01047 g010
Figure 11. Contrasting degrees of crystallinity in plattnerite (PbO2) according to when in the conditioning process it was precipitated in the new lead pipe and how long the initial precipitate had to mature in the solution. (a) At 62 weeks (wks): fine-grained but relatively well-crystalline matrix coating wall of pipe; (b) at 62 weeks: small, not well-crystalline grains perched on tips of projections from coating on pipe wall; (c) at 33 weeks: poorly crystalline particles trapped on filter from water flow in pipe. Structural order of the same mineral phase shown to increase from the bottom to the top spectrum.
Minerals 11 01047 g011
Publisher’s Note: MDPI stays neutral with regard to jurisdictional claims in published maps and institutional affiliations.