Article

Hydrophobicity and Charge Distribution Effects in the Formation of Bioorganoclays

by
Peter Grančič
1,*,† and
Daniel Tunega
1,2,*,†
1
Institute of Soil Research, University of Natural Resources and Life Sciences, Peter-Jordan-Straße 82, A-1190 Vienna, Austria
2
School of Pharmaceutical Science and Technology, Tianjin University, 92 Weijin Road, Nankai District, Tianjin 300072, China
*
Authors to whom correspondence should be addressed.
These authors contributed equally to this work.
Minerals 2021, 11(10), 1102; https://doi.org/10.3390/min11101102
Submission received: 13 September 2021 / Revised: 30 September 2021 / Accepted: 2 October 2021 / Published: 8 October 2021
(This article belongs to the Special Issue Recent Advances in Molecular Modeling of Clay Minerals Interfaces)

Abstract

:
Interactions of bioorganic moieties with clay minerals have attracted attention not only from the perspective of novel bioclay materials but also because they play a crucial role in our understanding of physical and chemical processes in soils. The aim of the present article is to explore the interactions responsible for the formation of a phosphatidylcholine-kaolinite bioclay by employing a series of classical molecular dynamic simulations. Detailed analysis of the structure and energies of the resulting bioclays reveals that the phosphatidylcholine molecules bind to the kaolinite surface either via their zwitterionic heads or hydrophobic aliphatic tails, depending on the kaolinite surface characteristics and the density of organic coating. The phosphatidylcholine molecules have a tendency to form irregular layers with a preferred parallel orientation of molecules with respect to the kaolinite surface. The tails exhibit varying degrees of flexibility and disorder depending on their distance from the surface and the density of surface coating. Significant differences in the binding can be spotted with respect to the two types of kaolinite basal surfaces, i.e., the hydrophobic siloxane surface, which possesses a considerable dispersion character, and the hydrophilic alumina surface, polarized by the surface hydroxyl groups.

1. Introduction

Based on a constant demand for novel, preferably cheap and environmentally-friendly materials, the combination of various organic cations and minerals became crucial in a number of applications ranging from sorbents for environmental damage remediation [1,2] to nanofillers that alter the physico-chemical properties of polymeric matrices [3,4].
Recently, significant attention has been paid to the preparation of organoclays, using mainly quarternary ammonium [5] and phosphonium cations [4] with a variety of clay minerals. The structure and properties of the resulting organoclays have been analyzed within numerous experimental studies, using X-ray diffraction [6,7], thermal gravimetric analysis [8,9], scanning electron microscopy [10,11], transmission electron microscopy [10,12,13] or X-ray photoelectron spectroscopy [13,14]. The exact molecular arrangement at the atomic scale far beyond experimental resolution can be obtained from molecular simulations, which reveal the structure [13,14,15,16,17,18], phase transitions [19,20] and effects associated with various types of organic cations [17,21] or diffusion processes [22,23]. Even more detailed information can be reached by employing theoretical chemistry methods at the ab initio level of the resolution [24].
Common organoclays prepared with the aid of synthetic surfactants are considered environmentally harmful due to the byproducts associated with their manufacture and the time required for their natural degradation [25]. An environmentally-friendly alternative is the replacement of synthetic surfactants by molecules of a biological origin. Among other candidate molecules, the group of phospholipids has been successfully used in the preparation of stable bioclays either by their intercalation into the interlayer space of a clay mineral [26,27] or by their adsorption onto its outer surface [28].
The phospholipid phosphatidylcholine is a naturally occurring surfactant with hydrophilic zwitterionic head composed of positively charged choline group and negatively charged glycerophosphoric acid, onto which a variety of fatty acids can be attached. Unlike their typical organic predecessors (e.g., alkyammonium cations), phospholipids bring new challenges due to the increase in the overall degrees of freedom [29]. Particularly interesting are the effects associated with (i) electrostatic charge distribution of the polar head group and (ii) the presence of two hydrophobic aliphatic tails. Studies of phospholipid–clay interactions may also contribute to our understanding of the evolution of life [30].
The mineral kaolinite, represented by the overall stoichiometric formula Al 2 Si 2 O 5 ( OH ) 4 , is one of the most abundant 1:1 layered phyllosilicate minerals with a single layer composed of one silica tetrahedral sheet and one alumina octahedral sheet. Moreover, kaolinite belongs to typical soil minerals. In the absence of isomorphic substitutions and site defects, each kaolinite sheet comprises of two kinds of basal surfaces, often referred to as (i) hydrophobic siloxane surface, characterized by its considerable dispersion, and (ii) hydrophilic alumina surface, polarized by the surface hydroxyl groups [31]. Pure kaolinite does not bear a net electrostatic charge and can be characterized by its relatively low shrink–swell capacity and low cation-exchange capacity of 1–15 mmol per 100 g clay [32,33].

2. Materials and Methods

All calculations were performed using the LAMMPS package [34] aided by a series of home-made scripts to generate input files and to process and visualize the outputs. A 16 × 10 × 7 supercell of kaolinite was built based on the unit cell parameters published by Bish [35]. The resulting supercell geometry was initially optimized using the conjugate gradient method [36] and then equilibrated by running a isothermal–isobaric N p T molecular dynamics (MD) simulation at 300 K and 101.325 kPa for 5 ns . The layers of the equilibrated kaolinite supercell (with the resulting total volume of 82.8 × 89.6 × 50.2 Å 3 ) were separated and a single monolayer was used for the construction of the simulation inputs by adding n randomly distributed, oriented and folded 1-palmitoyl-2-oleoyl-phosphatidylcholine (POPC) and residual water molecules of 3 wt . % with respect to the clay mineral mass in the space above it. Typically, the residual water content after freeze drying of organoclay samples varies from ≈2 to ≈6 wt . % [8,37]. Velocity vectors, scaled to 300 K and oriented towards the kaolinite surface were added to both the POPC and water molecules. Depending on the surface studied, the positions of the silicon or aluminum atoms were fixed and a protective wall composed of fixed dummy atoms was added far above the layer of water and POPC molecules. Next, the geometry of each simulation input was optimized using the conjugate gradient method to remove any potential random overlaps of the constituent molecules. Each simulation box was then equilibrated by running an N V T MD simulation for at least 10 ns or until any systematic drift in the total potential energy of the system was removed. Subsequently, 1000 different configurations were extracted from each equilibrated trajectory of 1 ns for further analysis. The system pressure and temperature were controlled using the Nosé-Hoover chain approach [38,39] by coupling a series of baro- and thermostats to improve ergodicity (with a relaxation time of 1 ps ). The classical MD equations of motion were integrated using the velocity Verlet algorithm [40] with an integration step of 1 fs . The short range Van der Waals and Coulombic interactions were truncated using a 25 Å cutoff and the long range Coulombic interactions were approximated using the Particle–Particle Particle–Mesh (PPPM) approach [41]. The simulations were performed in the slab-model where the periodicity in the z-direction (the direction perpendicular to the kaolinite surface) was removed and a correction term was applied to the PPPM solver [42] to eliminate any associated polarization effects. The interactions between the kaolinite monolayer, water and POPC molecules were described by a combination of CLAYFF [43], SPC/E [44] and OPLS-AA [45,46] force fields, respectively.

3. Results and Discussion

3.1. Atomic Density Profiles

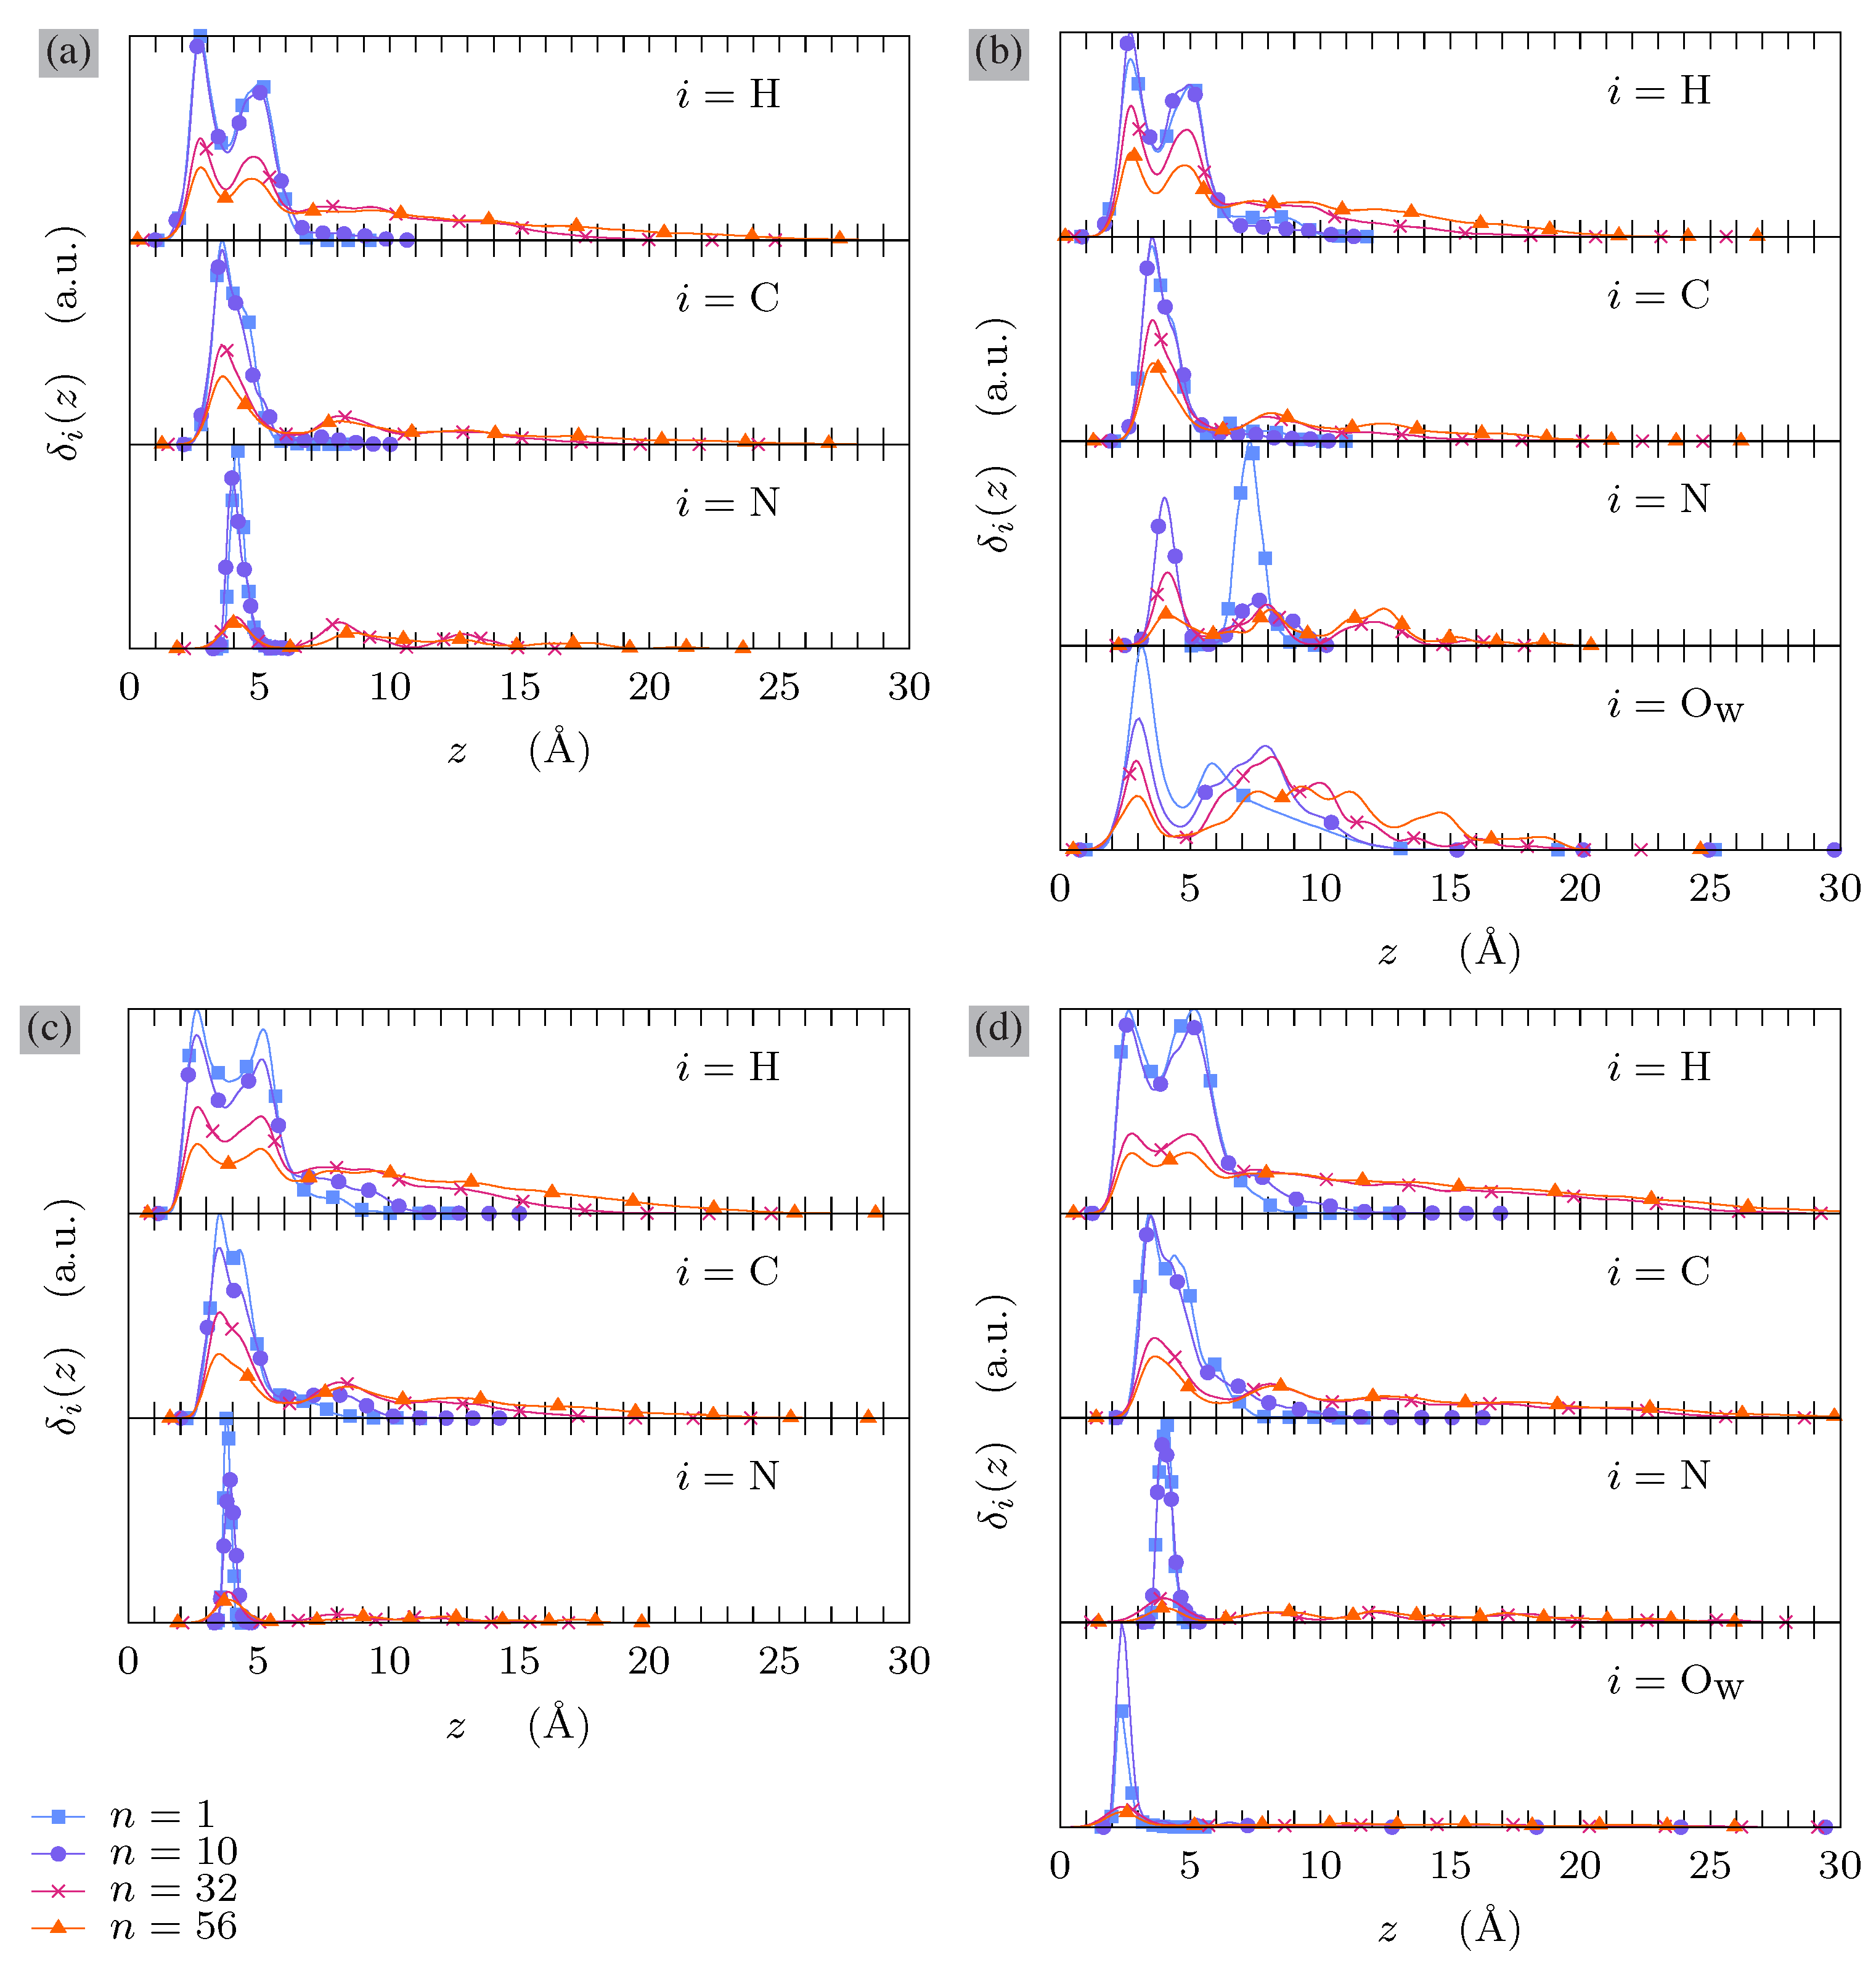
The one-dimensional density profiles δ i ( z ) in Figure 1 demonstrate that at low surface loading, all types of atoms reside in the proximity of the clay surface. The density profiles of carbon ( i = C ) and hydrogen ( i = H ) atoms that represent the POPC backbone indicate that the entire POPC molecule has the tendency to be oriented parallel to the surface. This arrangement is very similar to previous experimental [47] and computational observations [29] of POPC on a basal montmorillonite surface.
As the surface loading increases, the one dimensional densities widen and often become multimodal as clearly visible on the nitrogen density profiles ( i = N ), suggesting the formation of undefined layers or areas of varying density across the z-axis (cf. Figure 1b). Once the surface becomes more saturated, additional POPC molecules can still be attached and the resulting layers are stabilized through mutual interactions between the POPC molecules, mediated by the opposite electrostatic charges of the zwitterionic head groups. This idea is supported by the equidistant value ( 4.5 Å) between the peaks on the nitrogen density profiles, which corresponds to the expected distance between two POPC head groups arranged in a mutually parallel orientation. A full surface coverage of a similar system, composed of phosphatidylcholine molecules on a montmorillonite surface has been previously estimated as 0.1 μ g cm 2 [29] which in this case corresponds to 59 POPC molecules.
There is a distinct difference between hydrophobic siloxane and hydrophilic alumina surfaces as displayed, for example, in the residual water oxygen profiles ( i = O w ). At the hydrophilic alumina surface, the residual water molecules reside in the proximity of the surface, as they bind to the surface hydroxyl groups. On the other hand, at the hydrophobic siloxane surface, the residual water molecules are repelled from the surface and have a tendency to bind to polar groups at the POPC head. This fact can be clearly illustrated by the shifted single peak in the nitrogen density profile (cf. Figure 1b for i = N ) for low surface loadings ( n = 1 ), where the residual water molecules form a cluster around the POPC head, resulting in the apparent z-position shift.

3.2. Tilt Angles

Composed of several constituent subunits, the POPC molecule can be divided into 3 fragments: (i) the choline head group connected to the glycerophosphoric acid and the two aliphatic tails descending from (ii) oleic and (iii) palmitic acid. The orientation of each fragment is described by an unit vector v i derived from a straight line fitted to the positions of its molar mass-weighted backbone atoms excluding hydrogens. The coordinates of the kaolinite basal oxygen atoms of both kaolinite surfaces are fitted with a plane from which a normal unit vector n is extracted. Further, each fragment’s center-of-mass distance to the plane of the kaolinite basal oxygens z i is calculated. Finally, the tilt angle β i describing the orientation of each POPC fragment with respect to a given kaolinite surface is defined as the angle between vectors v i and n (cf. inset of Figure 2a,c, respectively).
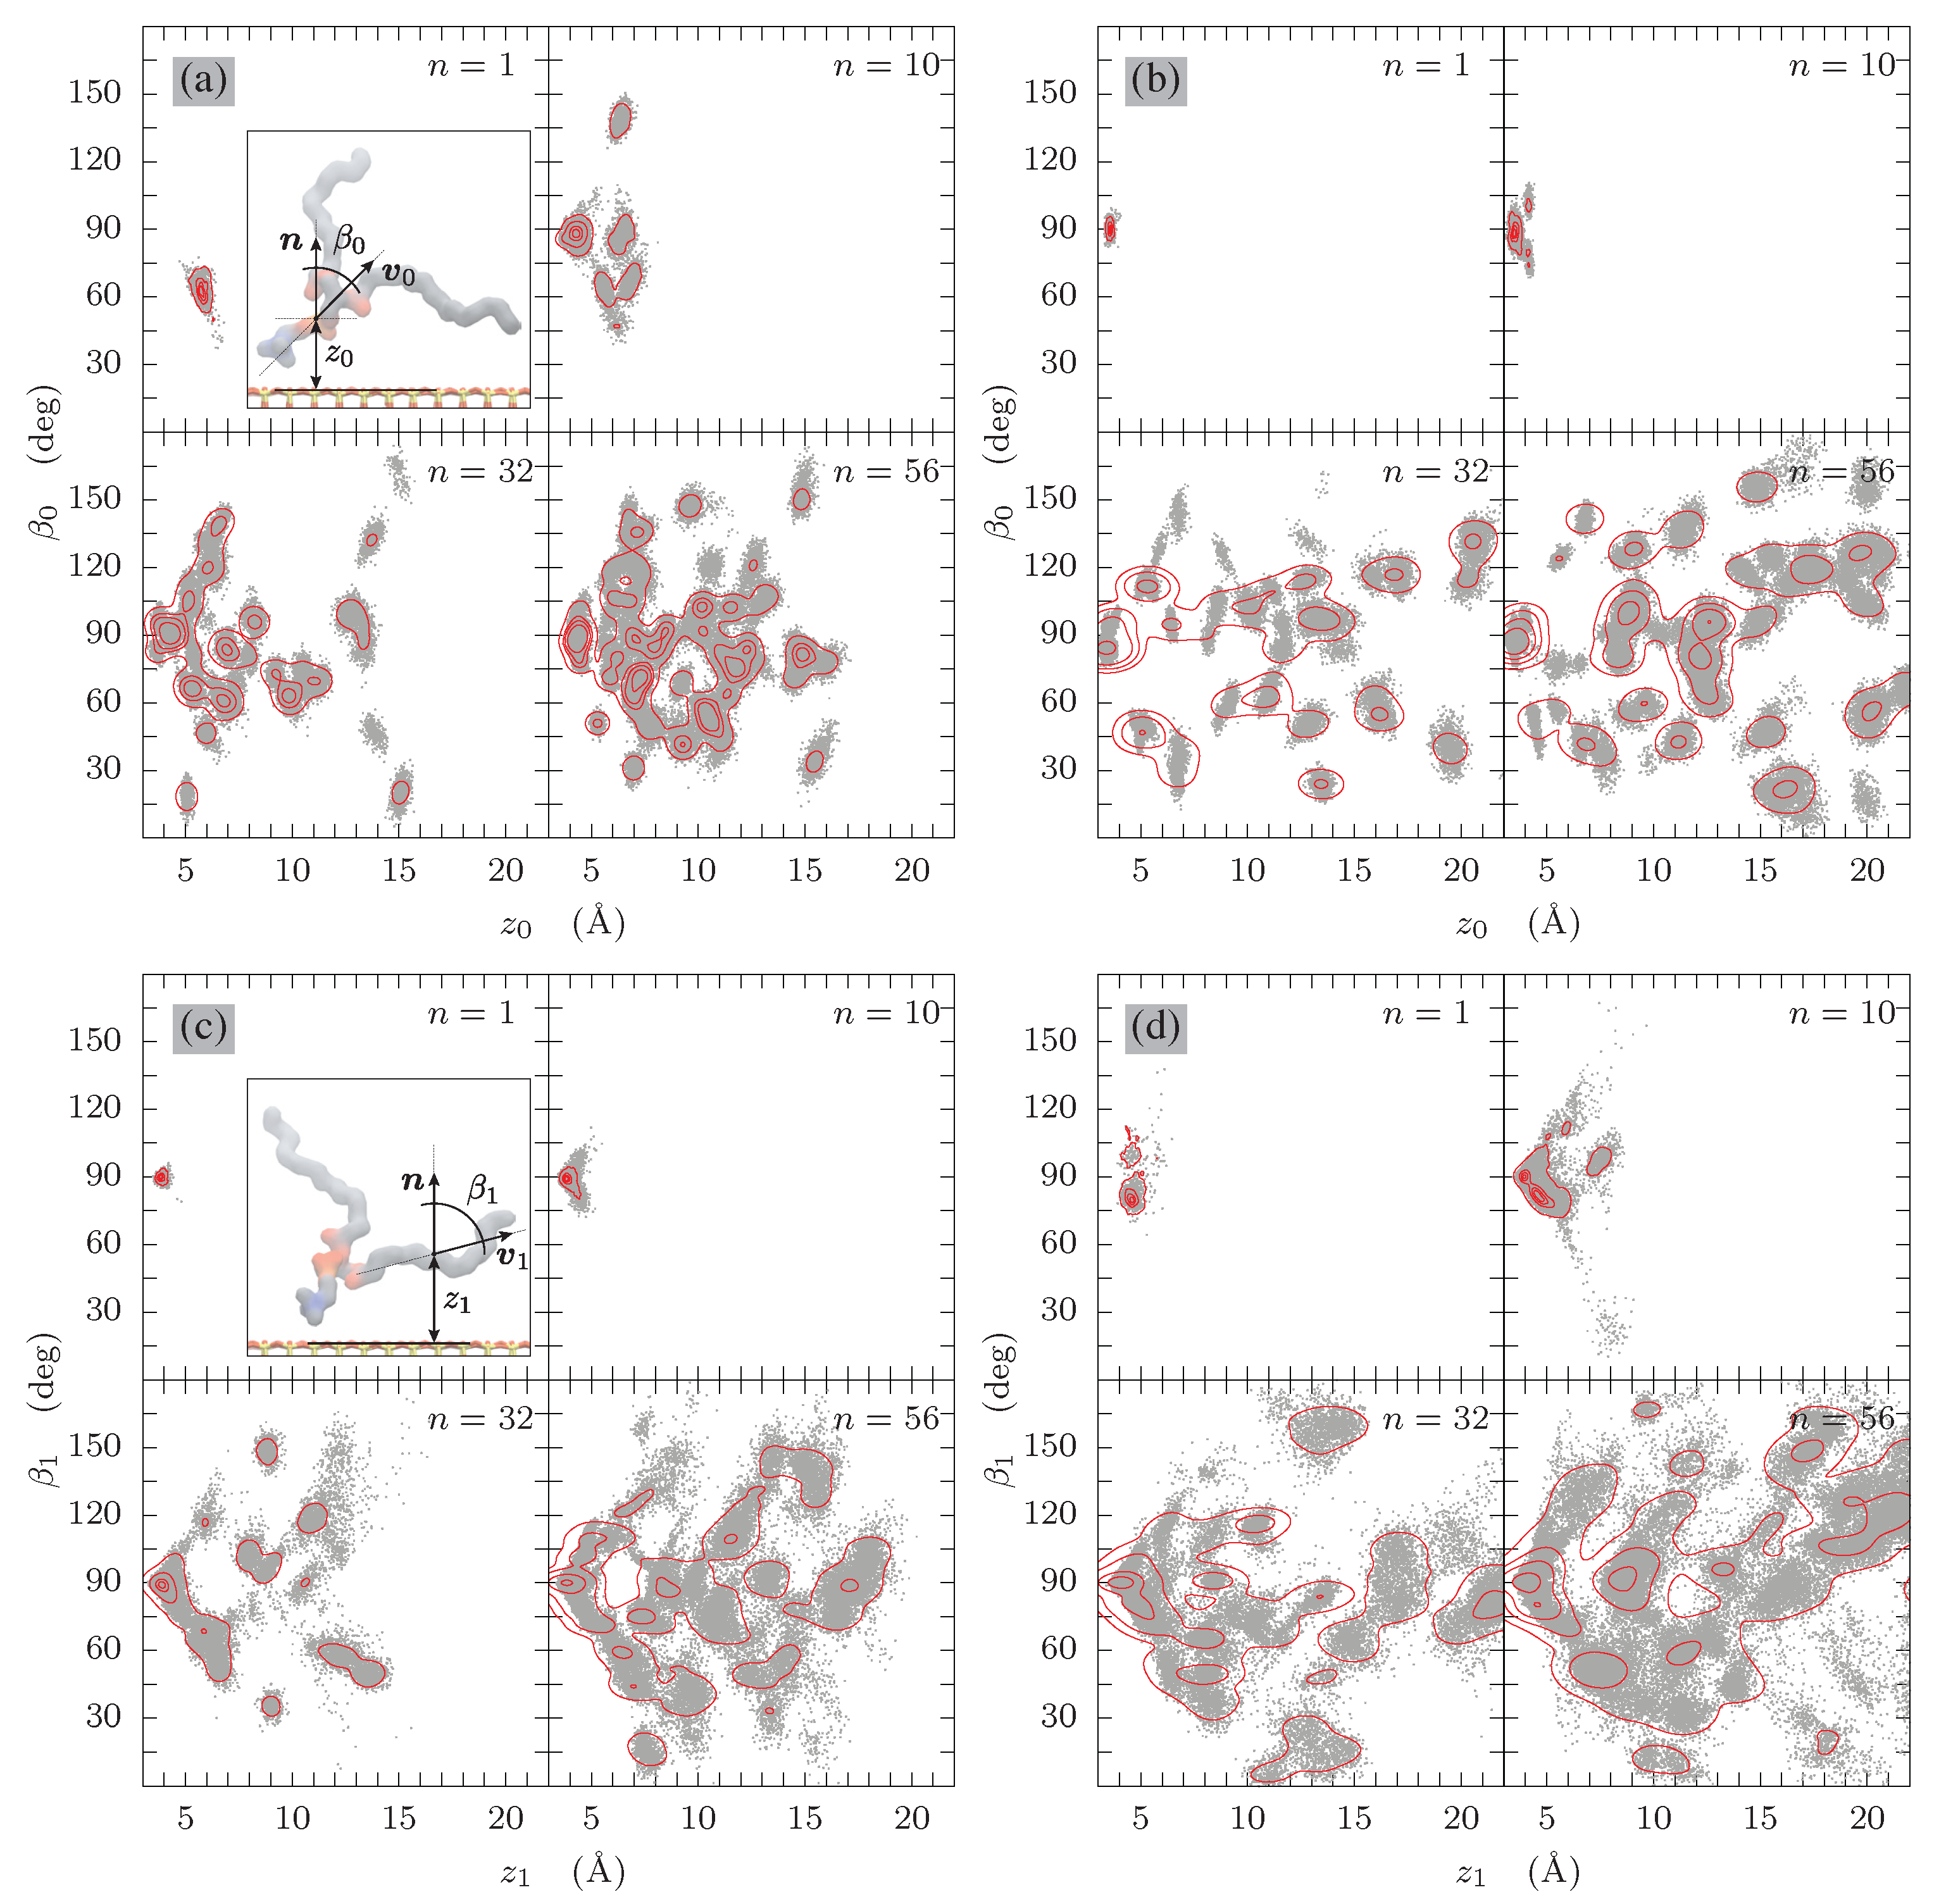
Figure 2 shows the distribution of tilt angles of the head group ( β 0 ) and the oleic acid tail ( β 1 ) in the presence of residual water molecules with respect to the kaolinite hydrophobic siloxane (a, c) and hydrophilic alumina (b, d) surfaces. For simplicity, only the plots displaying the tilt angle distributions of the oleic acid tail are shown because the ones for the palimitic acid tail are very similar.
By comparing the POPC head group tilt angle β 0 distributions in Figure 2 for hydrophobic siloxane (a) and hydrophilic alumina (b) kaolinite surface at low surface loadings ( n = 1 ), a distinct difference in orientation of the polar POPC head group can be spotted. While the hydrophobic character of the siloxane surface repels the polar POPC head group leading to a tilt angle of 60 , the hydrophilic alumina surface acts attractively causing the polar POPC head group to adopt a parallel orientation to the basal oxygens at a tilt angle of 90 .
At relatively low surface loading values (e.g., n = 10 ), the affinity towards the residual water molecules at corresponding surface dictates the arrangement of the nearest POPC molecules. At the hydrophobic surface, part of the molecules have their heads arranged parallel to the surface; however, the rest of the molecules can adopted almost any orientation and find themselves at greater distances from the surface compared to the hydrophilic surface. On the other hand, the hydrophobic tails exhibit the opposite behavior: the tendency to remain in the proximity of the hydrophobic surface in a surface-parallel orientation that contrasts with the non-parallel orientation and wider span of the z-positions in the case of the hydrophillic alumina surface.
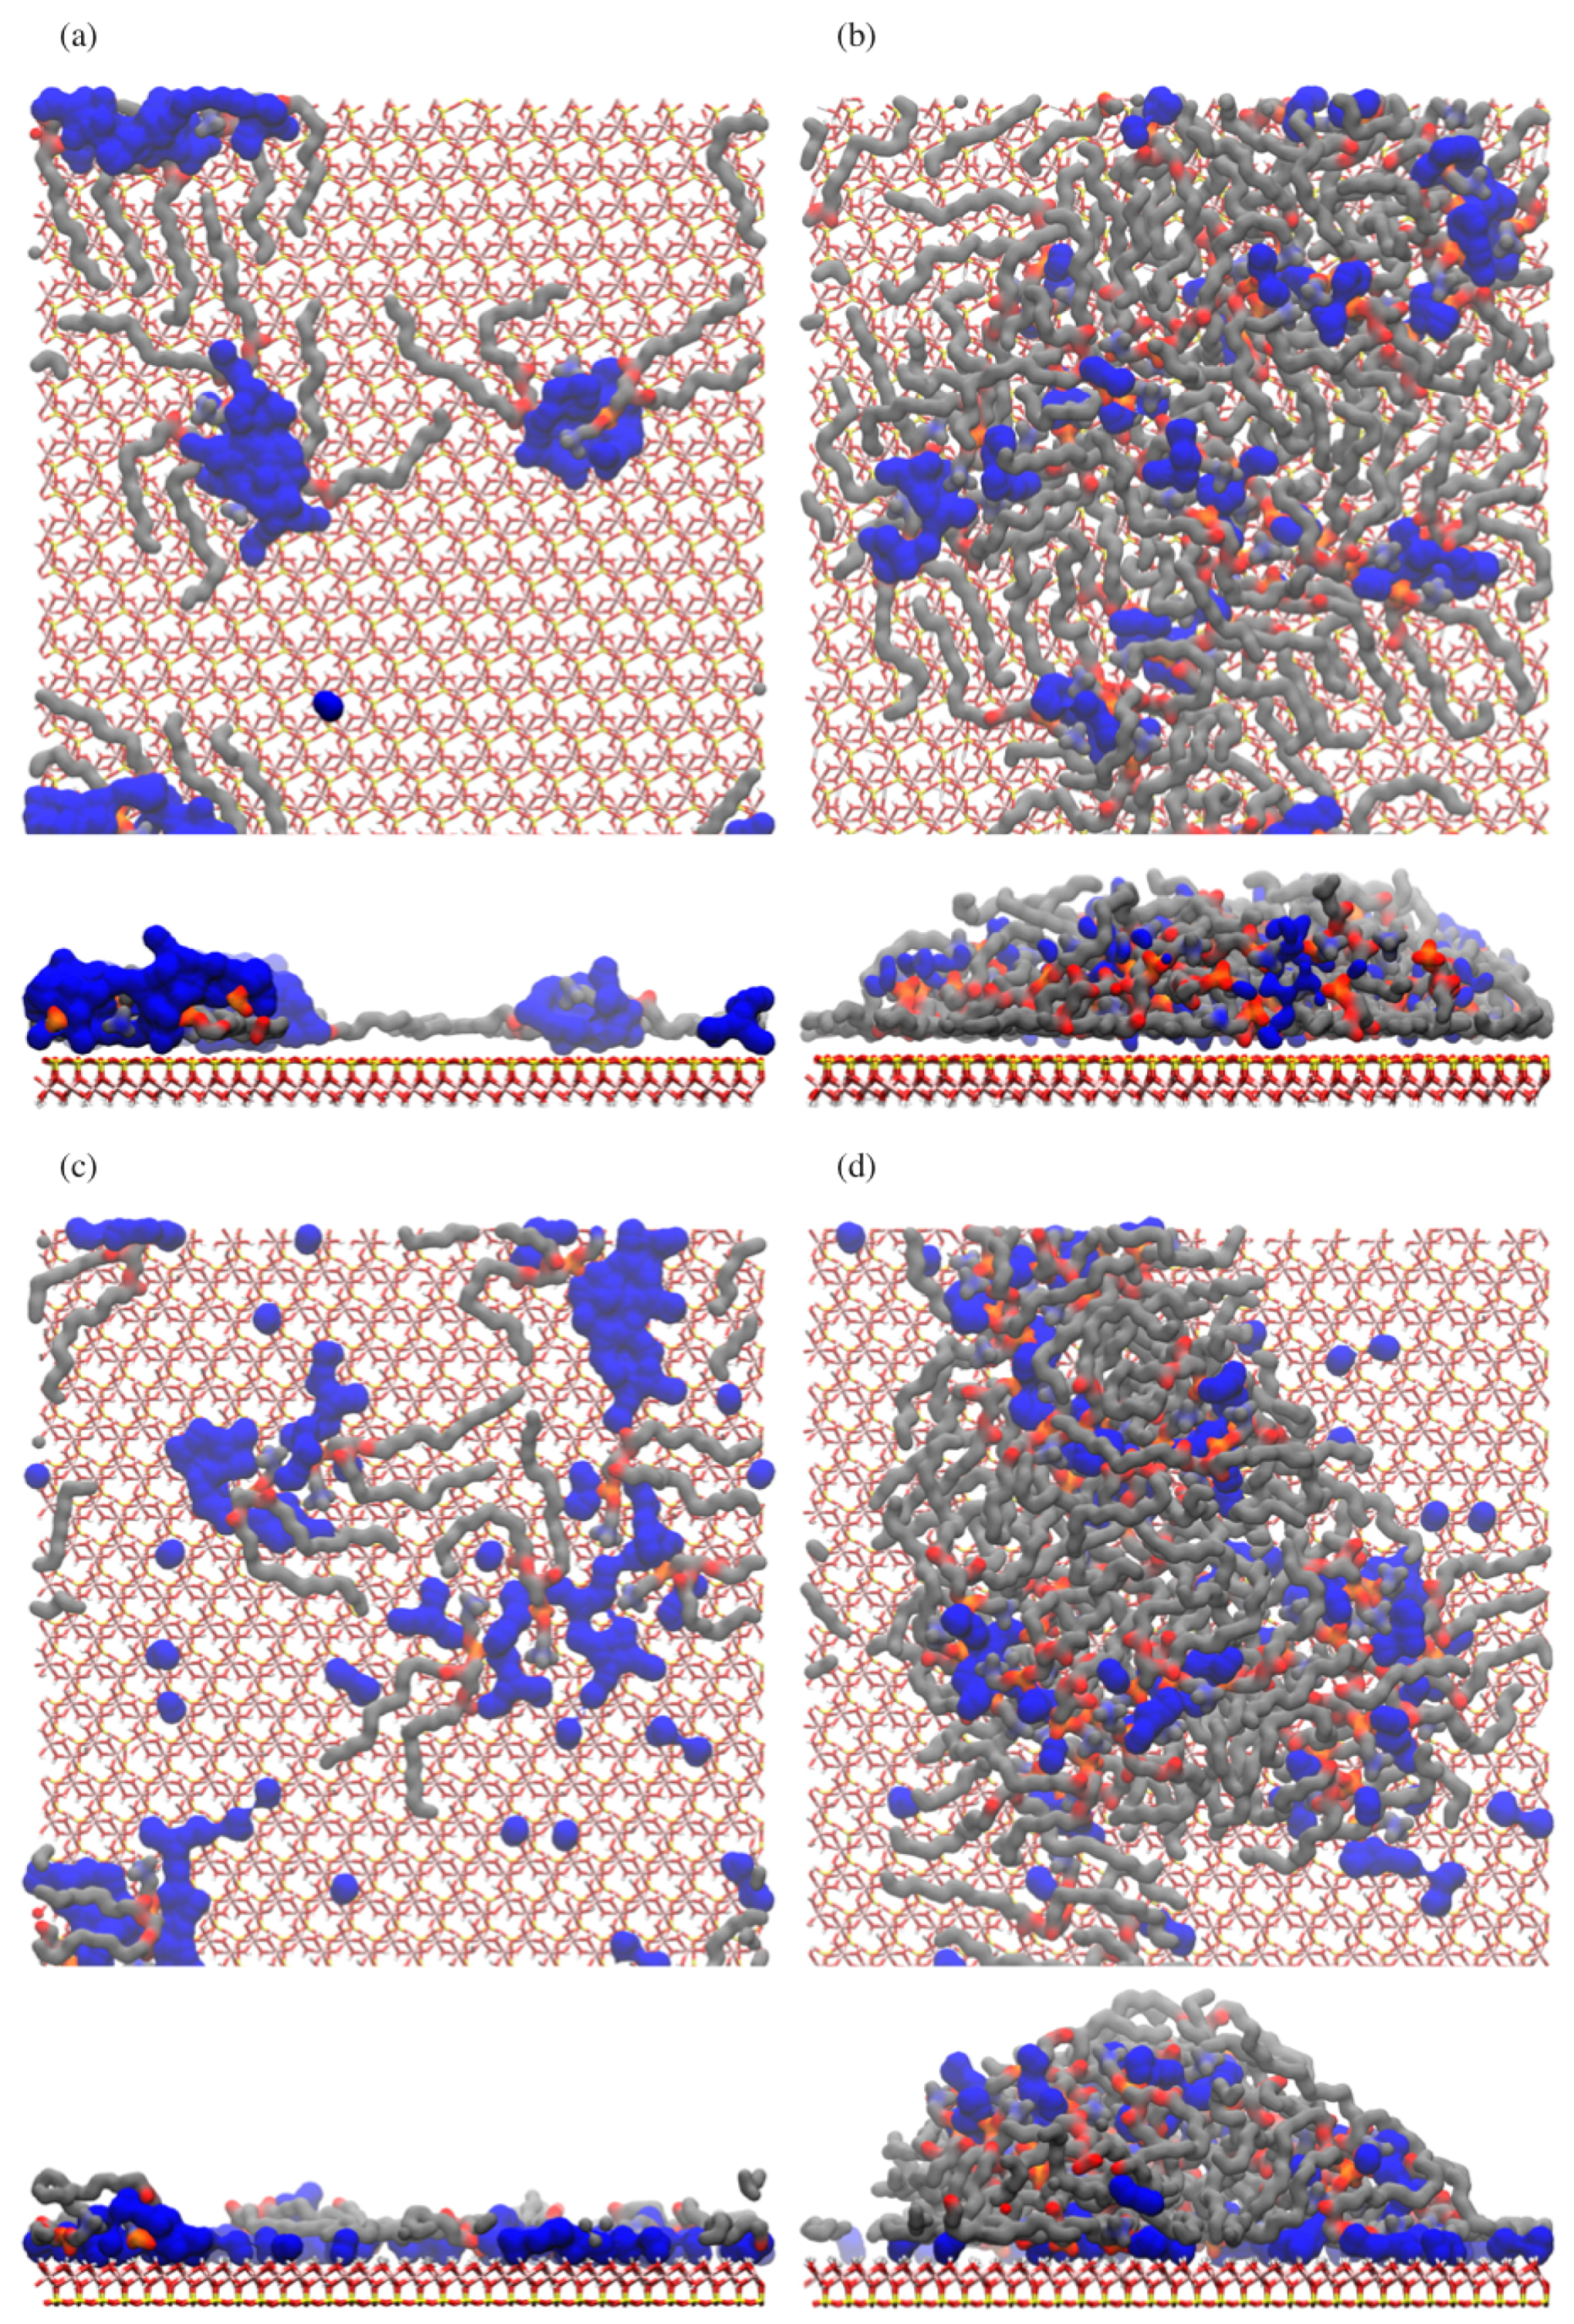
It is worth noting that for surface loading n = 10 , the POPC molecules usually group into clusters of 2 to 5 individual molecules at the hydrophobic siloxane surface (cf. Figure 5a for illustration). These clusters are stabilized via the mutual electrostatic interactions of the zwitterionic heads and by the presence of residual water molecules surrounding them. Simultaneously, the hydrophobic tails maximize their contact with the surface by pushing the POPC clusters towards the surface. This explains why already at surface loading of n = 10 the orientation of the zwitterionic head groups in the nearest proximity to the surface adopt values close to 90 .
As the POPC molecules begin to occupy most of the available surface, another trend becomes visible. While the hydrophobic surface is causing both the layer of the heads as well as the tails to expand (very likely due to the actual positions of the residual water molecules) a much wider spread of the center of mass occurrs at the hydrophilic surface. In principle, the POPC molecules can adopt almost any orientation and the overall conformation can be characterized as a random coil.

3.3. Internal Order

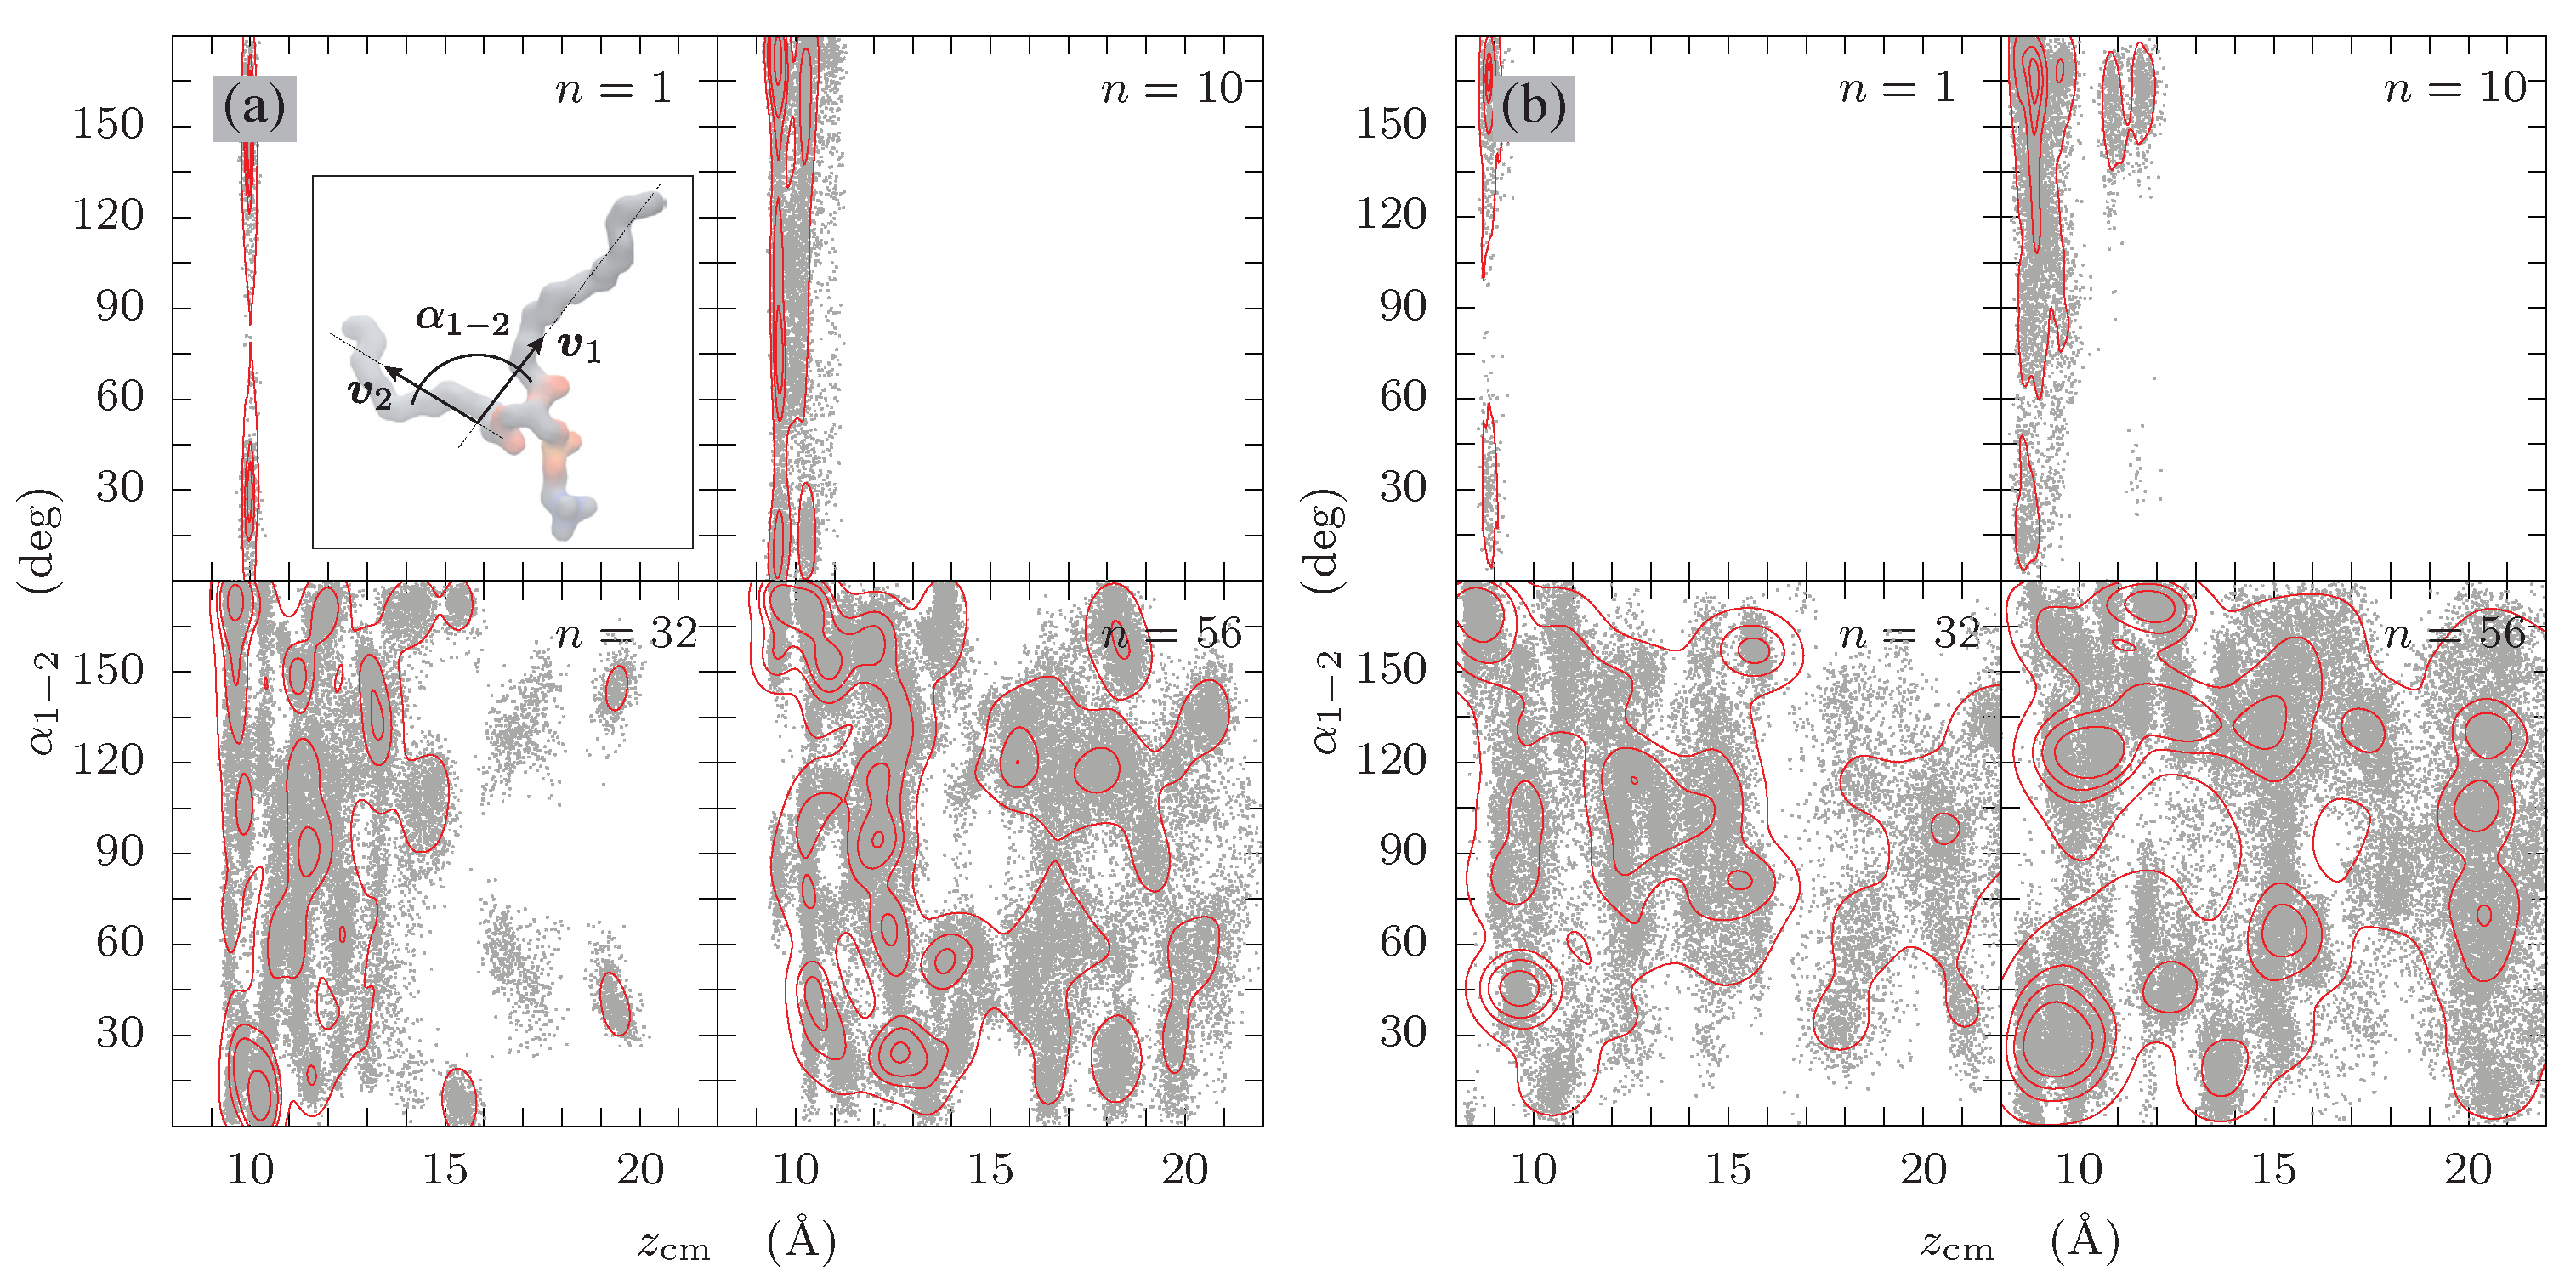
Figure 3 shows the internal tail–tail angle α 1 2 distribution with respect to the POPC center-of-mass distance z cm from the kaolinite basal oxygens. Even at low and moderate loading ( n = 1 and 10) the POPC molecular tails can adopt almost any orientation with respect to each other, with a slight preference for about 30 and 150 , respectively. As the distributions are collected over 1 ns simulation time, it becomes clear that the tails exhibit high levels of flexibility, as defined by the relatively low energy barriers of bond angles and dihedrals within the OPLS–AA force field. At high surface loadings, the internal tail–tail angles α 1 2 can adopt almost any orientation.
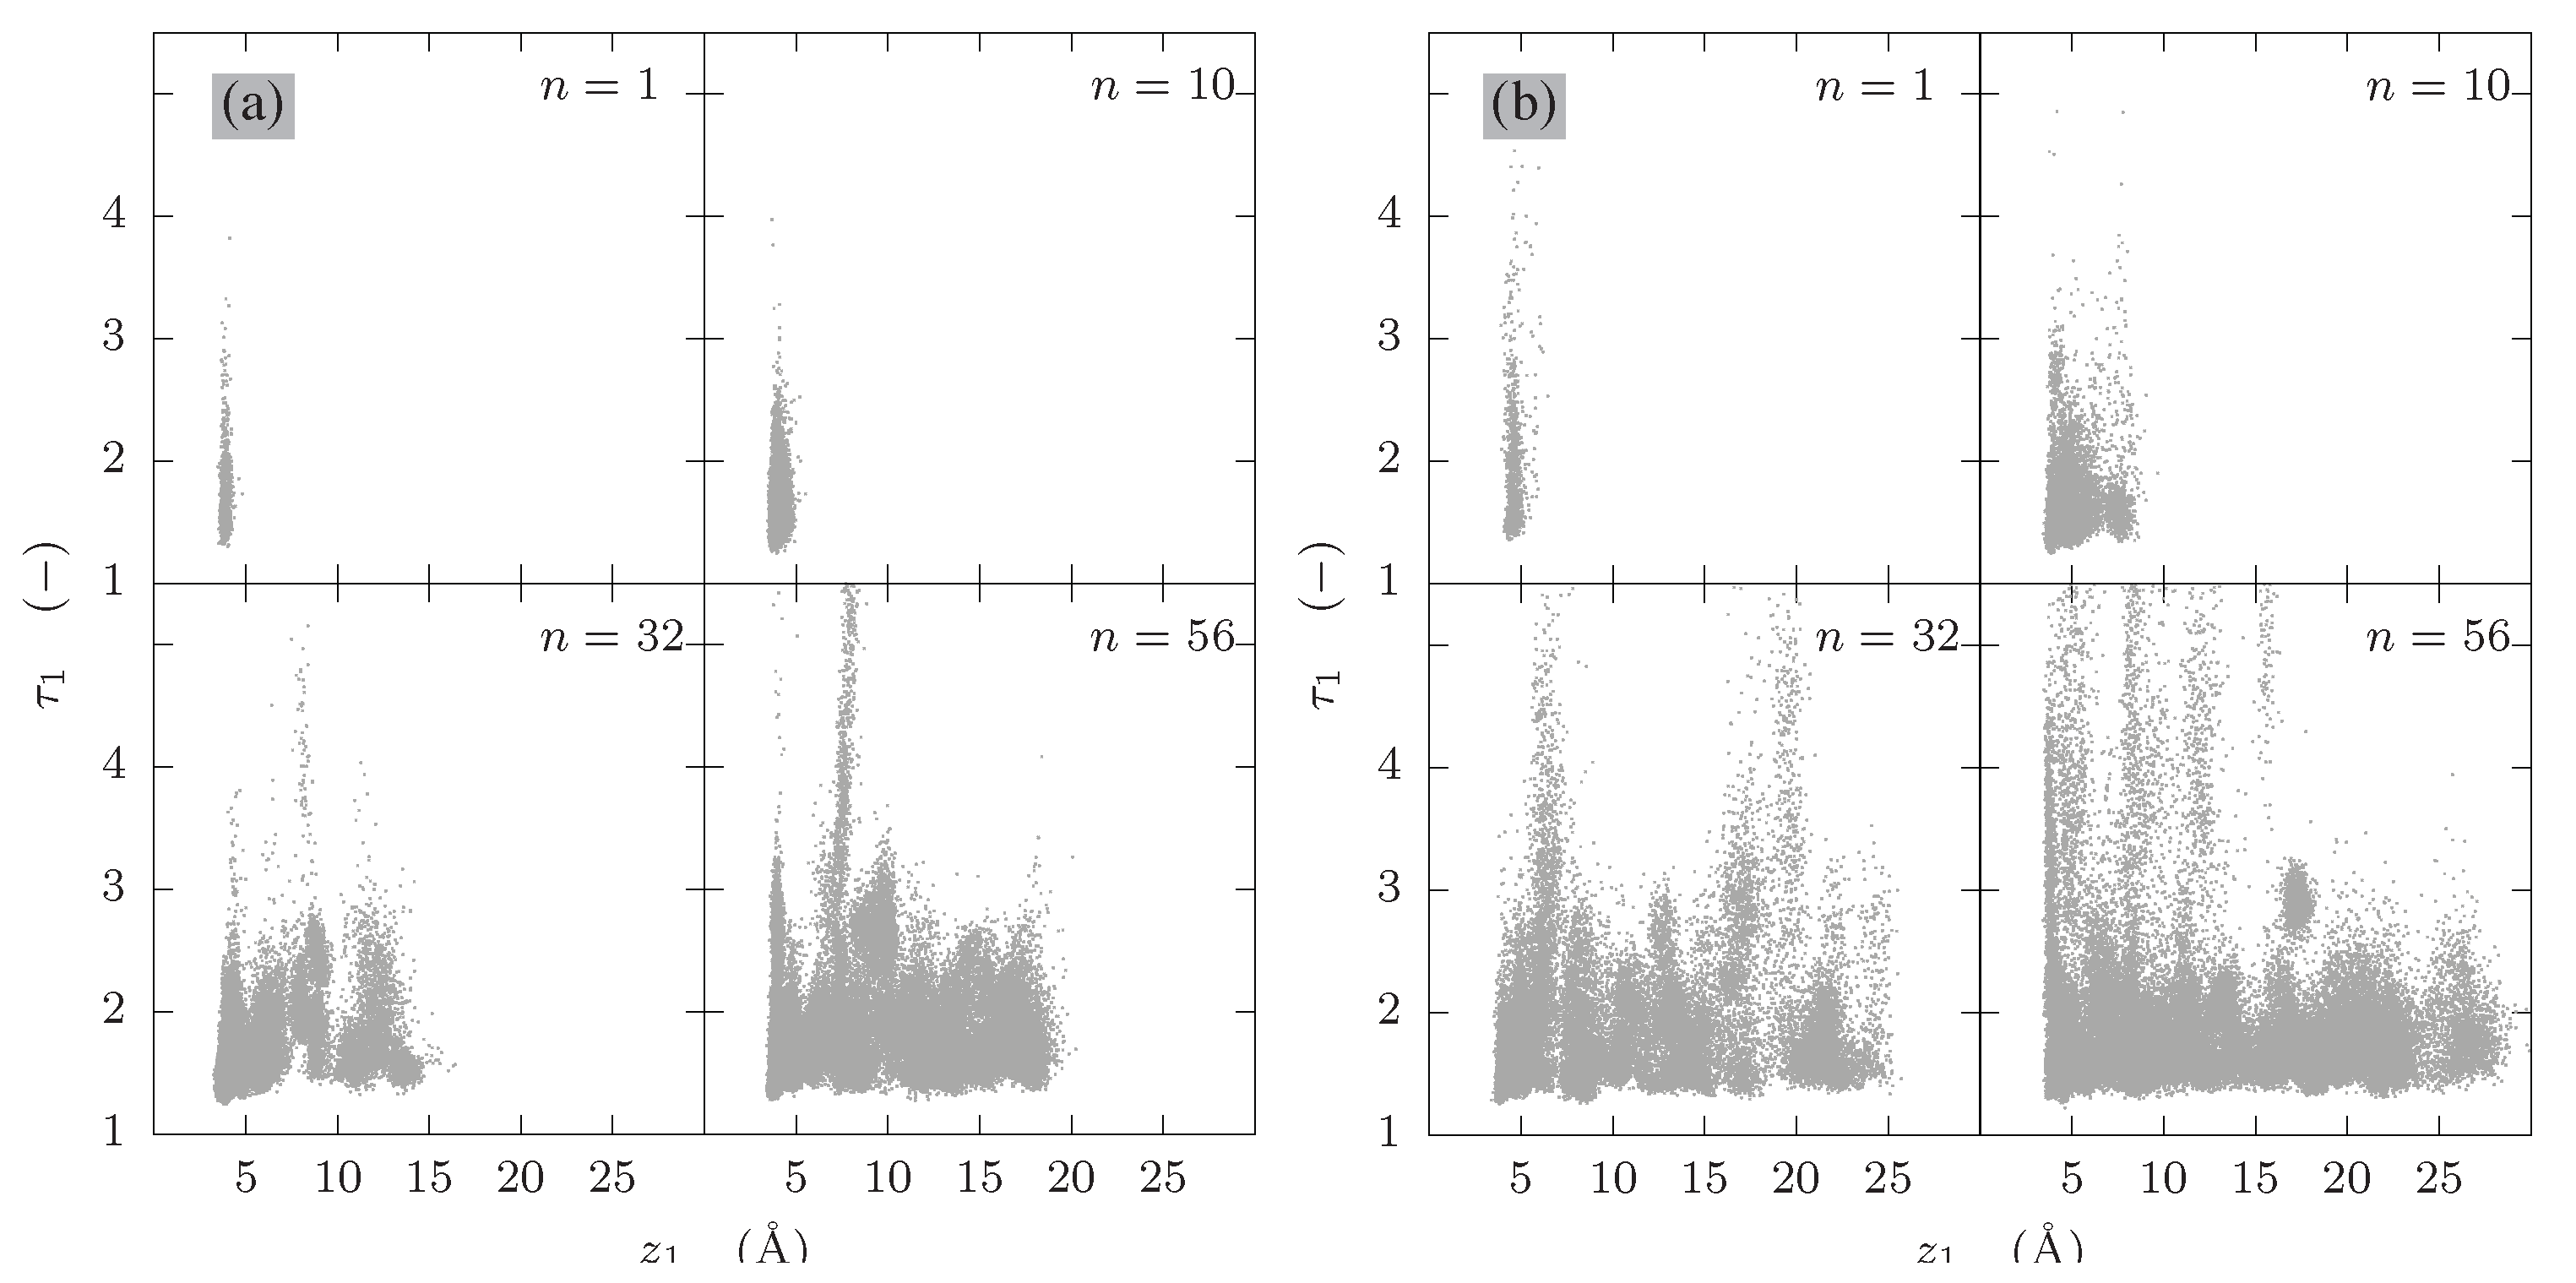
Another important measure of the internal order of the POPC molecules is their curvature, expressed through the so-called tortuosity parameter τ i , calculated as the ratio between the bond-to-bond accumulative tail fragment length l i BB and the Euclidean distance between the first and last carbon l i of i-th tail fragment ( τ i = l i BB / l i ), respectively. It is important to note that the reference value of an OPLS-AA optimized tail is 1.2 . Figure 4 shows the tortuosity parameter of the oleic acid tail fragment at both kaolinite surfaces. Regardless of surface loading or type of kaolinite surface, the majority of the tail tortuosities exceeds the reference value, hence adopting at least a partially folded conformation.

3.4. Residual Water Distribution

Figure 5 shows snapshots of both types of kaolinite surfaces at moderate ( n = 10 ) and high ( n = 56 ) surface loadings. Hydrophobic siloxane surface (Figure 5a,b) causes the residual water molecules to form relatively large confined clusters around the hydrophilic head groups of the POPC molecules. On the other hand, at hydrophilic surfaces (Figure 5c,d), the residual water molecules are more evenly distributed, avoiding contact with the hydrophobic POPC tails. Further, the height and the density of the POPC deposits differ significantly in both cases, minimizing the contact area between hydrophobic and hydrophilic moieties.

3.5. Interaction Energies

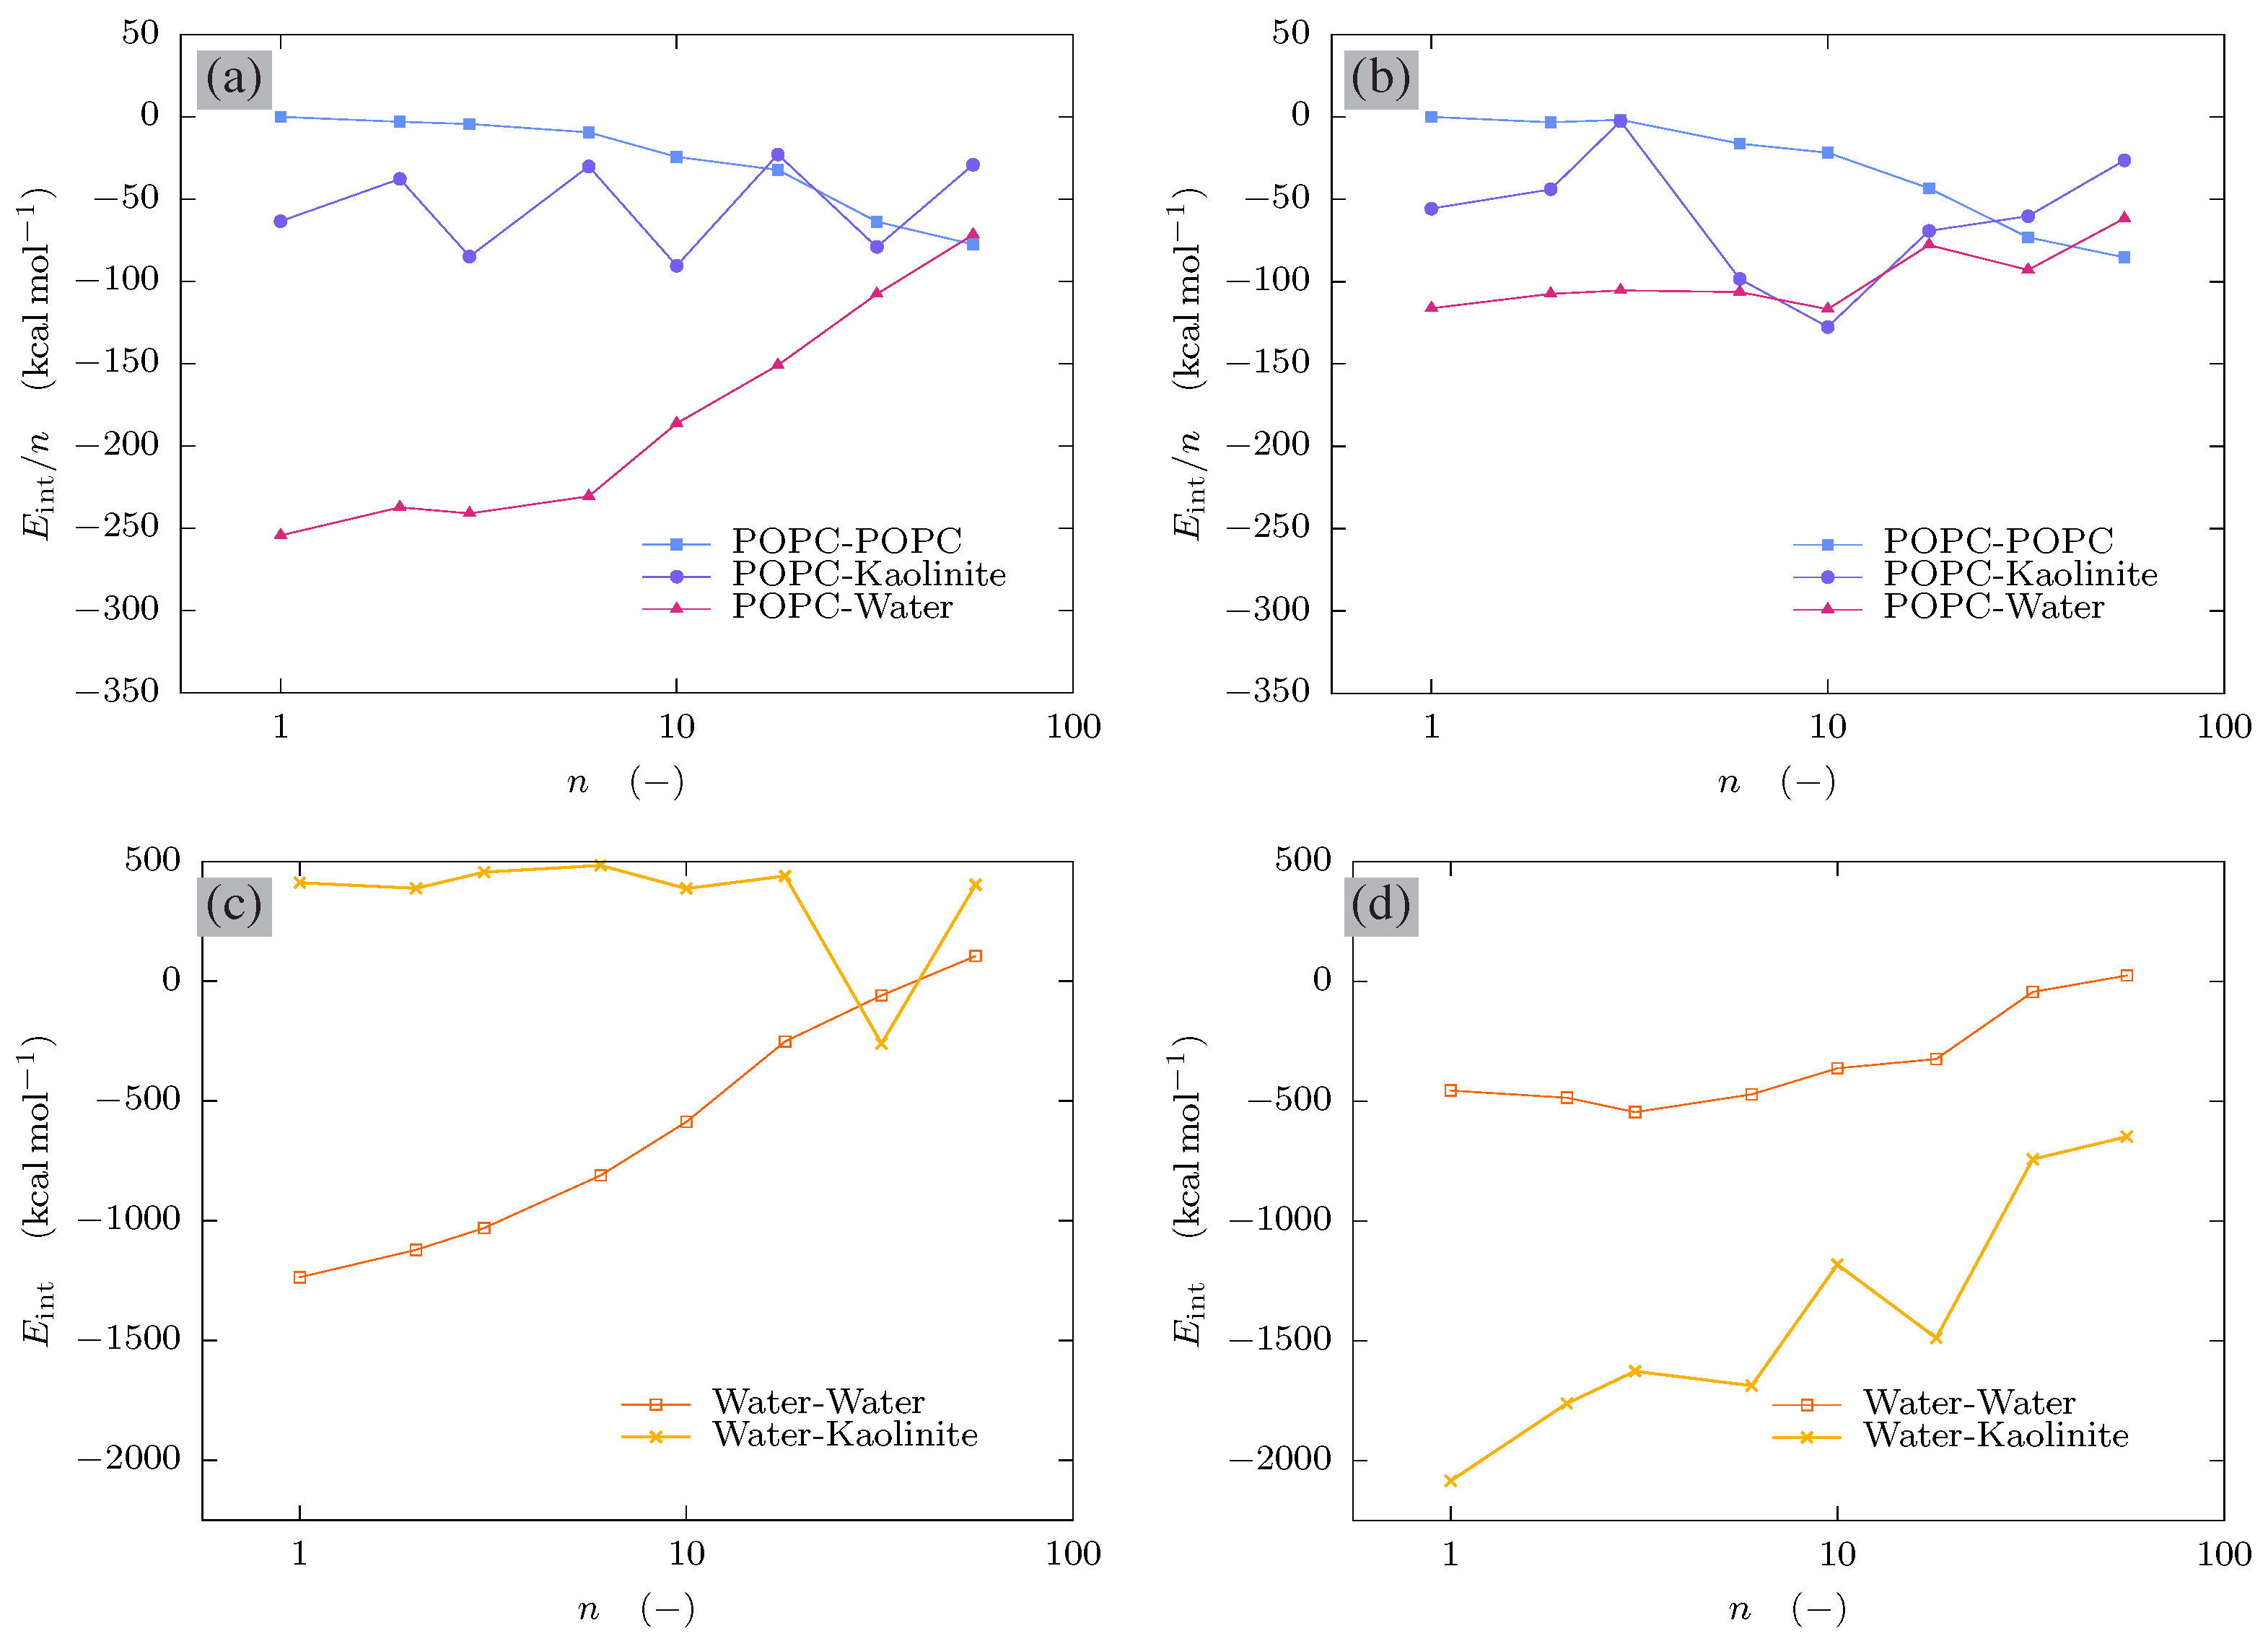
Figure 6 displays the interaction energies of various pair moieties with respect to the surface loading n (note that since the total number of molecules remains constant regardless the n value, the interaction energies involving only the residual water molecules and kaolinite are displayed separately and are not weighted by the POPC surface loading parameter n). The energies correspond to the sum of intermolecular Van der Waals and electrostatic interactions. Intramolecular potential energy contributions are not included. The displayed mean values are calculated over the 1000 selected snapshots of the equilibrated system within the production phase.
The major difference between the two kaolinite surfaces is most visible on the interaction energies between the water molecules and the kaolinite clay surface. For the hydrophobic siloxane kaolinite surface, the water molecules are clearly repelled by the surface, only at the highest loadings ( n = 32 and 56) their interactions become stabilized by the presence of large number of the POPC molecules.
The different slopes between the water–water interaction energies for the two kaolinite surfaces suggest that the number of directly interacting water molecules is greater at lower POPC loadings at the hydrophobic siloxane surface. Similarly, the interaction of water and POPC molecules is much stronger in the case of the hydrophobic siloxane kaolinite surface.
The difference in lines representing the mutual POPC interaction energies is negligible. A relatively large volume occupied by the POPC can be characterized as hydrophobic due to the size and length of the hydrophobic aliphatic tails. As a consequence, the interaction energies of POPC at the hydrophilic alumina surface at moderate and high surface loadings suggest that repulsive forces dominate. Similarly, the interaction energies between water and the POPC molecules are much stronger in the case of the hydrophobic siloxane kaolinite surface.
Overall, it can be stated that the forces responsible of the POPC-kaolinite bioclay have different nature depending on the surface characteristics. While for the hydrophobic siloxane kaolinite surface, the POPC molecules bind via hydrophobic interactions; for the hydrophilic alumina kaolinite surface, the major stabilizing factors are electrostatic forces acting between the polar atoms and charged groups as well as hydrogen bonds.
This contrasts with our previous findings on POPC–montmorillonite interactions [29]. Although the hydrophobic siloxane kaolinite consists of the same structural building blocks as the outer surface(s) of the clay mineral montmorillonite, the major difference in binding is the absence of an overall net long-range electrostatic charge that would stabilize the mineral–POPC zwitterionic head interactions and dictate the arrangement of the POPC molecule residual tails.

4. Conclusions

Relatively stable composites based on the combination of kaolinite and naturally occurring surfactant POPC can be formed. The results indicate that the POPC molecules bind to the kaolinite surface either via their hydrophilic zwitterionic heads or hydrophobic tails depending on the characteristics of the corresponding surface. The POPC molecules exhibit the tendency to form layers in which a parallel orientation with respect to the kaolinite surface dominates. The geometry and internal degrees of freedom of the relatively flexible tails vary strongly, depending on their distance from the kaolinite surface and the kaolinite surface characteristics. In addition, the residual water distribution and its stabilizing effect differs strongly with the kaolinite surface characteristics.
Similar to their organoclays predecessors, bioorganoclays based on the combination of naturally occurring surfactants such as POPC molecules and kaolinite are expected to exhibit similar adsorption capacities for anionic and non-polar organic contaminants which makes them an environmentally-friendly alternative, the constituents of which are both abundant and relatively cheap. Finally, studies that involve natural surfactant molecules and reactive surfaces could potentially reveal novel pathways for the preparation of, for example, new polymer matrices or drug-carrying nano- and microparticles for medical use.

Author Contributions

Conceptualization, P.G. and D.T.; methodology, P.G. and D.T.; software, P.G.; validation, P.G.; formal analysis, P.G.; investigation, P.G.; resources, D.T.; data curation, P.G. and D.T.; writing—original draft preparation, P.G.; writing—review and editing, P.G. and D.T.; visualization, P.G.; supervision, D.T.; project administration, D.T.; funding acquisition, D.T. Both authors have read and agreed to the published version of the manuscript.

Funding

This research was funded by the bilateral FWF-DFG project No. (Bioclays, 2017–2020) grant number I3263-N34. Computational resources were provided by the Vienna Scientific Cluster (VSC), project No. 70544.

Conflicts of Interest

The funders had no role in the design of the study; in the collection, analyses, or interpretation of data; in the writing of the manuscript, or in the decision to publish the results.

References

  1. Nafees, M.; Waseem, A. Organoclays as Sorbent Material for Phenolic Compounds: A Review. CLEAN—Soil Air Water 2014, 42, 1500–1508. [Google Scholar] [CrossRef]
  2. Lee, S.M.; Tiwari, D. Organo and Inorgano-Organo-Modified Clays in the Remediation of Aqueous Solutions: An Overview. Appl. Clay Sci. 2012, 59–60, 84–102. [Google Scholar] [CrossRef]
  3. Fornes, T.D.; Yoon, P.J.; Keskkula, H.; Paul, D.R. Nylon 6 Nanocomposites: The Effect of Matrix Molecular Weight. Polymer 2001, 42, 09929–09940. [Google Scholar] [CrossRef]
  4. Hedley, C.B.; Yuan, G.; Theng, B.K.G. Thermal Analysis of Montmorillonites Modified with Quaternary Phosphonium and Ammonium Surfactants. Appl. Clay Sci. 2007, 35, 180–188. [Google Scholar] [CrossRef]
  5. Lagaly, G.; Dékany, I. Adsorption on Hydrophobized Surfaces: Clusters and Self-Organization. Adv. Colloid Interface Sci. 2005, 114–115, 189–204. [Google Scholar] [CrossRef]
  6. Koh, S.M.; Song, M.; Takagi, T. Mineralogy, Chemical Characteristics and Stabilities of Cetylpyridinium-Exchanged Smectite. Clay Miner. 2005, 40, 213–222. [Google Scholar] [CrossRef]
  7. He, H.; Zhou, Q.; Martens, W.N.; Kloprogge, T.J.; Yuan, P.; Xi, Y.; Zhu, J.; Frost, R.L. Microstructure of HDTMA+-Modified Montmorillonite and its Influence on Sorption Characteristics. Clays Clay Miner. 2006, 54, 689–696. [Google Scholar] [CrossRef] [Green Version]
  8. Dultz, S.; Riebe, B.; Bunnenberg, C. Temperature Effects on Iodine Adsorption on Organo-Clay Minerals. II. Structural effects. Appl. Clay Sci. 2005, 28, 17–30. [Google Scholar] [CrossRef]
  9. Park, Y.; Ayoko, G.A.; Horvath, E.; Kurdi, R.; Kristof, J.; Frost, R.L. Structural Characterisation and Environmental Application of Organoclays for the Removal of Phenolic Compounds. J. Colloid Interface Sci. 2013, 393, 319–334. [Google Scholar] [CrossRef] [Green Version]
  10. Lee, S.Y.; Kim, S.J. Expansion Characteristics of Organoclay as a Precursor to Nanocomposites. Colloids Surfaces A Physicochem. Eng. Asp. 2002, 211, 19–26. [Google Scholar] [CrossRef]
  11. Schampera, B.; Dultz, S. Determination of Diffusive Transport in HDPy-Montmorillonite by H2O-D2O Exchange Using in situ ATR-FTIR Spectroscopy. Clay Miner. 2009, 44, 249–266. [Google Scholar] [CrossRef]
  12. Sun, H.; Zhang, J.; Li, L.; Xu, J.; Sun, D. Surface Modification of Natural Na-Montmorillonite in Alkane Solvents Using a Quaternary Ammonium Surfactant. Colloids Surfaces A Physicochem. Eng. Asp. 2013, 426, 26–32. [Google Scholar] [CrossRef]
  13. Schampera, B.; Šolc, R.; Tunega, D.; Dultz, S. Experimental and Molecular Dynamics Study on Anion Diffusion in Organically Modified Bentonite. Appl. Clay Sci. 2016, 120, 91–100. [Google Scholar] [CrossRef]
  14. Schampera, B.; Šolc, R.; Woche, S.K.; Mikutta, R.; Dultz, S.; Guggenberger, G.; Tunega, D. Surface Structure of Organoclays as Examined by X-ray Photoelectron Spectroscopy and Molecular Dynamics Simulations. Clay Miner. 2015, 50, 353–367. [Google Scholar] [CrossRef]
  15. Heinz, H.; Suter, U.W. Surface Structure of Organoclays. Angew. Chem. Int. Ed. 2004, 43, 2239–2243. [Google Scholar] [CrossRef] [Green Version]
  16. He, H.; Ding, Z.; Zhu, J.; Yan, P.; Xi, Y.; Yang, D.; Frost, R.L. Thermal Characteristics of Surfactant Modified Montmorillonites. Clays Clay Miner. 2005, 53, 287–293. [Google Scholar] [CrossRef]
  17. Heinz, H.; Vaia, R.A.; Krishnamoorti, R.; Farmer, B.L. Self-Assembly of Alkylammonium Chains on Montmorillonite: Effect of Chain Length, Head Group Structure, and Cation Exchange Capacity. Chem. Mater. 2007, 19, 59–68. [Google Scholar] [CrossRef]
  18. Heinz, H.; Lin, T.J.; Kishore Mishra, R.; Emami, F.S. Thermodynamically Consistent Force Fields for the Assembly of Inorganic, Organic, and Biological Nanostructures: The INTERFACE Force Field. Langmuir 2013, 29, 1754–1765. [Google Scholar] [CrossRef] [PubMed]
  19. Heinz, H.; Castelijns, H.J.; Suter, U.W. Structure and Phase Transitions of Alkyl Chains on Mica. J. Am. Chem. Soc. 2003, 125, 9500–9510. [Google Scholar] [CrossRef] [PubMed] [Green Version]
  20. Zeng, Q.H.; Yu, A.B.; Lu, G.Q. Molecular Dynamics Simulation of the Structural and Dynamic Properties of Dioctadecyldimethylammonium in Organoclays. J. Phys. Chem. B 2004, 108, 10025–10033. [Google Scholar] [CrossRef]
  21. Fu, Y.T.; Heinz, H. Cleavage Energy of Alkylammonium-Modified Montmorillonite and Relation to Exfoliation in Nanocomposites: Influence of Cation Density, Head Group Structure, and Chain Length. Chem. Mater. 2010, 22, 1595–1605. [Google Scholar] [CrossRef]
  22. Zhao, Q.; Burns, S.E. Modelling Sorption and Diffusion of Organic Sorbate in Hexadecyltrimethylammonium-Modified Clay Nanopores—A Molecular Dynamics Simulation Study. Environ. Sci. Technol. 2013, 47, 2769–2776. [Google Scholar] [CrossRef]
  23. Schampera, B.; Tunega, D.; Šolc, R.; Woche, S.K.; Mikutta, R.; Wirth, R.; Dultz, S.; Guggenberger, G. External Surface Structure of Organoclays Analyzed by Transmission Electron Microscopy and X-ray Photoelectron Spectroscopy in Combination with Molecular Dynamics Simulations. J. Colloid Interface Sci. 2016, 478, 188–200. [Google Scholar] [CrossRef] [PubMed]
  24. Scholtzová, E.; Tunega, D. Density Functional Theory Study of the Stability of the Tetrabutylphosphonium and Tetrabutylammonium. Clay Miner. 2019, 54, 41–48. [Google Scholar] [CrossRef]
  25. Ferfera-Harrar, H.; Dairi, N. Elaboration of Cellulose Acetate Nanobiocomposites Using Acidified Gelatin-Montmorillonite as Nanofiller: Morphology, Properties, and Biodegradation Studies. Polym. Compos. 2013, 34, 1515–1524. [Google Scholar] [CrossRef]
  26. Wicklein, B.; Darder, M.; Aranda, P.; Ruiz-Hitzky, E. Bio-Organoclays Based on Phospholipids as Immobilization Hosts for Biological Species. Langmuir 2010, 26, 5217–5225. [Google Scholar] [CrossRef]
  27. Nagy, K.; Bíró, G.; Berkesi, O.; Benczédi, D.; Ouali, L.; Dékány, I. Intercalation of Lecithins for Preparation of Layered Nanohybrid Materials and Adsorption of Limonene. Appl. Clay Sci. 2013, 72, 155–162. [Google Scholar] [CrossRef]
  28. Merino, D.; Ollier, R.; Lanfranconi, M.; Alvarez, V. Preparation and Characterization of Soy Lecithin-Modified Bentonites. Appl. Clay Sci. 2016, 127–128, 17–22. [Google Scholar] [CrossRef]
  29. Grančič, P.; Tunega, D. Geometry and Molecular Arrangement of Phosphatidylcholine-Montmorillonite Bioclays via Classical Molecular Dynamics Simulation. Appl. Clay Sci. 2020, 198, 105815. [Google Scholar] [CrossRef]
  30. Gaylor, M.O.; Miro, P.; Vlaisavljevich, B.; Kondage, A.A.S.; Barge, L.M.; Omran, A.; Videau, P.; Swenson, V.A.; Leinen, L.J.; Fitch, N.W.; et al. Plausible Emergence and Self Assembly of a Primitive Phospholipid from Reduced Phosphorus on the Primordial Earth. Orig. Life Evol. Biosph. 2021. [Google Scholar] [CrossRef]
  31. Schoonheydt, R.; Johnston, C. Surface and Interface Chemistry of Clay Minerals. In Handbook of Clay Science; Bergaya, F., Lagaly, G., Eds.; Developments in Clay Science; Elsevier: Amsterdam, The Netherlands, 2013; Volume 5, pp. 139–172. [Google Scholar] [CrossRef]
  32. Ma, C.; Eggleton, R.A. Cation Exchange Capacity of Kaolinite. Clays Clay Miner. 1999, 47, 174–180. [Google Scholar] [CrossRef]
  33. Kahr, G.; Madsen, F. Determination of the Cation Exchange Capacity and the Surface Area of Bentonite, Illite and Kaolinite by Methylene Blue Adsorption. Appl. Clay Sci. 1995, 9, 327–336. [Google Scholar] [CrossRef]
  34. Plimpton, S. Fast Parallel Algorithms for Short–Range Molecular Dynamics. J. Comput. Phys. 1995, 117, 1–19. [Google Scholar] [CrossRef] [Green Version]
  35. Bish, D.L. Rietveld Refinement of the Kaolinite Structure at 1.5 K. Clays Clay Miner. 1993, 41, 738–744. [Google Scholar] [CrossRef]
  36. Hestenes, M.R.; Stiefel, E. Methods of Conjugate Gradients for Solving Linear Systems. J. Res. Natl. Bur. Stand. 1952, 49, 409–436. [Google Scholar] [CrossRef]
  37. Scholzová, E.; Tunega, D.; Madejová, J.; Pálková, H.; Komadel, P. Theoretical and Experimental Study of Montmorillonite Intercalated with Tetramethylammonium Cation. Vib. Spectrosc. 2013, 66, 123–131. [Google Scholar] [CrossRef]
  38. Hoover, W.G. Canonical Dynamics: Equilibrium Phase-Space Distributions. Phys. Rev. A 1985, 31, 1695–1697. [Google Scholar] [CrossRef] [PubMed] [Green Version]
  39. Nosé, S. A Unified Formulation of the Constant Temperature Molecular Dynamics Methods. J. Chem. Phys. 1984, 81, 511–519. [Google Scholar] [CrossRef] [Green Version]
  40. Verlet, L. Computer “Experiments” on Classical Fluids. I. Thermodynamical Properties of Lennard-Jones Molecules. Phys. Rev. 1967, 159, 98–103. [Google Scholar] [CrossRef]
  41. Hockney, R.W.; Eastwood, J.W. Particle-Particle/Particle-Mesh Algorithms. In Computer Simulation Using Particles; CRC Press: Boca Raton, FL, USA, 1988; pp. 267–304. [Google Scholar]
  42. Yeh, I.C.; Berkowitz, M.L. Ewald Summation for Systems with Slab Geometry. J. Chem. Phys. 1999, 111, 3155. [Google Scholar] [CrossRef]
  43. Cygan, R.T.; Liang, J.J.; Kalinichev, A.G. Molecular Models of Hydroxide, Oxyhydroxide, and Clay Phases and the Development of a General Force Field. J. Phys. Chem. B 2004, 108, 1255–1266. [Google Scholar] [CrossRef]
  44. Berendsen, H.J.; Grigera, J.R.; Straatsma, T.P. The missing term in effective pair potentials. J. Phys. Chem. 1987, 91, 6269–6271. [Google Scholar] [CrossRef]
  45. Jorgensen, W.L.; Maxwell, D.S.; Tirado-Rives, J. Development and Testing of the OPLS All-Atom Force Field on Conformational Energetics and Properties of Organic Liquids. J. Am. Chem. Soc. 1996, 118, 11225–11236. [Google Scholar] [CrossRef]
  46. Kaminski, G.A.; Friesner, R.A.; Tirado-Rives, J.; Jorgensen, W.L. Evaluation and Reparametrization of the OPLS-AA Force Field for Proteins via Comparison with Accurate Quantum Chemical Calculations on Peptides. J. Phys. Chem. B 2001, 105, 6474–6487. [Google Scholar] [CrossRef] [Green Version]
  47. Sánchez-Verdejo, T.; Undabeytia, T.; Nir, S.; Maqueda, C.; Morillo, E. Environmentally Friendly Slow Release Formulations of Alachlor Based on Clay-Phosphatidylcholine. Environ. Sci. Technol. 2008, 42, 5779–5784. [Google Scholar] [CrossRef] [PubMed] [Green Version]
Figure 1. One-dimensional density profiles δ i ( z ) of i-th atom type (with i denoting H , C , N and O w atoms, respectively). Four different setups are shown, corresponding to the hydrophobic siloxane surface without (a) and with (b) residual water molecules and to the hydrophilic alumina surface without (c) and with (d) residual water molecules, respectively. The displayed lines correspond to surface loading of n = 1 (ultramarine squares), 10 (indigo circles), 32 (magenta crosses) and 56 (orange triangles) POPC molecules per given kaolinite surface. The value z denotes the distance of the i-th atom type from the kaolinite basal surface.
Minerals 11 01102 g001
Figure 2. POPC head fragment tilt angles β 0 and β 1 versus their center-of-mass distance with respect to the kaolinite surface z 0 and z 1 at hydrophobic siloxane (a,c) and hydrophilic alumina surfaces (b,d), respectively. The red contour lines correspond to 10, 25, 50 and 90 % confidence intervals of the fitted 2-dimensional kernel densities, respectively.
Minerals 11 01102 g002
Figure 3. Internal tail-tail angle α 1 2 distribution with respect to the POPC center-of-mass distance z cm from the hydrophobic siloxane (a) and hydrophilic alumina (b) surface. The red contour lines correspond to 10, 25, 50 and 90 % confidence intervals of the fitted 2-dimensional kernel densities, respectively.
Minerals 11 01102 g003
Figure 4. Distributions of the oleic acid residual tail tortuosity τ 1 with respect to its center-of-mass distance to the kaolinite basal oxygens z 1 of the hydrophobic siloxane (a) and hydrophilic alumina (b) surface, respectively. Four different values of the surface loading parameter n are displayed.
Minerals 11 01102 g004
Figure 5. Residual water distribution (emphasized in blue) for hydrophobic siloxane (a,b) and hydrophilic alumina (c,d) kaolinite surface. The displayed snapshots correspond to moderate ( n = 10 ) and high ( n = 56 ) surface loadings.
Minerals 11 01102 g005
Figure 6. Interaction energies of various pair moieties with respect to their surface loading n for hydrophobic siloxane (a,c) and hydrophilic alumina (b,d) kaolinite surface. Displayed pair moieties correspond to POPC–POPC (ultramarine squares), POPC–kaolinite (indigo, circles), POPC–residual water (magenta triangles), residual water–residual water (orange empty squares) and residual water–kaolinite (gold crosses), respectively.
Minerals 11 01102 g006
Publisher’s Note: MDPI stays neutral with regard to jurisdictional claims in published maps and institutional affiliations.