1. Introduction
Hot dry rock (HDR) is an efficient and clean source of renewable energy with great potential and has attracted the interests of geologists and geophysicists. HDRs can be found buried deep in the Earth’s interior, at temperatures higher than 180 °C, and contain little fluid. The most important application of this resource is in the generation of the electricity from heat [
1,
2].
In recent years, the mining and exploration of HDR have been developed rapidly, following technological and theoretical advancements. From investigations, the lithology of HDR geothermal resources has been concluded to be dominated by granite at a depth of 1500–5000 m in the Enhanced Geothermal System (EGS) [
3]. Furthermore, similar to the “source–reservoir–cap combination” hydrocarbon accumulation theory of oil and gas, the sedimentary layer with low thermal conductivity, which is dominated by sandstone and mudstone, has been inferred to be a natural high-quality caprock. Normally, the resistivity of granite is high (100–10,000 Ω·m) relative to that of sandstone and mudstone (0.1–100 Ω·m). Thus, resistivity can be seen as a key feature in distinguishing between a granite body and caprock. Furthermore, the target HDR ore body can usually be extracted from the surrounding granite for its higher resistivity, because of the negligible fluid and higher temperature [
4].
In mineral exploration, the electromagnetic (EM) method is commonly seen as one of the most important and indispensable methods. In recent years, researchers have achieved remarkable results in the application of EM for the HDR detection. In 1980, Ander applied the magnetotelluric (MT) method and the controlled source audio magnetotelluric (CSAMT) method for the first time to detect HDR on a large scale in New Mexico [
5]. Suzuki et al. [
6] combined the seismic and CSAMT methods to obtain information about an HDR reservoir. Volpi et al. [
7] utilized the MT method to study the structure of deep heat sources in Italy. Thiel et al. [
8] used the 3D-MT to validate caprock and HDR reservoirs in Australian Paralana, and Haieda and Suzuki [
9] used the CSAMT and transient electromagnetic (TEM) methods to detect the electrical structure of HDRs in Southern Australia.
Since 2010, the field of HDR exploration has rapidly developed in China. The related survey data show that China has potential HDR resources, which amount to about 856 trillion tons of standard coal [
10]. The temperature at a drilling depth of 3705 m in the well GR1 in Gonghe Basin, which is the first experimental area for key technology research on HDR exploration in China, was about 236 °C [
11]. Sun et al. [
12] inferred the basement interface of the Gonghe Basin using seismic reflection and CSAMT methods. Subsequently, Xue et al. [
13] used shallow temperature measurements, deep well temperature measurement, aeromagnetic data, gravity data, and CSAMT to evaluate HDRs in the Gonghe and Guide Basins, Qinghai. In terms of the MT method, Wang et al. [
14] discussed the deep electrical characteristics of the Guinan area and Tang et al. (2020) [
15] explored the deep heat source mechanisms of the Gonghe Basin.
The MT method uses a weak and random natural electromagnetic field for exploration at greater depths (up to 10–20 km), but its disadvantages include a low resolution and a weak anti-interference capability. In contrast, artificial sources are used in the CSAMT method, which make up for the energy shortage in natural electromagnetic fields and greatly improve the signal strength. In the CSAMT method, the Cagniard formula used to calculate apparent resistivity
can be expressed as follows [
16,
17]:
where
Ex is the approximated electric field component in the
x direction,
Hy is the approximated magnetic field component in the
y direction,
ω represents the circular frequency and
μ represents the permeability.
However, with a penetrating depth reaching 1.5 km, the resolution and accuracy of the CSAMT method are sharply reduced [
18]. In order to locate thermal storages and to explore for HDRs at greater depths, further improvements to the geophysical exploration methods and technologies for deep HDR ore bodies are needed.
The wide-field electromagnetic (WFEM) method also uses an artificial source of frequency domain sounding [
19]. Due to the difference in resistivity between rocks and stratums, the WEFM method can identify resistivity anomalies underground and then can be applied to infer the lithology distribution of rock formations. In these respects, the WFEM method has accumulated a large amount of data and has obtained good effects [
20,
21,
22,
23].
In this paper, the WFEM method is applied to detect HDRs in the Gonghe Basin for explorations at greater depths and at high resolutions. Besides distinguishing between granite and sand/mudstone caps based on anomalous resistivity, we first extracted the HDR from the surrounding granite by analyzing the relationship between inversion resistivity and granite temperature derived from the drilling well data. Our results help target the HDR area and help determine the areas with mining potential.
2. Geological Setting in the Gonghe Basin Area
The Gonghe Basin is located at the northeastern edge of the Tibet Plateau, which is at the junction between the Middle East Kunlun and the West Qinling orogens of the Qinling–Qilian–Kunlun fold system. This basin is surrounded by uplifts with fault–fold belts, and then, the abundant regional tectonic activities provide geo-dynamic conditions for the formation of HDR resources. Until now, more than 80 hot springs have been reported in the basin. The high-temperature hot springs discovered are mainly situated along the north–south fault zone on the east and west sides of the basin as a series of beads [
24]. The Gonghe Basin is a faulted basin that developed during the Mesozoic and Cenozoic and that spread in a north-west–west direction. The overall trend is that the west is thicker and the east is thinner. The basin is deposited with Triassic (T), Paleogene (E), Neogene (N), and Quaternary (Q). The intrusive rocks are mainly Indosinian-Yanshanian granites that invaded into the Middle and Lower T. Two sets of hydrothermal heat reservoirs, including the Lower E and the N thermal reservoirs, and the Indosinian granite HDR thermal reservoirs developed in the basin.
As shown in
Figure 1, the study area lies in the Qiabuqia geothermal field on the northeastern edge of the Cheji Sag in Gonghe Basin and has a relatively flat structure. The field is mainly deposited with Middle Pleistocene Gonghe Formations (
, Miocene Xianshuihe Formations and Pliocene Linxia Formations (N
2l), and Indosinian granite (T
2–3y).
Zhang et al. measured the thermal conductivity of
and N
2l at an average of 1.59 W/(m∙k), less than 2.51 for granite in the laboratory, which constitutes a caprock of the geothermal reservoir in the Gonghe area [
25]. According to the resistivity logging data of well GR1 (as shown in
Table 1), the part shallower than 1340 m is mainly mudstone and sandstone with many aquifers with low resistivity and the part deeper than 1340 m is dominated by granite and trace mudstone with high resistivity. A difference in the resistivity of the underlying stratum in the Qiabuqia area can be inferred. This fact provides the geophysical basis to apply the WFEM method to this basin.
3. Overview of the WFEM Method
The “
E-Ex” device of the WFEM method was applied in this work, meaning that a current source formed by a pair of ground electrodes served as the field source to measure the horizontal electric field component Ex, which is parallel to the direction of the power supply electrode. The electric field Ex and the potential difference between the two electrodes (M and N) are as follows [
26,
27]:
where
I is the current intensity;
dL is the length of the electric dipole source;
i is a pure imaginary number;
r is the distance between the transmission and reception, i.e., the distance between the observation point and the center of the dipole;
is the electrical conductivity; ∅ is the angle between the direction of the electric dipole source and the vector diameter direction from the midpoint of the source to the receiving point;
is the resistivity of the Earth; k is the wave number in a uniform half-space; and
MN is the distance between the two electrodes (M and N).
By substituting (2) into (3), we obtain:
with
where
is a complex function composed of frequency, magnetic permeability, earth resistivity, and transmission distance, which reflects the propagation characteristics of electromagnetic effects in the ground, and is called the “electromagnetic effect coefficient”.
is a coefficient related only to the pole distance, which is called the “device coefficient” for extracting apparent resistivity in wide-area electromagnetic sounding.
It can be seen that, compared with the traditional methods, the WFEM method is strictly derived from the electromagnetic wave equation, takes all information into account, calculates apparent resistivity parameters using an iterative method, and realizes holographic electromagnetic exploration.
4. Geophysical Survey
4.1. WFEM Data Acquisition Design
The E-Ex field construction device system is shown in
Figure 2, where (a) is the schematic diagram and (b) is the actual construction layout. The emission source is located in the northern part of the survey area, and the designed electrode distance AB is 1.1212 km. The transmitting and receiving distance
R is 10–15 km, the transmitting current is 150 A, and the transmitting voltage is 700–800 V.
Figure 3 is a picture of real use in the field, where (a) is the transmitter and (b) is the receiver. The measurement frequency employed is 0.01–8192 Hz and the transmitted 2nd series pseudo-random signal contains seven frequency components at a time. According to the estimation of empirical formulas such as electromagnetic skin depth, the target of this exploration is within a 5 km depth, and the overall resistivity of the study area is about 10–1000 Ω·m, so the signal frequency can meet the requirements of this exploration using a low frequency. In
Figure 2b, the layout of the WFEM survey network in the study area is shown. Six parallel survey lines (L1–L6) were deployed and were perpendicular to the structural strike. The intervals between the survey stations and the lines were 100 m and 1 km on average, respectively. In total, the survey lines cover 30 km, with 3012 WEFM physical points. Among them, the L2 line through GR1 is used to calibrate and control the stratum occurrence and the range of basic electrical changes, and the remaining survey lines are used to explore the geological and electrical characteristics of the blank area. The correlation between the six lines is helpful in verifying the objectivity of the WFEM results and is also beneficial in establishing a 3D model of the study area in a later stage.
4.2. Measured Data and Inversion
Conventional data processing, such as denoising and correction, were carried out for the apparent resistivity measured in the study area, and the GME-3Di software system (V6.0, Central south university, Changsha, China) was used to perform 2D continuous medium inversion imaging to obtain the results. According to the physical property background characteristics of the study area, an inversion of the L2 line passing through GR1 was first carried out, and the inversion results of the data were inferred and analyzed.
Figure 4 shows the inversion results of the WFEM survey for Line L2. The inversion results clearly distinguish between three electrical layers for resistivity and offer their corresponding thicknesses. The surface layer has a resistivity of 30–170 Ω·m and is distributed at an altitude of about 2300–2900 m. The low resistivity layer has a resistivity of 1–30 Ω·m at an altitude of 1300–2500 m, and the thickness gradually decreases from left to right with a slightly undulating formation. The target layer has a resistivity of 30–955 Ω·m and an altitude of −2000–2000 m. The entire inversion resistivity section has clear stratification information and a prominent change in the gradient, especially the low-resistive layer in the middle, which shows that the electrical characteristics of the formation in this section are quite different from the upper and lower strata.
In
Figure 4, the low resistivity layer with an altitude of 2500–1500 m has abnormal resistivity in the middle, with obvious differences in resistivity between the two sides of the abnormal area. Meanwhile, the layer of with high resistivity at an altitude of −1000–1000 m appears to be abnormally sinking. These abnormities are correlated and continuous; from such a resistivity distribution, Fault F1, which cuts through three electrical layers, is inferred.
Furthermore, on the basis of the calibration results from the survey line L2, a comparative and constrained inversion of the six lateral lines (L1–L6) can be carried out (see
Figure 5). In
Figure 5, the inversion results of WFEM data for the survey lines L1–L6 are similar. We can conclude that the resistivity of the formation in Gonghe Basin of Qinghai Province can be mainly divided into three layers: high, low, and high. The stratigraphic boundaries (black lines) between high and low are all clear. The upper black line is at a depth of 350–500 m with slight fluctuations, and the lower one is at about 800–1350 m.
Moreover, the fault zones in Lines L1–L5 are similar in shape and show the same characteristics, which are stable and can be traced continuously. Thus, it is inferred to be the same fault F1.
4.3. Data Interpretation
Based on the resistivity characteristics of the WFEM method, according to the GR1 well data and geophysical data, L2 is taken as an example to calibrate and interpret the geological attributes.
The following are inferred: the surface high-resistivity layer is Fluvial-lacustrine clastic rocks of the Gonghe Formation of the Early Middle Pleistocene (noted as Layer Q), the low-resistivity layer is Pliocene lacus-trine-delta front facies with subaqueous fan sand and mudstone (noted as Layer N), and the buried depth of the deep high-resistance layer is the granite basement of the target layer (noted as Layer T).
According to the horizontal analysis in
Figure 6, we can conclude that the thickness of Q varies greatly, which is related to stratum fluctuations. The thickness of N gradually becomes thinner from west to east, and Line L2 is relatively thick locally. The buried depth of deep T gradually becomes shallower from west to east, which is consistent with the results from previous geophysical and geological studies.
Faults affects the distribution, burial depth, and temperature of the stratum, and the discrimination of fault structure is of great significance in interpreting the results of the WFEM method. Through the previous electrical results, a regional fault F1 is mainly identified by WFEM, and F1 is located on the red curve, which divides the study into two parts with offset. The eastern part has an upward trend relative to the western part, and the hanging wall rises as a reverse fault.
6. Conclusions
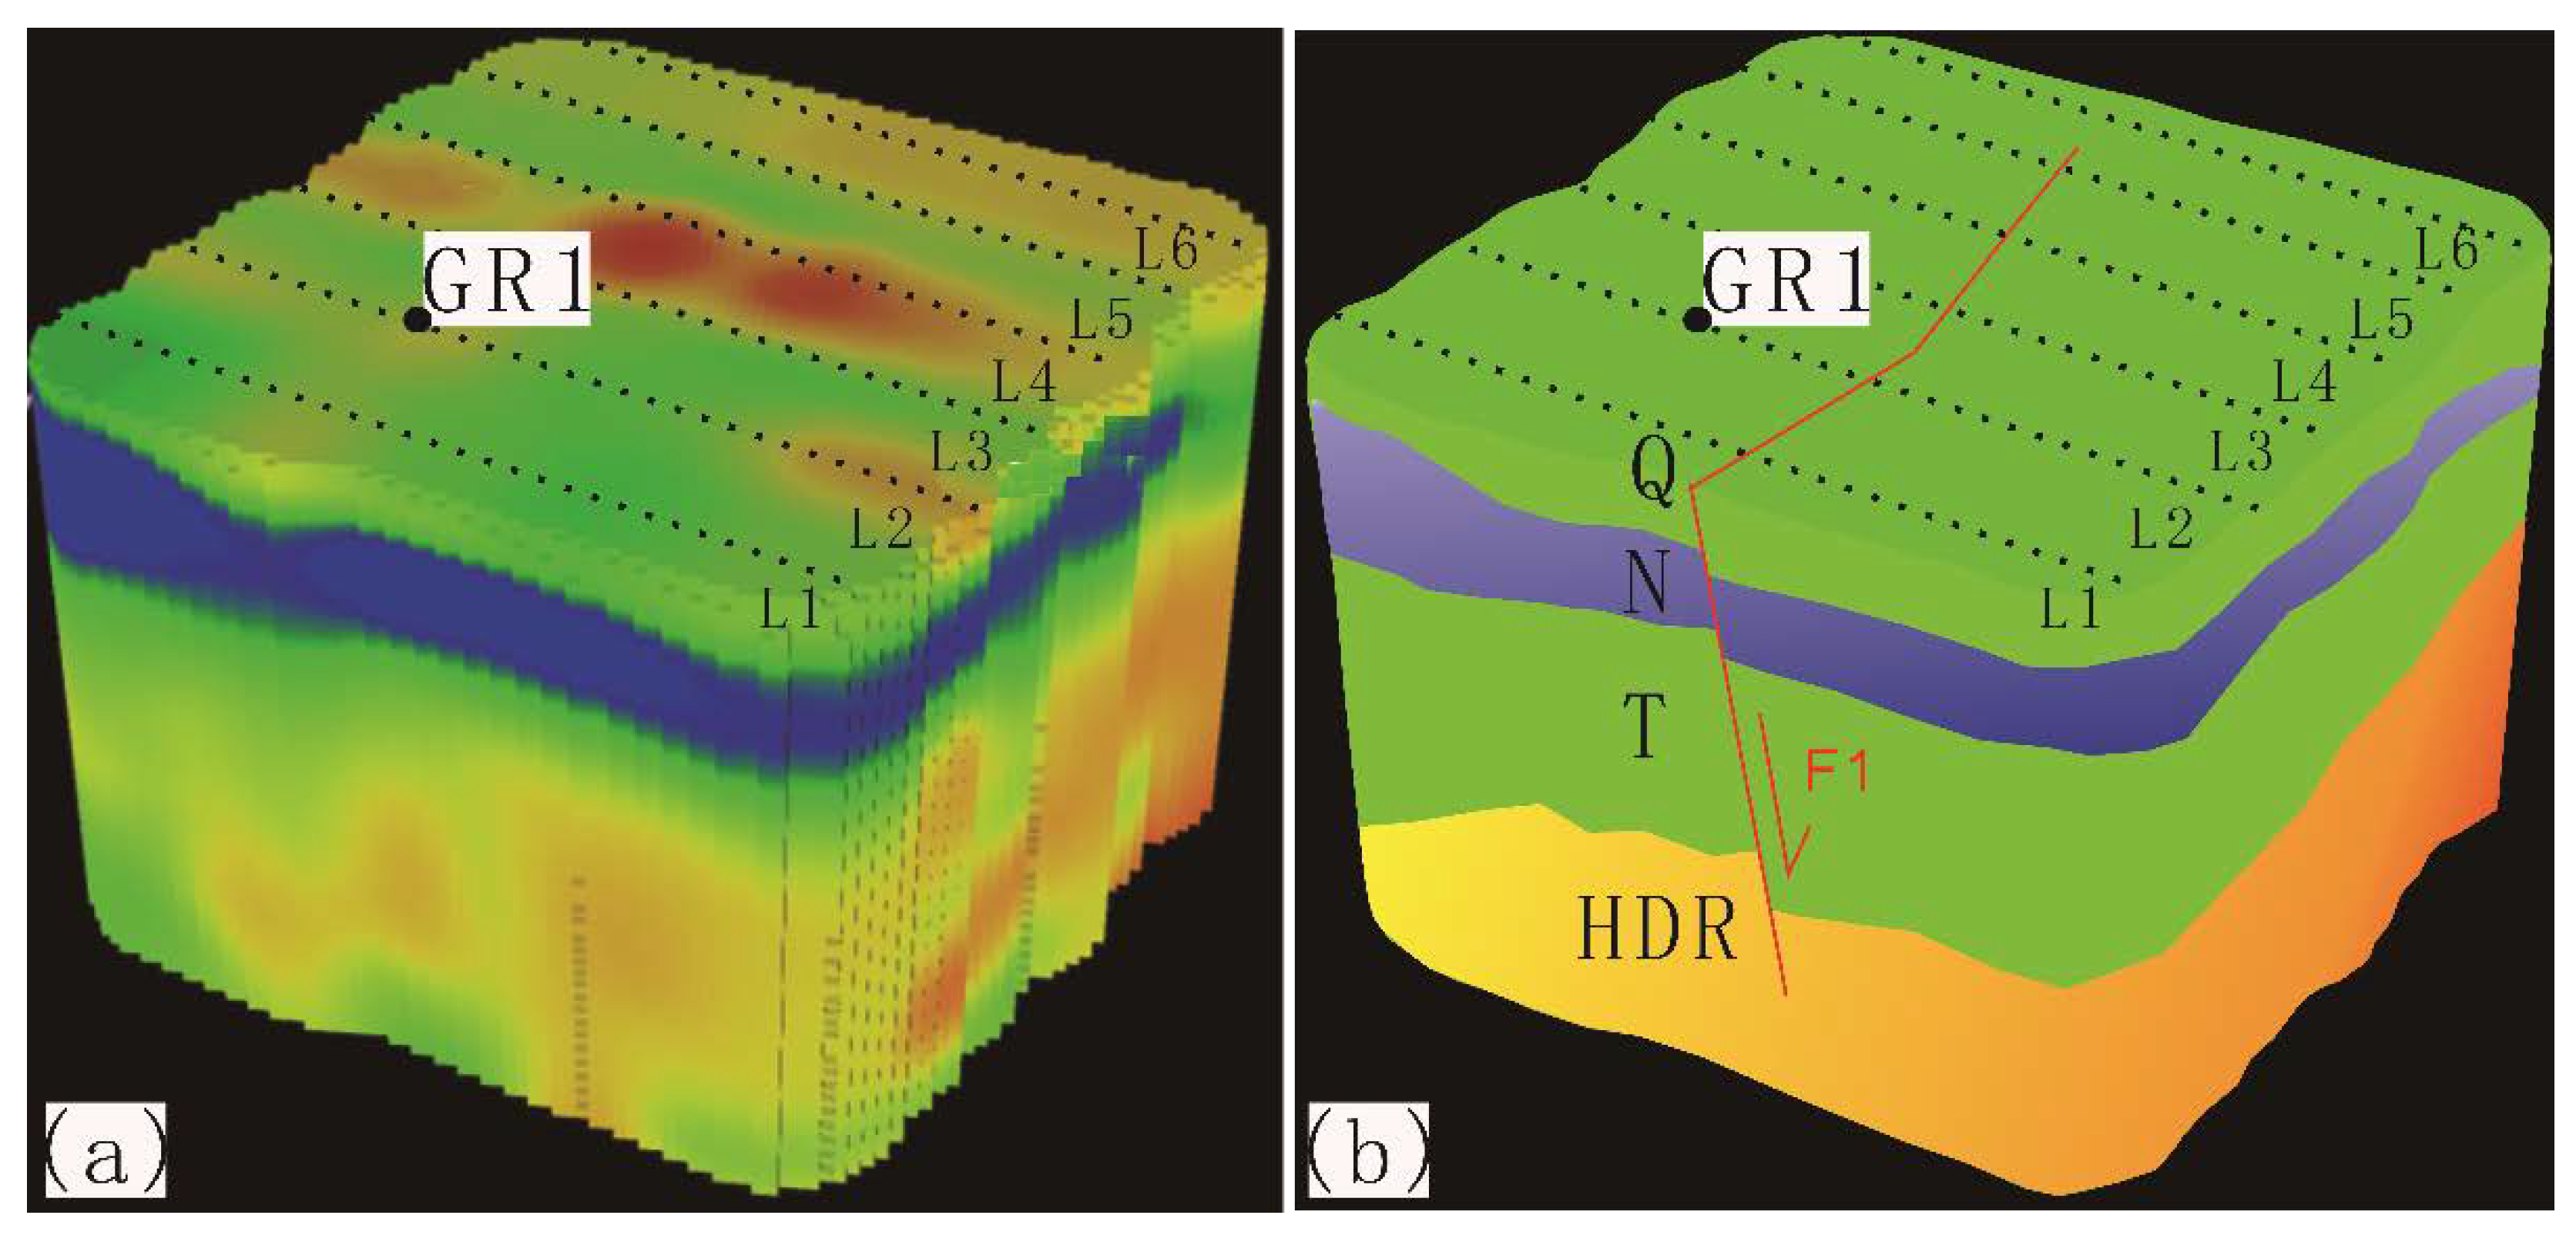
By combining the results of the WFEM method with the geological and physical property data, we found that the four electrical layers divided by the resistivity characteristics can nicely correspond with the Quaternary Gonghe Formation, the Neogene Linxia Formation and the Xianshuihe Formation, Triassic granite, and the HDR layers. At the same time, a continuous fault, which can be tracked regionally, was found in the study area. Moreover, with the well calibration, for the first time, we established a relationship between the resistivity inversion of the WFEM method and the granite temperature. We concluded that the temperature is positively correlated with the inversion resistivity as a whole, especially in the HDR area. HDRs were found in the well GR1, which is located in the uplift area with high resistivity. Thus, the northeast area with a shallower buried granite body, which is labeled in
Figure 8, can be seen as a potential favorable area for further explorations.
In summary, HDR exploration is in its infancy in China, and the above survey results show that the drilling verification depth of the WFEM method and the depth of inversion detection can reach 3705 m and 5000 m, respectively, which fully meets the requirements of deep HDR detection. Furthermore, this achievement provides a good demonstration of the effectiveness and feasibility of the WFEM method in detecting deep HDR resources.


