
Prospecting Potential of the Yanjingou Gold Deposit in the East Kunlun Orogen, NW China: Evidence from Primary Halo Geochemistry and In Situ Pyrite Thermoelectricity

 ,
,  ,
, 
Abstract
:1. Introduction
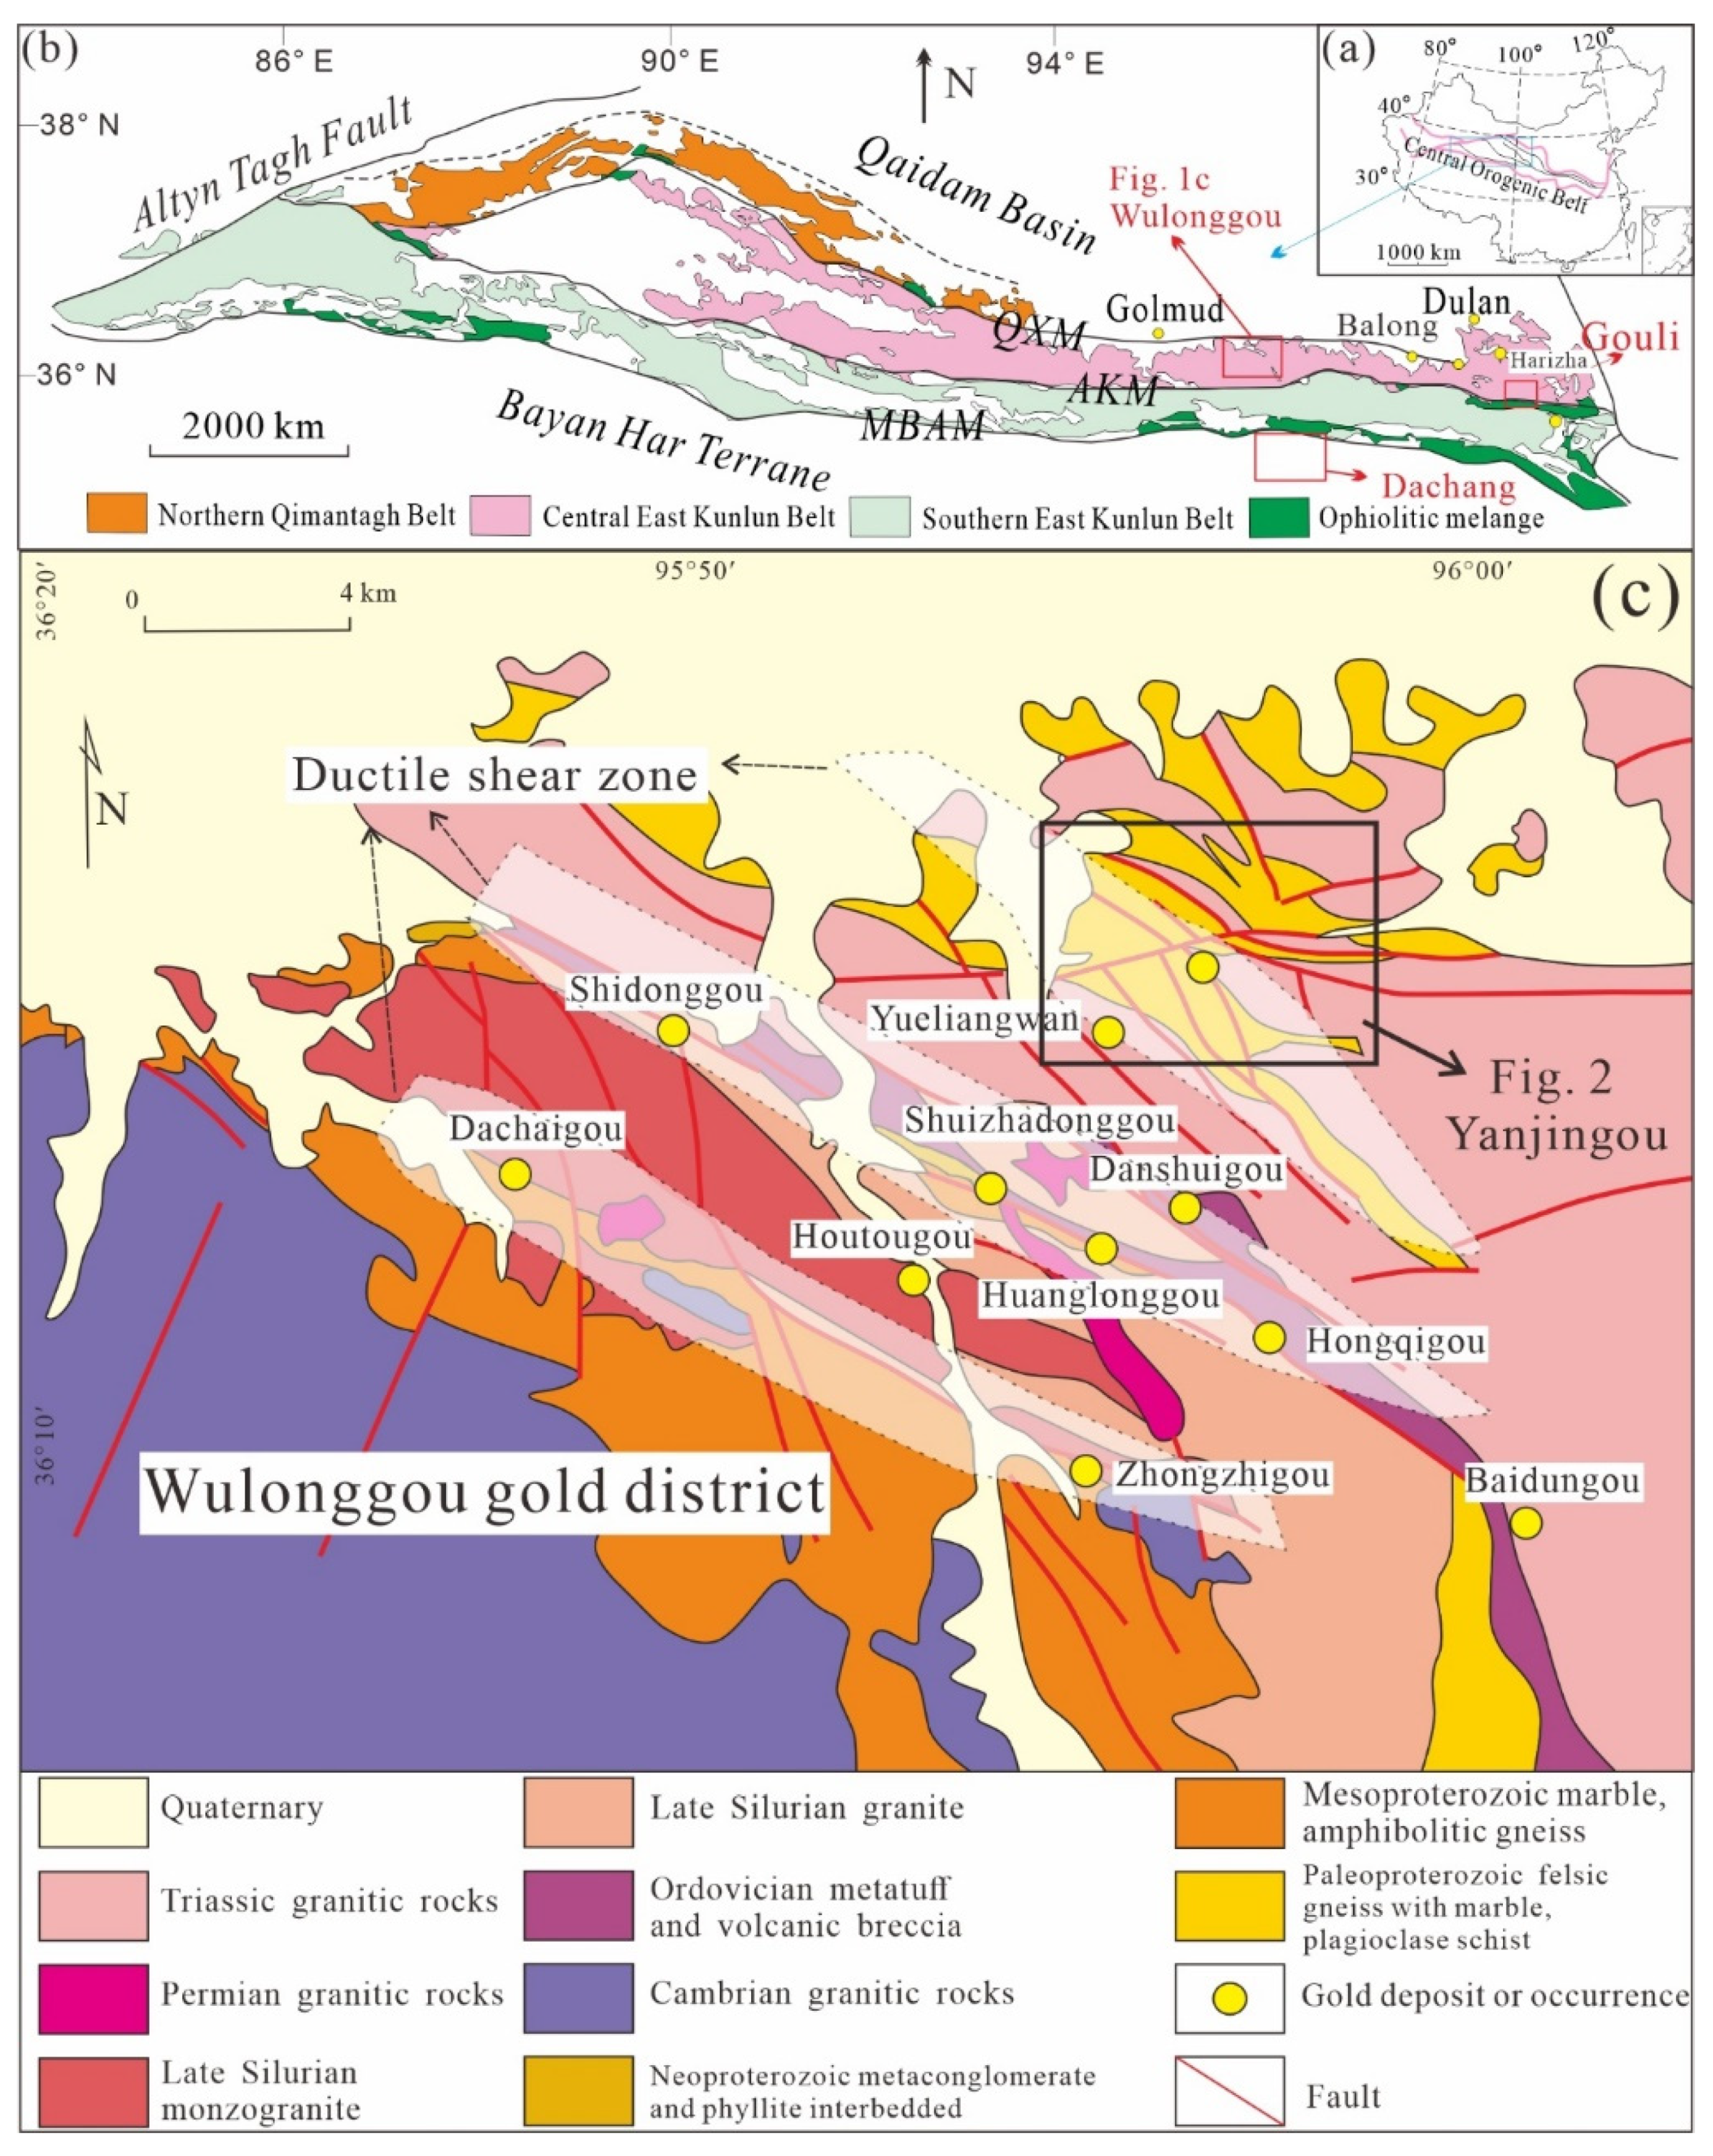
2. Regional Geology
3. Ore Deposit Geology
4. Sample Descriptions and Analytical Methods
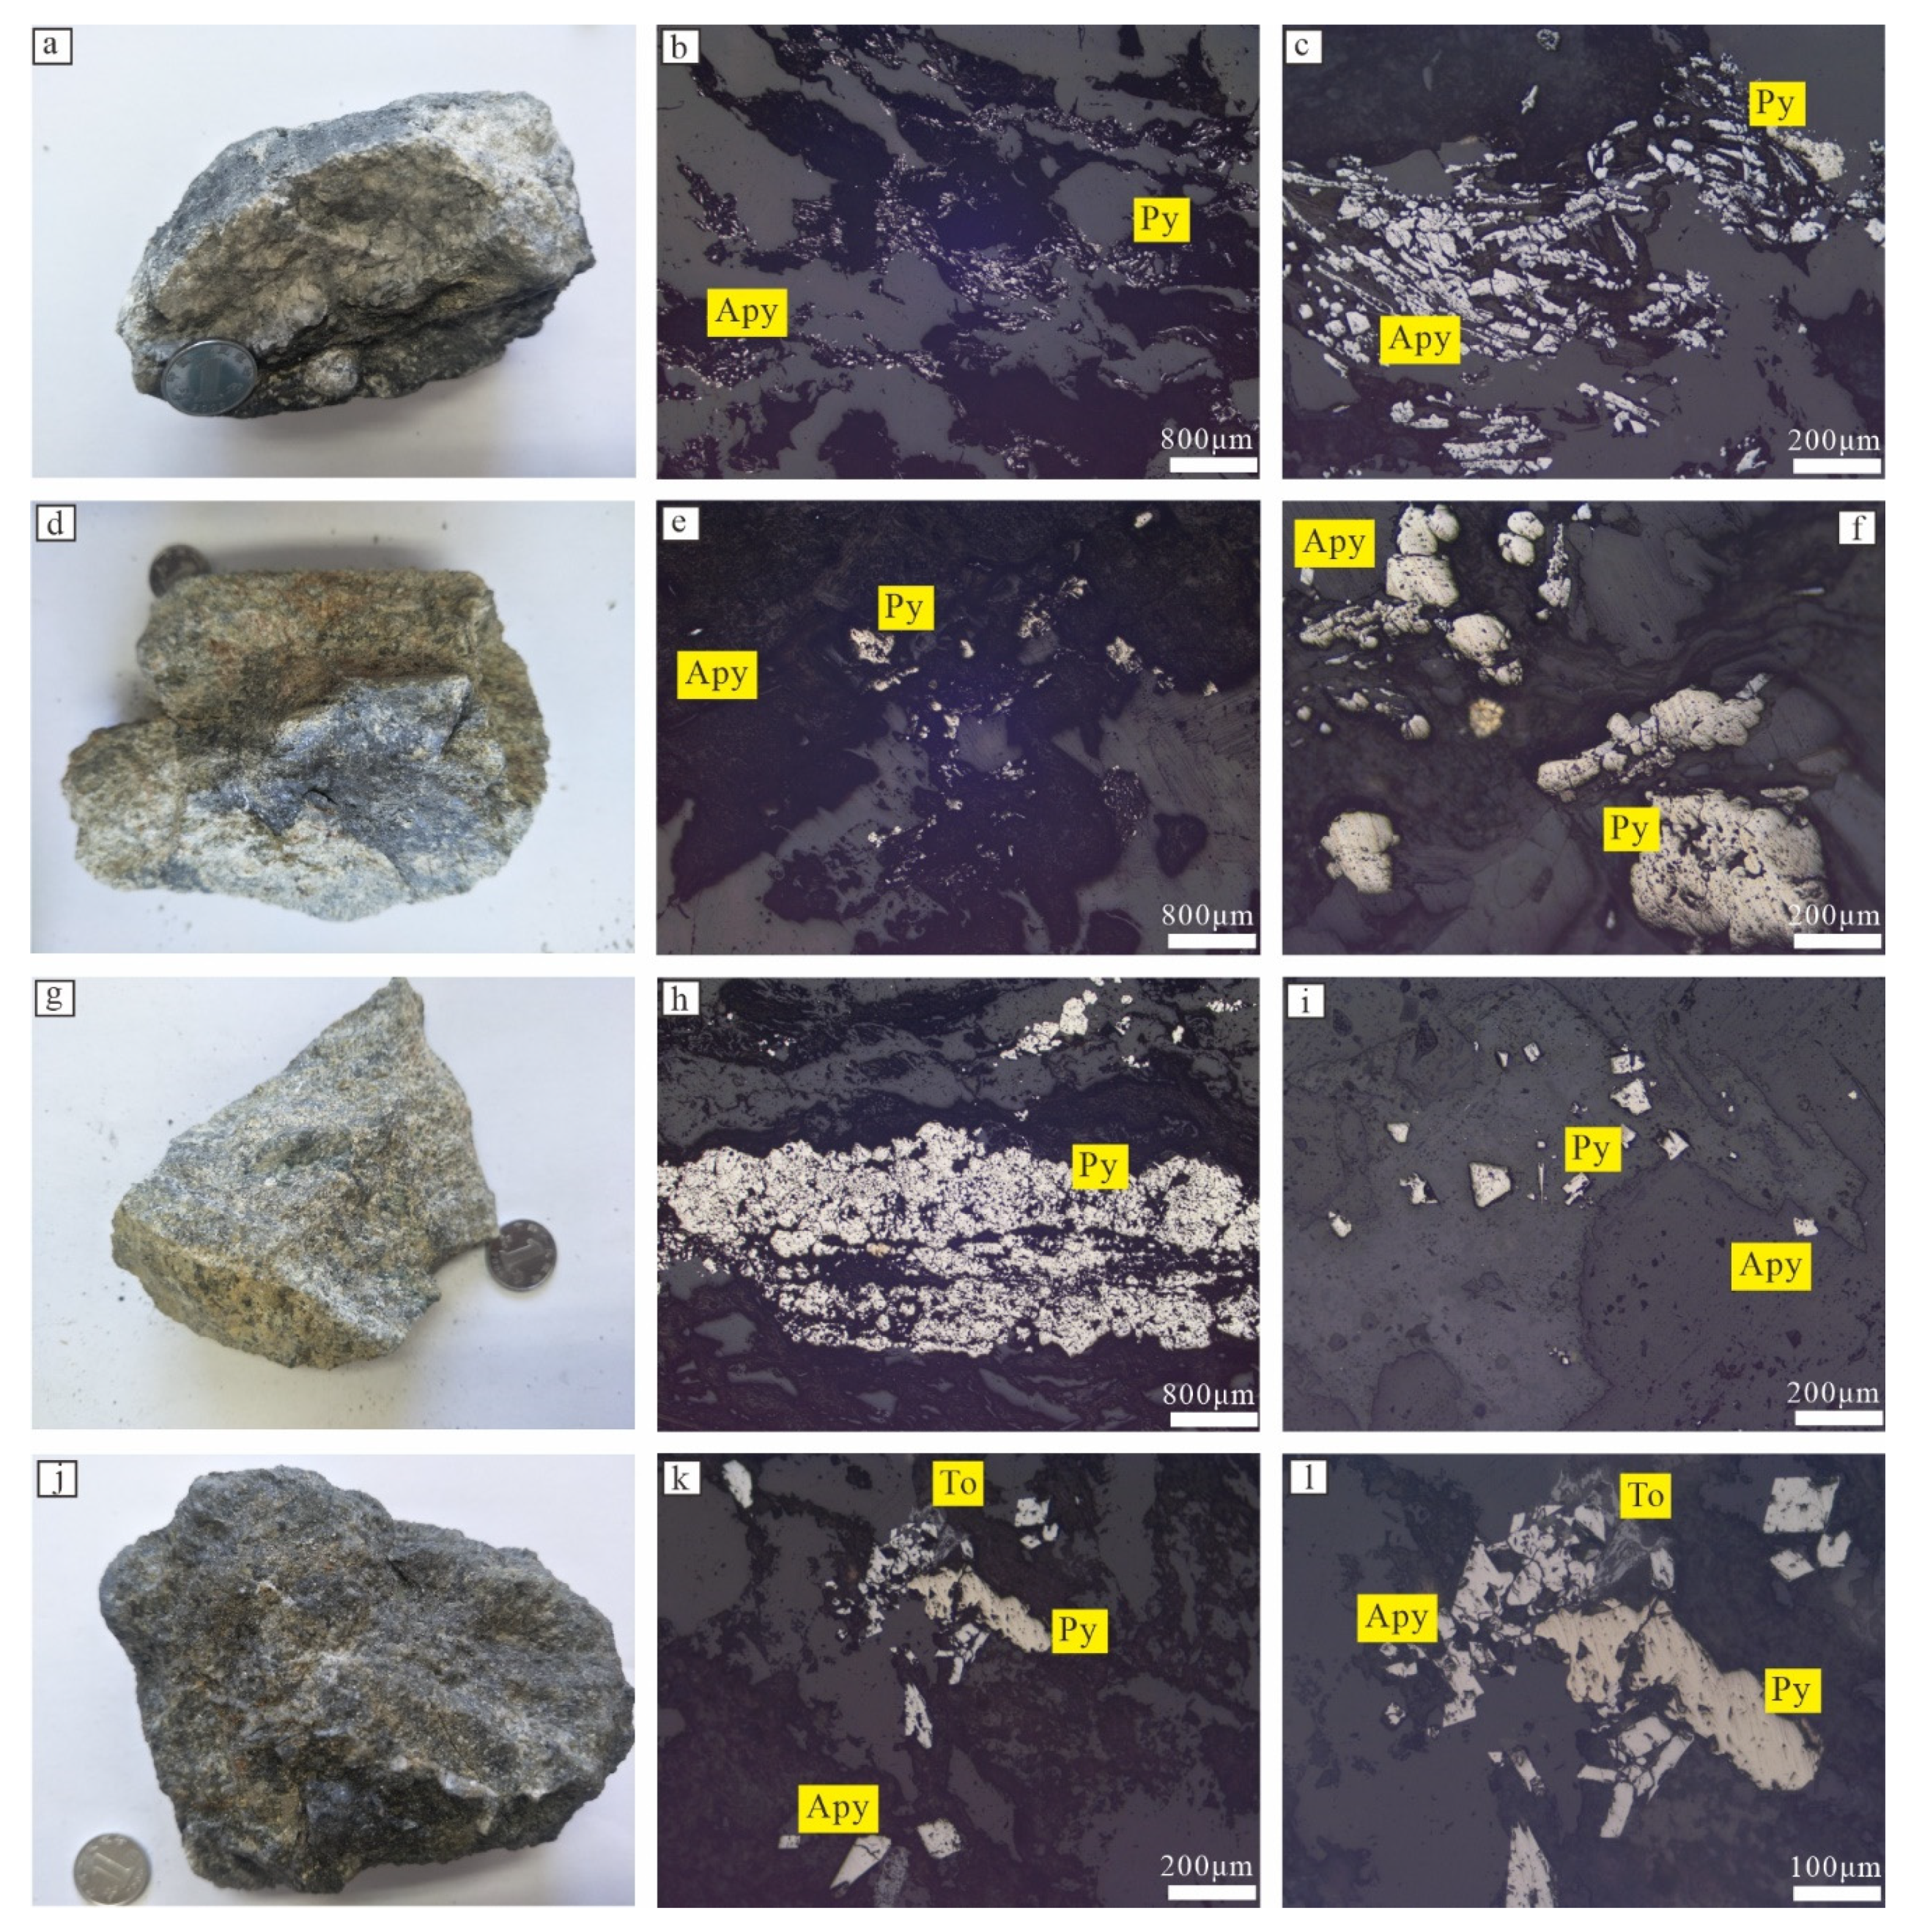
4.1. Petrography
4.2. Primary Halo Geochemistry
4.3. In Situ Pyrite Thermoelectric Analyses
5. Results
5.1. Primary Halo Geochemistry
5.1.1. Elemental Correlation Analysis
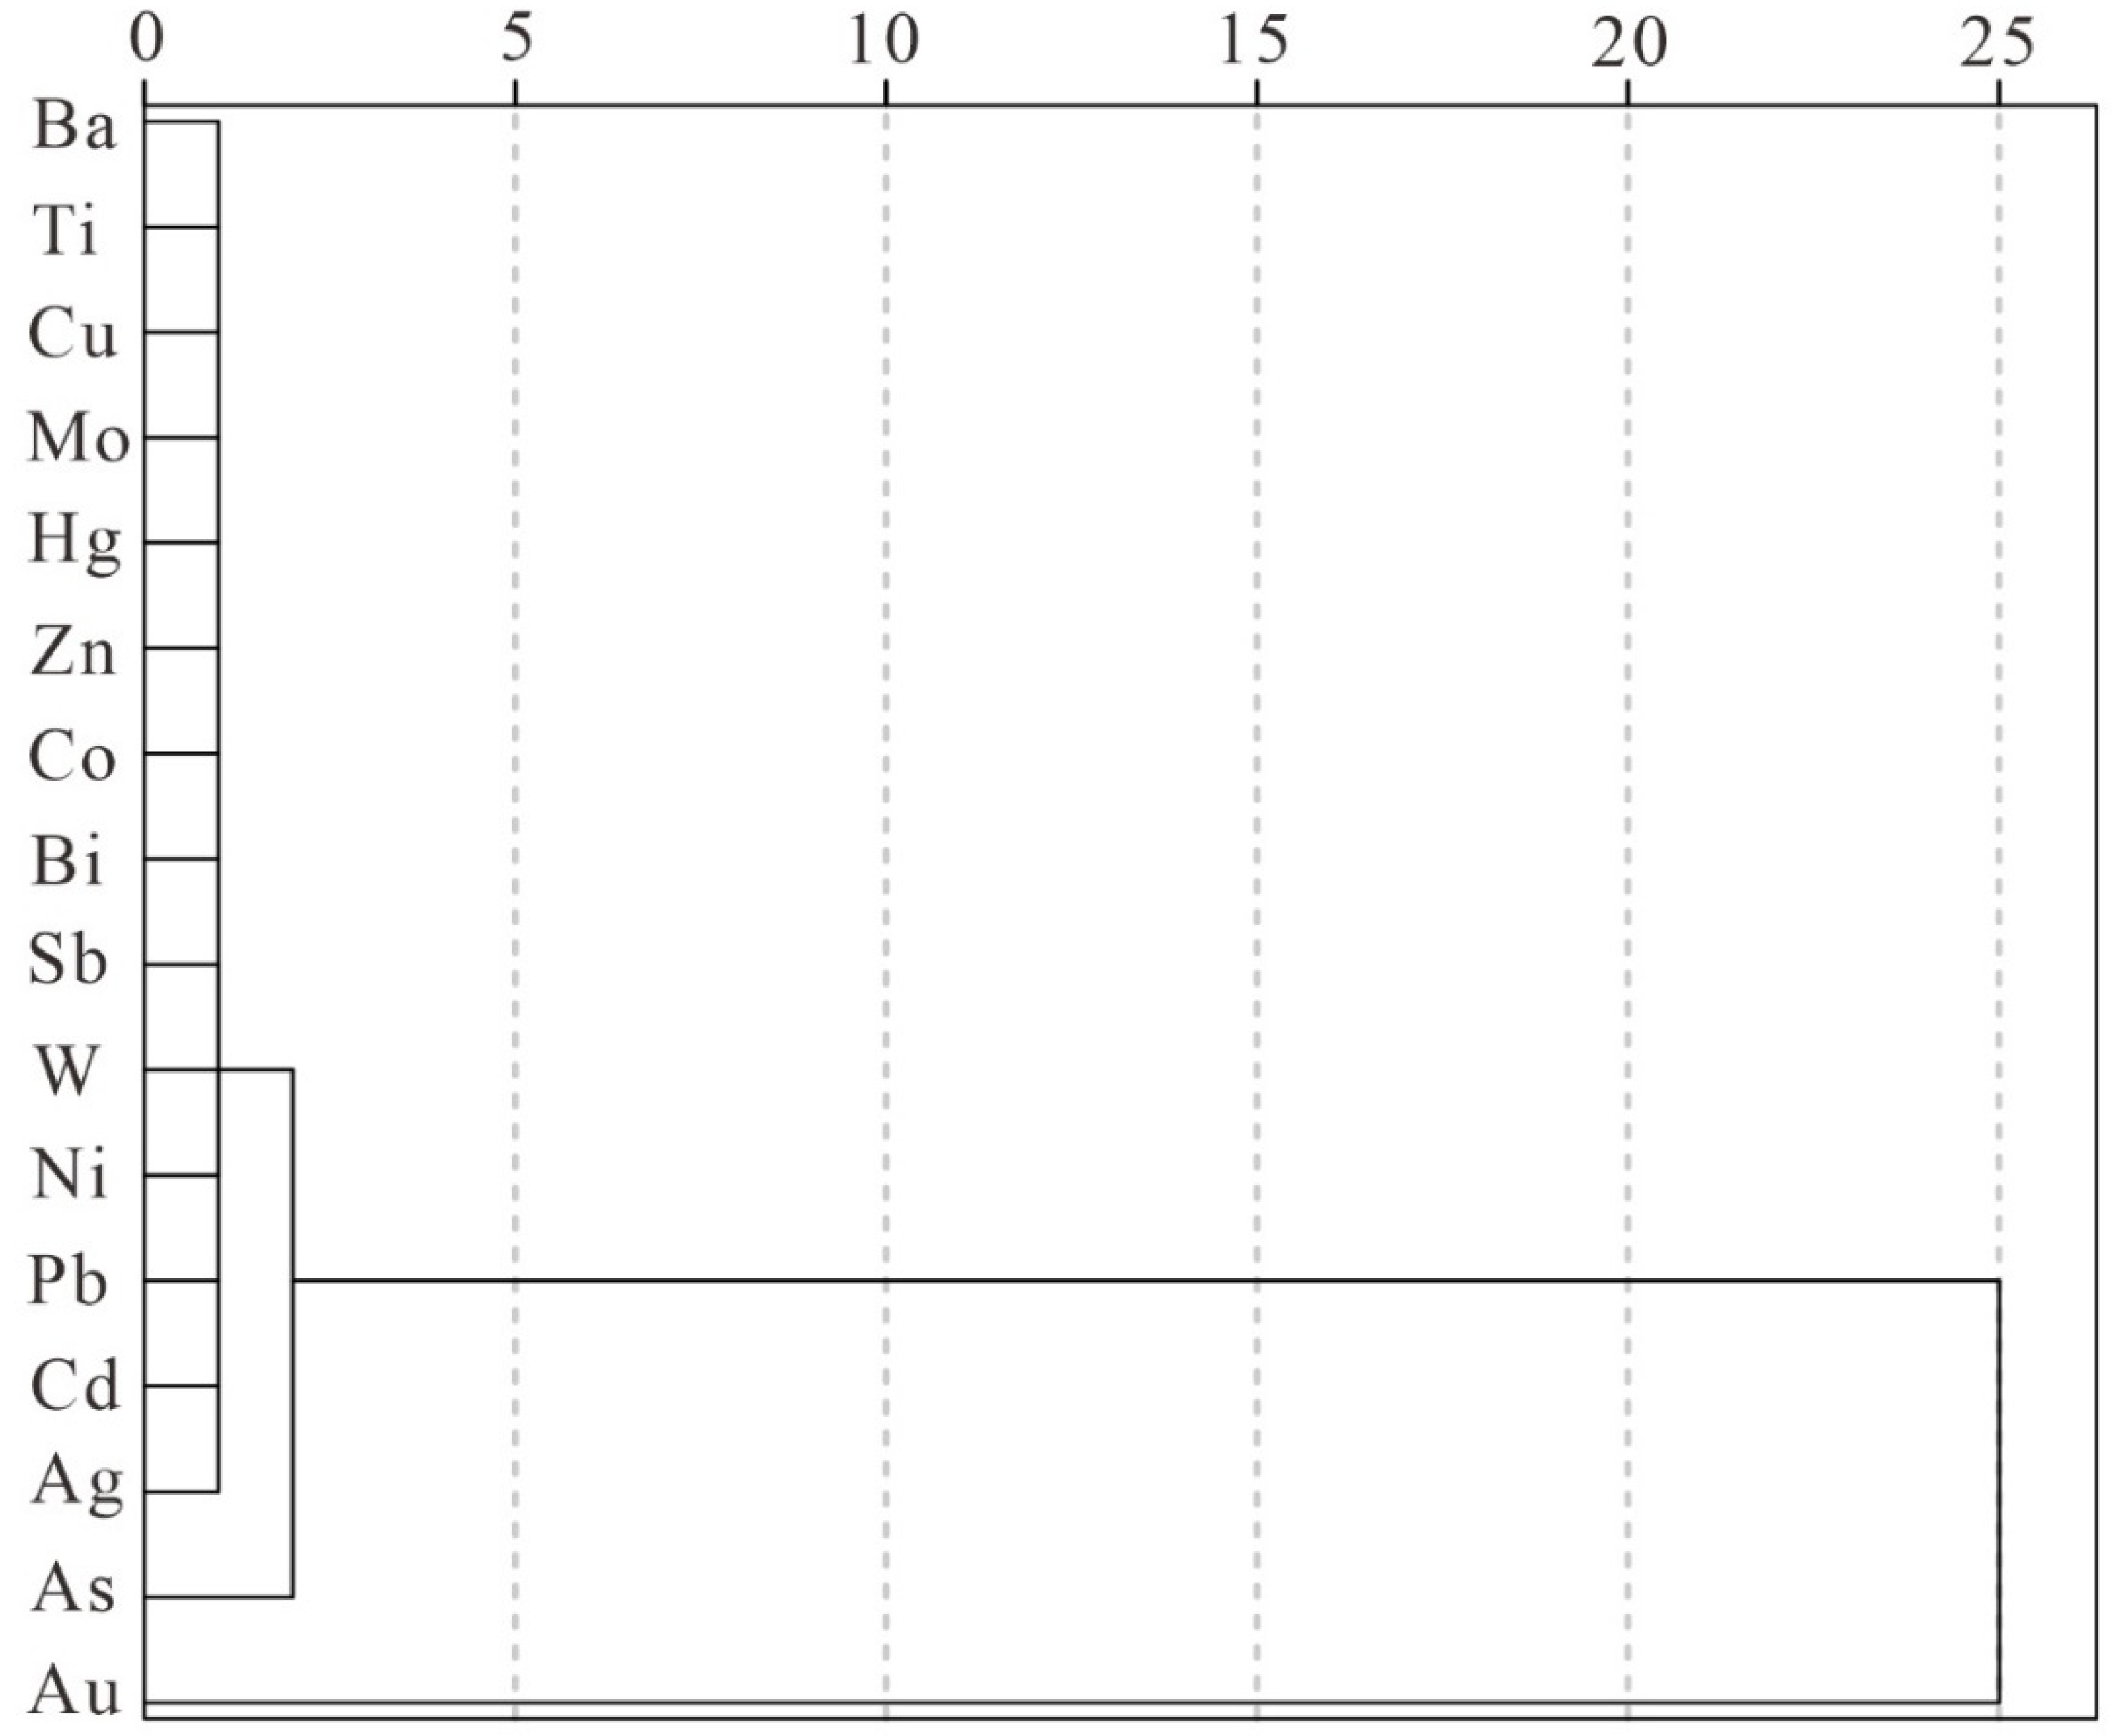
5.1.2. Cluster Analysis of the Element Anomalies
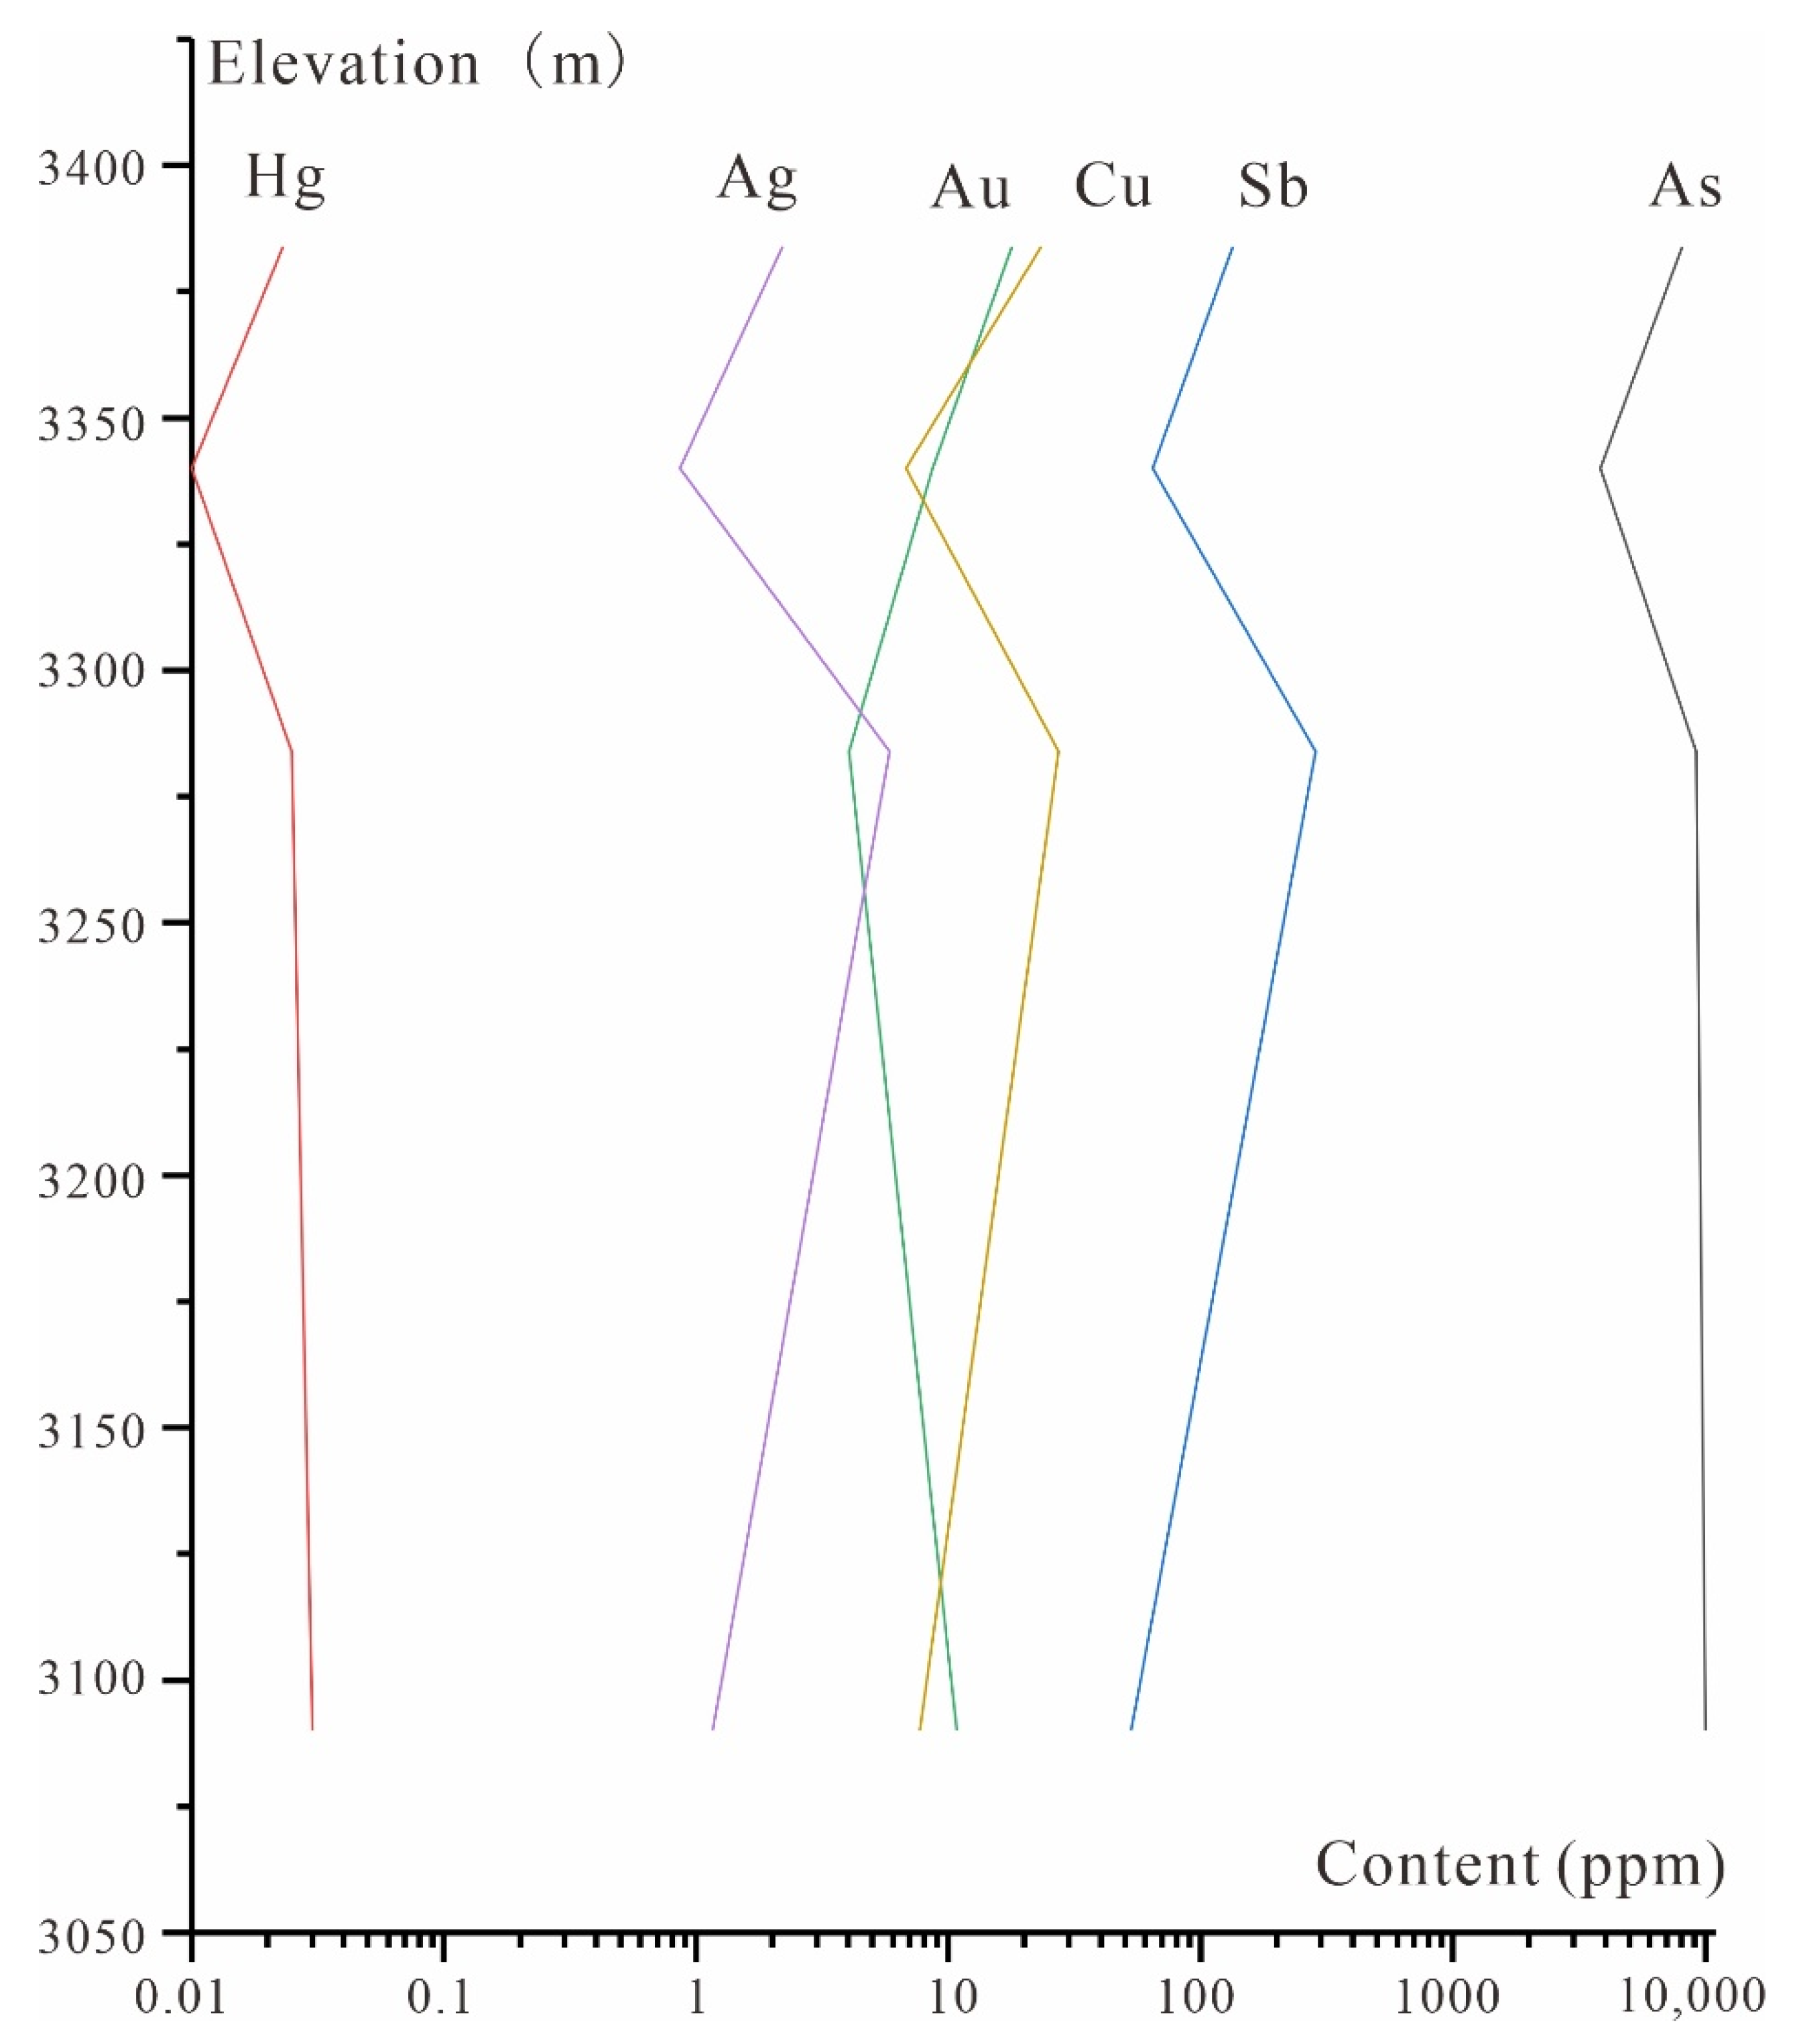
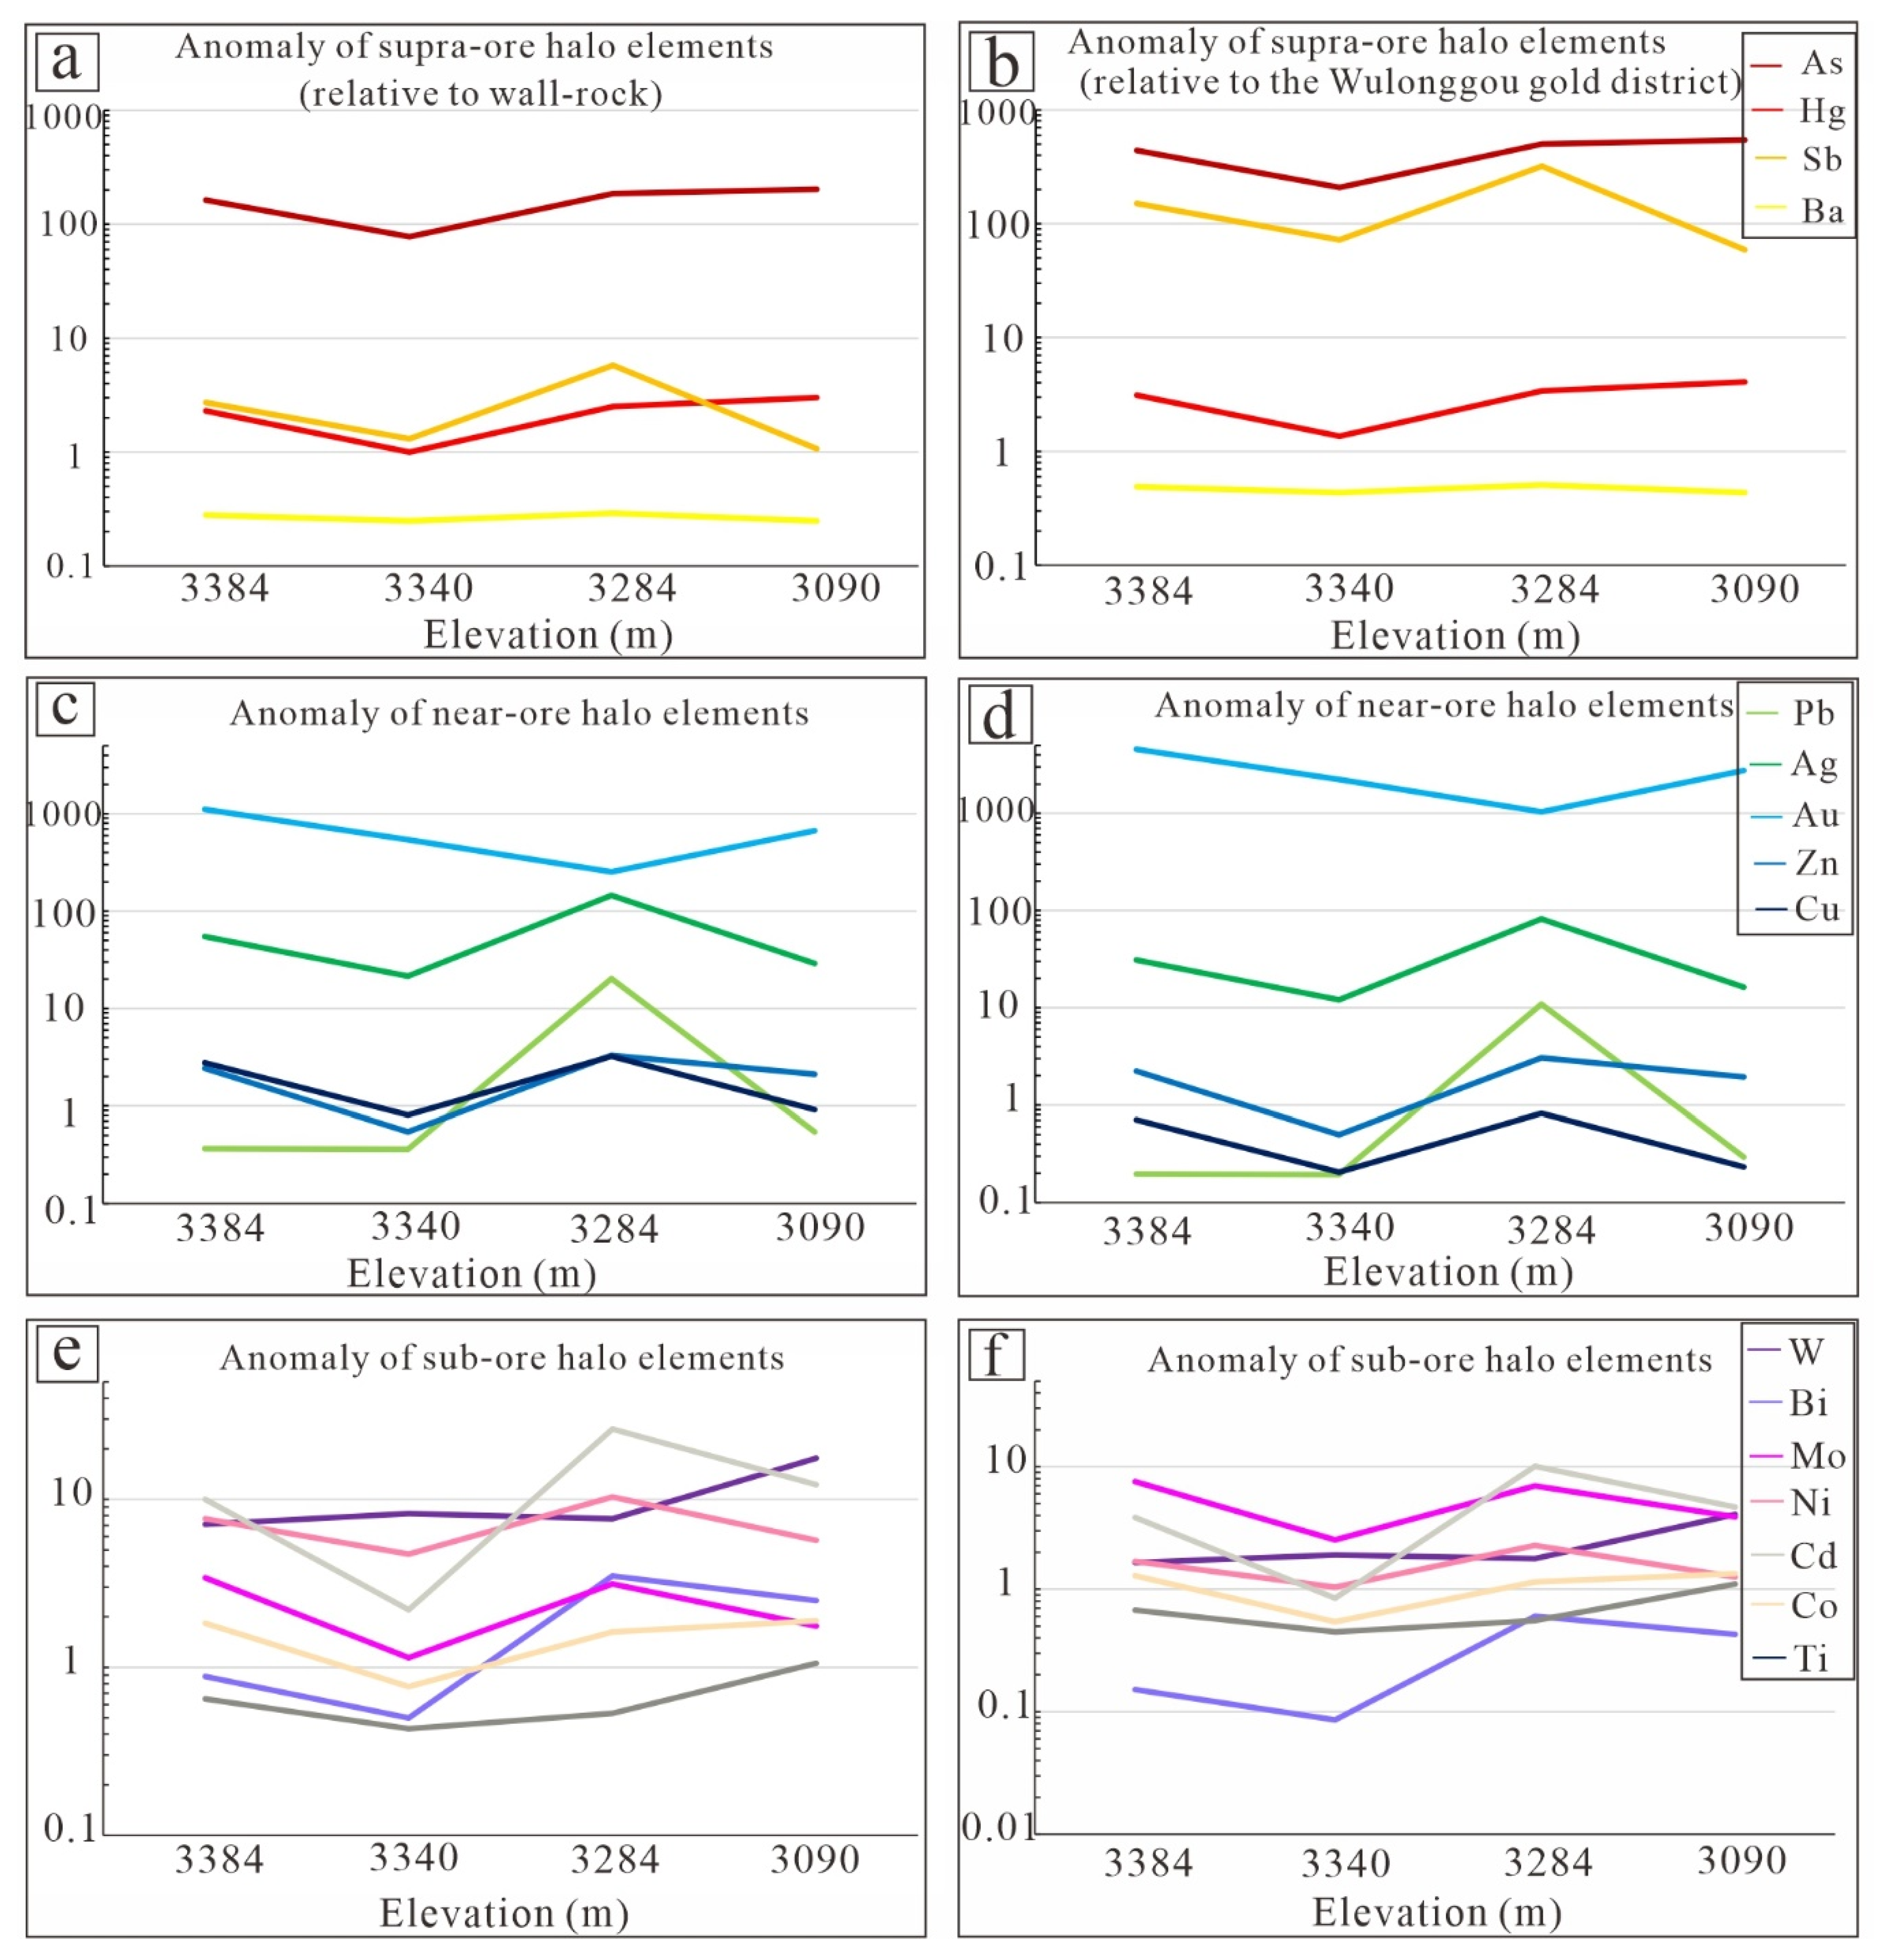
5.1.3. Element Zoning
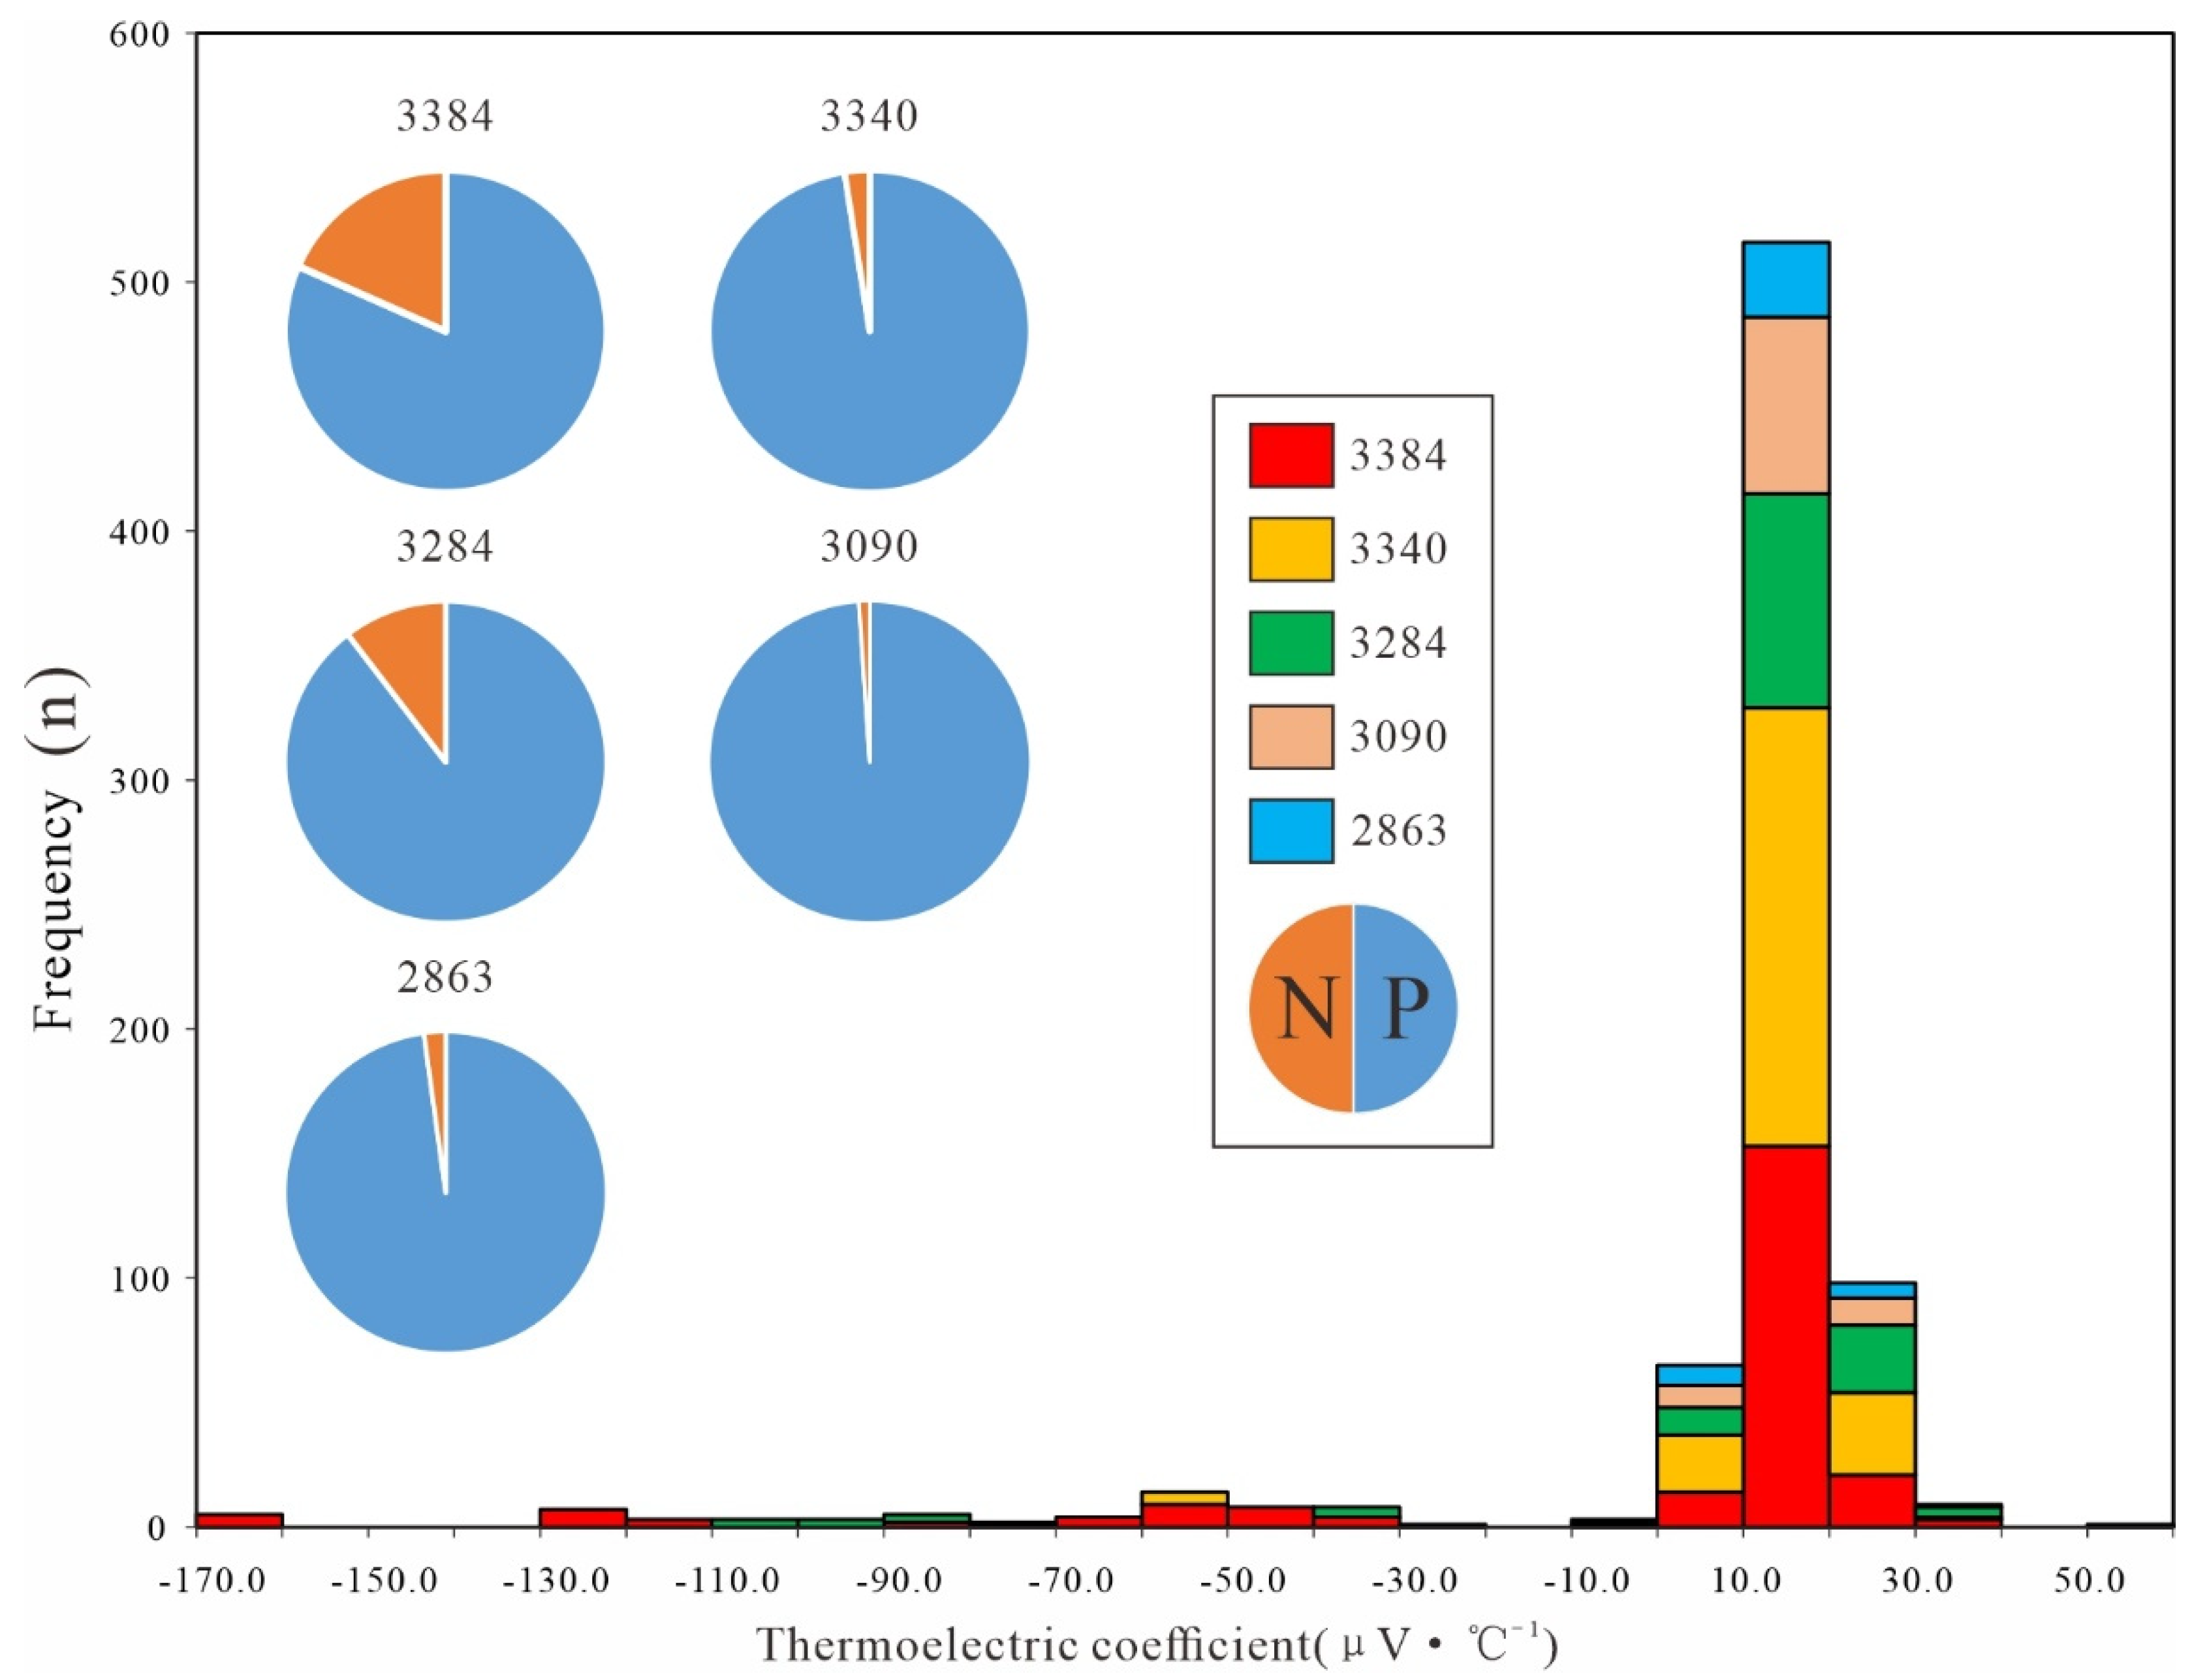
5.2. Pyrite Thermoelectric Properties
6. Discussion
6.1. Implications for Prospecting from Primary Halo Geochemistry
6.1.1. Calculation and Analysis of Primary Halo Geochemistry
6.1.2. Characteristic of Element Variation
6.2. Implications for Prospecting from In Situ Pyrite Thermoelectricity
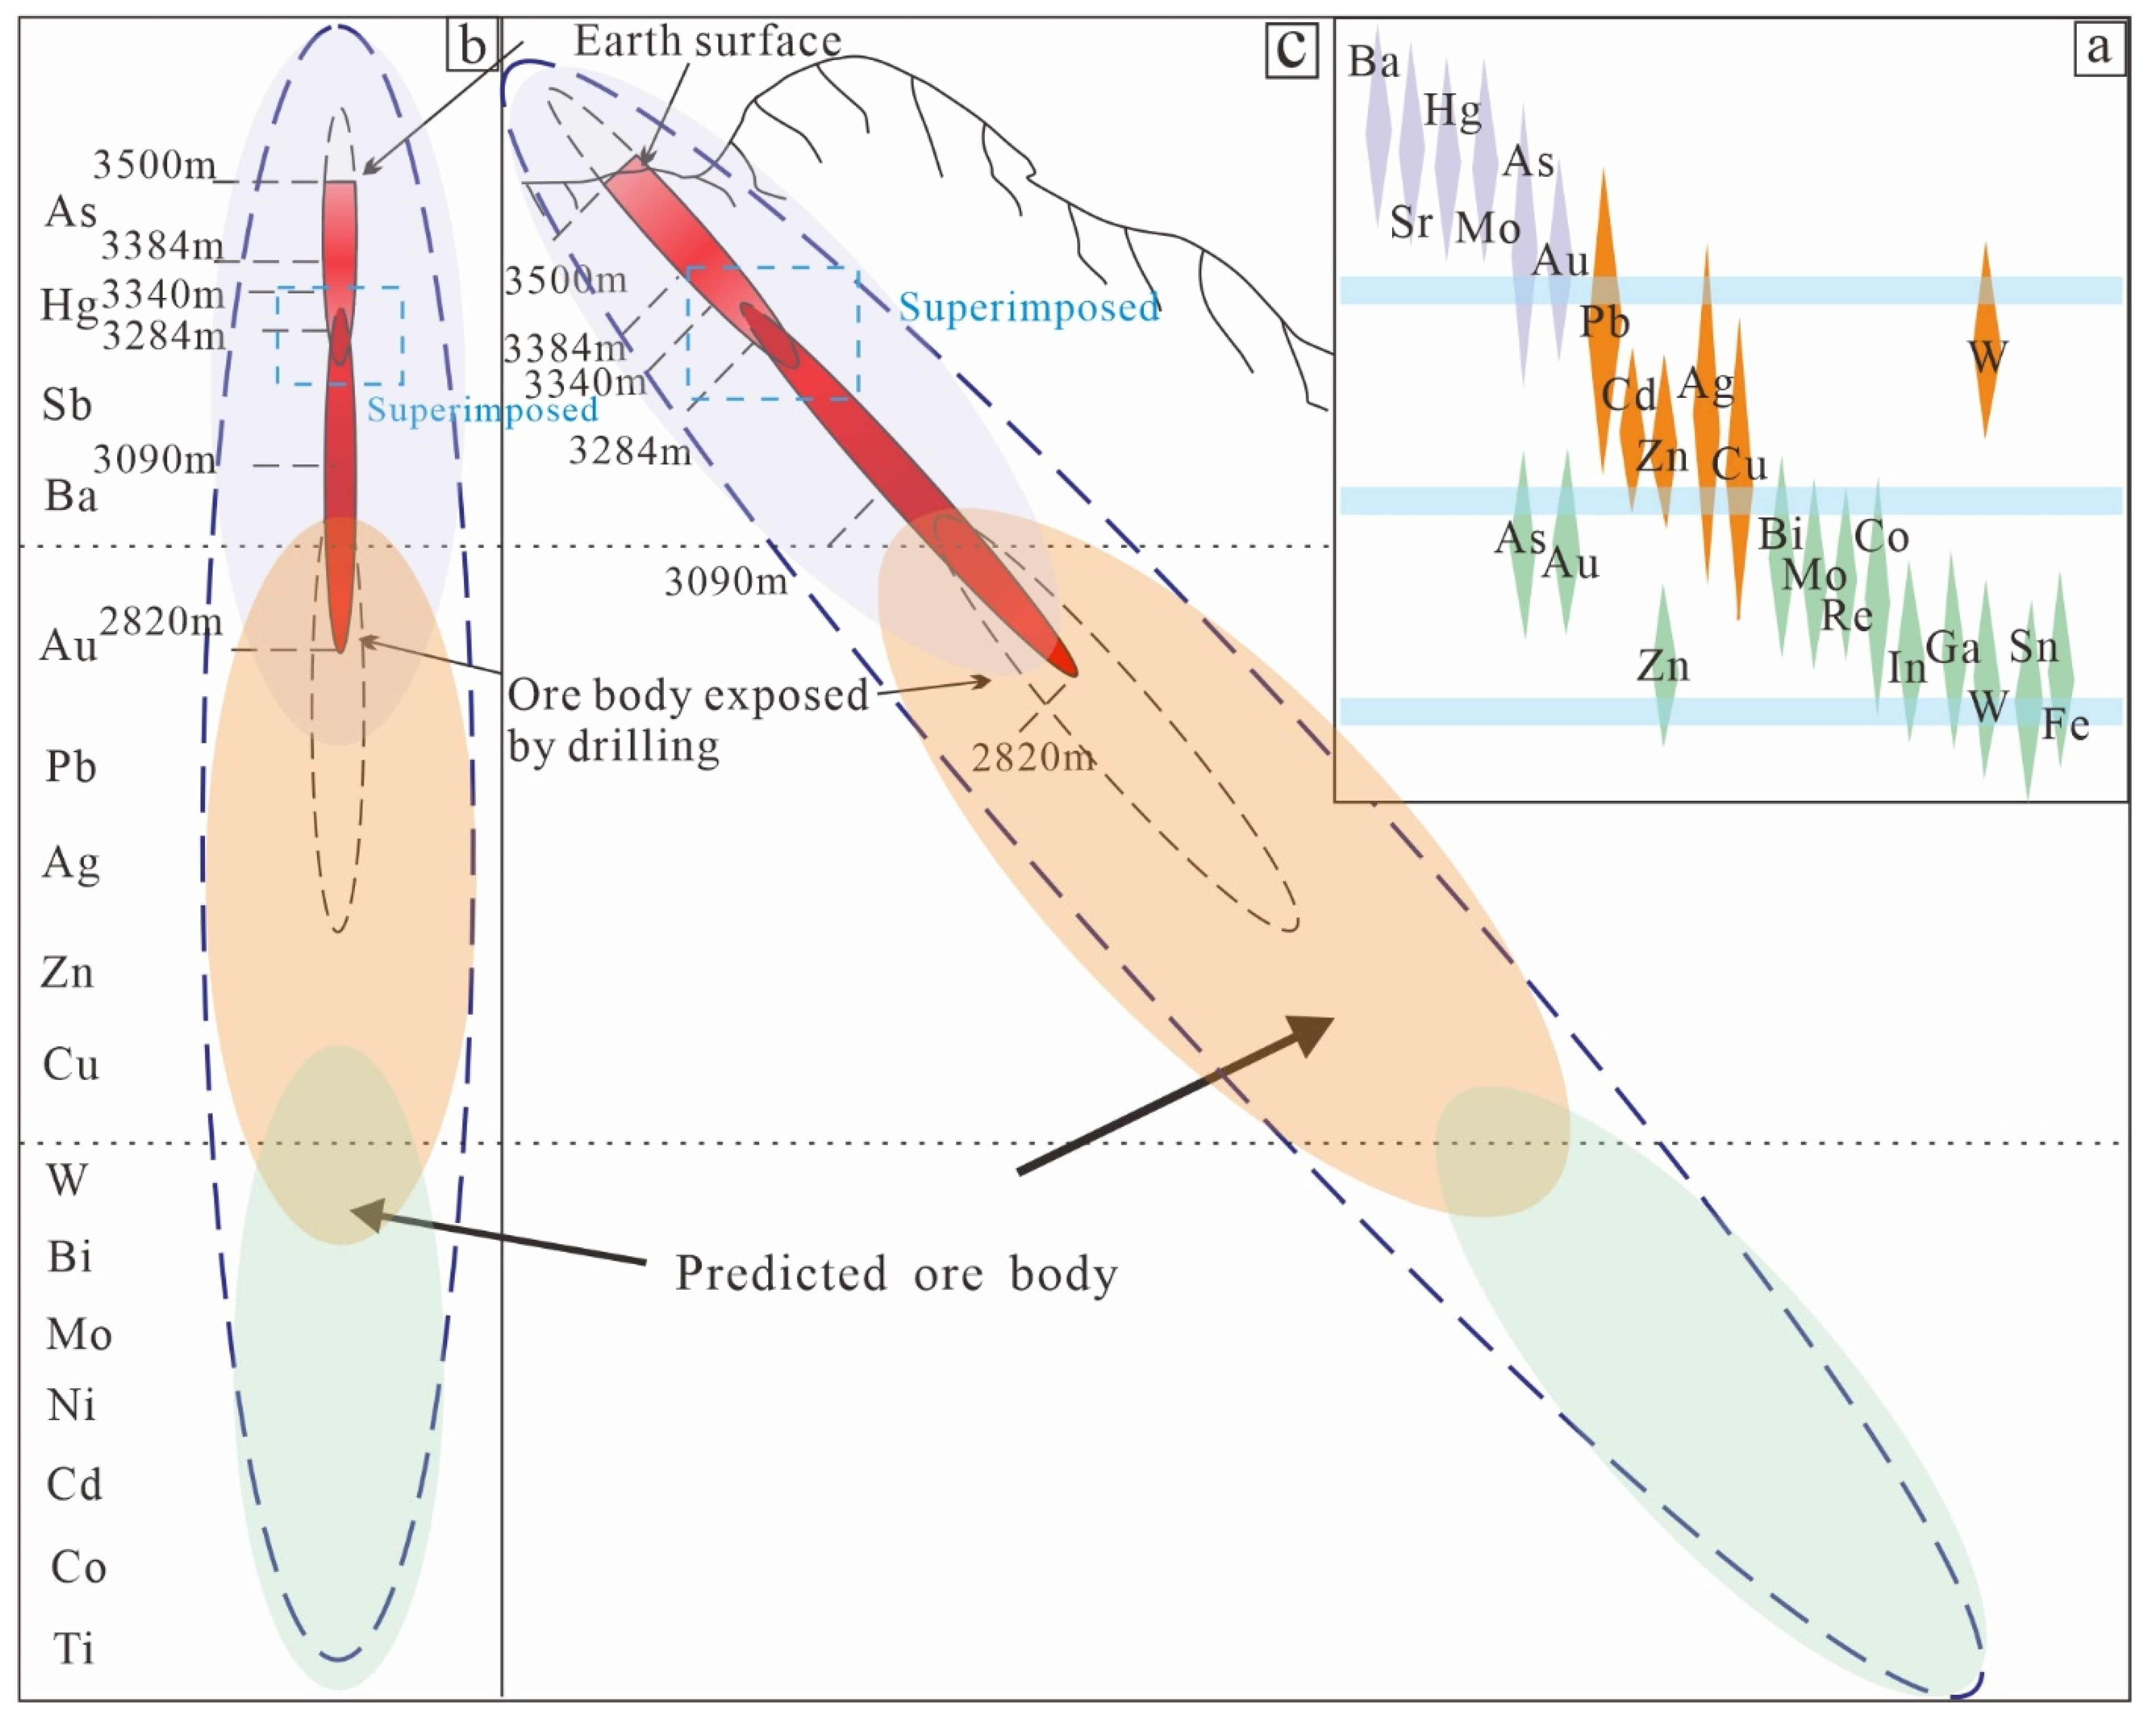
6.3. Mineralization Prediction Model and Prospecting Potential
7. Conclusions
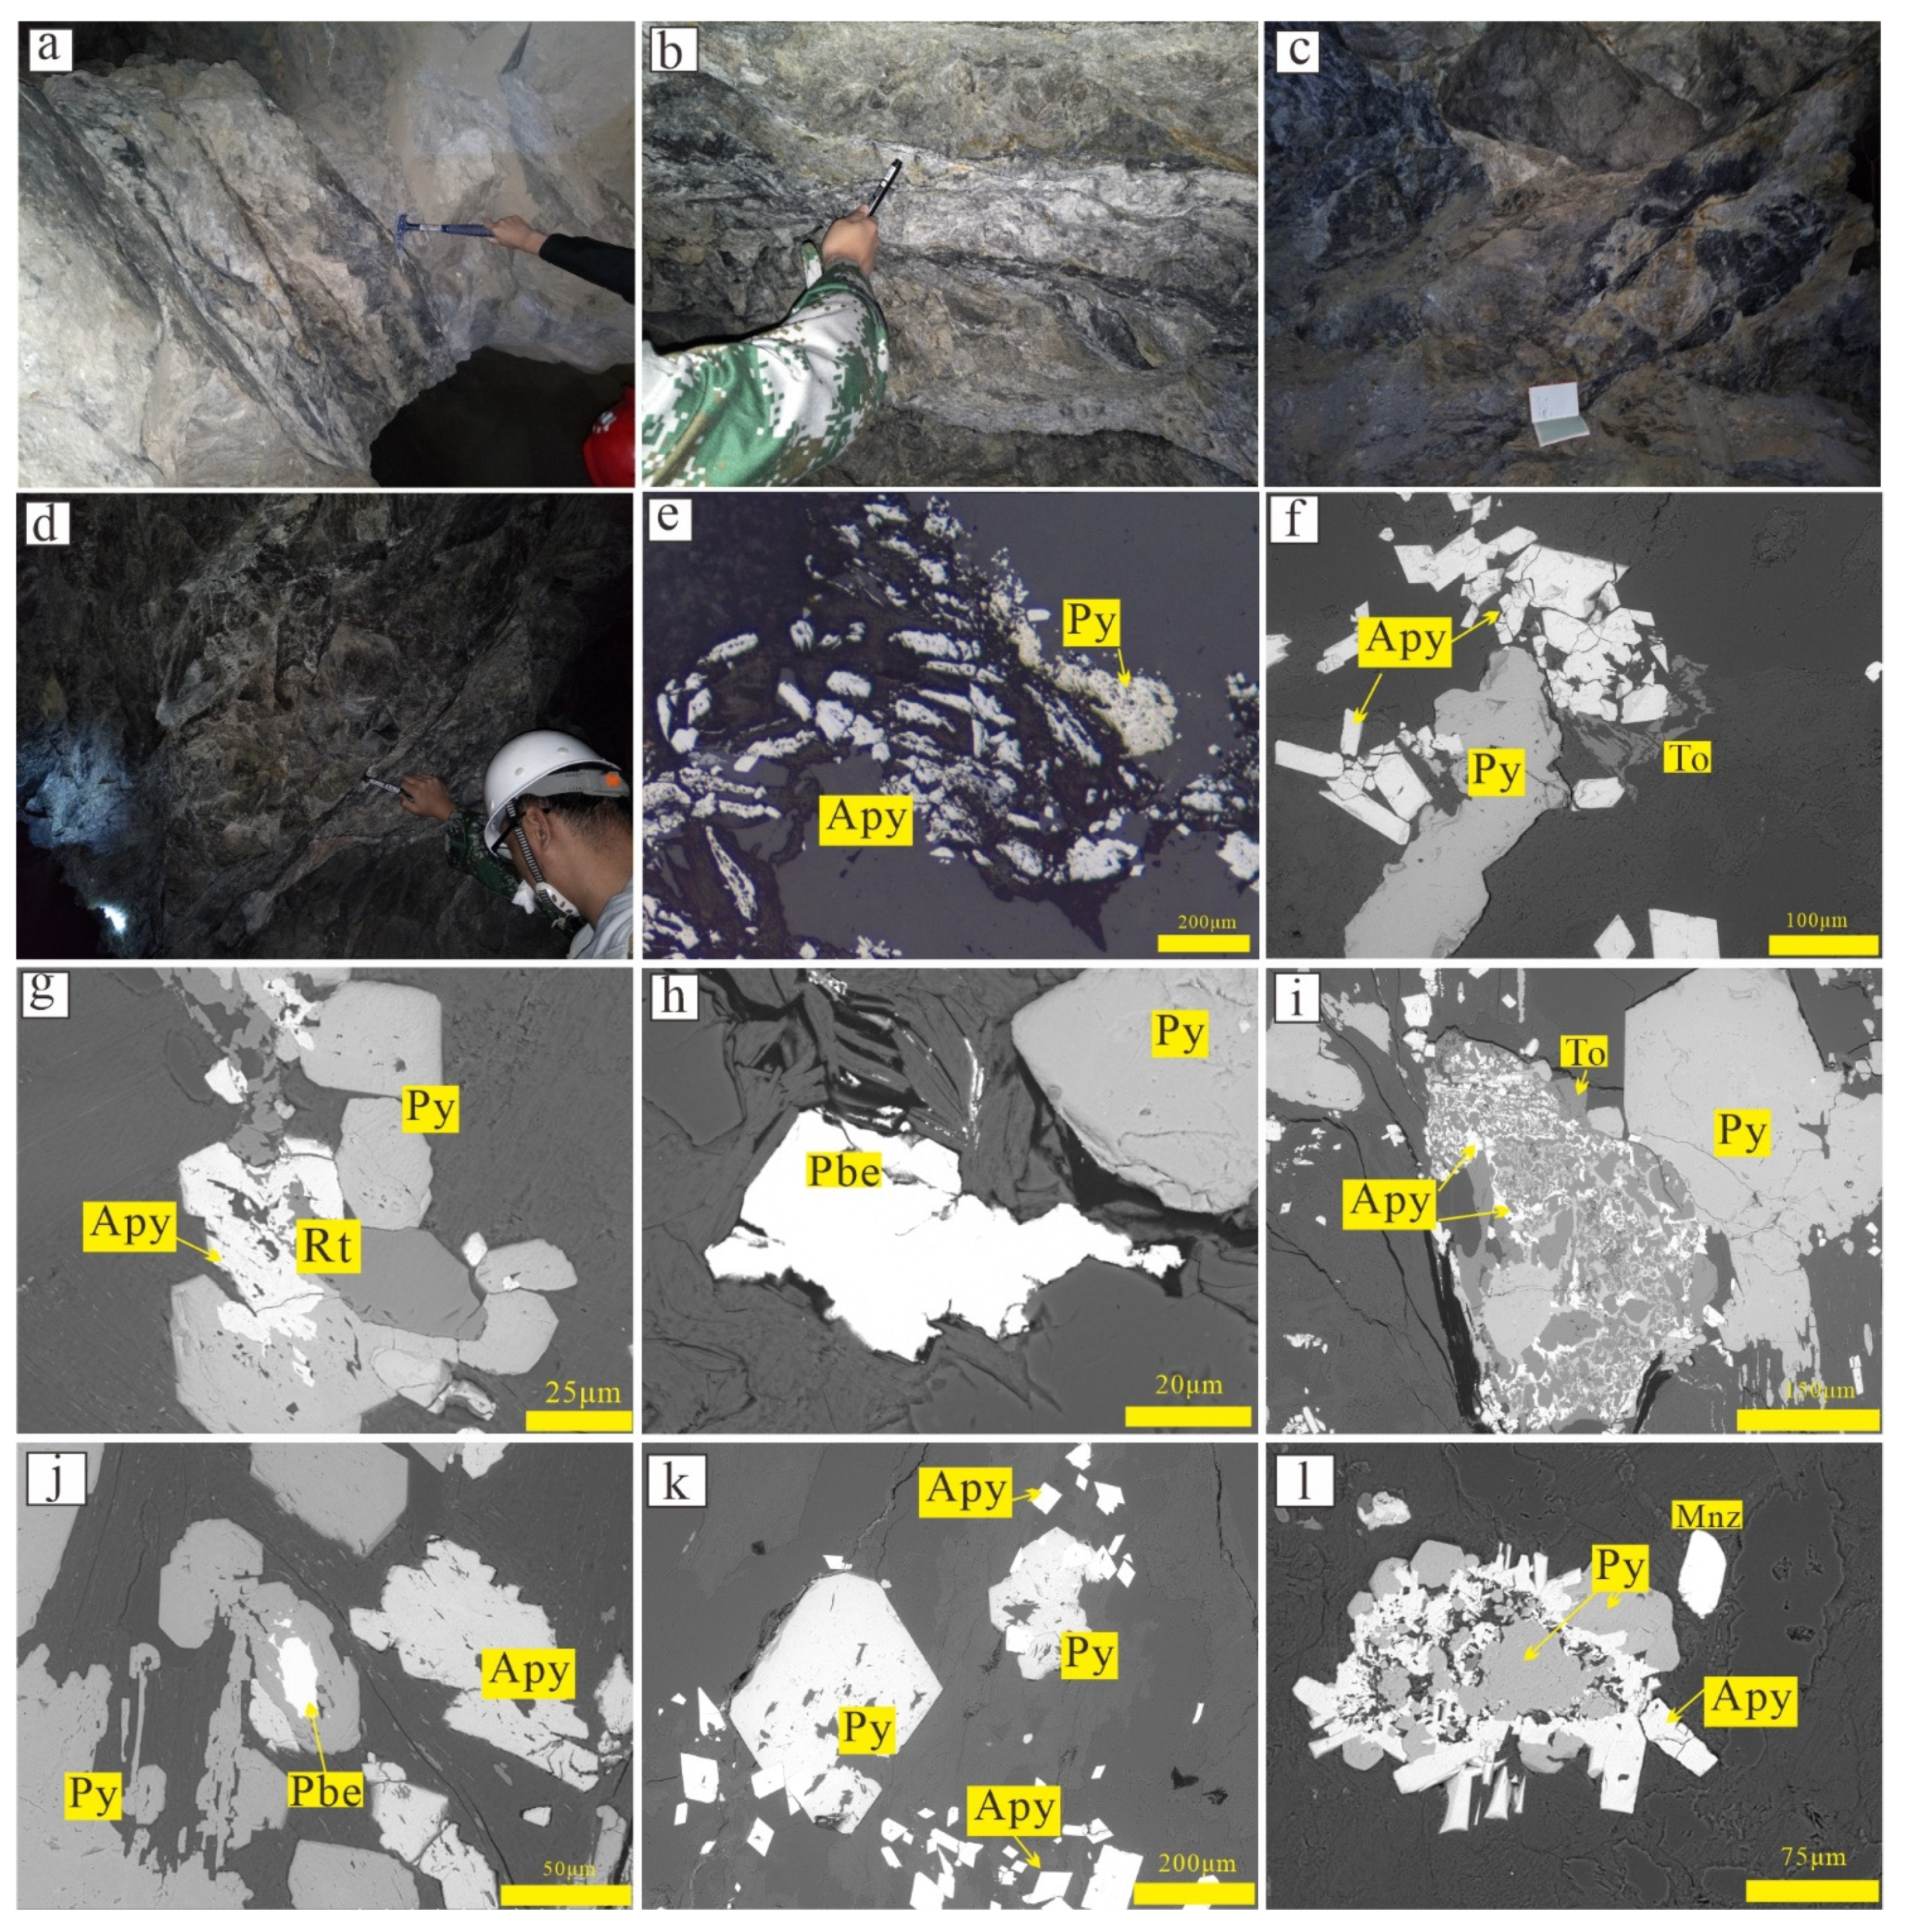
- The Yanjingou Au deposit is a fractured- and altered-type Au deposit that is rich in arsenopyrite.
- Element concentrations with a high correlation with Au are As > Cu > Co > Ti > Cd > Zn > Ag > Ba > Hg > Ni > Sb > Mo > Bi > W > Pb. Cluster analysis showed that Au and As were the most evident elemental anomalies.
- Axial element zoning determined with the concentration center and zoning index methods is consistent, and As, Hg, Ag, and Sb contents tend to cluster downward, suggesting good prospects for further deep mineralization.
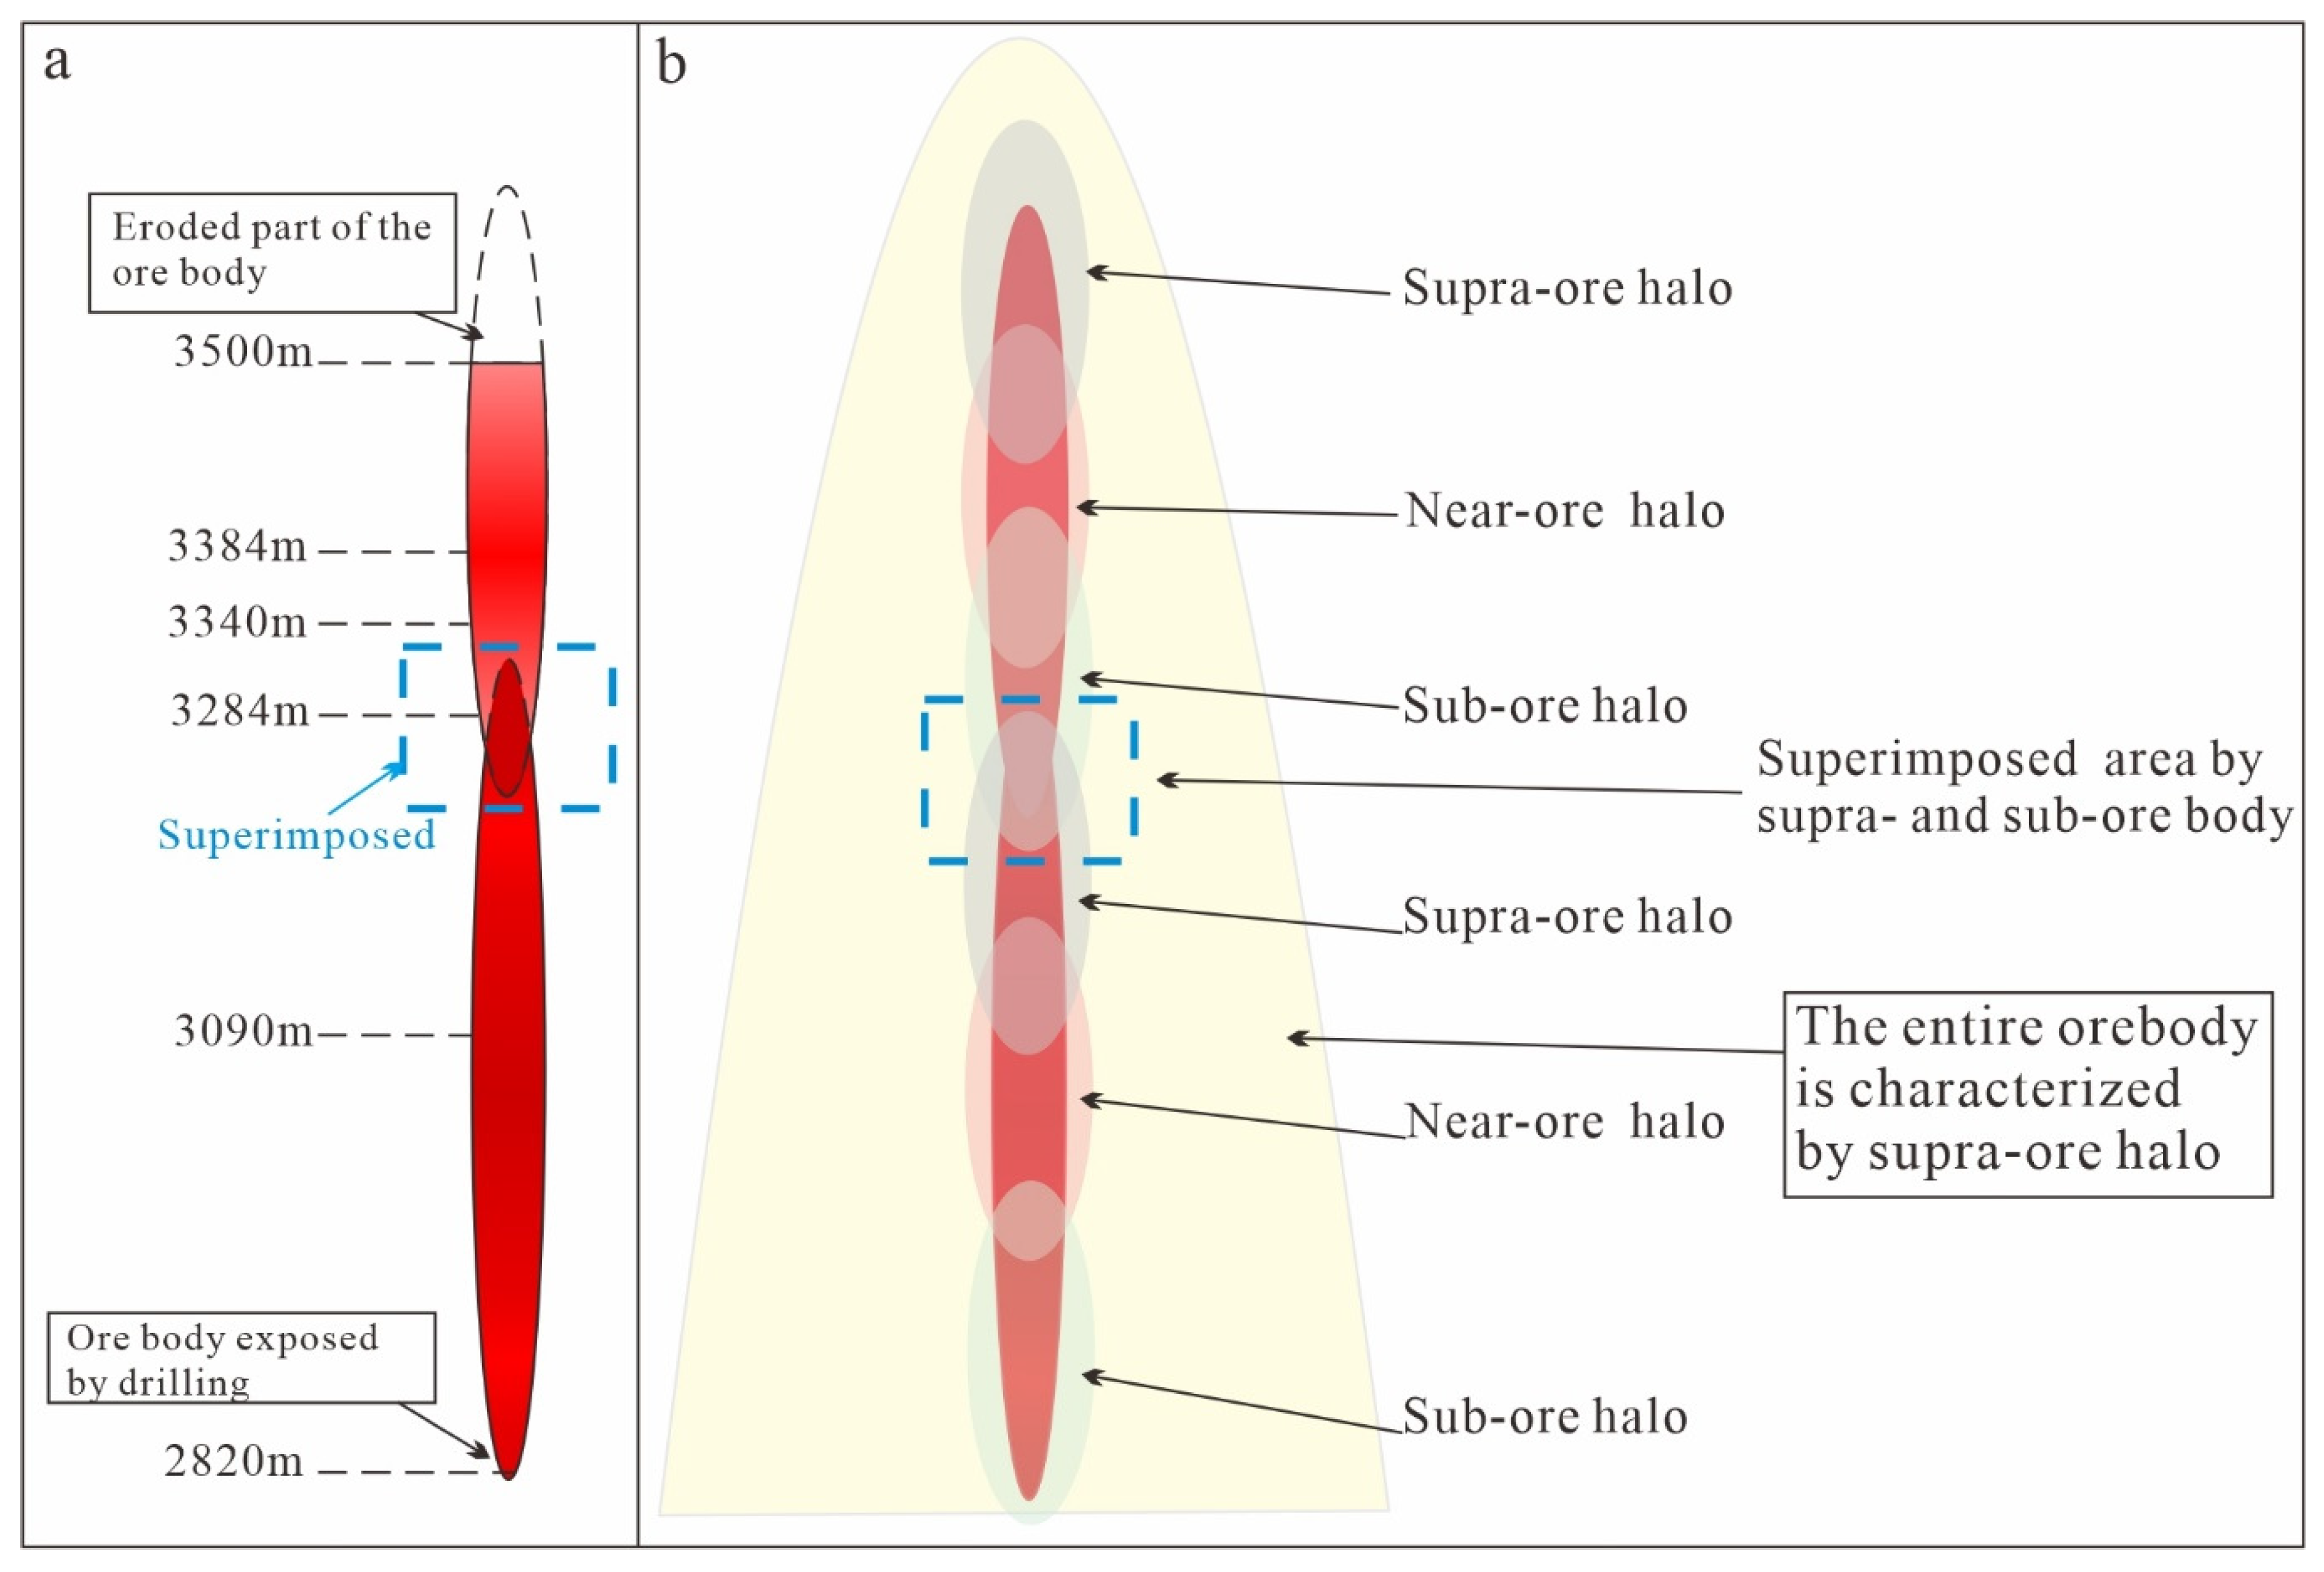
- Primary halo geochemistry showed the characteristics of supra-ore halo elements (As, Hg, Sb, Ag and Au), which indicate that the studied ore body is a supra-ore halo and represents the shallow part of the overall deposit.
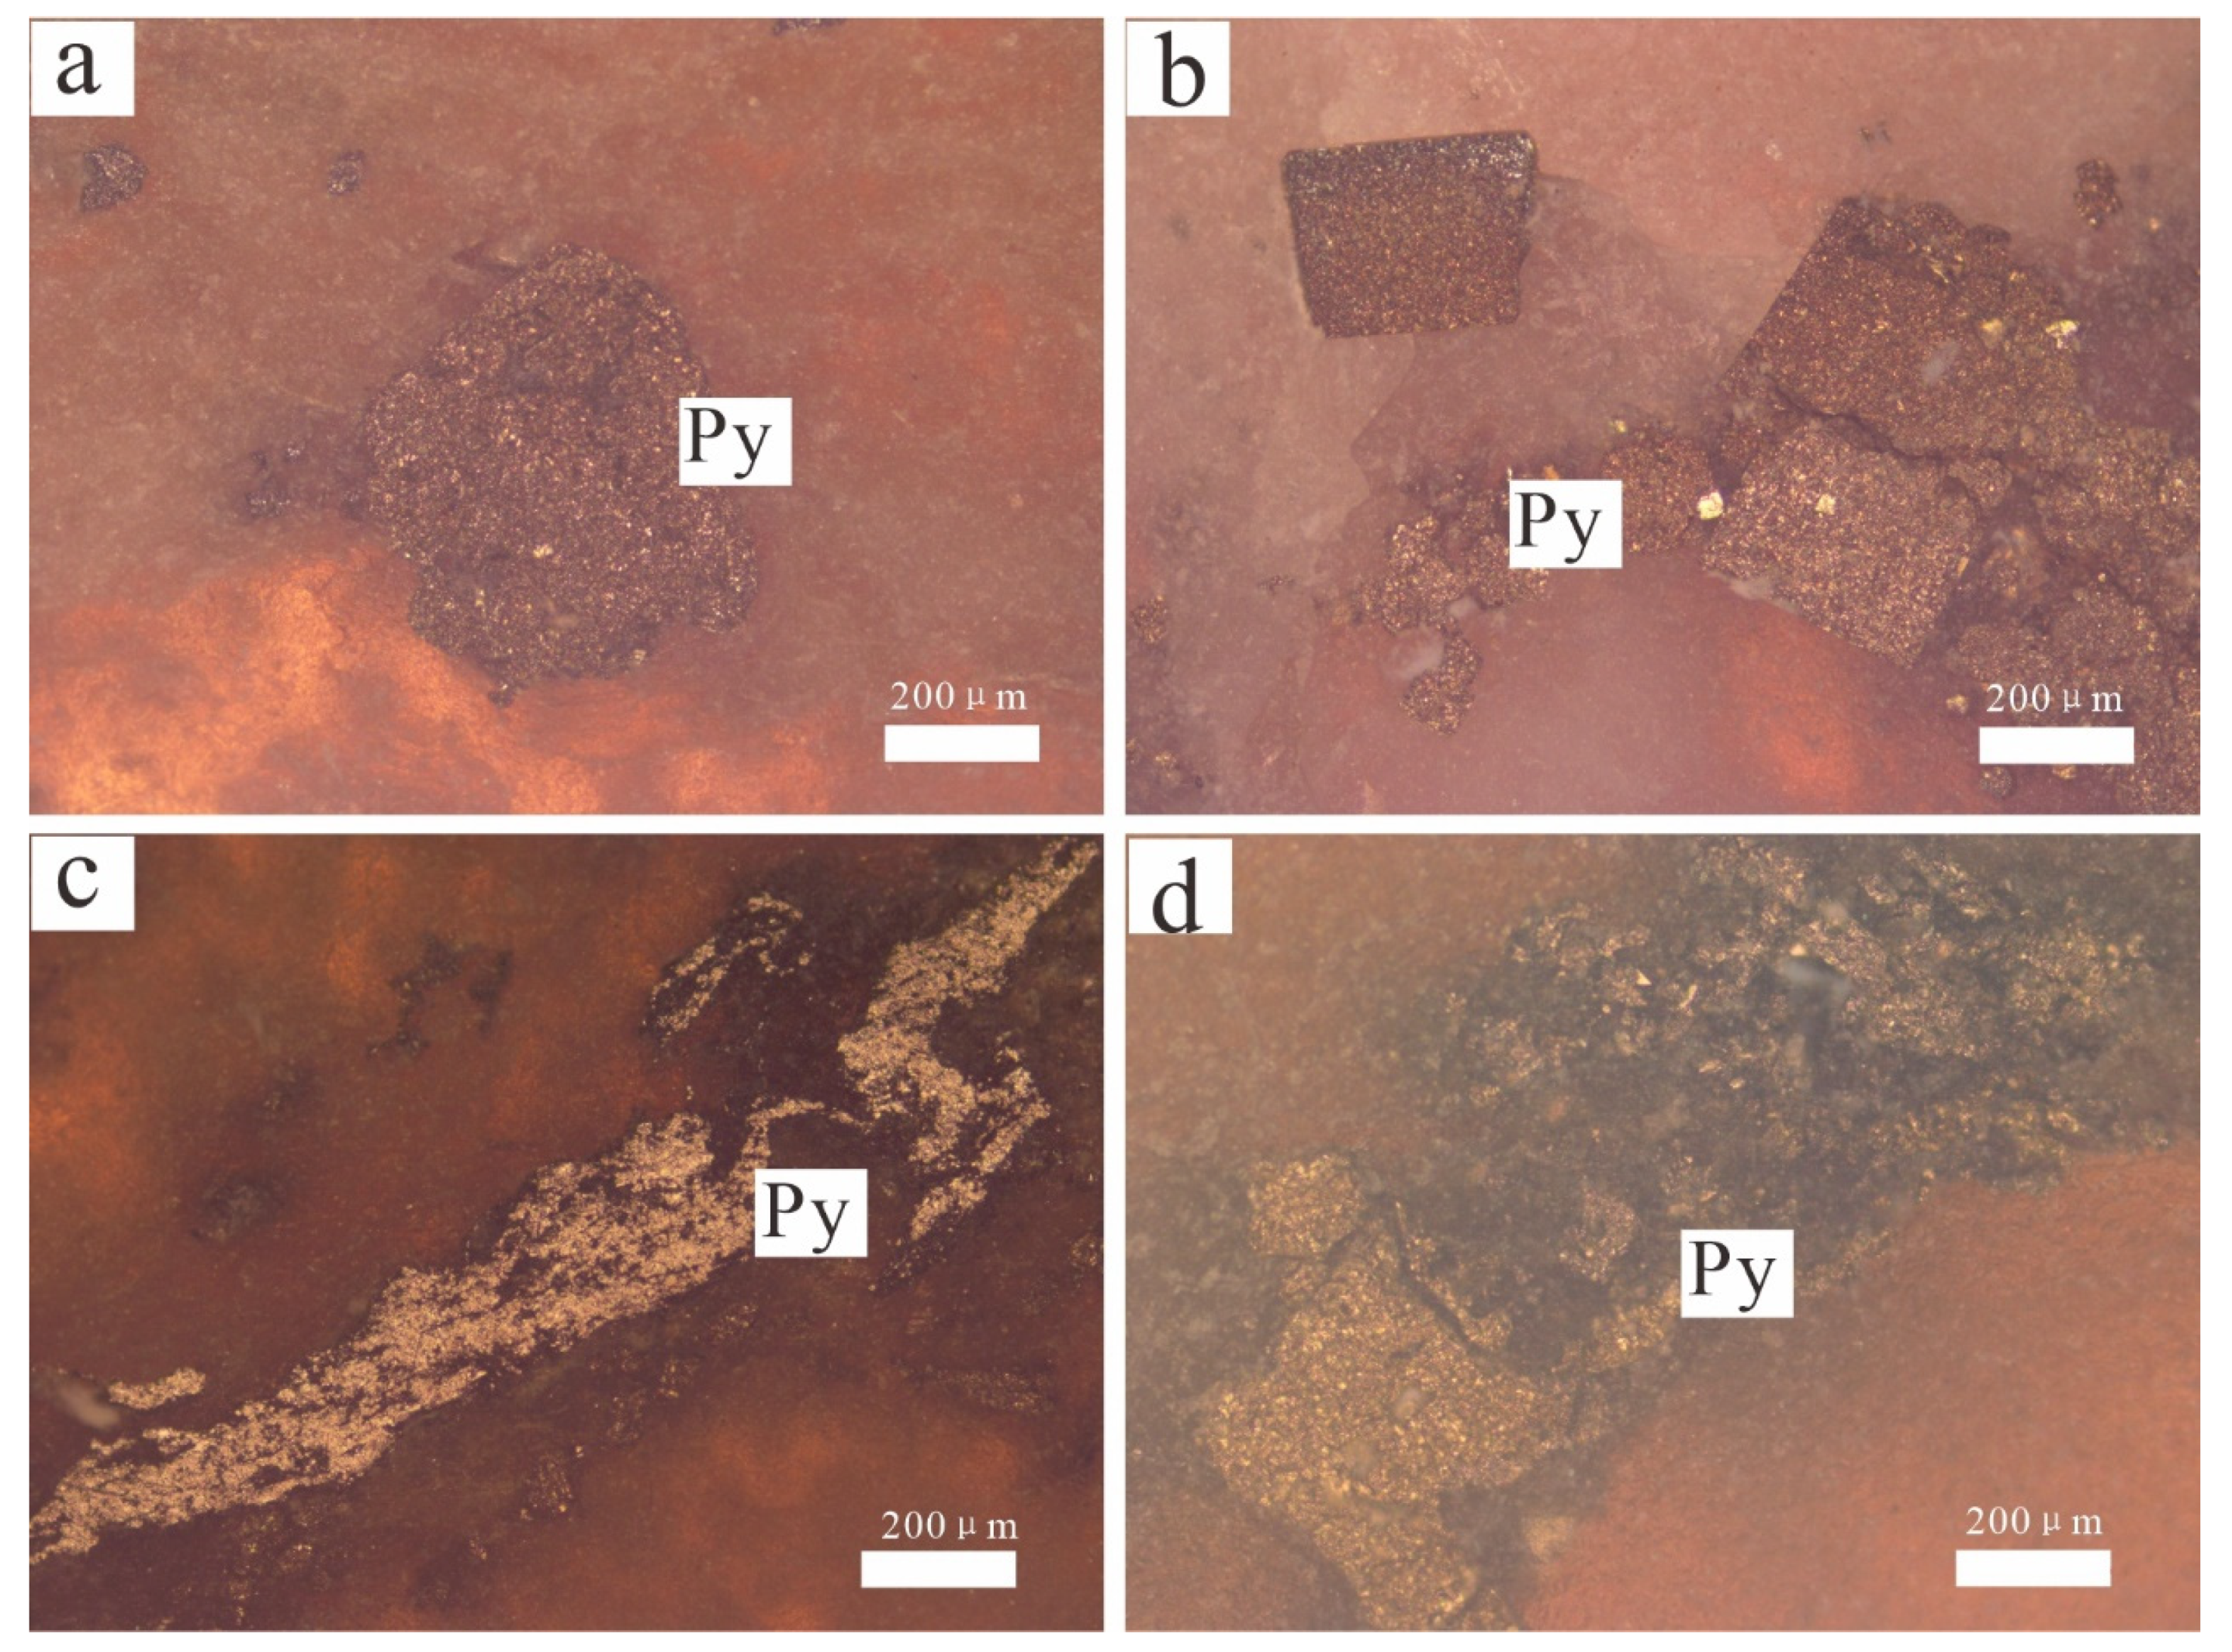
- In situ pyrite thermoelectric analysis showed that the observed ore body are dominated by P-type pyrite (>80%), and the amount of denudation is 50%, which again indicates that the ore body presents the shallow part of the deposit.
- A mineralization prediction model shows that the Yanjingou Au deposit has good mineralization and a high prospecting potential.
Supplementary Materials
Author Contributions
Funding
Data Availability Statement
Acknowledgments
Conflicts of Interest
References
- Groves, D.I.; Santosh, M. Craton and thick lithosphere margins: The sites of giant mineral deposits and mineral provinces. Gondwana Res. 2020. [Google Scholar] [CrossRef]
- Goldfarb, R.J.; Groves, D.I. Orogenic gold: Common or evolving fluid and metal sources through time. Lithos 2015, 233, 2–26. [Google Scholar] [CrossRef]
- Goldfarb, R.J.; Groves, D.I.; Gardoll, S. Orogenic gold and geologic time: A global synthesis. Ore Geol. Rev. 2001, 18, 1–75. [Google Scholar] [CrossRef]
- Groves, D.I.; Santosh, M.; Deng, J.; Wang, Q.; Yang, L.; Zhang, L. A holistic model for the origin of orogenic gold deposits and its implications for exploration. Miner. Depos. 2020, 55, 275–292. [Google Scholar] [CrossRef]
- Patten, C.G.C.; Pitcairn, I.K.; Molnár, F.; Kolb, J.; Beaudoin, G.; Guilmette, C.; Peillod, A. Gold mobilization during metamorphic devolatilization of Archean and Paleoproterozoic metavolcanic rocks. Geology 2020, 48, 1110–1114. [Google Scholar] [CrossRef]
- Chen, J.; Fu, L.; Selby, D.; Wei, J.; Zhao, X.; Zhou, H. Multiple episodes of gold mineralization in the East Kunlun Orogen, western Central Orogenic Belt, China: Constraints from Re-Os sulfide geochronology. Ore Geol. Rev. 2020, 123, 103587. [Google Scholar] [CrossRef]
- Zhang, J.; Ma, C.; Li, J.; Pan, Y. A possible genetic relationship between orogenic gold mineralization and post-collisional magmatism in the eastern Kunlun Orogen, western China. Ore Geol. Rev. 2017, 81, 342–357. [Google Scholar] [CrossRef]
- Groves, D.I.; Goldfarb, R.J.; Gebre-Mariam, M.; Hagemann, S.G.; Robert, F. Orogenic gold deposits: A proposed classification in the context of their crustal distribution and relationship to other gold deposit types. Ore Geol. Rev. 1998, 13, 7–27. [Google Scholar] [CrossRef]
- Li, X.H.; Fan, H.R.; Liang, G.Z.; Zhu, R.X.; Yang, K.F.; Steele-MacInnis, M.; Hu, H.L. Texture, trace elements, sulfur and He-Ar isotopes in pyrite: Implication for ore-forming processes and fluid source of the Guoluolongwa gold deposit, East Kunlun metallogenic belt. Ore Geol. Rev. 2021, 136, 104260. [Google Scholar] [CrossRef]
- Zhong, C.L.; Zhong, K.H.; Ran, F.Q. Geological Characters of Yanjingou Gold Mine in Qinghai Province Wulonggou Area. Sichuan Nonferrous Met. 2017, 1006–4079, 32-04, (In Chinese with English Abstract). [Google Scholar]
- Yuan, W.; Mo, X.; Zhang, A.; Chen, X.; Duan, H.; Li, X.; Hao, N.; Wang, X. Fission track thermochronology evidence for multiple periods of mineralization in the Wulonggou Gold deposits, eastern Kunlun Mountains, Qinghai Province. J. Earth Sci. 2013, 24, 471–478. [Google Scholar] [CrossRef]
- Chen, B.L.; Wang, Y.; Han, Y.; Chen, J.L. Metallogenic age of Yanjingou gold deposit in Wulonggou gold orefield, eastern Kunlun Mountains. Mineral. Depos. 2019, 38, 541–556, (In Chinese with English Abstract). [Google Scholar]
- Zhang, M. Characteristics of Cu-Pb-Zn in Ore-Bearing Structure of Yanjingou Gold Deposit in Dulan, Qinghai Province; Chengdu University of Technology: Chengdu, China, 2016; (In Chinese with English Abstract). [Google Scholar]
- Dong, Y. Study on Petrographic Characteristics of the Yanjingou Gold Deposit in Dulan County, Qinghai Province; Chengdu University of Technology: Chengdu, China, 2018; p. 71, (In Chinese with English Abstract). [Google Scholar]
- Xia, R.; Wang, C.; Qing, M.; Li, W.; Carranza, E.J.M.; Guo, X.; Ge, L.; Zeng, G. Zircon U–Pb dating, geochemistry and Sr–Nd–Pb–Hf–O isotopes for the Nan’getan granodiorites and mafic microgranular enclaves in the East Kunlun Orogen: Record of closure of the Paleo-Tethys. Lithos 2015, 234–235, 47–60. [Google Scholar] [CrossRef]
- Dong, Y.; He, D.; Sun, S.; Liu, X.; Zhou, X.; Zhang, F.; Yang, Z.; Cheng, B.; Zhao, G.; Li, J. Subduction and accretionary tectonics of the East Kunlun orogen, western segment of the Central China Orogenic System. Earth Sci. Rev. 2018, 186, 231–261. [Google Scholar] [CrossRef]
- Yu, M.; Dick, J.M.; Feng, C.; Li, B.; Wang, H. The tectonic evolution of the East Kunlun Orogen, northern Tibetan Plateau: A critical review with an integrated geodynamic model. J. Asian Earth Sci. 2020, 191, 104168. [Google Scholar] [CrossRef]
- Chen, L.; Sun, Y.; Pei, X.-Z.; Gao, M.; Feng, T. Northernmost paleo-tethyan oceanic basin in Tibet: Geochronological evidence from 40Ar/39Arage dating of Dur’ngoi ophiolite. Chin. Sci. Bull. 2001, 46, 1203–1205. [Google Scholar] [CrossRef]
- Chen, Y.X.; Pei, X.Z.; Li, R.B.; Li, Z.C.; Pei, L.; Chen, G.C.; Liu, C.J.; Li, X.B.; Yang, J. Zircon U-Pb age, geochemical and tectonic significance of metavolcanic rocks from Naij Tal Group, east section of east Kunlun. Earth Sci. Front. 2013, 20, 240–254, (in Chinese with English Abstract). [Google Scholar]
- Huang, H.; Niu, Y.; Nowell, G.; Zhao, Z.; Yu, X.; Zhu, D.-C.; Mo, X.; Ding, S. Geochemical constraints on the petrogenesis of granitoids in the East Kunlun Orogenic belt, northern Tibetan Plateau: Implications for continental crust growth through syn-collisional felsic magmatism. Chem. Geol. 2014, 370, 1–18. [Google Scholar] [CrossRef]
- Chen, N.; Sun, M.; Wang, Q.; Zhao, G.; Chen, Q.; Shu, G. EMP chemical ages of monazites from Central Zone of the eastern Kunlun Orogen: Records of multi-tectonometamorphic events. Chin. Sci. Bull. 2007, 52, 2252–2263. [Google Scholar] [CrossRef]
- Shao, F.; Niu, Y.; Liu, Y.; Chen, S.; Kong, J.; Duan, M. Petrogenesis of Triassic granitoids in the East Kunlun Orogenic Belt, northern Tibetan Plateau and their tectonic implications. Lithos 2017, 282–283, 33–44. [Google Scholar] [CrossRef] [Green Version]
- Ding, Q.-F.; Song, K.; Zhang, Q.; Yan, W.; Liu, F. Zircon U–Pb geochronology and Hf isotopic constraints on the petrogenesis of the Late Silurian Shidonggou granite from the Wulonggou area in the Eastern Kunlun Orogen, Northwest China. Int. Geol. Rev. 2018, 61, 1666–1689. [Google Scholar] [CrossRef]
- Zhao, X.; Wei, J.; Fu, L.; Huizenga, J.M.; Santosh, M.; Chen, J.; Wang, D.; Li, A. Multi-stage crustal melting from Late Permian back-arc extension through Middle Triassic continental collision to Late Triassic post-collisional extension in the East Kunlun Orogen. Lithos 2020, 360–361, 105446. [Google Scholar] [CrossRef]
- Chen, J.; Wei, J.; Fu, L.; Li, H.; Zhou, H.; Zhao, X.; Zhan, X.; Tan, J. Multiple sources of the Early Mesozoic Gouli batholith, Eastern Kunlun Orogenic Belt, northern Tibetan Plateau: Linking continental crustal growth with oceanic subduction. Lithos 2017, 29–293, 161–178. [Google Scholar] [CrossRef] [Green Version]
- Chen, J.; Fu, L.; Wei, J.; Selby, D.; Zhang, D.; Zhou, H.; Zhao, X.; Liu, Y. Proto-Tethys magmatic evolution along northern Gondwana: Insights from Late Silurian–Middle Devonian A-type magmatism, East Kunlun Orogen, Northern Tibetan Plateau, China. Lithos 2020, 356–357, 105304. [Google Scholar] [CrossRef]
- Bian, Q.-T.; Li, D.-H.; Pospelov, I.; Yin, L.-M.; Li, H.-S.; Zhao, D.-S.; Chang, C.-F.; Luo, X.-Q.; Gao, S.-L.; Astrakhantsev, O.; et al. Age, geochemistry and tectonic setting of Buqingshan ophiolites, North Qinghai-Tibet Plateau, China. J. Asian Earth Sci. 2004, 23, 577–596. [Google Scholar] [CrossRef]
- Liu, Z.Q.; Pei, X.Z.; Li, R.B.; Li, Z.C.; Chen, Y.X.; Gao, J.M.; Liu, C.J.; Wang, X.L.; Wei, F.G.; Zhang, G.; et al. Geological characteristics of the Buqingshan tectonic melange belt in the southern margin of East Kunlun and its tectonic implications. Geol. Bull. China 2011, 30, 1182–1195, (In Chinese with English Abstract). [Google Scholar]
- Xin, W.; Sun, F.-Y.; Li, L.; Yan, J.-M.; Zhang, Y.-T.; Wang, Y.-C.; Shen, T.-S.; Yang, Y.-J. The Wulonggou metaluminous A2-type granites in the Eastern Kunlun Orogenic Belt, NW China: Rejuvenation of subduction-related felsic crust and implications for post-collision extension. Lithos 2018, 312–313, 108–127. [Google Scholar] [CrossRef]
- Templ, M.; Filzmoser, P.; Reimann, C. Cluster analysis applied to regional geochemical data: Problems and possibilities. Appl. Geochem. 2008, 23, 2198–2213. [Google Scholar] [CrossRef]
- Zuo, R.; Xia, Q.; Wang, H. Compositional data analysis in the study of integrated geochemical anomalies associated with mineralization. Appl. Geochem. 2013, 28, 202–211. [Google Scholar] [CrossRef]
- Reimann, C.; Filzmoser, P.; Hron, K.; Kynclova, P.; Garrett, R.G. A new method for correlation analysis of compositional (environmental) data—A worked example. Sci. Total Environ. 2017, 607–608, 965–971. [Google Scholar] [CrossRef]
- Li, Y.; Zhang, D.; Dai, L.; Wan, G.; Hou, B. Characteristics of structurally superimposed geochemical haloes at the polymetallic Xiasai silver-lead-zinc ore deposit in Sichuan Province, SW China. J. Geochem. Explor. 2016, 169, 100–122. [Google Scholar] [CrossRef]
- Li, H.; Yu, B.; Wei, J. A new practical ideal model of structural superimposed halos for prediction of deep blind hydrothermal deposits and its significance. Geol. Explor. 2020, 56, 889–897, (In Chinese with English Abstract). [Google Scholar]
- Beus, A.A.; Gregorian, S.V. Geochemical Exploration Methods for Mineral. Deposits; Applied Publishing: Wilmette, IL, USA, 1977; p. 287. [Google Scholar]
- Harraz, H.Z.; Hamdy, M.M. Zonation of primary haloes of Atud auriferous quartz vein deposit, Central Eastern Desert of Egypt: A potential exploration model targeting for hidden mesothermal gold deposits. J. African Earth Sci. 2015, 101, 1–18. [Google Scholar] [CrossRef]
- Wu, J.C.; Shen, J.F.; Li, G.W.; Li, S.R.; Qiu, H.C.; He, Z.Y.; Li, J.P. The Improved Method for Measuring Thermoelectric Property of Pyrite and Its Implication for Exploring Gold Resources —A Case Study of the Wulong Gold Deposit in Liaoning Province. Bull. Mineral. Petrol. Geochem. 2020, 39, 284–292, (In Chinese with English Abstract). [Google Scholar]
- Pridmore, D.F.; Shuey, R.T. The electrical resistivity of galena, pyrite, and chalcopyrite. Am. Mineral. 1976, 61, 248–259. [Google Scholar]
- Chen, G.; Shao, W.; Sun, D. Genetic Mineralogy of Gold Deposits in Jiaodong Region with Emphasis on Gold Prospecting; Chongqing Publishing House: Chongqing, China, 1989. (In Chinese) [Google Scholar]
- Abraitis, P.K.; Pattrick, R.A.D.; Vaughan, D.J. Variations in the compositional, textural and electrical properties of natural pyrite: A review. Int. J. Mineral. Proces. 2004, 74, 41–59. [Google Scholar] [CrossRef]
- Shen, J.F.; Li, S.R.; Ma, G.G.; Liu, Y.; Yu, H.J.; Liu, H.M. Tyoomorphic characteristics of pyrite from the Linglong gold deposit: Its vertical variation and prospecting significance. Earth Sci. Front. 2013, 20, 55–75, (In Chinese with English Abstract). [Google Scholar]
- Xue, J.; Li, S.; Sun, W.; Zhang, Y.; Zhang, X. Characteristics of the genetic mineralogy of pyrite and its significance for prospecting in the Denggezhuang gold deposit, Jiaodong Peninsula, China. Sci. Chin. Earth Sci. 2014, 57, 644–661. [Google Scholar] [CrossRef]
- Wang, G.; Feng, Y.; Carranza, E.J.M.; Li, R.; Li, Z.; Feng, Z.; Zhao, X.; Wang, D.; Kong, L.; Jia, W.; et al. Typomorphic characteristics of pyrite: Criteria for 3D exploration targeting in the xishan gold deposit, China. J. Geochem. Explor. 2016, 164, 136–163. [Google Scholar] [CrossRef]
- Li, H.; Yu, B.; Wei, H.; Sun, F.Z.; Li, Y.C.; Wang, J.; Wei, Z.X.; Li, S. New breakthrough in the prediction of deep blind ore in mining area: Structural superimposed halo for blind ore method. Mineral. Explor. 2019, 10, 3070–3073, (In Chinese with English Abstract). [Google Scholar]
- Chen, Y.; Liu, H. Delineation of potential mineral resources region based on geo-anomaly unit. J. China Univ. Geosci. 2000, 11, 158–163, (In Chinese with English Abstract). [Google Scholar]
- Zhu, G. Metallogenic Analysis and Prediction Application of Typical Gold Deposits in East Kunlun Based on Structural Superposition: Taking Wulonggou Gold Deposit as an Example; Qinghai University: Qinghai, China, 2016; (In Chinese with English Abstract). [Google Scholar]
- Shen, J.F.; Li, S.R.; Du, B.S.; Wang, D.L.; Peng, Z.D.; Bo, H.J.; Li, K.; Liu, H.M.; Liu, S.Q. Minerals Alteration and Typomorph in Gold Deposit and Their Implications for Prospecting. Bull. Mineral. Petrol. Geochem. 2018, 37, 157–167, (In Chinese with English Abstract). [Google Scholar]
- Alam, M.; Li, S.-R.; Santosh, M.; Shah, A.; Yuan, M.-W.; Khan, H.; Qureshi, J.A.; Zeng, Y.-J. Morphological, thermoelectrical, geochemical and isotopic anatomy of auriferous pyrite from the Bagrote valley placer deposits, North Pakistan: Implications for ore genesis and gold exploration. Ore Geol. Rev. 2019, 112, 103008. [Google Scholar] [CrossRef]
- Li, C.-L.; Li, L.; Yuan, M.-W.; Alam, M.; Li, S.-R.; Santosh, M.; Deng, C.-Z.; Liu, H.; Xu, G.-Z. Study on pyrite thermoelectricity, ore-forming fluids and H-O-Rb-Sr isotopes of the Yongxin gold deposit, Central Asian Orogenic Belt: Implications for ore genesis and exploration. Ore Geol. Rev. 2020, 121, 103568. [Google Scholar] [CrossRef]
- Li, H.; Zhang, W.H.; Liu, B.L.; Wang, J.C.; Guo, R.X. The study on axial zonality sequence of primary halo and some criteria for the application of this sequence for major types of gold deposits in China. Geol. Explor. 1999, 35, 32–35, (In Chinese with English Abstract). [Google Scholar]
- Li, H.; Yu, B.; Li, D.L.; Zhang, G.Y. Prediction of blind ore bodies using structural superimposed halo and research methods. Geol. Explor. 2013, 49, 154–161, (In Chinese with English Abstract). [Google Scholar]
- Shao, Y. Study on primary element zoning of ore deposits and its application in geochemical prospecting. Geol. Explor. 1984, 2, 47–55, (In Chinese with English Abstract). [Google Scholar]
- Schieck, R.; Hartmann, A.; Fiechter, S.; Könenkamp, R.; Wetzel, H. Electrical properties of natural and synthetic pyrite (FeS2) crystals. J. Mater. Res. 2011, 5, 1567–1572. [Google Scholar] [CrossRef]
- Liu, H.N.; Liu, J.J.; Li, X.W.; Liu, C.H.; Dai, H.Z.; Tao, Y.L.; Wang, J.F.; Du, Y.D.; Fan, Y.F. Thermoelectric characteristics of pyrite from the Xindigou gold deposit in Inner Mongolia and its significance on deep prospecting. Geol. China 2018, 45, 819–838, (In Chinese with English Abstract). [Google Scholar]
- Morimoto, K. Relationship among the Trace Element Composition, Crystal Morphology and Physical Property of Natural Pyrite. Unpublished Ph.D. Thesis, Tohoku University, Sendai, Japan, 1992; p. 160. [Google Scholar]
- Fuchs, S.; Williams-Jones, A.E.; Przybylowicz, W.J. The origin of the gold and uranium ores of the Black Reef Formation, Transvaal Supergroup, South Africa. Ore Geol. Rev. 2016, 72, 149–164. [Google Scholar] [CrossRef] [Green Version]
- Fedikow, M.A.F.; Govett, G.J.S. Geochemical alteration haloes around the Mount Morgan gold–copper deposit, Queensland, Australia. J. Geochem. Explor. 1985, 24, 247–272. [Google Scholar] [CrossRef]
- Eilu, P.; Groves, D.I. Primary alteration and geochemical dispersion haloes of Archaean orogenic gold deposits in the Yilgarn Craton: The pre-weathering scenario. Geochem. Explor. Environ. Anal. 2001, 1, 183–200. [Google Scholar] [CrossRef]
- Goldberg, I.S.; Abramson, G.Y.; Los, V.L. Depletion and enrichment of primary haloes: Their importance in the genesis of and exploration for mineral deposits. Geochem. Explor. Environ. Anal. 2003, 3, 281–293. [Google Scholar] [CrossRef]


| Element | Au | Ag | Cu | Pb | Zn | Cd | Sb | W | Sn | As | Hg | Ba | Sc | Bi | Mo | Mn | Co | V | Ni | Ti | Cr |
|---|---|---|---|---|---|---|---|---|---|---|---|---|---|---|---|---|---|---|---|---|---|
| Au | 1 | 0.333 | 0.619 | 0.024 | 0.405 | 0.419 | 0.167 | 0.048 | −0.366 | 0.685 | 0.245 | 0.31 | −0.048 | 0.049 | 0.095 | −0.048 | 0.524 | 0.524 | 0.214 | 0.476 | −0.143 |
| Ag | 1 | 0.833 | 0.690 | 0.667 | 0.719 | 0.738 | −0.167 | −0.122 | 0.507 | 0.600 | 0.405 | −0.310 | 0.683 | 0.643 | −0.333 | 0.381 | 0.571 | 0.810 | 0.048 | 0.595 | |
| Cu | 1 | 0.429 | 0.857 | 0.874 | 0.381 | −0.119 | −0.268 | 0.482 | 0.709 | 0.452 | −0.095 | 0.488 | 0.429 | −0.095 | 0.500 | 0.667 | 0.667 | 0.167 | 0.333 | ||
| Pb | 1 | 0.476 | 0.539 | 0.595 | −0.048 | 0.317 | 0.507 | 0.300 | 0.048 | −0.071 | 0.854 | 0.310 | −0.762 | 0.143 | 0.262 | 0.548 | 0.167 | 0.119 | |||
| Zn | 1 | 0.994 | 0.286 | 0 | −0.098 | 0.482 | 0.846 | 0.405 | 0.286 | 0.683 | 0.524 | 0.480 | 0.619 | 0.690 | 0.571 | 0.286 | 0.238 | ||||
| Cd | 1 | 0.335 | 0.048 | −0.037 | 0.542 | 0.851 | 0.443 | 0.275 | 0.724 | 0.539 | −0.036 | 0.647 | 0.731 | 0.635 | 0.335 | 0.252 | |||||
| Sb | 1 | −0.333 | −0.244 | 0.52 | 0.136 | 0.381 | −0.286 | 0.512 | 0.619 | −0.262 | 0.310 | 0.405 | 0.381 | 0.024 | 0.429 | ||||||
| W | 1 | 0.805 | 0.368 | 0.327 | 0.333 | 0.619 | 0.146 | 0.048 | −0.119 | 0.524 | 0.429 | 0.357 | 0.786 | −0.095 | |||||||
| Sn | 1 | 0.156 | 0.140 | 0.073 | 0.488 | 0.325 | −0.098 | −0.488 | 0.146 | 0.122 | 0.317 | 0.512 | −0.146 | ||||||||
| As | 1 | 0.407 | 0.457 | 0.241 | 0.585 | 0.444 | −0.355 | 0.774 | 0.736 | 0.495 | 0.786 | −0.013 | |||||||||
| Hg | 1 | 0.382 | 0.273 | 0.671 | 0.709 | 0.164 | 0.655 | 0.682 | 0.791 | 0.327 | 0.546 | ||||||||||
| Ba | 1 | 0.452 | 0.098 | 0.310 | 0.143 | 0.786 | 0.881 | 0.357 | 0.548 | 0.119 | |||||||||||
| Sc | 1 | 0.122 | −0.048 | 0.214 | 0.595 | 0.476 | −0.595 | −0.385 | −0.675 | ||||||||||||
| Bi | 1 | 0.659 | −0.415 | 0.415 | 0.439 | 0.708 | 0.293 | 0.366 | |||||||||||||
| Mo | 1 | 0.214 | 0.548 | 0.524 | 0.667 | 0.119 | 0.810 | ||||||||||||||
| Mn | 1 | 0.167 | 0.048 | −0.310 | −0.19 | 0.214 | |||||||||||||||
| Co | 1 | 0.952 | 0.476 | 0.810 | 0.119 | ||||||||||||||||
| V | 1 | 0.595 | 0.714 | 0.190 | |||||||||||||||||
| Ni | 1 | 0.286 | 0.667 | ||||||||||||||||||
| Ti | 1 | −0.310 | |||||||||||||||||||
| Cr | 1 |
| Element | As | Hg | Sb | Ag | Au | W | Mo | Ni | |
|---|---|---|---|---|---|---|---|---|---|
| Zoning index method/ wall-rock | 3384 m | 0.3318 | 0.0552 | 0.0351 | 0.0901 | 0.0737 | 0.1138 | 0.1888 | 0.1115 |
| 3340 m | 0.3553 | 0.0009 | 0.0141 | 0.0770 | 0.0814 | 0.3051 | 0.0249 | 0.1413 | |
| 3284 m | 0.3047 | 0.0499 | 0.0783 | 0.1925 | 0.0134 | 0.0999 | 0.1355 | 0.1257 | |
| 3090 m | 0.3984 | 0.0801 | 0.0014 | 0.0448 | 0.0430 | 0.2983 | 0.0578 | 0.0763 | |
| Variation index (gradient difference) | Au | W | Ni | Sb | Ag | As | Hg | ||
| −6.8691 | −1.3960 | −1.7096 | −48.7073 | 0.3446 | 3.6291 | 88.3508 | |||
| Zoning index method/ Wulonggou Au district | 3384 m | 0.3494 | 0.0694 | 0.0579 | 0.0932 | 0.0774 | 0.0547 | 0.2434 | 0.0547 |
| 3340 m | 0.4013 | 0.0278 | 0.0667 | 0.0830 | 0.0913 | 0.1850 | 0.1377 | 0.0074 | |
| 3284 m | 0.3177 | 0.0610 | 0.0981 | 0.1989 | 0.0139 | 0.0523 | 0.1770 | 0.0810 | |
| 3090 m | 0.4186 | 0.0949 | 0.0217 | 0.0457 | 0.0451 | 0.2499 | 0.1044 | 0.0197 | |
| Variation index (gradient difference) | Sb | Ag | Ni | As | Hg | W | |||
| −1.349 | 0.1774 | 8.3743 | 8.4496 | 6.3448 | 10.7024 | ||||
| Concentration center method/ | 3384 m | 0.2594 | 0.2753 | 0.2507 | 0.2199 | 0.4319 | 0.1672 | 0.4411 | 0.2728 |
| 3340 m | 0.1225 | 0.0021 | 0.0445 | 0.0829 | 0.2102 | 0.1976 | 0.0256 | 0.1523 | |
| wall-rock | 3284 m | 0.2961 | 0.3097 | 0.6946 | 0.5840 | 0.0975 | 0.1824 | 0.3936 | 0.3821 |
| 3090 m | 0.3220 | 0.4129 | 0.0102 | 0.1132 | 0.2604 | 0.4529 | 0.1397 | 0.1928 | |
| Variation index (gradient difference) | As | Hg | W | Au | Mo | Sb | Ag | Ni | |
| 4.9572 | 202.8333 | 7.4847 | 8.1441 | 21.4915 | −49.5108 | 4.5435 | 1.9274 | ||
| Concentration center method/ | 3384 m | 0.2594 | 0.2712 | 0.2505 | 0.2196 | 0.4317 | 0.1201 | 0.3861 | 0.3043 |
| 3340 m | 0.1230 | 0.0448 | 0.1192 | 0.0807 | 0.2103 | 0.1678 | 0.0902 | 0.0169 | |
| Wulonggou Au district | 3284 m | 0.2959 | 0.2995 | 0.5330 | 0.5883 | 0.0977 | 0.1439 | 0.3522 | 0.5652 |
| 3090 m | 0.3217 | 0.3844 | 0.0974 | 0.1114 | 0.2603 | 0.5682 | 0.1715 | 0.1135 | |
| Variation index (gradient difference) | As | Hg | W | Au | Mo | Sb | Ag | Ni | |
| 4.9427 | 11.2766 | 12.0635 | 8.1316 | 7.6277 | 1.1266 | 4.6866 | 30.3070 | ||
| (ppm) | 3384 m | 3340 m | 3284 m | 3090 m | Wulonggou | Wall-Rock | Whole Ore Body |
|---|---|---|---|---|---|---|---|
| As | 8066.7 | 3835 | 9200 | 10000 | 18.4 | 49.5 | 7533.75 |
| Hg | 0.023 | 0.01 | 0.025 | 0.03 | 0.00736 | 0.01 | 0.021 |
| Sb | 134.2 | 64.3 | 284.5 | 52.7 | 0.89 | 49.235 | 144.1 |
| Ba | 270 | 240 | 280 | 240 | 553 | 965 | 261.25 |
| Pb | 6.5 | 6.4 | 360.8 | 9.7 | 33 | 17.8 | 95.45 |
| Ag | 2.2 | 0.86 | 5.82 | 1.16 | 0.071 | 0.04 | 2.65 |
| Au | 17.8 | 8.68 | 4.04 | 10.75 | 0.0039 | 0.016 | 11.21 |
| Zn | 202.7 | 45.5 | 277 | 177 | 91 | 84 | 178.75 |
| Cu | 23.3 | 6.8 | 27.3 | 7.7 | 33 | 8.45 | 18.24 |
| W | 3.2 | 3.7 | 3.45 | 7.9 | 1.94 | 0.45 | 3.98 |
| Bi | 0.053 | 0.03 | 0.21 | 0.15 | 0.35 | 0.06 | 0.099 |
| Mo | 6.5 | 2.17 | 5.98 | 3.35 | 0.86 | 1.905 | 4.88 |
| Ni | 31 | 19.1 | 41.8 | 23.1 | 18.4 | 4.05 | 29.74 |
| Cd | 0.5 | 0.11 | 1.31 | 0.61 | 0.13 | 0.05 | 0.61 |
| Co | 13.8 | 5.8 | 12.25 | 14.3 | 10.7 | 7.55 | 11.48 |
| Ti | 2370 | 1570 | 1940 | 3860 | 3502 | 3650 | 2250 |
| Relative to Wall-Rock | Relative to the Wulonggou Au District | ||||||||||
|---|---|---|---|---|---|---|---|---|---|---|---|
| 3384 m | 3340 m | 3284 m | 3090 m | Whole Ore Body | 3384 m | 3340 m | 3284 m | 3090 m | Whole Ore Body | ||
| As | 162.96 | 77.47 | 185.86 | 202.02 | 152.20 | 438.41 | 208.42 | 500.00 | 543.48 | 409.44 | |
| Hg | 2.30 | 1.00 | 2.50 | 3.00 | 2.10 | 3.13 | 1.36 | 3.40 | 4.08 | 2.85 | |
| Sb | 2.73 | 1.31 | 5.78 | 1.07 | 2.93 | 150.79 | 72.25 | 319.66 | 59.21 | 161.91 | |
| Ba | 0.28 | 0.25 | 0.29 | 0.25 | 0.27 | 0.49 | 0.43 | 0.51 | 0.43 | 0.47 | |
| Pb | 0.37 | 0.36 | 20.27 | 0.54 | 5.36 | 0.20 | 0.19 | 10.93 | 0.29 | 2.89 | |
| Ag | 55.00 | 21.50 | 145.50 | 29.00 | 66.25 | 30.99 | 12.11 | 81.97 | 16.34 | 37.32 | |
| Au | 1112.50 | 542.50 | 252.50 | 671.88 | 700.63 | 4564.10 | 2225.64 | 1035.90 | 2756.41 | 2874.36 | |
| Zn | 2.41 | 0.54 | 3.30 | 2.11 | 2.13 | 2.23 | 0.50 | 3.04 | 1.95 | 1.96 | |
| Cu | 2.76 | 0.80 | 3.23 | 0.91 | 2.16 | 0.71 | 0.21 | 0.83 | 0.23 | 0.55 | |
| W | 7.11 | 8.22 | 7.67 | 17.56 | 8.84 | 1.65 | 1.91 | 1.78 | 4.07 | 2.05 | |
| Bi | 0.88 | 0.50 | 3.50 | 2.50 | 1.65 | 0.15 | 0.09 | 0.60 | 0.43 | 0.28 | |
| Mo | 3.41 | 1.14 | 3.14 | 1.76 | 2.56 | 7.56 | 2.52 | 6.95 | 3.90 | 5.67 | |
| Ni | 7.65 | 4.72 | 10.32 | 5.70 | 7.34 | 1.68 | 1.04 | 2.27 | 1.26 | 1.62 | |
| Cd | 10.00 | 2.20 | 26.20 | 12.20 | 12.20 | 3.85 | 0.85 | 10.08 | 4.69 | 4.69 | |
| Co | 1.83 | 0.77 | 1.62 | 1.89 | 1.52 | 1.29 | 0.54 | 1.14 | 1.34 | 1.07 | |
| Ti | 0.65 | 0.43 | 0.53 | 1.06 | 0.62 | 0.68 | 0.45 | 0.55 | 1.10 | 0.64 | |
Publisher’s Note: MDPI stays neutral with regard to jurisdictional claims in published maps and institutional affiliations. |
© 2021 by the authors. Licensee MDPI, Basel, Switzerland. This article is an open access article distributed under the terms and conditions of the Creative Commons Attribution (CC BY) license (https://creativecommons.org/licenses/by/4.0/).
Share and Cite
Wu, J.; Zeng, Q.; Wei, Z.; Fan, H.; Yang, K.; Zhang, Z.; Li, X.; Liang, G.; Xia, F. Prospecting Potential of the Yanjingou Gold Deposit in the East Kunlun Orogen, NW China: Evidence from Primary Halo Geochemistry and In Situ Pyrite Thermoelectricity. Minerals 2021, 11, 1117. https://doi.org/10.3390/min11101117
Wu J, Zeng Q, Wei Z, Fan H, Yang K, Zhang Z, Li X, Liang G, Xia F. Prospecting Potential of the Yanjingou Gold Deposit in the East Kunlun Orogen, NW China: Evidence from Primary Halo Geochemistry and In Situ Pyrite Thermoelectricity. Minerals. 2021; 11(10):1117. https://doi.org/10.3390/min11101117
Chicago/Turabian StyleWu, Jinjian, Qingdong Zeng, Zhanhao Wei, Hongrui Fan, Kuifeng Yang, Zheming Zhang, Xinghui Li, Gaizhong Liang, and Fan Xia. 2021. "Prospecting Potential of the Yanjingou Gold Deposit in the East Kunlun Orogen, NW China: Evidence from Primary Halo Geochemistry and In Situ Pyrite Thermoelectricity" Minerals 11, no. 10: 1117. https://doi.org/10.3390/min11101117