
Mg/Ca Ratios in Synthetic Low-Magnesium Calcite: An Experimental Investigation

 , ,
, ,  ,
,
Abstract
:1. Introduction
2. Materials and Methods
2.1. Calcite Precipitation
2.2. Experimental Design
2.3. Analysis of Fluids
2.3.1. Atomic Absorption
2.3.2. Alkalinity Titrations
2.4. Analysis of Solids
2.4.1. ICP-OES
2.4.2. X-ray Diffraction (XRD) Analysis
2.4.3. Scanning Electron Microscopy (SEM) Imaging
3. Results
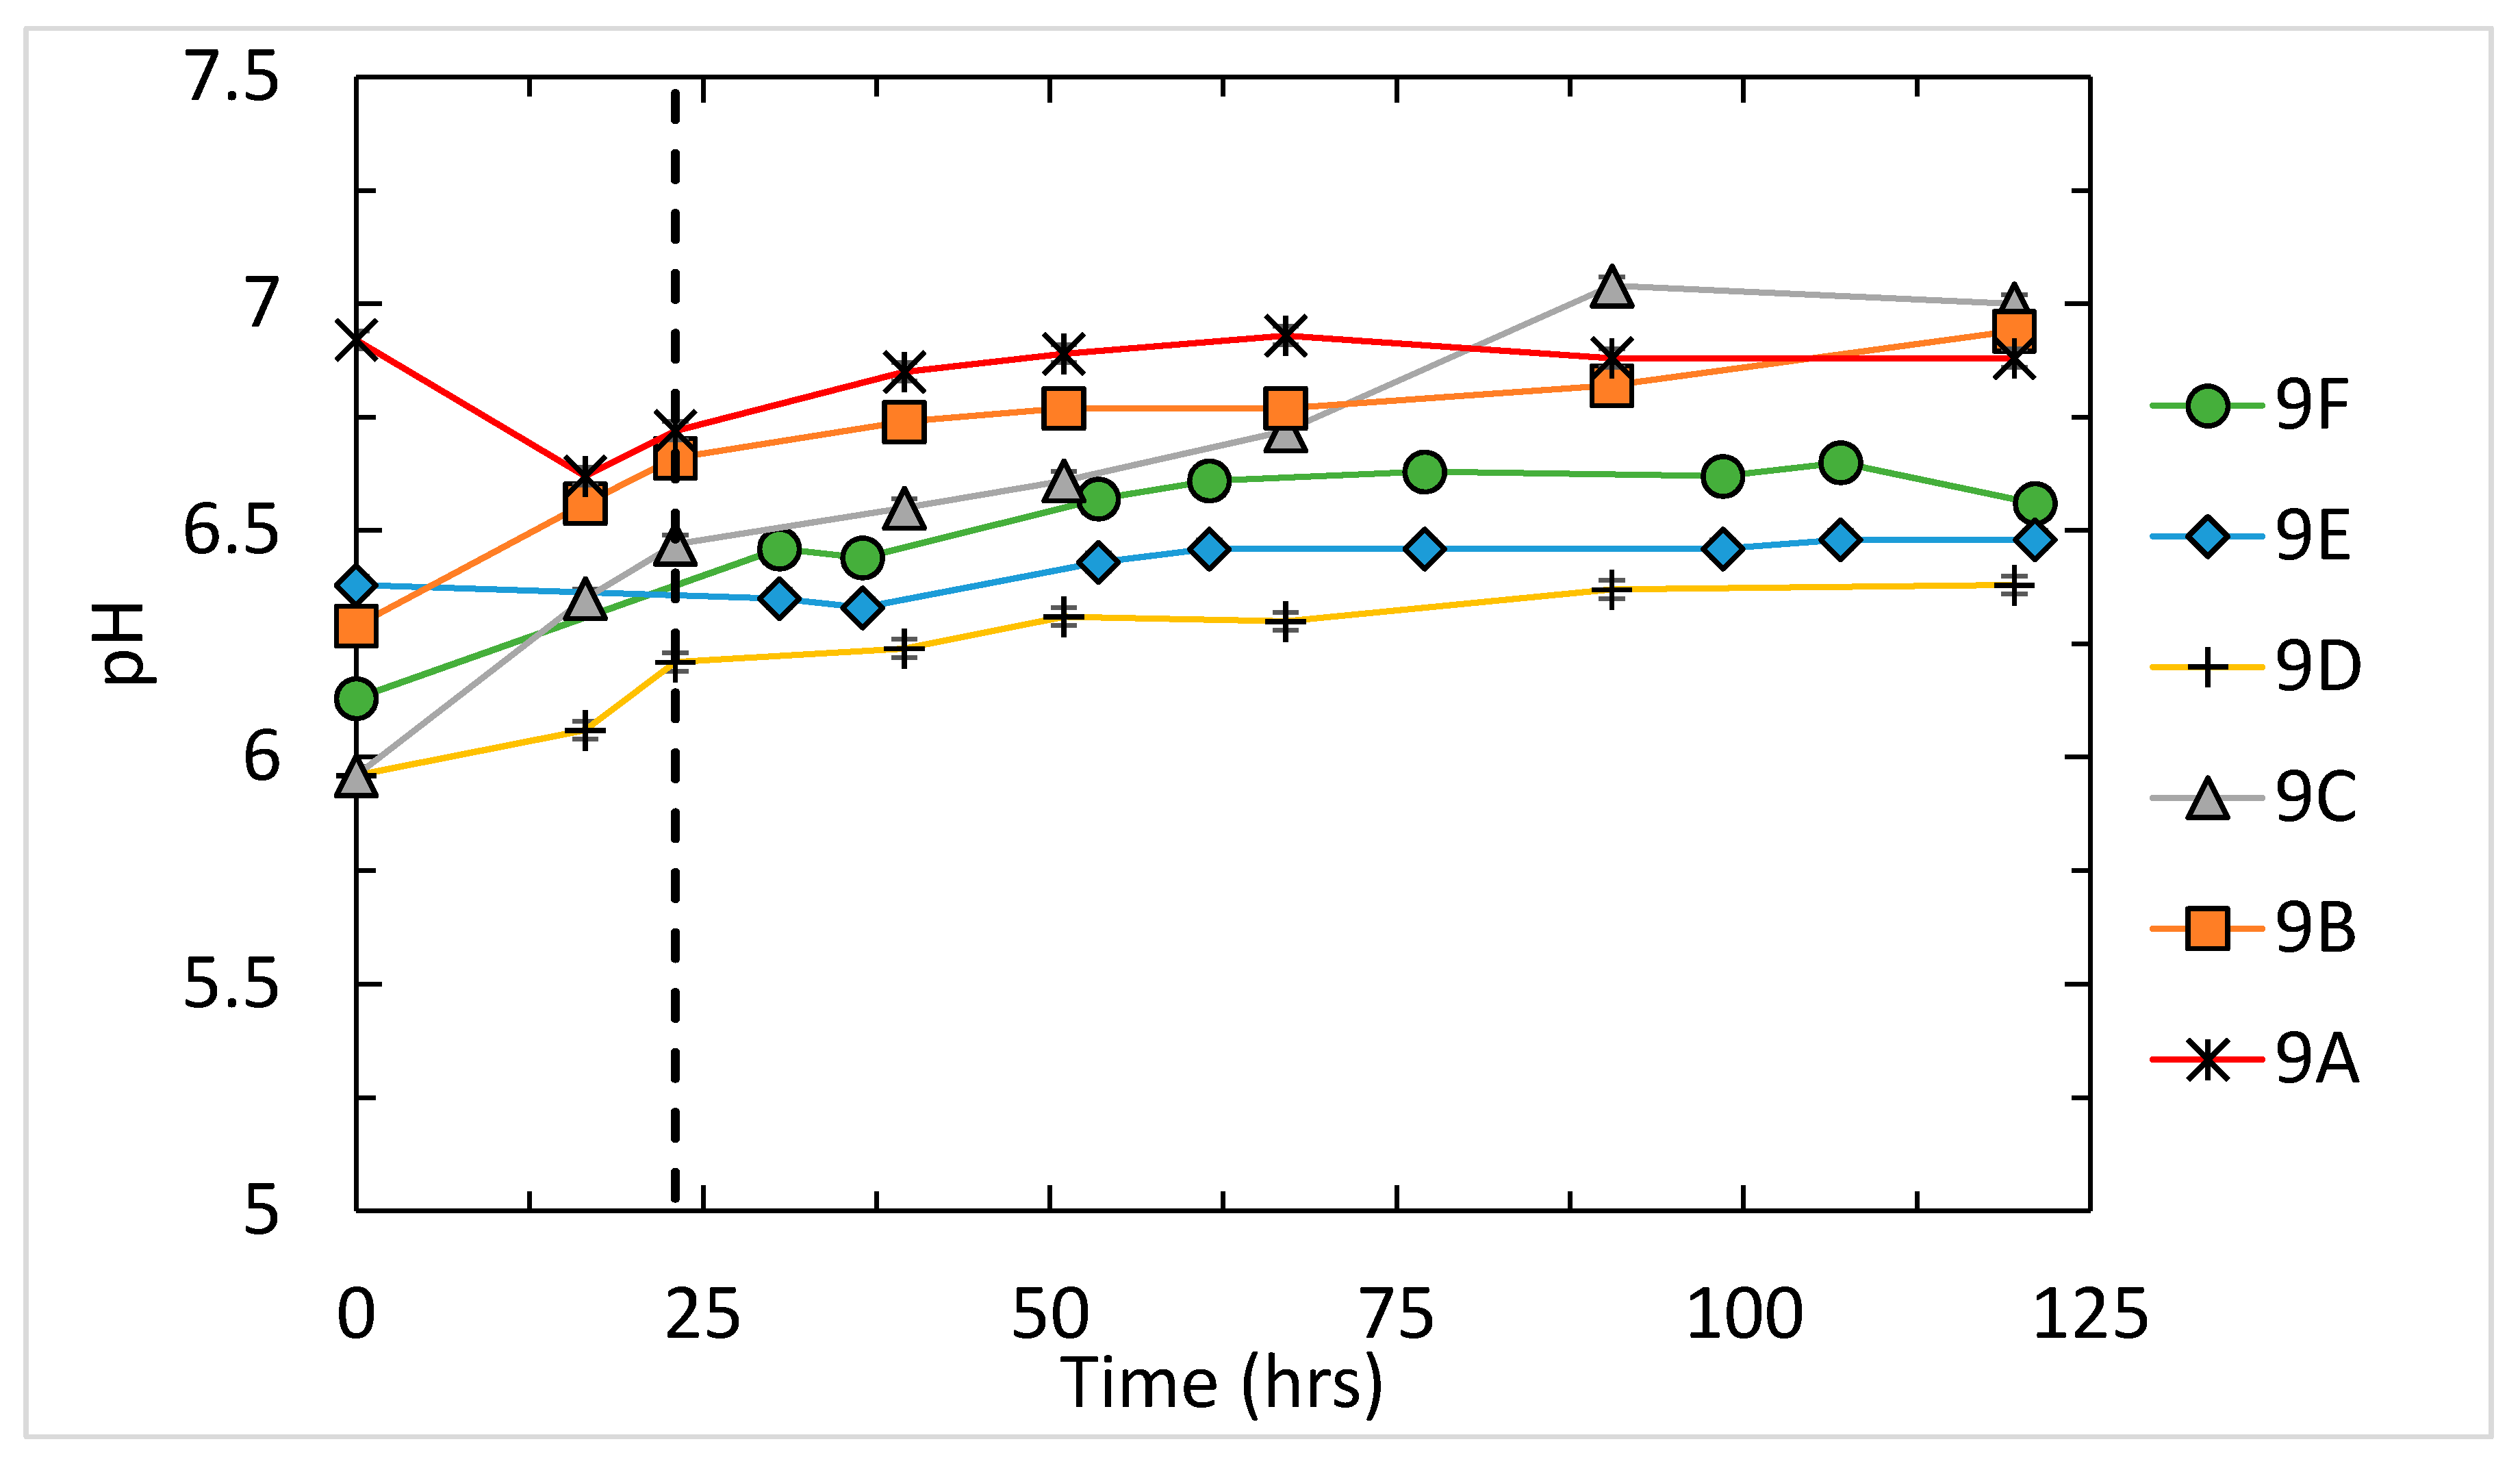
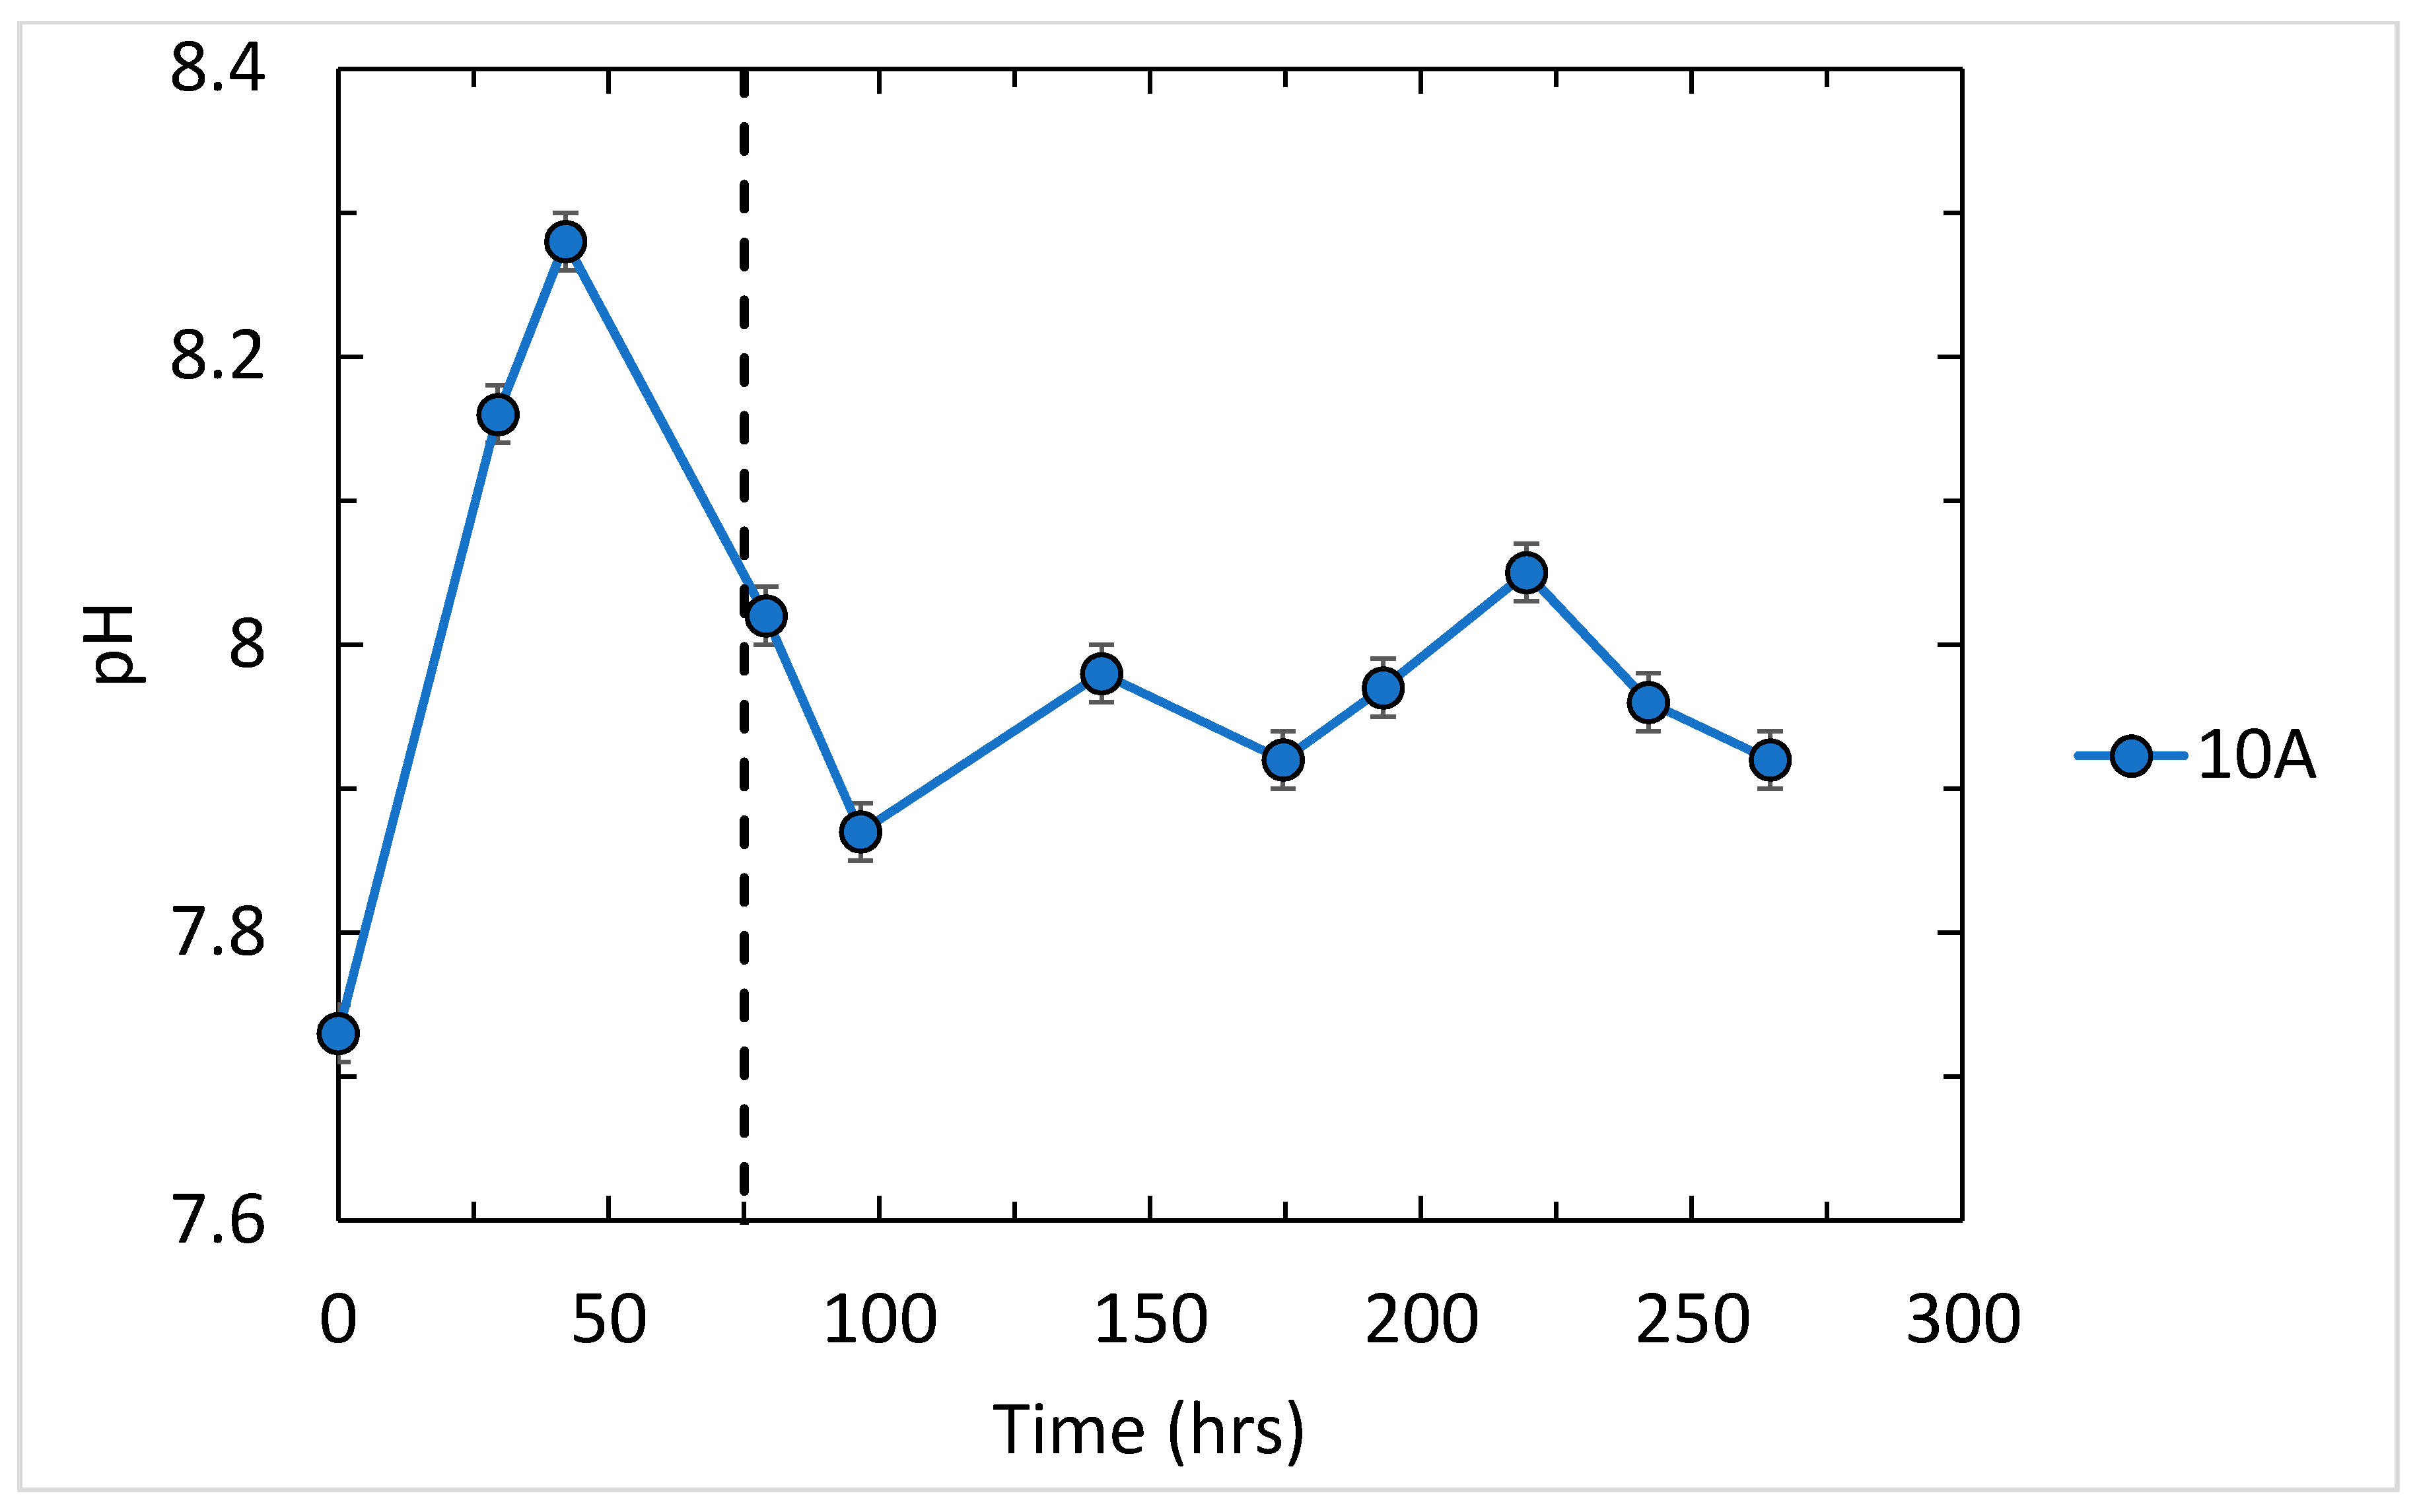
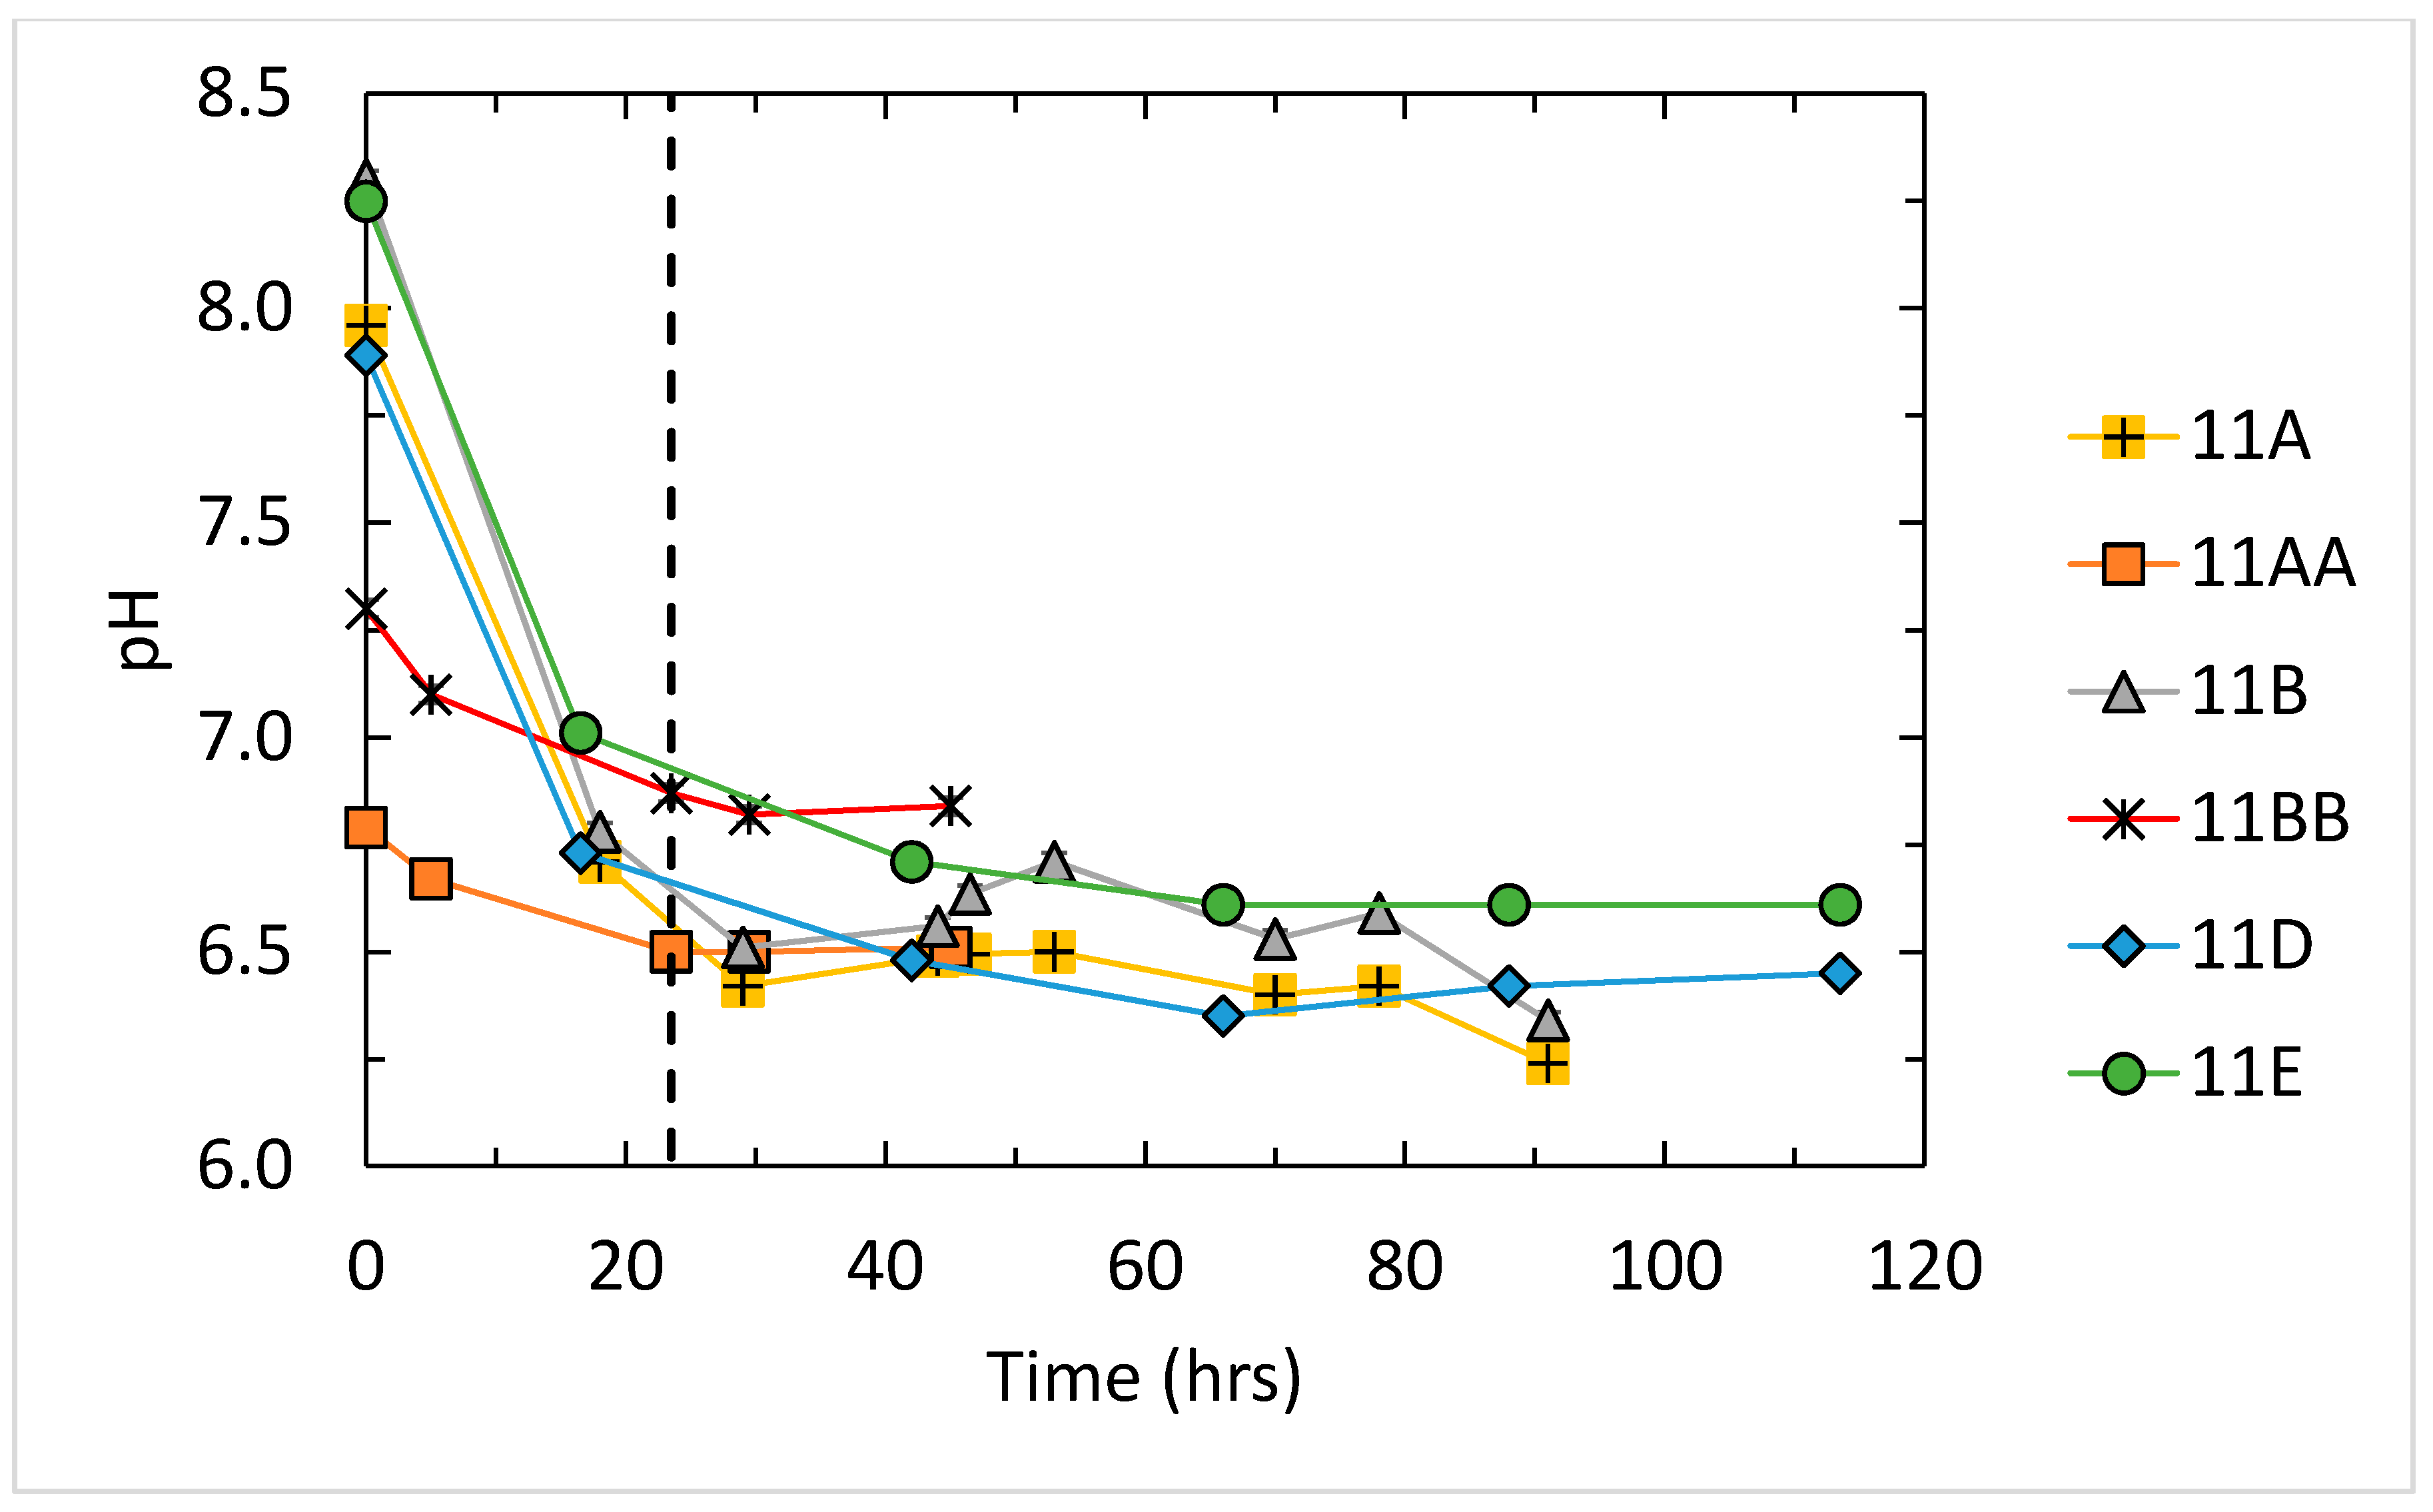
3.1. Results for Fluid pH, Salinity, and Saturation State
3.2. X-ray Diffraction Results
3.3. LS-AAS and ICP-OES Results
3.3.1. LS-AAS Results
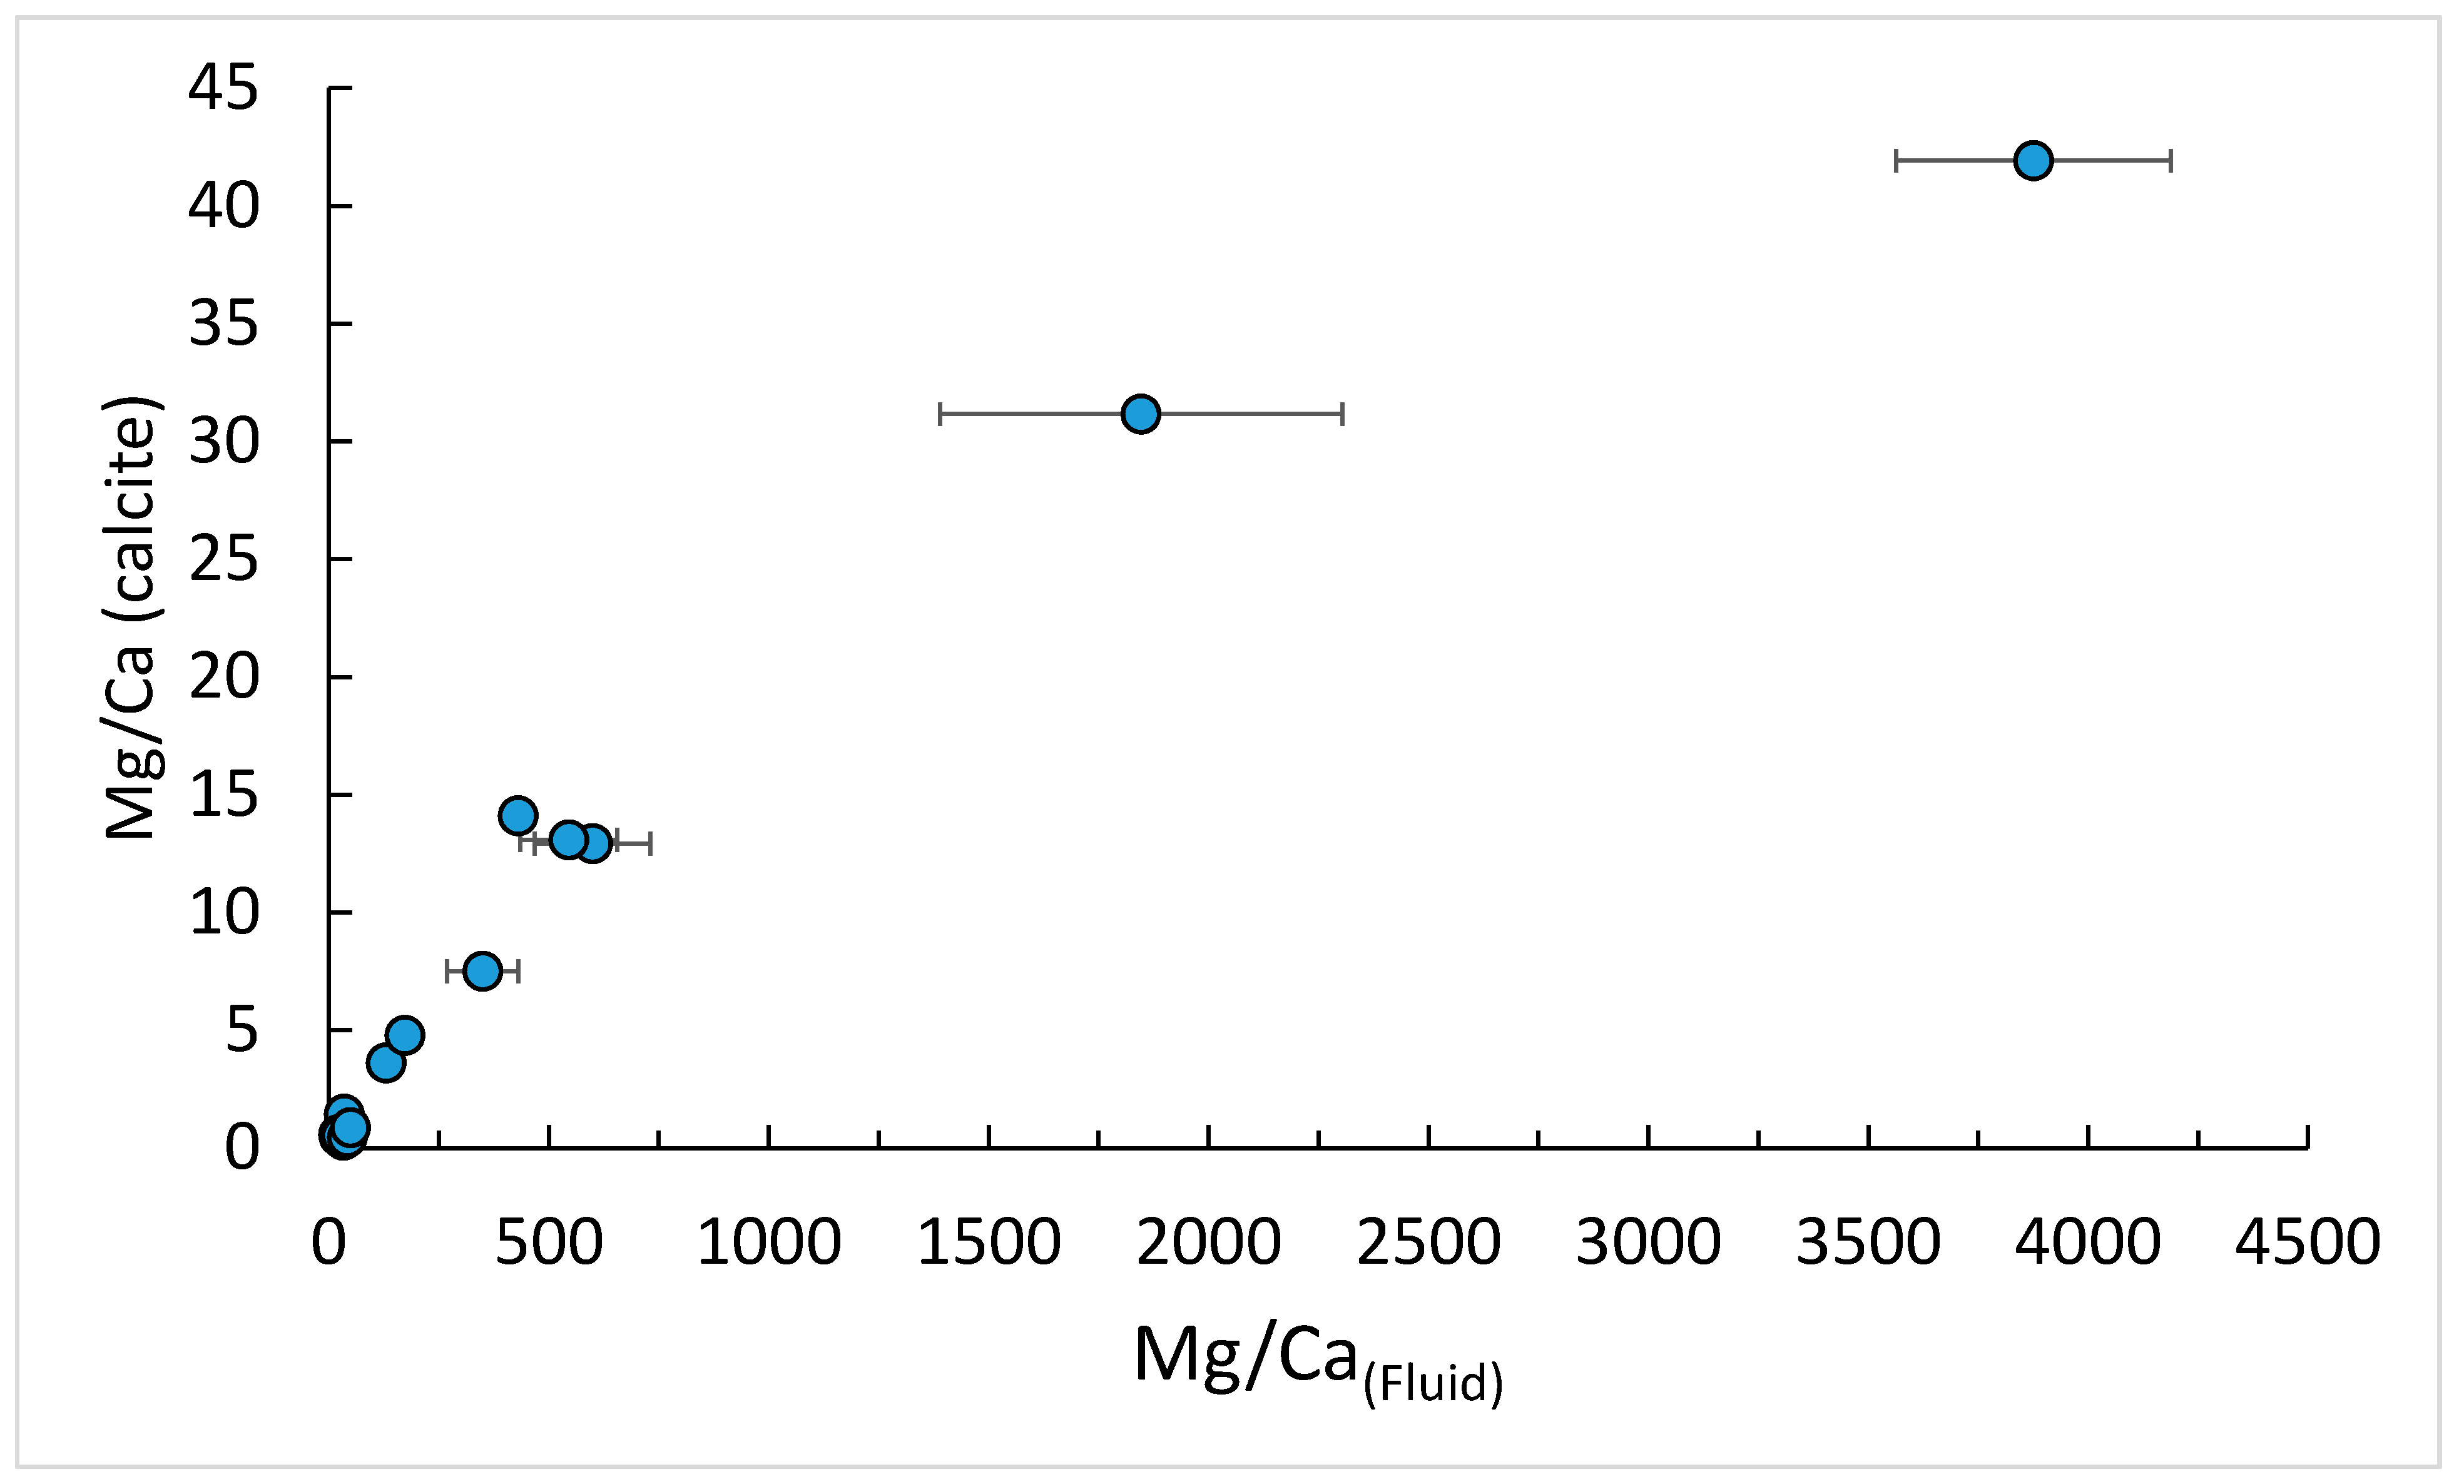
3.3.2. ICP-OES Results
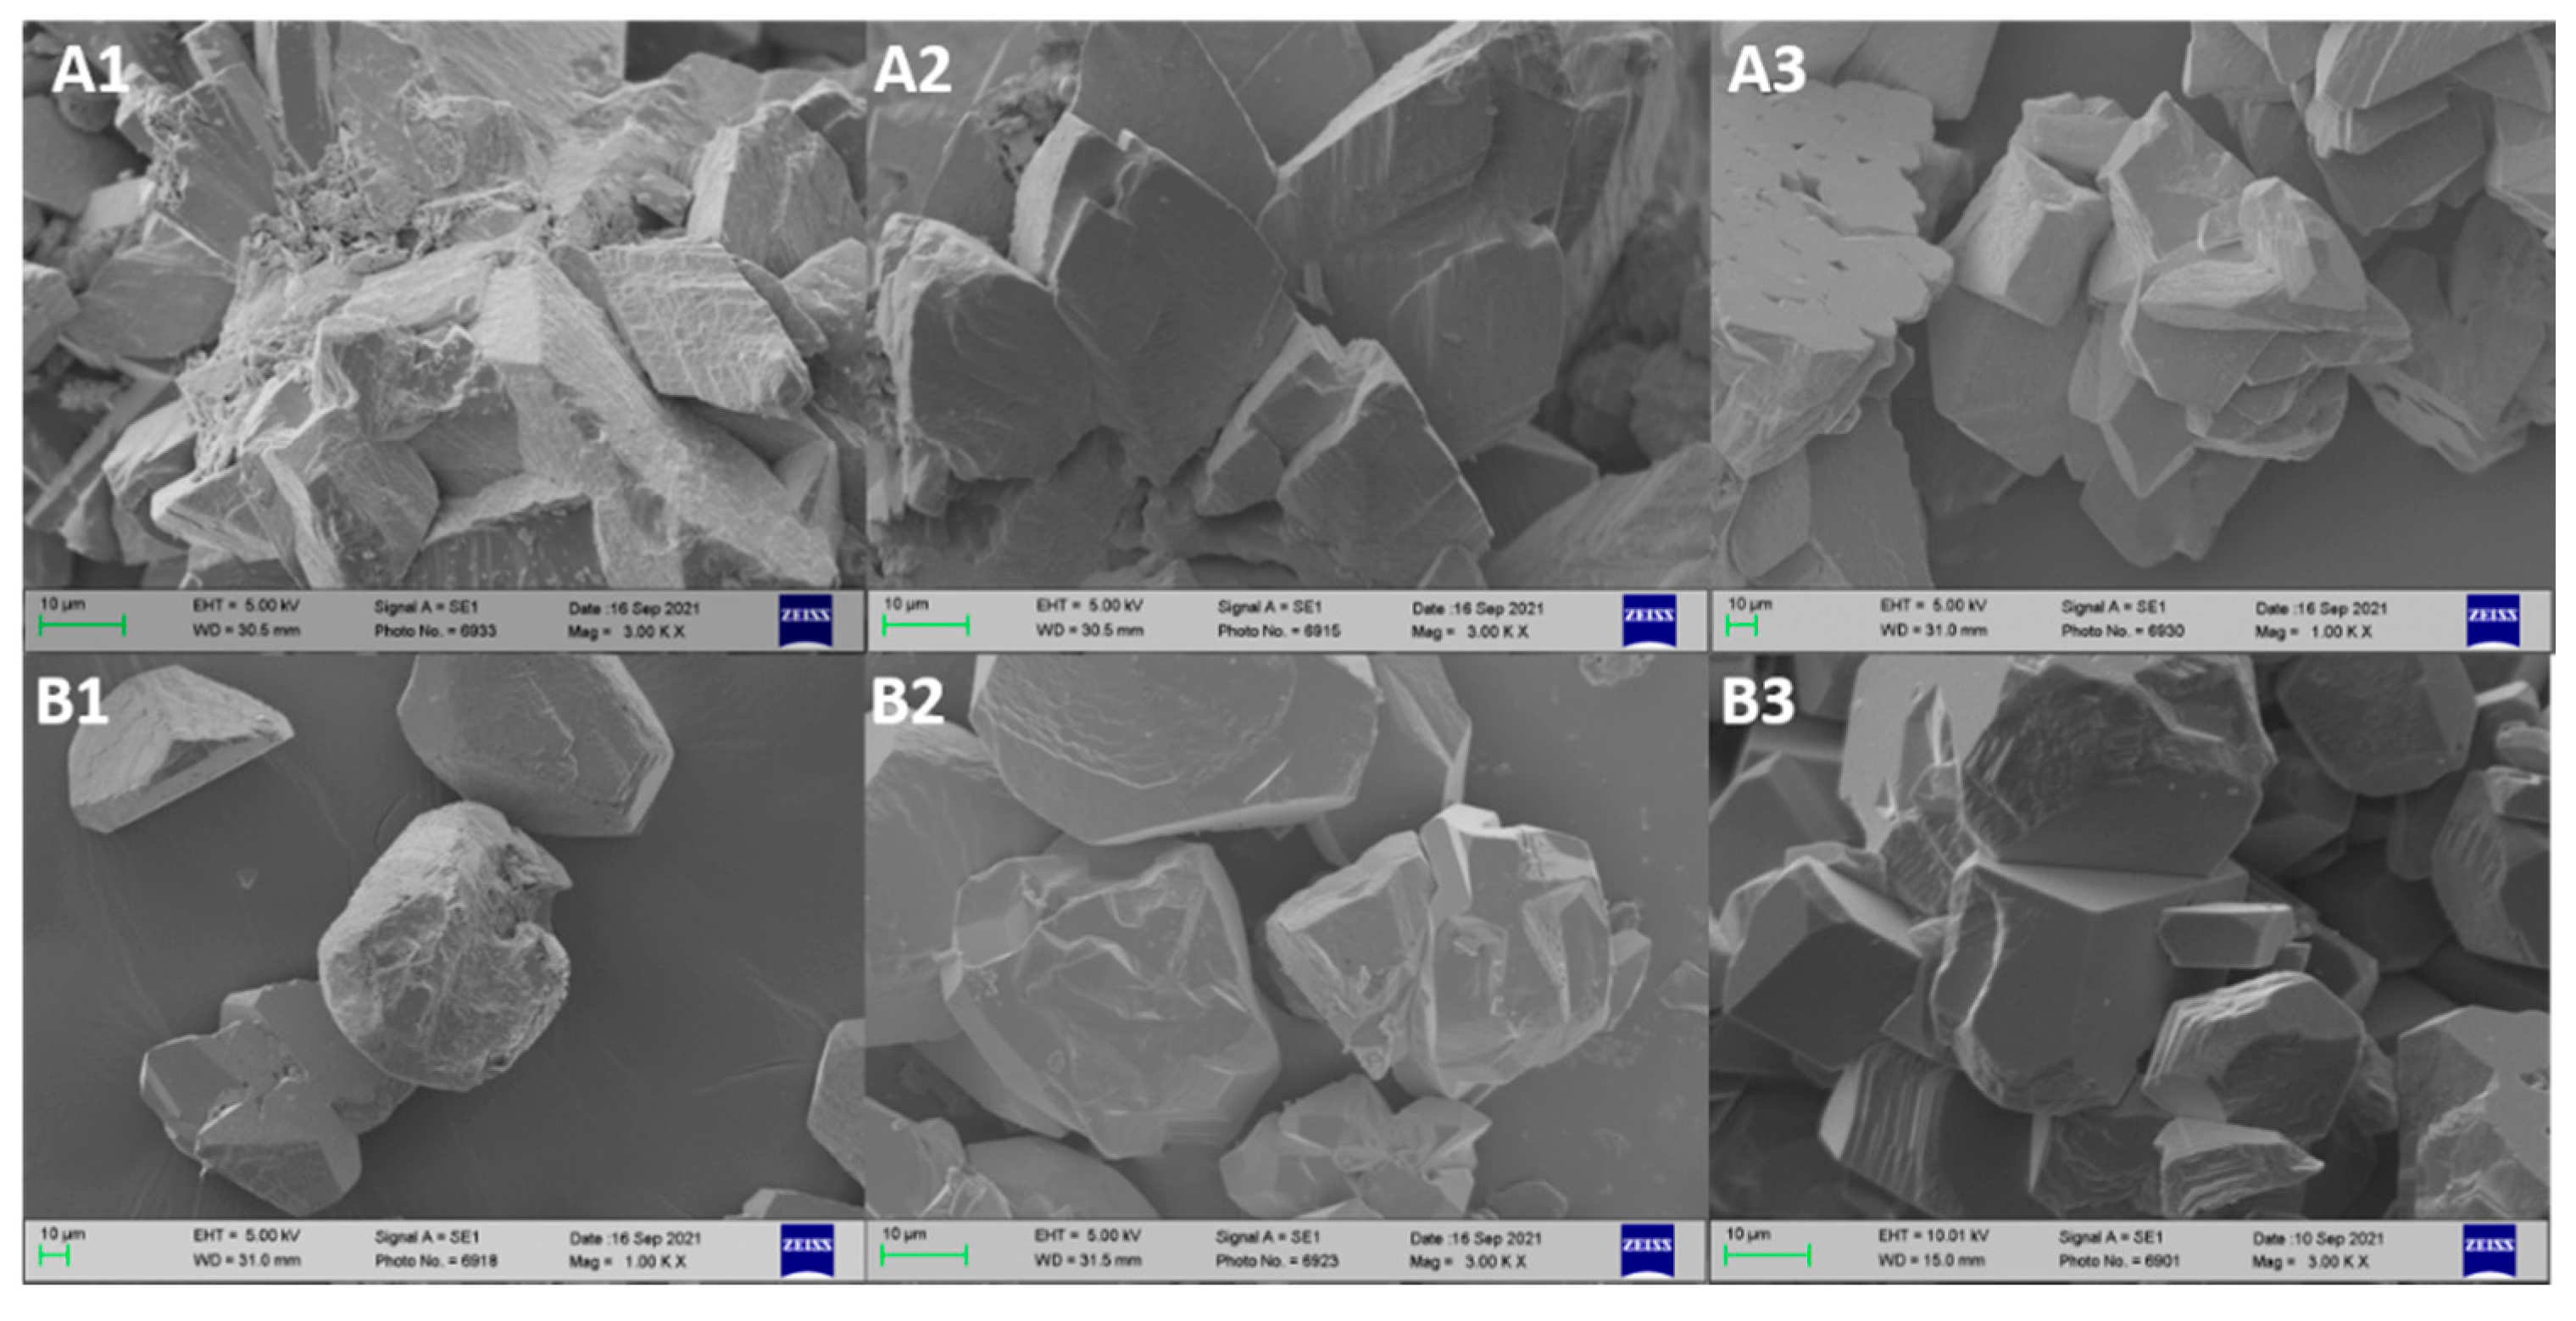
3.4. SEM Results
4. Discussion
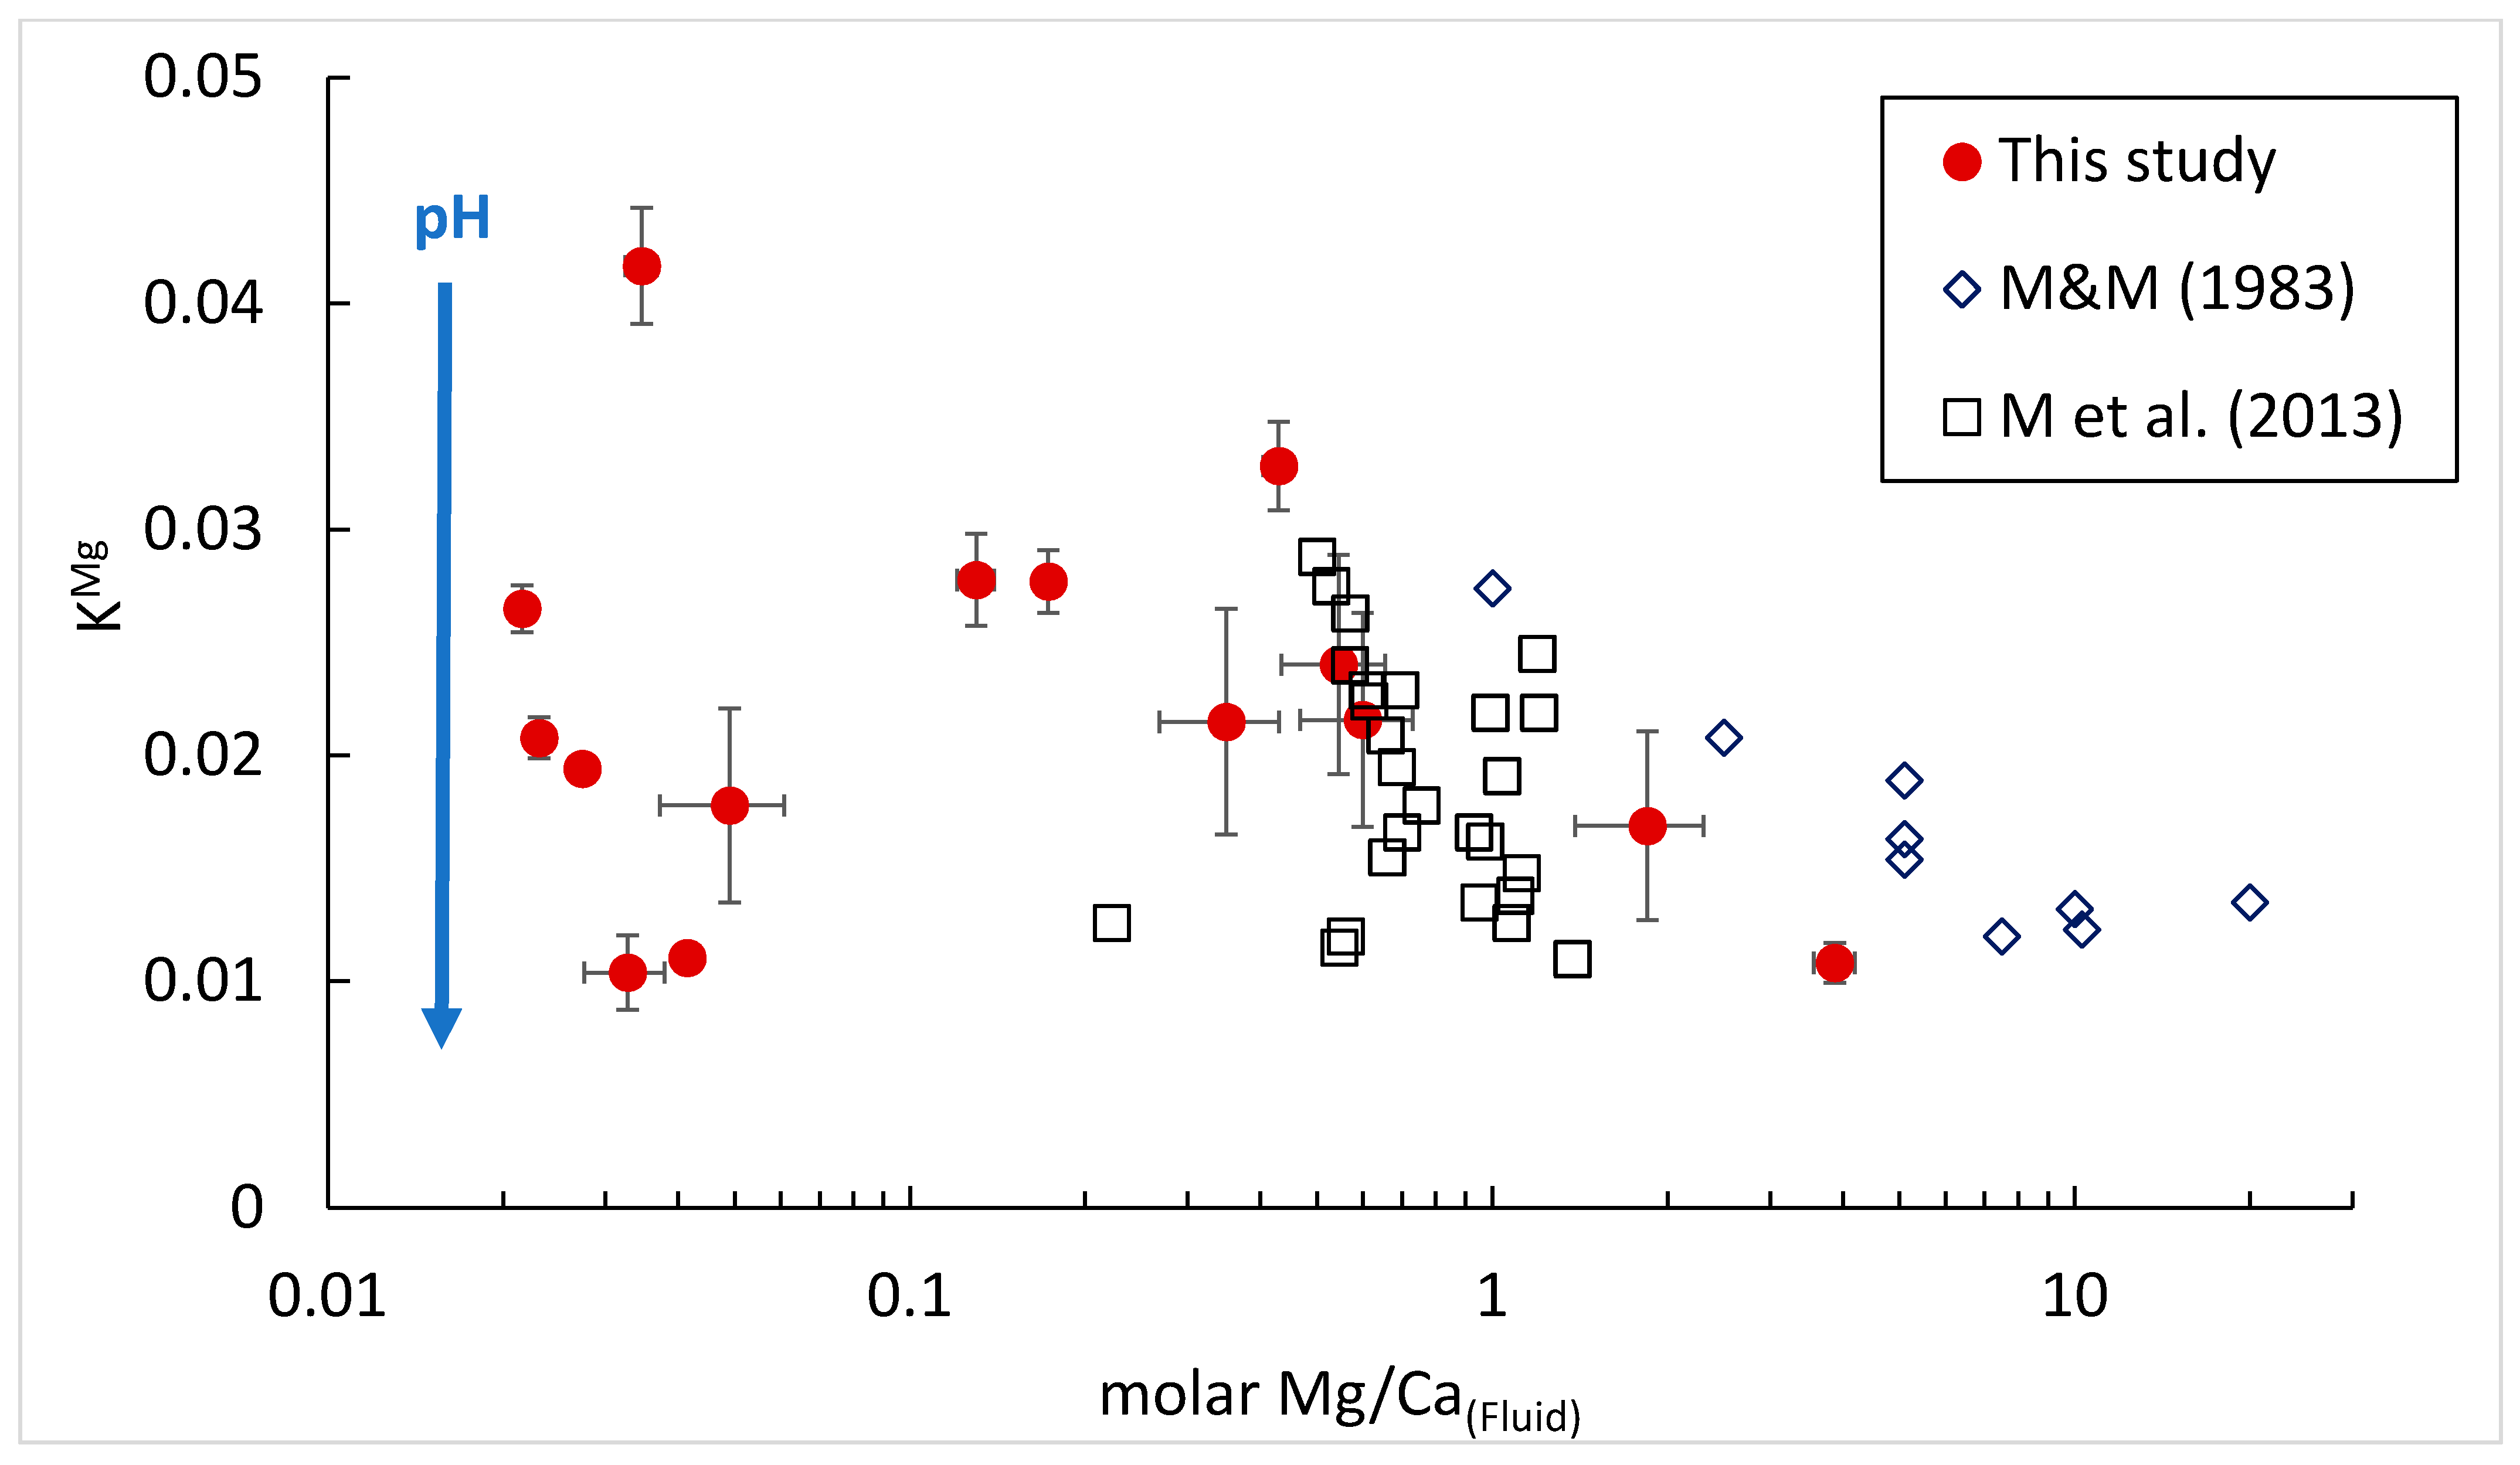
Mg/Ca Ratios in Synthetic Low-Magnesium Calcite
5. Conclusions
Supplementary Materials
Author Contributions
Funding
Data Availability Statement
Acknowledgments
Conflicts of Interest
References
- Katz, A. The interaction of magnesium with calcite during crystal growth at 25–90 °C and one atmosphere. Geochim. Cosmochim. Acta 1973, 37, 1563–1586. [Google Scholar] [CrossRef]
- Füchtbauer, H.; Hardie, L.A. Experimentally determined homogeneous distribution coefficients for precipitated magnesian calcites: Application to marine carbonate cements. In Proceedings of the Geological Society of America Annual Meeting, Denver, CO, USA, 8–10 November 1976; Volume 8, p. 877. [Google Scholar]
- Burton, E.A.; Walter, L.M. Relative precipitation rates of aragonite and Mg calcite from seawater: Temperature or carbonate ion control? Geology 1987, 15, 111–114. [Google Scholar] [CrossRef]
- Howson, M.R.; Pethybridge, A.D.; House, W.A. Synthesis and distribution coefficient of low-magnesium calcites. Chem. Geol. 1987, 64, 79–87. [Google Scholar] [CrossRef]
- Mucci, A. Influence of temperature on the composition of magnesian calcite overgrowths precipitated from seawater. Geochim. Cosmochim. Acta 1987, 51, 1977–1984. [Google Scholar] [CrossRef]
- Oomori, T.; Kaneshima, H.; Maezato, Y.; Kitano, Y. Distribution coefficient of Mg2+ ions between calcite and solution at 10–50 °C. Mar. Chem. 1987, 20, 327–336. [Google Scholar] [CrossRef]
- Huang, Y.; Fairchild, I.J. Partitioning of Sr2+ and Mg2+ into calcite under karst-analogue experimental conditions. Geochim. Cosmochim. Acta 2001, 65, 47–62. [Google Scholar] [CrossRef]
- Mucci, A. The solubility of calcite and aragonite in seawater at various salinities, temperatures, and one atmosphere total pressure. Am. J. Sci. 1983, 283, 780–799. [Google Scholar] [CrossRef]
- Zhong, S.; Mucci, A. Calcite and aragonite precipitation from seawater solutions of various salinities: Precipitation rates and overgrowth compositions. Chem. Geol. 1989, 78, 283–299. [Google Scholar] [CrossRef]
- Burton, E.A.; Walter, L.M. The effects of and temperature on magnesium incorporation in calcite in seawater and MgCl2-CaCl2 solutions. Geochim. Cosmochim. Acta 1991, 55, 777–785. [Google Scholar] [CrossRef]
- Hartley, G.; Mucci, A. The influence of on the partitioning of magnesium in calcite overgrowths precipitated from artificial seawater at 25° and 1 atm total pressure. Geochim. Cosmochim. Acta 1996, 60, 315–324. [Google Scholar] [CrossRef]
- Given, R.K.; Wilkinson, B.H. Kinetic control of morphology, composition, and mineralogy of abiotic sedimentary carbonates. J. Sediment. Res. 1985, 55, 109–119. [Google Scholar]
- Given, R.K.; Wilkinson, B.H. Kinetic control of morphology, composition, and mineralogy of abiotic sedimentary carbonates–REPLY. J. Sediment. Res. 1985, 55, 921–926. [Google Scholar]
- Saulnier, S.; Rollion-Bard, C.; Vigier, N.; Chaussidon, M. Mg isotope fractionation during calcite precipitation: An experimental study. Geochim. Cosmochim. Acta 2012, 91, 75–91. [Google Scholar] [CrossRef]
- Mavromatis, V.; Gautier, Q.; Bosc, O.; Schott, J. Kinetics of Mg partition and Mg stable isotope fractionation during its incorporation in calcite. Geochim. Cosmochim. Acta 2013, 114, 188–203. [Google Scholar] [CrossRef]
- Gabitov, R.I.; Sadekov, A.; Leinweber, A. Crystal growth rate effect on Mg/Ca and Sr/Ca partitioning between calcite and fluid: An in situ approach. Chem. Geol. 2014, 367, 70–82. [Google Scholar] [CrossRef]
- Devery, D.M.; Ehlmann, A.J. Morphological changes in a series of synthetic Mg-calcites. Am. Mineral. 1981, 66, 592–595. [Google Scholar]
- Mucci, A.; Morse, J.W. The incorporation of Mg2+ and Sr2+ into calcite overgrowths: Influences of growth rate and solution composition. Geochim. Cosmochim. Acta 1983, 47, 217–233. [Google Scholar] [CrossRef]
- Busenberg, E.; Plummer, L.N. Thermodynamics of magnesian calcite solid-solutions at 25 °C and 1 atm total pressure. Geochim. Cosmochim. Acta 1989, 53, 1189–1208. [Google Scholar] [CrossRef]
- Sandberg, P.A. An oscillating trend in Phanerozoic non-skeletal carbonate mineralogy. Nature 1983, 305, 19–22. [Google Scholar] [CrossRef]
- Wilkinson, B.H.; Algeo, T.J. Sedimentary carbonate record of calcium-magnesium cycling. Am. J. Sci. 1989, 289, 1158–1194. [Google Scholar] [CrossRef]
- Hardie, L.A. Secular variation in seawater chemistry: An explanation for the coupled secular variation in the mineralogies of marine limestones and potash evaporites over the past 600 m.y. Geology 1996, 24, 279–283. [Google Scholar] [CrossRef]
- Horita, J.; Weinberg, A.; Das, N.; Holland, H.D. Brine inclusions in halite and the origin of the Middle Devonian Prairie evaporites of Western Canada. J. Sediment. Res. 1996, 66, 956–964. [Google Scholar]
- Stanley, S.M.; Hardie, L.A. Hypercalcification: Paleontology links plate tectonics and geochemistry to sedimentology. GSA Today 1999, 9, 1–7. [Google Scholar]
- Zimmermann, H.; Holland, H.D.; Horita, J.A.B. The evolution of seawater during the Phanerozoic; Record from marine evaporites and fluid inclusions in halite. In Proceedings of the Geological Society of America Annual Meeting, Reno, NV, USA, 5–8 November 2000; Volume 32, p. 67. [Google Scholar]
- Lowenstein, T.K.; Timofeeff, M.N.; Brennan, S.T.; Hardie, L.A.; Demicco, R.V. Oscillations in Phanerozoic seawater chemistry: Evidence from fluid inclusions. Science 2001, 294, 1086–1088. [Google Scholar] [CrossRef] [PubMed] [Green Version]
- Horita, J.; Zimmermann, H.; Holland, H.D. Chemical evolution of seawater during the Phanerozoic: Implications from the record of marine evaporites. Geochim. Cosmochim. Acta 2002, 66, 3733–3756. [Google Scholar] [CrossRef]
- Dickson, J.A.D. Fossil echinoderms as monitor of the Mg/Ca ratio of Phanerozoic oceans. Science 2002, 298, 1222–1224. [Google Scholar] [CrossRef] [PubMed]
- Lowenstein, T.K.; Hardie, L.A.; Timofeeff, M.N.; Demicco, R.V. Secular variation in seawater chemistry and the origin and significance of calcium chloride basinal brines; Geological Society of America, 2003 Annual Meeting. In Proceedings of the Geological Society of America Annual Meeting, Seattle, WA, USA, 2–5 November 2003; Volume 35, p. 201. [Google Scholar] [CrossRef]
- Coggon, R.M.; Teagle, D.A.H.; Smith-Duque, C.E.; Alt, J.C.; Cooper, M.J. Reconstructing past seawater Mg/Ca and Sr/Ca from mid-ocean ridge flank calcium carbonate veins. Science 2010, 327, 1114–1117. [Google Scholar] [CrossRef] [Green Version]
- Hasiuk, F.J.; Lohmann, K.C. Application of calcite Mg partitioning functions to the reconstruction of paleocean Mg/Ca. Geochim. Cosmochim. Acta 2010, 74, 6751–6763. [Google Scholar] [CrossRef]
- Broecker, W.; Yu, J. What do we know about the evolution of Mg to Ca ratios in seawater? Paleoceanography 2011, 26, 1–8. [Google Scholar] [CrossRef] [Green Version]
- Demicco, R.V.; Lowenstein, T.K.; Hardie, L.A.; Spencer, R.J. Model of seawater composition for the Phanerozoic. Geology 2005, 33, 877–880. [Google Scholar] [CrossRef]
- Morse, J.W.; Wang, Q.; Tsio, M.Y. Influences of temperature and Mg:Ca ratio on CaCO3 precipitates from seawater. Geology 1997, 25, 85–87. [Google Scholar] [CrossRef]
- Spencer, R.J.; Hardie, L.A. Control of seawater composition by mixing of river waters and mid-ocean ridge hydrothermal brines. In Fluid-Mineral Interaction: A Tribute to HP Eugster Special Publication No. 2; Geochemical Society: Washington, DC, USA, 1990; Volume 19, pp. 409–419. [Google Scholar]
- Volk, T. Sensitivity of climate and atmospheric CO2 to deep-ocean and shallow-ocean carbonate burial. Nature 1989, 337, 637–640. [Google Scholar] [CrossRef]
- Holland, H.D.; Zimmermann, H. The Dolomite Problem Revisited. Int. Geol. Rev. 2000, 42, 481–490. [Google Scholar] [CrossRef]
- Schmidt, D.N.; Lazarus, D.; Young, J.R.; Kucera, M. Biogeography and evolution of body size in marine plankton. Earth Sci. Rev. 2006, 78, 239–266. [Google Scholar] [CrossRef]
- Stoll, H.M.; Ziveri, P.; Shimizu, N.; Conte, M.; Theroux, S. Relationship between coccolith Sr/Ca ratios and coccolithophore production and export in the Arabian Sea and Sargasso Sea. Deep. Res. Part II Top. Stud. Oceanogr. 2007, 54, 581–600. [Google Scholar] [CrossRef]
- Prentice, K.; Jones, T.D.; Lees, J.A.; Young, J.; Bown, P.; Langer, G.; Fearn, S.; EIMF. Trace metal (Mg/Ca and Sr/Ca) analyses of single coccoliths by Secondary Ion Mass Spectrometry. Geochim. Cosmochim. Acta 2014, 146, 90–106. [Google Scholar] [CrossRef]
- Nürnberg, D.; Bijma, J.; Hemleben, C. Assessing the reliability of magnesium in foraminiferal calcite as a proxy for water mass temperatures. Geochim. Cosmochim. Acta 1996, 60, 803–814. [Google Scholar] [CrossRef] [Green Version]
- Lea, D.W.; Mashiotta, T.A.; Spero, H.J. Controls on magnesium and strontium uptake in planktonic foraminifera determined by live culturing. Geochim. Cosmochim. Acta 1999, 63, 2369–2379. [Google Scholar] [CrossRef]
- Mashiotta, T.; Lea, D.W.; Spero, H.J. Glacial–interglacial changes in Subantarctic sea surface temperature and δ18O-water using foraminiferal Mg. Earth Planet. Sci. Lett. 1999, 170, 417–432. [Google Scholar] [CrossRef]
- Rosenthal, Y.; Boyle, E.A.; Slowey, N. Temperature control on the incorporation of magnesium, strontium, fluorine, and cadmium into benthic foraminiferal shells from Little Bahama Bank: Prospects for thermocline paleoceanography. Geochim. Cosmochim. Acta 1997, 61, 3633–3643. [Google Scholar] [CrossRef]
- Ferguson, J.E.; Henderson, G.M.; Kucera, M.; Rickaby, R.E.M. Systematic change of foraminiferal Mg/Ca ratios across a strong salinity gradient. Earth Planet. Sci. Lett. 2008, 265, 153–166. [Google Scholar] [CrossRef] [Green Version]
- Mathien-Blard, E.; Bassinot, F. Salinity bias on the foraminifera Mg/Ca thermometry: Correction procedure and implications for past ocean hydrographic reconstructions. Geochem. Geophys. Geosyst. 2009, 10. [Google Scholar] [CrossRef]
- Hönisch, B.; Allen, K.A.; Lea, D.W.; Spero, H.J.; Eggins, S.M.; Arbuszewski, J.; DeMenocal, P.; Rosenthal, Y.; Russell, A.D.; Elderfield, H. The influence of salinity on Mg/Ca in planktic foraminifers—Evidence from cultures, core-top sediments and complementary δ18O. Geochim. Cosmochim. Acta 2013, 121, 196–213. [Google Scholar] [CrossRef] [Green Version]
- Ries, J.B. Effect of ambient Mg/Ca ratio on Mg fractionation in calcareous marine invertebrates: A record of the oceanic Mg/Ca ratio over the Phanerozoic. Geology 2004, 32, 981–984. [Google Scholar] [CrossRef]
- Stanley, S.M.; Ries, J.B.; Hardie, L.A. Seawater chemistry, coccolithophore population growth, and the origin of Cretaceous chalk. Geology 2005, 33, 593–596. [Google Scholar] [CrossRef] [Green Version]
- Bentov, S.; Erez, J. Impact of biomineralization processes on the Mg content of foraminiferal shells: A biological perspective. Geochem. Geophys. Geosyst. 2006, 7. [Google Scholar] [CrossRef]
- Blackmon, P.D.; Todd, R. Mineralogy of some foraminifera as related to their classification and ecology. J. Paleontol. 1959, 33, 1–15. [Google Scholar]
- Erez, J. The Source of Ions for Biomineralization in Foraminifera and Their Implications for Paleoceanographic Proxies. Rev. Mineral. Geochem. 2003, 54, 115–149. [Google Scholar] [CrossRef] [Green Version]
- Sadekov, A.Y.; Eggins, S.M.; De Deckker, P. Characterization of Mg/Ca distributions in planktonic foraminifera species by electron microprobe mapping. Geochem. Geophys. Geosyst. 2005, 6. [Google Scholar] [CrossRef]
- Branson, O.; Redfern, S.A.T.; Tyliszczak, T.; Sadekov, A.; Langer, G.; Kimoto, K.; Elderfield, H. The coordination of Mg in foraminiferal calcite. Earth Planet. Sci. Lett. 2013, 383, 134–141. [Google Scholar] [CrossRef] [Green Version]
- Tesoriero, A.J.; Pankow, J.F. Solid solution partitioning of Sr2+, Ba2+, and Cd2+ to calcite. Geochim. Cosmochim. Acta 1996, 60, 1053–1063. [Google Scholar] [CrossRef]
- Rounds, S.A. Alkalinity and acid neutralizing capacity (ver. 4.0, September 2012). In U.S. Geological Survey Techniques of Water-Resources Investigations; U.S. Geological Survey: Reston, VA, USA, 2012; Book 9, Chapter 6.6. [Google Scholar]
- Lewis, E.; Wallace, D.; Allison, L.J. Program Developed for CO2 System Calculations; ORNL/CDIAC-105; Carbon Dioxide Information Analysis Center, Oak Ridge National Laboratory, US Department of Energy: Oak Ridge, TN, USA, 1998.
- Pierrot, D.; Lewis, E.; Wallace, D. MS Excel Program Developed for CO2 System Calculations; ORNL/CDIAC-105a; Carbon Dioxide Information Analysis Center, Oak Ridge National Laboratory, US Department of Energy: Oak Ridge, TN, USA, 2006.
- De Villiers, S.; Greaves, M.; Elderfield, H. An Intensity Ratio Calibration Method for the Accurate Determination of Mg/Ca and Sr/Ca of Marine Carbonates by ICP-AES. Geochem. Geophys. Geosyst. 2002, 3. [Google Scholar] [CrossRef]
- Greaves, M.; Barker, S.; Daunt, C.; Elderfield, H. Accuracy, Standardization, and Interlaboratory Calibration Standards for Foraminiferal Mg/Ca Thermometry. Geochem. Geophys. Geosyst. 2005, 6, 1–9. [Google Scholar] [CrossRef]
- Millero, F.J.; Graham, T.B.; Huang, F.; Bustos-Serrano, H.; Pierrot, D. Dissociation constants of carbonic acid in seawater as a function of salinity and temperature. Mar. Chem. 2006, 100, 80–94. [Google Scholar] [CrossRef]
- Dickson, A.G. Thermodynamics of the Dissociation of Boric Acid in Synthetic Seawater from 273.15 to 318.15 K. Deep Sea Res. Part A Oceanogr. Res. Pap. 1990, 37, 755–766. [Google Scholar] [CrossRef]
- Zeebe, R.E.; Wolf-Gladrow, D.A. CO2 in Seawater: Equilibrium, Kinetics, Isotopes; Elsevier: London, UK, 2001; p. 347. ISBN 9780444509468. [Google Scholar]


| Run | Concentrations of Salts in Titrate Solutions (mmol L−1) | Calculated Aqueous Mg/Ca (mmol/mol) | ||||
|---|---|---|---|---|---|---|
| NaCl | NaHCO3 | NaOH | MgCl2·6H2O | CaCl2·2H2O | ||
| 9A | 600 | 300 | 134 | 166 | 807 | |
| 9B | 600 | 300 | 113 | 187 | 604 | |
| 9C | 600 | 300 | 50 | 250 | 200 | |
| 9D | 600 | 300 | 6 | 294 | 20 | |
| 9E | 600 | 300 | 23 | 277 | 83 | |
| 9F | 600 | 300 | 66 | 234 | 282 | |
| 10A | 600 | 12 | 2 | 10 | 200 | |
| 11A-1,2,3 | 600 | 300 | 3 | 297 | 10 | |
| 11AA | 600 | 300 | 30 | 3 | 297 | 10 |
| 11B | 600 | 300 | 10 | 3 | 297 | 10 |
| 11BB-1,2,3 | 600 | 300 | 10 | 3 | 297 | 10 |
| 11D | 600 | 300 | 45 | 255 | 176 | |
| 11E | 600 | 300 | 10 | 45 | 255 | 176 |
| Run | CO32− | Ca2+ | TA | ΩC | S (‰) | CaCO3 (g) | |
|---|---|---|---|---|---|---|---|
| 9A | Precip | 0.15 | 14.28 | 34.25 | 3.45 | 45.34 | 17.74 |
| Final | 0.07 | 8.09 | 22.18 | 1.01 | |||
| 9B | Precip | 0.08 | 22.28 | 25.82 | 3.06 | 45.08 | 18.68 |
| Final | 0.11 | 8.3 | 22.42 | 1.57 | |||
| 9C | Precip | 0.04 | 29.47 | 11.09 | 1.8 | 47.38 | 19.79 |
| Final | 0.51 | 16.71 | 42.01 | 13.21 | |||
| 9D | Precip | 0.02 | 61.92 | 7.22 | 1.67 | 45.89 | 20.59 |
| Final | 0.05 | 43.59 | 9.79 | 3.18 | |||
| 9E | Precip | 0.02 | 58.51 | 12.07 | 1.85 | 44.81 | 22.68 |
| Final | 0.04 | 36.11 | 17.46 | 2.27 | |||
| 9F | Precip | 0.04 | 45.01 | 13.34 | 3.21 | 45.25 | 22.04 |
| Final | 0.06 | 33.2 | 25.96 | 3.23 | |||
| 10A | Precip | 0.22 | 2.95 | 15.83 | 2.53 | 22.44 | 1.53 |
| Final | 0.18 | 1.62 | 8.02 | 1.16 | |||
| Run | pH | SE | Mg/Ca(Solid) (mol/mol) | Mg/Ca(Fluid) (mmol/mol) | SE | Mg/Ca(Fluid) (mol/mol) | SE | KMg | SE |
|---|---|---|---|---|---|---|---|---|---|
| 9A | 6.84 | 0.06 | 41.92 | 3875 | 311.9 | 3.8752 | 0.3119 | 0.0108 | 0.00087 |
| 9B | 6.77 | 0.06 | 31.17 | 1846 | 457.1 | 1.8465 | 0.4571 | 0.0169 | 0.00418 |
| 9C | 6.74 | 0.13 | 12.92 | 599.1 | 131.5 | 0.5991 | 0.1315 | 0.0216 | 0.00474 |
| 9D | 6.23 | 0.01 | 1.441 | 34.59 | 2.131 | 0.0346 | 0.0021 | 0.0417 | 0.00257 |
| 9E | 6.44 | 0.02 | 3.608 | 129.9 | 9.531 | 0.1299 | 0.0095 | 0.0278 | 0.00204 |
| 9F | 6.51 | 0.08 | 14.10 | 429.8 | 25.82 | 0.4298 | 0.0258 | 0.0328 | 0.00197 |
| 10A | 7.99 | 0.05 | 4.785 | 172.8 | 8.630 | 0.1728 | 0.0086 | 0.0277 | 0.00138 |
| 11A-1 | 6.32 | 0.09 | 0.5710 | 21.56 | 0.850 | 0.0216 | 0.0009 | 0.0265 | 0.00104 |
| 11A-2,3 | 6.91 | 0.42 | 0.3400 | 32.73 | 5.160 | 0.0327 | 0.0052 | 0.0104 | 0.00164 |
| 11AA | 6.55 | 0.04 | 0.4790 | 23.06 | 1.009 | 0.0231 | 0.0010 | 0.0208 | 0.00091 |
| 11B-1 | 6.43 | 0.09 | 0.5310 | 27.36 | 0.4750 | 0.0274 | 0.0005 | 0.0194 | 0.00034 |
| 11B-2,3 | 7.05 | 0.49 | 0.457 | 41.4 | 0.4750 | 0.0414 | 0.0005 | 0.0110 | 0.00013 |
| 11BB | 6.91 | 0.06 | 0.87 | 49.0 | 11.82 | 0.0490 | 0.0118 | 0.0178 | 0.00429 |
| 11D | 6.23 | 0.06 | 7.508 | 349.4 | 81.28 | 0.3494 | 0.0813 | 0.021486 | 0.00500 |
| 11E | 6.71 | 0.08 | 13.09 | 544.9 | 110.0 | 0.5449 | 0.1100 | 0.0240 | 0.00485 |
Publisher’s Note: MDPI stays neutral with regard to jurisdictional claims in published maps and institutional affiliations. |
© 2021 by the authors. Licensee MDPI, Basel, Switzerland. This article is an open access article distributed under the terms and conditions of the Creative Commons Attribution (CC BY) license (https://creativecommons.org/licenses/by/4.0/).
Share and Cite
Weremeichik, J.M.; Gabitov, R.I.; Sadekov, A.; Novak, A.; Jimenez, A.; Thirumalai, R.V.K.G.; Varco, J.J.; Dygert, A. Mg/Ca Ratios in Synthetic Low-Magnesium Calcite: An Experimental Investigation. Minerals 2021, 11, 1158. https://doi.org/10.3390/min11111158
Weremeichik JM, Gabitov RI, Sadekov A, Novak A, Jimenez A, Thirumalai RVKG, Varco JJ, Dygert A. Mg/Ca Ratios in Synthetic Low-Magnesium Calcite: An Experimental Investigation. Minerals. 2021; 11(11):1158. https://doi.org/10.3390/min11111158
Chicago/Turabian StyleWeremeichik, Jeremy M., Rinat I. Gabitov, Aleksey Sadekov, Aleksandra Novak, Angel Jimenez, Rooban Venkatesh K. G. Thirumalai, Jac J. Varco, and Andrew Dygert. 2021. "Mg/Ca Ratios in Synthetic Low-Magnesium Calcite: An Experimental Investigation" Minerals 11, no. 11: 1158. https://doi.org/10.3390/min11111158
APA StyleWeremeichik, J. M., Gabitov, R. I., Sadekov, A., Novak, A., Jimenez, A., Thirumalai, R. V. K. G., Varco, J. J., & Dygert, A. (2021). Mg/Ca Ratios in Synthetic Low-Magnesium Calcite: An Experimental Investigation. Minerals, 11(11), 1158. https://doi.org/10.3390/min11111158