Article

Energy Dissipation and Electromagnetic Radiation Response of Sandstone Samples with a Pre-Existing Crack of Various Inclinations under an Impact Load

1
National Engineering Research Center for Coal Gas Control, China University of Mining and Technology, Xuzhou 221116, China
2
Key Laboratory of Gas and Fire Control for Coal Mines of Ministry of Education, China University of Mining and Technology, Xuzhou 221116, China
3
School of Safety Engineering, China University of Mining and Technology, Xuzhou 221116, China
4
State Key Laboratory for GeoMechanics and Deep Underground Engineering, China University of Mining and Technology, Xuzhou 221116, China
5
Frontier Scientific Research Center of Fluidized Mining of Deep Resources, China University of Mining and Technology, Xuzhou 221116, China
6
Department of Mining Engineering, Balochistan University of Information Technology, Engineering and Management Sciences, Quetta 87300, Pakistan
*
Author to whom correspondence should be addressed.
Minerals 2021, 11(12), 1363; https://doi.org/10.3390/min11121363
Submission received: 4 November 2021 / Revised: 26 November 2021 / Accepted: 29 November 2021 / Published: 2 December 2021
(This article belongs to the Special Issue Fracturing of Coal and Rock Mass)

Abstract

:
Various primary fissures and defects are widely present in a rock mass and have a significant impact on the stability of the rock mass. We studied the influence of the crack inclination angle on the energy dissipation and electromagnetic radiation (EMR) response of sandstone under an impact load. Impact tests were conducted on red sandstone samples with different inclination angles, in addition to test energy dissipation and EMR signals. The results showed that as the energy of the stress wave increased, the energy consumption density and damage variables of the sample gradually increased, and the electromagnetic radiation energy also increased. As the crack inclination increased, the energy consumption density first decreased and then increased, while the damage variable and electromagnetic radiation energy first increased and then decreased. In the process of impact damage, the main frequency of EMR was 0~5 kHz. As the energy of the stress wave increased, the dominant frequency band of the main frequency expanded from low frequency to high frequency, and the amplitude signal gradually increased; the α = 45° specimen frequency domain was the widest, and the amplitude was the largest. The crack inclination significantly changed the failure state of the sample, resulting in changes in the energy dissipation and the electromagnetic radiation response of the sample.

1. Introduction

With most of the mines in China in the deep mining stage, deep rock masses are affected by in-situ stress, and stress waves generated as a result of mining activities. The failure process of a rock mass under dynamic and static loads is often more complicated [1,2,3]. According to the law of thermodynamics [4], the process of rock deformation and failure is actually the process of energy absorption, transformation, and release. Therefore, studying the law of energy dissipation in the process of impact failure is helpful to quantitatively characterize the damage and failure of rock mass.
Many scholars have studied the relationship between mechanical properties, failure properties, and damage properties in the process of rock impact failure from the energy perspective, and results showed that the energy dissipation law has a significant strain rate effect. With an increase in the strain rate, the degree of rock fragmentation and the energy dissipation increased and showed a positive correlation. Lou [5] conducted comparative analysis through experiments and Particle Flow Code (PFC) simulations, studied the impact failure process from the perspective of habitual cracks and energy, and believed that the dynamic strength and degree of fragmentation corresponded well with energy dissipation. Cheng [6] conducted dynamic experiments on sandstones with different axial pressures to test the energy dissipation of the stress wave and believed that the attenuation of the stress wave energy had a quadratic function relationship with the axial static load. Ping [7] conducted a dynamic splitting test on limestone and believed that the dynamic tensile strength of limestone and the increase in absorbed energy increased as a power function. Ma [8] found through experiments that as the number of prefabricated cracks gradually increased, the energy consumed during the damage and destruction process of the specimen also gradually decreased. Liang [9] believed that the absorbed energy of the sample showed a significant increasing trend with the continuous increase and increase in temperature and impact velocity. Zhou [10] discussed the damage mechanism of the specimen from the energy point of view through impact and dynamic experiments. Li [11] and Huang [12] both conducted impact dynamics experiments on samples and believed that the energy dissipation density increased with the increase in the fractal dimension. Liu [13] believed that as the strain rate gradually increased, the energy dissipation rate increased, which can reflect the degree of fracture of the sample to a certain extent.
Some scholars studied the law of energy dissipation in the process of rock deformation and failure through uniaxial compression experiments. It is believed that the damage and failure process of the sample is accompanied by the absorption and release of energy, and the damage of the sample is quantitatively characterized by energy. Yang [14] considered the energy-driven process during rock failure, and the results showed that the energy dissipation energy of the sample was positively correlated with the damage degree during the cyclic loading process. Liu [15] conducted dynamic load and static load tests to study the energy dissipation laws of samples under different damage states. Song [16] established the functional relationship between EMR energy and energy dissipation by performing uniaxial compression experiments on raw coal samples and testing electromagnetic radiation signals at the same time. The on-site rock mass is rich in defects and joints. The damage and failure of the rock mass is often the indication of the continuous growth and development of its internal defects, and the damage and failure of the rock mass can be regarded as an instability phenomenon in the energy-driven process [17,18].
Sandstone is a relatively common rock in rock mass structure. Therefore, sandstone samples with different inclination angles to simulate on-site rock masses to conduct experiments to study the influence of crack inclination angle are used for energy dissipation. Sandstone is a kind of polycrystalline material, and under the action of the impact load, the internal grains gain energy and deform or even break, releasing free electrons to the outside, often showing abnormal EMR fluctuations [19,20,21]. Our predecessors studied the response of EMR during rock mass rupture through experiments and believed that the failure process of the samples released EMR signals, and an obvious EMR mutation phenomenon occurred under extensive damage. Kong [22,23] used multifractals to analyze the EMR signal of coal under high temperature and found that the stress and EMR signal during the damage process of samples at different temperatures had a significant positive correlation. The mechanism of EMR generated by Li [24] during the loading process of coal and rock was mainly caused by the piezoelectric effect and accelerated motion of charged particles. Using Fast Fourier Transform (FFT) to transform EMR waveforms from time-domain signals to frequency-domain signals, it was found that the frequency spectrum characteristics corresponding to different scales of damage also have certain rules, and the rules can be used to reflect the damage and damage inside the rock. Li and Shen [25,26] conducted uniaxial compression experiments on samples with different moisture contents, and the results showed a good correlation between sample stress and the EMR response. Different moisture contents have a strong influence on the mechanism of EMR damage to the samples. Wang [27] studied the temporal and spatial distribution characteristics of ultra-low frequency EMR in front of the work, which corresponded well to the damage process. Therefore, EMR response characteristics can monitor the damage and destruction of rock masses and have been used in fields such as on-site dynamic disaster monitoring and early warning [28,29].
This article will study the characteristics of energy dissipation and the EMR response of fractured sandstone under an impact load and will explore the relationship between the energy dissipation characteristics of fractured sandstone and the EMR signal response. The research results have far-reaching significance for the further study of the EMR response mechanism of the dynamic rock failure process.

2. Experimental Procedure

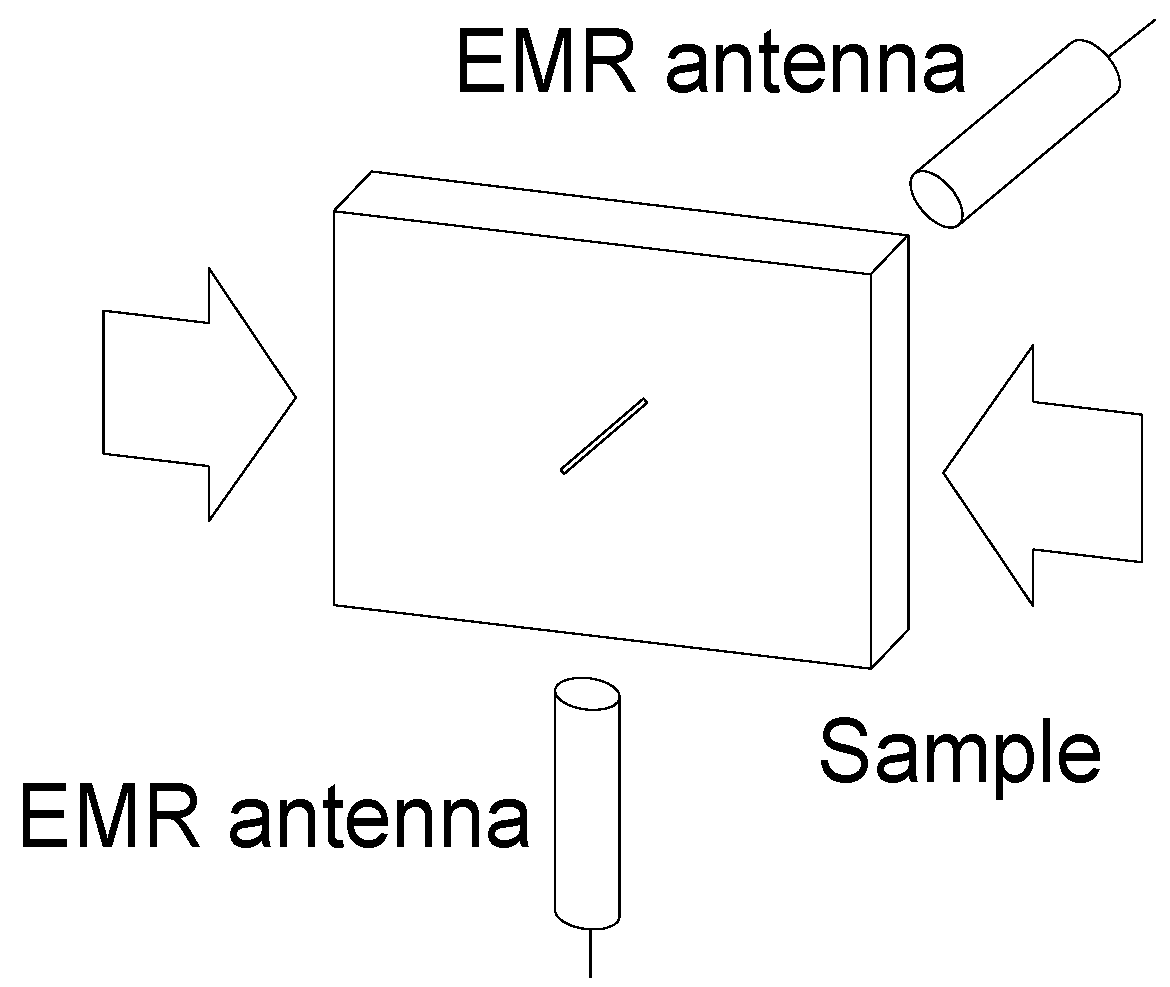
2.1. Experimental System

The experimental system consists of the Split Hopkinson Pressure Bar (SHPB) and EMR acquisition system of China University of Mining and Technology (Xuzhou, China), as shown in Figure 1. The SHPB test system is mainly composed of a dynamic load system, an axial load system, an infrared speed measurement system, and a dynamic strain acquisition system. The impact load is controlled by the dynamic load loading system, which changes the dynamic load by changing the air pressure in the high-pressure chamber and the position of the impact bar (commonly known as a bullet). Axial static load is achieved by adjusting the oil pressure in the hydraulic cylinder at the tail of the transmission bar through the axial pressure loading and buffer device to push the transmission rod to clamp the sample. The infrared speed measurement system consists of a parallel light source and a speedometer, which can test the speed of the bullet when it hits the incident rod in real time. The dynamic strain acquisition system consists of strain gauges pasted on the incident rod and transmission rod, Wheatstone bridge, super strain acquisition instrument (LK2017B), and data acquisition card. The resistance value of the strain gauge is 120 Ω, and the power supply voltage is 3~10 V.
The EMR collection system is based on the SHPB experimental system, with a 30 kHz EMR antenna arranged on one side and below the sample. The arrangement position is shown in Figure 2. The EMR acquisition system adopts the CTA-1 EMR dynamic data acquisition system produced by Physical Acoustics (Princeton Jct, NC, USA). The system can collect eight channels of EMR signals at the same time. The sampling frequency is 10 Msps, the pre-gain is 40 dB, and the sampling length is 15 k. The threshold is 80 dB, the blocking time (HLT) is set to 1000 μs, the acquisition mode is set to the external trigger mode, and it is displayed in real time.

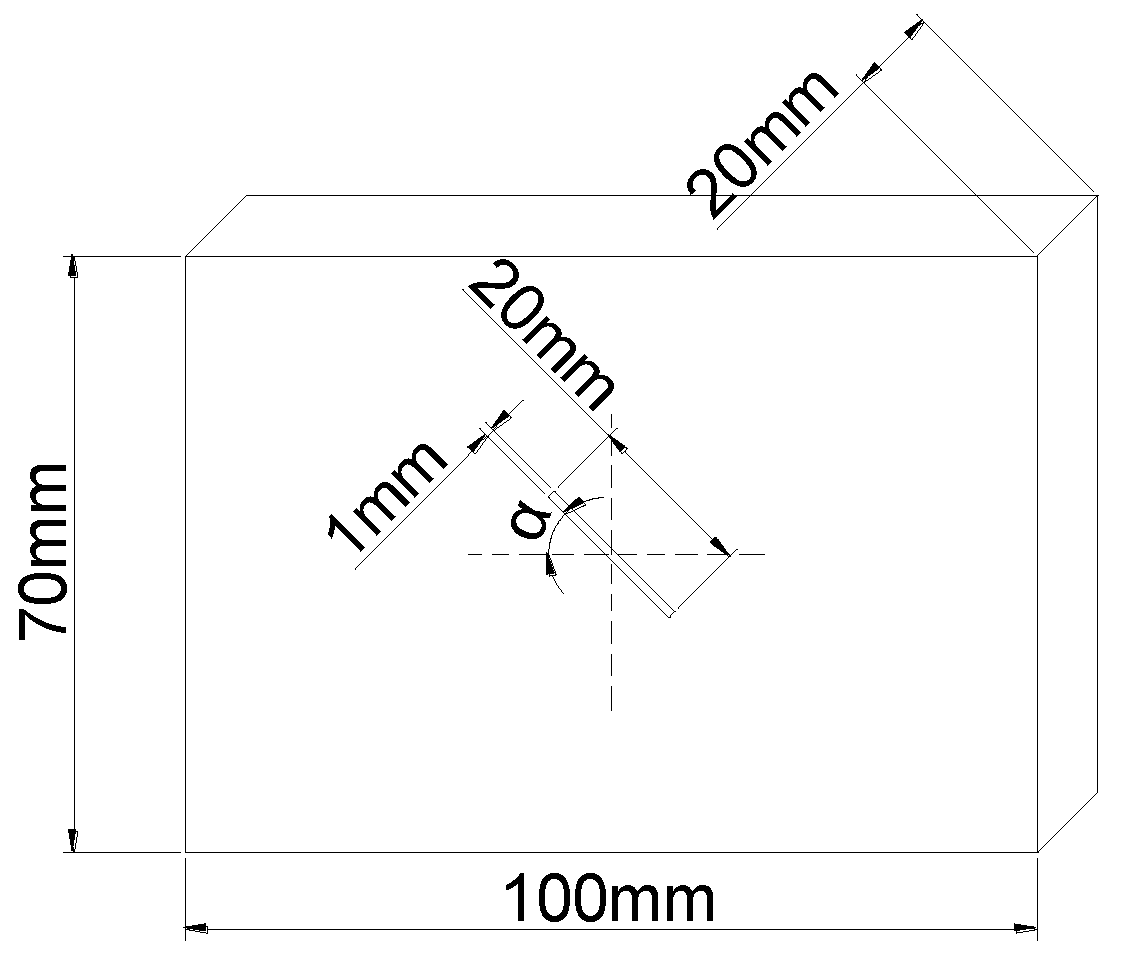
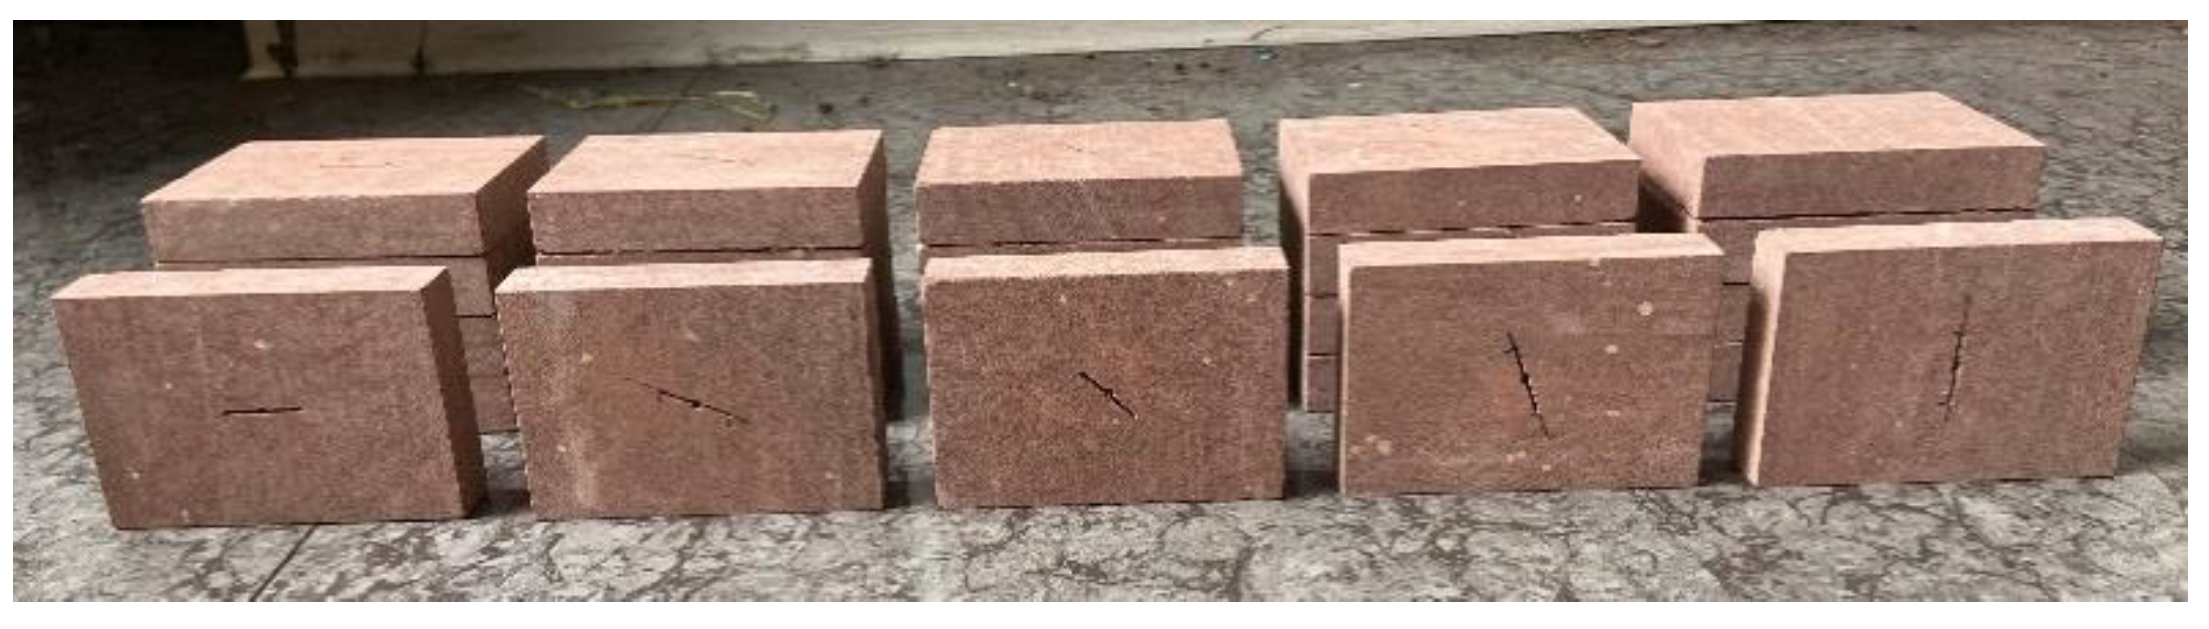
2.2. Experimental Samples

The red sandstone sample used in the experiment was selected from the Junan sandstone mine in Shandong Province, with an average density of 2.424 g/cm3 and an average wave speed of 2.35 m/s. The sample was processed into 100 mm × 20 mm × 70 mm through waterjet slitting, the pre-crack inclination α was 0°, 22.5°, 45°, 67.5°, and 90°, the length was 20 mm, the width was 1 mm, the depth was 20 mm, and the schematic diagram of the crack inclination is shown in Figure 3. The surface unevenness of the sample was as small as 0.02 mm, the section was perpendicular to the axis, and the maximum deviation did not exceed 0.25°. The sample is shown in Figure 4.

2.3. Principle of the Experiment

The SHPB experiment is based on one-dimensional stress wave theory and the assumption of uniformity [30]. The one-dimensional stress wave theory assumes that the diameter of the bar is small relative to the wavelength of the stress wave, and the one-dimensional compression stress wave generated by the impact bar impacting the incident bar at a certain speed does not account for the dispersion of the stress wave when propagating in the incident bar. The homogenization assumption assumes that the thickness of the samples is small enough to deform uniformly throughout the test. At the same time, the friction between the contact surface of the samples and the bar is ignored. According to the basic assumptions of SHPB experimental technology, the average strain rate ε ˙ ( t ) , strain ε ( t ) , and stress σ ( t ) of the sample can be derived from the stress wave waveform in the experiment [31,32,33,34,35]. The formulas are as follows (1)–(3).
ε ˙ ( t ) = C 0 L 0 [ ε i ( t ) ε r ( t ) ε t ( t ) ]
ε ( t ) = C 0 L 0 0 t [ ε r ( t ) + ε t ( t ) ε i ( t ) ] d t
σ ( t ) = A 2 A 0 E [ ε i ( t ) + ε r ( t ) + ε t ( t ) ]
In the formula,   C 0 represents the propagation speed of the stress wave in the elastic bar, which is 5100 m/s; L 0 represents the sample length, which is 100 mm; E represents the elastic modulus of the elastic bar, which is 210 GPa; A represents the cross-sectional area of the elastic bar; A 0 represents the cross-sectional area of the sample; t represents the duration of the stress wave pulse.
The calculation formulas of incident energy W i , reflected energy W r , and transmission energy W t received by the sample during the impact experiment are as follows [36,37]:
W i ( t ) = E C 0 A 0 t ε i 2 ( t ) d t
W r ( t ) = E C 0 A 0 t ε r 2 ( t ) d t
W t ( t ) = E C 0 A 0 t ε t 2 ( t ) d t
Because petroleum jelly is applied on both sides of the sample, the friction between the elastic bar and the contact surface of the sample can be ignored, that is, the energy absorbed by the sample is equal to the total dissipated energy W d ( t ) during the impact process:
W d ( t ) = W i ( t ) W r ( t ) W t ( t )
In the SHPB experiment, in order to minimize the error caused by the sample size difference, the sample crushing dissipated energy density ε d is introduced:
ε d = W d V
In the formula, V is the sample volume.

3. Experimental Results and Discussion

It can be obtained from previous studies that all stress wave energy comes from incident wave energy. In this study, the incident wave energy was controlled by changing the impact velocity. The experiment controlled the axial static load to 6 MPa and the impact air pressure to 0.08 MPa. The impact velocity was controlled by changing the launch position of the bullet. The impact velocity was 1 m/s, 1.5 m/s, 2 m/s, 2.5 m/s, 3 m/s, and 3.5 m/s. Figure 5 shows the typical waveform curve of the sample.
The specific experimental steps are as follows:
(1).
Started the experimental instrument to ensure that all experimental equipment was in normal working condition, to ensure that the experimental specimen as basically in a state of stress balance during the dynamic loading process and that the test result was reliable.
(2).
Used the axial compression loading device to clamp the sample to the set axial compression. Arranged the EMR antenna.
(3).
Started the SHPB experimental system and EMR collection system.
(4).
Started the impact bar launch system to complete the experiment.

3.1. Energy Dissipation Law of Specimens with Different Inclination Angles

According to Formulas (1)–(9), the test data were processed, and the energy calculation results of samples with different inclination angles under different impact speed conditions were obtained, as shown in Table 1.

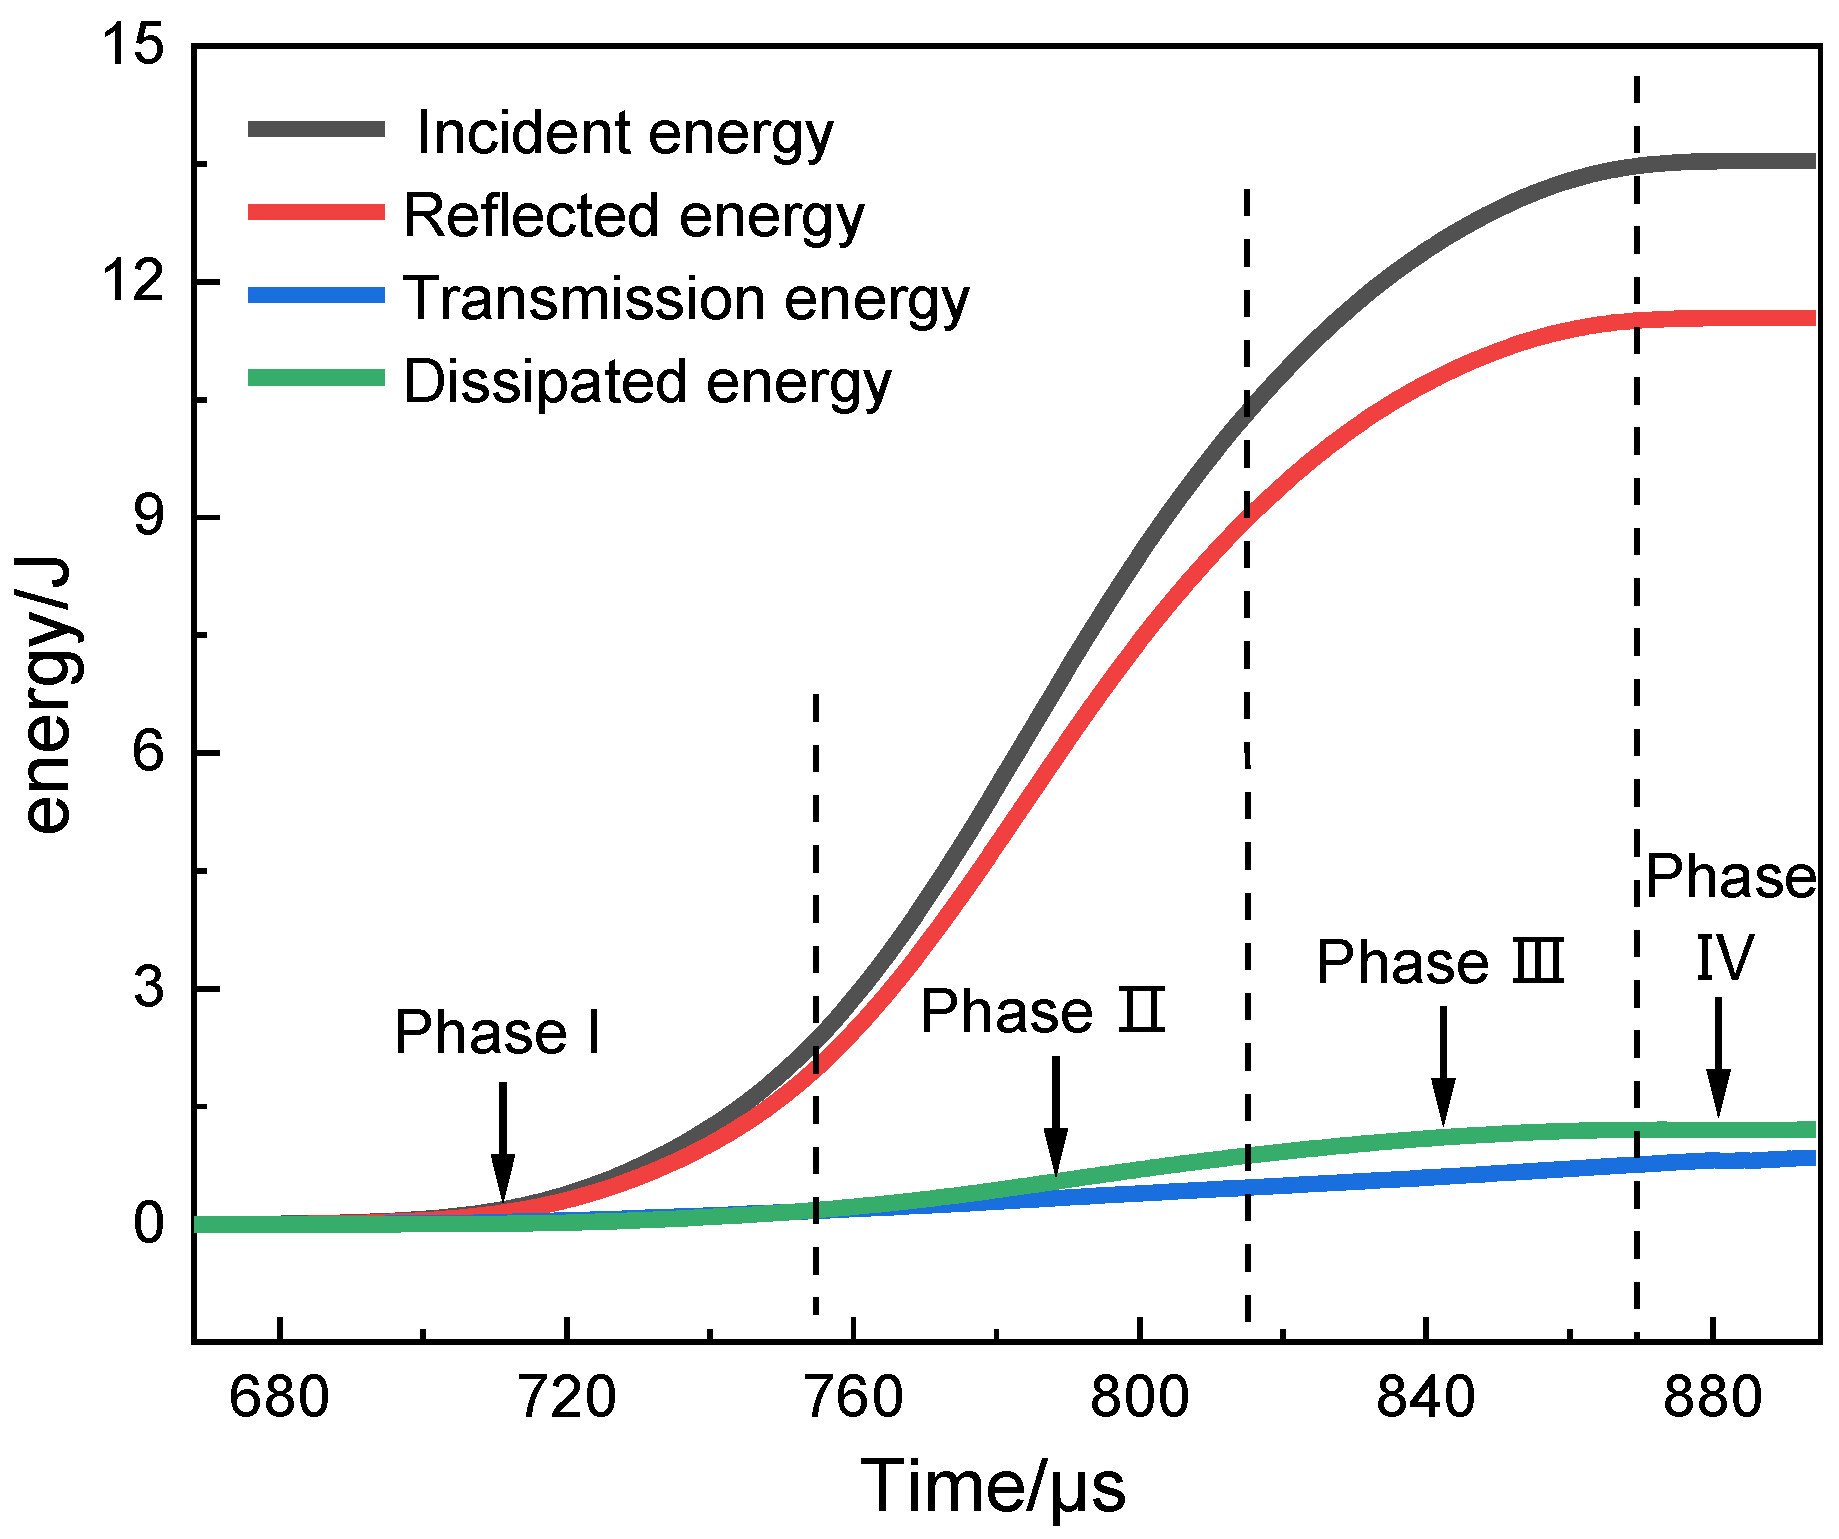
3.1.1. Typical Energy Time History Curve

Due to the limited space of the article, the typical energy vs. time curve of a 0° sample at an impact velocity of 1.1 m/s was taken as an example and was drawn as shown in Figure 6. It can be seen from the figure that the incident energy, reflected energy, transmitted energy, and dissipated energy increased to varying degrees with time, and most of the energy in the incident energy occurred when transferred to the contact surface of the incident bar and the sample. The reflection was converted into reflected energy, and only a small part of the energy passed through the sample and was converted into transmission energy and dissipation energy. This is because the wave impedances of the specimen and the bar were different, and the contact area between the specimen and the rod was small, so many stress waves were reflected when propagating to the specimen, and only a small part of the energy passed through the specimen. When the stress wave passed through the sample, a small part of the energy was used for damage and destruction of the sample to form dissipated energy.
The figure shows that the failure process of sandstone specimens under an impact load can be divided into four stages, namely, the compaction stage, linear elastic stage, yield stage, and softening stage. The energy dissipation process of the sandstone specimen failure in these four stages can be analyzed from the following. The compaction stage (stage I), where the stress wave occurred during the rising stage, and the internal pores of the sample were closed under the action of the stress wave. The energy consumed in this process was relatively small, and the energy curve of each part gradually started to rise, and the rate of rise continued to increase. Then, it entered the linear elastic stage (stage II). In this stage, due to the short time of the impact load, a large number of macro cracks formed before the micro cracks propagated, and the cracks merged and penetrated rapidly. The dissipated energy of the sample continued to rise, and the energy curve of each part also increased linearly. In the yield stage (stage III), the crack further expanded, the dissipated energy of the specimen continued to rise, and the energy curve of each part also continued to rise, but the rate of rise gradually decreased. Finally, it entered the softening stage (stage IV). During this stage, the sample was completely destroyed, the stress wave rapidly weakened, and the dissipated energy no longer rose. All parts of the energy remained stable, and the energy curve remained unchanged.

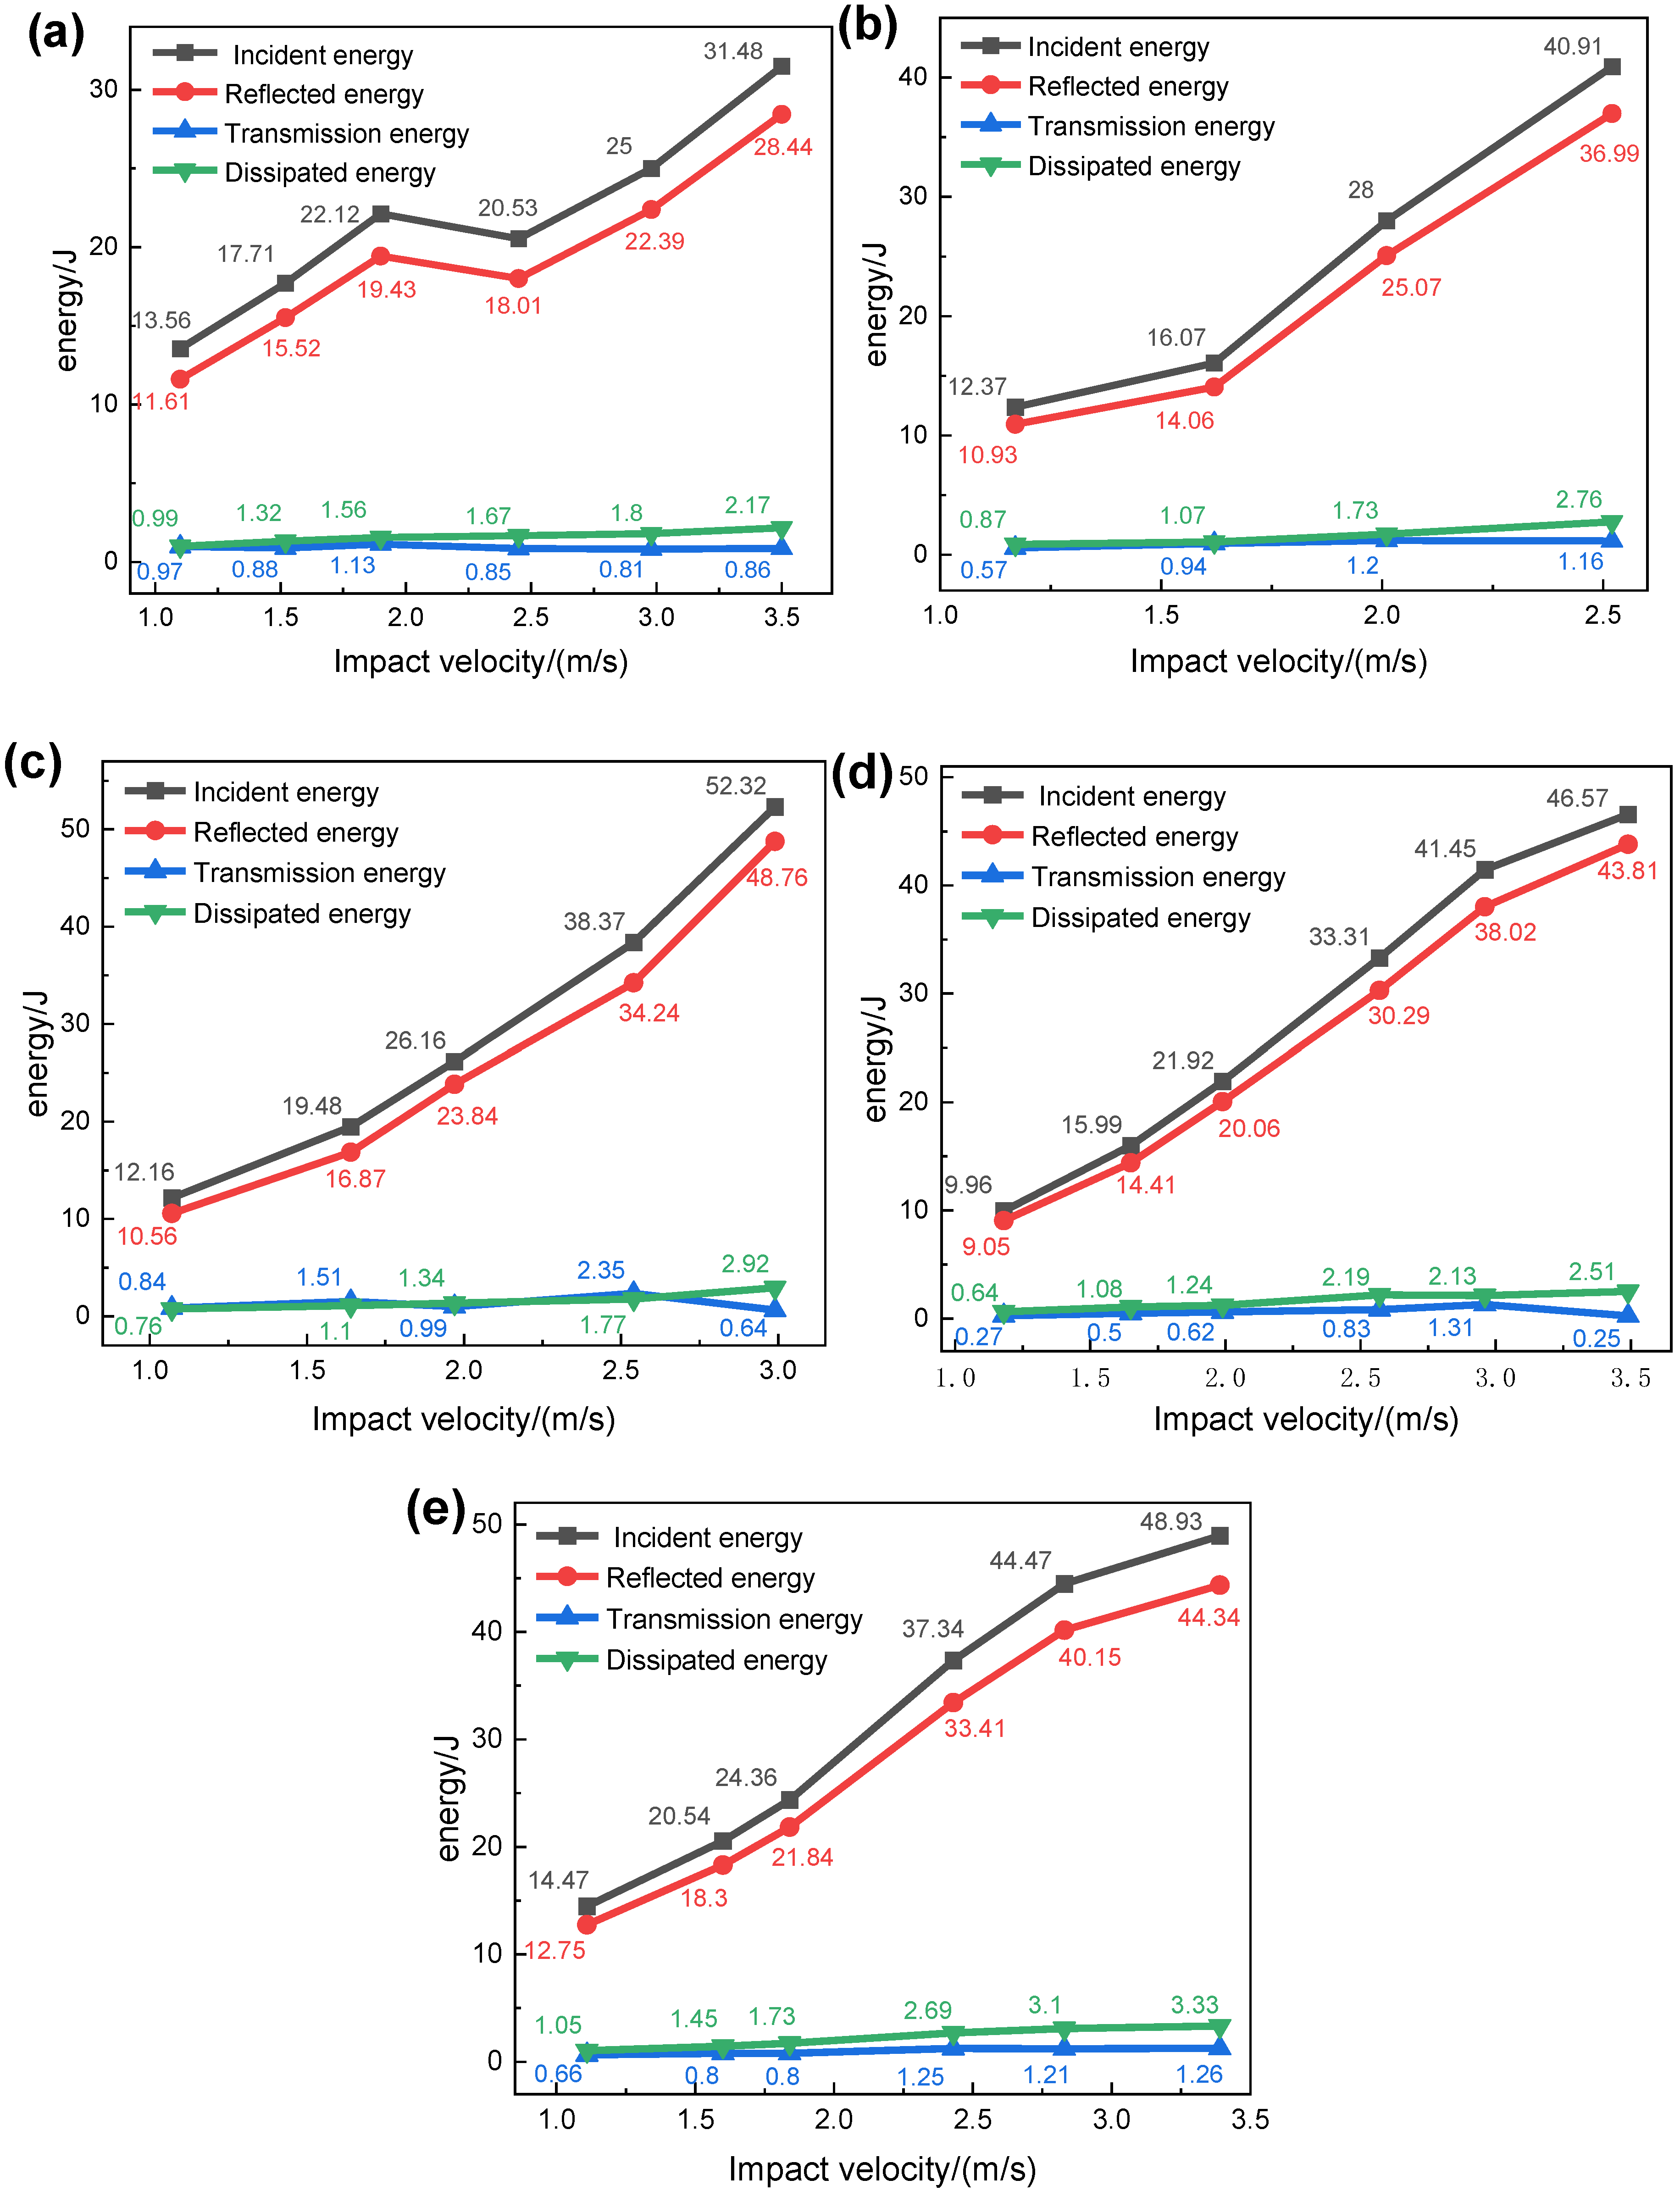
3.1.2. The Relationship between the Energy of the Impact Process and the Impact Velocity

As shown in Figure 7, with the increase in the impact velocity, the incident energy and the reflected energy increased significantly, showing a good linear relationship, indicating that most of the energy carried by the incident wave during the impact did not pass through the sample. Instead, when the stress wave was transmitted to the specimen, it was reflected back into the incident bar again. At the same time, the transmission energy remained basically unchanged, and the dissipation energy increased slightly, indicating that the transmission energy was less affected by the impact velocity, which was more related to the size of the sample. The energy passing through the sample was mainly used for the energy dissipated by the damage and destruction of the sample. With the continuous increase in the impact velocity, the dissipation energy gradually increased, indicating that the damage degree of the sample gradually increased.

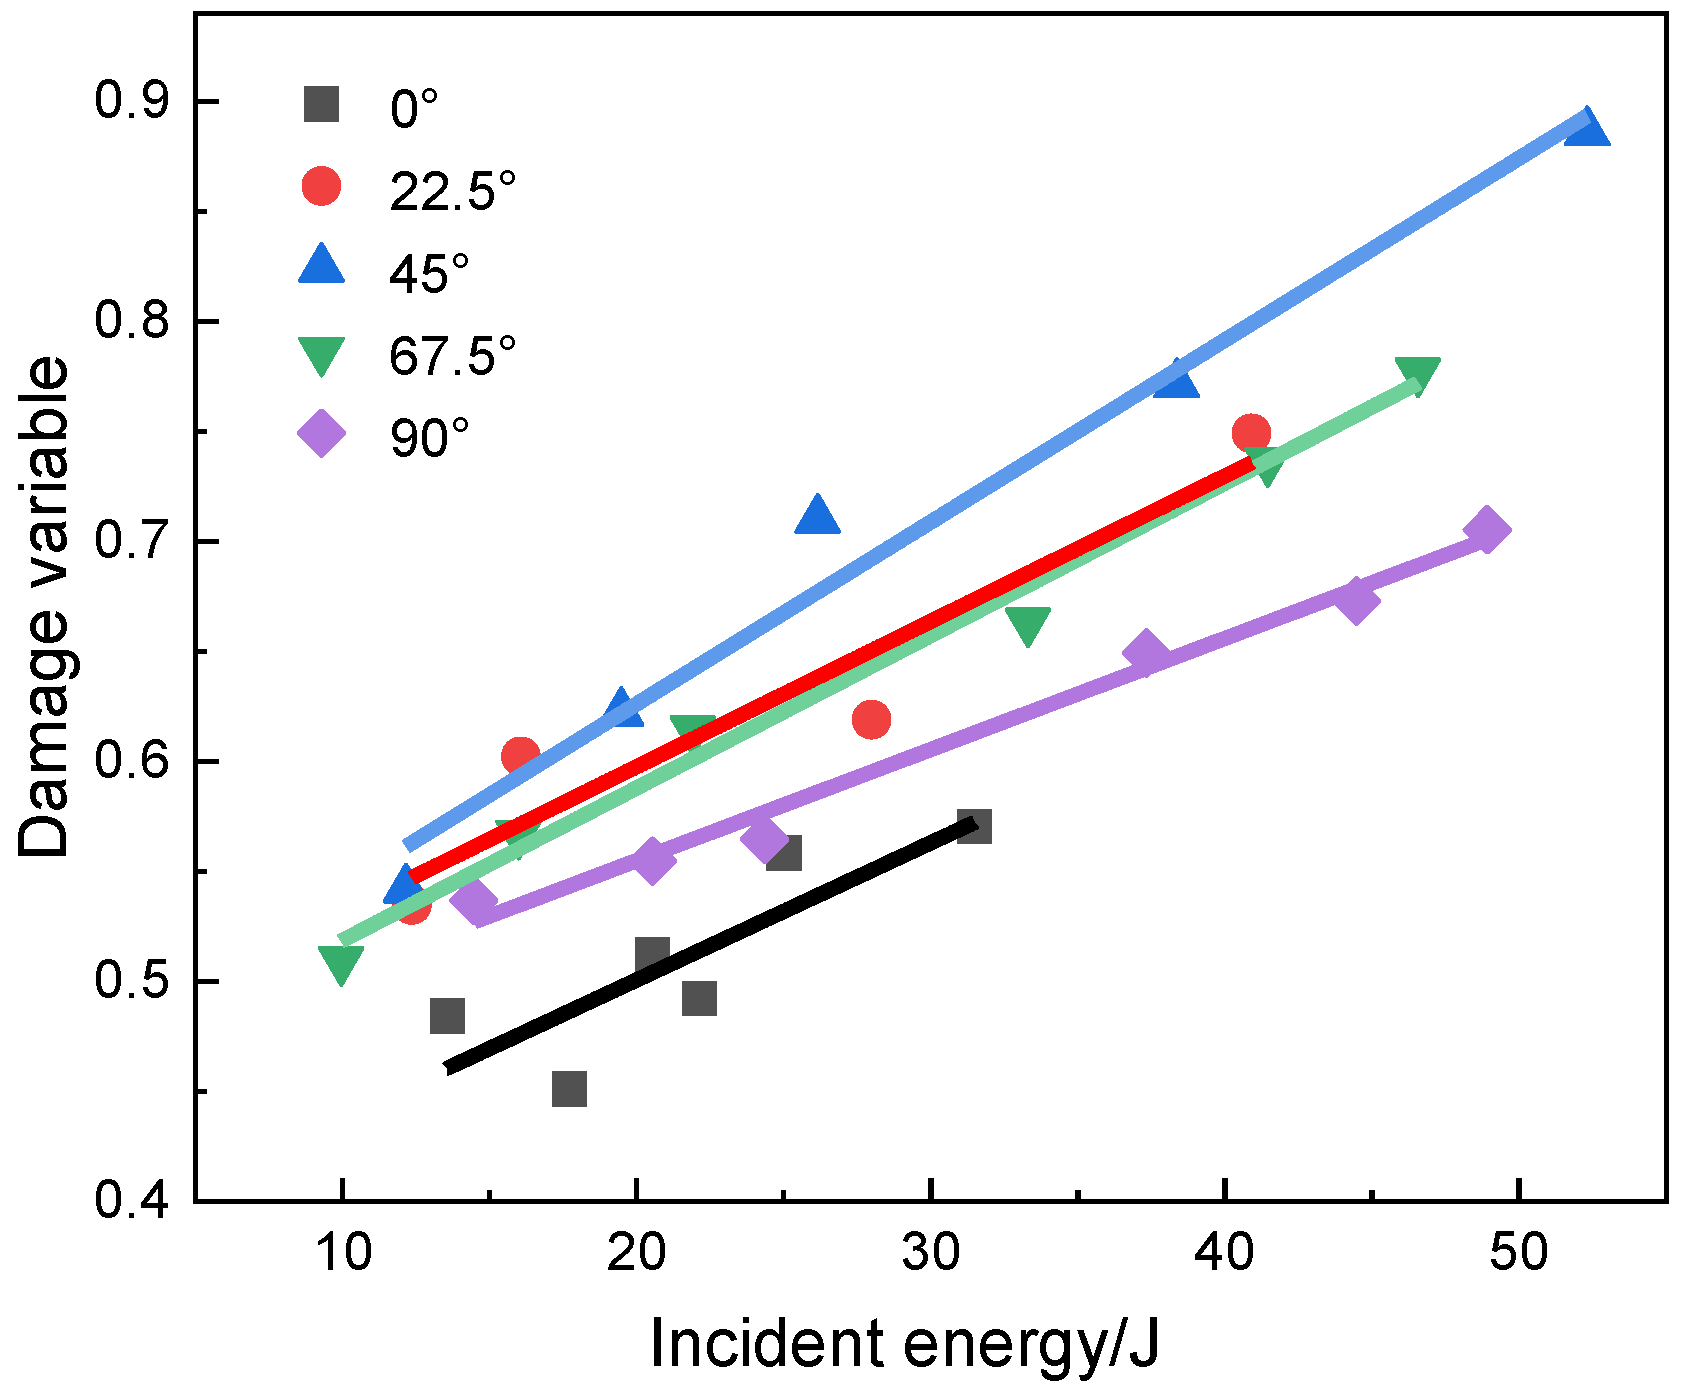
3.2. Calculation of Damage Variables for Specimens with Different Inclination Angles

The damage variable is a metric that characterizes the degree of rock failure, which can directly show the percentage of rock microcracks and pores in the total volume. According to previous studies, damage variables can be described from many aspects, such as changes in the elastic modulus or changes in wave speed. However, it is known from the laws of thermodynamics that the process of rock deformation and failure is also the process of energy absorption and release. Therefore, it is also an effective way to characterize damage through energy dissipation. On the basis of previous studies [38,39], this article defines the damage variable D in the impact failure process of sandstone specimens as follows:
D = W d u
where Wd is the total dissipated energy; u is the total absorbed energy density at the failure of the sample, and its calculation formula is:
u = σ d ε
where σ is stress; ε is strain.
In order to analyze the relationship between the total absorbed energy density, total dissipated energy density and damage variables, incident energy, and crack inclination angle, the calculation results of energy dissipation under the impact damage of samples with different inclination angles were calculated, as shown in Table 2. It can be seen from the table that the total absorbed energy density of samples with different inclination angles was 0.0089~0.0336 J/cm3, the total dissipated energy density was 0.0045~0.0237 J/cm3, and the damage variable D was 0.48~0.88.
In order to analyze the total absorbed energy density, total dissipated energy density and the response law of damage variables with incident energy for samples with different inclination angles, the calculation results in Table 2 were plotted as Figure 8 and Figure 9.
Figure 8 is the relationship curve between the total absorbed energy density and the total dissipated energy density of samples with different inclination angles and the incident energy, and Figure 9 is the relationship curve between the damage variable and the incident energy. It can be seen from the figure that the total absorbed energy density, total dissipated energy density, and damage variables of samples with different inclination angles increased with the increase in incident energy, and all showed a significant linear relationship. This is because as the incident energy gradually increased, the internal damage of the sample under the action of the stress wave increased, and the damage variable increased. The occurrence of new cracks caused the sample to consume more energy, and the energy absorbed per unit volume also increased.
Comparing the total absorbed energy density, total dissipated energy density, and damage variables of samples with different inclination angles under the same incident energy condition, we concluded that the crack inclination angle had a significant effect on it. In particular, as the inclination angle gradually increased, the total absorbed energy density and total dissipated energy density of the sample showed a trend of first decreasing and then increasing, while the damage variable showed a trend of first increasing and then decreasing. The total absorbed energy density and total dissipated energy density were the smallest during the impact failure process of the sample with α = 45°, but the corresponding damage variable was the largest. This shows that the sample with α = 45° consumed less energy and the cracks were more abundant, and the sample with the phenotype was more prone to deformation and failure. However, the total absorbed energy density and total dissipated energy density of the α = 22.5° and 67.5° specimens were relatively high, and the damage variables of the corresponding specimens decreased instead. This shows that the α = 22.5° and 67.5° specimens needed to consume higher energy during the process of cracking, showing that they were less prone to deformation and failure. Finally, the total absorbed energy density and total dissipated energy density of the α = 0° and 90° samples reached the maximum, and the damage variable reached the minimum. This shows that the cracking process of the α = 0° and 90° samples required the highest energy consumption to break the bond, which shows that these samples were the least prone to deformation and failure.
In order to analyze the relationship between sample strength and damage in the process of failure, the dynamic strength of samples with different inclination angles was plotted as a function of damage variables, as shown in Figure 10. As the energy carried by the stress wave gradually increased, the dynamic strength and damage variables of the sample increased, and a good linear relationship was shown. However, the relationship curve between the dynamic strength of the specimen with different inclination angles and the damage variable could be drawn where the crack inclination made a significant change. Specially, as the inclination angle gradually increased, the dynamic strength of the sample showed a trend of first decreasing and then increasing. The dynamic strength of the specimen with α = 45° during the impact failure process was relatively small, and the damage variable was relatively large. This shows that the strength of the α = 45° sample was low, and the ability to resist external loads was small. The dynamic strength of the α = 22.5° and 67.5° specimens was relatively higher, and the damage variable was relatively lower. This shows that the strength of the α = 22.5° and 67.5° specimens was relatively high, and the ability to resist external loads was relatively high. The dynamic strength of the specimens at α = 0° and 90° reached the maximum, and the corresponding damage variable also reached the minimum. This shows that the α = 0° and 90° samples had the greatest strength and the greatest ability to resist external loads. In summary, it can be concluded that the crack inclination was closely related to the mechanical strength of the specimen.

3.3. Characteristics of the EMR Response of Samples with Different Inclination Angles

The impact dynamics experiment was based on one-dimensional stress wave theory and the assumption of uniformity, and the sample failure occurred due to stress waves. The energy carried by the incident wave minus the energy carried by the reflected wave and the transmitted wave is the energy consumed by the deformation and destruction of the sample, and part of the energy will be released in the form of heat energy, sound energy, EMR energy, etc. In order to study the relationship between EMR energy and various parameters in the process of impact damage, the relationship curve between EMR energy and dissipated energy density and the damage variables was drawn, as shown in Figure 11 and Figure 12.
It can be seen from Figure 11 that as the dissipated energy density of the sample increased gradually during the impact failure process of the samples with different inclination angles, the EMR energy also increased, and it showed a good exponential fitting relationship. When the dissipated energy density reached a certain threshold, the EMR energy began to rise rapidly.
From Figure 11 and Figure 12, it can be seen that based on the EMR energy of samples with different inclination angles under the same incident energy condition, the damage degree of the sample with α = 45° was the largest, and the EMR energy generated by the corresponding sample was also the largest. This shows that the strength of the sample with α = 45° was the smallest, the degree of deformation and damage during the impact damage was the largest, and the strength of the EMR signal generated by the damage was also the largest. However, the damage degree and EMR energy of the samples of α = 22.5° and 67.5° were relatively small. This shows that the strength of the α = 22.5° and 67.5° specimens was relatively high, the degree of deformation and damage during the impact damage process was relatively small, and the EMR signal strength was relatively small. The α = 0° and 90° sample damage degree and EMR energy reached the minimum. This shows that the strength of the α = 0° and 90° samples was the largest, the degree of deformation and damage during the impact damage was the smallest, and the intensity of the EMR signal was also the smallest. In summary, it can be concluded that the EMR response was closely related to the damage and destruction of the specimen.

3.4. Frequency Characteristics of EMR of Samples with Different Inclination Angles

The experiment indicated that the EMR signal was doped with a lot of noise signals, and the interference signal needed to be filtered out. Fast Fourier Transform (FFT) was used to quickly transform the signal from the time domain to the frequency domain features. Let X(n) be a finite-length sequence of length n and define its discrete Fourier transform X(k) as:
X ( k ) = N = 0 N 1 x ( n ) W N n k ( k = 0 , 1 , , N 1 )
The frequency characteristics are closely related to the damage scale of the sample, and the damage of different scales corresponds to different dominant frequencies. Through the FFT of the collected EMR waveform files, the frequency characteristics of the damage of samples with different inclination angles under different impact speed conditions were obtained, as shown in Figure 13. From the figure, it can be concluded that the main frequency of the EMR of the sample under impact damage was 0~5 KHz.
Comparing the EMR frequency characteristics of samples with different inclination angles under different incident energy conditions, it can be shown that as the energy carried by the stress wave increased, the dominant frequency band of the sample’s main frequency expanded from low frequency to high frequency, and the amplitude signal also increased. When the incident energy was 10–20 J, the frequency was mainly 0–1.5 kHz, the dominant frequency signal was near 200 Hz, and the amplitude signal was relatively small. This was due to the relatively small energy carried by the stress wave in the process of impact failure, and the sample produced compaction failure, mainly due to the deformation and small cracks between the particles. When the incident energy was 20~40 J, the frequency expanded to the middle frequency band, mainly at 0~3.5 kHz, the main frequency signal was located near 200 Hz and 2 kHz, and the amplitude signal also increased accordingly. This is because the energy carried by the stress wave increased, and the sample was mainly elastically damaged. At the same time, the sample has stress concentration at the prefabricated crack began to produce macroscopic cracks. The internal crystal particles began to fracture, and the charge separation occurred at the crack tip. A large amount of charges of different signs accumulated on the side to form an electrostatic field. When the incident energy was greater than 40 J, the frequency further expanded to the high frequency band, mainly at 0~5 kHz, the main frequency signal was located near 200 Hz, 2 kHz, and 4 kHz, and the amplitude signal reached the maximum. This is because the energy carried by the stress wave reached a certain threshold, the crack propagated rapidly under the action of the stress wave, the sample was completely destroyed, and the damage was more severe; free electrons were rapidly emitted outward, forming a relatively strong electrostatic field.
The EMR frequency characteristics of samples with different inclination angles compared with the same period of time under the same incident energy condition showed that the inclination angle of the pre-crack had a significant effect on the distribution and amplitude of the frequency signal. Under the same stress wave energy, the α = 0° and 90° samples mainly deformed between grains accompanied by the generation of small cracks. The frequency of free electrons generated by the deformation was relatively low. Therefore, the frequency domain of the sample spectrum signal of α = 0° and 90° was relatively narrow, and the amplitude was relatively small. However, the samples of α = 22.5° and 67.5° were relatively less prone to damage, the cracks produced were single, and the crack propagation process released low-speed free electrons. Therefore, the frequency domain of the sample frequency signal of α = 22.5° and 67.5° was relatively wide, and the amplitude was relatively large. Finally, the α = 45° specimens had a variety of failure forms, the failure scale reached the maximum, and a large number of high-speed moving free electrons were released during the rapid crack propagation. As a result, the frequency domain of the sample spectrum signal of α = 45° was relatively wide, and the amplitude was the maximum.

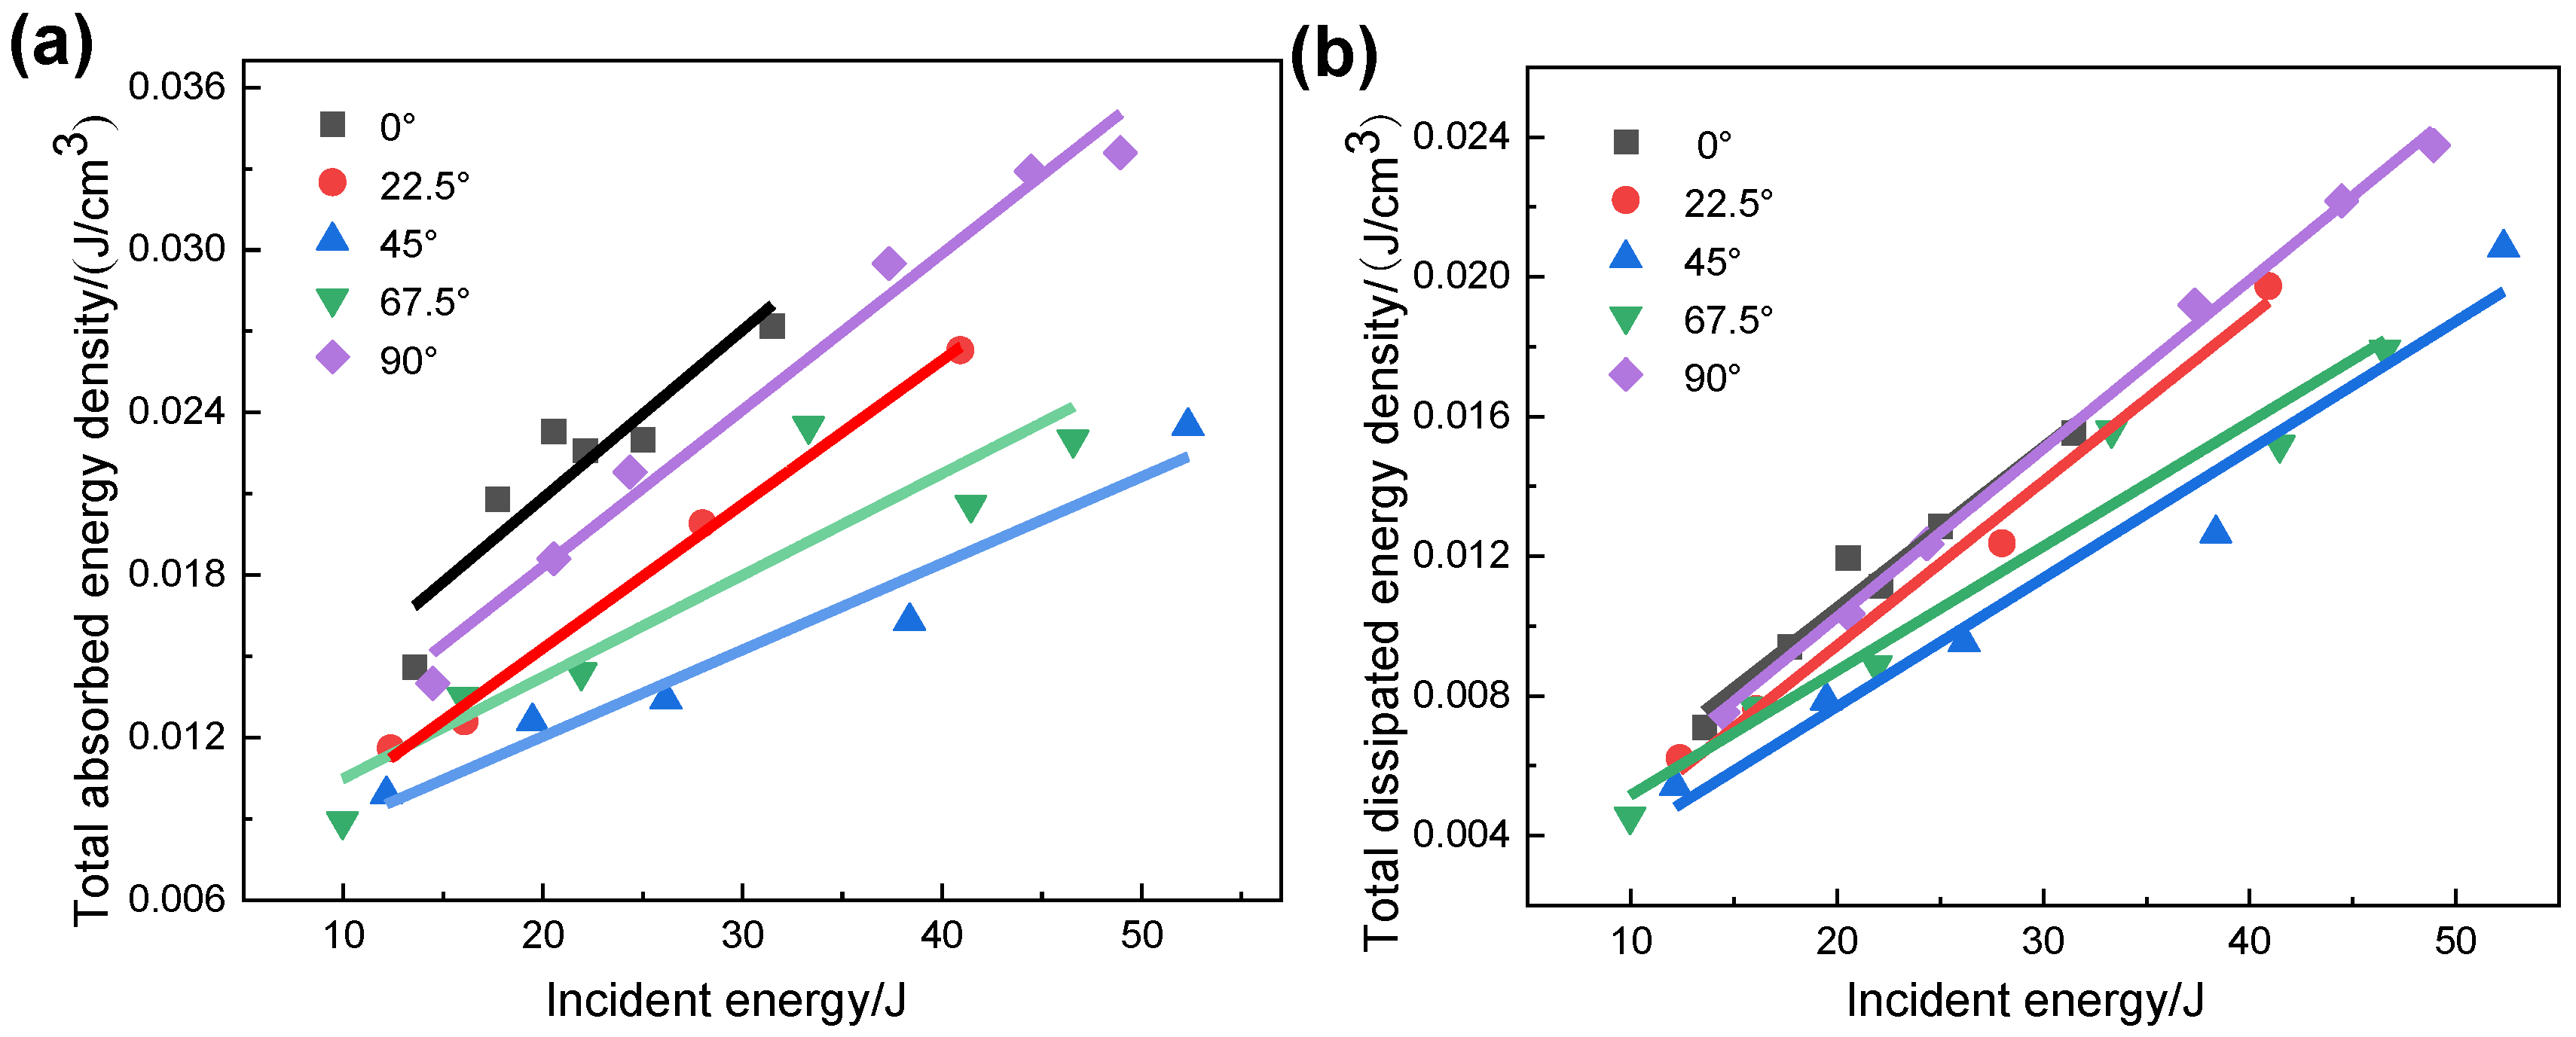
3.5. Analysis of the Energy Dissipation of the Impact Failure of Specimens with Different Inclination Angles

As mentioned in the introduction, the process of rock energy conversion is actually a reflection of changes in its internal microstructure. When the energy of the stress wave is small, the sample will oscillate with a small amplitude and no macro cracks will be generated. Under the action of the stress wave, the molecules inside the sample will deform and dislocate, and the energy will be relatively small. As the energy of the stress wave gradually increases, the sample oscillation intensifies, and the pre-crack tip region begins to expand. The molecular particles undergo intermolecular dislocation under the action of tension and shear, which causes the atoms between the particles to break and the energy consumption continues to rise. When the energy of the stress wave increases to a certain extent, the sample is unstable and damaged, the cracks propagate rapidly, a large number of internal particles fracture, and the energy consumption rises rapidly.
To study the difference in energy consumption in different fracture processes of samples with different inclination angles, test specimens were taken from the main fracture of the sample, and the scanning electron microscope (SEM) test was carried out; representative fracture topography photos were selected, as shown in Figure 14.
It is seen from the figure that the fracture morphology of the sample with α = 45° showed the main characteristics of intergranular fracture. When the crack tip has sufficient energy, the atomic bonds between the grains are broken, and the formation of the additional free surface is the smallest; the additional free surface energy required is also the smallest, and the energy required for rupture is also the smallest. Therefore, when the energy of the stress wave was the same, the specimen with α = 45° was the most prone to damage, and the corresponding damage was the largest. The α = 22.5° and 67.5° sample fracture morphology showed the combination of an intergranular fracture and a transgranular fracture. Based on the principle of minimum failure energy [3], cracks first propagated along the grains. When the cracks extended to the grains, crack arrest or growth around the crystals will occur. However, due to the large energy carried by the stress wave, the cracks will grow rapidly. When the crack propagates to the grain with lower strength, transgranular fracture will occur directly, forming a new free surface, which requires higher free energy, and consumes more energy, showing that it is less prone to damage, and the degree of damage is in the middle. The fracture morphology of the samples with α = 0° and 90° showed the main characteristics of transgranular fracture. This is because when the stress wave passed through the sample, the sample was not destroyed immediately. The stress wave oscillated repeatedly inside the sample, causing the sample to be damaged again. Under the rapid high-energy impact, tearing and fracture will occur, which requires a lot of energy, showing that the specimen was the least prone to damage, and the corresponding damage degree was correspondingly the smallest.

3.6. Analysis of the EMR Response to the Impact Damage of Specimens with Different Inclination Angles

Previous studies concluded that the EMR response of rock failure is an intricate process. In fact, the failure of a rock under load is the process of energy absorption, transformation, and release, which is accompanied by the release of electromagnetic energy and elastic energy [40]. As a typical piezoelectric material, quartz is also one of the main components of sandstone. Under the action of the impact load, the energy carried by the stress wave is transformed into elastic energy to deform the piezoelectric crystal and release free charges. Due to the large energy carried by the stress wave, the specimens often undergo trans-crystalline fracture, atomic bonds are broken, and the two sides of the fracture surface are charged with different signs. At the same time, the friction between the crack surfaces causes the electron capacitation to undergo a transition, resulting in a rapid increase in the charge density. Therefore, the greater the energy carried by the stress wave, the more violently the sample is destroyed, the higher the free charge density generated, and the greater the EMR response.
The necessary condition for crack propagation is that the elastic energy released by the crack tip area is equal to the energy required to form a new crack surface. When the energy of the stress wave reaches a certain level, the energy obtained in the crack tip area exceeds a certain threshold. The cracks that could not grow before initiate and propagate rapidly. The new crack surface rubs quickly and produces violent vibrations, resulting in a large release of energy and a rapid increase in EMR energy. Therefore, before reaching this threshold, the increase in EMR energy is approximately linear with the increase in incident energy. After the threshold is exceeded, the EMR energy begins to rise rapidly, as shown in Figure 15. This shows that the response characteristics of EMR in different stages of rock failure are different, and the process of rapid release of high energy such as the impact failure of rock is different from ordinary deformation and failure, and the response of EMR is more significant. Recognizing and using these differences can provide guidance to study the EMR response to rock failure.

3.7. Analysis of the Influence of the Inclination Angle on the EMR Response of the Sample Damage

It can be concluded that the EMR signal of sandstone damage under load is caused by various reasons. At the same time, the crack inclination also has a significant impact on the failure mode of the sample, so the damage EMR response of the sample with different inclination angles is also different [40].
The EMR signal generated by the failure of the sample with α = 45° mainly originated from crack propagation and triboelectricity. It can be concluded from 4.1 that the 45° sample underwent intergranular fracture, and the energy consumed by the crack was relatively small. Therefore, under the action of the stress wave carrying the same energy, the crack morphology generated by the α = 45° sample was more abundant, and a large number of electrons at the crack tip were able to escape and form free electrons, which generated a strong EMR signal. At the same time, rapid and severe frictional slip occurred between the crack surfaces, which caused free electrons to transfer outward to produce equal positive and negative charges between the crack surfaces. Therefore, the EMR response of the sample with α = 45° was the most intense. The EMR signal generated by the failure of the sample was mainly due to the crack propagation. Under the condition that the stress wave carries the same energy, the samples of α = 22.5° and 67.5° began to undergo transgranular fracture. The fracture required more energy, and the resulting crack was single. During the crack propagation process, only the crack tip released free electrons, and the electron density was relatively small, accompanied by a small degree of triboelectricity. Therefore, the EMR response of the samples of α = 22.5° and 67.5° was relatively small. The EMR signal generated by the α = 0° and 90° specimens mainly originated from the piezoelectric effect and crack propagation. Since the α = 0° and 90° samples had more transgranular failure, bond breaking required more energy. When the stress wave passed through the sample for the first time, the sample only underwent compression deformation and did not produce macroscopic cracks. At this stage, the piezoelectric crystal inside the sample deformed after being subjected to the stress wave, and the center of positive and negative charges shifted, causing the surface of the crystal to be electrically charged. Subsequently, the stress wave oscillated repeatedly in the sample, causing cracks on the surface of the sample, and the free electrons generated by the crack propagation were minimal. Therefore, the EMR response of the samples with α = 0° and 90° was minimal.

4. Conclusions

This paper conducted impact damage tests on sandstones with different inclination angles cracks, monitored the energy and EMR signals of each part of the sample during the impact process, analyzed the energy dissipation and EMR response laws in the failure process, and discussed the influence of the crack inclination angle on the damage energy dissipation and EMR signal of the specimen. The main conclusions are as follows:
(1)
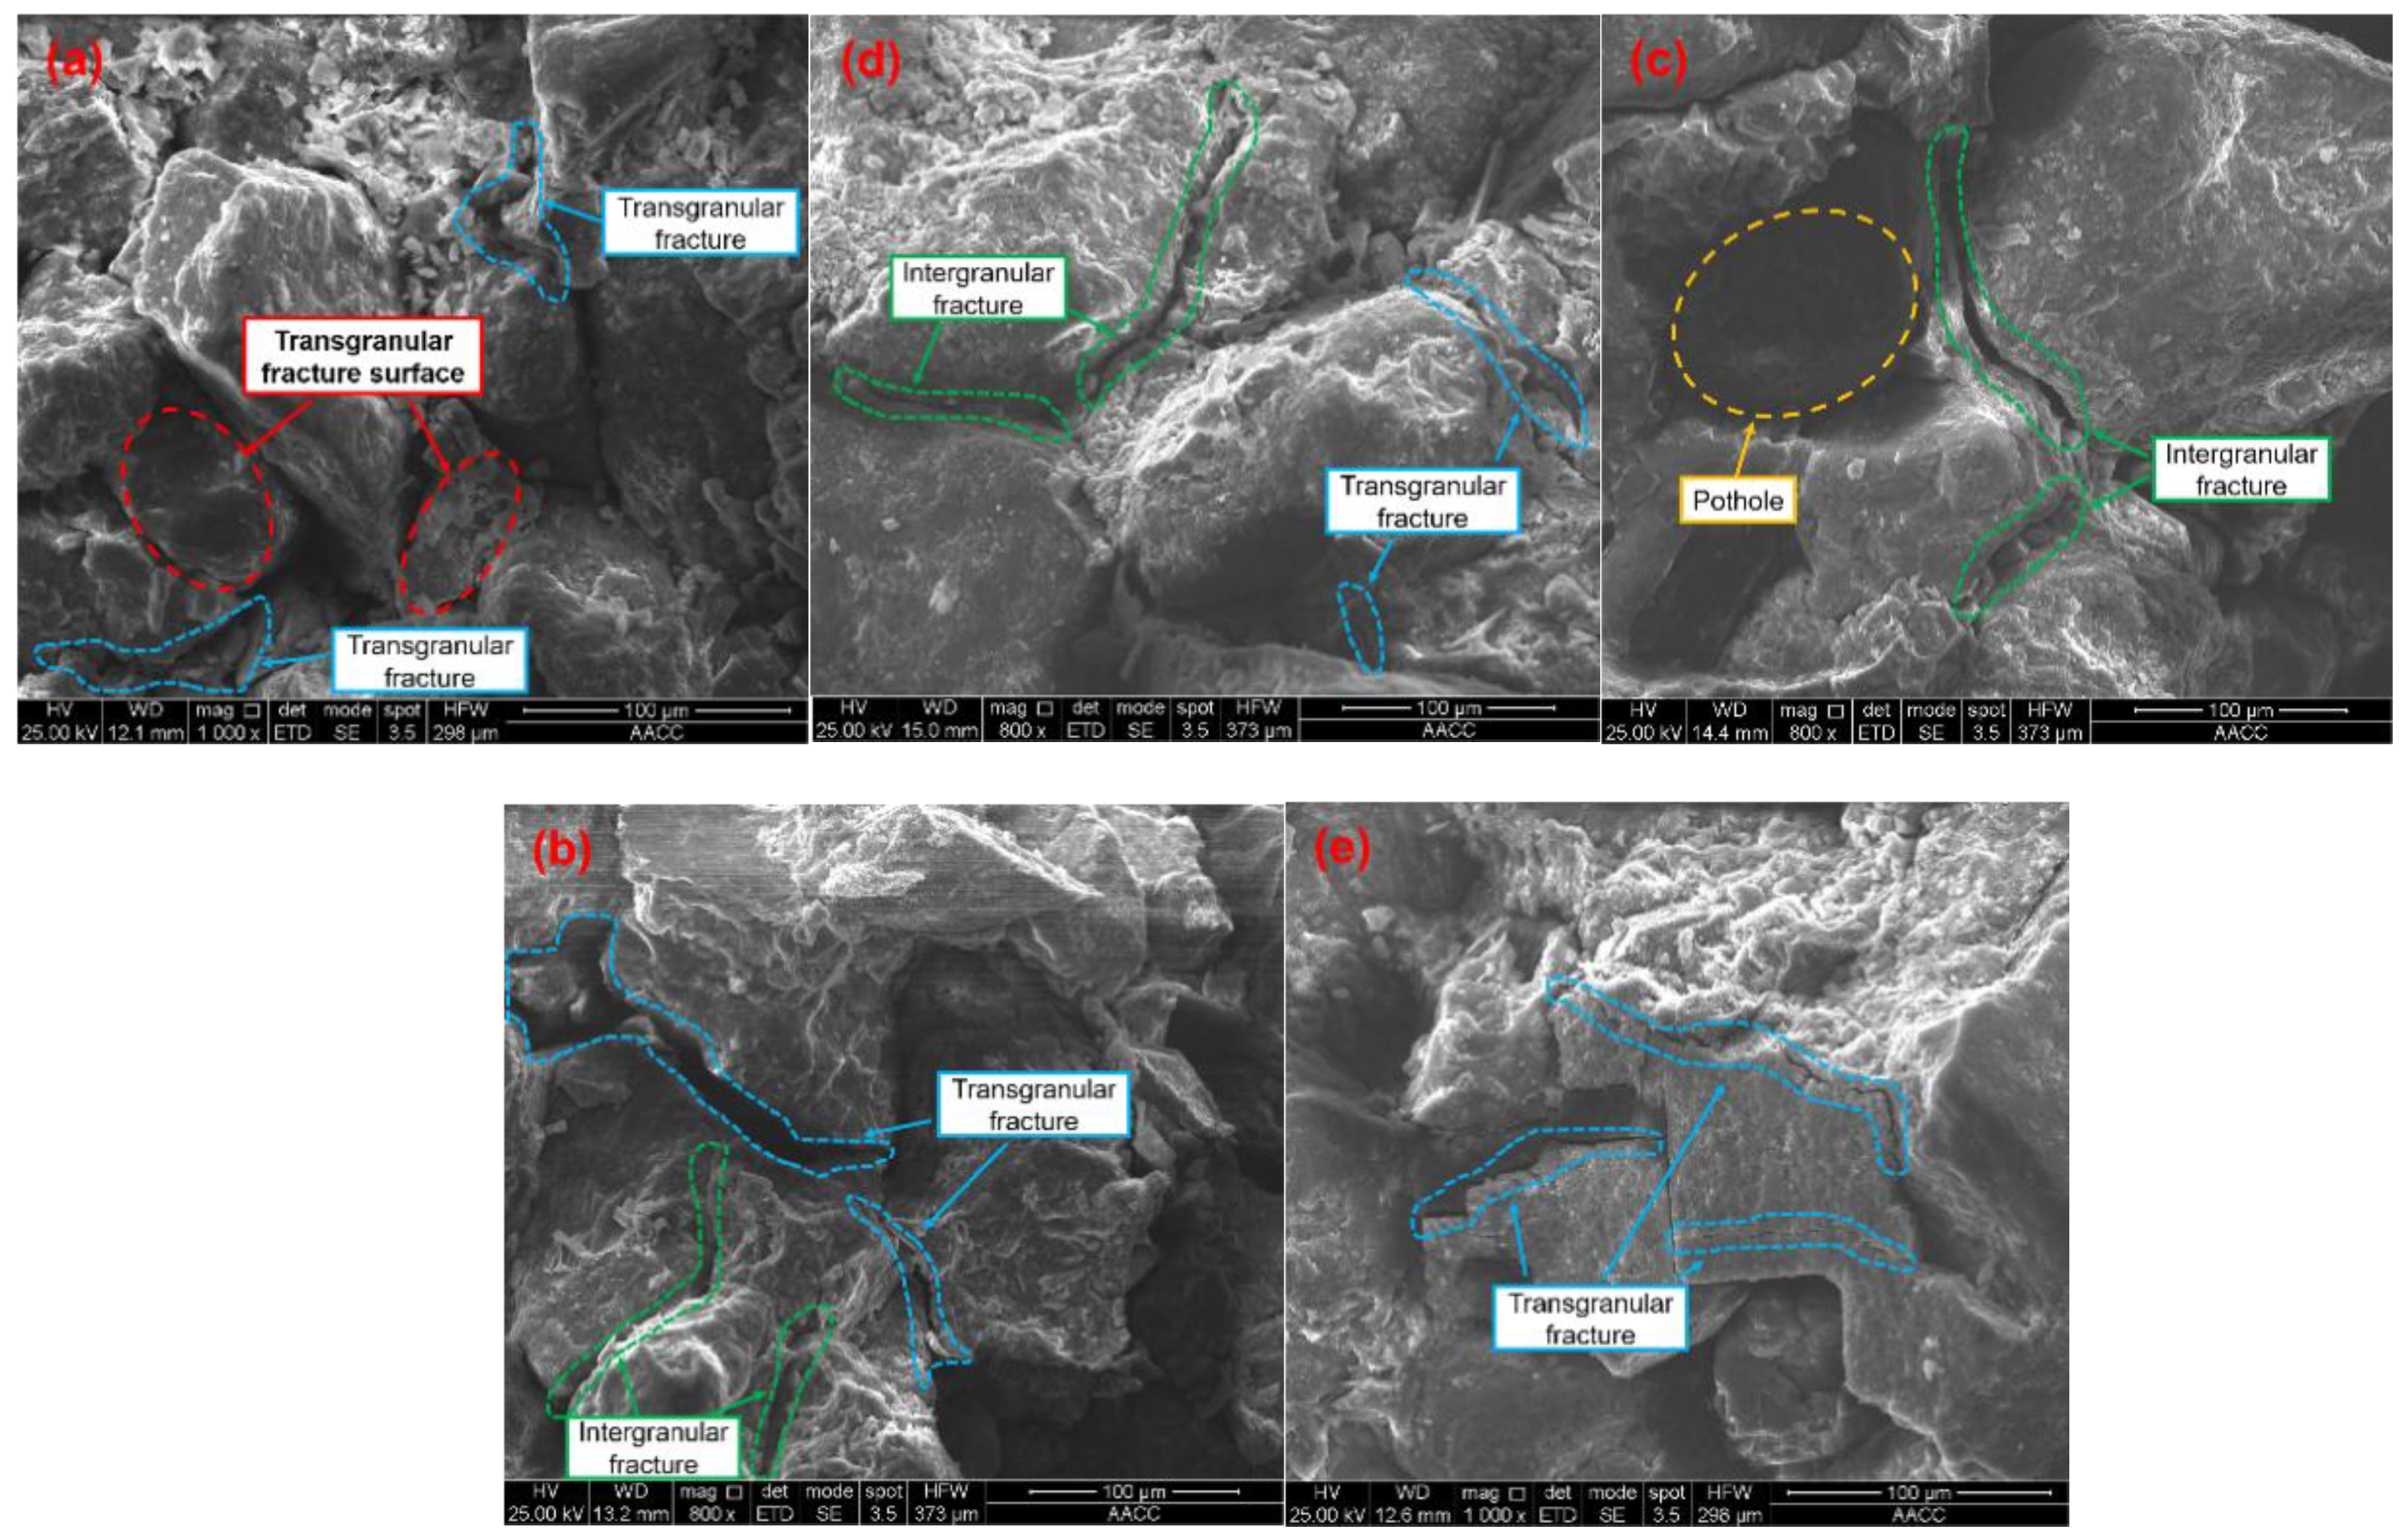
In the process of impact damage, as the energy carried by the stress wave gradually increased, the dissipated energy density and damage degrees of the sample gradually increased, and there was a significant linear relationship. At the same time, the crack inclination had a significant effect on both. Under the same incident energy condition, the sample with α = 45° was mainly characterized by intergranular fracture, the dissipated energy density was the smallest, but the damage degree was the largest. On the contrary, the samples of α = 0° and 90° were dominated by transgranular fracture, the dissipated energy density was the largest, but the damage degrees was the smallest. The α = 22.5° and 67.5° specimens showed the combined characteristics of intergranular fracture and transgranular fracture, and the dissipated energy density and damage degrees were in the middle.
(2)
During the impact experiment, the sandstone damage response to EMR had a good incident energy effect; in particular, as the incident energy increased, the free charge density generated by the piezoelectric effect, crack propagation, and friction effects increased, and the EMR energy gradually increased. When the stress wave energy reached a certain threshold, the EMR energy began to rise rapidly.
(3)
The EMR signal of the sample with α = 45° mainly originated from crack propagation and frictional electrification. The free electron density was the highest, and the EMR response was relatively strong. However, the EMR signals of the samples with α = 22.5° and 67.5° mainly originated from crack propagation, the free electron density was relatively small, and the EMR response was relatively small. Finally, the EMR signals generated by the α = 0° and 90° samples were mainly derived from the piezoelectric effect and crack propagation, the free electron density was minimized, and the EMR response was correspondingly minimized.
(4)
During the impact damage process, the main frequency range of EMR was 0~5 kHz. As the energy carried by the stress wave gradually increased, the dominant frequency band of the main frequency expanded from low frequency to high frequency, and the amplitude signal gradually increased. At the same time, the EMR frequency characteristics of samples with different inclination angles were also different. The sample frequency domain was relatively wide, and the amplitude was relatively large. The α = 0° and 90° samples had the narrowest frequency domain and relatively smallest amplitude. This discovery has certain guiding significance for the use of frequency band monitoring in engineering practice. However, the time-frequency response and waveform analysis of EMR under an impact load have not yet been defined.

Author Contributions

Z.Z.: Methodology, Validation, Formal analysis, Investigation, Writing—original draft. Z.L.: Conceptualization, Methodology, Validation, Data curation, Supervision, Project administration, Funding acquisition. Y.N.: Validation, Investigation. H.T.: Validation, Investigation. X.Z.: Writing—review & editing. X.L. and M.A.: Investigation, Resources. All authors have read and agreed to the published version of the manuscript.

Funding

This research was supported by the National Natural Science Foundation of China (52074280), key projects of the National Natural Science Foundation of China (51934007), major scientific and technological innovation projects in Shandong Province (2019 JZZY020505), and Development of Jiangsu Higher Education Institutions (PAPD).

Acknowledgments

The authors would like to thank the reviewers and editors who presented critical and constructive comments for the improvement of this paper.

Conflicts of Interest

The authors declared that there is no conflict of interest.

References

  1. Cai, M.; Brown, E.T. Challenges in the Mining and Utilization of Deep Mineral Resources. Engineering 2017, 3, 432–433. [Google Scholar] [CrossRef]
  2. He, M.; Xie, H.; Peng, S.; Jiang, Y. Study on rock mechanics in deep mining engineering. Chin. J. Rock Mech. Eng. 2005, 24, 2803–2813. [Google Scholar]
  3. Jiang, Y.; Pan, Y.; Jiang, F.; Dou, L.; Ju, Y. State of the art review on mechanism and prevention of coal bumps in China. J. China Coal Soc. 2014, 39, 205–213. [Google Scholar]
  4. Xie, H.; Ju, Y.; Li, L. Criteria for strength and structural failure of rocks based on energy dissipation and energy release principles. Chin. J. Rock Mech. Eng. 2005, 24, 3003–3010. [Google Scholar]
  5. Cheng, Y.; Song, Z.; Jin, J.; Wang, T.; Yang, T. Waveform characterization and energy dissipation of stress wave in sandstone based on modified SHPB tests. Geomech. Eng. 2020, 22, 187–196. [Google Scholar]
  6. Luo, Y.; Wang, G.; Li, X.; Liu, T.; Mandal, A.K.; Xu, M.; Xu, K. Analysis of energy dissipation and crack evolution law of sandstone under impact load. Int. J. Rock Mech. Min. Sci. 2020, 132, 104359. [Google Scholar] [CrossRef]
  7. Ping, Q.; Fang, Z.; Ma, D.; Zhang, H. Coupled Static-Dynamic Tensile Mechanical Properties and Energy Dissipation Characteristic of Limestone Specimen in SHPB Tests. Adv. Civ. Eng. 2020, 2020, 7172928. [Google Scholar] [CrossRef] [Green Version]
  8. Liang, W.; Zhao, J.; Li, Y.; Zhai, Y. Research on the Fractal Characteristics and Energy Dissipation of Basalt Fiber Reinforced Concrete after Exposure to Elevated Temperatures under Impact Loading. Materials 2020, 13, 1902. [Google Scholar] [CrossRef]
  9. Ma, Q.; Huang, K.; Ma, D. Energy absorption characteristics and theoretical analysis of frozen clay with pre-existing cracks under uniaxial compressive impact load. Cold Reg. Sci. Technol. 2020, 182, 103206. [Google Scholar] [CrossRef]
  10. Zhou, S.-Q.; Zhou, D.-W.; Zhang, Y.-F.; Wang, W.-J.; Li, D. Research on the Dynamic Mechanical Properties and Energy Dissipation of Expansive Soil Stabilized by Fly Ash and Lime. Adv. Mater. Sci. Eng. 2019, 2019, 5809657. [Google Scholar] [CrossRef] [Green Version]
  11. Huang, S.; Xia, K.; Zheng, H. Observation of microscopic damage accumulation in brittle solids subjected to dynamic compressive loading. Rev. Sci. Instrum. 2013, 84, 093903. [Google Scholar] [CrossRef] [PubMed]
  12. Li, Y.; Zhai, Y.; Liu, X.; Liang, W. Research on Fractal Characteristics and Energy Dissipation of Concrete Suffered Freeze-Thaw Cycle Action and Impact Loading. Materials 2019, 12, 2585. [Google Scholar] [CrossRef] [Green Version]
  13. Liu, X.; Li, Y.; Zhao, F.; Zhou, Y.; Wang, W.; Li, S. Experimental Research on Mechanical and Energy Characteristics of Reinforced Rock under Dynamic Loading. Shock Vib. 2019, 2019, 4356729. [Google Scholar] [CrossRef] [Green Version]
  14. Liu, X.; Dai, F.; Zhang, R.; Liu, J. Static and dynamic uniaxial compression tests on coal rock considering the bedding directivity. Environ. Earth Sci. 2015, 73, 5933–5949. [Google Scholar] [CrossRef]
  15. Song, D.; Wang, E.; Liu, J. Relationship between EMR and dissipated energy of coal rock mass during cyclic loading process. Saf. Sci. 2012, 50, 751–760. [Google Scholar] [CrossRef]
  16. Yang, D.; Hu, J.; Ding, X. Analysis of energy dissipation characteristics in granite under high confining pressure cyclic load. Alex. Eng. J. 2020, 59, 3587–3597. [Google Scholar] [CrossRef]
  17. Whittles, D.; Kingman, S.; Lowndes, I.; Jackson, K. Laboratory and numerical investigation into the characteristics of rock fragmentation. Miner. Eng. 2006, 19, 1418–1429. [Google Scholar] [CrossRef]
  18. Xie, H.; Eng, R.P.; Ju, Y. Energy dissipation of rock deformation and fracture. Chin. J. Rock Mech. Eng. 2004, 23, 3565–3570. [Google Scholar]
  19. Li, D.; Wang, E.; Li, Z.; Jia, H.; Wang, X.; Kong, X.; Wang, X.; Wang, A. Muhammad, A causal mechanism for anomalous electromagnetic radiations from coal and rock failureElectromagnetic radiation mechanism. Geophysics 2018, 83, E423–E434. [Google Scholar] [CrossRef]
  20. Qiu, L.; Song, D.; Li, Z.; Liu, B.; Liu, J. Research on AE and EMR response law of the driving face passing through the fault. Saf. Sci. 2019, 117, 184–193. [Google Scholar] [CrossRef]
  21. Wang, E.Y.; Wang, Y.-G.; Li, Z.H.; Liu, X.F.; Zhao, E.-L. Experimental study on the microwave radiation precursor laws of loading coal in deformation and fracture process. Chin. J. Geophys. 2011, 51, 2429–2436. [Google Scholar]
  22. Kong, B.; Wang, E.; Li, Z. Regularity and coupling correlation between acoustic emission and electromagnetic radiation during rock heating process. Geomech. Eng. 2018, 15, 1125–1133. [Google Scholar]
  23. Kong, B.; Wang, E.; Li, Z.; Lu, W. Study on the feature of electromagnetic radiation under coal oxidation and temperature rise based on multifractal theory. Fractals 2019, 27, 1950038. [Google Scholar] [CrossRef]
  24. Li, D.; Wang, E.; Kong, X.; Zhao, S.; Kong, Y.; Wang, X.; Wang, D.; Liu, Q. Mechanical properties and electromagnetic radiation characteristics of concrete specimens after exposed to elevated temperatures. Constr. Build. Mater. 2018, 188, 381–390. [Google Scholar]
  25. Li, H.; Shen, R.; Wang, E.; Li, D.; Li, T.; Chen, T.; Hou, Z. Effect of water on the time-frequency characteristics of electromagnetic radiation during sandstone deformation and fracturing. Eng. Geol. 2020, 265, 105451. [Google Scholar] [CrossRef]
  26. Shen, R.; Li, T.; Li, H.; He, S.; Zhao, E.; Hou, Z.; Chen, T. Study on the effect of water on electromagnetic radiation characteristics of fractured sandstone under load. Environ. Earth Sci. 2021, 80, 87. [Google Scholar] [CrossRef]
  27. Wang, E.; Jia, H.; Song, D.; Li, N.; Qian, W. Use of ultra-low-frequency electromagnetic emission to monitor stress and failure in coal mines. Int. J. Rock Mech. Min. Sci. 2014, 70, 16–25. [Google Scholar] [CrossRef]
  28. Shen, R.; Li, H.; Wang, E.; Li, D.; Hou, Z.; Zhang, X.; Han, X. Mechanical behavior and AE and EMR characteristics of natural and saturated coal samples in the indirect tensile process. J. Geophys. Eng. 2019, 16, 753–763. [Google Scholar] [CrossRef]
  29. Wang, E.; He, X.; Liu, X.; Li, Z.; Wang, C.; Xiao, D. A non-contact mine pressure evaluation method by electromagnetic radiation. J. Appl. Geophys. 2011, 75, 338–344. [Google Scholar] [CrossRef]
  30. Ai, D.; Zhao, Y.; Wang, Q.; Li, C. Crack propagation and dynamic properties of coal under SHPB impact loading: Experimental investigation and numerical simulation. Theor. Appl. Fract. Mech. 2020, 105, 102393. [Google Scholar] [CrossRef]
  31. Zhou, Y.; Xia, K.; Li, X.; Li, H.; Ma, G.; Zhao, J.; Zhou, Z.; Dai, F. Suggested methods for determining the dynamic strength parameters and mode-I fracture toughness of rock materials. Int. J. Rock Mech. Min. Sci. 2012, 49, 105–112. [Google Scholar] [CrossRef]
  32. Li, X.B.; Lok, T.S.; Zhao, J. Dynamic Characteristics of Granite Subjected to Intermediate Loading Rate. Rock Mech. Rock Eng. 2004, 38, 21–39. [Google Scholar] [CrossRef]
  33. Xu, J.; Liu, S. Analysis of energy dissipation rule during deformation and fracture process of rock under high temperatures in SHPB test. Chin. J. Rock Mech. Eng. 2013, 32, 3109–3115. [Google Scholar]
  34. Ping, Q.; Ma, Q.; Yuan, P. Energy dissipation analysis of stone specimens in SHPB tensile test. J. Min. Saf. Eng. 2013, 30, 401–407. [Google Scholar]
  35. Song, L.; Hu, S. Two-wave method and three-wave method in SHPB data processing. Explos. Shock. Waves 2005, 25, 368–373. [Google Scholar]
  36. Lundberg, B. A split Hopkinson bar study of energy absorption in dynamic rock fragmentation. Int. J. Rock Mech. Min. Sci. Géoméch. Abstr. 1976, 13, 187–197. [Google Scholar] [CrossRef]
  37. Hong, L.; Zhou, Z.-L.; Yin, T.-B.; Liao, G.-Y.; Ye, Z.-Y. Energy consumption in rock fragmentation at intermediate strain rate. J. Central South Univ. Technol. 2009, 16, 677–682. [Google Scholar] [CrossRef]
  38. Li, Z.; Xu, Z.; Xie, H.; Ju, Y.; Ma, X.; Han, Z. Failure experimental study on energy laws of rock under differential dynamic impact velocities. J. China Coal Soc. 2011, 36, 2007–2011. [Google Scholar]
  39. Zhao, Y.; Gong, S.; Huang, Y. Experimental study on energy dissipation characteristics of coal samples under impact loading. J. China Coal Soc. 2015, 40, 2320–2326. [Google Scholar]
  40. Song, X.; Li, X.; Li, Z.; Zhang, Z.; Cheng, F.; Chen, P.; Liu, Y. Study on the characteristics of coal rock electromagnetic radiation (EMR) and the main influencing factors. J. Appl. Geophys. 2018, 148, 216–225. [Google Scholar] [CrossRef]
Figure 1. Schematic diagram of the experimental system.
Minerals 11 01363 g001
Figure 2. Schematic diagram of the EMR antenna layout.
Minerals 11 01363 g002
Figure 3. Schematic diagram of the crack inclination.
Minerals 11 01363 g003
Figure 4. Sample physical map.
Minerals 11 01363 g004
Figure 5. Typical waveform curve of the sample SHPB experiment.
Minerals 11 01363 g005
Figure 6. Typical energy vs. time curve.
Minerals 11 01363 g006
Figure 7. Incident energy, reflected energy, transmitted energy, and dissipated energy change curves with impact velocity: (a) 0°; (b) 22.5°; (c) 45°; (d) 67.5°; (e) 90°.
Minerals 11 01363 g007
Figure 8. The relationship curve of total absorbed energy density and total dissipated energy density with incident energy: (a) Total absorbed energy density; (b) Total dissipated energy density.
Minerals 11 01363 g008
Figure 9. The relationship curve between the damage variable and incident energy.
Minerals 11 01363 g009
Figure 10. The relationship curve between dynamic strength and damage variable.
Minerals 11 01363 g010
Figure 11. The relationship curve between EMR energy and dissipated energy density.
Minerals 11 01363 g011
Figure 12. The relationship curve between EMR energy and damage variable.
Minerals 11 01363 g012
Figure 13. EMR frequency characteristics under different crack inclination angles and impact speeds: (a) 0°; (b) 22.5°; (c) 45°; (d) 67.5°; (e) 90°.
Minerals 11 01363 g013
Figure 14. Fracture morphology characteristics: (a) 0°; (b) 22.5°; (c) 45°; (d) 67.5°: (e) 90°.
Minerals 11 01363 g014
Figure 15. The relationship curve between EMR energy and incident energy.
Minerals 11 01363 g015
Table 1. Calculation result of dynamic impact energy of the specimen.
Crack Inclination/°Impact Velocity/(m/s)Incident Energy Wi/JReflected Energy Wr/JTransmission Energy Wt/JDissipated Energy Wd/JEnergy Density/(J/cm3)Dynamic Strength/MPa
01.113.56 11.61 0.97 0.99 0.0071 33.65
1.5217.71 15.52 0.88 1.32 0.0094 32.15
1.922.12 19.43 1.13 1.56 0.0111 37.77
2.4520.53 18.01 0.85 1.67 0.0120 37.28
2.9825.00 22.39 0.81 1.80 0.0129 42.09
3.531.48 28.44 0.86 2.17 0.0155 37.77
22.51.1712.37 10.93 0.57 0.87 0.0062 23.19
1.6216.07 14.06 0.94 1.07 0.0076 29.70
2.0128.00 25.07 1.20 1.73 0.0124 32.48
2.5240.91 36.99 1.16 2.76 0.0197 31.13
451.0712.16 10.56 0.84 0.76 0.0054 18.77
1.6419.48 16.87 1.51 1.10 0.0079 24.53
1.9726.16 23.84 0.99 1.34 0.0095 25.48
2.5438.37 34.24 2.35 1.77 0.0127 31.92
2.9952.32 48.76 0.64 2.92 0.0208 26.92
67.51.189.96 9.05 0.27 0.64 0.0046 24.27
1.6515.99 14.41 0.50 1.08 0.0077 30.09
1.9921.92 20.06 0.62 1.24 0.0089 27.14
2.5733.31 30.29 0.83 2.19 0.0156 32.28
2.9641.45 38.02 1.31 2.13 0.0152 32.77
3.4946.57 43.81 0.25 2.51 0.0179 31.30
901.1114.47 12.75 0.66 1.05 0.0075 26.29
1.620.54 18.30 0.80 1.45 0.0104 31.27
1.8424.36 21.84 0.80 1.73 0.0123 29.07
2.4337.34 33.41 1.25 2.69 0.0192 38.43
2.8344.47 40.15 1.21 3.10 0.0222 41.18
3.3948.93 44.34 1.26 3.33 0.0238 38.23
Table 2. Calculation results of the damage variables.
Crack Inclination/°Incident Energy/JTotal Absorbed Energy Density
u/(J/cm3)
Total Dissipated Energy Density
εd/(J/cm3)
Damage Variable/D
013.56 0.01460.00710.48
17.71 0.02080.00940.45
22.12 0.02260.01110.49
20.53 0.02330.01190.51
25.00 0.02300.01280.55
31.48 0.02720.01550.57
22.512.37 0.01160.00620.53
16.07 0.01260.00760.61
28.00 0.01990.01230.61
40.91 0.02630.01970.74
4512.16 0.00990.00540.54
19.48 0.01260.00780.62
26.16 0.01340.00950.71
38.37 0.01630.01260.77
52.32 0.02350.02080.88
67.59.96 0.00890.00450.51
15.99 0.01350.00770.56
21.92 0.01440.00880.61
33.31 0.02350.01560.66
41.45 0.02060.01510.73
46.57 0.02300.01790.77
9014.47 0.01400.00750.53
20.54 0.01860.01030.55
24.36 0.02180.01230.56
37.34 0.02950.01910.64
44.47 0.03290.02210.67
48.93 0.03360.02370.71
Publisher’s Note: MDPI stays neutral with regard to jurisdictional claims in published maps and institutional affiliations.

