
Identification and Metabolism of Naturally Prevailing Microorganisms in Zinc and Copper Mineral Processing


Abstract
:1. Introduction
2. Materials and Methods
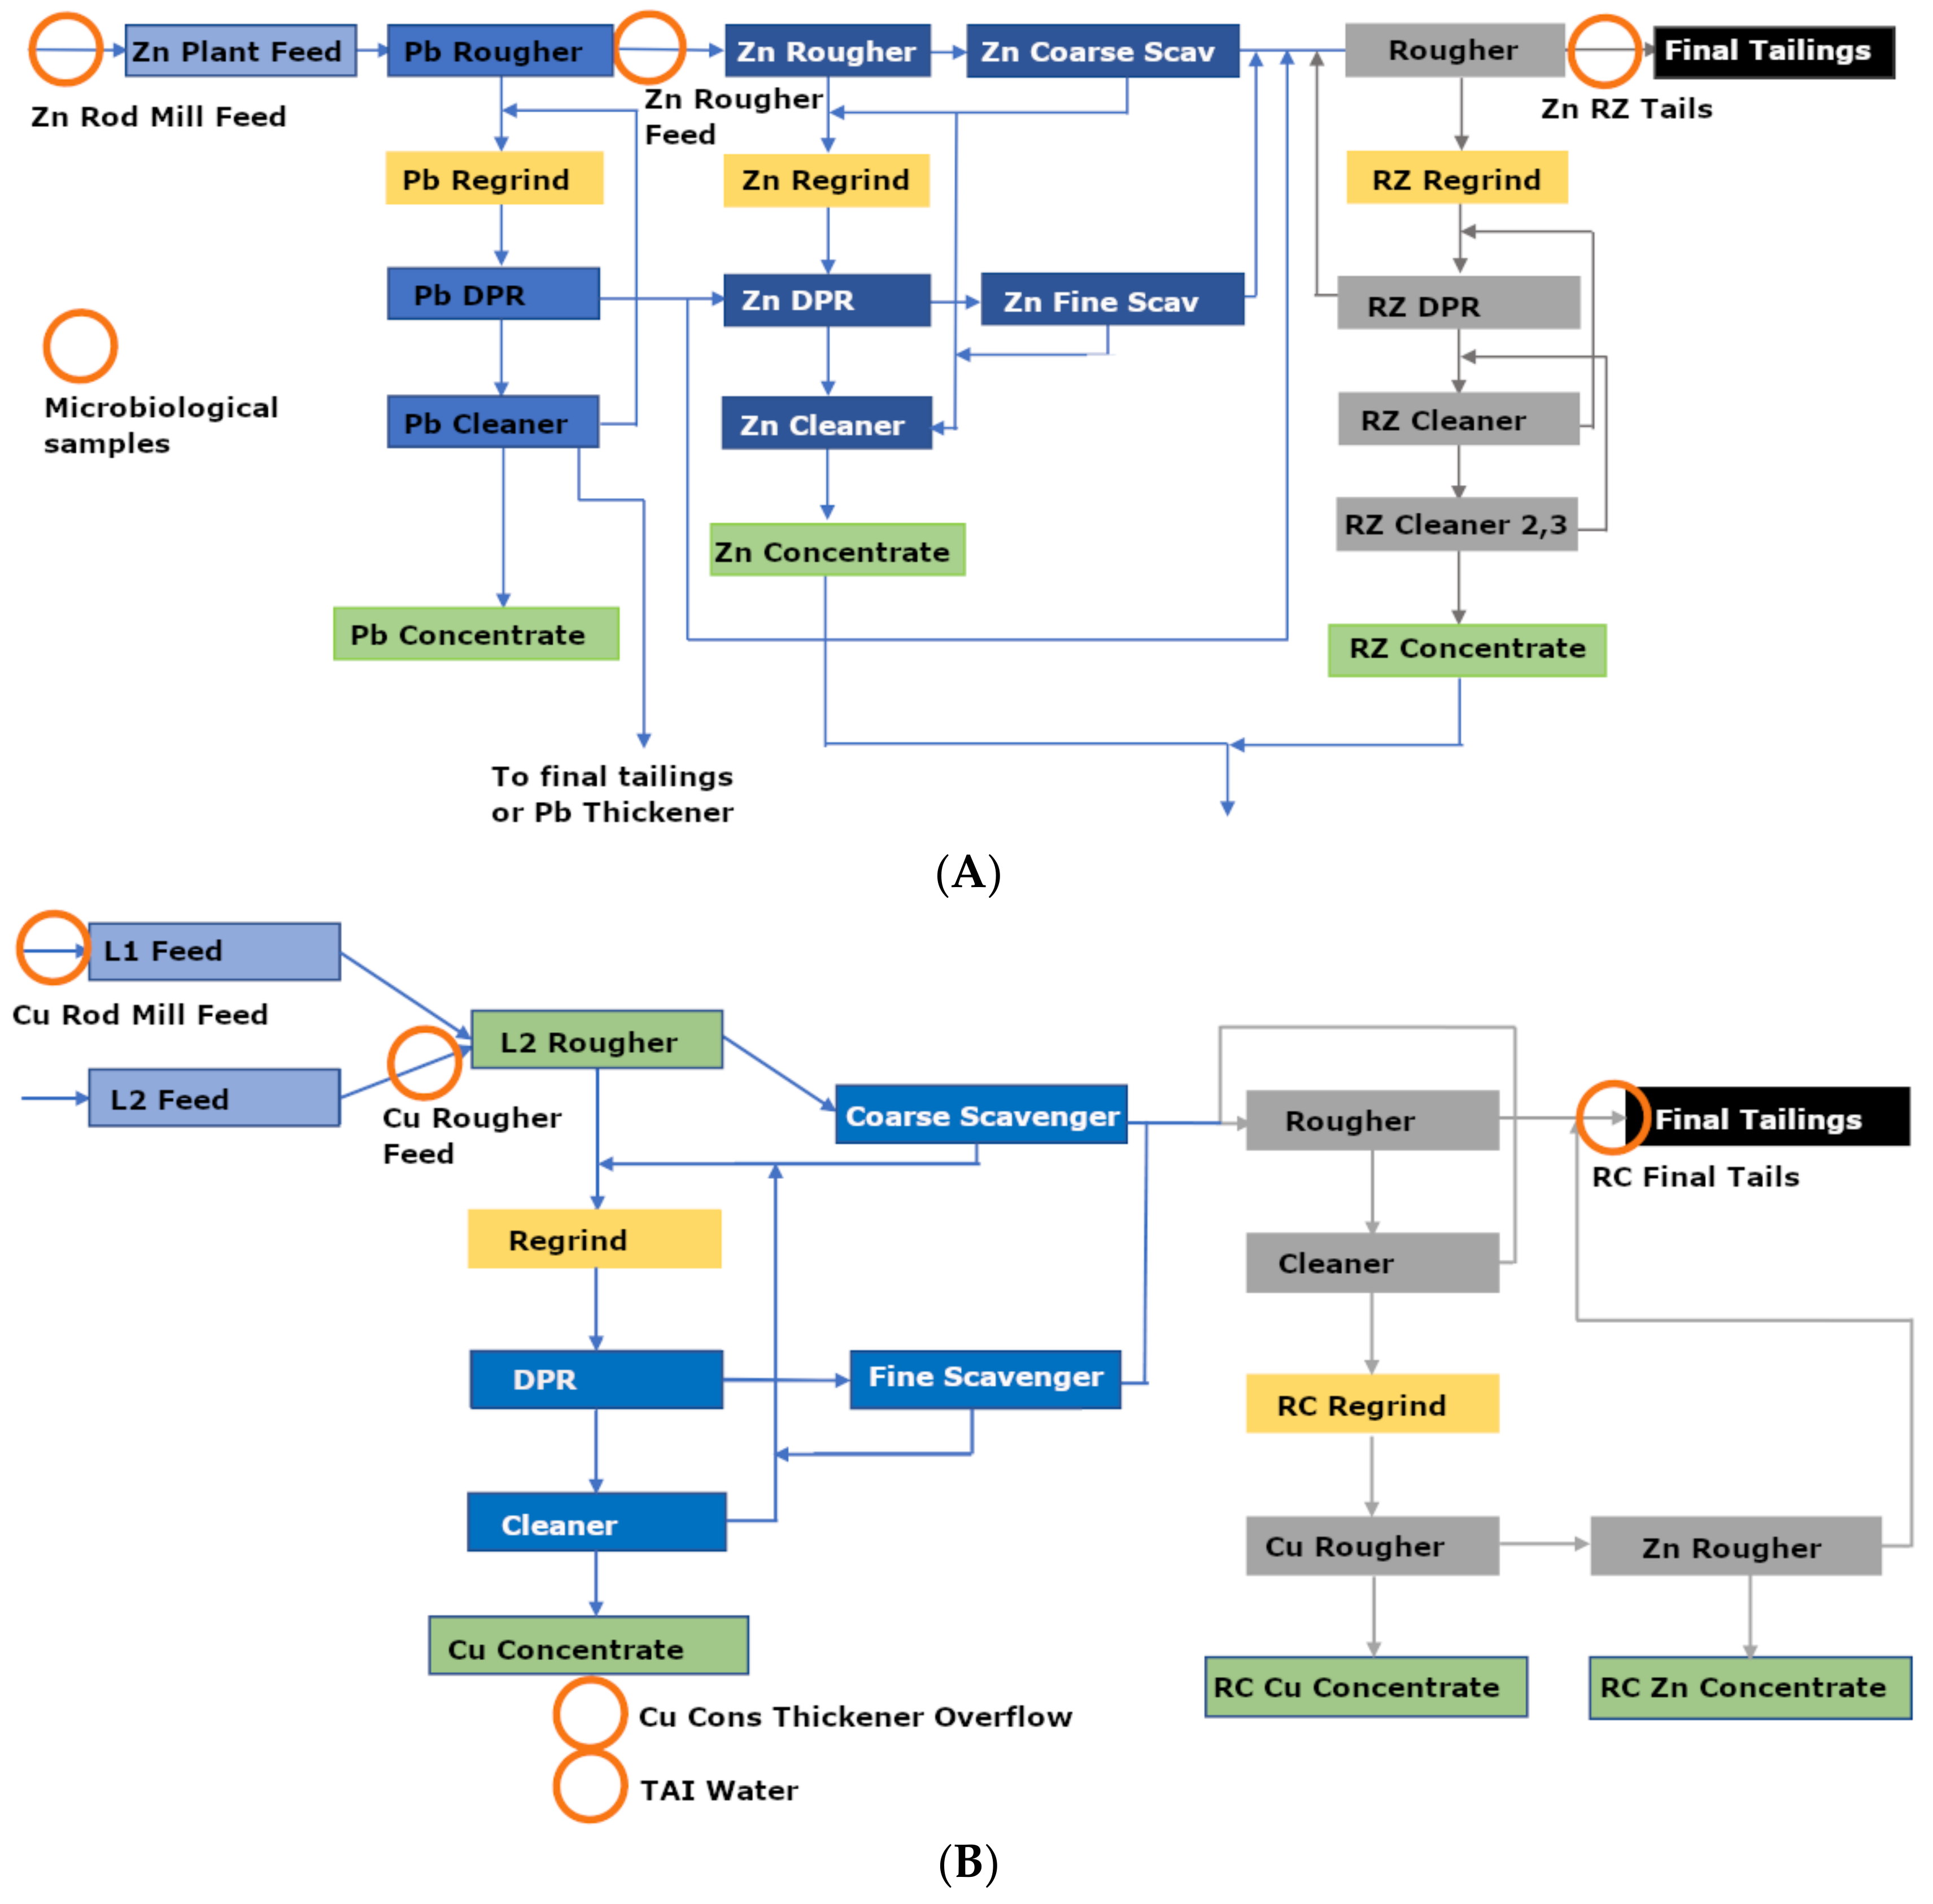
2.1. Sampling Site
2.2. Samples
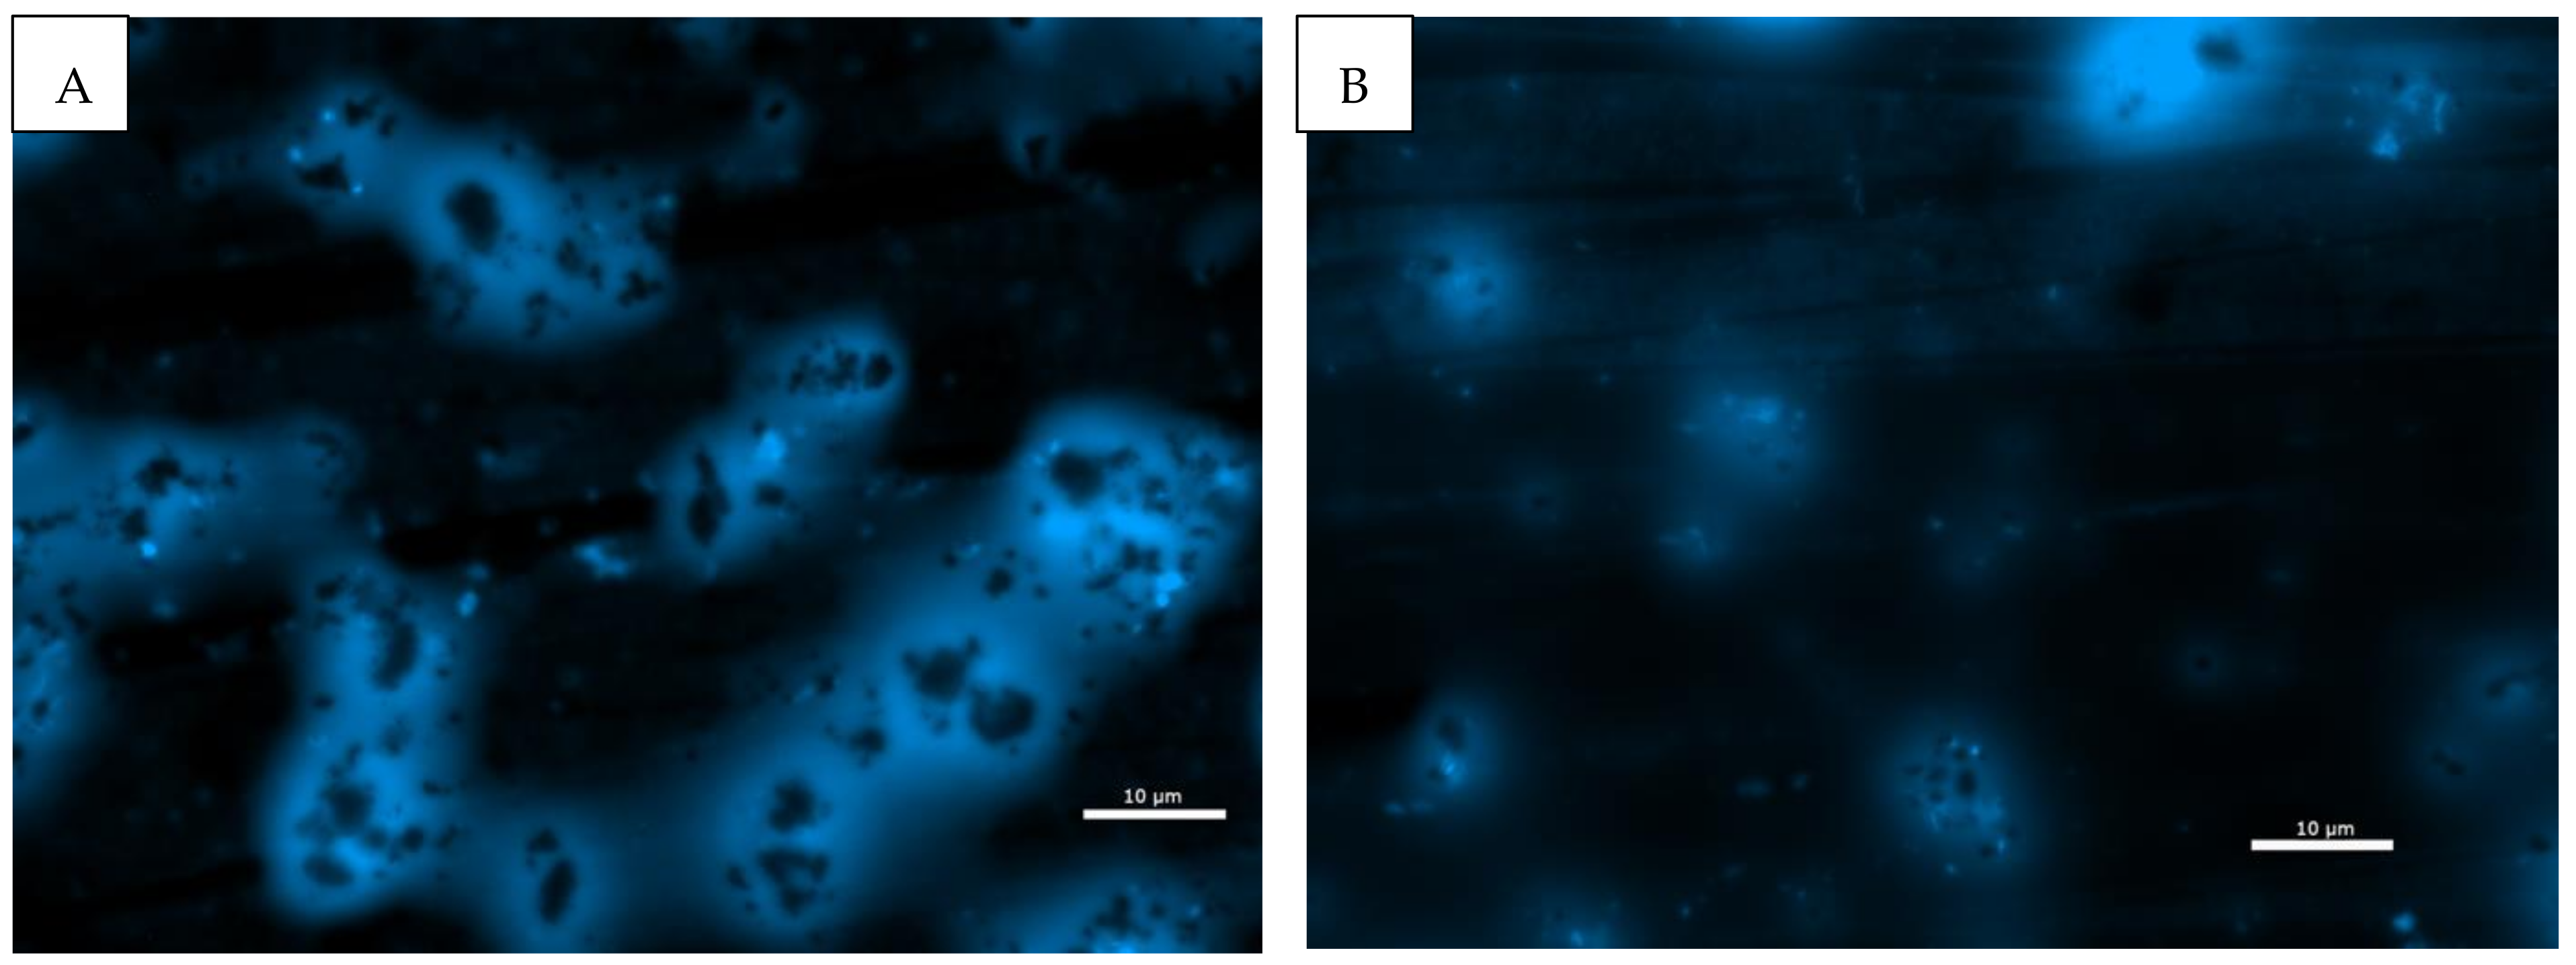
2.3. Microscopy
2.4. DNA Extraction
2.5. Estimation of Community Size
2.6. Amplicon Sequencing and Sequence Analysis
2.7. Metagenomes
2.8. Chemical Analyses
2.9. Statistical Analyses
3. Results
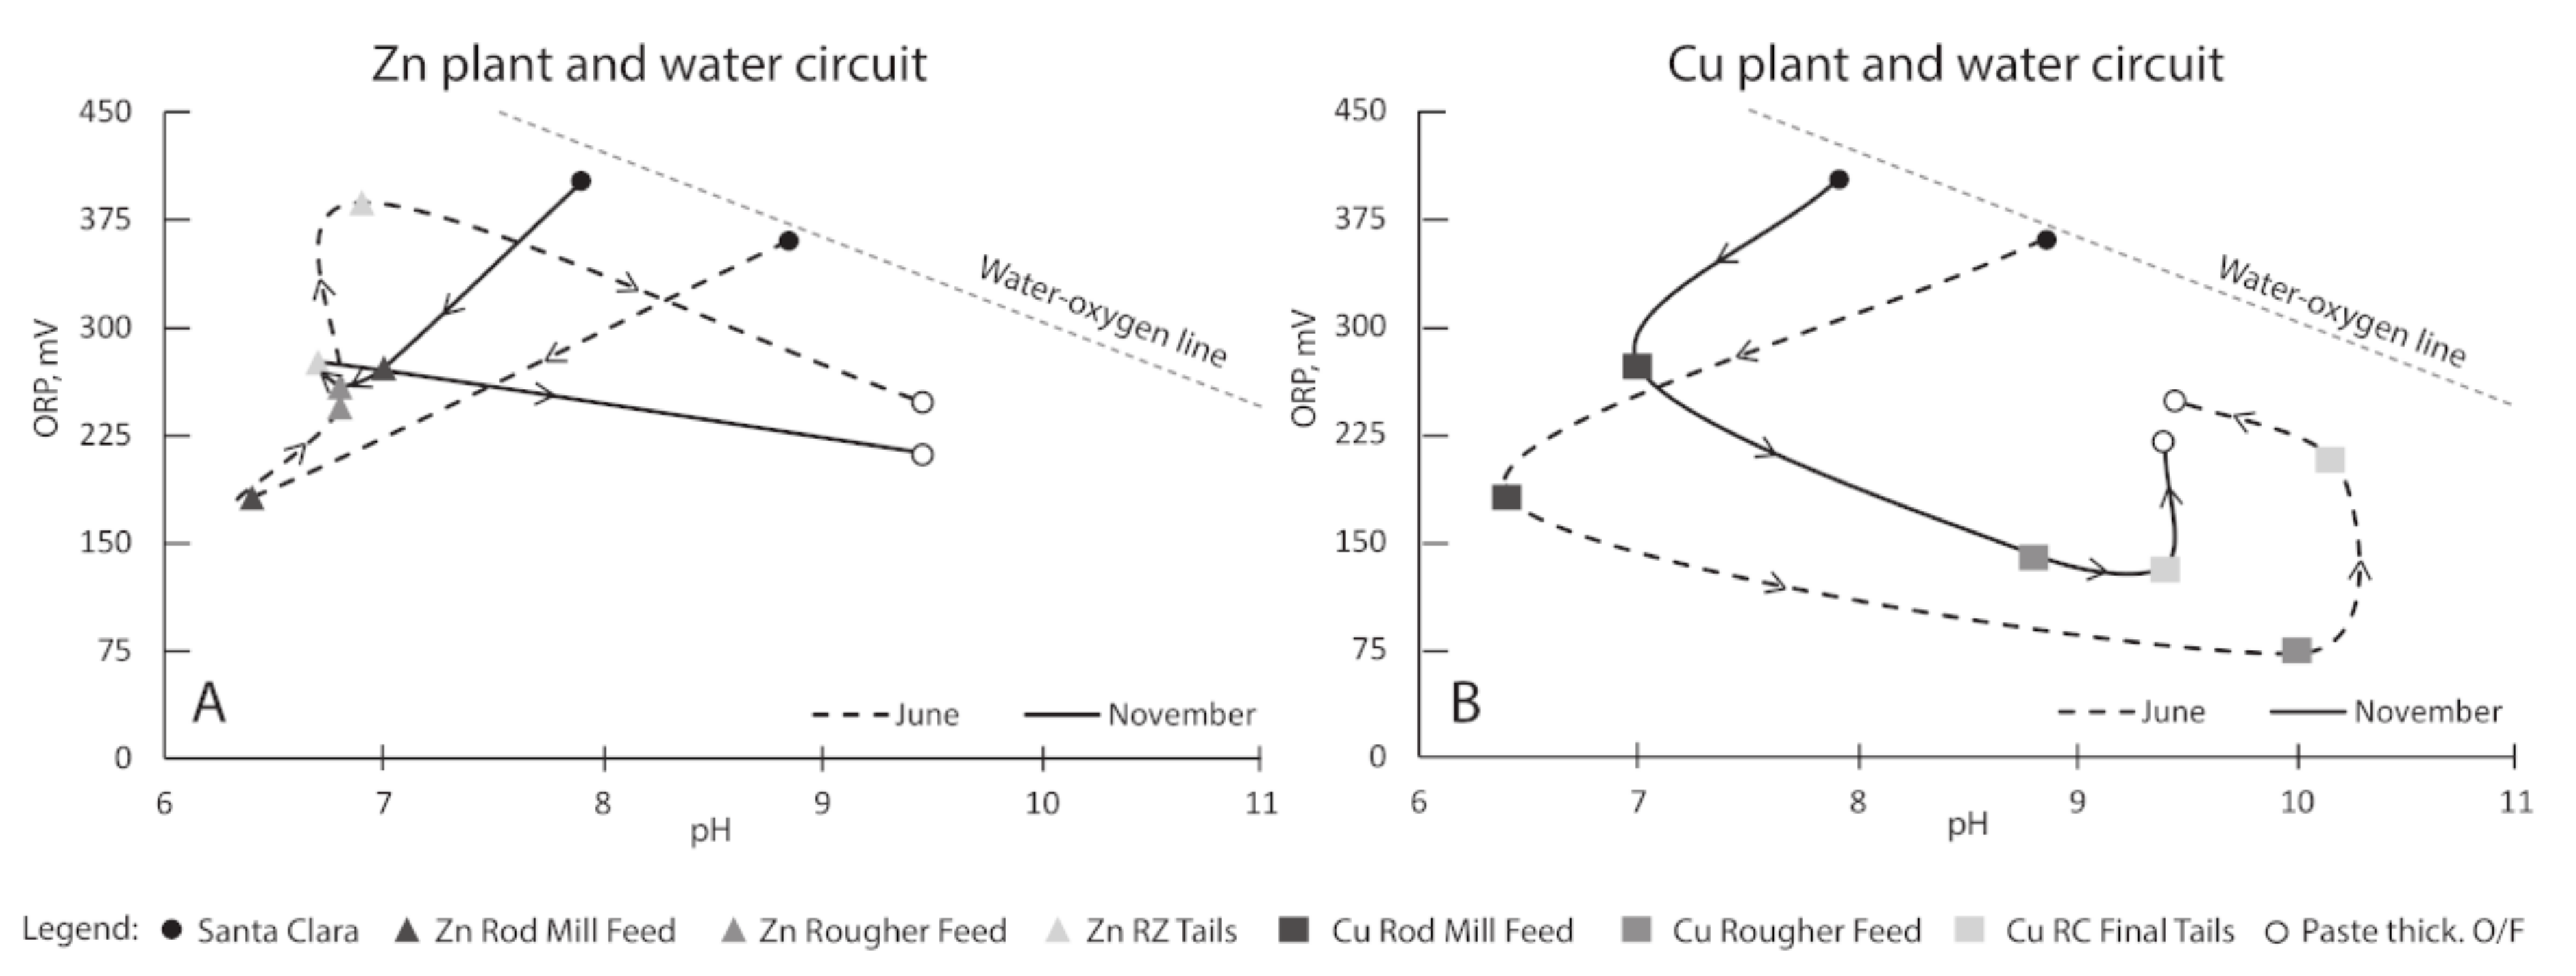
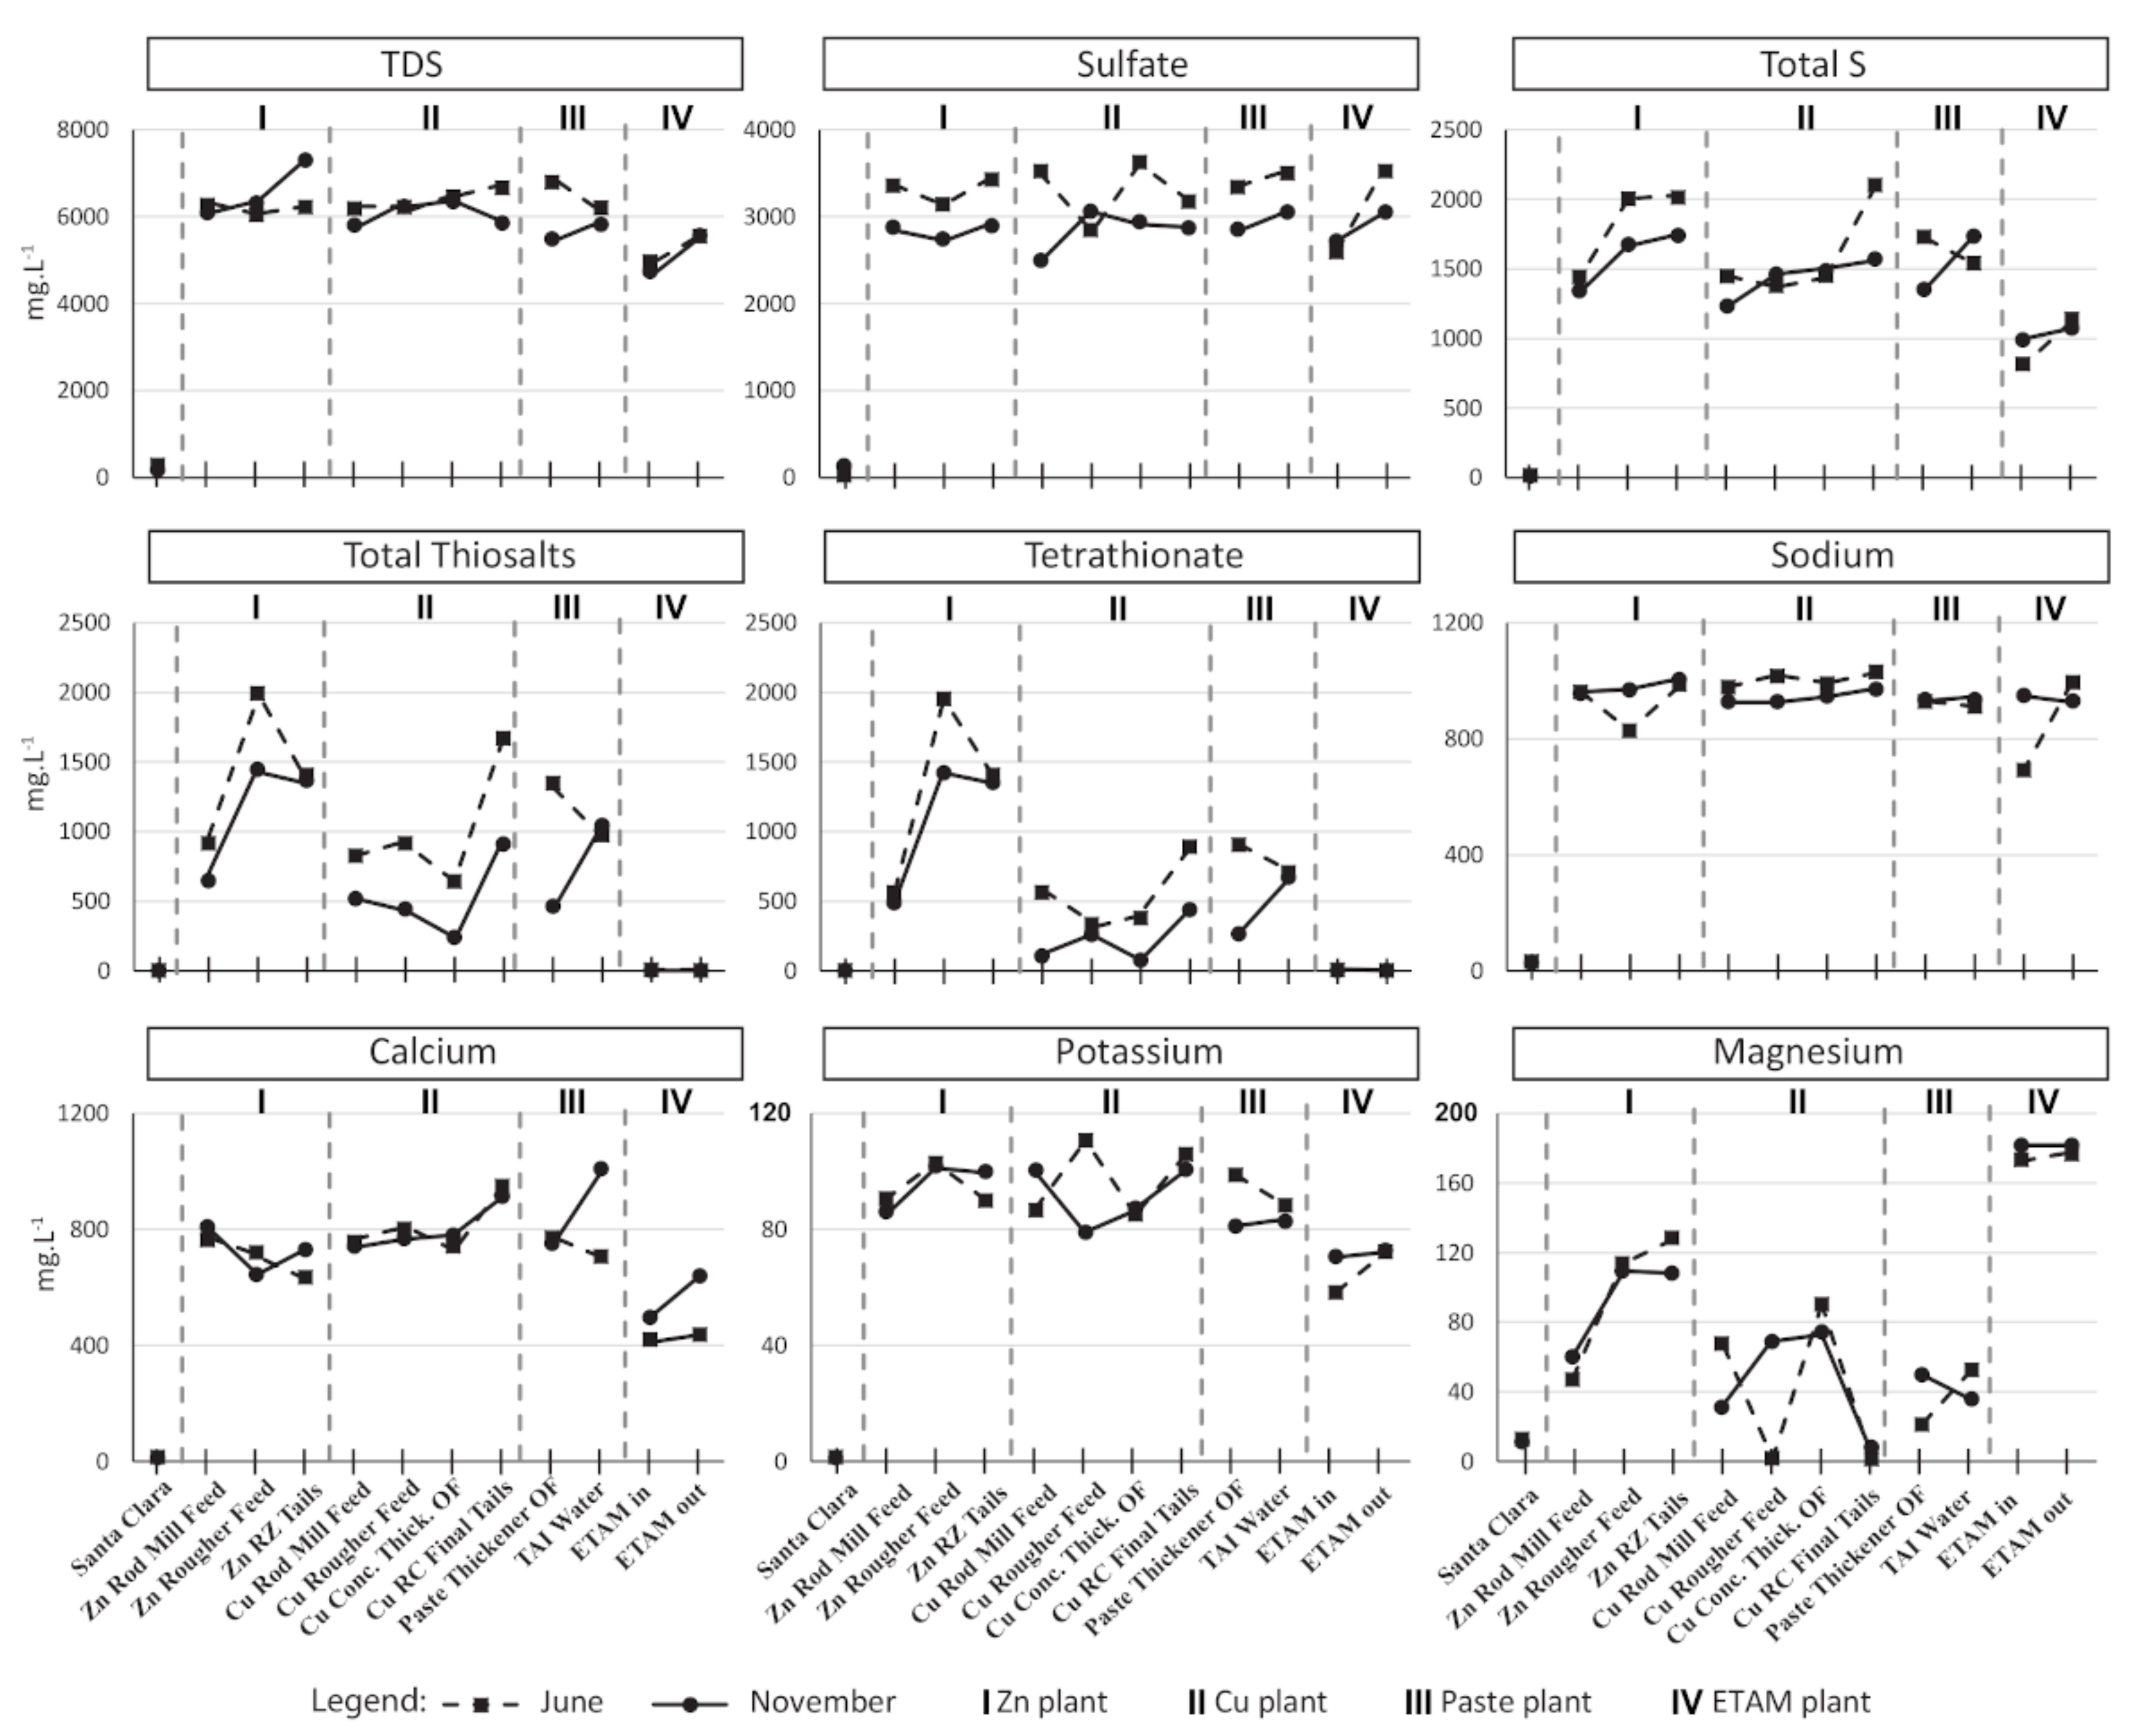
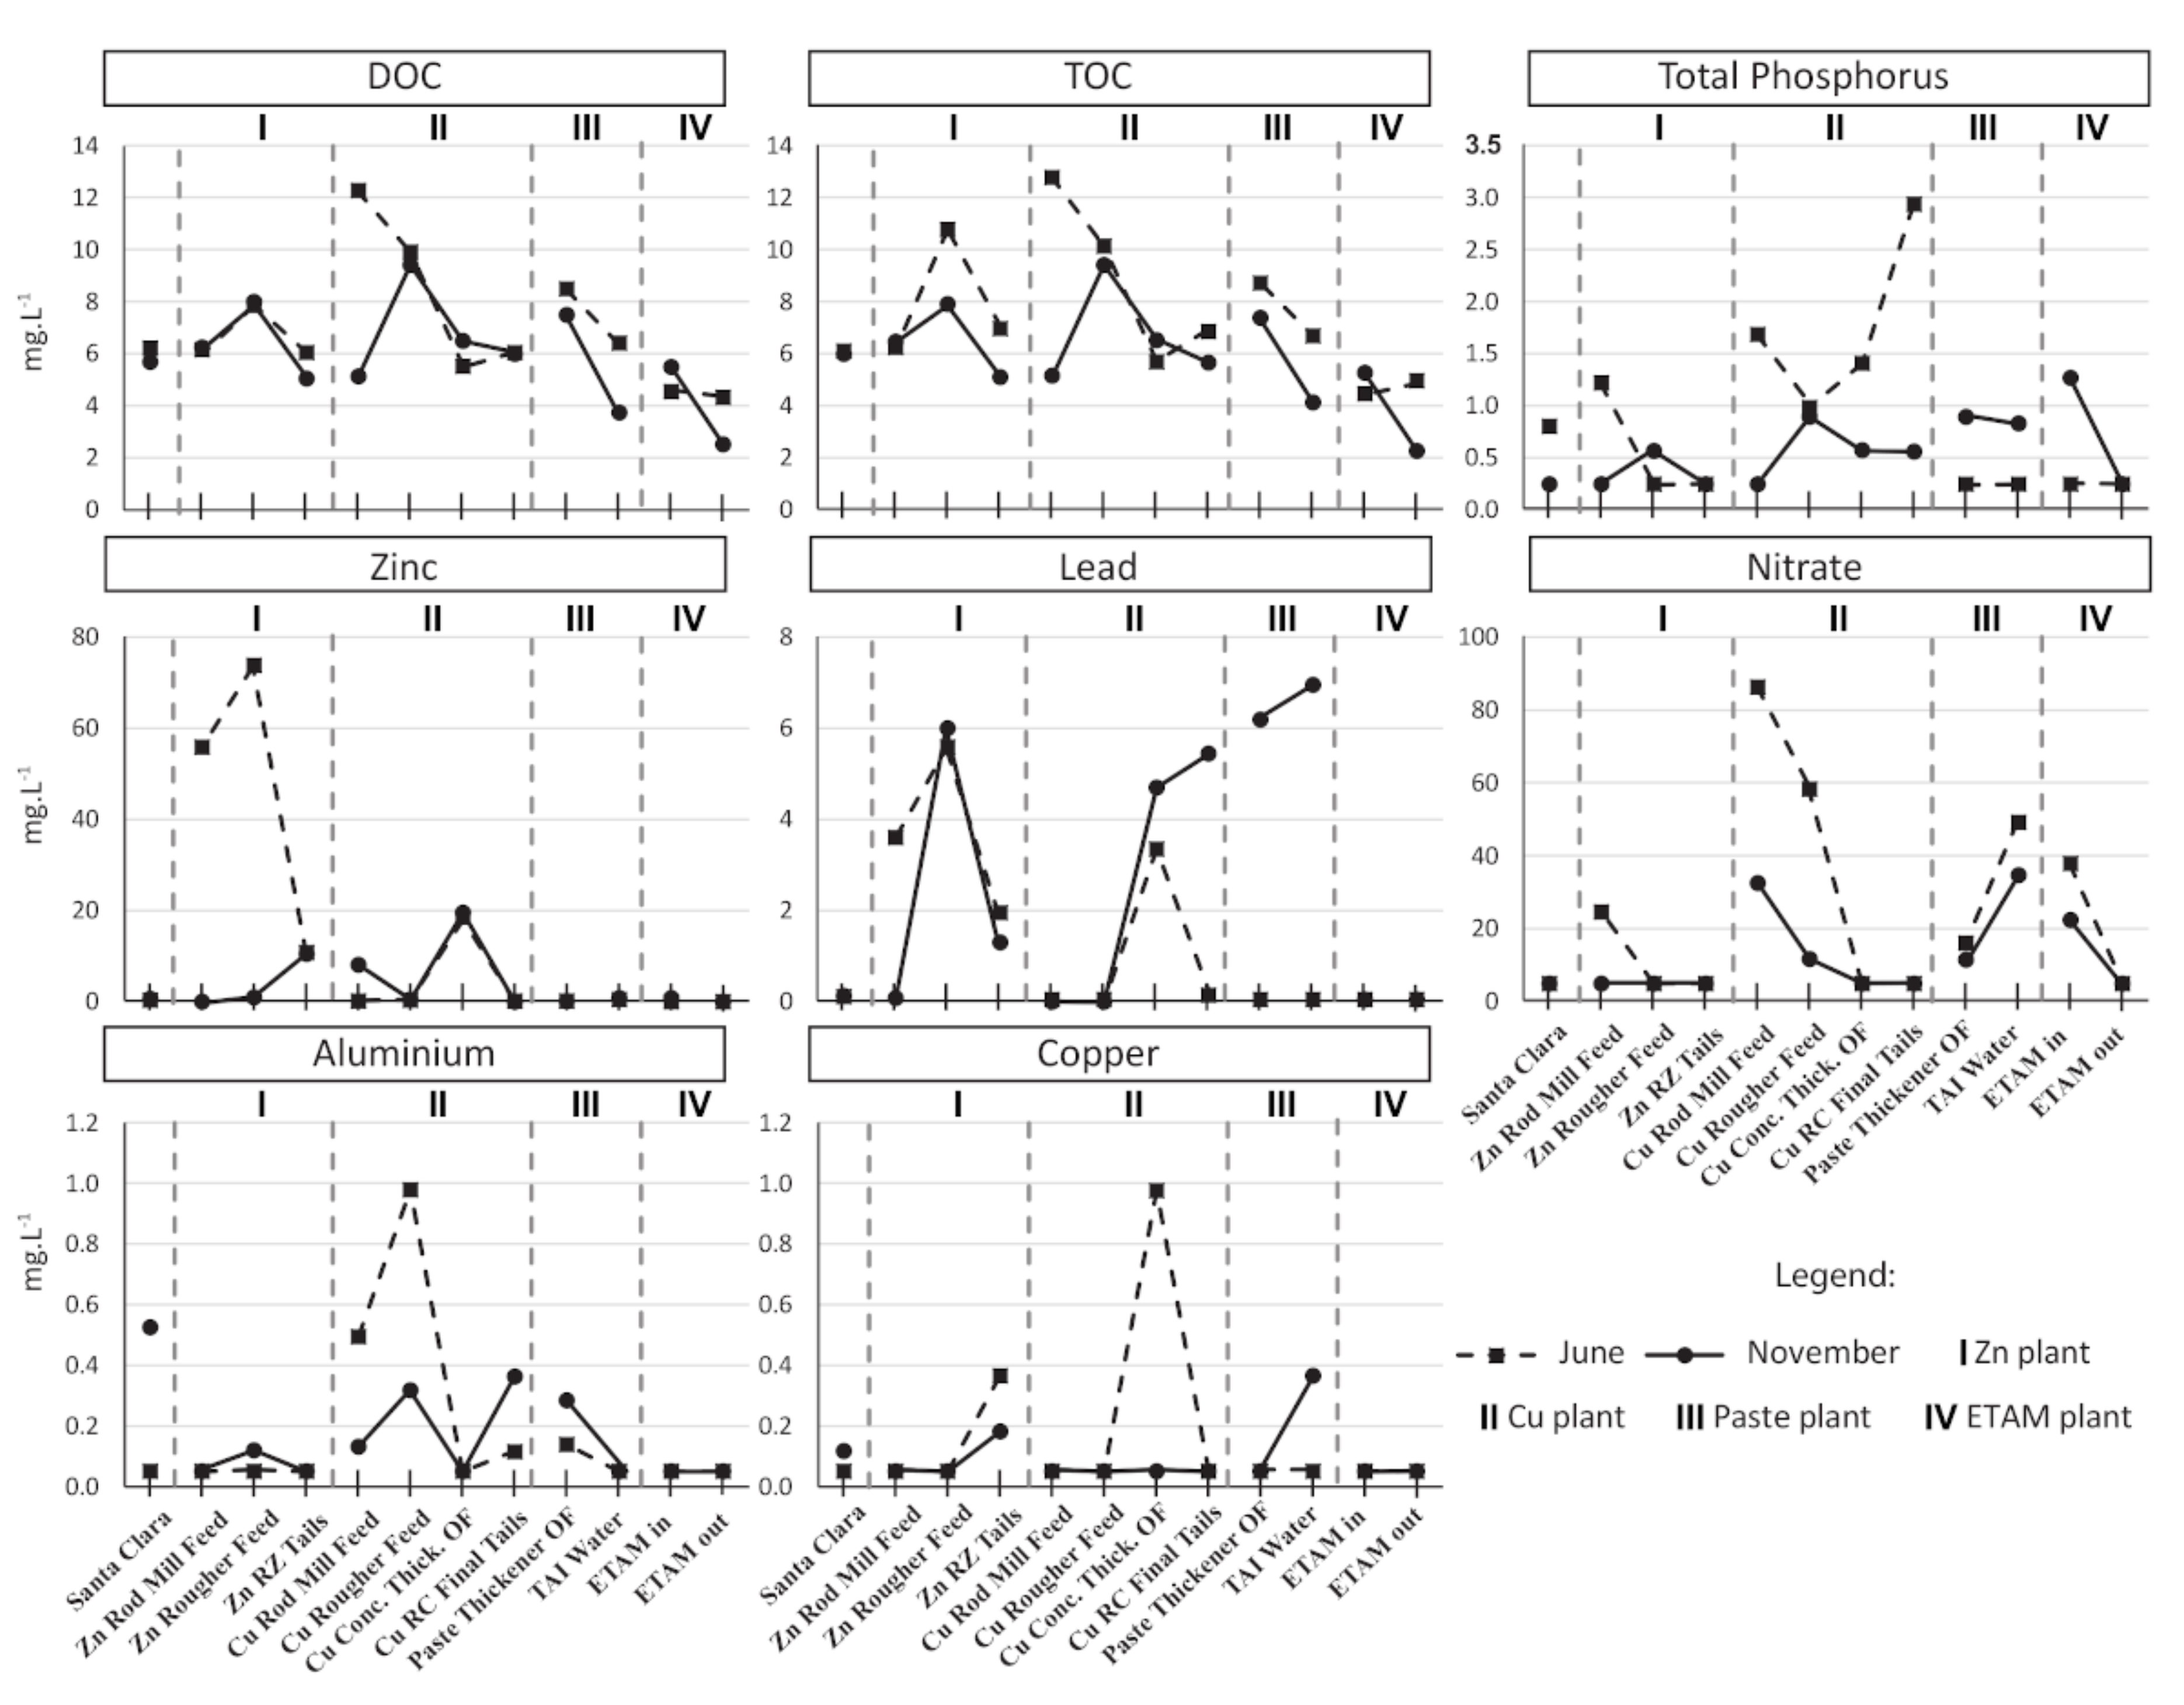
3.1. Process Water Chemistry
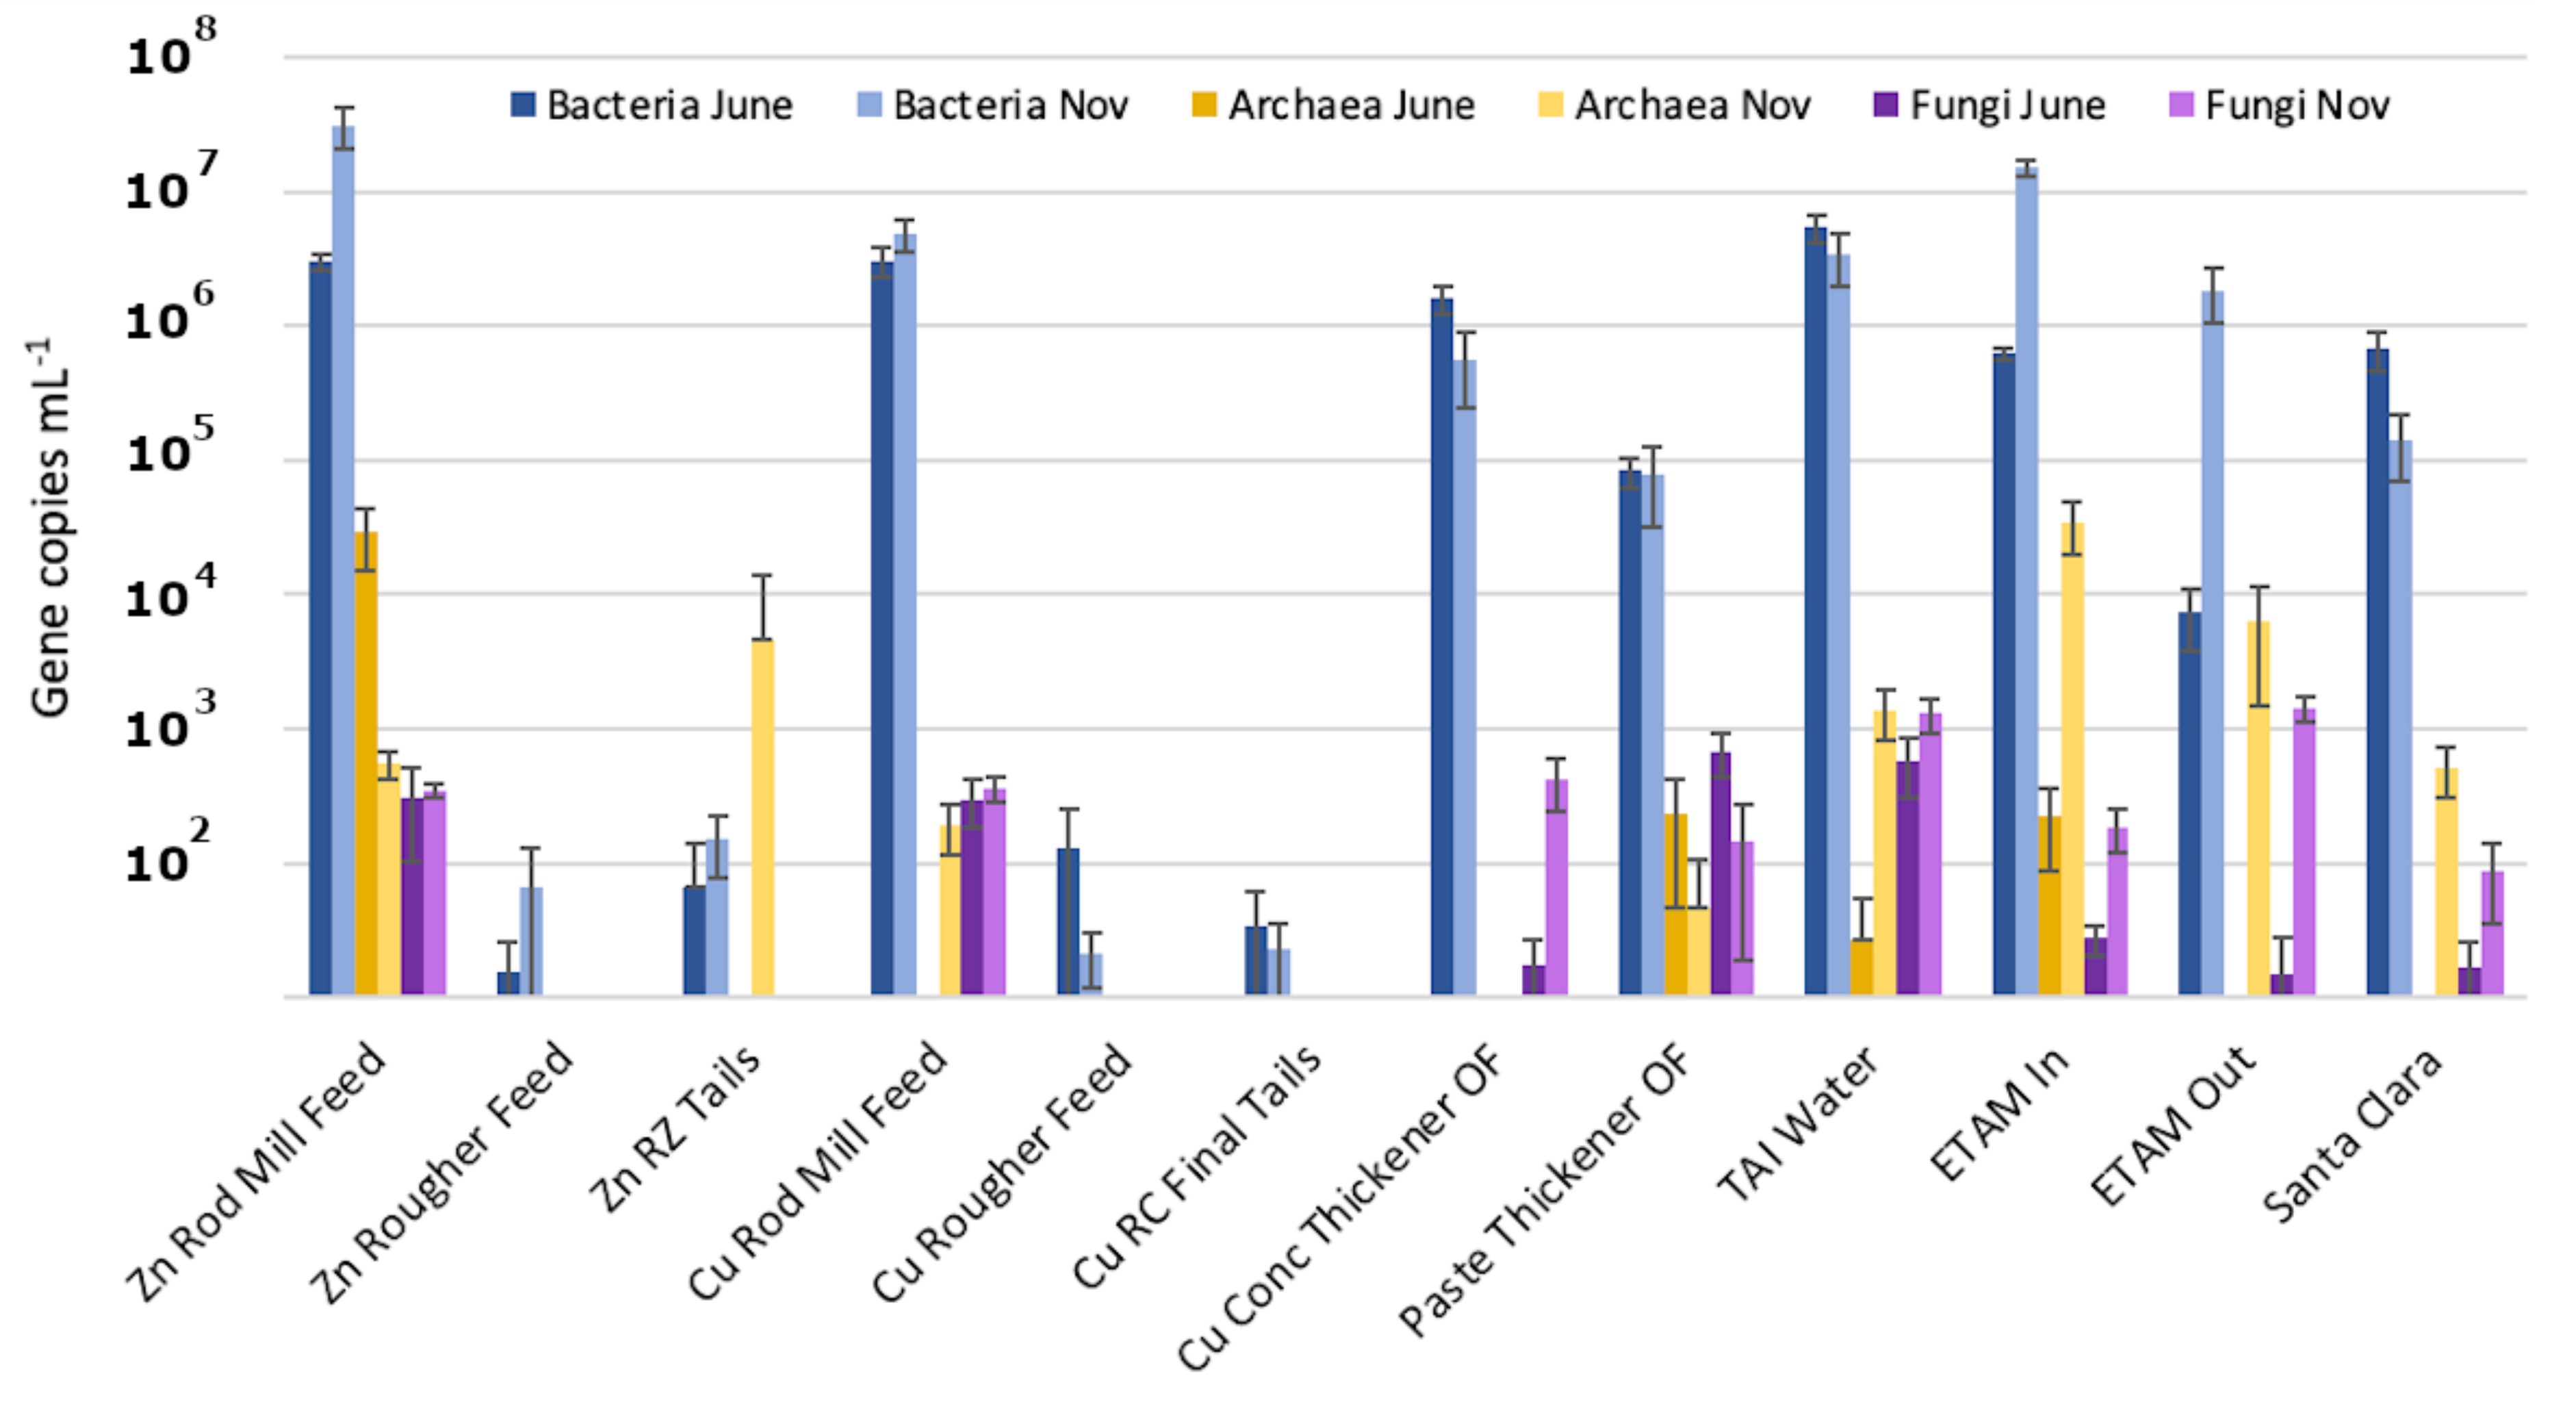
3.2. Estimated Sizes of the Microbial Populations
3.3. Microbial Communities
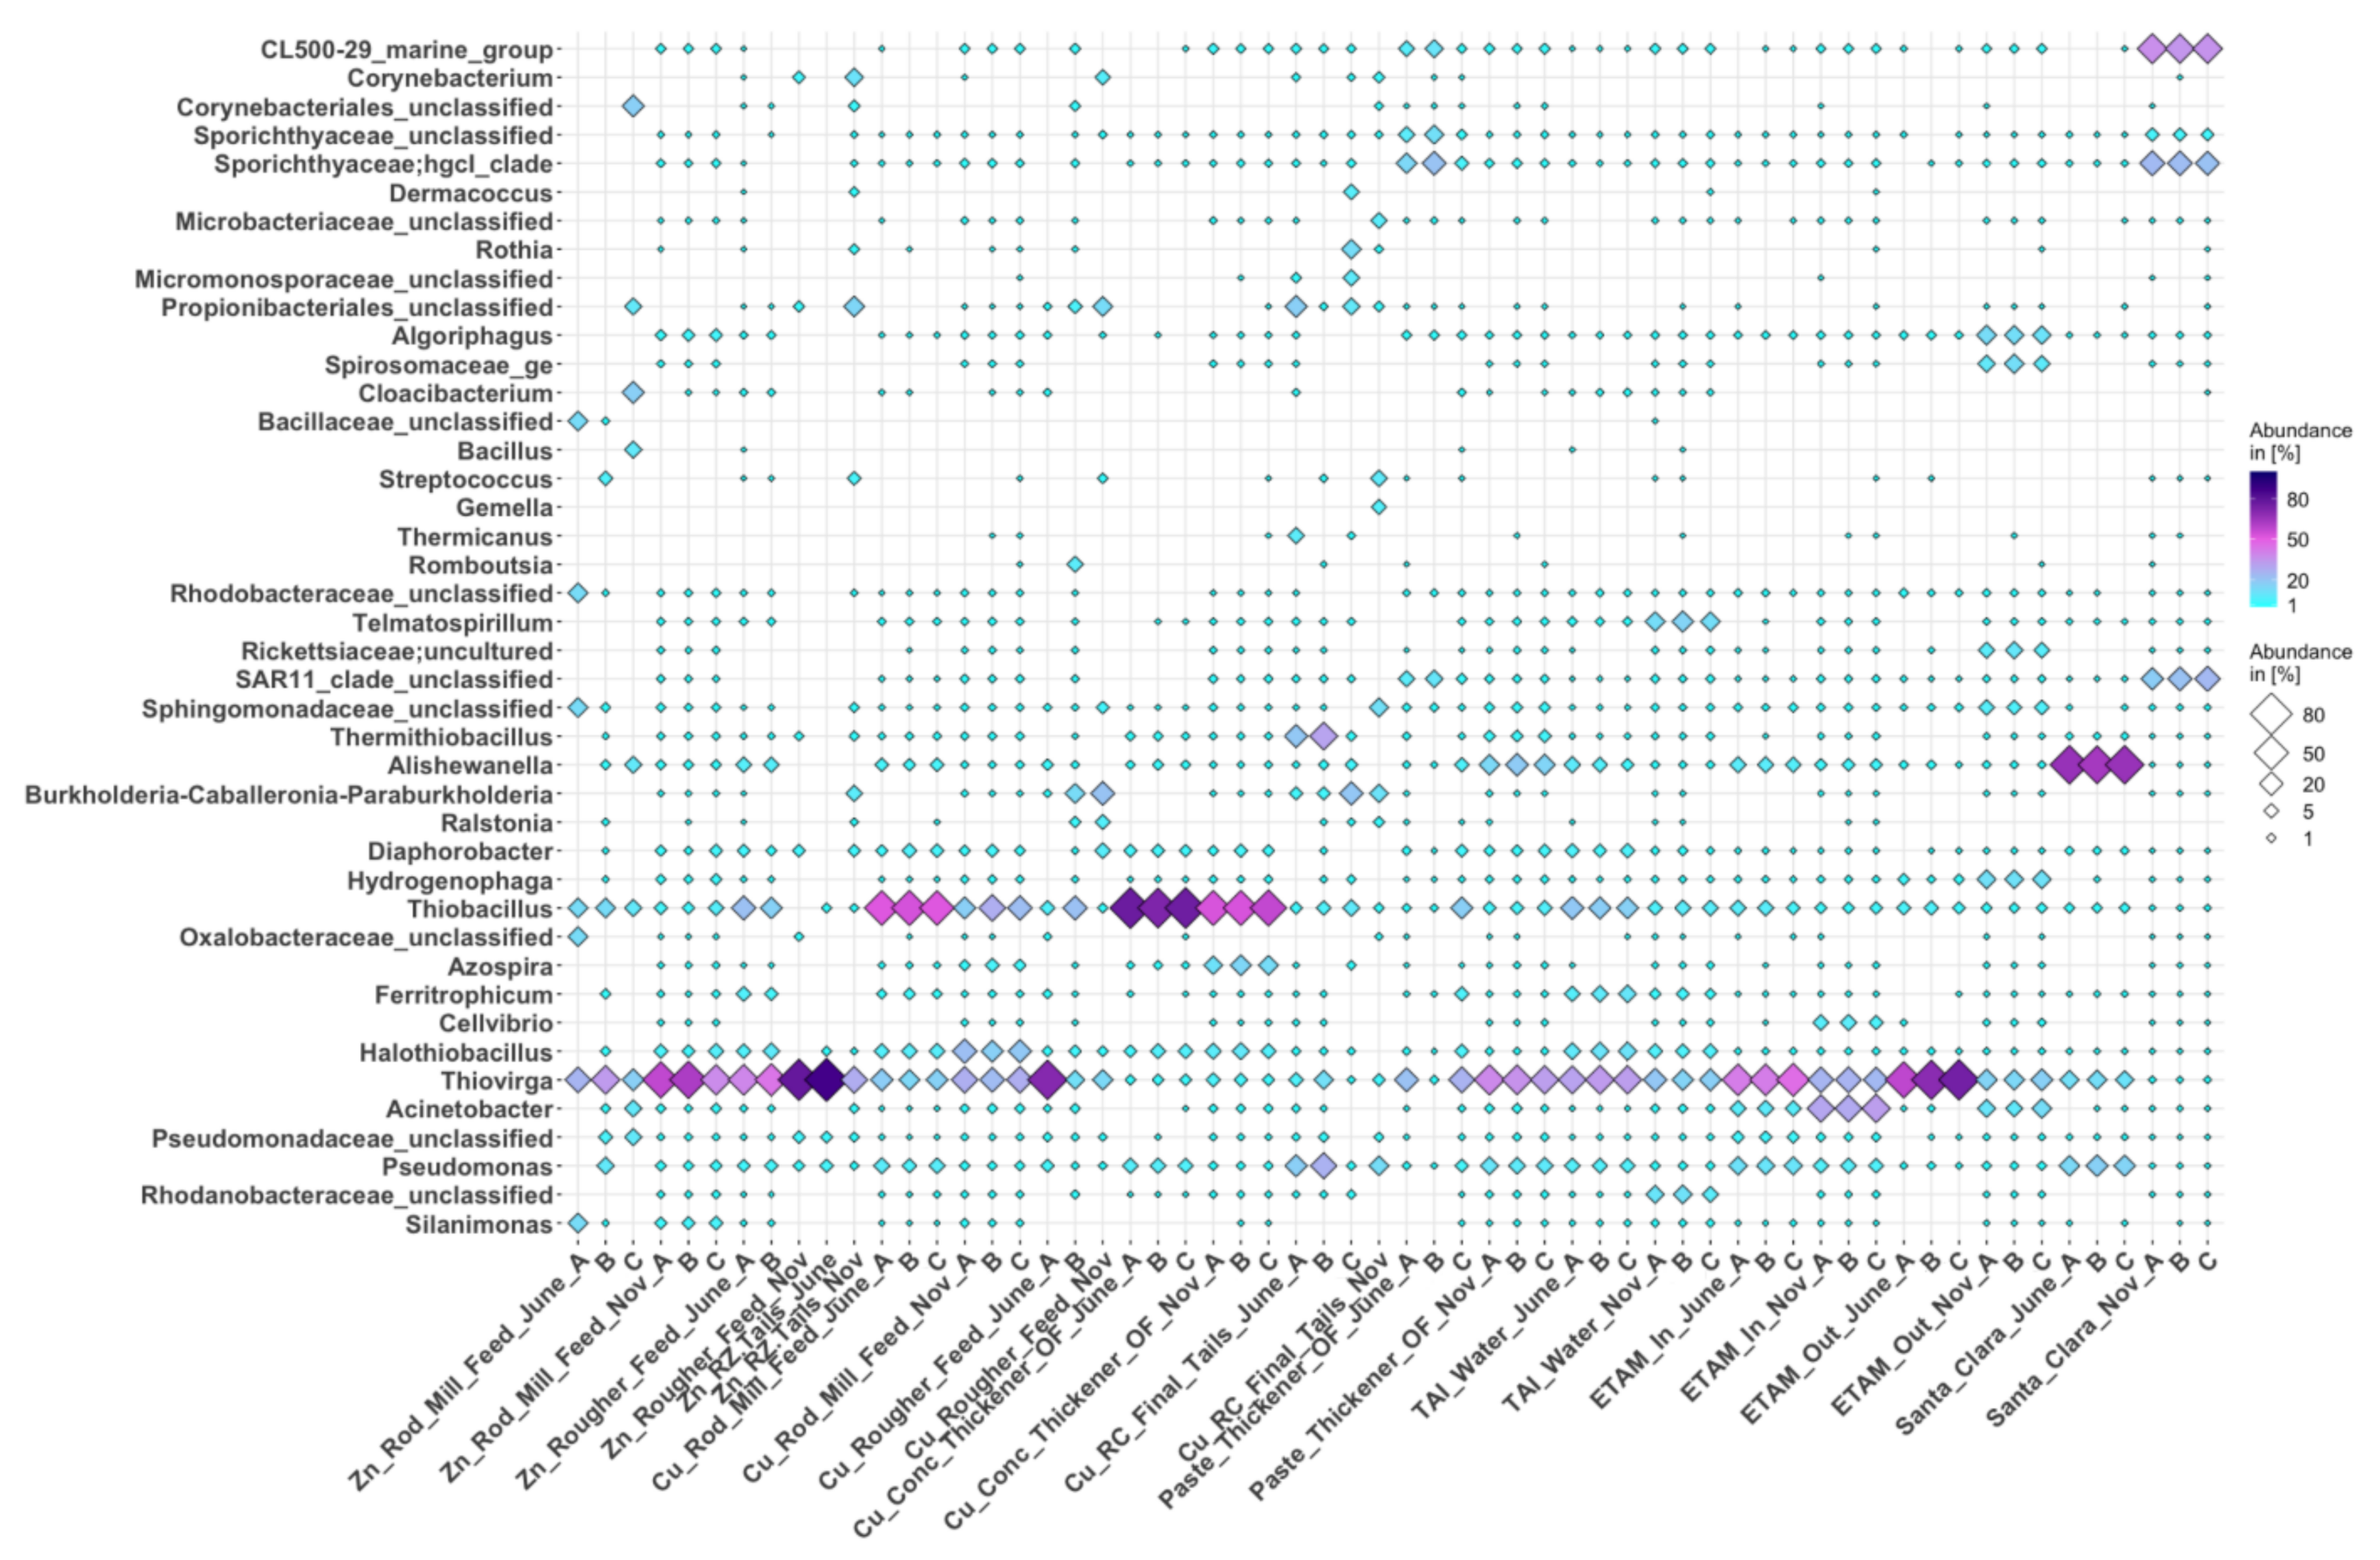
3.3.1. Bacteria
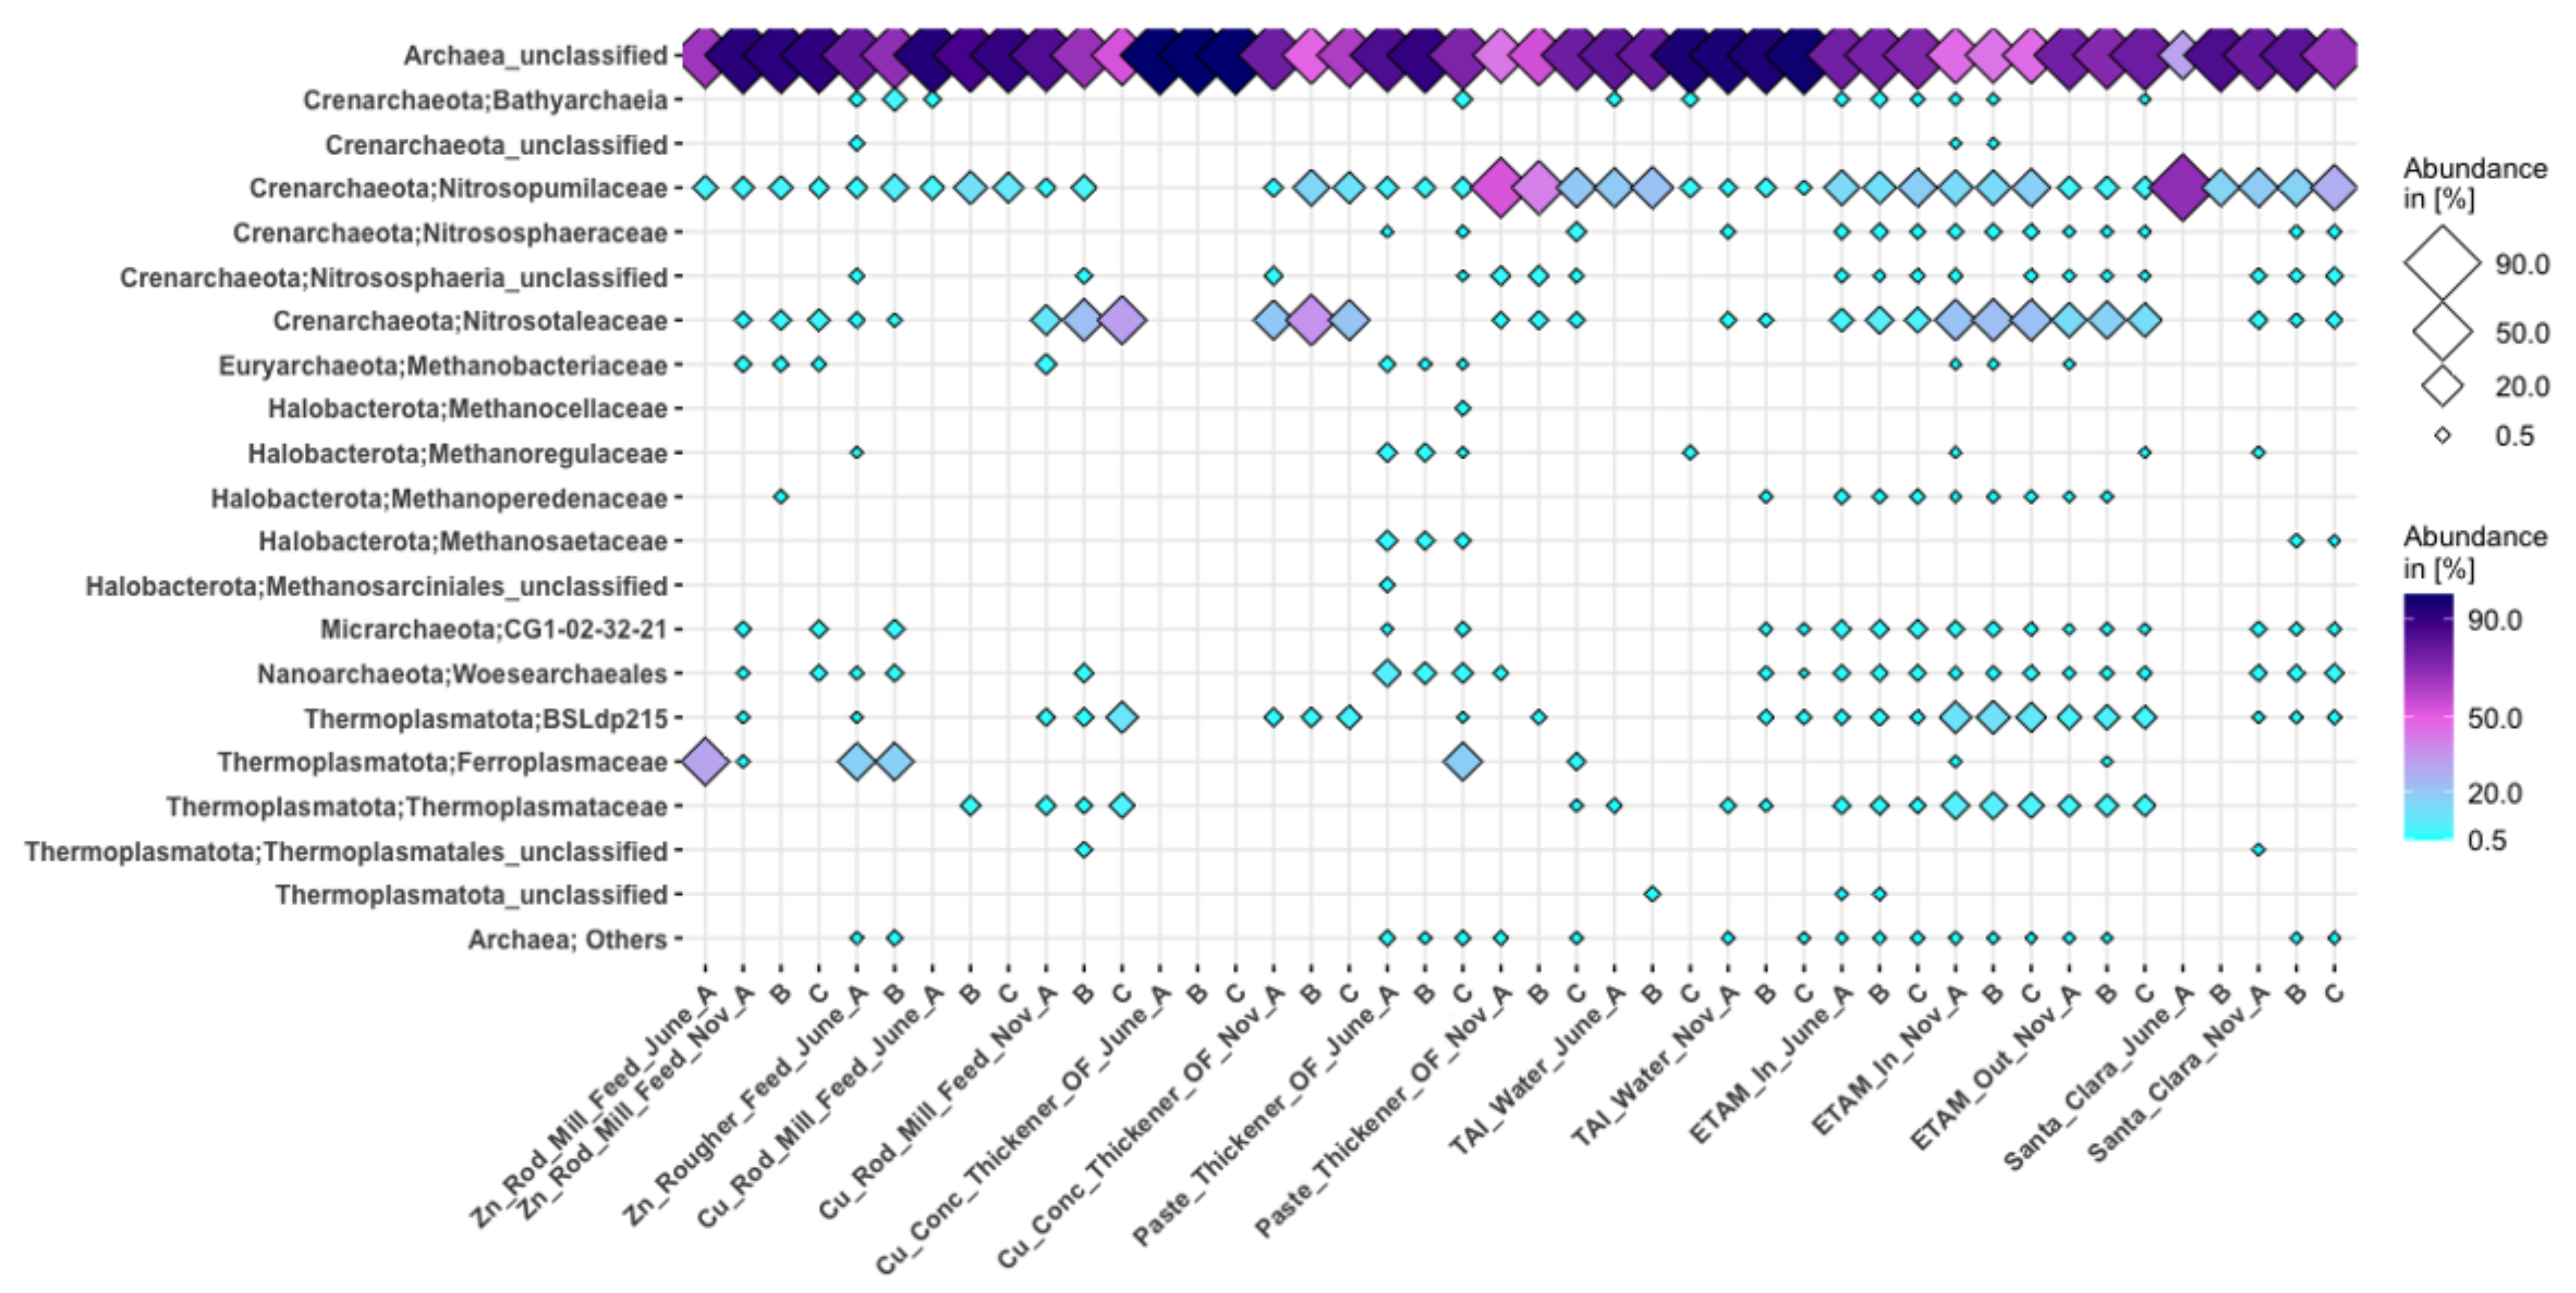
3.3.2. Archaea
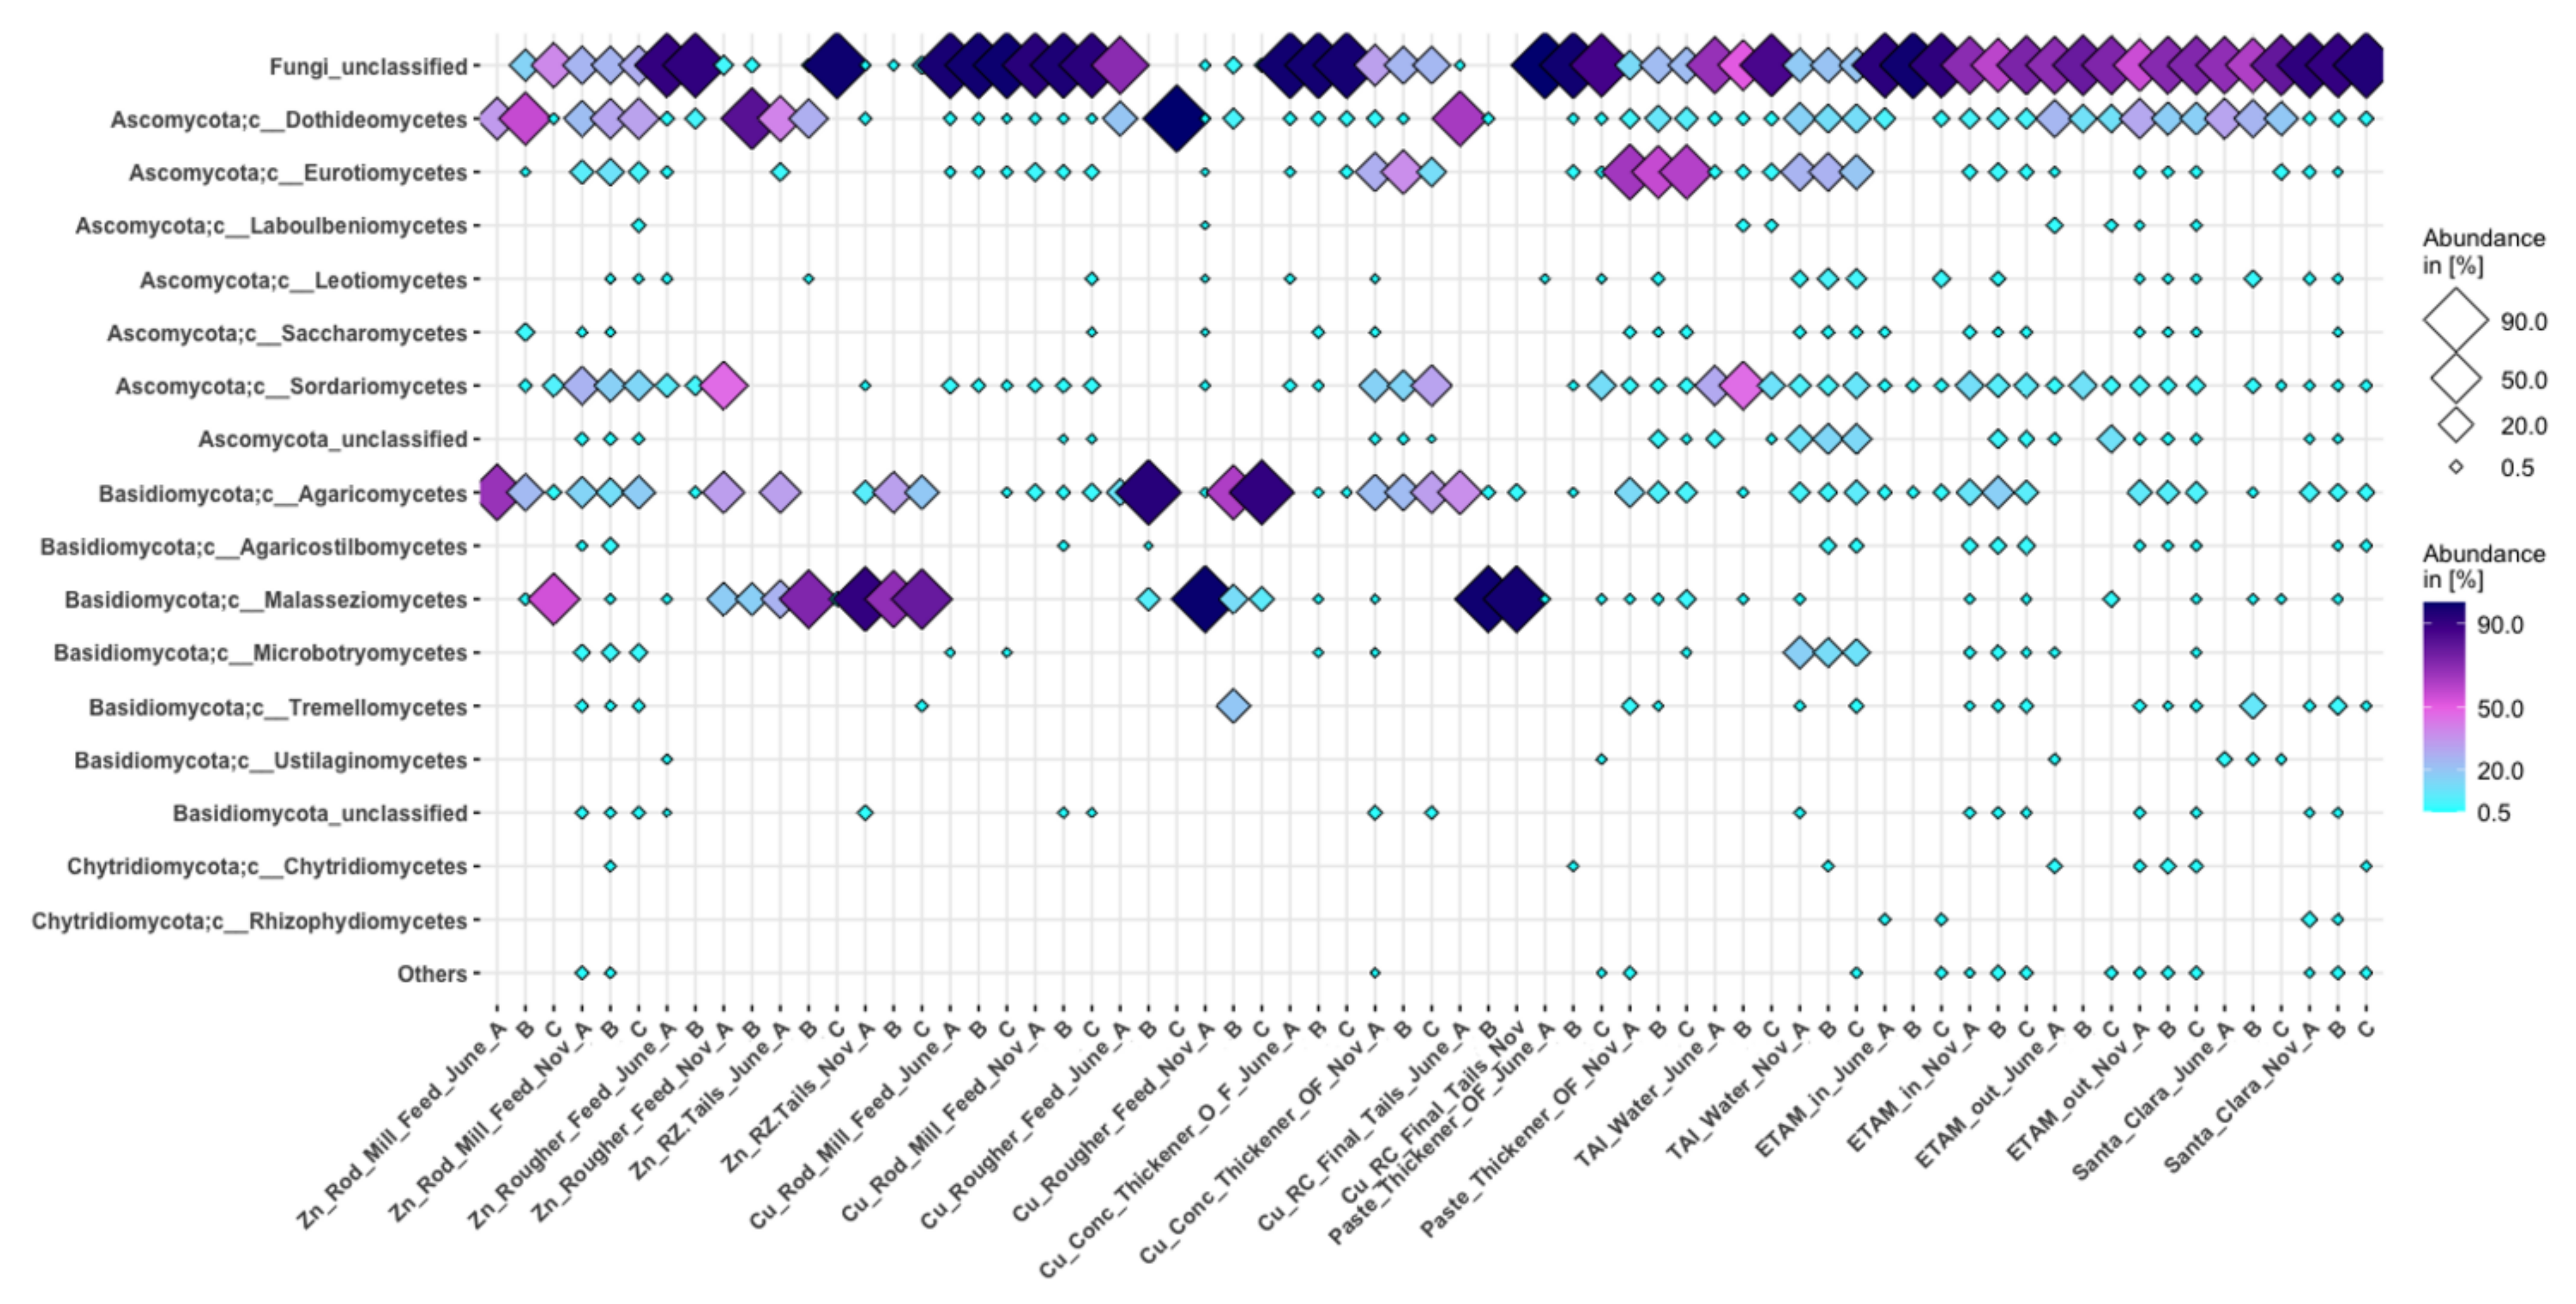
3.3.3. Fungi
3.4. Metagenomics
3.4.1. Metagenomic Data
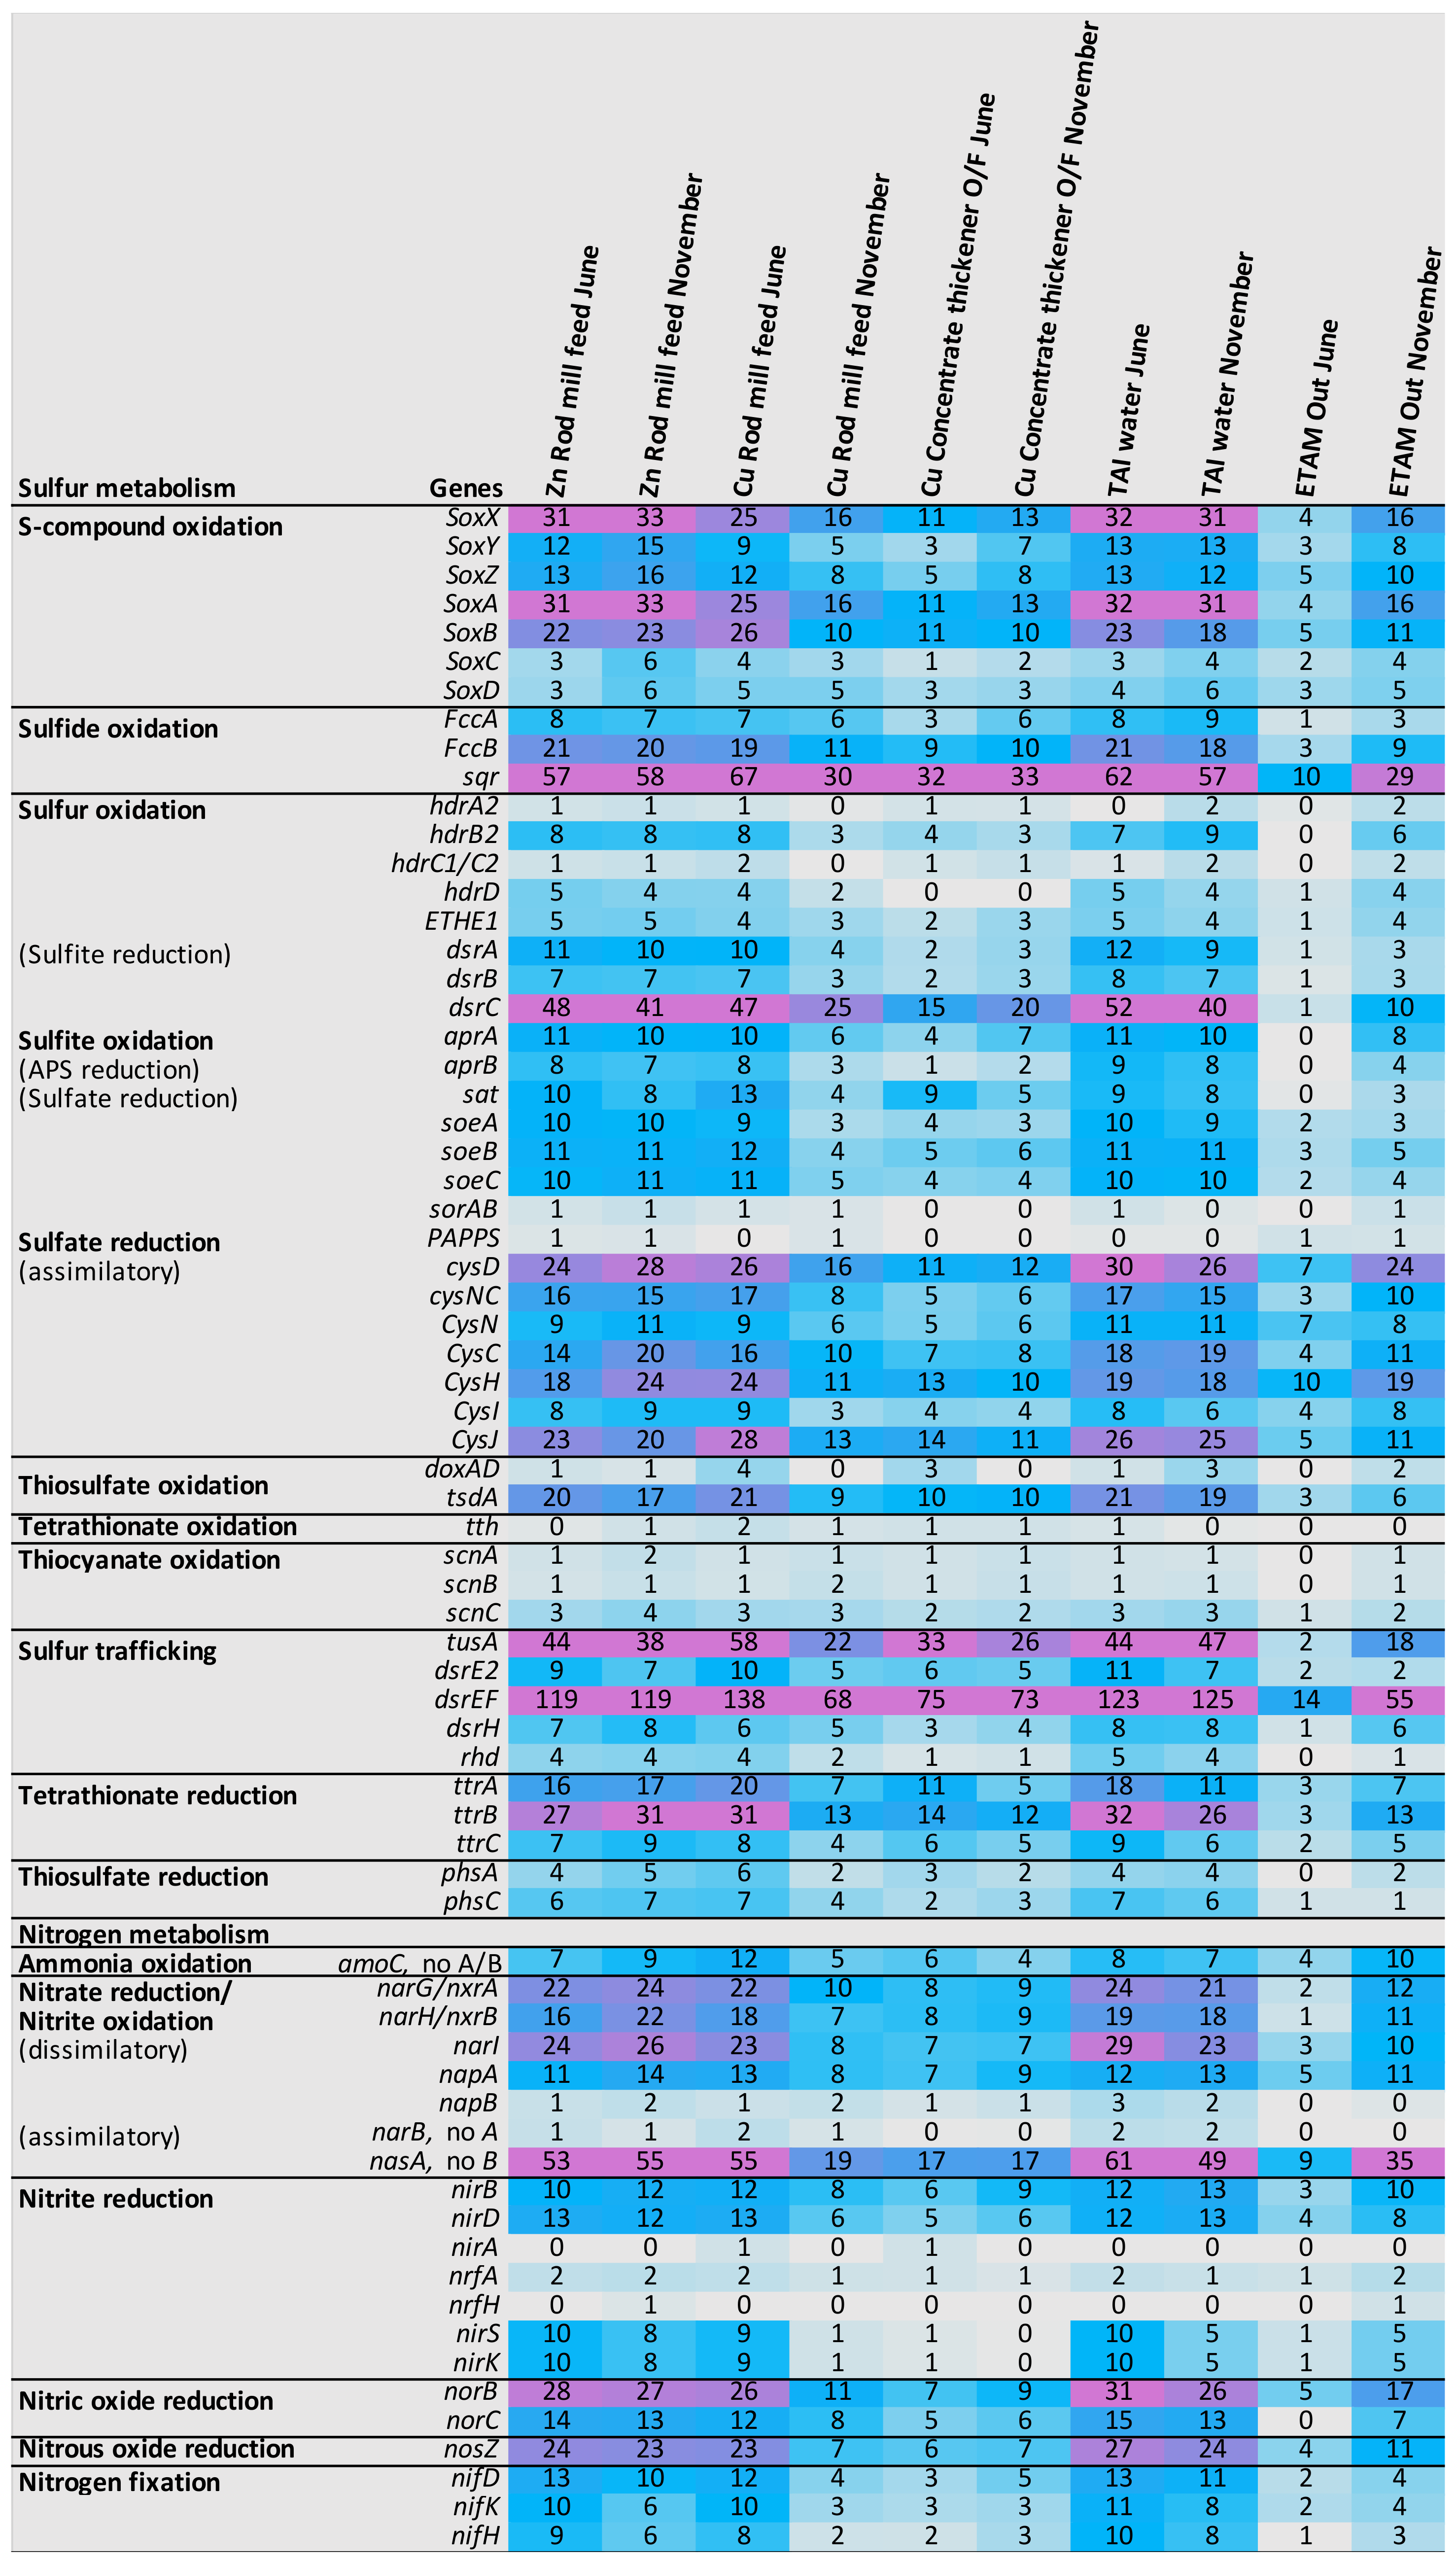
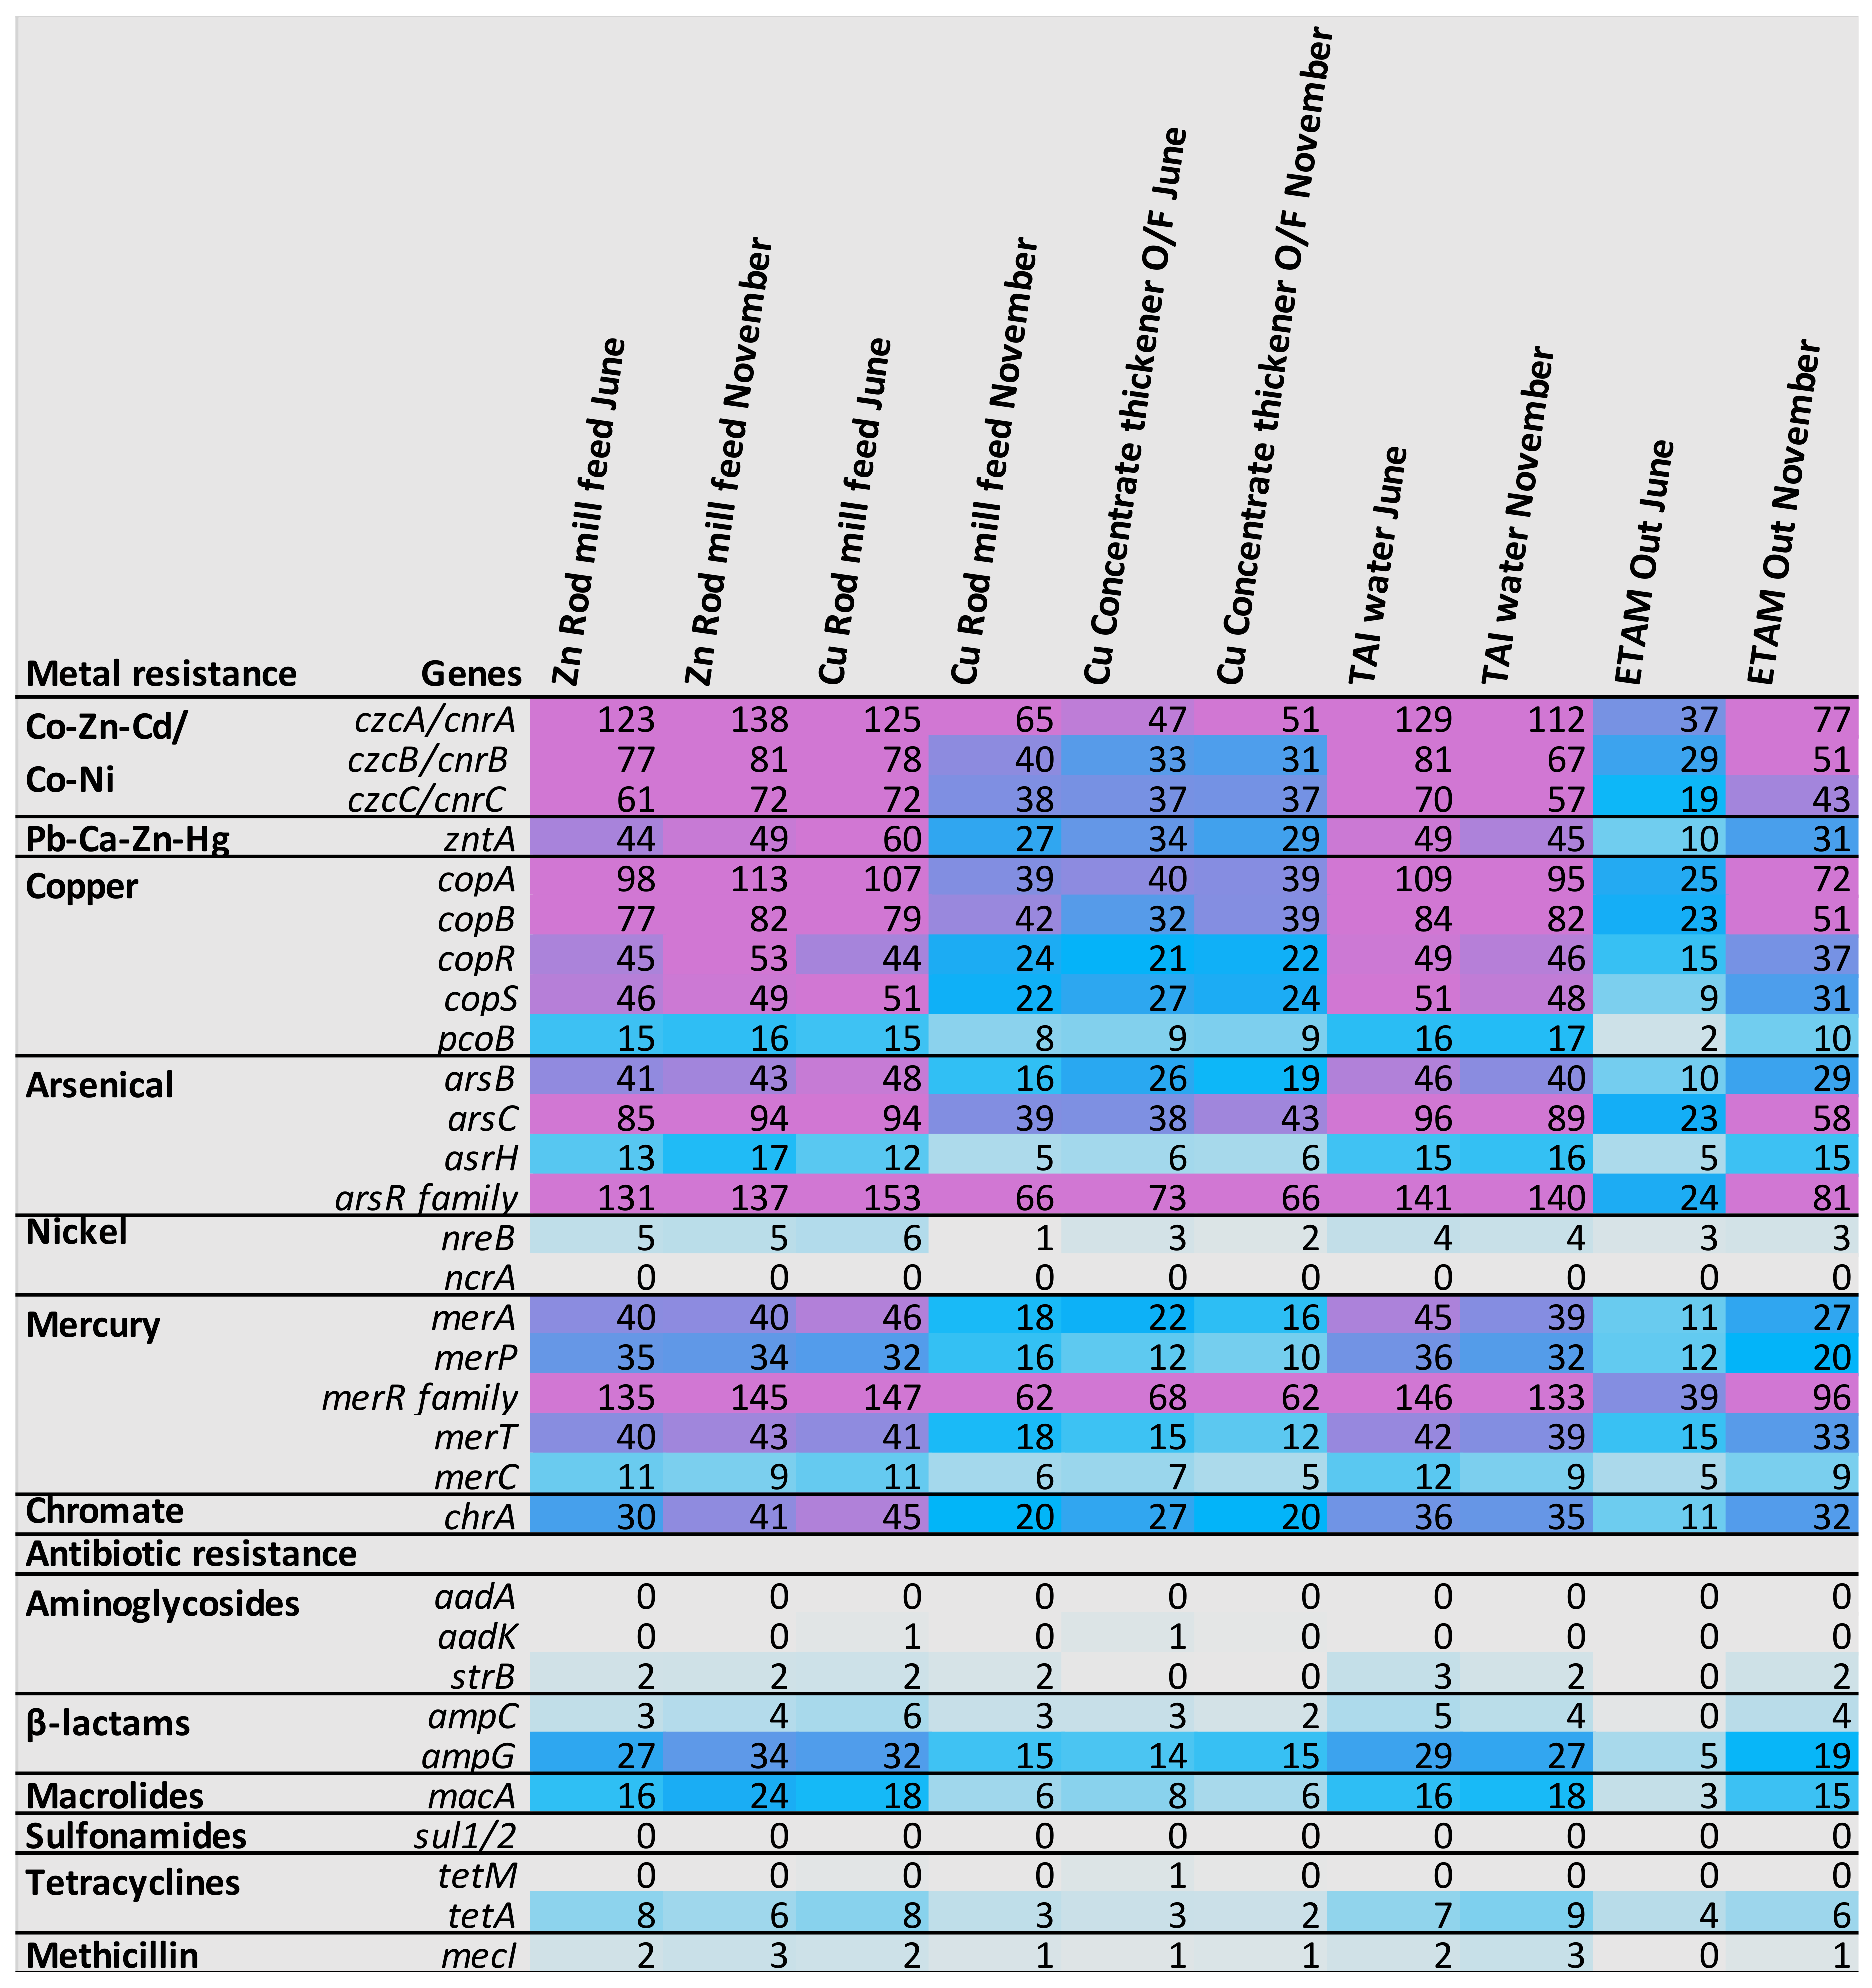
3.4.2. Metabolism
3.4.3. Metagenome-Assembled Genomes (MAGs)
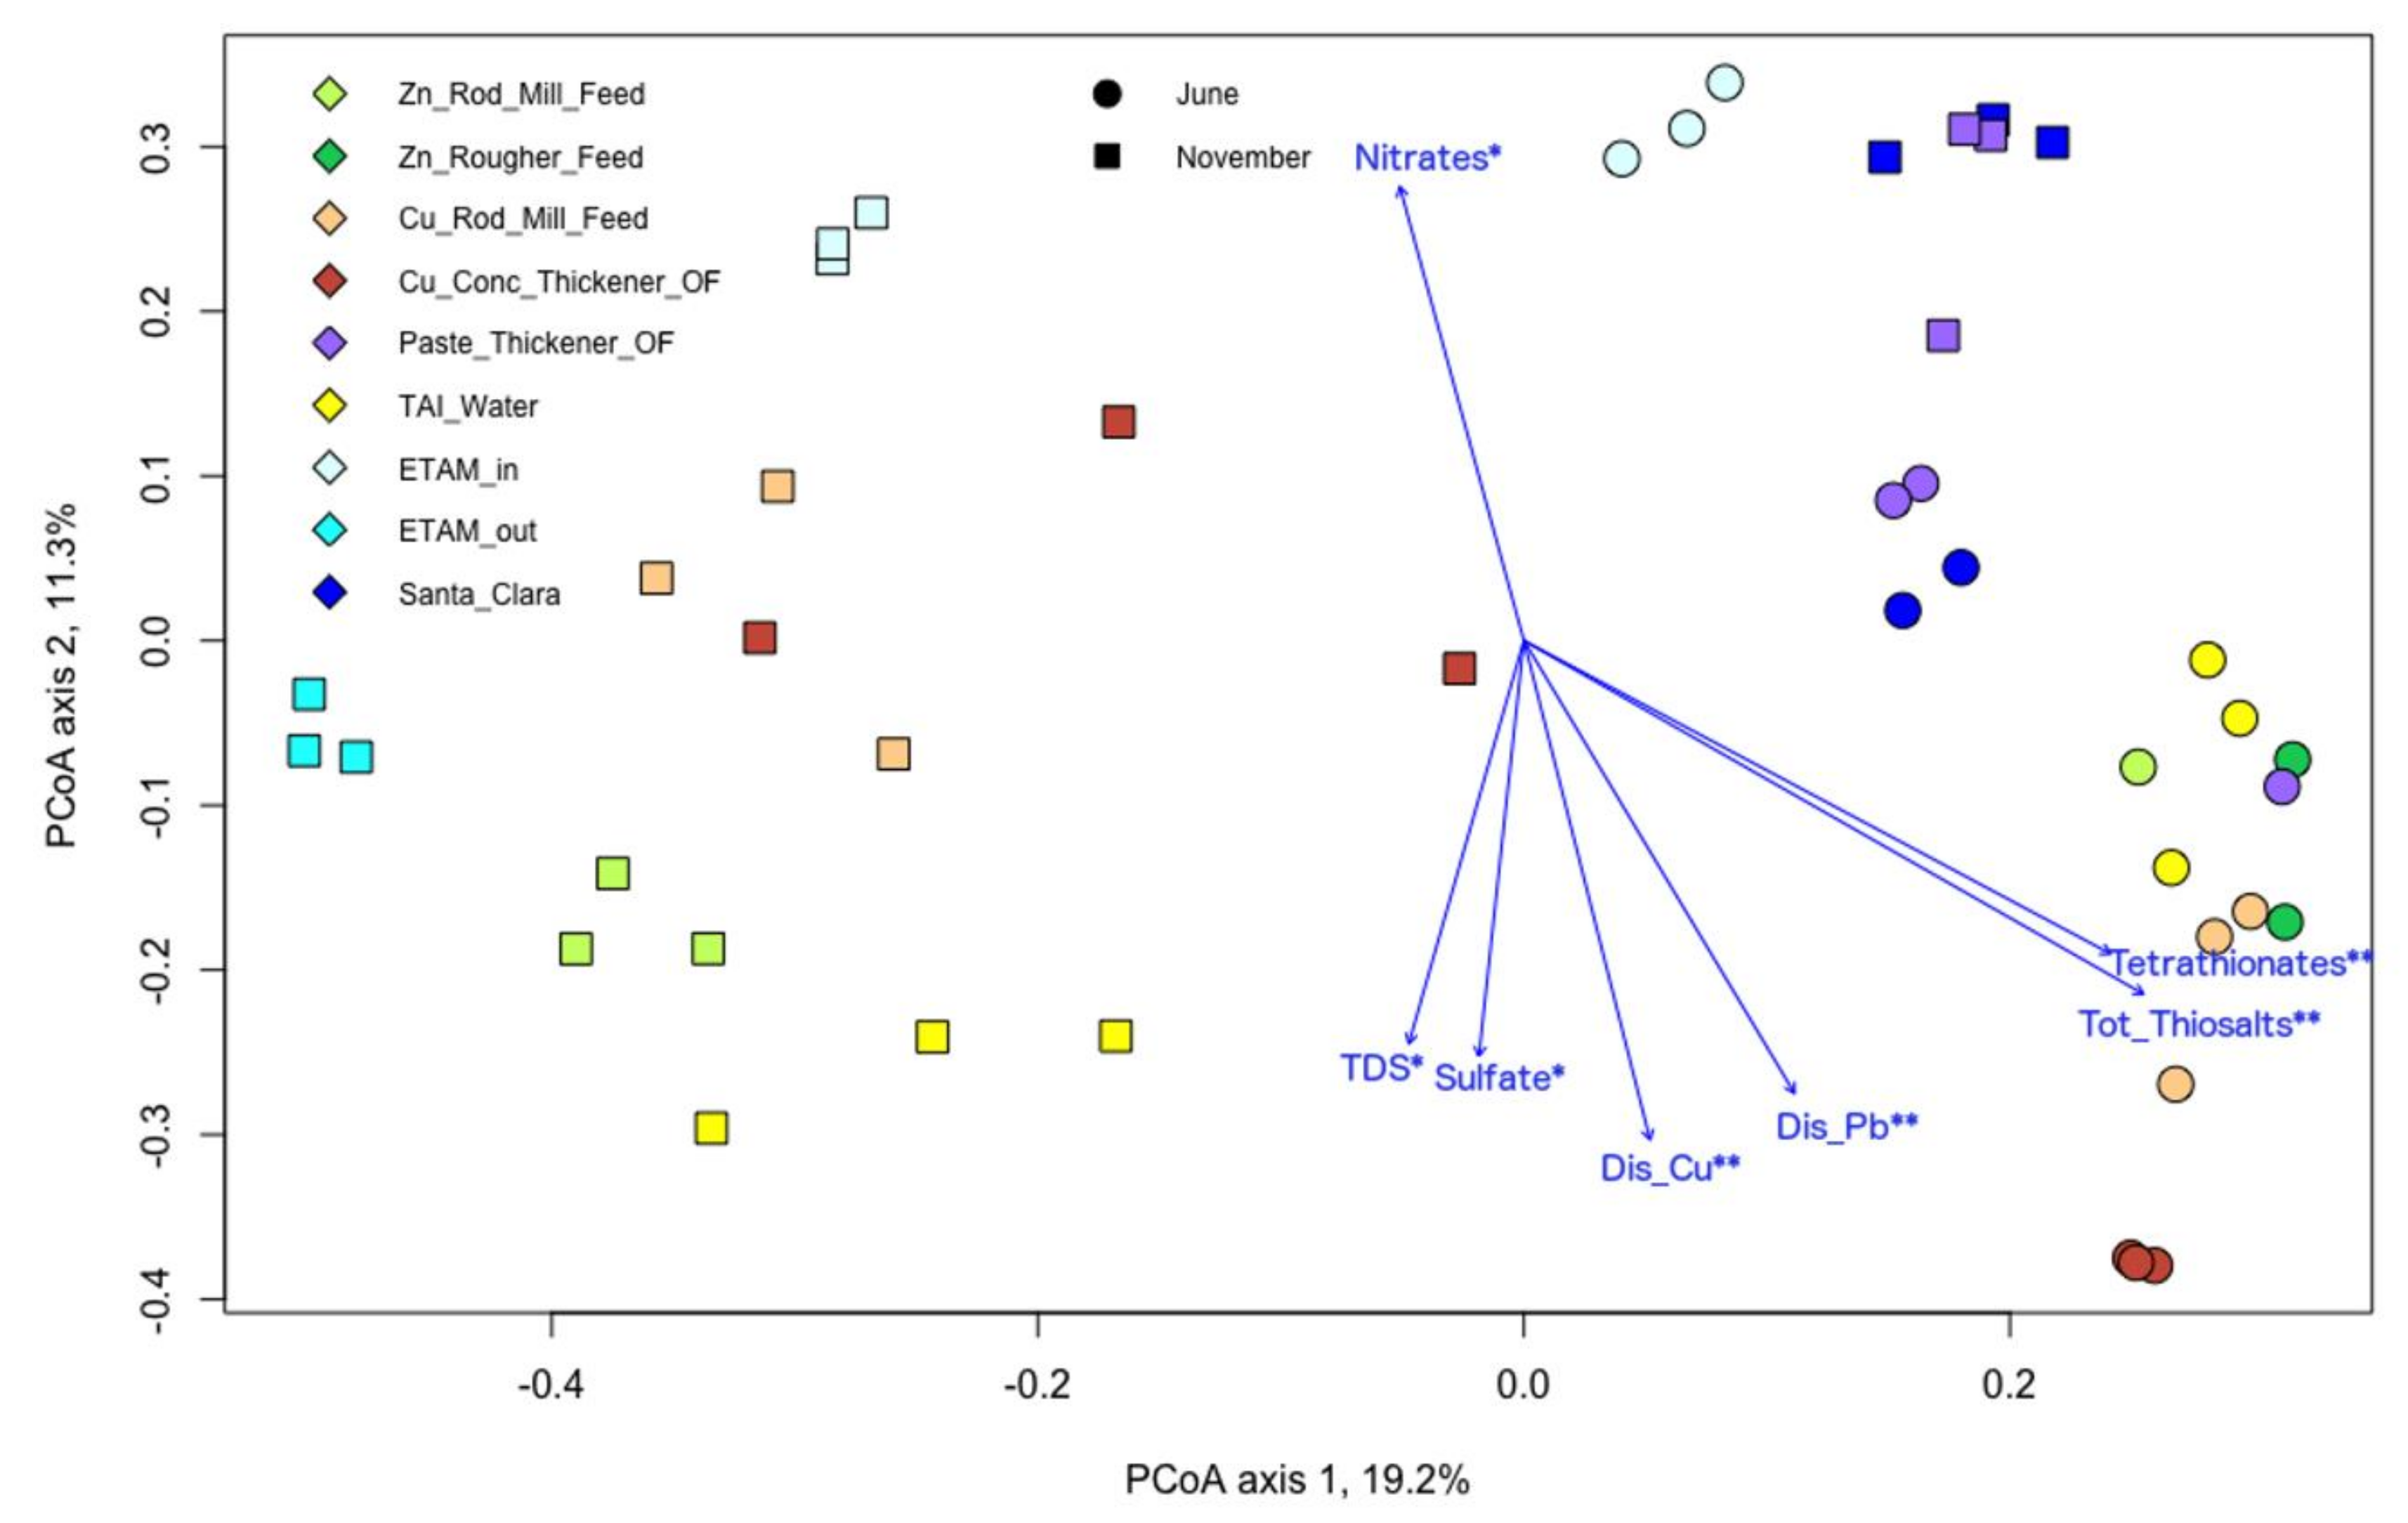
3.5. Microbial and Chemical Relationships
4. Discussion
5. Conclusions
Supplementary Materials
Author Contributions
Funding
Data Availability Statement
Acknowledgments
Conflicts of Interest
References
- Johnson, D.B. The evolution, current status, and future prospects of using biotechnologies in the mineral extraction and metal recovery sectors. Minerals 2018, 8, 343. [Google Scholar] [CrossRef] [Green Version]
- Liu, W.; Moran, C.J.; Vink, S. A reviw of the effect of water quality on flotation. Miner. Eng. 2013, 53, 91–100. [Google Scholar] [CrossRef]
- Seifelnassr, A.A.S.; Abouzeid, A.-Z.M. Exploitation of bacterial activities in mineral industry and environmental preservation: An overview. J. Min. 2013. [Google Scholar] [CrossRef] [Green Version]
- Behera, S.K.; Mulaba-Bafubiandi, A.F. Microbes assisted mineral flotation a future prospective for mineral processing industries: A review. Min. Proc Ext. Met. Rev. 2017, 38, 96–105. [Google Scholar] [CrossRef]
- Kinnunen, P.; Miettinen, H.; Bomberg, M. Review of potential microbial effects on flotation. Minerals 2020, 10, 533. [Google Scholar] [CrossRef]
- Liu, W.; Moran, C.J.; Vink, S. Impact of chalcopyrite depression by water-borne bacteria in pure and combined mineral systems. Int. J. Miner. Process. 2013, 123, 18–24. [Google Scholar] [CrossRef]
- Evdokimova, G.A.; Gershenkop, A.S.; Fokina, N.V. The impact of bacteria of circulating water on apatite-nepheline ore flotation. J. Environ. Sci. Health Part A 2012, 47, 398–404. [Google Scholar] [CrossRef]
- Flemming, H.; Wuertz, S. Bacteria and archaea on Earth and their abundance in biofilms. Nat. Rev. Microbiol. 2019, 17, 247–260. [Google Scholar] [CrossRef]
- Rampelotto, P.H. Extremophiles and extreme environments. Life 2013, 3, 482–485. [Google Scholar] [CrossRef]
- Bomberg, M.; Miettinen, H.; Musuku, B.; Kinnunen, P. First insights to the microbial communities in the plant process water of the multi-metal Kevitsa mine. Res. Microbiol. 2020, 171, 230–242. [Google Scholar] [CrossRef]
- Levay, G.; Smart, R.S.C.; Skinner, W.M. The impact of water quality on flotation performance. J. S. Afr. Inst. Min. Metal. 2001, 101, 69–76. [Google Scholar]
- Muzinda, I.; Schreithofer, N. Water quality effects on flotation: Impacts and control of residual xanthates. Miner. Eng. 2018, 125, 34–41. [Google Scholar] [CrossRef]
- Jucker, B.B.; Harms, H.; Zehnder, A.J.B. Adhesion of the positively charged bacterium Stenotrophomonas (Xanthomonas) maltophilia 70401 to glass and Teflon. J. Bacteriol. 1996, 178, 5472–5479. [Google Scholar] [CrossRef] [PubMed] [Green Version]
- Stewart, E.J. Growing unculturable bacteria. J. Bacteriol. 2012, 194, 4151–4160. [Google Scholar] [CrossRef] [PubMed] [Green Version]
- Le, T.M.K.; Miettinen, H.; Bomberg, M.; Schreithofer, N.; Dahl, O. Challenges in the assessment of mining process water quality. Minerals 2020, 10, 940. [Google Scholar] [CrossRef]
- Herlemann, D.P.R.; Labrenz, M.; Jürgens, K.; Bertilsson, S.; Waniek, J.J.; Andersson, A.F. Transitions in bacterial communities along the 2000 km salinity gradient of the Baltic Sea. ISME J. 2011, 5, 1571–1579. [Google Scholar] [CrossRef] [Green Version]
- Bano, N.; Ruffin, S.; Ransom, B.; Hollibaugh, J.T. Phylogenetic composition of Arctic Ocean archaeal assemblages and comparison with antarctic assemblages. Appl. Environ. Microbiol. 2004, 70, 781–789. [Google Scholar] [CrossRef] [Green Version]
- Barns, S.M.; Fundyga, R.E.; Jeffries, M.W.; Pace, N.R. Remarkable archaeal diversity detected in a Yellowstone National Park hot spring environment. Proc. Natl. Acad. Sci. USA 1994, 91, 1609–1613. [Google Scholar] [CrossRef] [Green Version]
- Bomberg, M.; Miettinen, H. Data on the optimization of an archaea-specific probe-based qPCR assay. Data Brief 2020, 33, 106610. [Google Scholar] [CrossRef]
- Takai, K.E.; Horikoshi, K. Rapid detection and quantification of members of the archaeal community by quantitative PCR using fluorogenic probes. Appl. Environ. Microbiol. 2000, 66, 5066–5072. [Google Scholar] [CrossRef] [Green Version]
- Haugland, R.; Vesper, S. Method of Identifying and Quantifying Specific Fungi and Bacteria. U.S. Patent Application No. 6,387,652, 14 May 2002. [Google Scholar]
- Klindworth, A.; Pruesse, E.; Schweer, T.; Peplies, J.; Quast, C.; Horn, M.; Glöckner, F.O. Evaluation of general 16S ribosomal RNA gene PCR primers for classical and next-generation sequencing-based diversity studies. Nucleic Acids Res. 2013, 41, e1. [Google Scholar] [CrossRef] [PubMed]
- Gardes, M.; Bruns, T.D. ITS primers with enhanced specificity for basidiomycetes—Application to the identification of mycorrhizae and rusts. Mol. Ecol. 1993, 2, 113–118. [Google Scholar] [CrossRef] [PubMed]
- White, T.J.; Bruns, T.; Lee, S.; Taylor, J. Amplification and direct sequencing of fungal ribosomal RNA genes for phylogenetics. In PCR Protocols: A Guide to Methods and Applications; Innis, M.A., Gelfand, D.H., Sninsky, J.J., White, T.J., Eds.; Academic Press: New York, NY, USA, 1990; pp. 315–322. [Google Scholar]
- Schloss, P.D.; Westcott, S.L.; Ryabin, T.; Hall, J.R.; Hartmann, M.; Hollister, E.B.; Lesniewski, R.A.; Oakley, B.B.; Parks, D.H.; Robinson, C.J.; et al. Introducing mothur: Open-source, platform-independent, community-supported software for describing and comparing microbial communities. Appl. Environ. Microbiol. 2009, 75, 7537–7541. [Google Scholar] [CrossRef] [PubMed] [Green Version]
- Pruesse, E.; Quast, C.; Knittel, K.; Fuchs, B.M.; Ludwig, W.; Peplies, J.; Glöckner, F.O. SILVA: A comprehensive online resource for quality checked and aligned ribosomal RNA sequence data compatible with ARB. Nucleic Acids Res. 2007, 35, 7188–7196. [Google Scholar] [CrossRef] [Green Version]
- Quast, C.; Pruesse, E.; Yilmaz, P.; Gerken, J.; Schweer, T.; Yarza, P.; Peplies, J.; Glöckner, F.O. The SILVA ribosomal RNA gene database project: Improved data processing and web-based tools. Nucleic Acids Res. 2013, 41, D590–D596. [Google Scholar] [CrossRef]
- Altschul, S.F.; Gish, W.; Miller, W.; Myers, E.W.; Lipman, D.J. Basic local alignment search tool. J. Mol. Biol. 1990, 215, 403–410. [Google Scholar] [CrossRef]
- Kõljalg, U.; Nilsson, R.H.; Abarenkov, K.; Tedersoo, L.; Taylor, A.F.S.; Bahram, M.; Bates, S.T.; Bruns, T.D.; Bengtsson-Palme, J.; Callaghan, T.M.; et al. Towards a unified paradigm for sequence-based identification of fungi. Mol. Ecol. 2013, 22, 5271–5277. [Google Scholar] [CrossRef] [Green Version]
- Nilsson, R.H.; Larsson, K.H.; Taylor, A.F.S.; Bengtsson-Palme, J.; Jeppesen, T.S.; Schigel, D.; Kennedy, P.; Picard, K.; Glöckner, F.O.; Tedersoo, L.; et al. UNITE database for molecular identification of fungi: Handling dark taxa and parallel taxonomic classifications. Nucleic Acids Res. 2019, 47, D259–D264. [Google Scholar] [CrossRef]
- UNITE Community. UNITE Mothur Release; UNITE Community: London, UK, 2017. [Google Scholar]
- Caporaso, J.G.; Kuczynski, J.; Stombaugh, J.; Bittinger, K.; Bushman, F.D.; Costello, E.K.; Fierer, N.; Peña, A.G.; Goodrich, J.K.; Gordon, J.E.; et al. QIIME allows analysis of high-throughput community sequencing data. Nat. Methods 2010, 7, 335–336. [Google Scholar] [CrossRef] [Green Version]
- Kassambara, A. ggpubr: “ggplot2” Based Publication Ready Plots, Version 0.4.0; R Package. 2020. Available online: https://CRAN.R-project.org/package=ggpubr (accessed on 28 January 2021).
- Andrews, S.; Krueger, F.; Segonds-Pichon, A.; Biggins, L.; Cruger, C.; Wingett, S.; Montgomery, J. FastQC: A Quality Control Tool for High Throughput Sequence Data; Babraham Institute: Cambridge, UK, 2011; Available online: https://www.bioinformatics.babraham.ac.uk/projects/fastqc/ (accessed on 28 January 2021).
- jstjohn/SeqPrep. Available online: https://github.com/jstjohn/SeqPrep (accessed on 11 November 2020).
- Bolger, A.M.; Lohse, M.; Usadel, B. Trimmomatic: A flexible trimmer for illumina sequence data. Bioinformatics 2014, 30, 2114–2120. [Google Scholar] [CrossRef] [Green Version]
- Li, D.; Liu, C.M.; Luo, R.; Sadakane, K.; Lam, T.W. MEGAHIT: An ultra-fast single-node solution for large and complex metagenomics assembly via succinct de Bruijn graph. Bioinformatics 2015, 31, 1674–1676. [Google Scholar] [CrossRef] [PubMed] [Green Version]
- Eren, A.M.; Esen, Ö.C.; Quince, C.; Vineis, J.H.; Morrison, H.G.; Sogin, M.L.; Delmont, T.O. Anvi’o: An advanced analysis and visualization platform for ‘omics data. PeerJ 2015, 3, e1319. [Google Scholar] [CrossRef] [PubMed]
- Langmead, B.; Salzberg, S.L. Fast gapped-read alignment with Bowtie 2. Nat. Methods 2012, 9, 357. [Google Scholar] [CrossRef] [PubMed] [Green Version]
- Menzel, P.; Ng, K.L.; Krogh, A. Fast and sensitive taxonomic classification for metagenomics with Kaiju. Nat. Commun. 2016, 7, 1–9. [Google Scholar] [CrossRef] [PubMed] [Green Version]
- El-Gebali, S.; Mistry, J.; Bateman, A.; Eddy, S.R.; Luciani, A.; Potter, S.C.; Qureshi, M.; Richardson, L.J.; Salazar, G.A.; Smart, A.; et al. The Pfam protein families database in 2019. Nucleic Acids Res. 2019, 47, D427–D432. [Google Scholar] [CrossRef]
- Seemann, T. Prokka: Rapid prokaryotic genome annotation. Bioinformatics 2014, 30, 2068–2069. [Google Scholar] [CrossRef]
- Kanehisa, M.; Sato, Y.; Kawashima, M.; Furumichi, M.; Tanabe, M. KEGG as a reference resource for gene and protein annotation. Nucleic Acids Res. 2016, 44, D457–D462. [Google Scholar] [CrossRef] [Green Version]
- Parks, D.H.; Imelfort, M.; Skennerton, C.T.; Hugenholtz, P.; Tyson, G.W. CheckM: Assessing the quality of microbial genomes recovered from isolates, single cells, and metagenomes. Genome Res. 2015, 25, 1043–1055. [Google Scholar] [CrossRef] [Green Version]
- Greet, C.J. Chapter 1: The Eureka mine—An example of how to identify and solve problems in a flotation plant. In Flotation Plant Optimisation: A Metallurgical Guide to Identifying and Solving Problems in Flotation Plants; Greet, C.J., Ed.; Australasian Institute of Mining and Metallurgy: Carlton South, NSW, Australia, 2010; pp. 1–33. [Google Scholar]
- McMurdie, P.J.; Holmes, S. phyloseq: An R package for reproducible interactive analysis and praphics of microbiome census data. PLoS ONE 2013, 8, e61217. [Google Scholar] [CrossRef] [Green Version]
- Oksanen, J.; Blanchet, G.F.; Friendly, M.; Kindt, R.; Legendre, P.; McGlinn, D.; Minchin, P.R.; O’Hara, R.B.; Simpson, G.L.; Solymos, P.; et al. Vegan: Community Ecology Package, Version 2.5-6; R Package. 2009. Available online: https://CRAN.R-project.org/package=vegan (accessed on 28 January 2021).
- Hammer, Ø.; Harper, D.A.; Ryan, P.D. PAST: Paleontological statistics software package for education and data analysis. Palaeontol. Electron. 2001, 4, 9. [Google Scholar]
- Hausmann, B.; Pjevac, P.; Schreck, K.; Gerbold, C.W.; Daims, H.; Wagner, M.; Loy, A. Draft genome sequence of Telmatospirillum siberiense 26-4b1, an acidotolereant peatland alphaproteobacterium potentially involved in sulfur cycling. Genome Announc. 2018, 6, e01524-17. [Google Scholar] [CrossRef] [PubMed] [Green Version]
- Xia, X.; Li, J.; Liao, S.; Zhou, G.; Wang, H.; Li, L.; Xu, B.; Wang, G. Draft genomic sequence of a chromate- and sulfate-reducing Alishewanella strain with the aility ro bioremediate Cr and Cd contamination. Stand. Genomic Sci. 2016, 11, 48. [Google Scholar] [CrossRef] [PubMed] [Green Version]
- Watanabe, T.; Miura, A.; Shinohara, A.; Kojima, H.; Fukui, M. Thermithiobacillus plumbiphilus sp. nov., a sulfur-oxidizing bacterium isolated from lead sulfide. Int. J. Syst. Evol. Microbiol. 2016, 66, 1986–1989. [Google Scholar] [CrossRef] [PubMed]
- Lee, C.S.; Kim, K.K.; Aslam, Z.; Lee, S.-T. Rhodanobacgter thiooxydans sp. nov., isolated from a biofilm on sulfur particles used in an autotrophic denitrification process. Int. J. Syst. Evol. Microbiol. 2007, 57, 1775–1779. [Google Scholar] [CrossRef]
- Spring, S.; Kämpfer, P.; Schleifer, K.H. Limnobacter thiooxidans gen. nov., sp. novel thiosulfate-oxidazing bacterium isolated from freshwater lake sediment. Int. J. Syst. Evol. Microbiol. 2001, 51, 1463–1470. [Google Scholar] [CrossRef]
- Chen, X.-G.; Geng, A.-L.; Gould, W.D.; Ng, Y.-L.; Liang, D.T. Isolation and characterization of sulphur-oxidizing Thiomonas sp. and its potential application in biological deodorization. Lett. Appl. Microbiol. 2004, 39, 495–503. [Google Scholar] [CrossRef]
- Ito, T.; Sugita, K.; Yumoto, I.; Nodasaka, Y.; Okabe, S. Thiovirga sulfuroxydans gen. nov., sp. nov., a chemolithoautotrophic sulfur-oxidizing bacterium isolated from a microaerobic waste-water biofilm. Int. J. Syst. Evol. Microbiol. 2005, 55, 1059–1064. [Google Scholar] [CrossRef] [Green Version]
- Robertson, L.A.; Kuenen, J.G. The genus Thiobacillus. In Prokaryotes, Proteobacteria: Alpha and Beta Subclasses; Dworkin, M., Falkow, S., Rodenberg, E., Schleifer, K.-H., Stackebrandt, E., Eds.; Springer: New York, NY, USA, 2006; Volume 5, pp. 812–827. [Google Scholar]
- Hutt, L.P.; Huntemann, M.; Clum, A.; Pillay, M.; Palaniappan, K.; Varghese, N.; Mikhailova, N.; Stamatis, D.; Reddy, T.; Daum, C.; et al. Permanent draft genome of Thiobacillus thioparus DSM 505T, an obligately chemolithoautotrophic member of the Betaproteobacteria. Stand. Genomic Sci. 2017, 12, 10. [Google Scholar] [CrossRef] [Green Version]
- Kelly, D.P.; Wood, A.P.; Genus, I. Halothiobacillus. In Bergey’s Manual of Systematic Bacteriology, 2nd ed.; Brenner, D.J., Krieg, N.R., Staley, J.T., Garrity, G.M., Eds.; Springer: New York, NY, USA, 2005; Volume 2. [Google Scholar]
- Wood, A.P.; Kelly, D.P. Physiological characteristics of a new thermophilic obligately chemolithotrophic Thiobacillus species Thiobacillus tepidarius. Int. J. Syst. Bacteriol. 1985, 35, 434–437. [Google Scholar] [CrossRef] [Green Version]
- Musuku, B.; Muzinda, I.; Lumsden, B. Cu-Ni processing improvements a First Quantum’s Kevitsa mine. Miner. Eng. 2015, 88, 9–17. [Google Scholar] [CrossRef]
- Whaley-Martin, K.; Jessen, G.L.; Colenbrander Nelson, T.; Mori, J.F.; Apte, S.; Jarolimek, C.; Warren, L.A. The potential role of Halothiobacillus spp. In sulfur oxidation and acid generation in circum-neutral mine tailings reservoirs. Front. Microbiol. 2019, 10, 297. [Google Scholar] [CrossRef] [PubMed] [Green Version]
- Narayan, K.D.; Sabat, S.C. Mechanism of electron transport during thiosulfate oxidation in an obligately mixotrophic bacterium Thiomonas bhubaneswarensis strain S10 (DSM 18181T). Appl. Microbiol. Biotech. 2017, 101, 1239–1252. [Google Scholar] [CrossRef] [PubMed]
- Dopson, M.; Lindström, E.B.; Hallberg, K.B. ATP generation during reduced inorganic sulfur compound oxidation by Acidithiobacillus caldus is exclusively due to electron transport phosphorylation. Extremophiles 2002, 6, 123–129. [Google Scholar] [CrossRef] [PubMed]
- Aminuddin, M. Substrate level versus oxidative phosphorylation in the generation of ATP in Thiobacillus denitrificans. Arch. Micrbiol. 1980, 128, 19–25. [Google Scholar] [CrossRef]
- Weiss, J.V.; Rentz, J.A.; Olaia, T.; Neubauer, S.C.; Merrill-Floyd, M.; Lilburn, T.; Bradburne, C.; Megonigal, P.; Emerson, D. Characterization of neutrophilic Fe(II)-oxidizing bacteria isolated from the rhizosphere of wetland plants and description of Ferritrophicum radicicola gen. nov. sp. nov., and Sideroxydans paludicola sp. nov. Geomicrobiol. J. 2007, 24, 559–570. [Google Scholar] [CrossRef]
- Swanner, E.D.; Nell, R.M.; Templeton, A.S. Ralstonia species mediate Fe-oxidation in circumneutral, metal-rich subsurface fluids of Henderson mine, CO. Chem. Geol. 2011, 284, 339–350. [Google Scholar] [CrossRef]
- Natarajan, K.A.; Sabari Prakasan, M.R. Biodegradation of sodium isopropyl xanthate by Paenibacillus polymyxa and Pseudomonas putida. Miner. Metall. Proc. 2013, 30, 226–232. [Google Scholar] [CrossRef]
- Chen, S.; Gong, W.; Mei, G. Study on biodegradation of alkyl xanthate collectors. In Proceedings of the 4th International Conference on Bioinformatics and Biomedical Engineering, Chengdu, China, 18–20 June 2010; pp. 1–6. [Google Scholar] [CrossRef]
- Chen, S.; Li, S.; Xiong, P.; Du, D. Biodegradation of sodium butyl xanthate by Shewanella oneidensis MR-1 in the presence of Cr(VI). Environ. Eng. Sci. 2019, 36, 1179. [Google Scholar] [CrossRef]
- Fewson, C.A. Metabolism of aromatic compounds by acinetobacter. In The Biology of Acinetobacter. Federation of European Microbiological Societies Symposium Series; Towner, K.J., Bergogne-Bérézin, E., Fewson, C.A., Eds.; Springer: Boston, MA, USA, 1991; Volume 57. [Google Scholar]
- Jiménez, J.I.; Nogales, J.; García, J.L.; Díaz, E. A genomic view of the catabolism of aromatic compounds in pseudomonas. In Handbook of Hydrocarbon and Lipid Microbiology; Timmis, K.N., Ed.; Springer: Berlin/Heidelberg, Germany, 2010. [Google Scholar]
- Wang, P.; Zhang, Y.; Jin, J.; Wang, T.; Wang, J.; Jiang, B. A high-efficiency phenanthrene-degrading Diaphorobacter sp. isolated from PAH-contaminated river sediment. Sci. Total Environ. 2020, 746, 140455. [Google Scholar] [CrossRef]
- Wang, W.; Zhong, R.; Shan, D.; Shao, Z. Indigenous oil-degrading bacteria in crude oil-contaminated seawater of the Yellow sea, China. Appl. Microbiol. Biotechnol. 2014, 98, 7253–7269. [Google Scholar] [CrossRef]
- Mao, Y.; Zhang, X.; Xia, X.; Zhong, H.; Chao, L. Versatile aromatic compound-degrading capacity and microdiversity of Thauera strains isolated from a coking wastewater treatment bioreactor. J. Ind. Microbiol. Biotechnol. 2010, 37, 927–934. [Google Scholar] [CrossRef] [PubMed]
- Kertesz, M.A.; Kawasaki, A. Hydrocarbon-degrading Sphingomonads: Sphingomonas, Sphingobium, Novosphingobium, and Sphingopyxis. In Handbook of Hydrocarbon and Lipid Microbiology; Timmis, K.N., Ed.; Springer: Berlin/Heidelberg, Germany, 2010. [Google Scholar]
- Morya, R.; Salvachúa, D.; Shekahar Thakur, I. Burkholderia: An untapped but promising bacterial genus for the conversion of aromatic compounds. Trends Biotechnol. 2020, 38, 963–975. [Google Scholar] [CrossRef] [PubMed]
- Bomberg, M.; Mäkinen, J.; Salo, M.; Kinnunen, P. High diversity in iron cycling microbial communities in acidic, iron-rich water of the Pyhäsalmi mine, Finland. Geofluids 2019. [Google Scholar] [CrossRef] [Green Version]
- Dutta, A.; Sar, P.; Sarkar, J.; Dutta Gupta, S.; Gupta, A.; Bose, H.; Mukherjee, A.; Roy, S. Archaeal communities in deep terrestrial subsurface underneath the Deccan Traps, India. Front. Microbiol. 2019, 10, 1362. [Google Scholar] [CrossRef] [Green Version]
- Golyshina, O.V.; Lünsdorf, H.; Golyshin, P.N. Ferroplasma. In Bergey’s Manual of Systematic of Archaea and Bacteria; Whitman, W.B., Rainey, F., Kämpfer, P., Trujillo, M., Chun, J., DeVos, P., Hedlund, B., Dedysh, S., Eds.; John Wiley and Sons: Hoboken, NJ, USA, 2016. [Google Scholar]
- Yang, B.-C.; Chen, N.; Liao, B.; Huang, Y.; Huang, L.-N. Spencerozyma acididurans sp. nov., an acid-tolerant basidiomycetous yeast species isolated from acid mine drainage. Int. J. Syst. Evol. Micr. 2019, 69, 2828–2833. [Google Scholar] [CrossRef]
- Salinas, E.; Elorza de Orellano, M.; Rezza, I.; Martinex, L.; Marchesvky, E.; Sanz de Tosetti, M. Removal of cadmium and lead from dilute aqueous solutions by Rhodotorula rubra. Bioresour. Technol. 2000, 72, 107–112. [Google Scholar] [CrossRef]
- Hoseinzadeh, S.; Shahabivand, S.; Aliloo, A.A. Toxic metals accumulation in Trichoderma asperellum and T. harzianum. Microbiology 2017, 86, 728–736. [Google Scholar] [CrossRef]
- Nam, I.-H.; Murugesan, K.; Ryu, J.; Kim, J.H. Arsenic (As) removal using Talaromyces sp. KM-31 isolated from As-contaminated mine soil. Minerals 2019, 9, 568. [Google Scholar] [CrossRef] [Green Version]
- Findley, K.; Oh, J.; Yang, J.; Conlan, S.; Deming, C.; Meyer, J.A.; Schoenfeldt, D.; Nomicos, E.; Park, M.; Kong, H.H.; et al. Topographic diversity of fungal and bacterial communities in human skin. Nature 2013, 498, 367–370. [Google Scholar] [CrossRef]
- Lai, X.; Cao, L.; Tan, H.; Fang, S.; Huang, Y.; Zhou, S. Fungal communities from methane hydrate-bearing deep-sea marine sediments in South China Sea. ISME J. 2007, 1, 756–762. [Google Scholar] [CrossRef]
- Le Calvez, T.; Burgaud, G.; Mahe, S.; Barbier, G.; Vandenkoornhuyse, P. Fungal diversity in deep-sea hydrothermal ecosystems. Appl. Environ. Microbiol. 2009, 75, 6415–6421. [Google Scholar] [CrossRef] [PubMed] [Green Version]
- Arenz, B.E.; Held, B.W.; Jurgens, J.A.; Farrell, R.L.; Blanchette, R.A. Fungal diversity in soils and historic wood from the Ross Sea Region of Antarctica. Soil Biol. Biochem. 2006, 38, 3057–3064. [Google Scholar] [CrossRef]
- Escudero, C.; Vera, M.; Oggerin, M.; Amils, R. Active microbial biofilms in deep poor porous continental subsurface rocks. Sci. Rep. 2017, 8, 1538. [Google Scholar] [CrossRef] [PubMed]
- Vongporm, Y. Thiosalt Behaviour in Aqueous Media. Ph.D. Thesis, Memorial University of Newfoundland, Saint John, NL, Canada, 2008; pp. 26–36. [Google Scholar]
- Miranda-Trevino, J.C.; Pappoe, M.; Hawboldt, K.; Bottaro, C. The importance of thiosalts speciation: Review of analytical methods, kinetics, and treatment. Crit. Rev. Environ. Sci. Technol. 2013, 43, 2013–2070. [Google Scholar] [CrossRef]
- Liu, L.; Rao, S.R.; Finch, J.A. Technical note laboratory study of effect of recycle water on flotation of a Cu/Zn sulphide ore. Miner. Eng. 1993, 6, 1183–1190. [Google Scholar] [CrossRef]
- Öztürk, Y.; Bıçak, Ö.; Özdemir, E.; Ekmekçi, Z. Mitigation negative effects of thiosulfate on flotation performance of a Cu-Pb-Zn sulfide ore. Miner. Eng. 2018, 122, 142–147. [Google Scholar] [CrossRef]
- Phillips, V.A.; Kolbe, J.L.; Opperhauser, H. Effect of pH on the growth of Mg(OH)2 crystals in an aqueous environment at 60 °C. J. Cryst. Growth 1977, 41, 228–234. [Google Scholar] [CrossRef]
- Mikheenko, A.; Saveliev, V.; Gurevich, A. MetaQUAST: Evaluation of metagenome assemblies. Bioinformatics 2016, 32, 1088–1090. [Google Scholar] [CrossRef] [Green Version]
- Ondov, B.D.; Bergman, N.H.; Phillippy, A.M. Krona: Interactive metagenomic visualization in a web browser. In Encyclopedia of Metagenomics; Springer US: New York, NY, USA, 2015; pp. 339–346. [Google Scholar]


| Samples | T | SPC | pH | DO | ORP |
|---|---|---|---|---|---|
| °C | mS cm−1 | mg L−1 | mV SHE | ||
| June | |||||
| Zn Rod Mill Feed | 27.3 | 7.0 | 6.4 | 5.5 | 182 |
| Zn Rougher Feed | 35.0 | 4.6 | 6.8 | 1.2 | 245 |
| Zn RZ Tails | 33.2 | 6.3 | 6.9 | 3.9 | 387 |
| Cu Rod Mill Feed | 27.5 | 7.0 | 6.5 | 5.5 | 190 |
| Cu Rougher Feed | 36.0 | 4.4 | 10.0 | 1.8 | 72 |
| Cu RC Final Tailings | 36.1 | 5.2 | 10.2 | 2.9 | 200 |
| Cu Concentrate Thickener Overflow | 25.2 | 6.8 | 6.7 | 6.3 | 320 |
| Paste Thickener Overflow | 31.0 | 6.9 | 9.4 | 3.8 | 251 |
| ETAM in | 22.2 | 5.1 | 8.6 | 8.9 | 319 |
| ETAM out | 19.1 | 6.6 | 9.5 | 12.9 | 290 |
| Santa Clara | 23.2 | 0.3 | 8.8 | 6.3 | 360 |
| November | |||||
| Zn Rod Mill Feed | 26 | 7.3 | 7.0 | 5.4 | 272 |
| Zn Rougher Feed | 33.3 | 5.5 | 6.8 | 0.1 | 259 |
| Zn RZ Tails | 33.0 | 5.0 | 6.7 | 4.1 | 276 |
| Cu Rod Mill Feed | 26.2 | 7.5 | 7.0 | 5.4 | 270 |
| Cu Rougher Feed | 30.6 | 4.7 | 8.8 | 5.1 | 141 |
| Cu RC Final Tailings | 32.2 | 5.2 | 9.4 | 4.4 | 133 |
| Cu Concentrate Thickener Overflow | N.A | N.A | N.A | N.A | N.A |
| Paste Thickener Overflow | 27.2 | 7.4 | 9.4 | 6.9 | 214 |
| ETAM in | 22.5 | 6.6 | 8.1 | 8.0 | 336 |
| ETAM out | 17.4 | 7.0 | 7.4 | 6.9 | 341 |
| Santa Clara | 14.4 | 0.3 | 7.9 | 7.6 | 401 |
Publisher’s Note: MDPI stays neutral with regard to jurisdictional claims in published maps and institutional affiliations. |
© 2021 by the authors. Licensee MDPI, Basel, Switzerland. This article is an open access article distributed under the terms and conditions of the Creative Commons Attribution (CC BY) license (http://creativecommons.org/licenses/by/4.0/).
Share and Cite
Miettinen, H.; Bomberg, M.; Le, T.M.K.; Kinnunen, P. Identification and Metabolism of Naturally Prevailing Microorganisms in Zinc and Copper Mineral Processing. Minerals 2021, 11, 156. https://doi.org/10.3390/min11020156
Miettinen H, Bomberg M, Le TMK, Kinnunen P. Identification and Metabolism of Naturally Prevailing Microorganisms in Zinc and Copper Mineral Processing. Minerals. 2021; 11(2):156. https://doi.org/10.3390/min11020156
Chicago/Turabian StyleMiettinen, Hanna, Malin Bomberg, Thi Minh Khanh Le, and Päivi Kinnunen. 2021. "Identification and Metabolism of Naturally Prevailing Microorganisms in Zinc and Copper Mineral Processing" Minerals 11, no. 2: 156. https://doi.org/10.3390/min11020156