Article

Understanding of Blast Furnace Performance with Biomass Introduction

1
Metallurgy Department, Swerim, 974 37 Luleå, Sweden
2
Department of Civil, Environmental and Natural Resources Engineering, Minerals and Metallurgical Engineering, MiMeR, Luleå University of Technology, 971 87 Luleå, Sweden
3
Relitor, 973 34 Luleå, Sweden
*
Author to whom correspondence should be addressed.
Minerals 2021, 11(2), 157; https://doi.org/10.3390/min11020157
Submission received: 22 December 2020 / Revised: 22 January 2021 / Accepted: 28 January 2021 / Published: 2 February 2021
(This article belongs to the Special Issue Bio-Coal for Metallurgical Processes)

Abstract

:
The blast furnace still dominates the production and supply of metallic units for steelmaking. Coke and coal used in the blast furnace contribute substantially to CO2 emissions from the steel sector. Therefore, blast furnace operators are making great efforts to lower the fossil CO2 emissions and transition to fossil-free steelmaking. In previous studies the use of pre-treated biomass has been indicated to have great potential to significantly lower fossil CO2 emissions. Even negative CO2 emission can be achieved if biomass is used together with carbon capture and storage. Blast furnace conditions will change at substantial inputs of biomass but can be defined through model calculations when using a model calibrated with actual operational data to define the key blast furnace performance parameters. To understand the effect, the modelling results for different biomass cases are evaluated in detail and the overall performance is visualised in Rist- and carbon direct reduction rate (CDRR) diagrams. In this study injection of torrefied biomass or charcoal, top charging of charcoal as well as the use of a combination of both methods are evaluated in model calculations. It was found that significant impact on the blast furnace conditions by the injection of 142 kg/tHM of torrefied biomass could be counteracted by also top-charging 30 kg/tHM of charcoal. With combined use of the latter methods, CO2-emissions can be potentially reduced by up to 34% with moderate change in blast furnace conditions and limited investments.

1. Introduction

The BF (blast furnace) still dominates the production and supply of metallic units for steelmaking, although the coke and coal used in the BF contribute substantially to CO2 emissions from the steel sector. Therefore, BF operators are making great efforts to reduce fossil CO2 emissions and adapting the process for fossil-free steelmaking. In a previous study the potential to reduce CO2 emissions by applying different methods as e.g., top gas recycling [1], use of pre-reduced burden as hot briquetted iron (HBI)/direct reduced iron (DRI) [2], injection of hydrogen-rich gases (coke oven gas, H2) [2,3,4,5,6,7] or introduction of pre-treated biomass (torrefied biomass (TB) and charcoal (CC)) [4] via injection or top charging was theoretically evaluated using a 1-d (dimensional) static heat and mass balance BF model [8]. The study was supported by experimental experience and information from operational tests reported in the literature [1,2,3,4,5,6,7,9,10,11,12]. Comparing the above-mentioned methods, it was apparent that the introduction of pre-treated biomass in the form of TB and CC has the largest potential for avoiding fossil CO2 emissions when considering the total process system with production of heat and power from process gases. Further, through CO2 capture and storage, both fossil and renewable CO2 is captured, which results in a significantly higher total CO2 capture than the generated fossil CO2.
Injection of TB or CC as well as top charging of CC will result in changed internal conditions in the BF. Top charging of reactive carbonaceous materials as activated nut coke, bio-coal-containing briquette or reactive charcoal enhances the energy-consuming Boudouard reaction and, thereby, the thermal reserve zone temperature (TRZT) is lowered. Lowering of TRZT will result in a higher ratio of CO2/(CO2 + CO) in equilibrium with wüstite and thus improved the gas efficiency and lower the carbon (C) consumption. Such an effect was also reported during operational tests in an experimental BF when charging 150 kg/tHM of activated nut coke (coke coated with lime or magnetite) in the ferrous layers [13,14]. Top charging of briquettes containing bio-coal [15], coal composite agglomerates [8,9,10,11] or ferrocoke [16] are other means to reduce the TRZT for improved gas efficiency.
When injecting 23.5% TB of a total injection rate of 143.5 kg/tHM into an experimental BF the hydrogen input increased but the TRZT was unchanged [4]. Varying the pulverised coal (PC) injection rate did not influence the TRZT but at higher PC injection rate the thermal reserve zone (TRZ) started higher up in the shaft [17]. Changes in the combustion behaviour when mixing TB with PC were found [4], during raceway monitoring in one-tuyere tests at an industrial BF [18]. This was also found in studies on combustion behaviour involving CFD (computational fluid dynamics) modelling [4,18,19]. The effect on combustion behaviour will lead to changes in the raceway conditions but not improve the gas efficiency as when top charging reactive materials with accompanying lowering of TRZT.
To describe the process state and efficiency for reference conditions and compare with cases assuming the use of TB or CC, heat and mass balance models can be applied. These types of 1-d (dimensional) static heat and mass balance BF models are widely and successfully used for describing BF operation [8,20,21,22]. MASMOD (name of BF model), a 1-d static heat and mass balance model, has previously been used for process evaluation of modified operational conditions, e.g., injection of alternative material [4,23,24], use of alternative coke [13,14,25], tuyere injection of TB [5] and top charging of pre-treated biomass in briquettes [15]. It has also been used to theoretically evaluate impact from possible modifications on the BF [18,26,27] or the overall effect on the process system as for IEA–International Energy Agency [28].
In MASMOD the BF is divided into two zones with the intersection between the zones defined to occur where reduction gas composition is constrained by its equilibrium with wüstite, which occurs in the TRZ at TRZT. In the analogue Rist and CDRR (carbon direct reduction rate) diagrams developed in the 1960s, the results from such process modelling can be graphically visualised, showing key parameters and giving a view of overall BF performance, e.g., BF efficiency relative to what is theoretically possible with the specific materials and conditions under which the BF is operated [29,30,31,32,33]. The Rist diagram describes the oxygen exchange between iron oxide and reduction gas in the BF [31]. The CDRR diagram shows the BF operation in relation to chemical and thermal constraints. The actual carbon consumption reached, measured gas efficiency and specific blast volume gives the operational point and state of the process in terms of direct reduction rate. In case of inconsistencies in data, the set of specific blast, gas efficiency and carbon consumption will not coincide in one point; instead, a triangular area is formed and errors in the data can be detected [22]. Commonly, steel operators use either RIST or CDRR diagrams and are only familiar with the type used at their own plant.
In this work the impact on BF conditions from introducing pre-treated biomass via injection of TB or CC and top charging of CC is analysed in detail from an operational perspective. At high injection rates of TB significant impact on the BF conditions is found. Therefore, a concept to counteract these negative effects from high injection rates of TB on the BF conditions by simultaneous charging of reactive charcoal is studied. The studies are conducted in MASMOD using a base case containing deduced data for BF performance parameters as a starting point. When deciding the parameter settings or comparing actual BF effect with modelled ones, experience from operational tests are considered when possible, and to get an overview of the relative process efficiency for the cases the results are visualised in Rist and CDRR diagrams.

2. Materials and Methods

2.1. Biomass

The analysis and higher heating value (HV) of PC, TB1, TB2 and CC used in this study are shown in Table 1, where the PC and CC are carbonaceous materials with high C content and HV. The torrefied biomasses TB1 and TB2 have higher content of volatile matter (VM), lower content of total carbon and lower HV compared to the pyrolyzed CC. Comparing TB1 and TB2 it is seen that TB1 with higher torrefaction degree has higher HV, lower VM content and higher total carbon content. All used biomass is produced from Scandinavian wood. The used CC is commercial charcoal normally used for BBQ purposes. The TB is based on sawdust. Moisture content of the TB and CC is set to 1.2%, which represents assumed moisture content for biomass dried during milling.

2.2. MASMOD

The used BF model MASMOD is a static 1-d heat and mass balance model based on similar theoretical principles as the Rist and CDRR diagrams for describing the BF [29,30,31,32,33]. This model is described in more detail by Hooey et al. [8] and information on how it is applied for model calculations is described in [18]. It describes the BF according to the schematic representation in Figure 1, showing how the BF is divided into sections and how BF reactions are incorporated in the model. MASMOD includes mass and heat balances over the whole BF and separately for lower and upper zones, separated by the interface at TRZ. The balances are based on the information on amounts, compositions and temperatures of ingoing and outgoing materials and gases. MASMOD is designed to be flexible, with possibilities to evaluate actual process data or simulate alternative BF operation conditions after model calibration.

Interface between Upper and Lower Zones-TRZ-eq

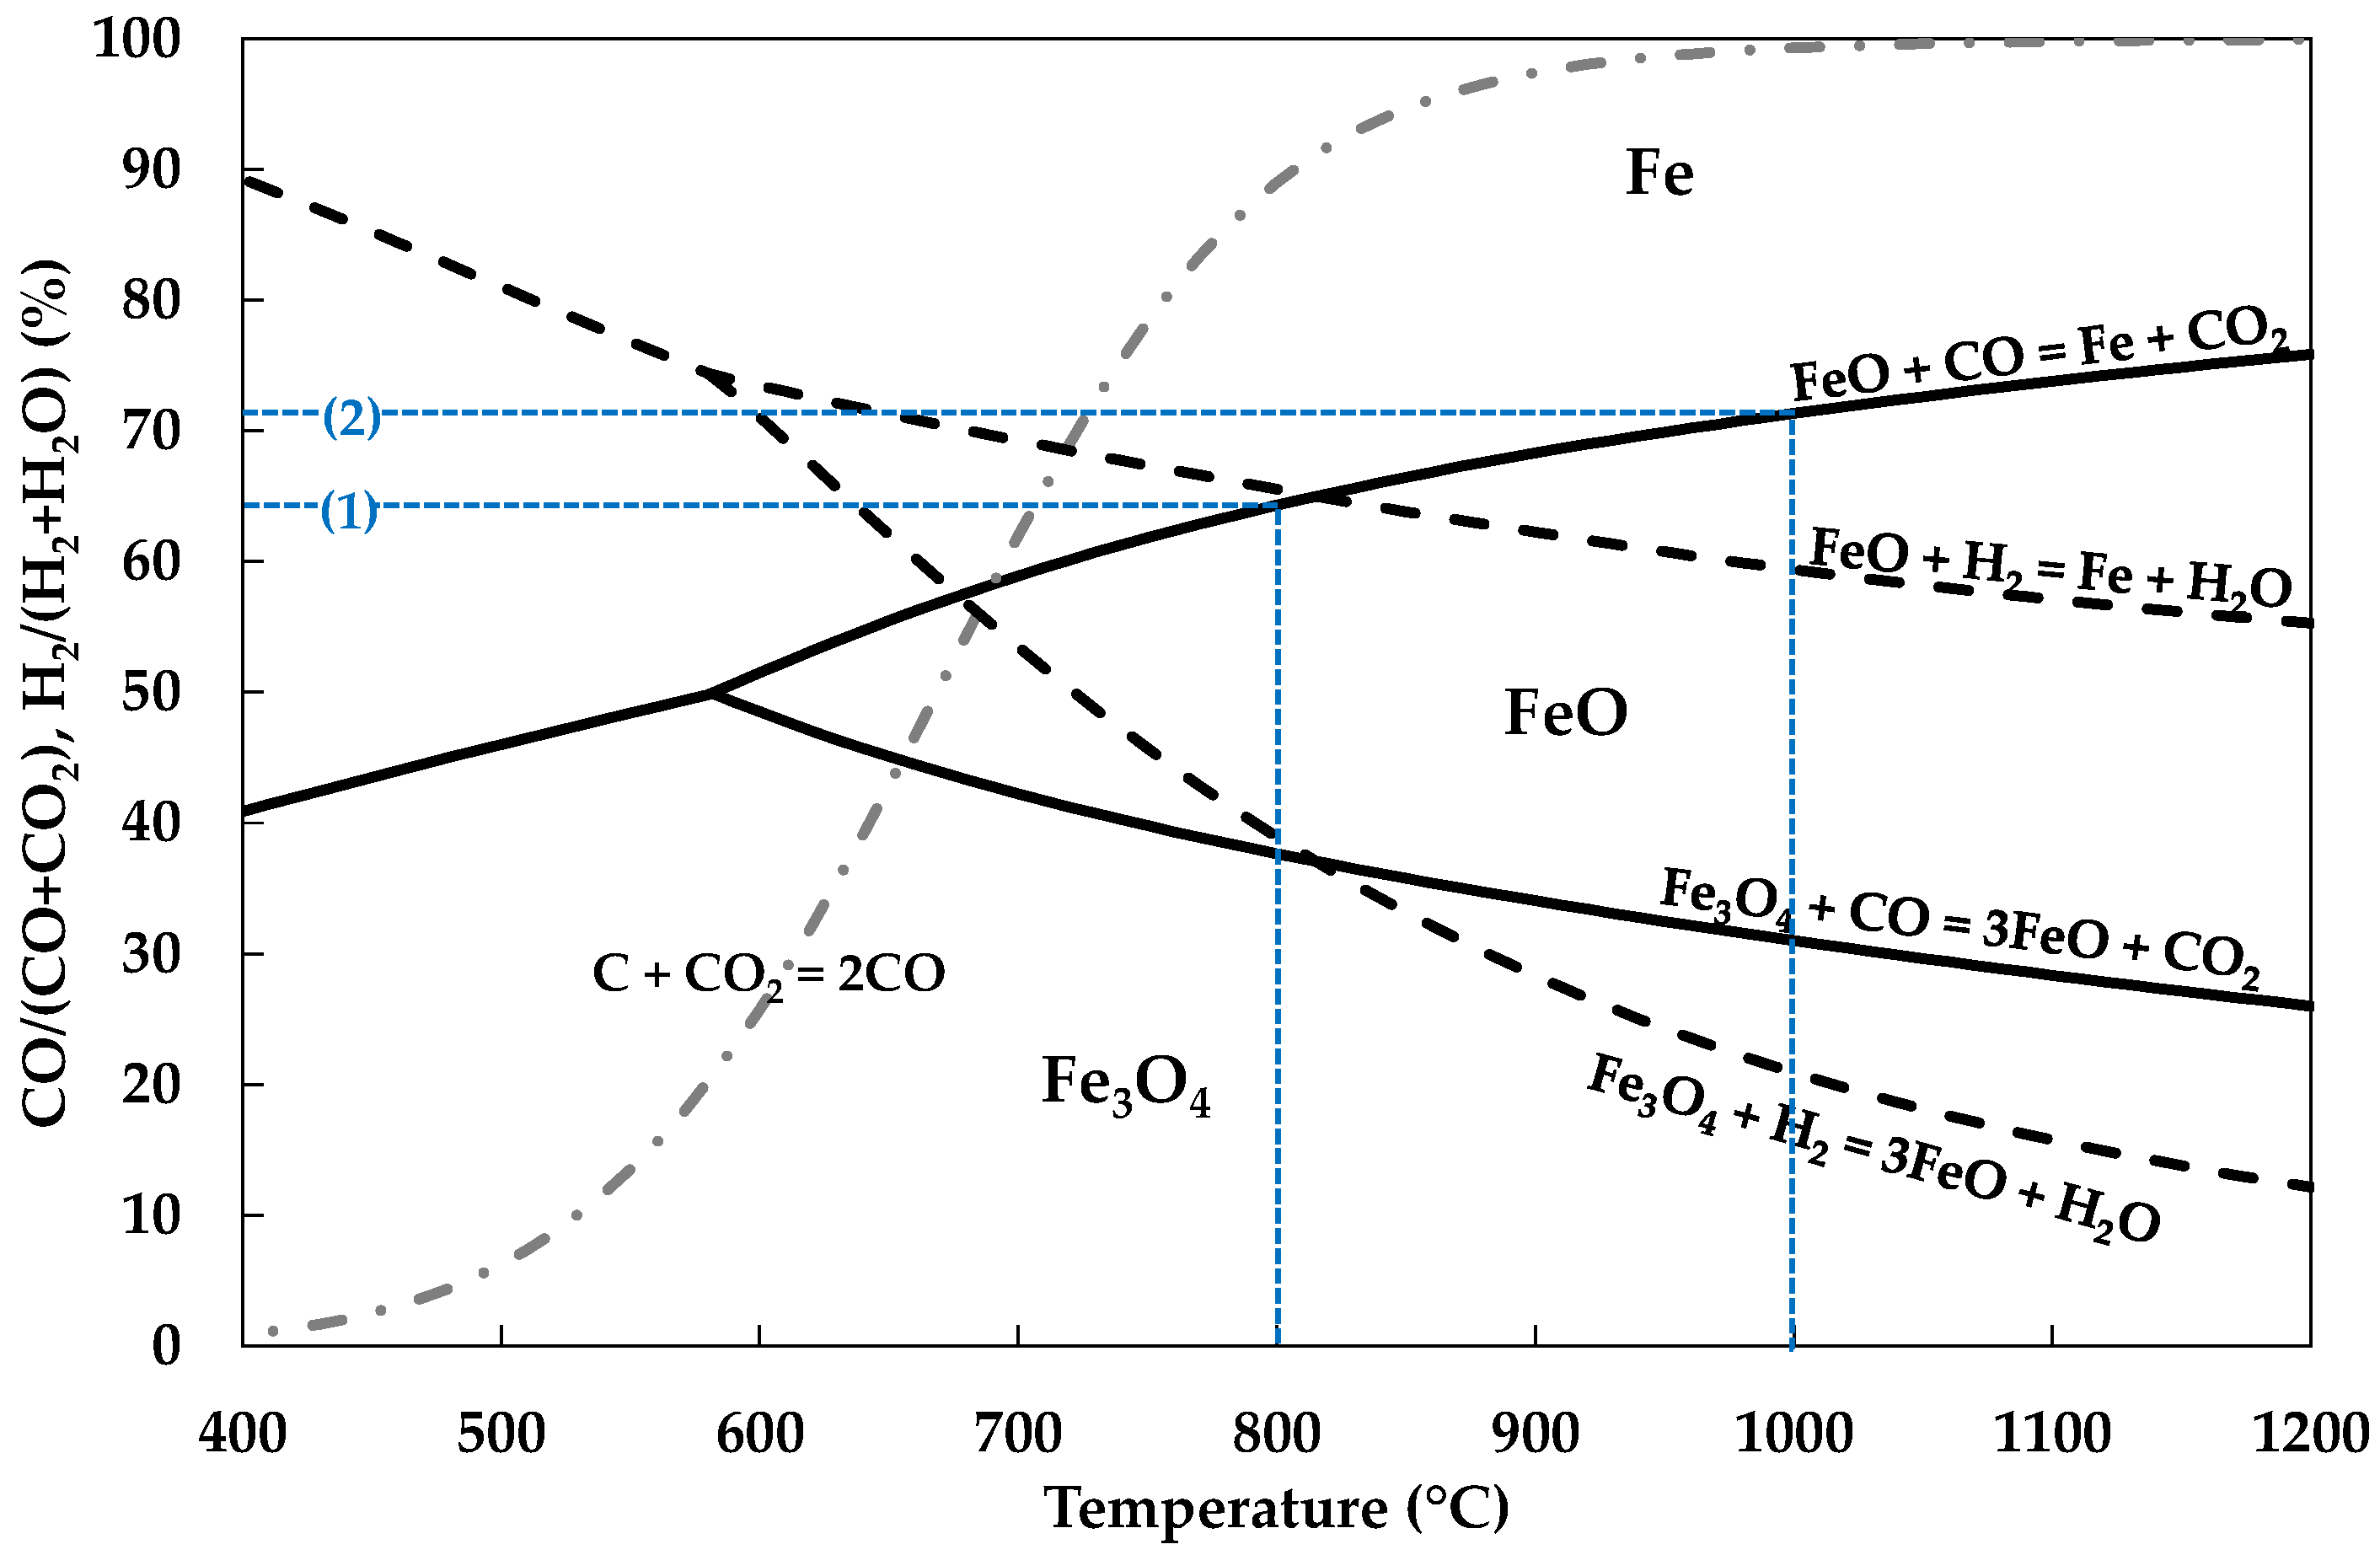
One part of the model that is critical for simulating highly reactive charged carbon-containing material is the thermal reserve zone, especially the interface between the upper and lower zones and the gas composition in equilibrium with Femet/wustite. At this interface between the upper and lower zones of the BF, the TRZ-eq constrains the BF performance at its ‘chemical pinch point’, as described by Rist and Meysson [31], and enables division of the heat and mass balance. The BF performance is constrained here by the chemical equilibrium between the reducing gases (CO/CO2 and H2/H2O) and iron (Fe/FeO), seen in Figure 2. EtaCOTRZ-eq and EtaH2 TRZ-eq, Equations (1) and (2), are calculated for equilibrium conditions at the TRZT and deviations from the equilibrium conditions are accounted for in MASMOD through shaft efficiency (SE), see Equations (3) and (4).
E t a C O T R Z e q = % C O 2   T R Z e q % C O 2   T R Z e q + % C O T R Z e q
E t a H 2   T R Z e q = % H 2 O T R Z e q % H 2 T R Z e q + % H 2 O T R Z e q
E t a C O T R Z = S E × E t a C O T R Z e q
E t a H 2   T R Z = S E × E t a H 2   T R Z e q
The TRZT is essential for both reduction gas composition and heat flow between the upper and lower zones. The equilibrium reduction gas composition changes with temperature, as seen in Figure 2. From the FeO + CO = Fe + CO2 and FeO + H2 = Fe + H2O line it is seen that decreased TRZT results in increased EtaCOTRZ eq and decreased EtaH2 TRZ eq. For example, EtaCOTRZ eq at 800 °C = 35 (1) and EtaCOTRZ eq at 1000 °C = 29 (2), which shows that higher TRZT corresponds to lower utilisation of CO (Figure 2).

2.3. Visulisation of Effects of Biomass Introduction into the BF in RIST and CDRR Diagrams

The existing BF model MASMOD has been further developed and equipped with features for drawing Rist diagrams based on the modelling result. The Rist diagram is incorporated in MASMOD in its original form, as developed by A. Rist [31] including CO and H2 as reducing gases [33]. The Rist diagram shows the transfer of oxygen to the reduction gas in a common expression involving both C- and H-containing gas. The expression for the reduction gas described by (H2 + O)/(C + H2) is given on the x-axis of the Rist diagram. This ratio corresponds to 1 + Eta(CO + H2)), as described by Equations (5) and (6).
E t a   ( C O + H 2 ) = % H 2 O + % C O 2 % H 2 O + % H 2 + % C O 2 + % C O
( H 2 + O ) / ( C + H 2 ) = ( 2 × % H 2 O + % H 2   + 2 × % C O 2 + % C O ) / ( % H 2 O + % H 2 + % C O 2 + % C O ) = 1 + E t a ( C O + H 2 )
The Eta(CO + H2) seen in Equation (5) is a combination of EtaCO and EtaH2 as shown in Equations (3) and (4).
The used CDRR diagram is similar to the original diagram developed by Nakatani et al. [30] but with the possibility to show heat loss, blast volume and EtaCO for operational cases, as described by Ryman [22]. The CDRR diagram is based on the mass and heat balance of the whole BF and constraints of TRZ-eq. It shows how the actual carbon rate and DRR relates to the optimal conditions at the chemical and thermal constraints. The thermal constraint line in the MASMOD CDRR diagram is drawn considering the heat demand of the process including actual heat in top gas, HM, slag and heat losses. The heat loss is based on actual operational data to show a more realistic thermal constraint for the actual BF. The thermal constraint is defined slightly differently by different authors [30,32]. For example, Nakatani et al. [30] consider the process heat demand including heat in outgoing top gas at 200 °C, actual HM, actual slag and no other heat loss.
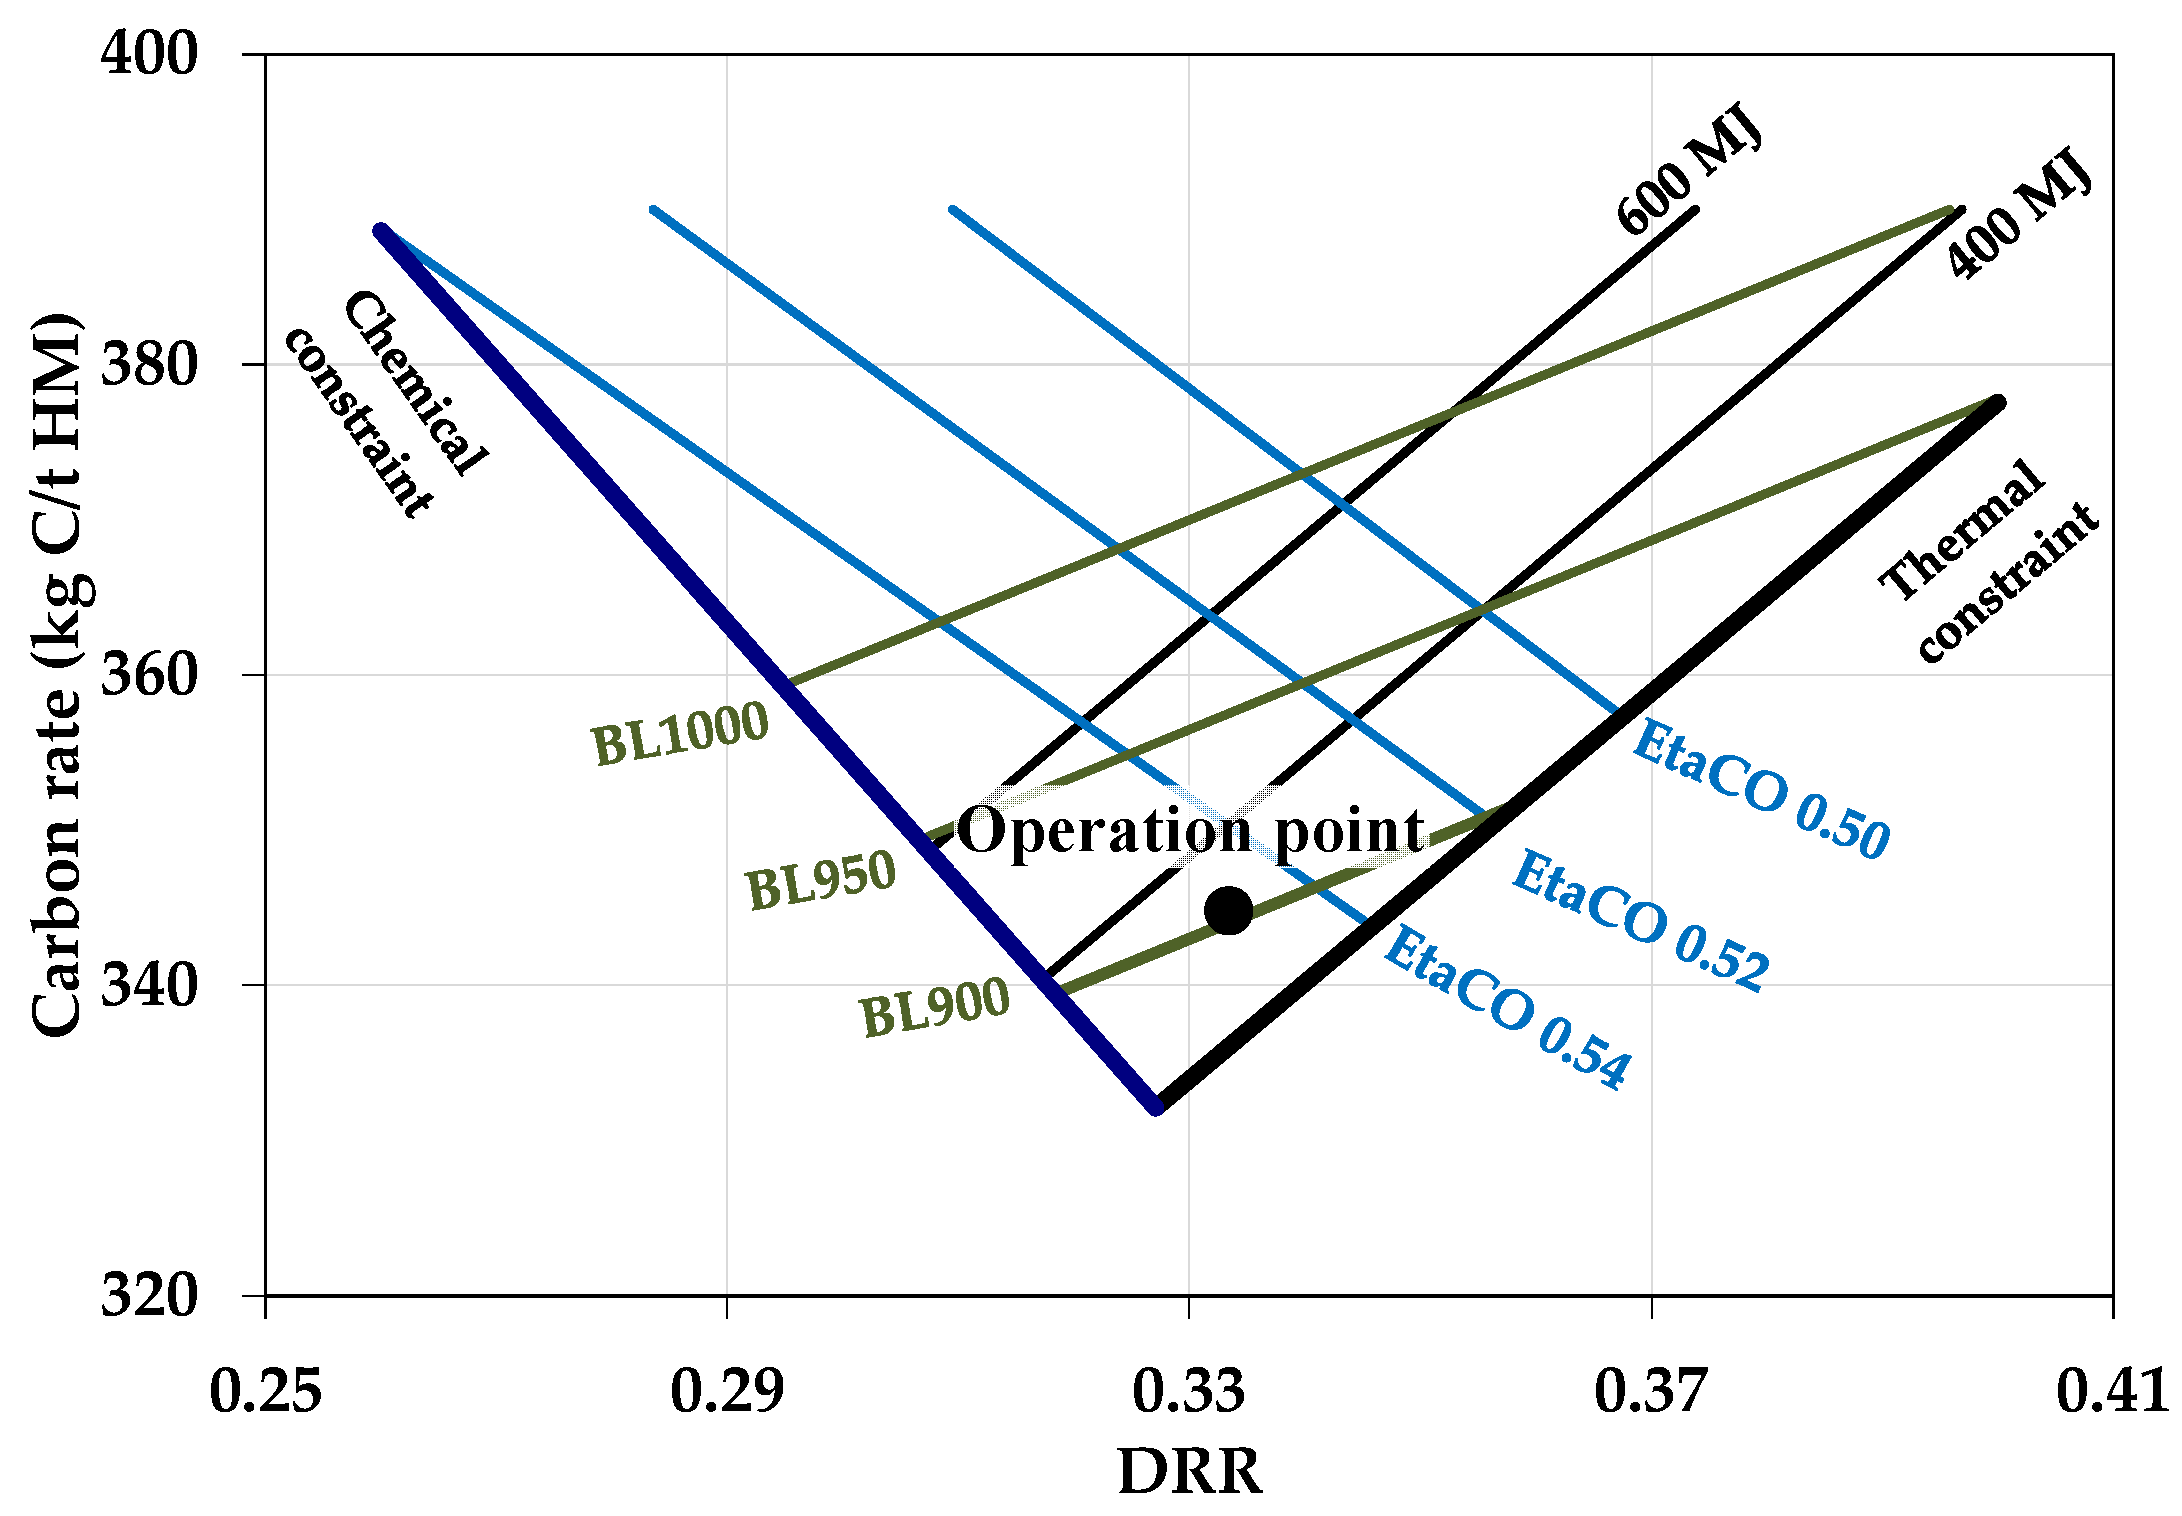
Figure 3 shows an example of a CDRR diagram calculated and drawn through the functions in MASMOD. Here, the thermal constraint considers actual heat in outgoing top gas, actual HM, actual slag and 200 MJ/tonne HM heat loss. In addition to the thermal- and chemical constraint and heat loss lines [MJ/tHM], the diagram includes lines for showing EtaCO and blast volume (BL) [Nm3/tHM] for the actual operational case.

2.4. Calculation Cases

MASMOD is calibrated with actual BF operational data from SSAB BF No. 3 in Luleå to form a reference case with calibrated performance parameters. These parameters include SE, EtaH2, TRZT, distribution of elements between HM and slag, sulphur capacity of slag, heat losses and heat loss distribution. This operational data-based reference case is used as the base for simulating different cases with biomass introduction in the BF through keeping the performance parameters found in the calibrated case mostly constant. The SE that is related to the ferrous burden materials (reducibility, oxidation degree of Fe, total Fe content), gas distribution (e.g., affected by disintegration and channelling) and slag rate is assumed to be constant. EtaH2 is assumed to be constant at 35.5%, as in the reference case, due to low H2-contents in the reduction gas. One exception is made with TRZT, where lower TRZT is assumed for the charcoal top-charging case, which is a phenomenon reported by Okvist et al. and Lundgren et al. for charging of activated nut coke [13,14] and by Mousa et al. for charging of bio-coal-containing agglomerates [15]. The assumed decreased TRZT of 30 °C due to reactive charcoal in these calculations is conservative when comparing to decrease in TRZT of 30–40 °C during the operational trials.
To study the impact of pre-treated biomass on the BF conditions seven simulated cases as described in Table 2 are evaluated. The calibrated reference case corresponds to BF operation with coke and injected PC as reduction agents. The other cases are designed to have the same coke consumption as the reference case and, instead, varying PC injection rate. The blast conditions are kept constant with the same blast temperature and O2-enrichment. This results in varying top gas temperature and RAFT. If not acceptable for BF operation, these can be adjusted, for example, by changing the O2-enrichment. The slag basicity is controlled as in the reference case by adjusting the limestone addition and the slag rate is allowed to vary.

3. Results

Table 3 shows process data for the reference case and calculated data from MASMOD corresponding to the calibration and simulation results for all cases. During calibration operational data are used and good agreement is achieved for the mass and heat balance. By iteration, the differences between measured and calculated data are minimised. Calculated output data from the model are given in bold. As can be seen, the weighed amount of pellets, the slag basicity (B2) and the specific blast volume in the operational data can be quite closely estimated in the model calculation for the reference case (Ref.). Calibration aims to define some BF characteristic parameters, such as the distribution factors for different elements between HM and slag, the SE, TRZT and EtaH2.
When modelling different cases assuming a fixed production rate, the blast volume is determined by oxygen input required to supply reducing gas and heat to the BF while considering other oxygen sources. At a constant coke rate, but a varied total injection rate of PC and biomass, the required injection rate will be higher when HHV and Cfix are lower, as for TB1 and TB2. Conversely, the injection rate can be lowered when injecting CC with PC, as the HHV and Cfix are slightly higher than for PC. CCT results in a lower total reductant rate compared to the Ref., as charcoal has high HHV and Cfix, and due to the fact that top charging is expected to lower TRZT, which results in an increased gas efficiency at a fixed SE.
Injection of TB 2 results in the largest impact on the top gas temperature and RAFT, which reach 178 and 1932 °C, respectively. The opposite effect is seen when top charging of charcoal when the top gas temperature and RAFT are 81 and 2242 °C, respectively. The combination of top charging charcoal and injection of TB1 results in almost similar top gas temperature but approximately 100 °C lower RAFT compared to the reference operation.
CCT results in the highest PC replacement ratio of 1.30, which is significantly higher than CCI with PC replacement ratio of 1.04. The difference in replacement ratio between top charging and injecting the same CC comes mainly from the decreased TRZT with top-charged CC. TB2 has a low PC replacement ratio, mainly because of its low carbon content (57%) and low HHV(23). The PC replacement ratio for TB1I and CCT describes combined PC replacement ratio by biomass introduction.
A lower ash amount together with higher basicity (B2) in the used TB and CC compared to PC results in lower need for limestone to reach desired basicity and thereby also lower slag volume at tuyere level and for the final slag. The melting properties in terms of temperature versus melting and viscosity were evaluated in Factsage and no major differences could be found. Melting properties for the final slag were slightly improved for CCI and TB1I&CCT, which are the cases with the lowest slag rate. The estimated viscosity of the final slag was slightly lower for the compositions corresponding to CCI and TB1I&CCT, but the melting intervals were quite similar. For the tuyere slag the melting interval was slightly narrower for the compositions corresponding to CCI and TB1I&CCT.
As can be seen from Table 4, the fossil CO2 emissions are reduced by 9–34% for the evaluated cases. When top charging charcoal the total CO2 emission is ~9% lower. By combining injection and top charging of biomass the potential to reduce the fossil CO2 emission is theoretically 432 kg/tHM or ~34%. Lowering of TRZT will enhance the reduction, but at the same time the replacement of PC with TB1 as injectant increases the blast consumption and reducing gas formation.
Figure 4 shows the CDRR diagram that corresponds to the reference case used in the calibration. As seen, the operating triangle representing the actual process data and operating point calculated in the model for the calculated reference coincide, showing that the calibration was successful.
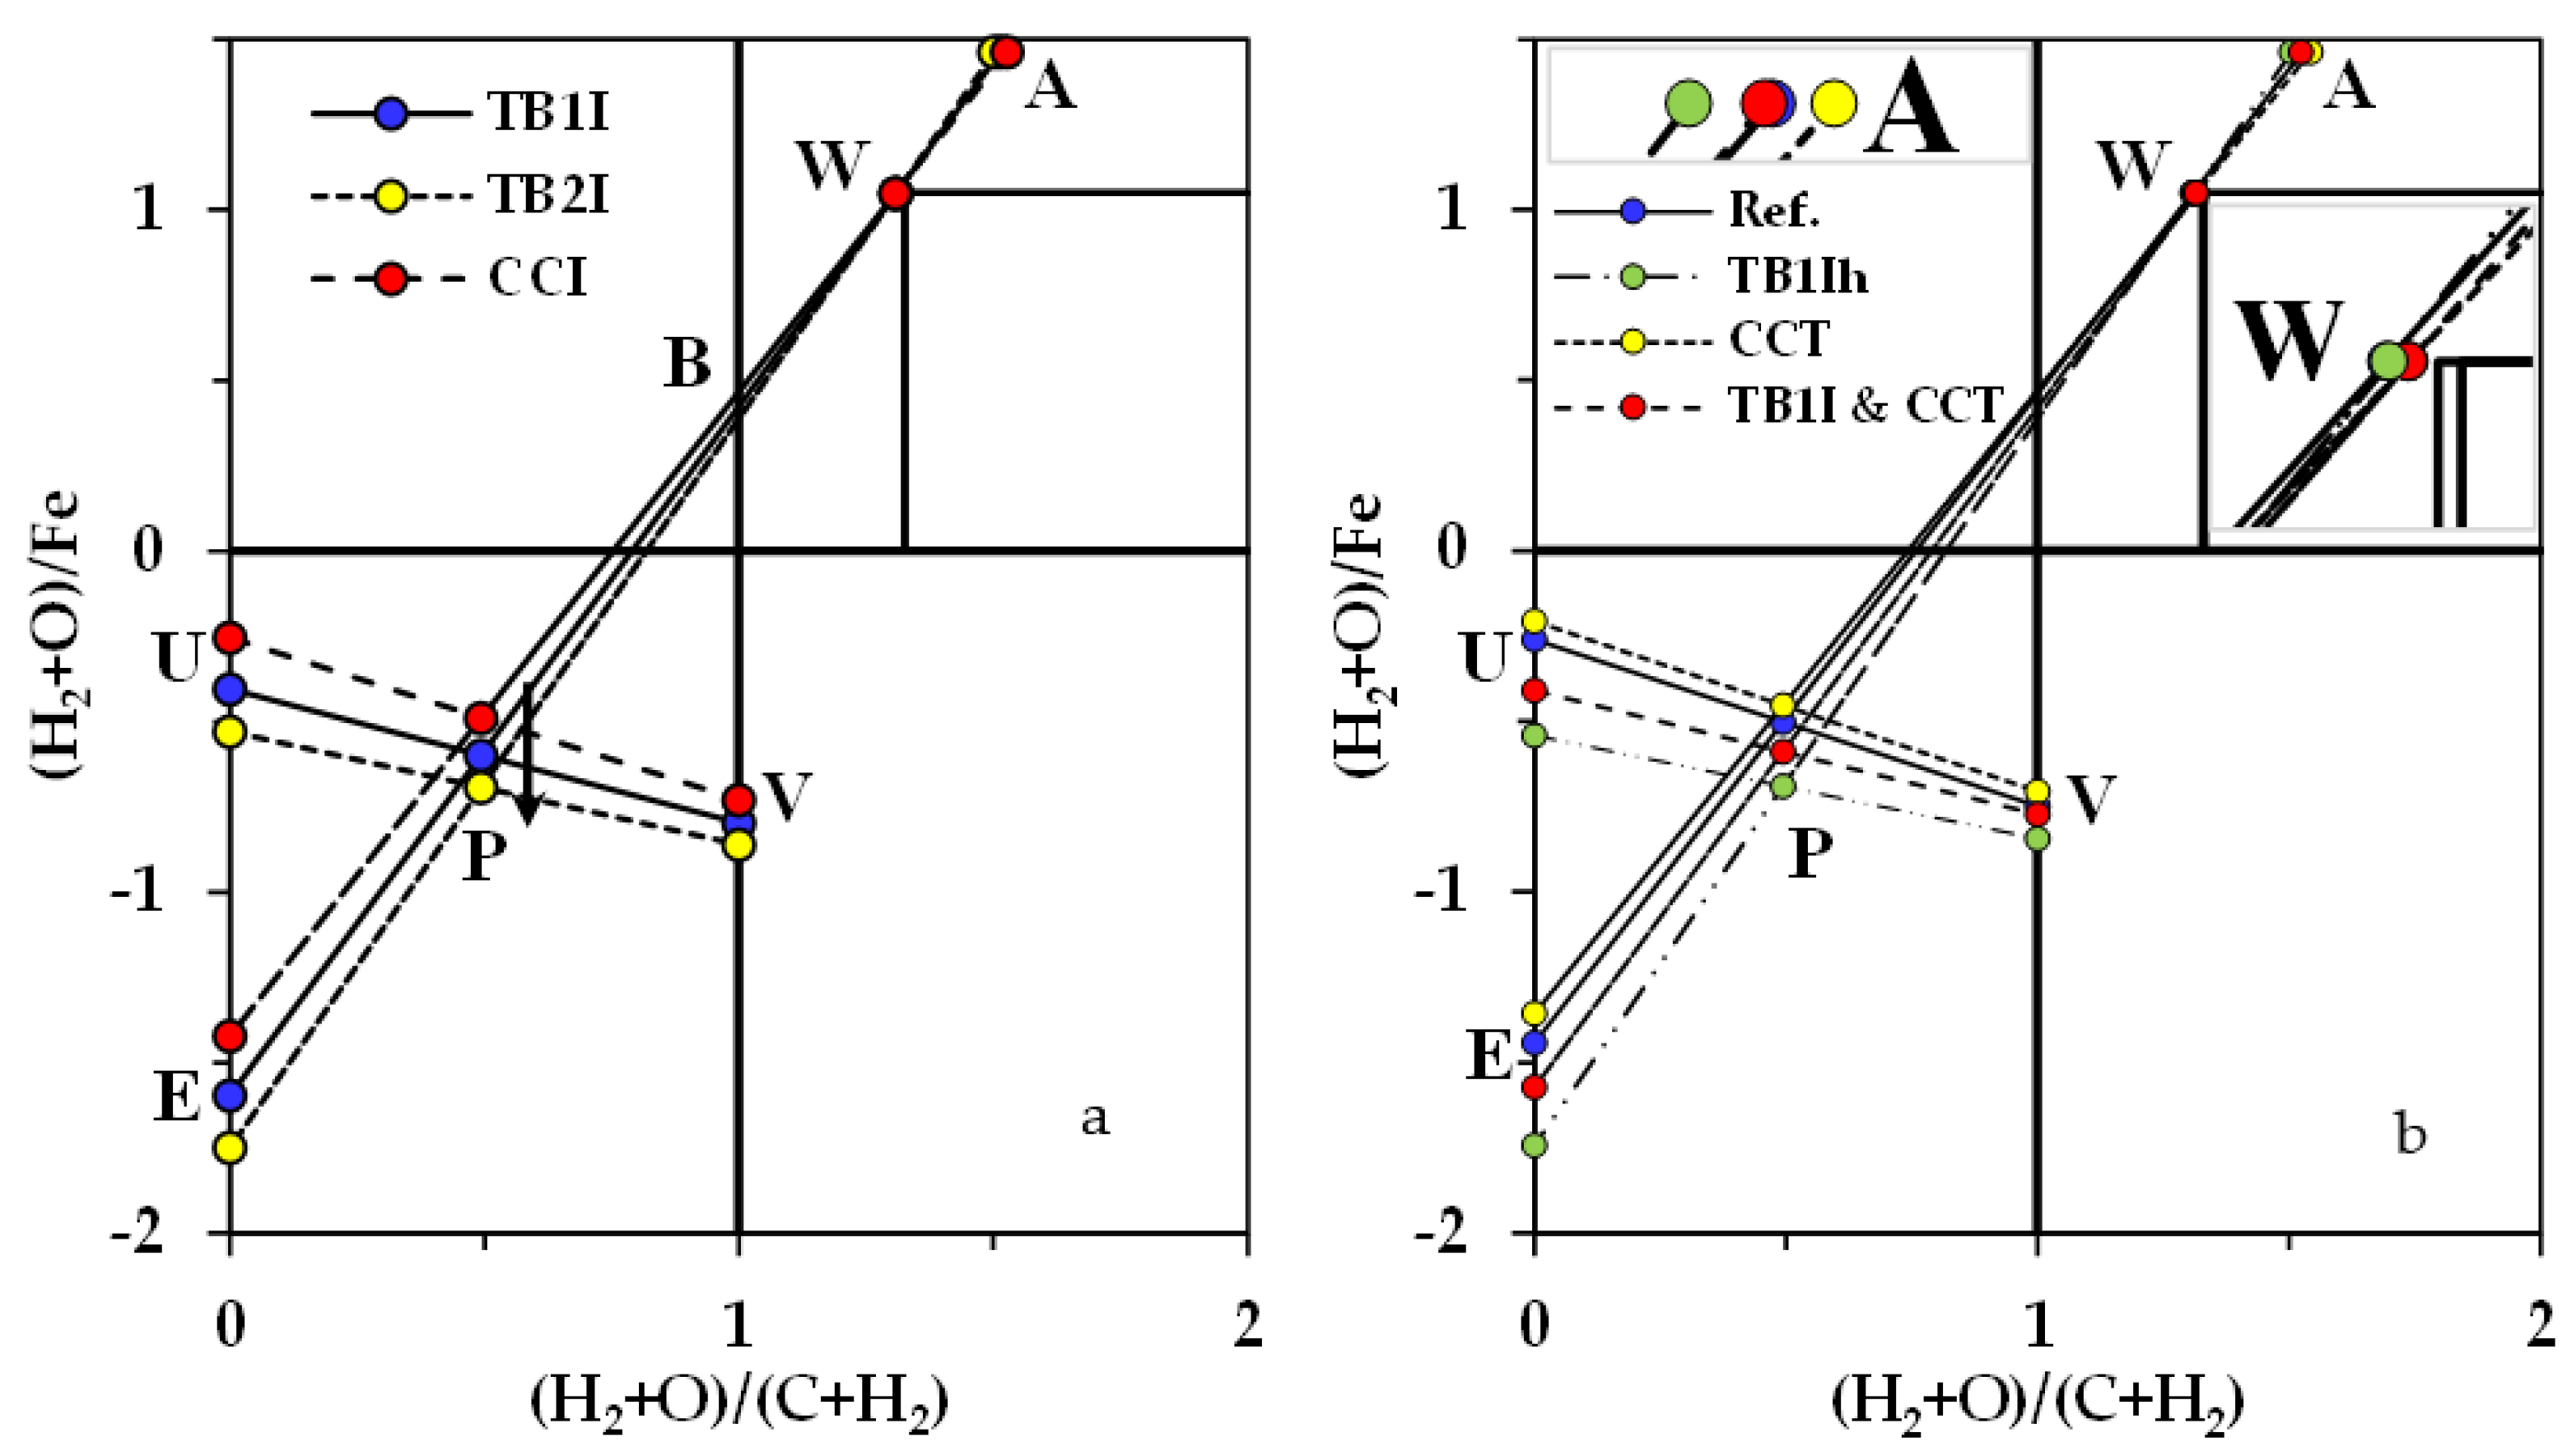
Figure 5 shows the Rist diagrams for cases of TB1I, TB2I and CCI in (a) and Ref. CCT and TB1I&CCT in (b). TB1 and TB2 have lower calorific values and higher volatile content compared to CC and PC. These differences result in higher required total injectant rate to maintain the heat balance in the lower zone (B-V). This also results in higher specific oxygen in the blast (U-E) and lower reduction gas volume (slope of operating line), thus also resulting in lower DRR (B-0). This increased reduction gas volume results in lower reduction gas utilisation (xA (A at the x-axis), which equals 1 + Eta(CO + H2)) and, subsequently, higher chemical energy content in the top gas. As the shaft efficiency and TRZT are kept constant in these cases, the gas composition in equilibrium with wustite (point W) is quite similar for all three cases. The resolution of the diagram does not make it possible to see the slight difference in position of W, due to different H2 input.
Addition of reactive charcoal from the top (CCT) results in higher reduction gas utilisation (Eta(CO + H2), xA)), lower reduction gas volume(slope of operating line), lower heat demand in the lower zone (B-V) and lower DRR (B-0). This can be seen by comparing Ref. with CCT, where the yellow CCT circle is beneath the red TB1I and CCT circle at W. This results from the assumed lower TRZT that shifts the point W to right (higher Eta(CO + H2)TRZ), seen more clearly in the zoomed-in section of Figure 5b.
Comparing the case TB1I&CCT with the Ref., it is seen that the gas utilisation (Blue Ref. circle is beneath the red circle at A.) and heat demand (B-V) are quite similar, while reduction gas volume (slope of operating line) is higher in case TB1I&CCT. High volatile content in TB1 contributes to the higher reduction gas volumes. Ref. and TB1I&CCT have almost the same injection rate, although TB1 has significantly lower calorific value compared to PC, which is explained by the additional carbon input via 30 kg of CC charged from the top.
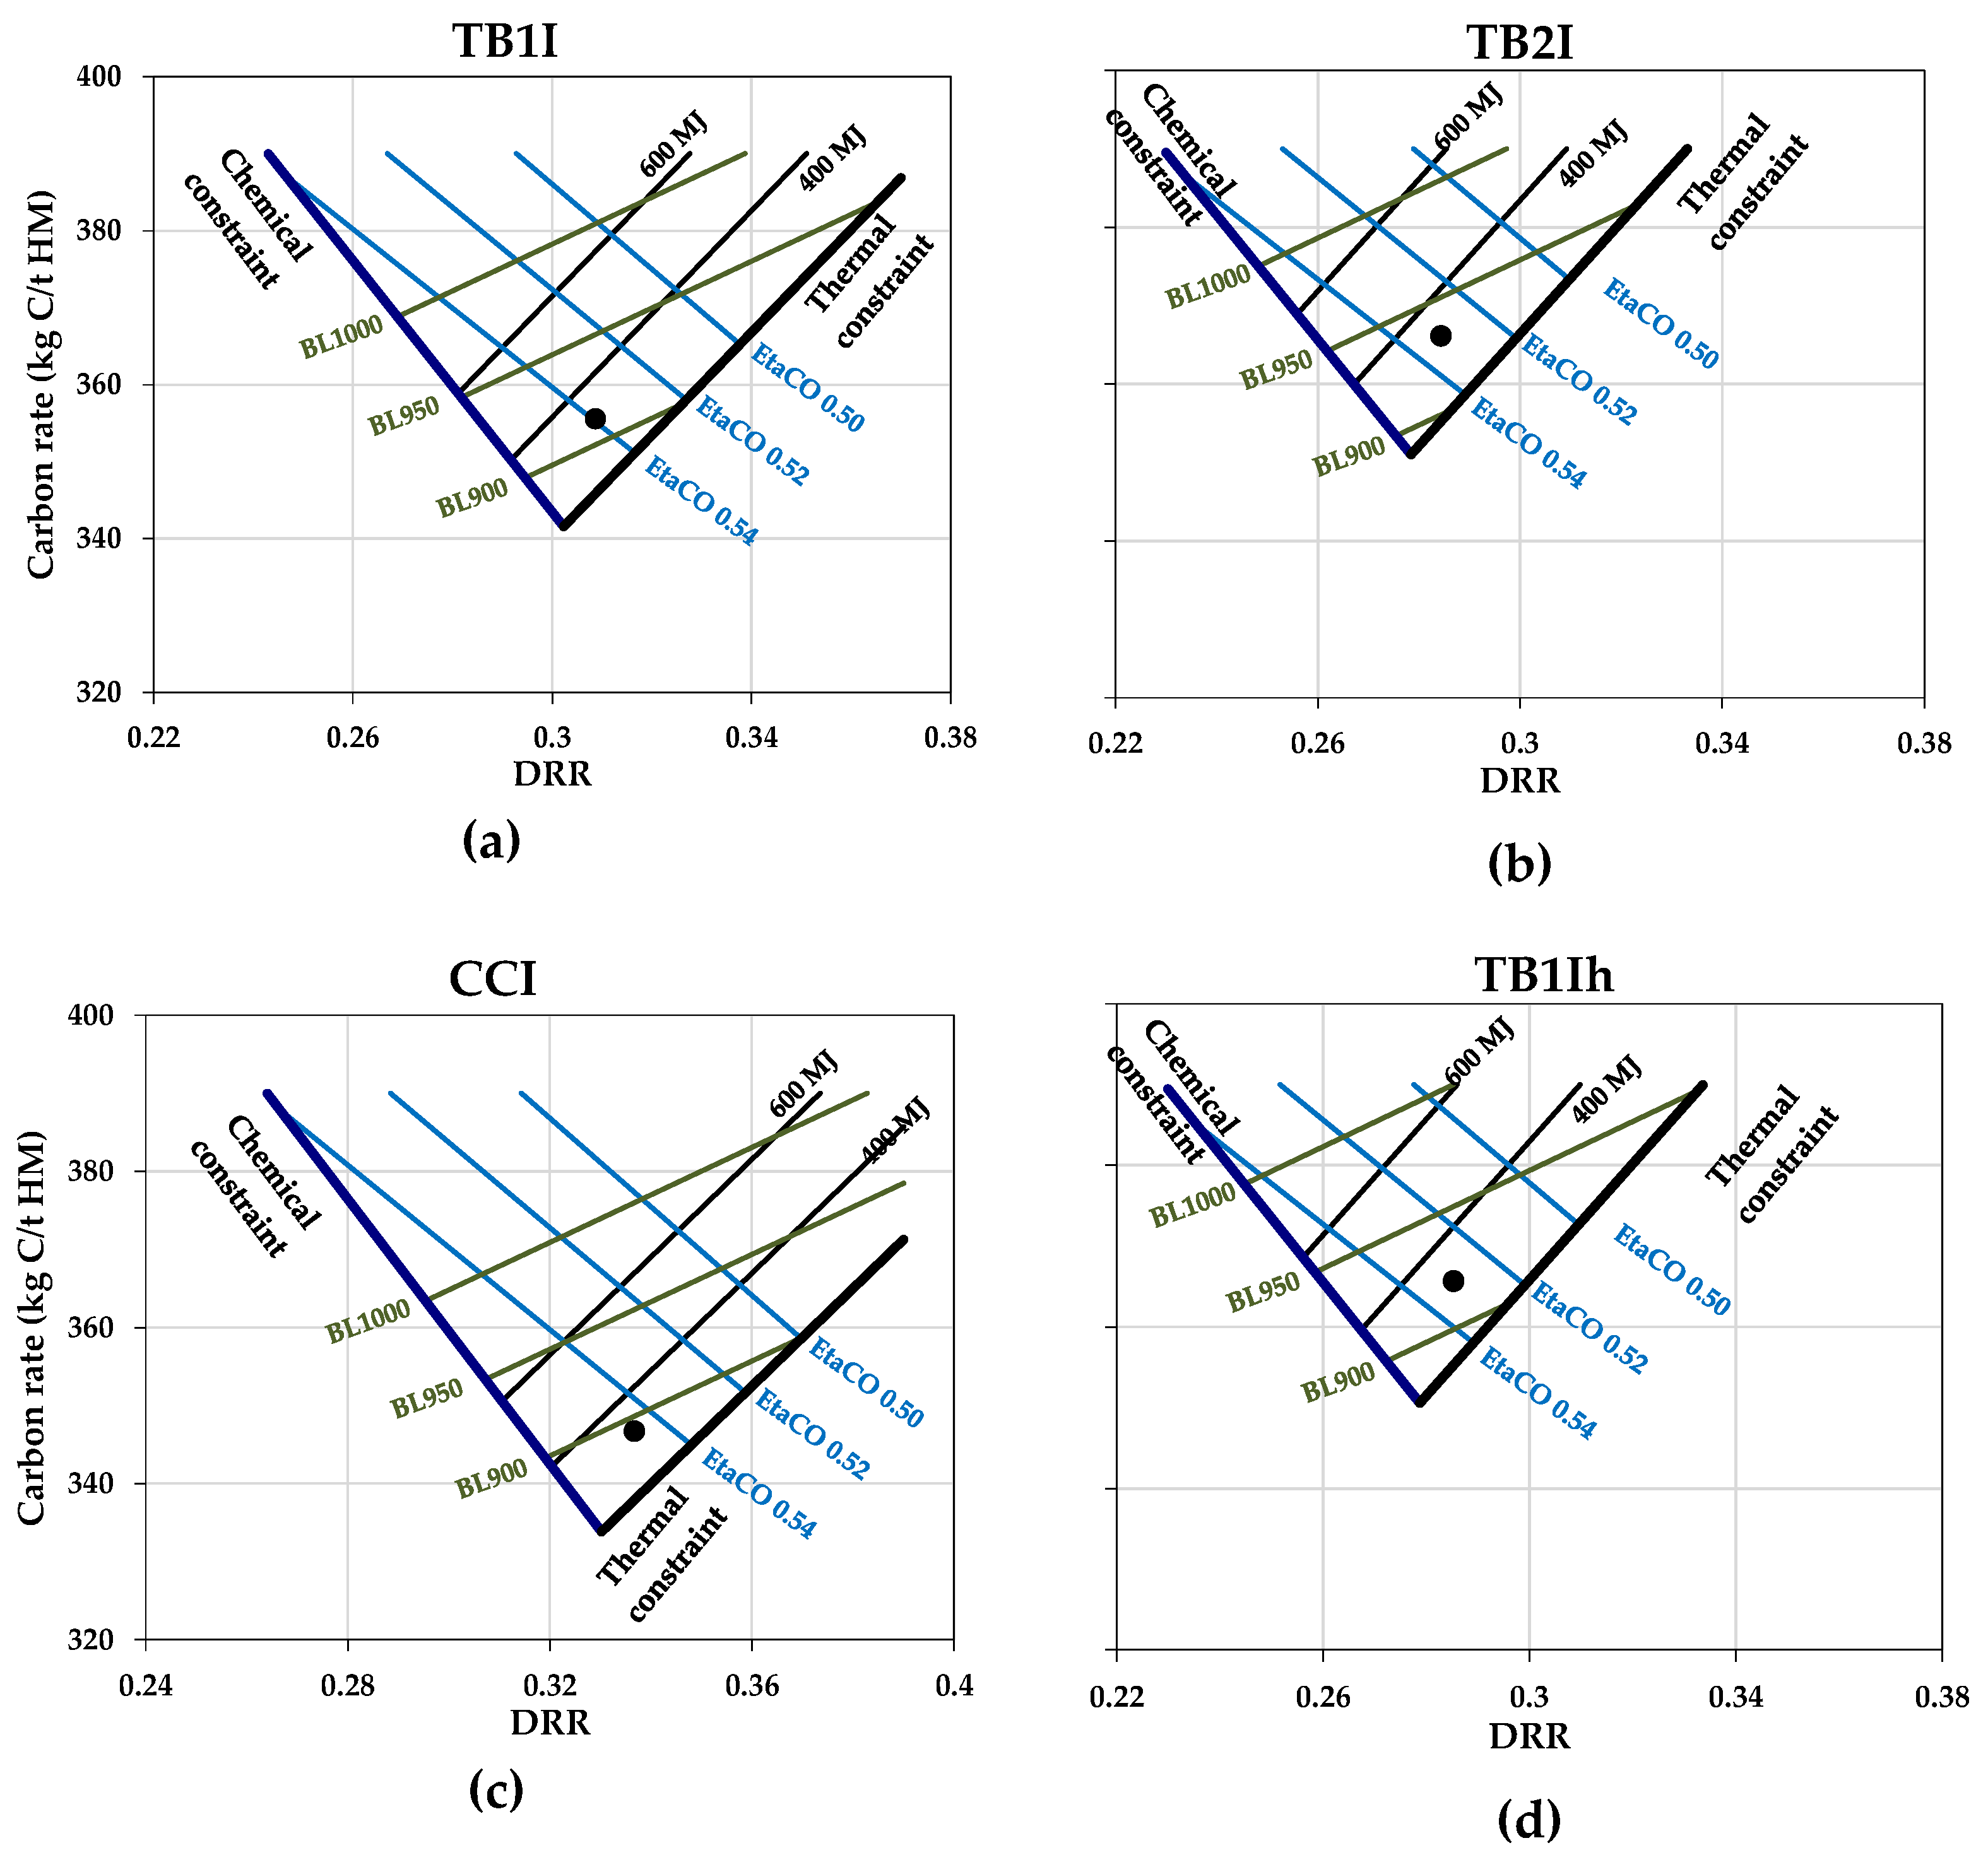
In Figure 6 CDRR diagrams of the same cases as for the RIST diagrams in Figure 5 are shown, except for the reference case, which is found in Figure 4. The operation point is located at the same distance from the heat loss lines and chemical constraint in all cases because SE and heat losses are kept constant. Comparison of Ref. (Figure 4), TB1I and TB2I (Figure 6b,c) shows that the carbon rate increases from 345 kg/tHM in Reference to 355 kg/tHM for TB1I to 366 kg/tHM for TB2I. The specific blast is increased, and this will give a higher reducing gas volume as well; subsequently, DRR decreases from 0.33 in Ref. to 0.28 in TB2I. The carbon rate for CCI (Figure 6c) is similar to Ref., with slightly higher DRR and lower carbon rate. CCT ((Figure 6e) results in lower carbon rate and blast rate, while EtaCO is increased because of lowered TRZT compared to the Ref. (Figure 4).
Comparison of TB1I&CCT ((Figure 6f with Ref. (Figure 4) shows that TB1I&CCT correspond to a higher carbon rate (354 kg/tHM) and lower DRR (0.30), while the specific blast rate (892 Nm3/tHM) is slightly lower. The TB1I&CCT involves the introduction of in total 177 kg/tHM of pre-treated biomass with almost sustained BF conditions as in the reference and therefore have the potential to significantly decrease fossil CO2 emissions in a sustainable way.

4. Discussion

A comparative evaluation of different pre-treated biomasses introduced to the BF through injection and top charging or a combination of both have been theoretically analysed. A BF model calibrated with actual BF data to get realistic performance parameters was used. The results were evaluated in detail and visualised by Rist and CDRR diagrams. When assumptions were made for the calculations these were based on the experience from operational tests on pilot and industrial scale, and some information was also deduced from literature.
The BF model was successfully calibrated with operational data, the balances closed well, which is evident from the fact that the collected process data were similar to the output data from the model, seen in Table 3 by comparing process data and Ref. This is illustrated in Figure 4, where both the process data and simulated operation point are seen in a CDRR diagram. The fact that calculated and measured data coincide in combination with closure of the balances during calibration indicates a high reliability of the collected process data. However, the model calculation results are influenced by the selected assumptions and parameter settings used. For example, in this case EtaH2 and oxygen enrichment were assumed to be constant and, based on experience, the TRZT was assumed to drop 30 °C when top charging CC. Another aspect of the assumptions and the nature of the static 1-d model is that similar conditions inside the BF is assumed by constant performance parameters, and changes to for example cohesive zone and burden permeability are not directly predicted. Moreover, complete conversion is assumed for all injected biomasses and changes to the BF due to different combustion kinetics are not considered.
The model results show that the introduction of 100–172 kg pre-treated biomass per tonne of hot metal theoretically can lower the fossil CO2 emissions with 9–34%. This can be done with limited investment costs for additional equipment at the steel plant. By combining the introduction of TB1 with top charging of CC, 172 kg of biomaterial could be introduced with high replacement of wood to PC. The resulting BF conditions were comparable with the ones for the reference case in terms of e.g., RAFT, top gas temperature, and gas efficiency. The lower need for reducing agents due to higher gas efficiency when lowering the TRZT will lower the specific blast volume. However, the physical properties of charcoal, in terms of low strength, may cause disintegration in the shaft and thus limit its use in medium-sized and large BFs.
Conversely, the injection of TB1 will result in higher gas volumes moving upward from the bosh. Top gas temperatures will increase and high gas volumes through the shaft can potentially restrict the maximum production rate, especially if the BF already operates at a production rate close to maximum. This can partly be counteracted by raising O2 enrichment of the blast.
Visualizing results in the Rist diagram shows how torrefied biomass (TB) with higher O and H content (more volatiles) impacts the BF heat balance, resulting in higher reduction gas flow and higher heat demand for the BF. Similarly, the CDRR diagrams indicate a higher heat demand through higher total carbon rate, and higher reduction gas volume is indicated by the higher specific blast in combination with higher reductant rate.
CCI provides approximately similar C input as PCI, but results in lower and different ash characteristics, resulting in minor impact on the BF conditions and lower slag rate. If CC is top charged instead, lowering of TRZT results in a higher replacement of pre-treated biomass to PC and the total reductant rate is decreased. This higher gas utilisation results in a lower top gas temperature of 81°, which can be counteracted by lowering the oxygen enrichment or by the injection of HV PC or torrefied biomass, which will contribute to higher heat flux from the lower part of the BF to the top. However, the strength of the charcoal may be an obstacle for industrial implementation. Another feasible way to introduce charcoal from the top can be in the form of an agglomerate, mainly based on in-plant residues, as studied during industrial trials in Oxelösund [15]. As this type of briquette also contains iron oxides, the effect on the TRZT may be even higher, as the ferrous oxides are in close contact with reactive carbonaceous materials. Based on the promising results, further studies are ongoing.
Operating a real BF with these biomasses would probably have resulted in operational adjustments to get feasible operational conditions, which has not been done in the simulations. For example, injection of TB2 resulted in low RAFT and high TGT, which is usually compensated by higher oxygen enrichment of the blast. Such adjustments will also to some extent control the heat flux and thereby the isotherms and position of cohesive zone. Top-charged CC resulted in low TGT, which could possibly have been compensated with decreased O2 in the blast. Further, 100% of TB1 injection using an existing injection system can be difficult to realise, as the injection plant and diameters of pipes for conveying are designed for PC. TB and CC have significantly lower density and therefore require larger equipment. Control of biomass particle size distribution is important because larger particles require longer heating time and thereby the devolatilisation and ignition is delayed [26]. High ratio of such larger particles may lower the combustion efficiency.

5. Conclusions

A comparative evaluation of introduction of pre-treated biomass to the blast furnace (BF) through injection and top charging using a BF model calibrated with actual BF data has been conducted. The following can be concluded under the assumptions made in this study.
  • The model simulations indicate that the input of pre-treated bio-coal can theoretically enable lowering of fossil CO2-emissions by 9–34%.
  • Injection of the selected type of charcoal results in minor changes in the BF conditions and results in decreased slag volume, and therefore decreased need for limestone addition, because of low content of acid ash forming oxides.
  • Injection of torrefied biomass significantly changes the conditions, resulting in lower raceway adiabatic flame temperature (RAFT), higher volumes of reducing gas and higher top gas temperatures, which limits the maximum amount possible to inject.
  • Top charging of charcoal with lowering of thermal reserve zone temperature results in higher gas efficiency, lower top gas temperature and higher RAFT.
  • By combining the two methods with opposite impact on the BF conditions theses impacts level out and an operational state quite similar to the reference conditions can be achieved. This is exemplified by combining injection of torrefied biomass with top charging of charcoal, where the contrary change in BF operating conditions evens out and resembles those of the reference case.
  • The highest reduction of fossil CO2 emissions (34%) is estimated for injection of 143 kg per tonne of hot metal of torrefied biomass and top charging of 30 kg per tonne of hot metal charcoal.
  • The slag rate and need for limestone to control the basicity at 1.07 is lower for all cases with input of pre-treated biomass.

Author Contributions

Conceptualisation, J.O. and L.S.Ö.; methodology, J.O., A.B. and L.S.Ö.; formal analysis, J.O. and L.S.Ö.; writing—original draft preparation, J.O. and L.S.Ö.; writing—review and editing, L.S.Ö. and B.B.; visualisation, J.O. and A.B. All authors have read and agreed to the published version of the manuscript.

Funding

This research was funded by CAMM (Centre of Advanced Mining and Metallurgy).

Institutional Review Board Statement

Not applicable.

Informed Consent Statement

Not applicable.

Data Availability Statement

Not applicable.

Acknowledgments

The paper is a contribution from CAMM, Centre of Advanced Mining and Metallurgy, at Luleå University of Technology, which has supported all presented research scientifically and economically. Technical support in preparing data and result evaluation by SSAB is gratefully acknowledged.

Conflicts of Interest

The authors declare no conflict of interest.

Abbreviations

VariableDescription
AOAlloying oxides SiO2, P2O5, MnO, etc.
BLBlast
BR Boudouard reaction
CCCharcoal
CCICharcoal injection
CCTCharcoal top-charging
CDRRCarbon Direct Reduction Rate
DRRDirect reduction rate
EtaGas utilisation
EtaCOEtaCO = %CO2/(%CO2 + %CO)
EtaH2EtaH2 = %H2O/(%H2O + %H2)
Eta(CO + H2)Eta(CO + H2)= (%CO2 + %H2O /(%CO2 + %CO + %H2O + %H2)
HHVHigher heating value
ΔHHeat of reaction
MASMODName of 1 dimensional static BF model used
nMoles of element (nO, nC, nH)
PCPulverized coal
RARReductant rate
SEShaft efficiency
TBTorrefied biomass
TB1I, TB2ITB injection of highly torrefied biomass 1 or lowly torrefied biomass 2
TRZThermal reserve zone
TRZ-eqInterface in TRZ where reduction gas composition corresponds to equilibrium with wüstite and metallic iron
TRZTTRZ temperature
VMVolatile matter

References

  1. Danloy, G.; Berthelemot, A.; Grant, M.; Borlée, J.; Sert, D.; van der Stel, J.; Jak, H.; Dimastromatteo, V.; Hallin, M.; Eklund, N.; et al. ULCOS-Pilot testing of the Low-CO2 Blast Furnace process at the experimental BF in Luleå. Revu De Métallurgie 2009, 106, 1–8. [Google Scholar] [CrossRef] [Green Version]
  2. Knop, K.; Hallin, M.; Burström, E. ULCORED SP 12 Concept for minimized CO2 emission. Revue De Métallurgie 2009, 106, 419–421. [Google Scholar] [CrossRef]
  3. Watakabe, S.; Miyagawa, K.; Matsuzaki, S.; Inada, T.; Tomita, Y.; Saito, K.; Osame, M.; Sikström, P.; Sundqvist Ökvist, L.; Wikström, J.-O. Operation Trial of Hydrogenous Gas Injection of COURSE50 Project at an Experimental Blast Furnace. ISIJ Int. 2013, 53, 2065–2071. [Google Scholar] [CrossRef] [Green Version]
  4. Okvist, L.S.; Hu, X.; From, L.-E.; Sandström, D.; Ölund, M.; Hirsch, A.; Mittelstädt, H.; Bolle, M.; Hensmann, M.; Möhring, S.; et al. Improved Coal Combustion under Variable BF Conditions; Final Report, EUR 29519 EN; Publications Office of the European Union: Luxembourg, 2018; pp. 111–116. ISBN 978-92-79-98296-5. [Google Scholar]
  5. Lingiardi, O.; Burrai, O.; Gomez Fuentealba, C.; Etchevarne, P.; Gonzalez, J.M. Natural gas injection at Siderar #2 Blast Furnace. Ironmak. Conf. Proc. 1999, 58, 135–142. [Google Scholar]
  6. Starshinov, B.N.; Korwlnikov, I.V.; Sinitskii, V.I.; Laverentev, M.L.; Sinitskii, V.D. Blast-Furnace operation with the addition of natural gas to the blast. Trans. Metall. 1961, 7, 4–8. [Google Scholar] [CrossRef]
  7. Agarwal, J.C.; Brown, F.C.; Chin, D.L.; Stevens, G.S. Results from ultra high rates of natural gas injection into the blast furnace at ACME steel company. In Proceedings of the ICSTI Ironmaking, Toronto, ON, Canada, 22–25 March 1998. [Google Scholar]
  8. Hooey, P.L.; Bodén, A.; Wang, C.; Grip, C.-E.; Jansson, B. Design and application of a spread sheet based model of the blast furnace factory. ISIJ Int. 2010, 50, 924–930. [Google Scholar] [CrossRef]
  9. Ueda, S.; Watanabe, K.; Yanagiya, K.; Inoue, R.; Ariyama, T. Improvement of reactivity of carbon iron ore composite with biomass char for blast furnace. ISIJ Int. 2009, 49, 1505–1512. [Google Scholar] [CrossRef] [Green Version]
  10. Kasai, A.; Matsui, Y. Lowering the Thermal Reserve Zone Temperature in Blast Furnace by Adjoining Carbonaceous Material and Iron Ore. ISIJ Int. 2004, 44, 2073–2078. [Google Scholar] [CrossRef]
  11. Kasai, A.; Toyota, H.; Nozawa, K.; Kitayama, S. Reduction of Reducing Agent in Blast Furnace Operation by Carbon Composite Iron Ore Hot Briquette. ISIJ Int. 2011, 51, 1333–1335. [Google Scholar] [CrossRef] [Green Version]
  12. Marques, M.B.; Assis, A.R.; Dias, S.M.B.; Araujo, F.H.; De Andrade, F.C.; Dos Santos, R.J. Co-Injection of Natural Gas, Charcoal Fines and Pulverized Coal in the Arcelormittal Monlevade Blast Furnace “A”. Technol. Metal. Mater. Min. 2011, 20110912, 544–554. [Google Scholar]
  13. Ökvist, L.S.; Brandell, C.; Lundgren, M. Impact of activated nut coke on energy efficiency in the blast furnace. In Proceedings of the Aistech 2014, Indianapolis, IN, USA, 3–8 May 2014. [Google Scholar]
  14. Lundgren, M.; Sundqvist Ökvist, L.; Brandell, C. Development of nut coke activation for energy efficient blast furnace operation. In Proceedings of the AisTech/ICSTI, Cleveland, OH, USA, 4–7 May 2015. [Google Scholar]
  15. Mousa, E.; Lundgren, M.; Sundqvist Ökvist, L.; From, L.E.; Robles, A.; Hällsten, S.; Sundelin, B.; Friberg, H.; El-Tawil, A. Reduced Carbon Consumption and CO2 Emission at the Blast Furnace by Use of Briquettes Containing Torrefied Sawdust. J. Sustain. Metall. 2019, 5, 391–401. [Google Scholar] [CrossRef] [Green Version]
  16. Nishioka, K.; Ujisawa, Y.; Inada, T. Effect of Large Quantity of Ferrocoke Charging on Reduction of Reducing Agent Rate of Blast Furnace. Tetsu-to-Hagané 2014, 100, 1347–1354. [Google Scholar] [CrossRef] [Green Version]
  17. Ökvist, L.S.; Jansson, B.; Hahlin, P. Effect of coal properties, injection rate and O2 addition on BF conditions. In Proceedings of the ICSTI, Osaka, Japan, 26–30 November 2006. [Google Scholar]
  18. Sundqvist Ökvist, L.; Lagerwall, P.; Sundelin, B.; Orre, J.; Brämming, M.; Lundgren, M. Low CO2 ironmaking in the blast furnace: Roheisenerzeugung im Hochofen mit niedrigen CO2 Emissionen. Stahl Und Eisen 2017, 137, 29–37. [Google Scholar]
  19. Ng Wing, K.; Giroux, L.; MacPhee, T.; Todoschuk, T. Combustibility of Charcoal for Direct Injection in Blast Furnace Ironmaking; Association for Iron & Steel Technology: Warrendale, PA, USA, 2012. [Google Scholar]
  20. Spanlang, A.; Wukovits, W.; Weiss, B. Development of a Blast Furnace Model with Thermodynamic Process Depiction by Means of the Rist Operating Diagram. Chem. Eng. Trans. 2016, 52, 973–978. [Google Scholar]
  21. Bhattacharya, A.; Muthusamy, S. Static Heat Energy Balance Mathematical Model for an Iron Blast Furnace. Int. J. Miner. Process. Extract. Metall. 2017, 2, 57–67. [Google Scholar] [CrossRef] [Green Version]
  22. Ryman, C.; Grip, C.-E.; Franck, P.-Å.; Wikström, J.-O. Similarities between pinch analysis and classical blast furnace analysis methods—Possible improvement by synthesis. In Proceedings of the 1st International Green Energy Conference, Waterloo, ON, Canada, 12–16 June 2005. [Google Scholar]
  23. Ökvist, L.S.; Lundgren, M.; Hyllander, G.; Hensmann, M.; Olsson, E.; Antila, O.; Schuster, S. Injection of Alternative Carbon Containing Materials into the Blast Furnace. In Proceedings of the TMS 2012 141st Annual Meeting & Exhibition, Orlando, FL, USA, 11–15 March 2012. [Google Scholar]
  24. Ökvist, L.S.; Hyllander, G.; Olsson, E.T.; Wikström, J.-O. Injection of pulverized materials into the blast furnace raceway. In Proceedings of the 6th ICSTI, Rio de Janerio, Brazil, 14–17 October 2012. [Google Scholar]
  25. Flexible Production of Coke Using Alternative Coals, Effects on Coke Properties under Blast Furnace Conditions, Coordination of Application on Cooperation with Colleague; 2012: FLEXCOKE (RFSR-CT-2013-00001); Publications Office of the European Union: Luxembourg, 2012.
  26. Sundqvist Ökvist, L.; From, L.-E.; Ölund, M.; Orre, J.; Sundelin, B.; Ahmed, H. Lowering of CO2 Emissions at the BF by Using Bio-coal—Theoretical and Practical Possibilities and Limitations. In Proceedings of the AISTech 2018, Philadephia, PA, USA, 10 May 2018. [Google Scholar]
  27. Orre, J.; Sundqvist, L.; Brämming, M.; Sundelin, B.; Lagerwall, P.; Björkman, B. Modelling of blast furnace process modification for lowering CO2 emissions from integrated steel plant. In Proceedings of the EMECR 2017, Kobe, Japan, 11–13 October 2017. [Google Scholar]
  28. IEAGHG Iron and Steel CCS Study (Techno-Economics Integrated Steel Mill). Available online: http://documents.ieaghg.org/index.php/s/P3rYI5vSh80SPM7 (accessed on 4 December 2020).
  29. Rist, A. Analogue Diagrams for Process Metallurgists. ISIJ Int. 1992, 32, 1034–1043. [Google Scholar] [CrossRef] [Green Version]
  30. Nakatani, F.; Mukai, T.; Nakamura, F. Theoretical consideration on blast furnace coke ratio. Trans. ISIJ 1966, 6, 263–280. [Google Scholar] [CrossRef] [Green Version]
  31. Rist, A.; Meysson, N. A dual graphic representation of the blast-furnace mass and heat balances. J. Metals 1967, 50–59. [Google Scholar] [CrossRef]
  32. Kundrat, D.M. Development of an Analytical Equation for Calculation of the Blast Furnace Fuel Rate. Metall. Trans. B 1986, 17B, 705–724. [Google Scholar] [CrossRef]
  33. Kundrat, D.M.; Miwa, T.; Rist, A. Injections in the Iron Blast Furnace: A Graphics Study by Means of the Rist Operating Diagram. Metall. Trans. B 1991, 22B, 363–383. [Google Scholar]
  34. Roine, A. HSC Chemistry® [Software]; Outotec: Pori, Finland, 2018; Available online: www.outotec.com/HSC (accessed on 15 December 2020).
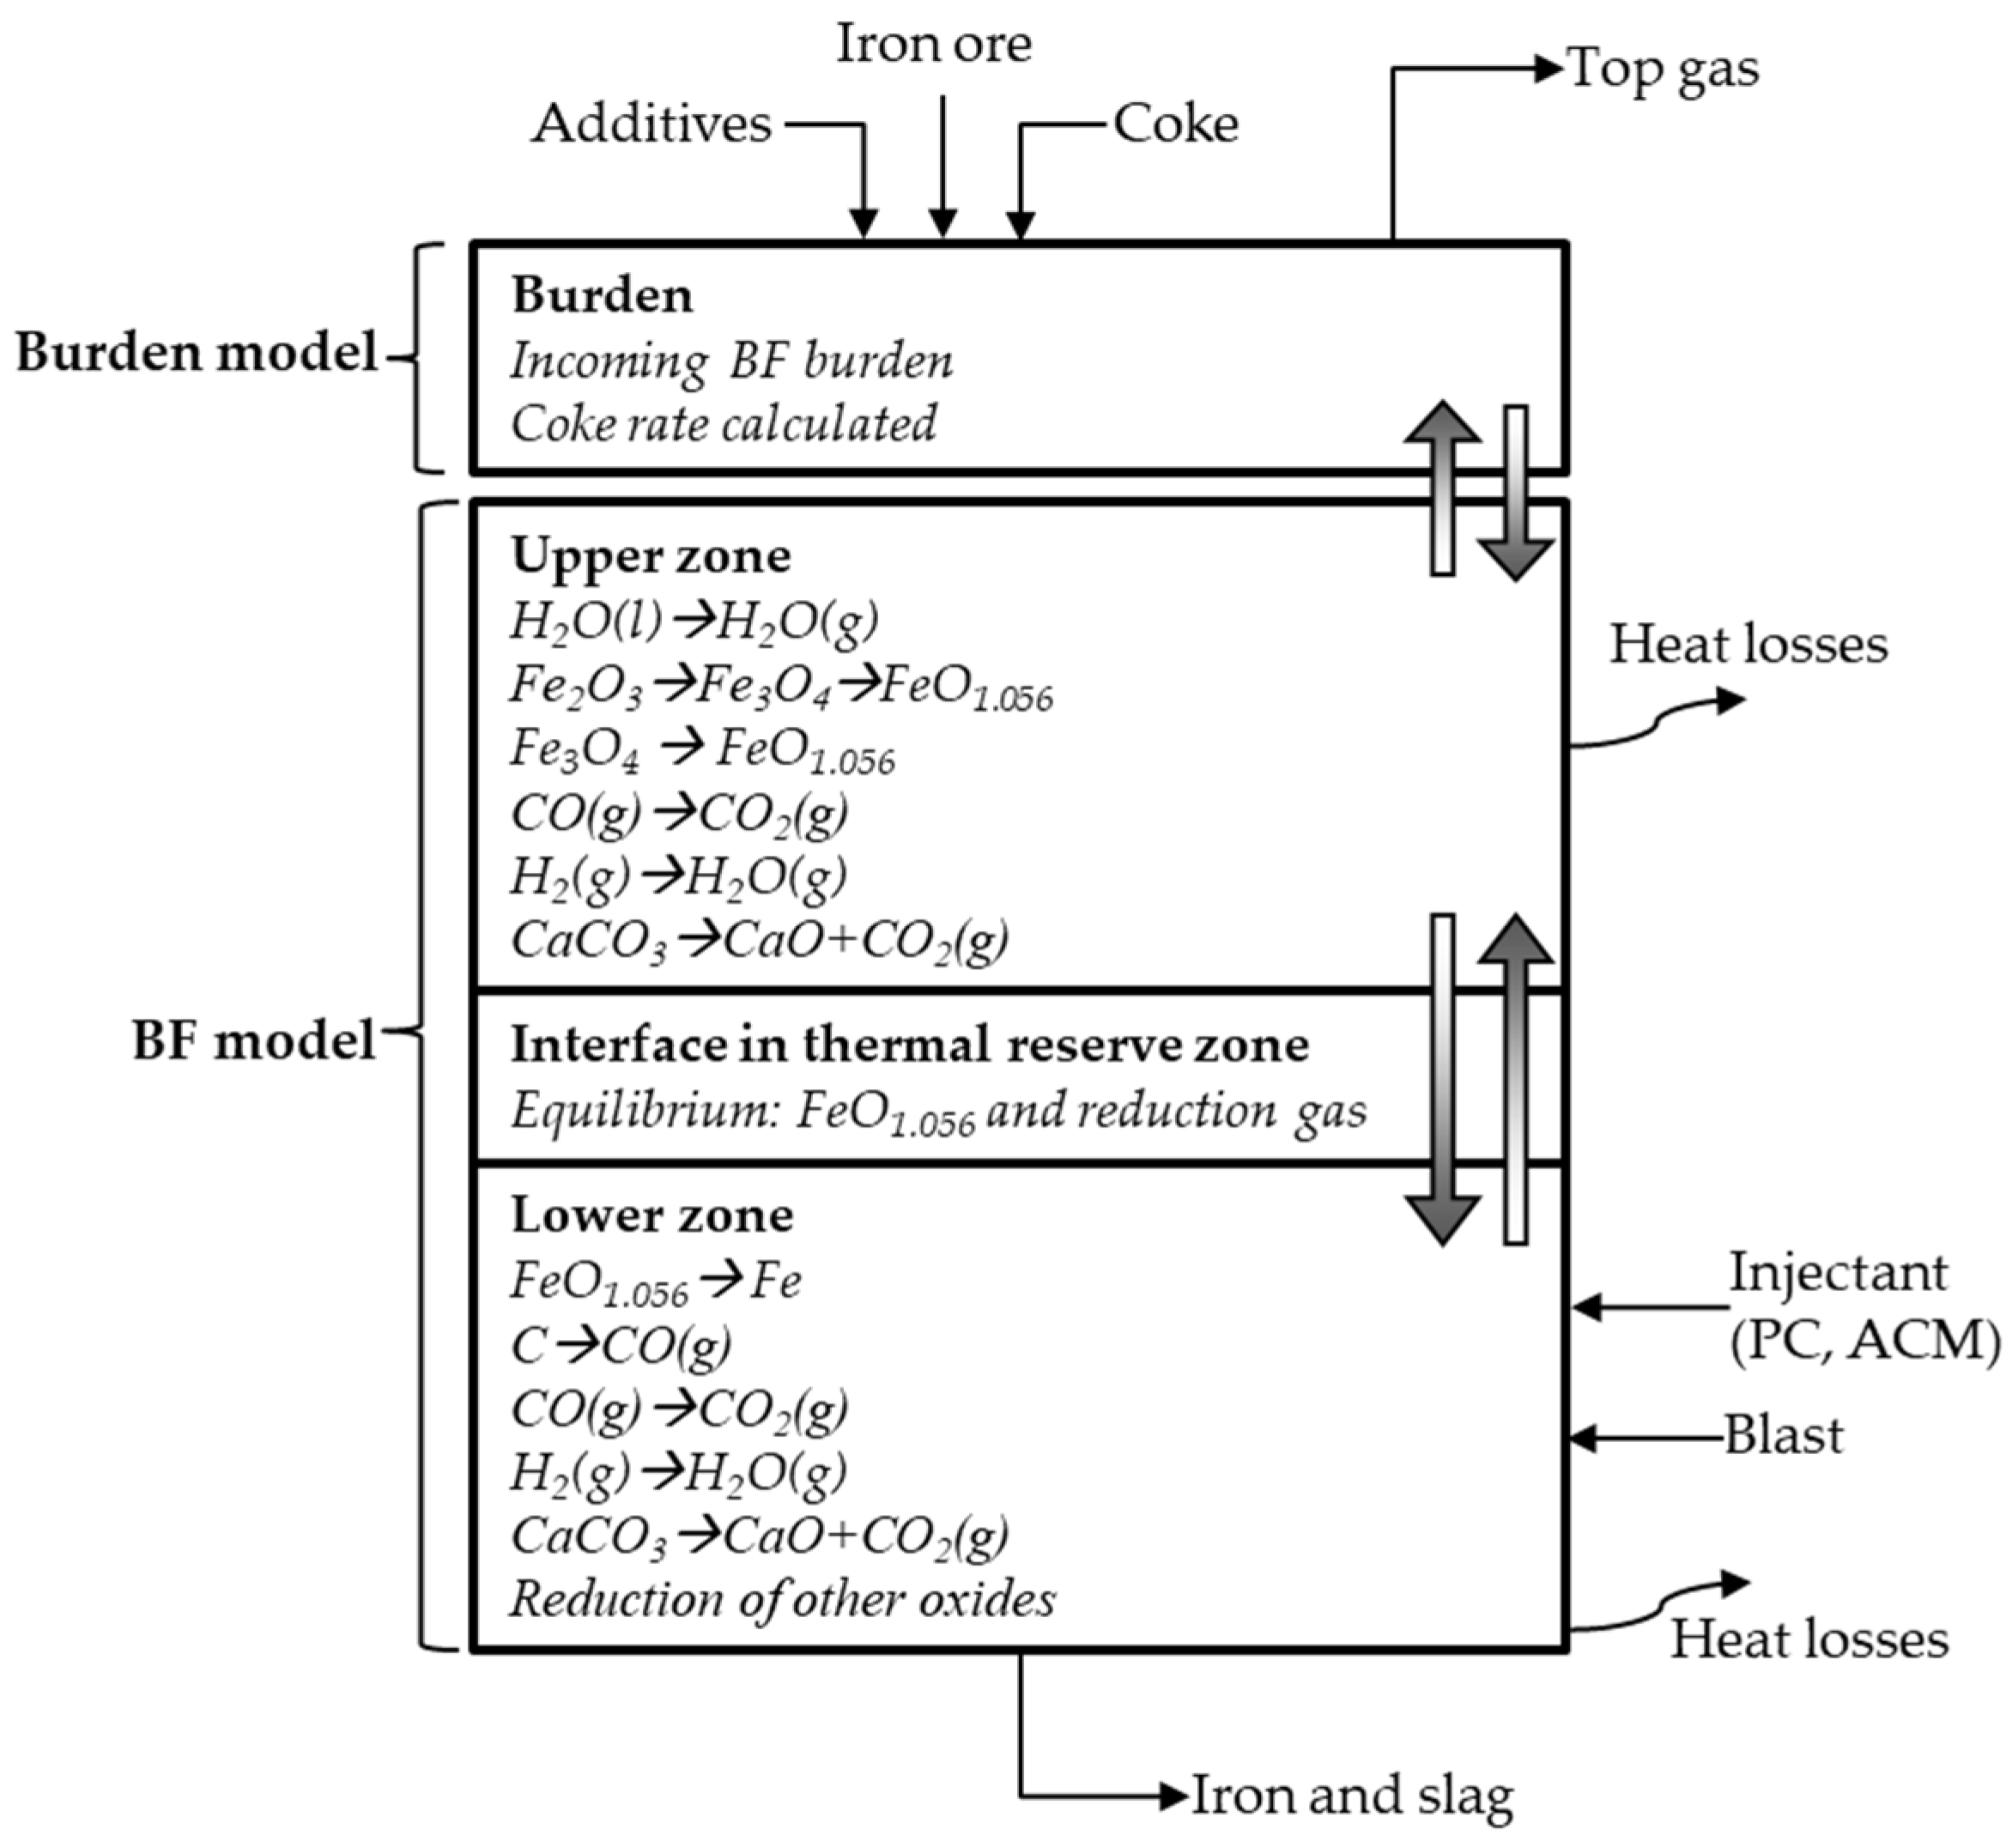
Figure 1. Schematic representation of blast furnace (BF) as described by MASMOD [18].
Minerals 11 00157 g001
Figure 2. Baur-Glaessner diagram, Fe-O-C (full) and Fe-O-H (dotted) equilibrium curves with superimposed Boudard curve, based on thermodynamic data from HSC Chemistry version 8.2. [34] Lines (1) and (2) show % CO/(CO + CO2) at equilibrium FeO + CO = Fe + CO2 for 800 and 1000 °C.
Minerals 11 00157 g002
Figure 3. Carbon direct reduction rate (CDRR) diagram from MASMOD.
Minerals 11 00157 g003
Figure 4. CDRR diagram of the reference case.
Minerals 11 00157 g004
Figure 5. Rist diagrams of (a) TB1I, TB2I and CCI, (b) Ref., CCT and TB1I and CCT including zoomed section.
Minerals 11 00157 g005
Figure 6. CDRR diagram of: (a) TB1I; (b) TB2I; (c) CCI; (d) TB1Ih; (e) CCT; (f) TB1I & CCT.
Minerals 11 00157 g006aMinerals 11 00157 g006b
Table 1. Analysis of used reductants for injection and top charging, VM = volatile matter, HHV = higher heating value.
UnitPCTB1TB2Charcoal
C% wt.82705787
H% wt.4.155.83.4
N% wt.2.20.10.10.25
O% wt.3.92436.78.3
S% wt.0.280.010.010.01
Ash% wt.7.80.90.40.85
Volatiles% wt.21507412
C fix% wt.71492687
H2O% wt.0.51.21.21.2
HHVMJ/kg32282333
Ash Composition
SiO2% wt.498.67.020
Fe2O3% wt.112.71.73.1
Al2O3% wt.351.61.89.4
CaO% wt.12275629
MgO% wt.4.45.38.18.1
Table 2. Case descriptions.
NameDescription
Ref.Reference case
TB1IInjection of 100 kg/tHM highly torrefied biomass
TB2IInjection of 100 kg/tHM lowly torrefied biomass
CCIInjection of 100 kg/tHM charcoal
TB1IhInjection of TB1 to replace all PC
CCT30 kg/tHM of top-charged CC, 30 °C lower TRZ temperature
TB1I & CCT30 kg top-charged CC, injection of TB1 to replace all PC
Table 3. Process data, assumed inputs and calculated data, calculated data in bold.
UnitProcess DataRef.TB1ITB2ICCITB1IhCCTTB1I & CCT
Pelletskg/tHM13311332133213321333133313321333
CCTkg/tHM0000003030
Cokekg/tHM309309309309309309309309
PCIkg/tHM14314370993901040
TB/CC injectionkg/tHM001001001001950142
RARkg/tHM452452479508448505443481
Slag ratekg/tHM171171163166160156167156
Limestonekg/tHM20.120.114.916.913.09.917.410.0
Basicity (B2)%CaO/%SiO21.031.071.071.071.071.071.071.07
Blast volumeNm3/tHM914905913935895921880891
Tuyere gas volumeNm3/tHM-1218128213571202134311661255
O2 enrichment%4.24.24.24.24.24.24.24.2
RAFT°C-2157203919312170193722422061
Top gas temperature°C12412415317912518081124
Top gas LHVMJ/Nm33.03.03.23.33.03.32.93.1
Top gas energyGJ/tHM4.24.24.64.94.24.93.94.4
EtaCO%54.954.954.053.254.753.256.254.9
SE--0.950.950.950.950.950.950.95
TRZT°C-850850850850850820820
PC replacement ratiokg PC/kg Bio--0.730.441.040.731.300.83
Table 4. CO2 emissions and comparison with reference case.
UnitRef.TB1ITB2ICCITB1IhCCTTB1I & CCT
CO2 Biokg/tHM025820931950496462
CO2 fossilkg/tHM1272105111409578401154840
Total CO2 emissionkg/tHM1272130913491276134412501302
Δ fossil CO2%0−17−10−25−34−9−34
Δ fossilCO2kg/tHM0−221−132−315−432−118−432
Publisher’s Note: MDPI stays neutral with regard to jurisdictional claims in published maps and institutional affiliations.