Abstract
Carbonaceous reductants for pyrometallurgical applications are usually obtained from fossil-based sources. The most important properties of the reductants greatly depend on the application and the feeding of the reductant into the process. However, the mechanical strength, calorific value, fixed carbon content, and reactivity of the reductant are the properties that usually define the applicability of the reductant for different processes. The reactivity of the biochars is usually high in comparison to metallurgical coke, which may restrict the applicability of the biochar in reduction processes. One cause of the higher reactivity is the higher surface area of the biochars, which can be suppressed with agglomeration treatment, e.g., briquetting. In this work, hydrolysis lignin was used for slow pyrolysis experiments to produce biochars. The biochars were pyrolyzed in briquetted form and in as-received form at various temperatures. The reactivity values of the biochars were tested in dynamic reactivity tests in a CO-CO2-N2 gas atmosphere at temperatures of up to 1350 °C. It was found that the yield of the hydrolysis lignin char only decreased by 3.36 wt% when the pyrolysis temperature was elevated from 600 to 1200 °C, while a decrease in yield of 4.88 wt% occurred when the pyrolysis temperature was elevated from 450 to 600 °C. The mass loss of hydrolysis lignin biochar in the reactivity experiment in CO-CO2-N2 atmosphere was significantly decreased from 79.41 wt% to 56.80 wt% when the hydrolysis lignin was briquetted before the slow pyrolysis process and the temperature of the pyrolysis process was elevated from 600 to 1200 °C. This means that the mass loss of the material was suppressed by 22.61 wt% due to the higher pyrolysis temperature and briquetting process.
1. Introduction
Carbonaceous reductants in pyrometallurgical processes usually originate from fossil sources. The use of fossil-based carbonaceous reductants directly leads to formation of fossil carbon dioxide (CO2) emissions. Because of the global trend of mitigating fossil-based CO2, these materials should be replaced, at least partially, with renewable carbon. Renewable carbon or renewable carbonaceous material, in this context, means bio-based carbonaceous material that could be used for reduction purposes in pyrometallurgical processes.
The high moisture content, high volatile matter content, and bulky nature of wood-based or ligno-cellulosic biomass in general are the key properties that hinder the direct use of biomass as a fuel or as a reductant [1,2,3]. The combination of drying and a high-temperature thermal treatment is the method that can significantly improve biomass properties to meet the requirements of the target process [2,4,5,6]. The method of high-temperature thermal treatment depends on the targeted product—gasification, fast pyrolysis, and slow pyrolysis are the most common methods for maximizing the yields of gaseous, liquid, and solid products, respectively [5,7,8]. In this paper, the focus is on the slow pyrolysis of biomass, and thus the solid product, biochar.
Slow pyrolysis improves the chemical and structural properties of the biomass. Moisture is removed, thevolatile matter content is considerably decreased, and fixed carbon content is increased. According to Agirre et al., 2013 [4], the proximate chemical composition of char from fruit cutting residues is more affected by the pyrolysis temperature than the retention time.
Ghysels et al., 2019 studied the effects of different factors (highest treatment temperature (HTT), heating rate (HR), and holding time (HT)) on the quality and quantity of biochar from lignin-rich digested stillage from lignocellulosic ethanol production. Additionally, the two-way and three-way interactions between the factors and their effect on the biochar quality and quantity were analyzed and quantified through three different methods. The most conservative significant effects were obtained from the intersections of the significant effects of different methods. These effects were used further in subsequent models. According to the results, the biochar yield, the ratio of oxygen to carbon atoms (O/C) and hydrogen to carbon atoms (H/C) were the most affected by HTT in the pyrolysis of lignin-rich digested stillage. For fixed carbon yield, no significant effect was found from the intersection of the methods, thus it was concluded that the fixed carbon yield was independent of the operating conditions [9].
The main properties of a reducing agent in different processes are its strength, reactivity, and heating value. The priorities of different properties vary a lot depending of the process itself, as well as the configuration of the feeding of the reductant into the system. In the blast furnace process, for example, the main problems of substitution of metallurgical coke with charcoal are the missing mechanical strength and the excessively high reactivity of the charcoal [4]. On the other hand, the problems of using biochar as a slag foaming agent in an electric arc furnace (EAF) are related to the low apparent density and high reactivity of the biochar. These properties lead to low penetration depth and gasification and combustion reactions of the biochar on the surface of the slag layer when the biochar is injected into the process [10]. This is also the case in reduction processes where the reducing agent is injected into the process above the melt.
The reactivity of the biochar was previously connected with its surface area and porosity [11,12]. Other physical and chemical properties that are reported to affect the reactivity of the biochar include gas diffusion rates, the concentration of active sites, the hydrogen and oxygen contents, and also the possible content of persistent free radicals (EPFR) [12,13]. These properties can be, at least partially, influenced by different pre-treatment methods. In Haensel et al., 2009, the high-temperature pyrolysis of lignin at 1200 °C considerably decreased the X-ray photoelectron spectra (XPS) peak intensity values of C-O and C=O bonds in comparison to lignin pyrolyzed at 600 °C, indicating that the oxygen content of lignin decreased as the pyrolysis temperature was elevated. The UV-induced photoelectron spectroscopy (UPS) spectrum in the same research revealed that randomly oriented graphitic substructures were formed in lignin pyrolysis at 1200 °C, however the graphitization was not complete [14].
In this study, the focus is on the improvement of biomass properties in terms of using carbonized biomass, i.e., biochar, in different pyrometallurgical processes. Grinding to a specified particle size, agglomeration, and high-temperature pyrolysis were the methods used to treat the biomass. The increase of the apparent density of the biochar, improvement of the proximate chemical composition, and decreased porosity and surface area (and thus reactivity of the biochar) are the main interests.
2. Experimental Procedure
2.1. Materials
Enzymatic hydrolysis and yeast fermentation of woody biomass (soft wood) used to produce bioethanol yields a considerable amount of lignin as a side product. This hydrolysis lignin was used as a raw material in the biomass pyrolysis experiments and the produced chars were tested in reactivity tests. The hydrolysis lignin for the experiments was provided by ST1, Kajaani. Hydrolysis lignin was received with a 50–60 wt% moisture content. Lignin was dried in a heating chamber at 40 °C for 12 days until the moisture content of the material was decreased to less than 10 wt% according to standard SFS-EN 16179:en. Fossil-based nut coke was used as a reference material in the reactivity experiments, which was provided by SSAB, Raahe. Nut coke is a term used for metallurgical coke that is typically in the size range of 8–40 mm in diameter [15].
2.2. Pre-Treatment
Hydrolysis lignin was used in the experiments in powdered form or as briquettes. This was done to evaluate the effects of biomass agglomeration on the pyrolysis yield and porous structure and reactivity of the char. The particle sizes for the lignin raw material varied a lot from fine powder to agglomerates as large as 80 mm in diameter. Therefore, the material was ground and sieved to a particle size of less than 0.5 mm before briquetting. The briquetting of the lignin was performed with a hydraulic press and a press mold, as presented in Figure 1. The compressive force used in briquetting was 10 kN and the compression time was 20 s. The compression resulted in mini-briquettes of approximately 8 mm in diameter, 9 mm in height, and 0.5 g in weight. The lignin that was tested in powdered form was ground to a particle size of less than 0.5 mm in diameter after the pyrolysis. Demirbas, 2004 [16] reported that a smaller particle size of a biomass results in a lower yield in pyrolysis. Therefore, the biochar was ground after the pyrolysis in the case of fine powder to homogenize the material.
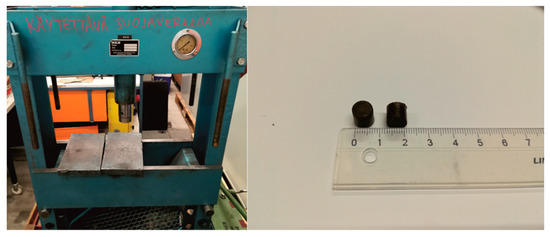
Figure 1.
Hydraulic press and lignin briquettes.
2.3. Slow Pyrolysis
The pyrolysis of the hydrolysis lignin was performed in a Nabertherm HT08/18 chamber furnace (Nabertherm GmbH, Lilienthal, Germany). The dimensions of the furnace were 150 × 150 × 300 mm (height × width × depth). Hydrolysis lignin was packed in a graphite crucible with a height of 59 mm and inner diameter of 54 mm and covered with a graphite lid. The graphite crucible was further placed into a corundum crucible with an inner diameter of 92 mm and height of 97 mm. The empty space of the corundum crucible was filled with synthetic graphite powder (MDL number: MFCD00144065, Alfa Aesar, Thermo Fisher Gmbh, Kandel, Germany) and the corundum crucible was shielded with a spinel lid. Nitrogen (N2) was used as an inert gas in the slow pyrolysis with a flow rate of 1 L/min. The heating rate in the chamber furnace was 5 °C/min to the final pyrolysis temperature, after which the samples were held at the final temperature for 8 h. A relatively low heating rate and long residence time were chosen to prevent insufficient pyrolysis of the bigger particles of the lignin feedstock [17]. No quenching was used but the samples were freely left to cool to room temperature (~25 °C). Three different final temperatures were used in the experiments: 450 °C, 600 °C, and 1200 °C. The pyrolysis was replicated three times at each pyrolsysis temperature. The final temperatures were chosen based on the behavior of lignin under thermal treatment. Lignin has a broad decomposition stage from 200 °C to 550 °C, after which the aromatic clusters (mainly phenols) begin to re-organize through cross-linking reactions [17]. The structure re-organization continues, and at 1200 °C even graphitic substructures from lignin structure have been observed [14].
2.4. Thermo-Gravimetric Analysis and Mass Spectrometry
Thermo-gravimetric analysis (Netzsch STA 449 F3 Jupiter thermo-gravimetric analyzator, TGA, Netzsch-Gerätebau GmbH, Selb, Germany) coupled with mass spectrometry using a Netzsch QMS 403 C quadrupole mass spectrometer (Netzsch-Gerätebau GmbH, Selb, Germany) was performed to analyze the different stages of lignin pyrolysis and to define the gaseous components released from lignin during the pyrolysis. The sample size in each experiment was approximately 400 mg. Because the aim was to analyze the slow pyrolysis process, the heating program was defined according to actual pyrolysis, with the heating ramp being 5 °C/min and final temperature being 1200 °C. The only difference in the program was that no holding time at the final temperature in the thermo-gravimetric analysis was applied. Additionally, instead of using N2 as an inert gas, argon (Ar) was chosen in thermo-gravimetric analysis experiments. This was done to prevent overlapping of spectra at the m/z value of 28 because the N2 signal would have been dominant at that m/z value in mass spectrometer (MS) analysis. The other gas components that correspond to the same m/z signal are ethylene (C2H4) and carbon monoxide (CO). The gas flow in the experiment was 60 mL/min. The MS scanning width was 100, ranging from m/z 0 to 100. The scanning time was 55 s for each scan. National Institute of Standards and Technology (NIST) Chemistry Webbook was used as a preliminary guide to identify different gas species from the mass spectrum signals, however the results were also compared with those previously reported in the literature.
2.5. Proximate Analysis of the Samples
The proximate analysis of the biochar and nut coke samples was done with the TGA device used in the thermogravimetric analysis and by mass spectrometry of slow pyrolysis. The program used to determine the moisture content, volatile matter, and ash content was designed from the basis of the program reported in Cassel and Menard, 2012 [18]. The program is presented in Figure 2. N2 was used as an inert gas in the experiments at a flow rate of 200 mL/min until the volatile matter content was determined at 950 °C. After determination of the volatile matter content, the protective gas flow rate was decreased to 20 mL/min and air flow was elevated from 0 to 180 mL/min to determinate the ash content. At this stage, the temperature was kept constant at 950 °C. The sample mass in the experiments was approximately 200 mg.
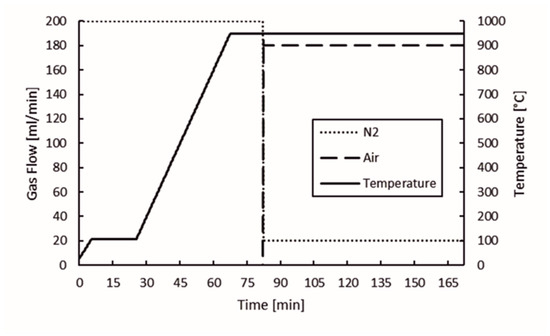
Figure 2.
Proximate analysis experimental program.
2.6. Apparent Density Measurements
The apparent densities of the briquetted chars and lignin were measured using the slide gauge (micrometer) method [19]. The height and diameter of regularly shaped, cylindrical samples was measured from four different locations. Based on the measurement results, the average height and diameter was calculated. The samples were weighed with an analytical balance and the density was calculated based on the results.
2.7. Specific Surface Area (SSA), Pore Volume, and Pore Size Distribution
To determine the specific surface area (SSA), pore size distribution, and pore volume, ASAP 2020 and 3Flex physisorption instruments by Micromeritics Instruments Corporation, Georgia, USA, were used. Portions of each sample (100–200 mg) were degassed at low pressure (in the range of 2 to 50 µmHg) and at a temperature of 140 °C for 3 h to clean the surfaces and remove any adsorbed gas. N2 was used as an adsorptive gas to measure the sample isotherms. The instrument measured the volume of N2 adsorbed on the surfaces of the biochar and nut coke samples at different relative partial pressures and under constant cryogenic conditions (−196 °C). The SSA was calculated using the BET algorithm [20], while the pore size distribution, according to IUPAC notation (micropores < 2 nm, mesopores 2 nm < 50 nm, macropores > 50 nm) [21], was calculated using the DFT model, assuming slit-like pores [22,23].
2.8. Dynamic Reactivity Tests
Dynamic reactivity tests of the biochars and nut coke were performed using the Netzsch STA 449 F3 Jupiter thermogravimetric analyzer. The temperature was elevated linearly from 30 °C to 1350 °C at a heating rate of 10 °C/min. The gas composition was kept constant throughout the whole experiment for 25, 25, and 50 volumetric percentages of CO, CO2, and N2, respectively. The gas flow throughout the experiments was 100 mL/min. The sample mass was approximately 200 mg. No holding time was applied at the final temperature of the experiment. The conditions for the experiments were chosen on the grounds of previous research on coke and biochar reactivity at high-temperatures [24,25,26,27]. The gasification reactions for biochar and coke are controlled by different factors at different temperatures and gasification stages [25,26]. In this work, non-isothermal reactivity tests were chosen for investigation of the reactivity of hydrolysis lignin chars and nut coke across a wide temperature range.
3. Results and Discussion
3.1. Hydrolysis Lignin
The ultimate and proximate analysis results for dried hydrolysis lignin are presented in Table 1. The analysis was performed according to existing standards. The amount of fixed carbon was determined by subtracting the percentages of ash content and volatile matter from a total of 100%. The analysis results for nut coke were not available. As can be seen from the Table 1, dried hydrolysis lignin has a high volatile matter content and low ash content. The relatively low fixed carbon content is a result of the high volatile matter content. The volatile matter content mainly results from the high oxygen content of the hydrolysis lignin, i.e., the gaseous product of lignin pyrolysis is oxygen-rich. In comparison to the typical nut coke composition, the hydrolysis lignin composition is very different. Coke typically has higher fixed carbon and ash contents but significantly lower volatile matter content [28,29].

Table 1.
Chemical properties of hydrolysis lignin. d. b.: dry basis.
3.2. Char and Nut Coke Properties
Lignin char yields are presented in Figure 3. “LIG” refer to raw material hydrolysis lignin, “BR” refers to briquette, and the number in the suffix stands for the final temperature in the pyrolysis process. According to results, briquetting before pyrolysis does not have considerable impact on the char yield. On the other hand, temperature of the pyrolysis process can be observed to have more significant impact on the char yield than briquetting. The drop in char yield is higher when elevating the pyrolysis temperature from 450 to 600 °C than when elevating the temperature from 600 to 1200 °C. This can be explained by the broad lignin decomposition stage starting from 200 °C and ending approximately at 550 °C. This is the temperature range in which most of the oxygen-containing compounds and a large portion of the hydrogen-containing compounds are released from lignin. After the decomposition stage, the aromatic clusters start to combine with each other via cross-linking reactions [17].
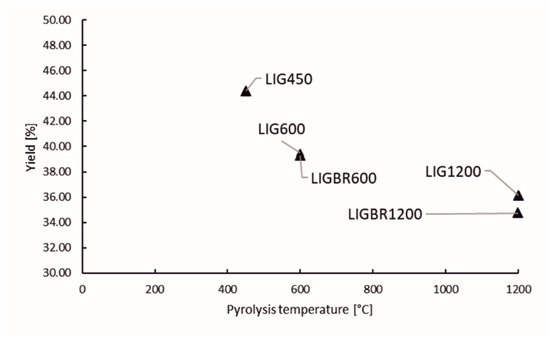
Figure 3.
Yield of lignin chars.
Cao et al., 2013 [30] reported on the changes in lignin functional groups at high temperatures using TGA and Fourier-transform infrared (FTIR) spectrometry. They found out that as the temperature further increases from 500 to 900 °C, the bonds of benzene groups break and new aromatic groups are formed. The disappearance of C-H-bonds began gradually after 800 °C, indicating the formation of macromolecular aromatic clusters.
As the temperature was further elevated to 1000 and 1200 °C, the hydroxyl (O–H) peak in the FTIR spectrometry almost completely disappeared, as did the peak for C=C bonds. The peak for C=C–O bonds was also significantly reduced at 1200 °C. The reduction of C=C–O bonds and disappearance of C=C is explained by the conjugation of these with phenyl groups. Meanwhile, the release of CO, CO2, and CH4 was detected in the product gas. This indicates the depletion of aromatic bonded oxygen with a decrease of phenols and carboxyl carbons in the char structure. The structure of lignin at this stage is suggested to be between amorphous and graphitic carbon [30].
Based on the literature and char yields presented in Figure 3, it can be stated that at higher temperatures above 550 °C, there is only slight volatile release, however the high temperature has a great impact on carbon structure reformation of lignin char [17,30].
The results of proximate analysis of lignin chars and nut coke are presented in Table 2. As can be observed, the volatile matter content of the lignin char is decreased as the pyrolysis temperature is elevated. This directly affects the fixed carbon content of the chars, i.e., the amount of fixed carbon is increased as the pyrolysis temperature is elevated. The comparison between lignin and nut coke suggests that chars pyrolyzed at temperatures of 600 °C and higher have higher fixed carbon contents than fossil-based nut coke. The volatile content of all the lignin char samples is higher than of nut coke, while nut coke has considerably higher ash content. Additionally, the density of the briquetted lignin chars is listed to the Table 2. The density was slightly increased through pyrolysis at 600 °C (LIGBR600), however the increase was more significant as the pyrolysis temperature was elevated to 1200 °C (LIGBR1200). In comparison to lignin chars reported by Toloue Farrokh et al., 2018, the briquetted chars had significantly higher apparent density [17]. The apparent density of metallurgical coke varies depending on the size fraction, location in the coke oven, and chemical composition of the coal blend, but usually the reported particle density of coke is approximately 1000 kg/m3 [31].
Table 2.
Proximate analysis of lignin chars and nut coke. d. b.: dry basis.
3.3. Behavior of Hydrolysis Lignin in Slow Pyrolysis
The mass loss and mass loss rate of hydrolysis lignin during pyrolysis in the temperature range of 28–1200 °C is presented in Figure 4. The left y-axis corresponds to the mass percentage during pyrolysis, right y-axis is the mass loss rate of the sample, and the x-axis is the temperature. Vertical dashed lines represent the start and end of the degradation stage. The threshold mass loss rate up until the degradation stage was determined based on the data set. The resulting 0.15%/min mass loss rate was the threshold. According to the chosen threshold, the mass loss rate at the beginning of the degradation stage was determined to be 168 °C, while at the end of degradation stage was 572 °C. In Figure 4, the chosen degradation stage looks correct based on the behavior of thermo-gravimetric (TG) and first derivative of the TG (DTG) curves. This is also in-line with previous studies concerning the behavior of lignin under thermal treatment [17,32,33,34]. This is the stage where most of the volatile matter, condensable gas, and non-condensable gas is released.
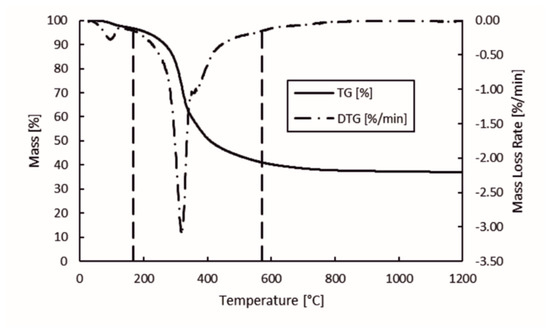
Figure 4.
Mass loss and mass loss rate of hydrolysis lignin in pyrolysis.
The gas components of the hydrolysis lignin pyrolysis product gas were analyzed with MS connected to TGA. The mass spectra is presented in 3D in Figure 5 and Figure 6. Even though the scan width ranged from m/z values of 0 to 100 (Figure 5), the species in pyrolysis gas were identified between the m/z values of 0 and 45 (Figure 6). This was done for two reasons: the signal intensities were highest in this range and there was less overlapping of different compounds at the same m/z values. However, even in the chosen m/z range, there are various fragmentation ions that may correspond to the one m/z signal, including m/z 16 for O+ in water and for CH4+ in methane; m/z 17 for OH+ and NH3+; m/z 28 for N2+, CO+, and C2H4+; and m/z 44 for CO2+ and C2H4OH+. The m/z signal of 32 could be identified to oxygen (O2), methanol (CH4O), or hydrazine (N2H4); and the m/z signal of 36 to hydrogen chloride (HCl) or methanol-D4, which is an isotopologue of methanol, with each hydrogen atom having an extra neutron. These compounds were determined according to the NIST Chemistry Webbook. The m/z value of 36 could also correspond to tricarbon (C3), which is reported to be a transient species in lignin degradation, as it is cleaved from the benzene ring to obtain saturated or unsaturated hydrocarbons. According to signal intensities as functions of temperature, as presented in Figure 7, tricarbon could be the most probable compound to correspond to the m/z value of 36.
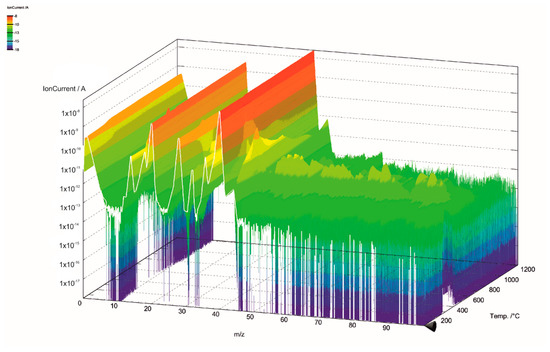
Figure 5.
Mass spectra of lignin pyrolysis product gas in the m/z range of 0–100.
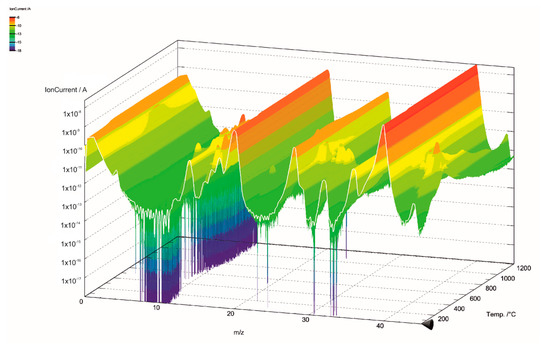
Figure 6.
Mass spectra of lignin pyrolysis product gas in the m/z range of 0–45.
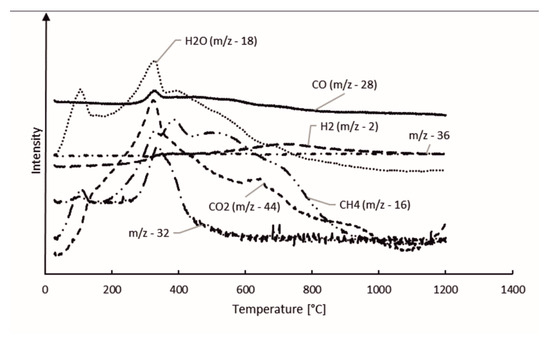
Figure 7.
Hydrolysis lignin pyrolysis products.
As can be observed in Figure 7, the m/z value of 18 was identified as water (H2O). The m/z signal of 17 (not shown in the Figure 7) was identical to the m/z signal of 18 but with lower intensity, and therefore was also identified as H2O. H2O degrades at two stages, peaking at 106 and 330 °C. The results suggest that the water formation is not only based on the volatilization of the free moisture of the material, but is also formed from degradation of oxygen-containing functional groups [35]. Together with CO2, water is reported to account for the major part of the oxygen elimination from biomass [35]. The CO2 signal (m/z 44) also peaks at 330 °C, however the signal intensity does not decrease as fast as the signal for H2O, and formation of CO2 can even be observed at 900–1000 °C. The CO signal (m/z 28) intensity steadily decreased throughout the pyrolysis process. This is in-line with the previous TG-FTIR studies by Cao et al., 2013, who reported FTIR signals for CO, CO2, and CH4 in lignin pyrolysis product gas at 1200 °C [30]. The CH4 signal (m/z 16) in our study had the highest peak at 330 °C, followed by two less-intense and broader peaks at 387 and 501 °C. The H2 signal (m/z 2) intensity slowly evolved during the pyrolysis, having the highest intensity at 716 °C. This result is in-line with the literature [19].
3.4. Surface Area and Porosity of the Chars and Nut Coke
The specific surface area (SSA) of the chars is presented in Figure 8. The pore volume and size distribution of the pores of the samples are presented in Figure 9a,b, respectively. The y-axes in Figure 8 and Figure 9a are presented in common logarithm form to more accurately illustrate the results. The different stages of hydrolysis lignin and their effects on the structure of the lignin char can be easily observed. LIG450 had a moderate SSA of 32 m2/g. According to Figure 9a,b, the mesopores account for 22% of the porosity, while 78% of the porosity comes from micropores. The total porosity of sample LIG450 was 0.01307 cm3/g.
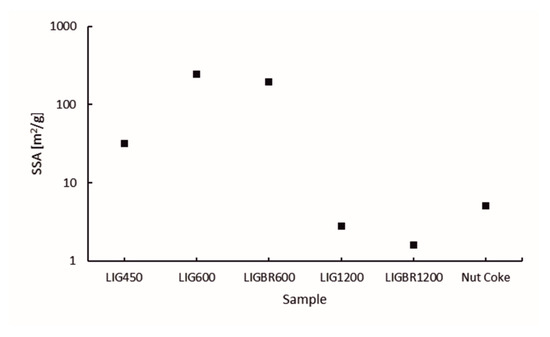
Figure 8.
Specific surface areas of the samples.
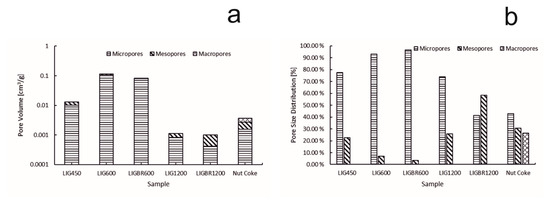
Figure 9.
Pore volumes and pore size distributions of the samples. (a): pore volume of the samples; (b):pore size distribution of the samples.
As the temperature of the pyrolysis was elevated to 600 °C the surface area and pore volume was increased significantly in LIG600 and LIGBR600 samples. This is mainly due to the degradation of lignin during the pyrolysis process, which causes higher microporosity in samples. When comparing the results of LIG600 and LIGBR600 samples, it can be observed that briquetting only had a little impact on the surface area and porosity development at this pyrolysis temperature.
By further elevating the pyrolysis temperature to 1200 °C, significant changes in char surface area and pore volume were achieved. When comparing LIG1200 and LIGBR1200 samples in Figure 8, it can be observed that briquetting had a significant impact on the SSA of the char at this stage of pyrolysis. The SSA of LIG1200 was 2.8 m2/g, while for LIGBR1200 it was 1.6 m2/g. Additionally, the pore size distribution was affected by briquetting, as can be observed in Figure 9b. The percentages of LIG1200 micropores and mesopores were 74% and 26%, respectively, while LIGBR1200 was composed of 42% micropores and 58% mesopores. Because these changes occurred without significant changes in total pore volume, it is suggested that the higher mesoporosity is a result of crack formation on the lignin char briquette edges, while the lower microporosity is mainly a result of compression of the biomass before pyrolysis, leading to a closer interaction of the lignin particles during high-temperature treatment.
By comparing the different chars to nut coke, it can be stated that LIG1200 and LIGBR1200 samples had pore volume and SSA values most closely resembling nut coke out of all the lignin char samples. Nut coke had SSA and total pore volume values of 5.1 m2/g and 0.00366 cm3/g, respectively, which were more than the corresponding values for LIG1200 and LIGBR1200.
3.5. Lignin Char and Nut Coke Reactivity
The TG and DTG curves of reactivity of lignin chars and nut coke are presented in Figure 10a,b, respectively. According to the results, nut coke had the highest residual mass at the end of the experiments, while sample LIG450 had the lowest residual mass. The effect of pyrolysis temperature on char reactivity can also be easily noted. The mass loss for LIG450 begins at 450 °C as the volatiles are released. The same applies to LIG600 and LIGBR600, as the mass loss began when the temperature reached 600 °C. The mass losses before the mentioned temperatures correspond to the release of moisture from the samples. As the temperature reached 900 °C, the mass loss rate for all lignin char samples increased significantly. Additionally, the mass loss rate for nut coke started to increase at 900 °C, but the increase in the reaction rate was less noticeable than in biochar samples.
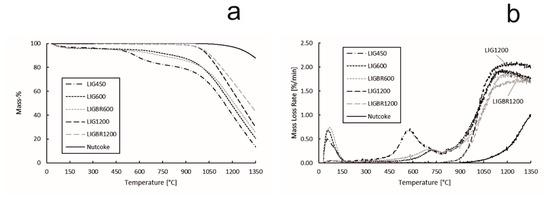
Figure 10.
Reactivity of hydrolysis lignin chars and nut coke. (a): sample mass percentage during the experiment; (b): mass loss rate of the samples during the experiment.
The effect of briquetting on char reactivity was observable between the chars that were pyrolyzed at 600 °C (LIG600 and LIGBR600), however the effect became notable at the high pyrolysis temperature of 1200 °C (LIG1200 and LIGBR1200). This could be explained by the different stages of lignin behavior under thermal treatment. For lignin, 600 °C is a pyrolysis temperature where the degradation stage has ended but the amorphous carbon formation stage is only beginning [17,32,33,34], i.e., the structure of the char has lost the majority of the oxygen-containing compounds but the structure reformation has not fully began. This might be the reason why LIG600 and LIGBR600 had approximately identical mass loss values and mass loss rate curves. Additionally, the SSA values and pore volumes were similar between those samples. On the other hand, at 1200 °C the amorphous carbon formation stage has finished, i.e., the structure of the char is reformed at this temperature. During the structure reformation, the proximity of particles is important, since it improves the interaction between the particles, thus leading to continuity in the reformed carbon structure, and therefore a tighter structure [14,30]. This effect was observed from the surface area, pore volume, and pore size distribution results and led to formation of less-reactive char. In Figure 10b, it can be seen that LIG1200 had the highest mass loss rate at the end of the experiment due to the high amount of residual carbon as compared to LIG450, LIG600, and LIGBR600 samples, while LIGBR1200 had the second lowest mass loss rate at the end of the experiment, although the residual carbon content was the highest of all the lignin char samples.
The results of reactivity tests are shown in Table 3 to illustrate the significance of the effects of briquetting and high-temperature pyrolysis in terms of controlling the char reactivity. The mass loss and mass loss rate values were obtained from the end of the experiment. As can be seen, LIGBR1200 showed 22.61 percentage points (p.p.) less weight loss in the reactivity experiment than LIG600 and 29.74 p.p. less than LIG450. The difference in mass values between the chars pyrolyzed at 1200 °C was 13.19 p.p., whereas the difference between the chars pyrolyzed at 600 °C was 4.83 p.p. In comparison with the pulverized chars LIG600 and LIG1200, sample LIG1200 had 9.42 p.p. less mass loss, while in comparison with LIGBR600 and LIGBR1200, sample LIGBR1200 had 17.78 p.p. less mass loss. The result shows that the combination of briquetting and high-temperature pyrolysis is clearly more efficient in terms of decreasing the char reactivity than either of the mentioned treatment methods alone.
Table 3.
Mass loss and mass loss rate values of hydrolysis lignin chars and nut coke in reactivity tests at up to 1350 °C.
These results, however, include reactions such as vaporization of water and release of volatile matter, which may distort the results. In Figure 11a,b, the TG and DTG data from Figure 10a,b are modified so that the starting point for the TG curve is set to 750 °C, i.e., at 750 °C the mass loss is set to 0%. The mass loss rate is also determined according to this. Using this method, the effect of water vapor release and part of the effect of the volatile release on the results can be ruled out and the starting temperature for the gasification reaction of the chars and nut coke is easier to define. As can be observed from Figure 11b, the volatile matter of samples LIG450, LIG600, and LIGBR600 is released at 750 °C as the reaction rate (DTG curve) remains steady in the range of 0.20–0.25%/min. At this point, the TG and DTG curves of LIG450, LIG600, and LIGBR600 are overlapping. As the temperature is further elevated, the slopes of the DTG curves increase, and since the gasification behaviors for each sample are different, the curves separate from each other. This point is considered to be the threshold temperature range for the gasification reaction.
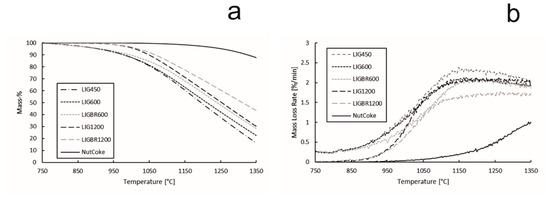
Figure 11.
Gasification reactivity values of hydrolysis lignin chars and nut coke. (a): mass percentage of the samples during the gasification; (b): mass loss rate of the samples during the gasification.
The mass loss during the gasification reaction, the reaction rate at the gasification threshold temperature, and the threshold temperature of each sample are presented in Table 4. The threshold temperature for the gasification reaction of each sample was chosen based on the reaction rate data set. The increase of 0.05%/min from the initial apparent reaction rate (ARR) at 750 °C was chosen. When comparing the results in Table 4 and Figure 11b, it can be observed that the threshold temperatures in Table 4 fit well with the reaction rate curves in Figure 11b. The mass loss rates at threshold temperature, presented in Table 4, are momentary and constantly vary as the temperature is elevated, as can be seen in Figure 11b. According to the results in Table 4, the threshold temperatures of the gasification reactions of LIGBR600, LIG1200, and LIGBR1200 are almost the same, with LIGBR1200 having the lowest threshold temperature (872 °C). However, the mass loss of LIGBR1200 is the lowest of all the hydrolysis lignin chars listed in Table 4. On the other hand, LIGBR600 had a considerably higher (26 °C) threshold temperature in comparison to LIG600. Based on the reactivity data, SSA data, and porosity data, it is suggested that briquetting had different types of inhibiting effects on the chars that were pyrolyzed at different temperatures. The briquetting of LIGBR600 samples had an elevating effect on the threshold temperature, but since the porosity and surface area of LIGBR600 was almost the same as that of LIG600 samples, the reaction rate increased rapidly after reaching the threshold temperature. The threshold temperature for the gasification of LIGBR1200 was lower than that of LIG1200, which can be explained by the similar pore volumes of the samples. However, as the gasification reaction progressed, the inhibiting effect of briquetting of LIGBR1200 began to show as the temperature was elevated. This is suggested to be a consequence of the different pore size distribution and lower SSA value of LIGBR1200 in comparison with LIG1200.
Table 4.
Mass loss values for the samples and threshold temperatures for the gasification reaction.
4. Conclusions
In this work, hydrolysis lignin was pyrolyzed using a slow pyrolysis process at three different final temperatures of 450 °C, 600 °C, and 1200 °C. In the slow pyrolysis process at 600 and 1200 °C, the material samples were pyrolyzed in briquetted and non-briquetted form. The slow pyrolysis process was demonstrated and analyzed with a thermogravimetric analyzer (TGA) coupled with a mass spectrometer (MS). A proximate chemical analysis was performed for the five produced lignin chars and fossil-based nut coke, which was used as a reference in the experiments. Additionally, the densities of the briquetted chars were defined before and after the slow pyrolysis process. All the samples were tested using a dynamic reactivity experiment in a CO-CO2-N2 gas atmosphere with temperatures ranging from 30 to 1350 °C.
According to results, it is suggested that briquetting and high-temperature pyrolysis yields biochar samples that could partly or completely replace coke in various pyrometallurgical processes, e.g., in different reduction processes. This suggestion is supported by the high fixed carbon content, low ash content, and volatile matter content comparable to fossil-based nut coke, as well as the inhibited reactivity of the chars. Additionally, the specific surface area (SSA) and pore volume of lignin char samples LIG1200 and LIGBR1200 were comparable to those of nut coke. The improved properties for the chars were achieved through the combination of briquetting and high pyrolysis temperature.
In the reactivity tests, it was observed that the mass loss of lignin chars was significantly decreased by the combination of briquetting and high-temperature pyrolysis. Based on the reactivity test results, it was observed that the combination of briquetting and high-temperature pyrolysis had a more significant joint effect on suppressing the char reactivity than either of these treatment methods alone. The mass loss of LIGBR1200 in the reactivity test was 56.80%, while it was 79.41% for the LIG600 sample, resulting 22.61 p.p. less mass loss for LIGBR1200 in this dynamic reactivity test.
The apparent densities of briquetted chars were high in comparison to metallurgical coke and non-briquetted chars, which could help to overcome the problem of low penetration depth in pyrometallurgical applications where injection of carbonaceous material is used in the process.
Author Contributions
Conceptualization, A.K.; methodology, A.K., A.H., D.B., J.S. and T.F.; software, A.K.; validation, A.K.; formal analysis, A.K., A.H. and T.F.; investigation, A.K. and D.B.; resources, A.K., A.H., D.B. and T.F.; data curation, A.K.; writing—original draft preparation, A.K.; writing—review and editing, A.K., A.H., D.B. and T.F.; visualization, A.K., A.H. and T.F.; supervision, T.F.; project administration, A.H. and T.F.; funding acquisition, A.H. and T.F. All authors have read and agreed to the published version of the manuscript.
Funding
This research was funded by European Regional Development Fund (ERDF) project Carbotech, project number A75548.
Institutional Review Board Statement
Not applicable.
Informed Consent Statement
Not applicable.
Data Availability Statement
Not applicable.
Acknowledgments
The authors want to acknowledge Tommi Kokkonen from Process Metallurgy, University of Oulu, for help in the design and execution of the TGA-related experiments presented in this paper. ST1 is acknowledged for providing the raw material hydrolysis lignin for the experiments. SSAB Raahe is acknowledged for providing the nut coke for the experiments.
Conflicts of Interest
The authors declare no conflict of interest. The funders had no role in the design of the study; in the collection, analyses, or interpretation of data; in the writing of the manuscript; or in the decision to publish the results.
References
- Ramasamy, S.; Moghtaderi, B. Dielectric properties of typical australian wood-based biomass materials at microwave frequency. Energy Fuels 2010, 24, 4534–4548. [Google Scholar] [CrossRef]
- Yip, K.; Xu, M.; Li, C.-Z.; Jiang, S.P.; Wu, H. Biochar as a Fuel: 3. Mechanistic Understanding on Biochar Thermal Annealing at Mild Temperatures and Its Effect on Biochar Reactivity. Energy Fuels 2011, 25, 406–414. [Google Scholar] [CrossRef]
- Koskela, A.; Suopajärvi, H.; Mattila, O.; Uusitalo, J.; Fabritius, T. Lignin from Bioethanol Production as a Part of a Raw Material Blend of a Metallurgical Coke. Energies 2019, 12, 1533. [Google Scholar] [CrossRef]
- Agirre, I.; Griessacher, T.; Rösler, G.; Antrekowitsch, J. Production of charcoal as an alternative reducing agent from agricultural residues using a semi-continuous semi-pilot scale pyrolysis screw reactor. Fuel Process. Technol. 2013, 106, 114–121. [Google Scholar] [CrossRef]
- Suopajärvi, H.; Pongrácz, E.; Fabritius, T. The potential of using biomass-based reducing agents in the blast furnace: A review of thermochemical conversion technologies and assessments related to sustainability. Renew. Sustain. Energy Rev. 2013, 25, 511–528. [Google Scholar] [CrossRef]
- Suopajärvi, H.; Pongrácz, E.; Fabritius, T. Bioreducer use in Finnish blast furnace ironmaking—Analysis of CO2 emission reduction potential and mitigation cost. Appl. Energy 2014, 124, 82–93. [Google Scholar] [CrossRef]
- Kirubakaran, V.; Sivaramakrishnan, V.; Nalini, R.; Sekar, T.; Premalatha, M.; Subramanian, P. A review on gasification of biomass. Renew. Sustain. Energy Rev. 2009, 13, 179–186. [Google Scholar] [CrossRef]
- Bridgwater, A.V.; Meier, D.; Radlein, D. An overview of fast pyrolysis of biomass. Org. Geochem. 1999, 30, 1479–1493. [Google Scholar] [CrossRef]
- Ghysels, S.; Ronsse, F.; Dickinson, D.; Prins, W. Production and characterization of slow pyrolysis biochar from lignin-rich digested stillage from lignocellulosic ethanol production. Biomass Bioenergy 2019, 122, 349–360. [Google Scholar] [CrossRef]
- Suopajärvi, H.; Kemppainen, A.; Haapakangas, J.; Fabritius, T. Extensive review of the opportunities to use biomass-based fuels in iron and steelmaking processes. J. Clean. Prod. 2017, 148, 709–734. [Google Scholar] [CrossRef]
- Lovel, R.R.; Vining, K.R.; Dell ’amico, M. The Influence of Fuel Reactivity on Iron Ore Sintering. ISIJ Int. 2009, 49, 195–202. [Google Scholar] [CrossRef]
- Ooi, T.C.; Aries, E.; Ewan, B.C.R.; Thompson, D.; Anderson, D.R.; Fisher, R. The study of sunflower seed husks as a fuel in the iron ore sintering process. Miner. Eng. 2008, 21, 167–177. [Google Scholar] [CrossRef]
- Ruan, X.; Sun, Y.; Du, W.; Tang, Y.; Liu, Q.; Zhang, Z. Formation, characteristics, and applications of environmentally persistent free radicals in biochars: A review. Bioresour. Technol. 2019, 281, 457–468. [Google Scholar] [PubMed]
- Haensel, T.; Comouth, A.; Lorenz, P.; Ahmed, S.I.U.; Krischok, S.; Zydziak, N. Pyrolysis of cellulose and lignin. Appl. Surf. Sci. 2009, 255, 8183–8989. [Google Scholar] [CrossRef]
- Gavel, D.J.; Adema, A.; van der Stel, J.; Kwakernaak, C.; Sietsma, J.; Boom, R. Melting Behaviour of Iron Ore Pellet Bed under Nut Coke Mixed Charge Conditions. ISIJ Int. 2020, 60, 451–462. [Google Scholar] [CrossRef]
- Demirbas, A. Effects of temperature and particle size on bio-char yield from pyrolysis of agricultural residues. J. Anal. Appl. Pyrolysis 2004, 72, 243–248. [Google Scholar] [CrossRef]
- Toloue Farrokh, N.; Suopajärvi, H.; Mattila, O.; Umeki, K.; Phounglamcheik, A.; Romar, H. Slow pyrolysis of by-product lignin from wood-based ethanol production– A detailed analysis of the produced chars. Energy 2018, 164, 112–123. [Google Scholar] [CrossRef]
- Cassel, B.; Menard, K. Proximate Analysis of Coal and Coke using the STA 8000 Simultaneous Thermal Analyzer; PerkinElmer, Inc.: Shelton, CT, USA, 2012. [Google Scholar]
- Basu, P. Biomass Gasification and Pyrolysis: Practical Design and Theory; Academic Press: Amsterdam, The Netherlands, 2010. [Google Scholar]
- Naderi, M. Surface Area: Brunauer-Emmett-Teller (BET). Prog. Filtr. Sep. 2015, 14, 585–608. [Google Scholar]
- Thommes, M.; Kaneko, K.; Neimark, A.V.; Olivier, J.P.; Rodriguez-Reinoso, F.; Rouquerol, J. Physisorption of gases, with special reference to the evaluation of surface area and pore size distribution (IUPAC Technical Report). Pure Appl. Chem. 2015, 87, 1052–1069. [Google Scholar] [CrossRef]
- Ryu, Z.; Zheng, J.; Wang, M. Porous structure of pan-based activated carbon fibers. Carbon 1998, 36, 427–432. [Google Scholar] [CrossRef]
- Figueroa-Gerstenmaier, S.; Siperstein, F.R.; Celzard, A.; Fierro, V. Application of Density Functional Theory for Determining Pore-Size Distributions of Microporous Activated Carbons. Adsorpt. Sci. Technol. 2014, 32, 23–35. [Google Scholar] [CrossRef]
- Roberts, D.G.; Harris, D.J. A kinetic analysis of coal char gasification reactions at high pressures. Energy Fuels 2006, 20, 2314–2320. [Google Scholar] [CrossRef]
- Guo, W.; Xue, Q.; Liu, Y.; Guo, Z.; She, X.; Wang, J. Kinetic analysis of gasification reaction of coke with CO2 or H2O. Int. J. Hydrogen Energy 2015, 40, 13306–13313. [Google Scholar] [CrossRef]
- Gan, M.; Lv, W.; Fan, X.; Chen, X.; Ji, Z.; Jiang, T. Gasification Reaction Characteristics between Biochar and CO2 as well as the Influence on Sintering Process. Adv. Mater. Sci. Eng. 2017, 2017, 9404801. [Google Scholar] [CrossRef]
- Babich, A.; Senk, D.; Gudenau, H.W. Effect of coke reactivity and nut coke on blast furnace operation. Ironmak. Steelmak. 2009, 36, 222–229. [Google Scholar] [CrossRef]
- Mousa, E.A.; Senk, D.; Babich, A.; Gudenau, H.W. Influence of nut coke on iron ore sinter reducibility under simulated blast furnace conditions. Ironmak. Steelmak. 2010, 37, 219–228. [Google Scholar] [CrossRef]
- Zhao, W.; Chu, M.; Wang, H.; Liu, Z.; Tang, J.; Ying, Z. Effect of Introducing Coke into Ore Layer on Softening-melting-dropping Characteristics of Vanadium-titanium Mixed Burden under Simulating BF Conditions. ISIJ Int. 2018, 58, 1989–1998. [Google Scholar] [CrossRef]
- Cao, J.; Xiao, G.; Xu, X.; Shen, D.; Jin, B. Study on carbonization of lignin by TG-FTIR and high-temperature carbonization reactor. Fuel Process. Technol. 2013, 106, 41–47. [Google Scholar] [CrossRef]
- Terui, K.; Kashihara, Y.; Hirosawa, T.; Nouchi, T. Optimization of Coke Mixed Charging Based on Discrete Element Method. ISIJ Int. 2017, 57, 1804–1810. [Google Scholar] [CrossRef]
- Yang, H.; Yan, R.; Chen, H.; Zheng, C.; Lee, D.H.; Liang, D.T. In-depth investigation of biomass pyrolysis based on three major components: Hemicellulose, cellulose and lignin. Energy Fuels 2006, 20, 388–393. [Google Scholar] [CrossRef]
- Fushimi, C.; Araki, K.; Yamaguchi, Y.; Tsutsumi, A. Effect of heating rate on steam gasification of biomass. 2. Thermogravimetric-mass spectrometric (TG-MS) analysis of gas evolution. Ind. Eng. Chem. Res. 2003, 42, 3929–3936. [Google Scholar] [CrossRef]
- Yang, H.; Yan, R.; Chen, H.; Lee, D.H.; Zheng, C. Characteristics of hemicellulose, cellulose and lignin pyrolysis. Fuel 2007, 86, 1781–1788. [Google Scholar] [CrossRef]
- Brebu, M.; Tamminen, T.; Spiridon, I. Thermal degradation of various lignins by TG-MS/FTIR and Py-GC-MS. J. Anal. Appl. Pyrolysis 2013, 104, 531–539. [Google Scholar] [CrossRef]


Publisher’s Note: MDPI stays neutral with regard to jurisdictional claims in published maps and institutional affiliations. |
© 2021 by the authors. Licensee MDPI, Basel, Switzerland. This article is an open access article distributed under the terms and conditions of the Creative Commons Attribution (CC BY) license (http://creativecommons.org/licenses/by/4.0/).