Abstract
In this work, Raman spectroscopic experiments are conducted on zeolites, including a total of 33 varieties and seven groups with different secondary structural frameworks, for which characteristic vibration modes are studied. Most of the zeolites show prominent Raman peaks in the spectral range between 200–1200 cm−1. Different groups of zeolites can be recognized by differences in the wavenumbers of the T-O-T (T = Si and Al, O = oxygen) modes in the range 379–538 cm−1, the M-O (M = metal,) modes in the range 250–360 cm−1 and the T-O bending modes in the range 530–575 cm−1. All zeolites show characteristic Raman peaks in the range 379–529 cm−1, except for natrolite group (fibrous) zeolites, which are characterized by T-O-T modes in the 433–447 cm−1 range and T-O bending modes in the 528–538 cm−1 range. The analcime group (with singly connected four-ring chains) zeolites show T-O-T modes in the 379–392 cm−1 and 475–497 cm−1 ranges. The gismondine group (with doubly connected four-ring chains) zeolites have T-O-T modes in the 391–432 cm−1 and 463–497 cm−1 ranges. The chabazite group (with a six-cyclic ring) zeolites are characterized by M-O modes in the 320–340 cm−1 range and T-O-T modes in the 477–509 cm−1 range. The Raman modes of mordenite group zeolites (397–410 cm−1 and 470–529 cm−1) overlap with those of heulandite group zeolites (402–416 cm−1 and 480–500 cm−1). Moreover, the mordenite group has a characteristic peak in the 502–529 cm−1 range, and an additional peak in the 800–965 cm−1 range. Another recognizable peak for the heulandite group is in the 612–620 cm−1 range. The unknown zeolites (cowlesite) have unique characteristic peaks at 534 cm−1, which can aid in the verification of their identity.
1. Introduction
Zeolites are commonly found minerals that are known for their important industrial applications. The term zeolite was proposed by Cronstedt in 1756, who found that these minerals expelled water when heated, as if they were boiling [1]. Dehydration and the absorption of moisture make them suitable for use as desiccants. The holes and vacancies in their relatively open structure allow the selective screening of ions of different sizes and can serve as a molecular sieve [2]. Previous researchers have studied the application of zeolites for the purification of livestock wastewater, landfill wastewater and aquaculture water [3,4]. The relationship between zeolite structures and the mechanisms of removing pollutants was further discussed in [5].
Surprisingly, the physical properties and geological importance of the zeolite group minerals were not well known until the late 20th century [6]. The formula for zeolites is more appropriately expressed as (Li,Na,K)a(Mg,Ca,Sr,Ba)d[Al(a+2d)Sin−(a+2d)O2n]·mH2O [6,7]. The letters a, d and n are considered for charges balanced with oxygen by the extraframework cations—usually Na, K, Ca, but less frequently Li, Mg, Sr, Ba (usually Si ≥ Al and m ≤ n). The basic structural unit of the crystal is the TO4 tetrahedron, where T stands for Si and Al. TO4 tetrahedrons are called primary building units [8]. Zeolite group minerals can be verified according to their differences in stacking and linking these tetrahedrons, which are called secondary framework units [9]. Based on this concept, Gottardi and Galli (1985) [6] classified zeolites into seven structural groups, the scheme of which was later revised by Ghobarkar et al. (2003) [10], as shown in Table 1.

Table 1.
The classification of zeolite minerals and the samples adopted in this study [10]. Zeolite minerals used in this study are in bold type, and all of them were identified by X-ray powder diffraction (XRD) except pollucite and gonnardite.
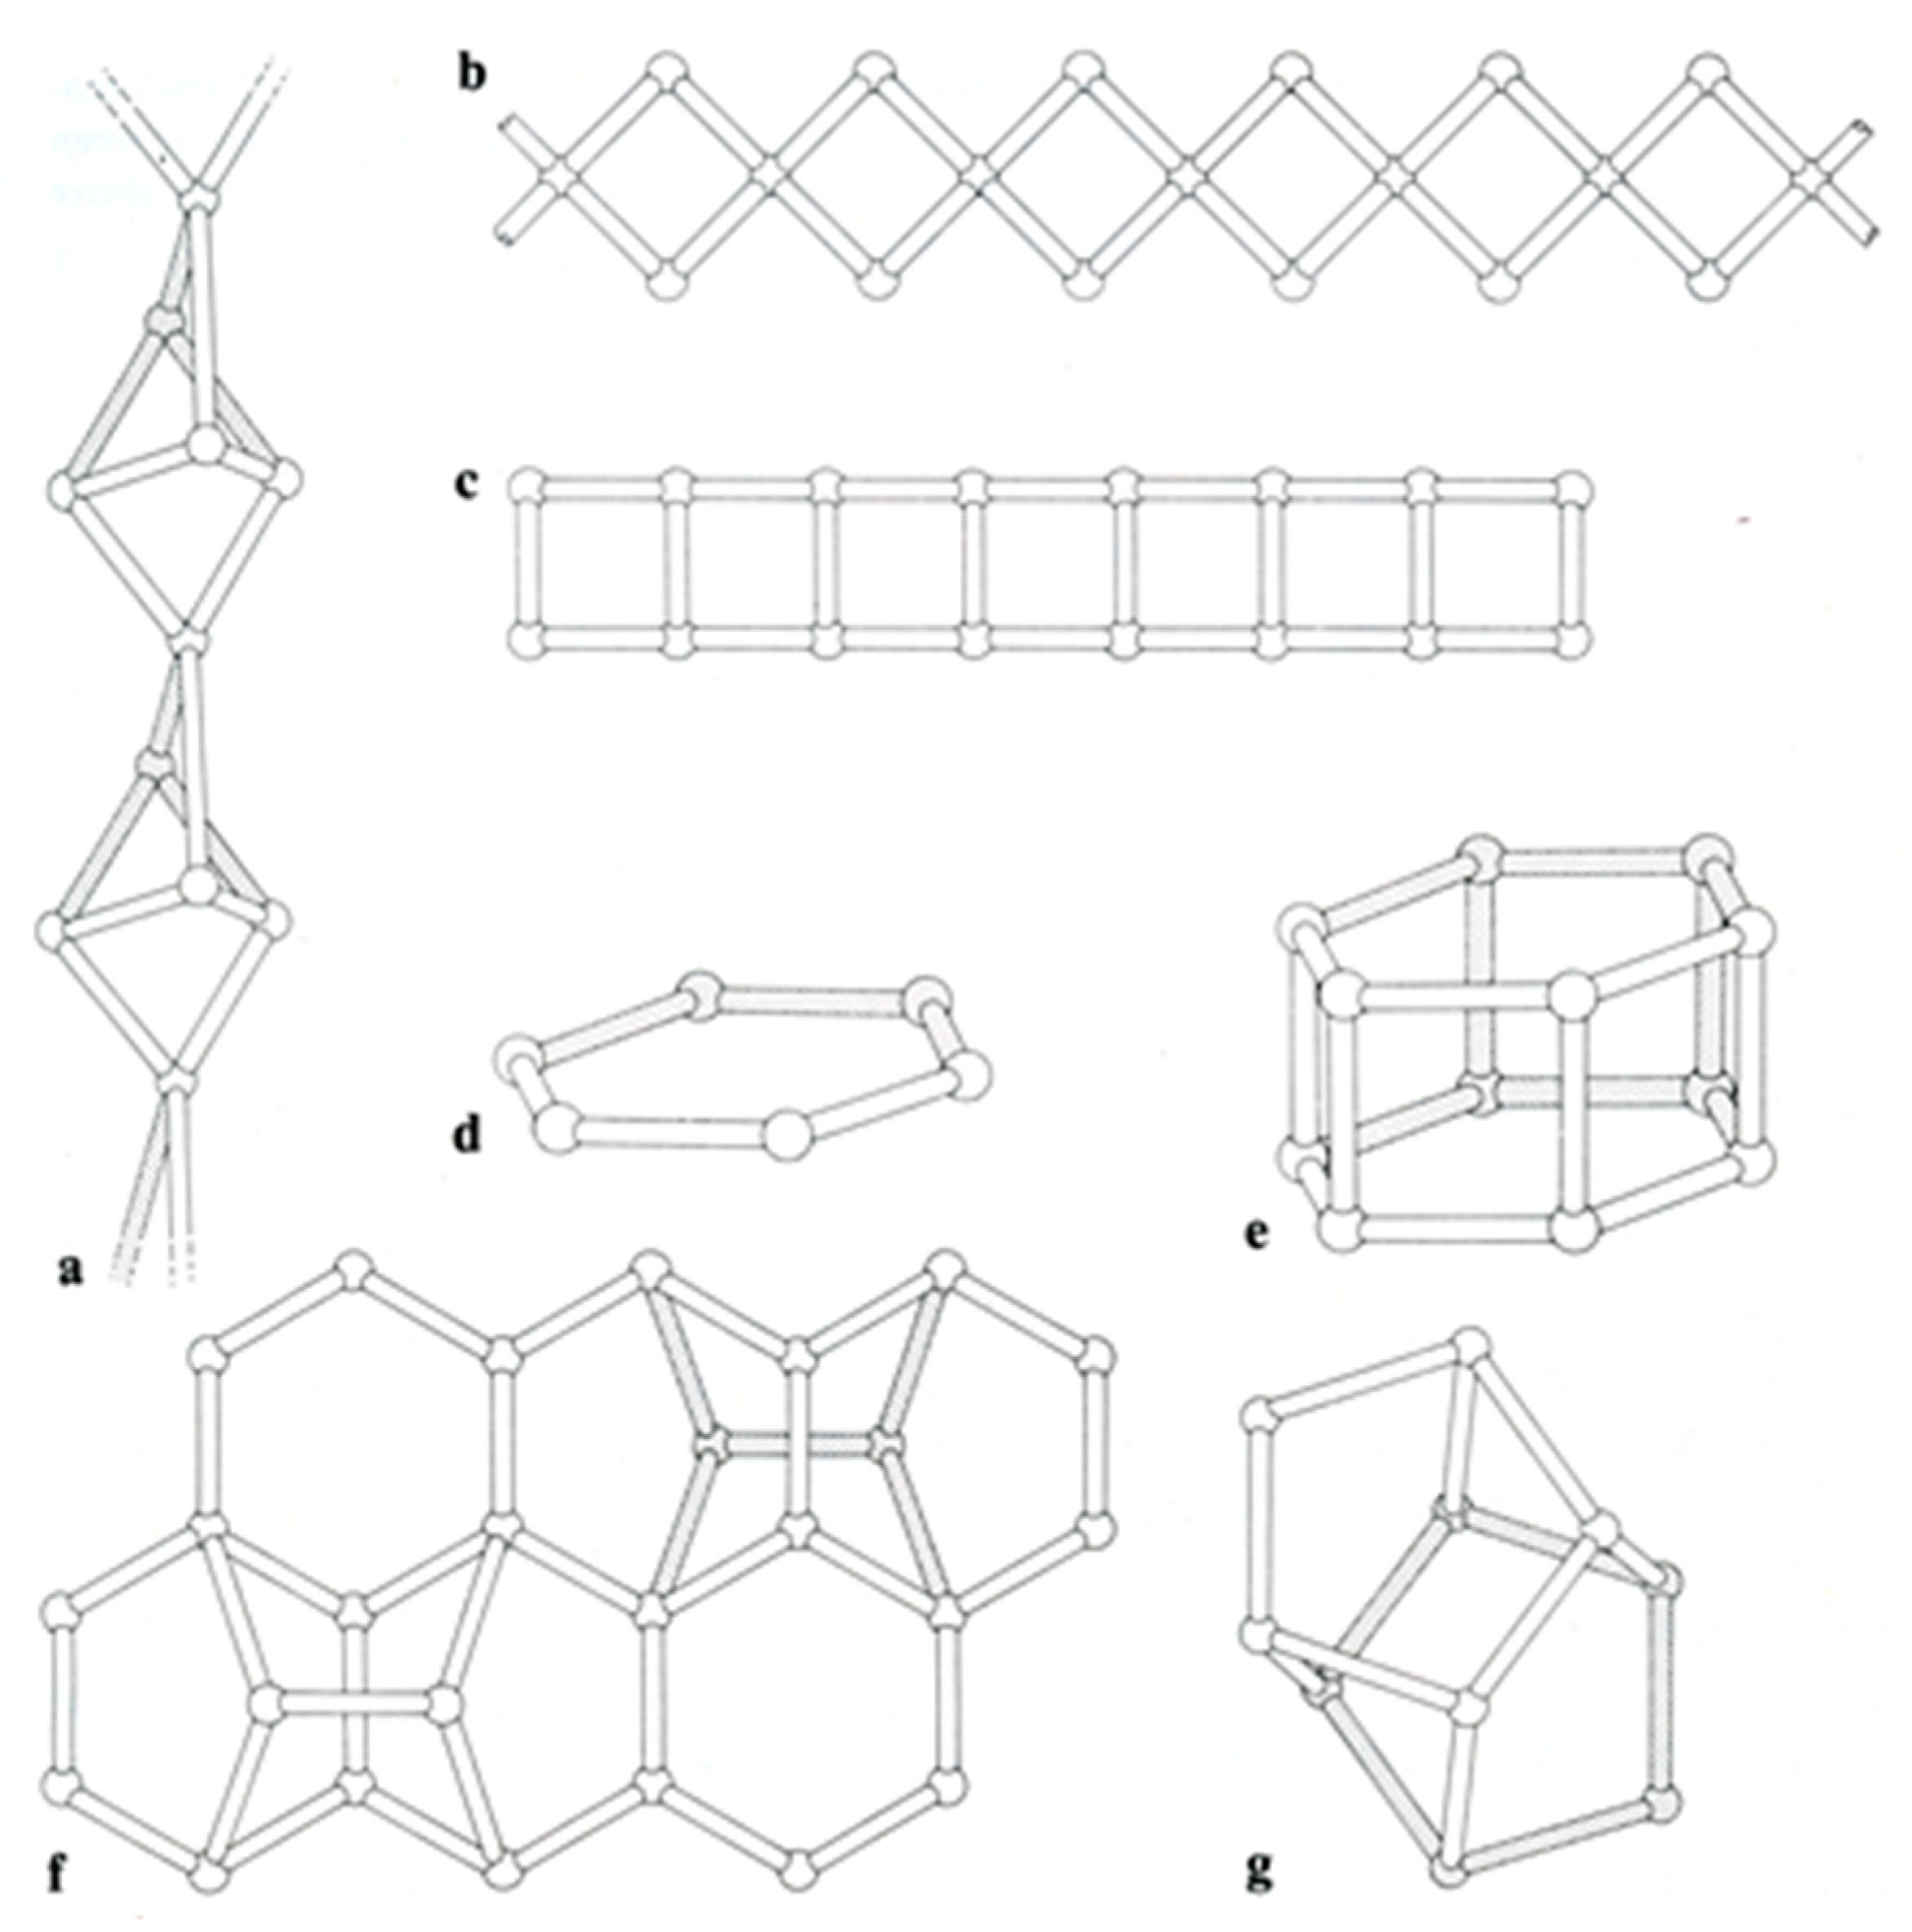
According to the scheme of Gottardi and Galli, 1985 and Ghobarkar et al., 2003 [6,10], more than 50 different species of zeolite have been identified, but only 47 natural zeolite minerals are classified into the seven groups: the natrolite group (fibrous zeolites), analcime group (singly connected four-ring chains), gismondine group (doubly connected four-ring chains), chabazite group (singly and doubly connected six-ring cyclic structure), mordenite group and heulandite group, in addition to cowlesite in the unknown structure group (Table 1 and Figure 1). In this study, we focused on the investigation of Raman spectra of secondary building units of zeolites. Based on the results, we were also able to establish a Raman spectrum database.
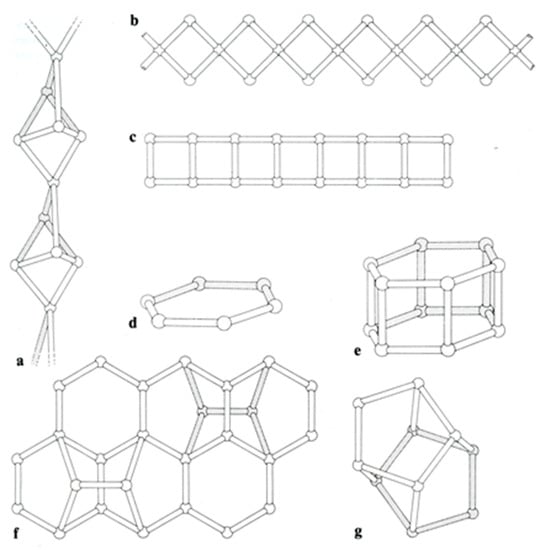
Figure 1.
Secondary framework units of zeolite groups: (a) fibrous structure, (b) singly connected four-ring chains, (c) doubly connected four-ring chains, (d) singly connected six-ring cyclic structure, (e) doubly connected six-cyclic structure, (f) mordenite structure and (g) heulandite structure (after Gottardi and Galli, 1985 [10]).
The phase identification of a mineral can be achieved by several methods. Conventional ways of identifying minerals by optical observation may present great difficulty when zeolite minerals are encountered. X-ray diffraction requires a sufficient quantity of the sample, which may not be readily available, and a powdered form needs to be prepared. The Raman spectroscopic method is a reliable tool for the non-destructive identification of mineral phases. It is easy to manipulate and does not require the tedious pre-treatment of a sample. Mineral phases can be identified quickly, provided that a complete set of Raman data for minerals are available. The RRUFFTM database is created by a RRUFF project from University of Arizona. They complete high quality spectral data from well characterized minerals and is developing the technology to share this information with the world. This database has provided Raman spectroscopic patterns for more than 4000 minerals. However, not all minerals are included; for example, zeolite minerals are only partially available.
In the past, Hong (2005) [11] and Chiang (2008) [12] reported Raman spectroscopic investigations on several zeolites. They attempted to perform a systematic comparison to test if the T-O-T modes could be adopted as a basis for the classification of zeolites and, furthermore, to find out if there exist any correlations in zeolites in their secondary framework units [6,10]. In their studies, some of the zeolite groups (such as the chabazite group in Hong’s study and the mordenite group in Chiang’s study) did not have sufficient samples to lead to a conclusive result. Apparently, more work needs to be done to justify their achievement. Despite the fact that valuable data can be obtained from the Internet, it is necessary for a systematic investigation of zeolites to be performed in order to obtain more meaningful data.
2. Method
Thirty-three zeolite species including natural and synthetic sources were used in this study. Zeolites that are rarely found in nature were synthesized by Chen (2002) [13,14]; for example gobbinsite, garronite, amicite and merlinoite. Almost all species were identified structurally by X-ray powder diffraction (XRD) or chemically by energy dispersive spectroscopy (EDS). XRD used D2 PHASER type from the Bruker Company in Karlsruhe, Germany. EDS was performed using an INCA-300 type from the Oxford Instruments in Buckinghamshire, United Kingdom, addition to the SEM of a JSM-6360LV type made by JEOL Company from Tokyo, Japan. The operating conditions were an acceleration voltage of 12–15 kV and an electric current of 0.18 nA, and every sample was analyzed at more than four spots. Each mineral was mounted in epoxy resin, and the surface was polished to a 5 μm grain size. We chose albite and silica-alumina glasses for the standard.
Micro-Raman spectroscopy using a Labram HR VIS from the Horiba Jobin-Yvon Company (from Paris, France) was adopted for spectroscopic investigation. The laser source was a 532 nm green light diode laser. The magnification was 50X and the beam size was focused to a minimum diameter of about 2 μm in a confocal manner. Before the experiment, the spectrometer was calibrated against the characteristic Raman peak of a silicon chip at 520 cm−1 to be within an error of ±1 cm−1. Spectral ranges of 150–1200 cm−1 were selected for the analysis and the data were processed by LabSpec 5 software. In each sample, three different spots were examined for better statistical results. The average time for each data acquisition was about 10 s.
3. Results and Discussion
3.1. The Raman Spectroscopy of Zeolites
The Raman spectroscopic results for each zeolite structure group are described as follows. In our results, the following should be noted:
- The numbers (1–3) before each zeolite mineral indicate the number of specimens of the same species, since each species may have had more than one specimen available for analysis.
- We compared our results with the RRUFF database and chose the data that matched best with our data in the tabulated lists.
- The stoichiometric composition and sample locality of each sample are listed.
3.1.1. Natrolite Group
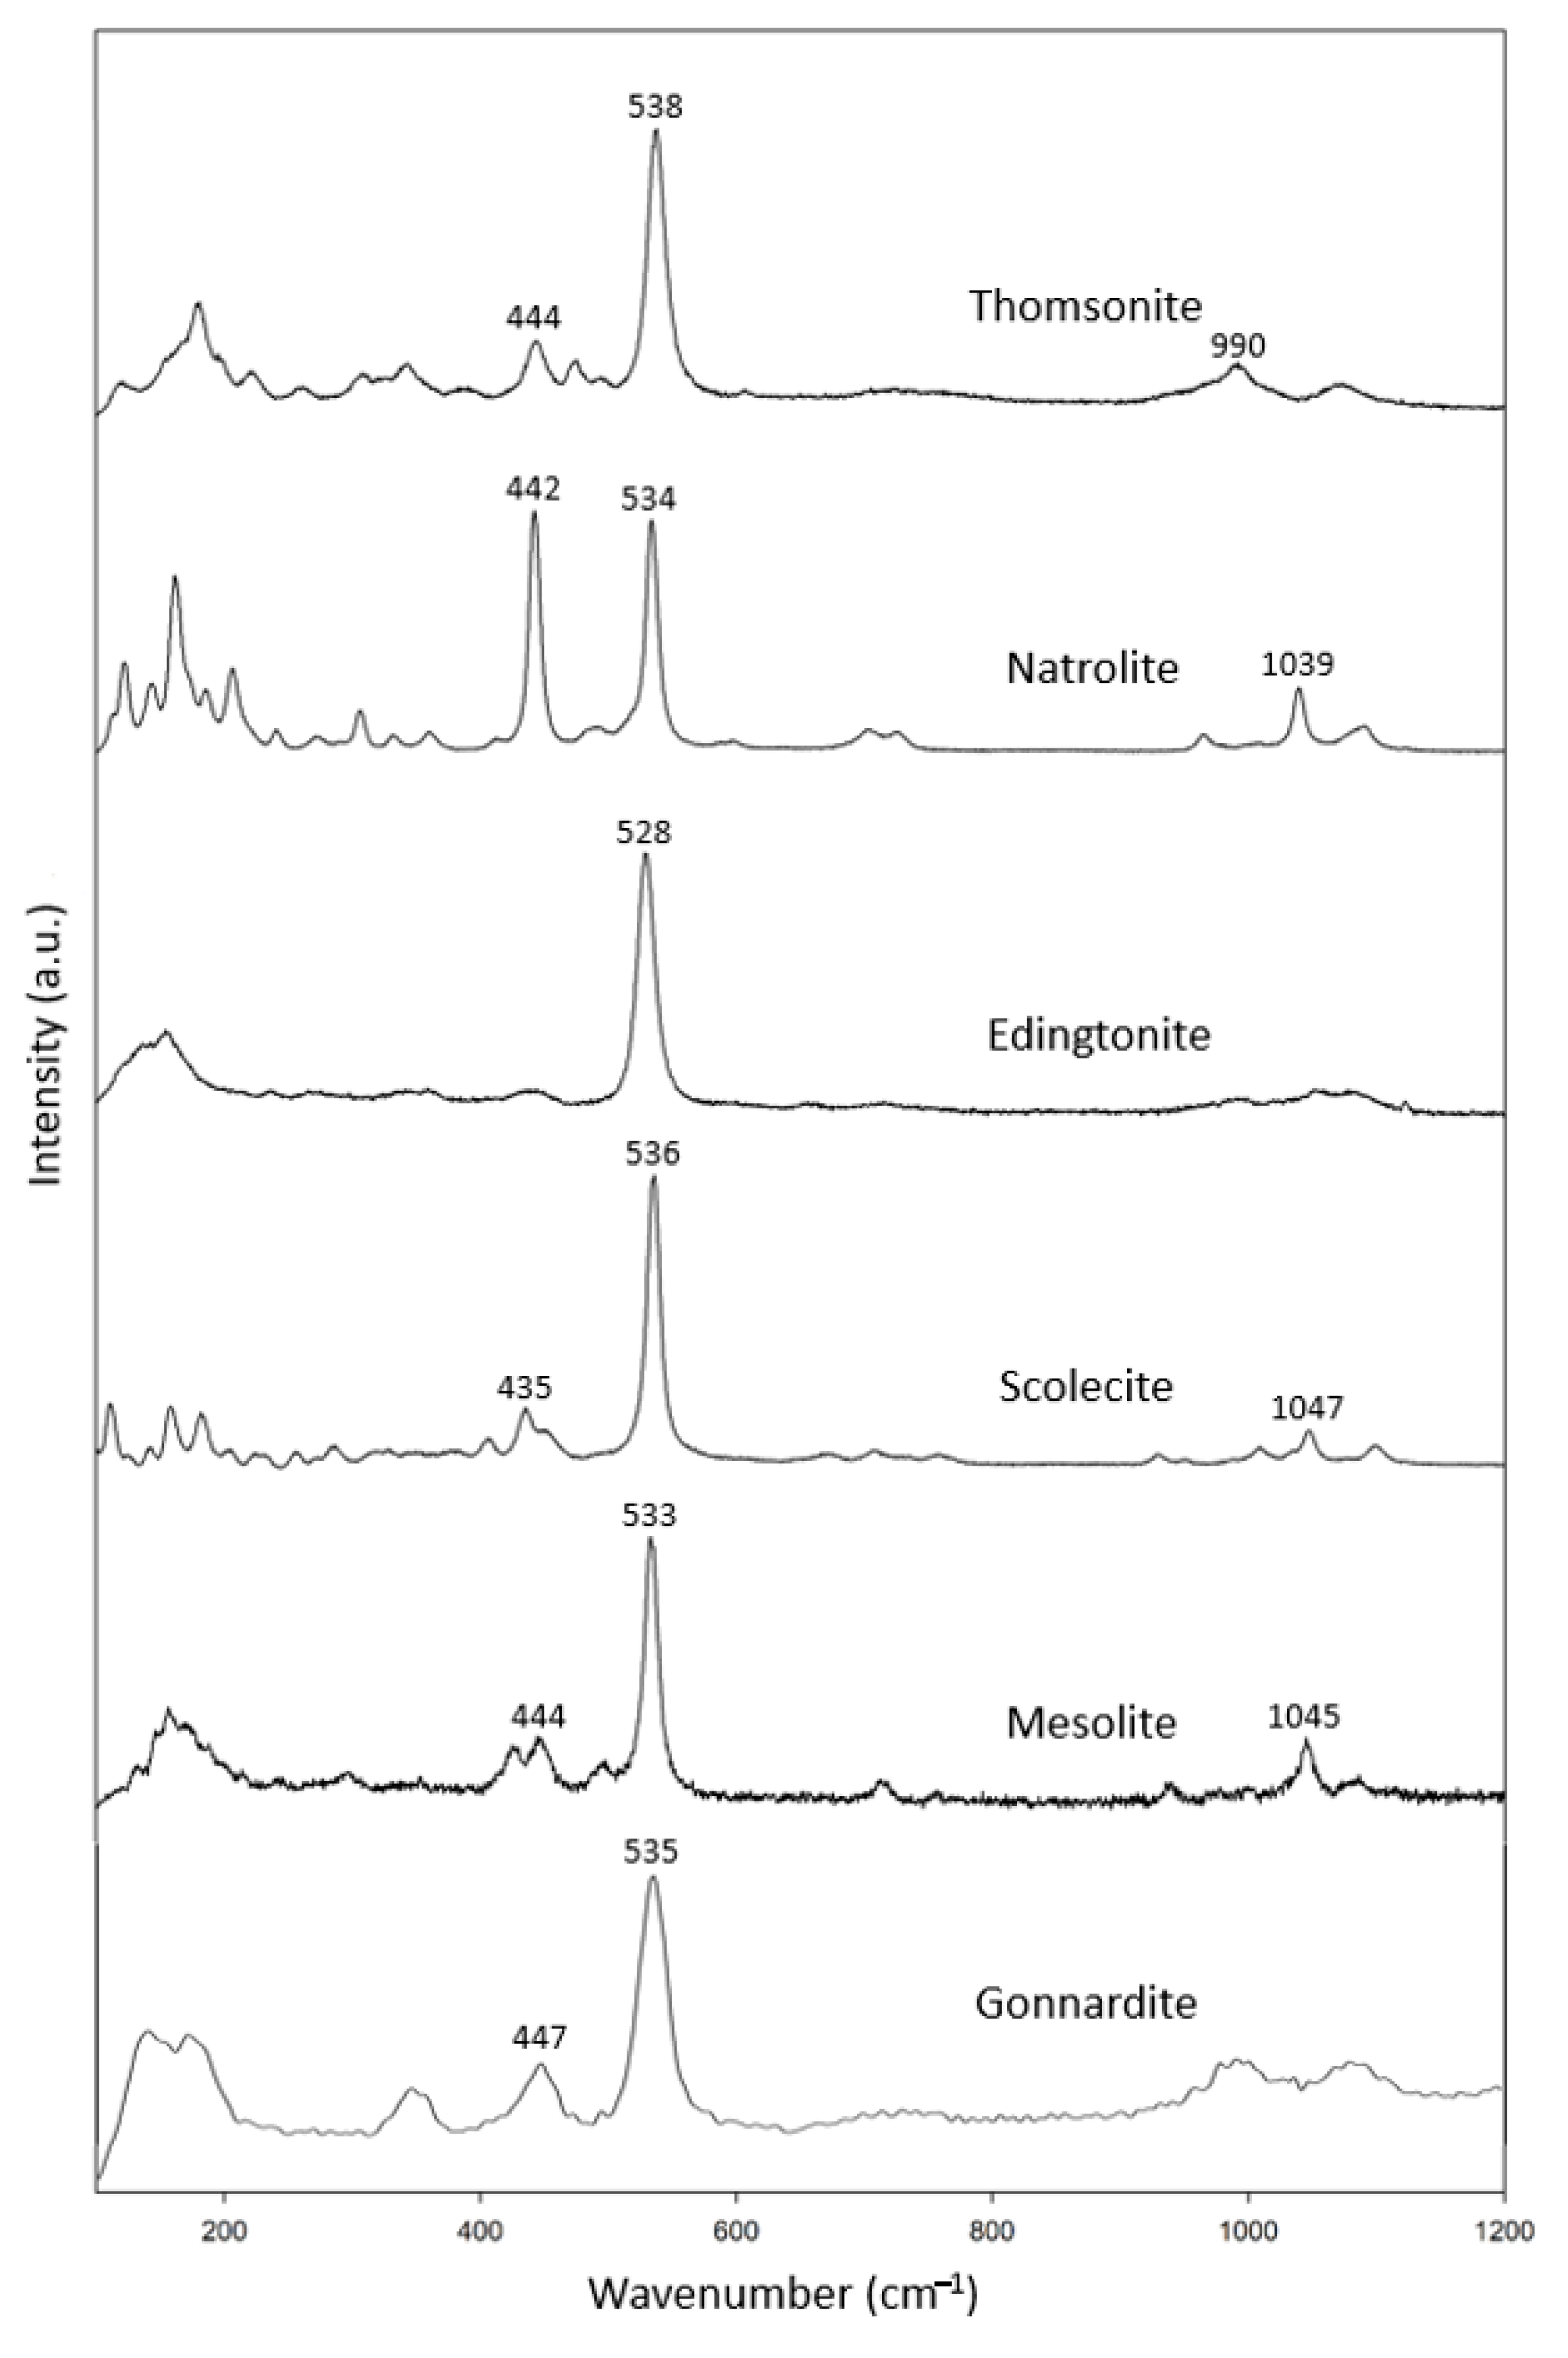
In this study, the fibrous zeolite specimens (Figure 1a) included three thomsonite, one edingtonite, one scolecite and two mesolite samples and one gonnardite (Table 2) sample. In combination with the RRUFF data, these specimens show common characteristic peaks at 433–447 cm−1 and 528–538 cm−1 (Figure 2). In addition, there was another characteristic peak at 990–1100 cm−1.

Table 2.
Natrolite group zeolite specimens (chemical formula in blue analyzed by EDS).
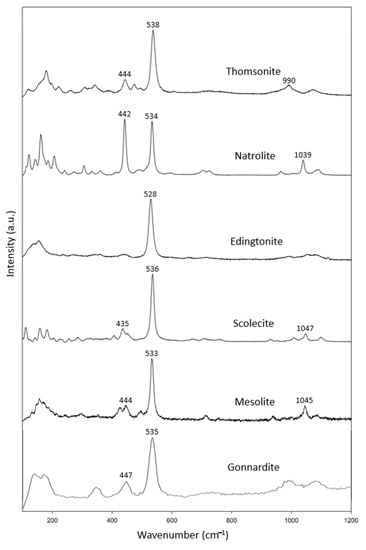
Figure 2.
Raman spectra of natrolite group zeolites.
Our Raman data for natrolite are consistent with those reported by Goryainov (2001) [15]. Our data also agree well with the natrolite group reported by Wopeka (1998) [16].
3.1.2. Analcime Group
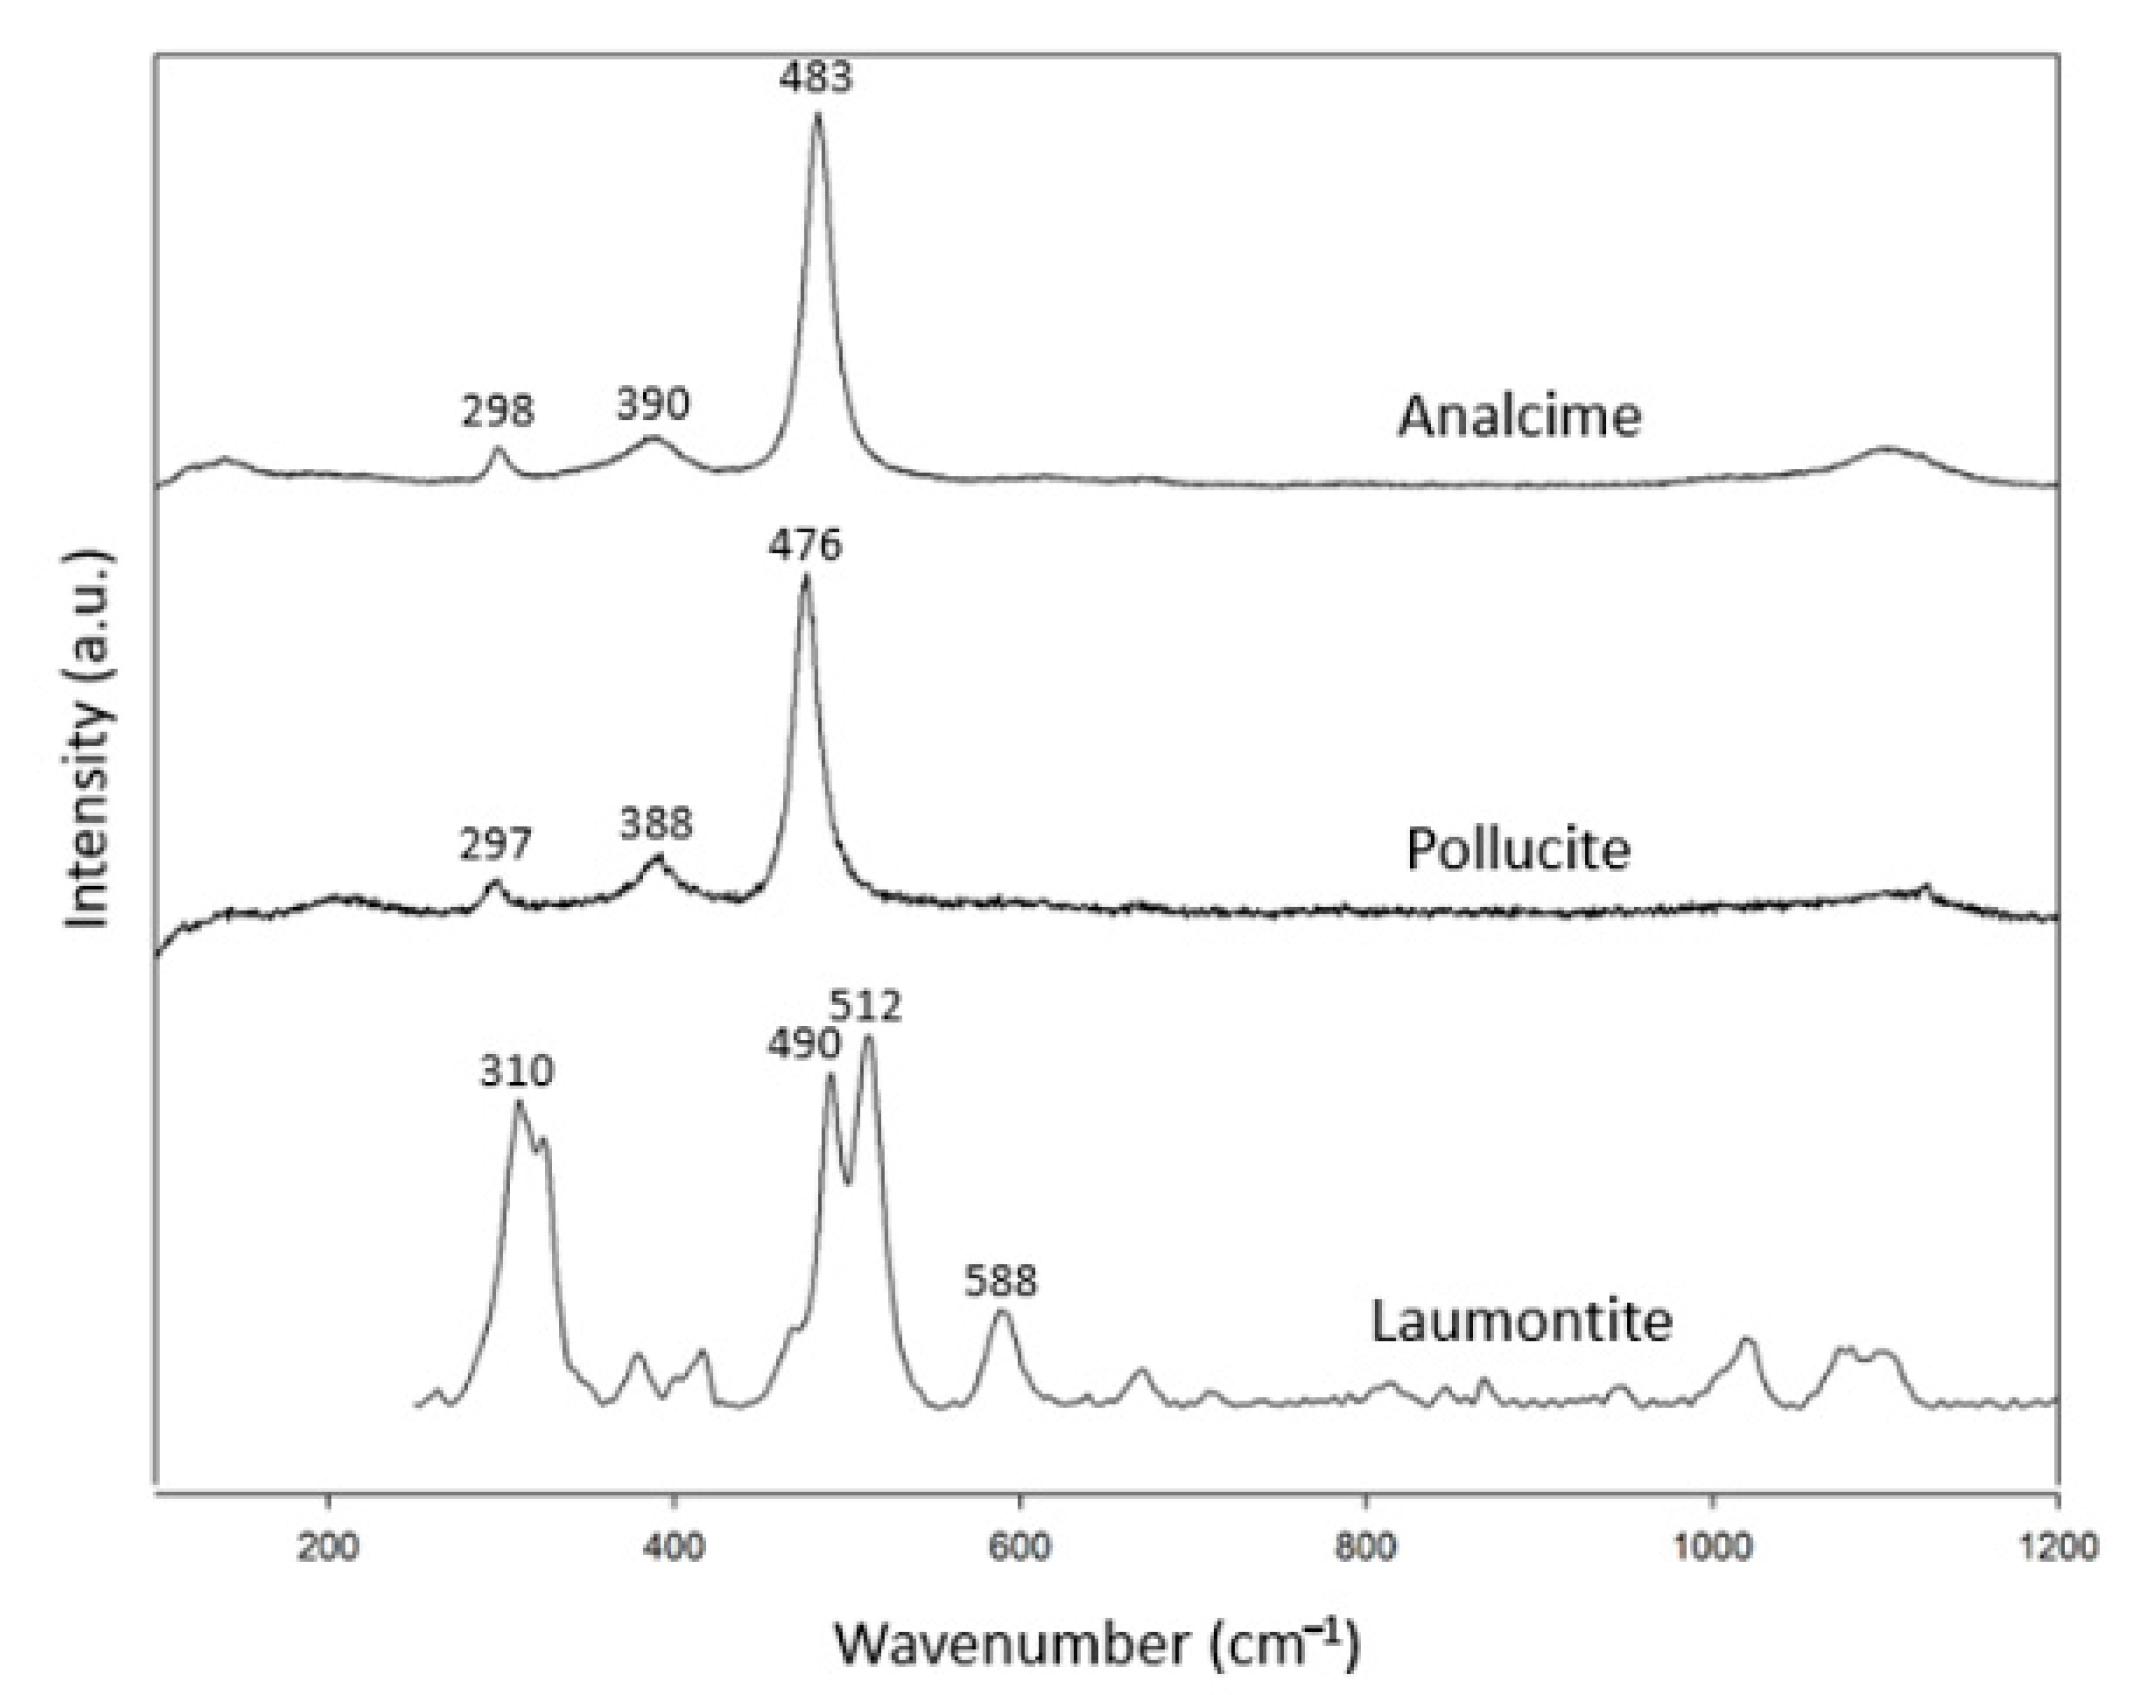
There are only three species for singly connected four-ring-chain zeolites (Figure 1b): analcime, laumontite and pollucite (Table 3). The numbers of this group are lower than the other zeolite groups. There were two specimens for analcime. Pollucite is a Cs-containing zeolite—a recently discovered mineral in this group. In combination with the RRUFF data, these specimens showed common characteristic peaks at 297–310 cm−1, 379–392 cm−1 and 475–497 cm−1 (Figure 3). Only laumontite showed additional peaks at other ranges of the spectrum.

Table 3.
Analcime group zeolite specimens (chemical formula in blue analyzed by EDS).
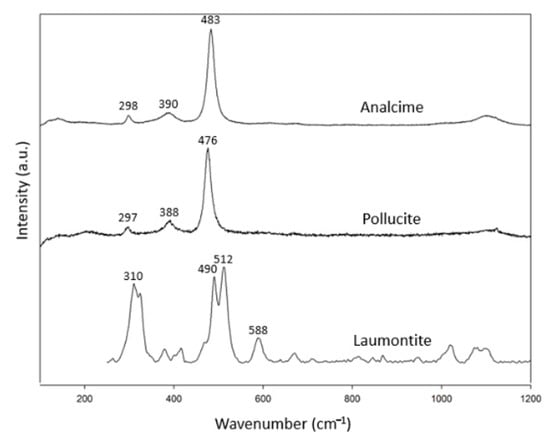
Figure 3.
Raman spectra of analcime group zeolites.
3.1.3. Gismondine Group
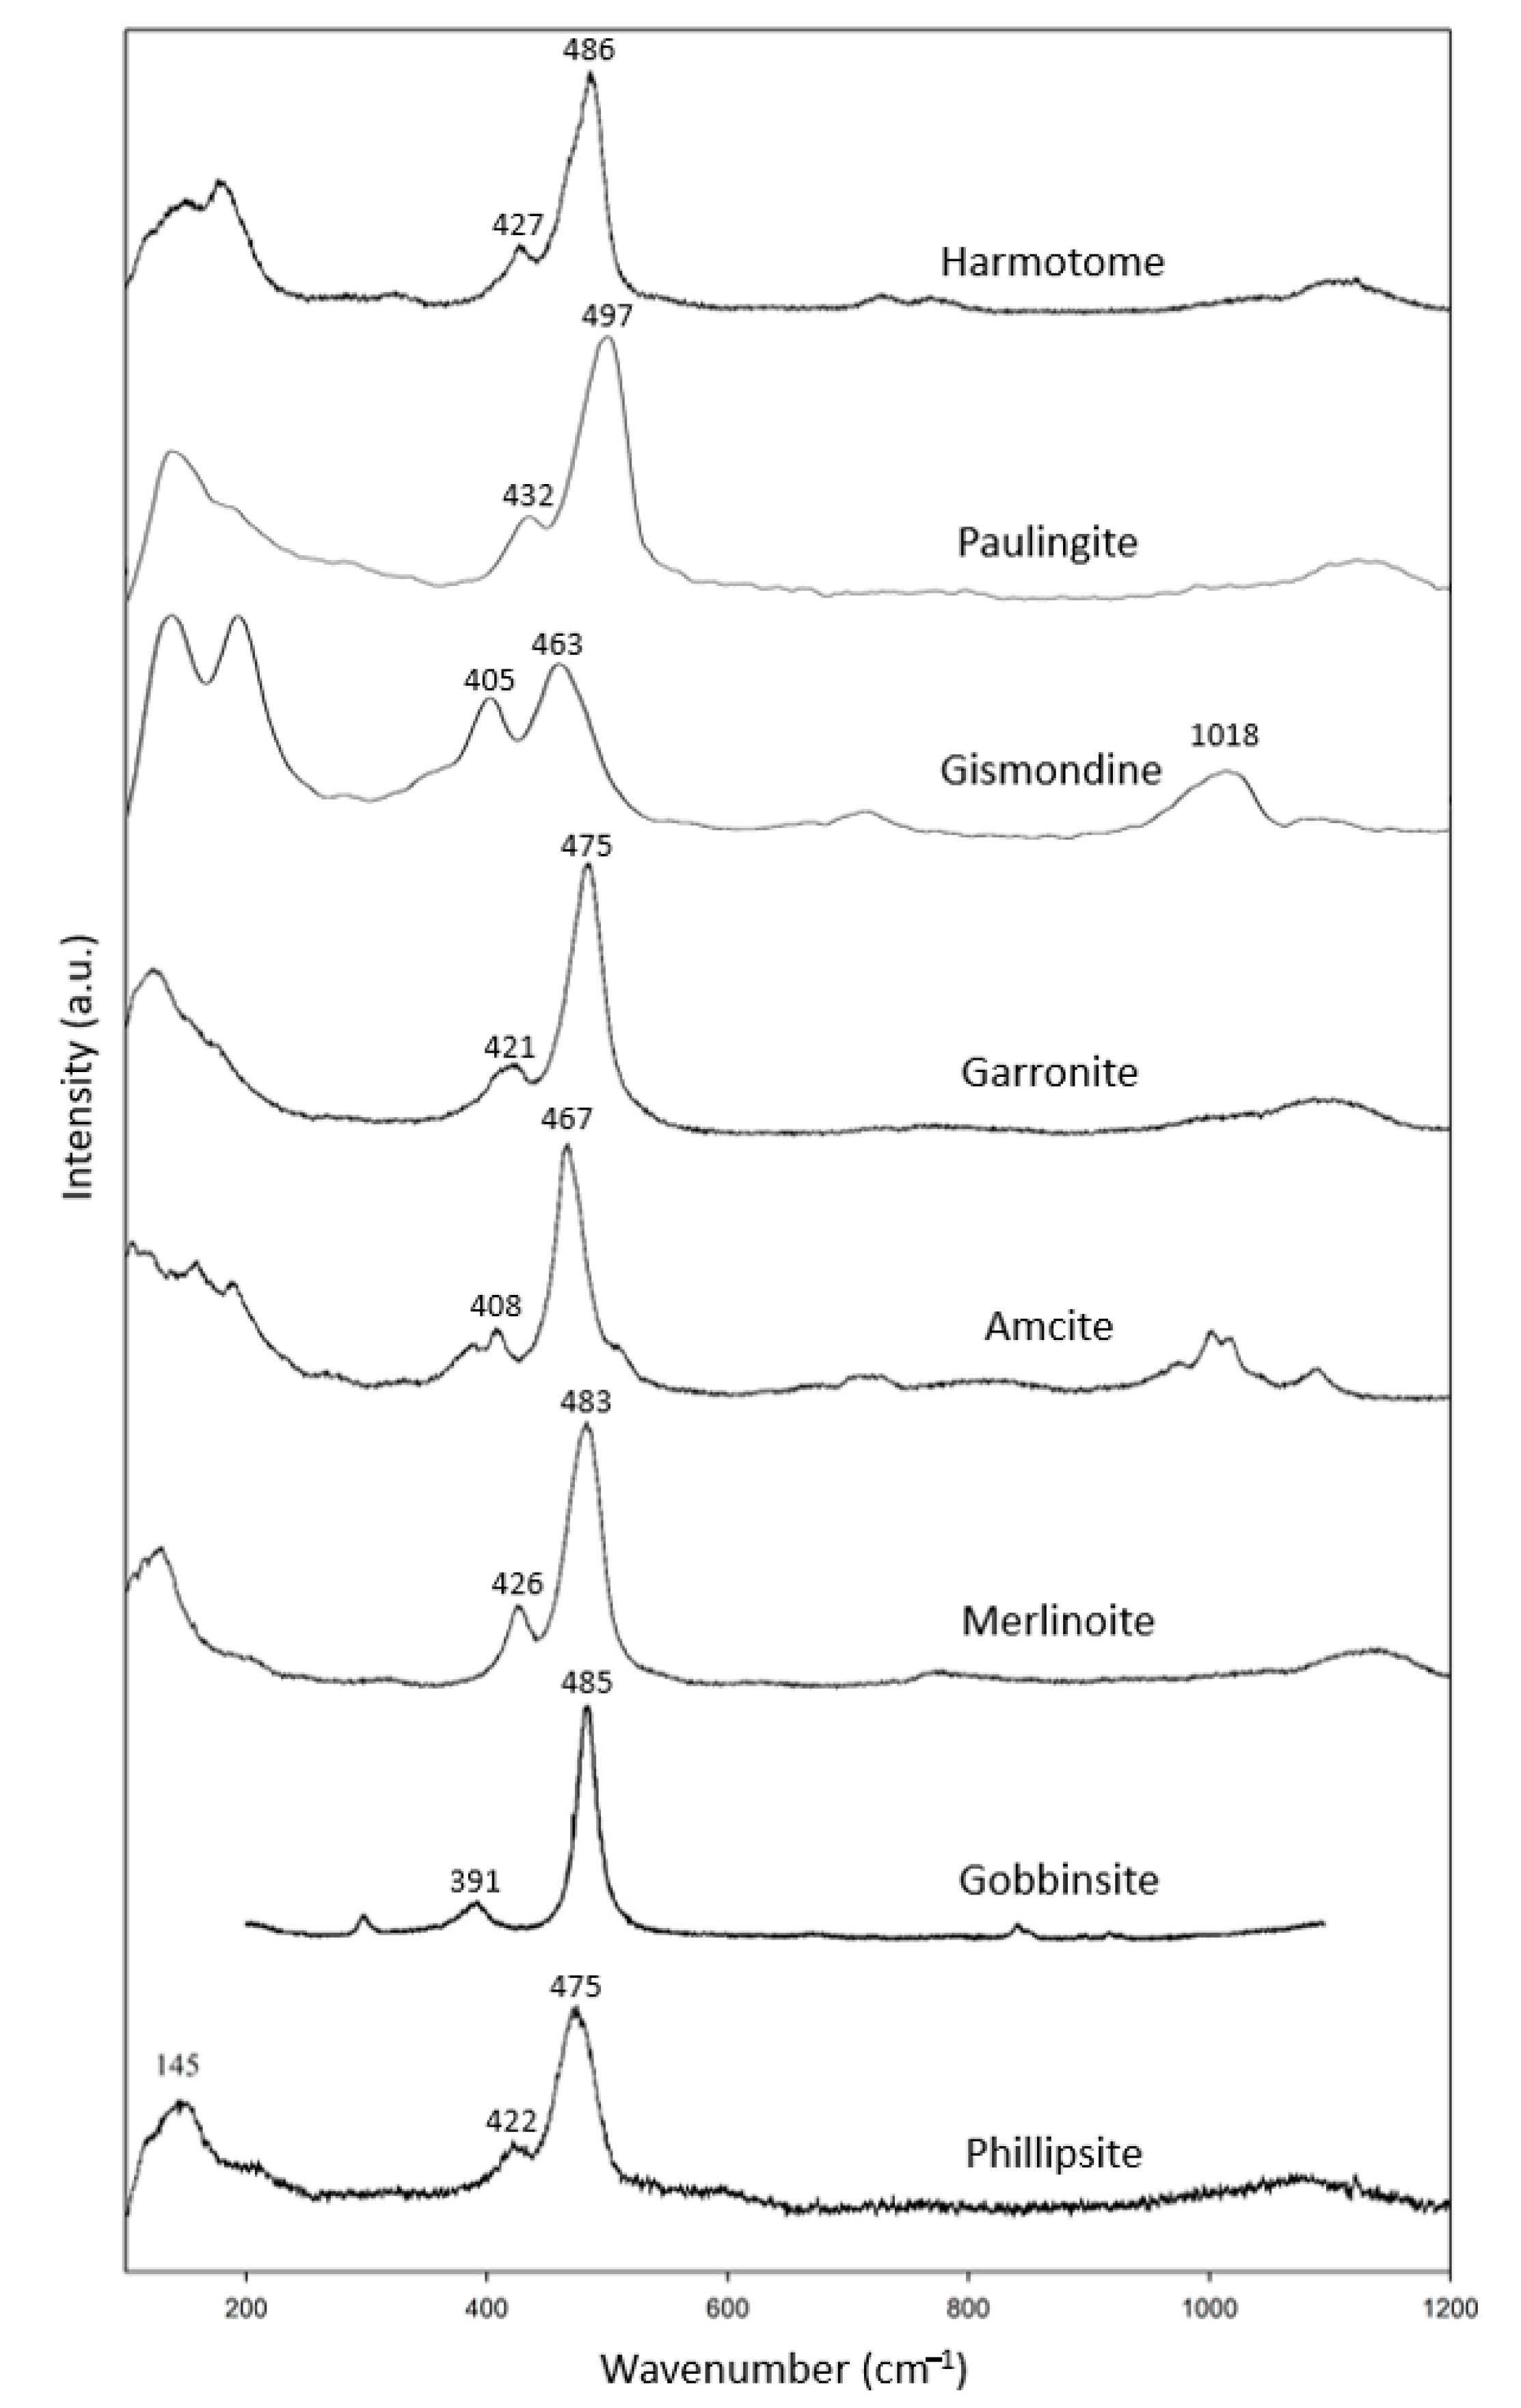
There are more mineral species in the doubly connected four-ring-chain zeolite group (Figure 1c), including specimens of harmotome, paulingite, gismondine, garronite, amicite, merlinoite and gobbinsite, in addition to two phillipsite specimens (Table 4). Among them, the rarely seen natural minerals of gismondine, garronite, amicite, merlinoite and gobbinsite are synthesized from glass through hydrothermal processes [13,14]. All have corresponding data in the RRUFF files except for gobbinsite. In combination with the RRUFF data, these specimens showed common characteristic peaks at 391–432 cm−1 and 463–497 cm−1 (Figure 4). The most intense peak in this group, spanning the range 463–497 cm−1, was found to be due to the relatively low wavenumber in gobbinsite and relatively high wavenumber in paulingite compared to the other members in this group. Otherwise, the most intense peak spanned a smaller range of 467–486 cm−1. Gismondine, as reported by Mozgawa (2001) [17], had its most intense peak at 1086 cm−1, which is not reasonable. Another reason for the wide span of characteristic peaks is the difference in the Si/Al ratio. In the process of synthesis, gismondine and amicite have lower Si/Al (~1), while gobbinsite and garronite have higher Si/Al (~1.5–2.2) [13]. This may influence the location of the highest peak between 463–497 cm−1.

Table 4.
Gismondine group zeolite specimens (chemical formula in blue analyzed by EDS).
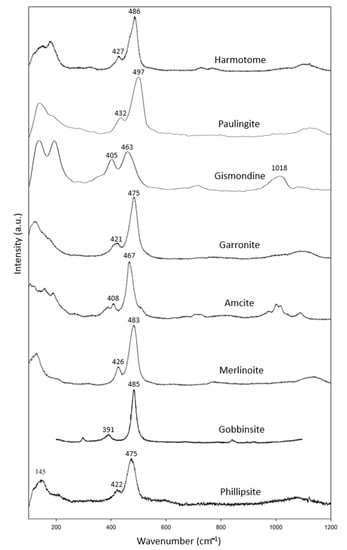
Figure 4.
Raman spectra of gismondine group zeolites.
3.1.4. Chabazite Group
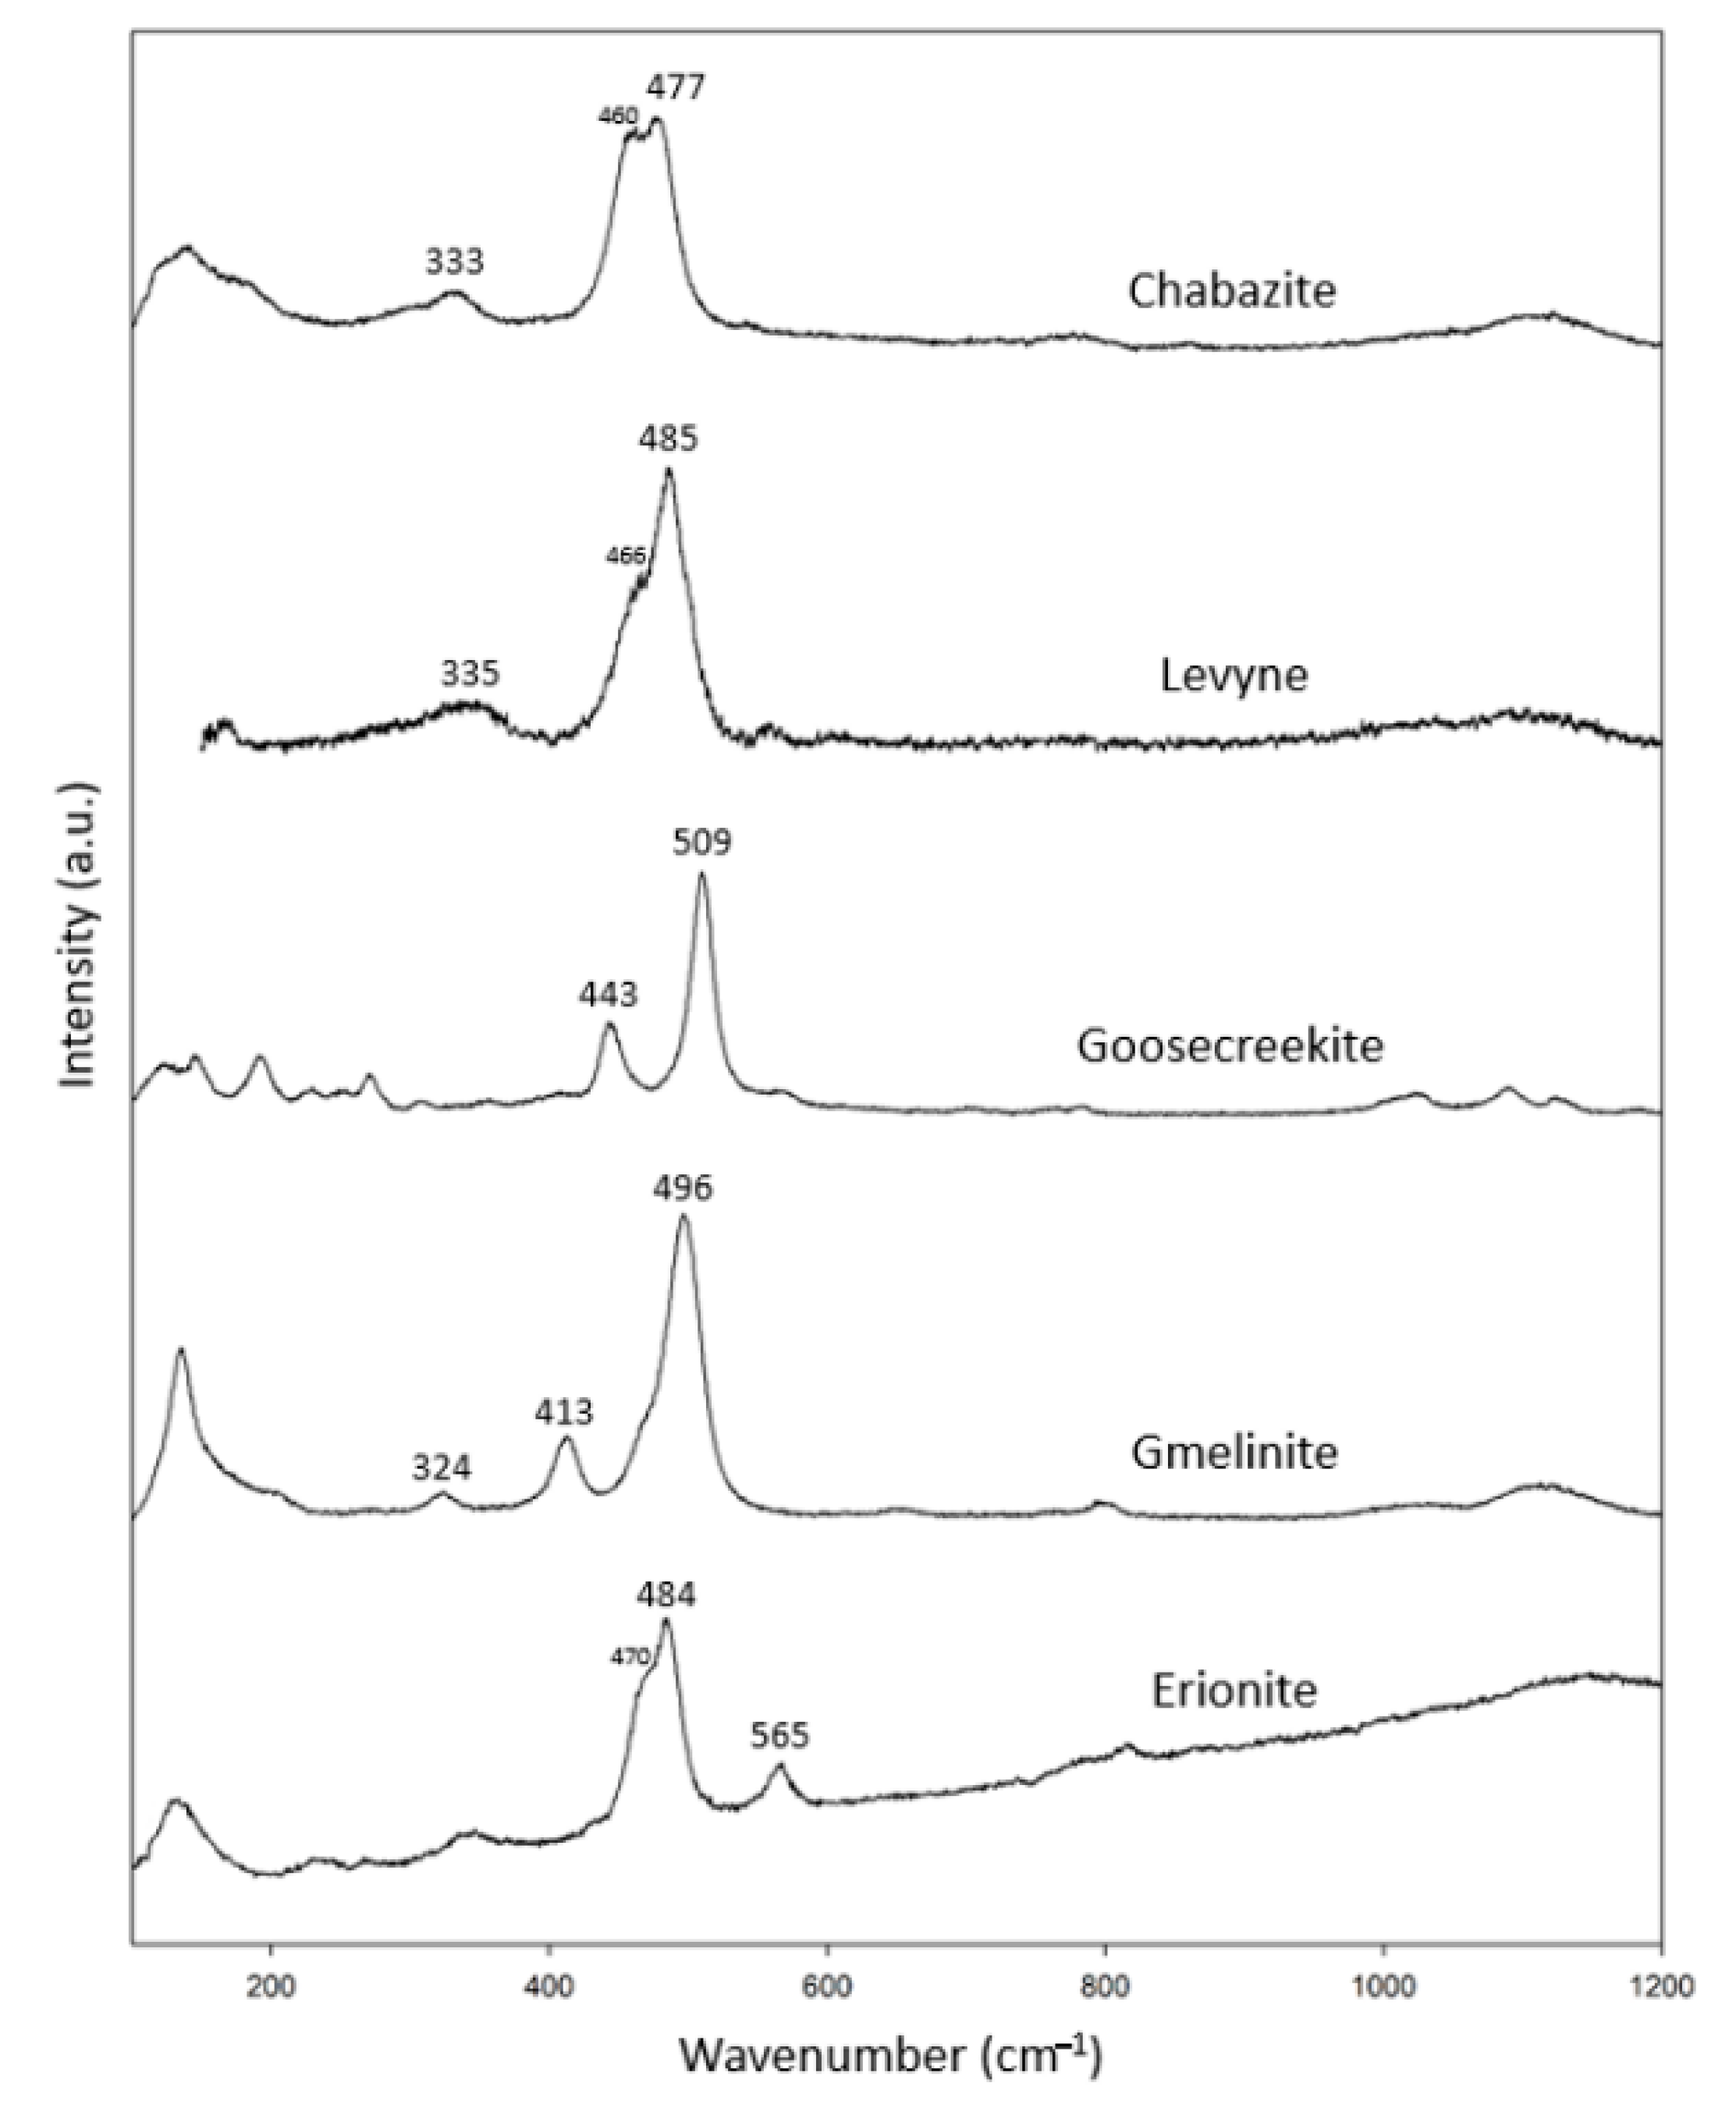
We analyzed one specimen of each of the six-ring cyclic structure zeolites (Figs. 1d and 1e), including chabazite, levyne, goosecreekite, gmelinite and erionite (Table 5). In combination with the RRUFF data, these specimens showed common characteristic peaks at 320–340 cm−1 and 477–509 cm−1 (Figure 5). In addition, chabazite, levyne and erionite had peaks at 460 cm−1, 466 cm−1 and 470 cm−1, respectively. Among them, only goosecreekite, which was recently found and classified as a member of the chabazite group, lacked the peak at 320–340 cm−1. There are no results for goosecreekite in the RRUFF data bank. We suspect that goosecreekite may not belong to the chabazite group. Further investigation is needed to verify the identity of goosecreekite.

Table 5.
Chabazite group zeolite specimens (chemical formula in blue analyzed by EDS).
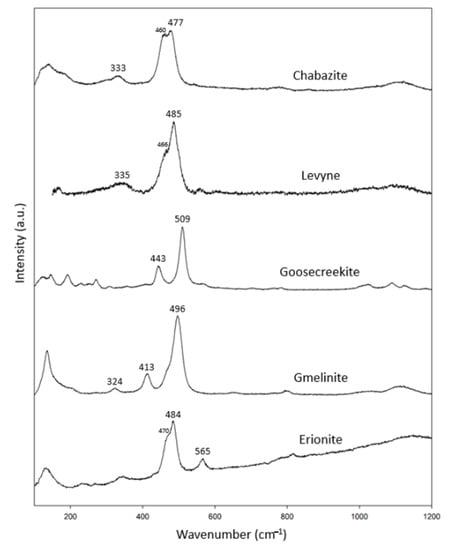
Figure 5.
Raman spectra of chabazite group zeolites.
3.1.5. Mordenite Group
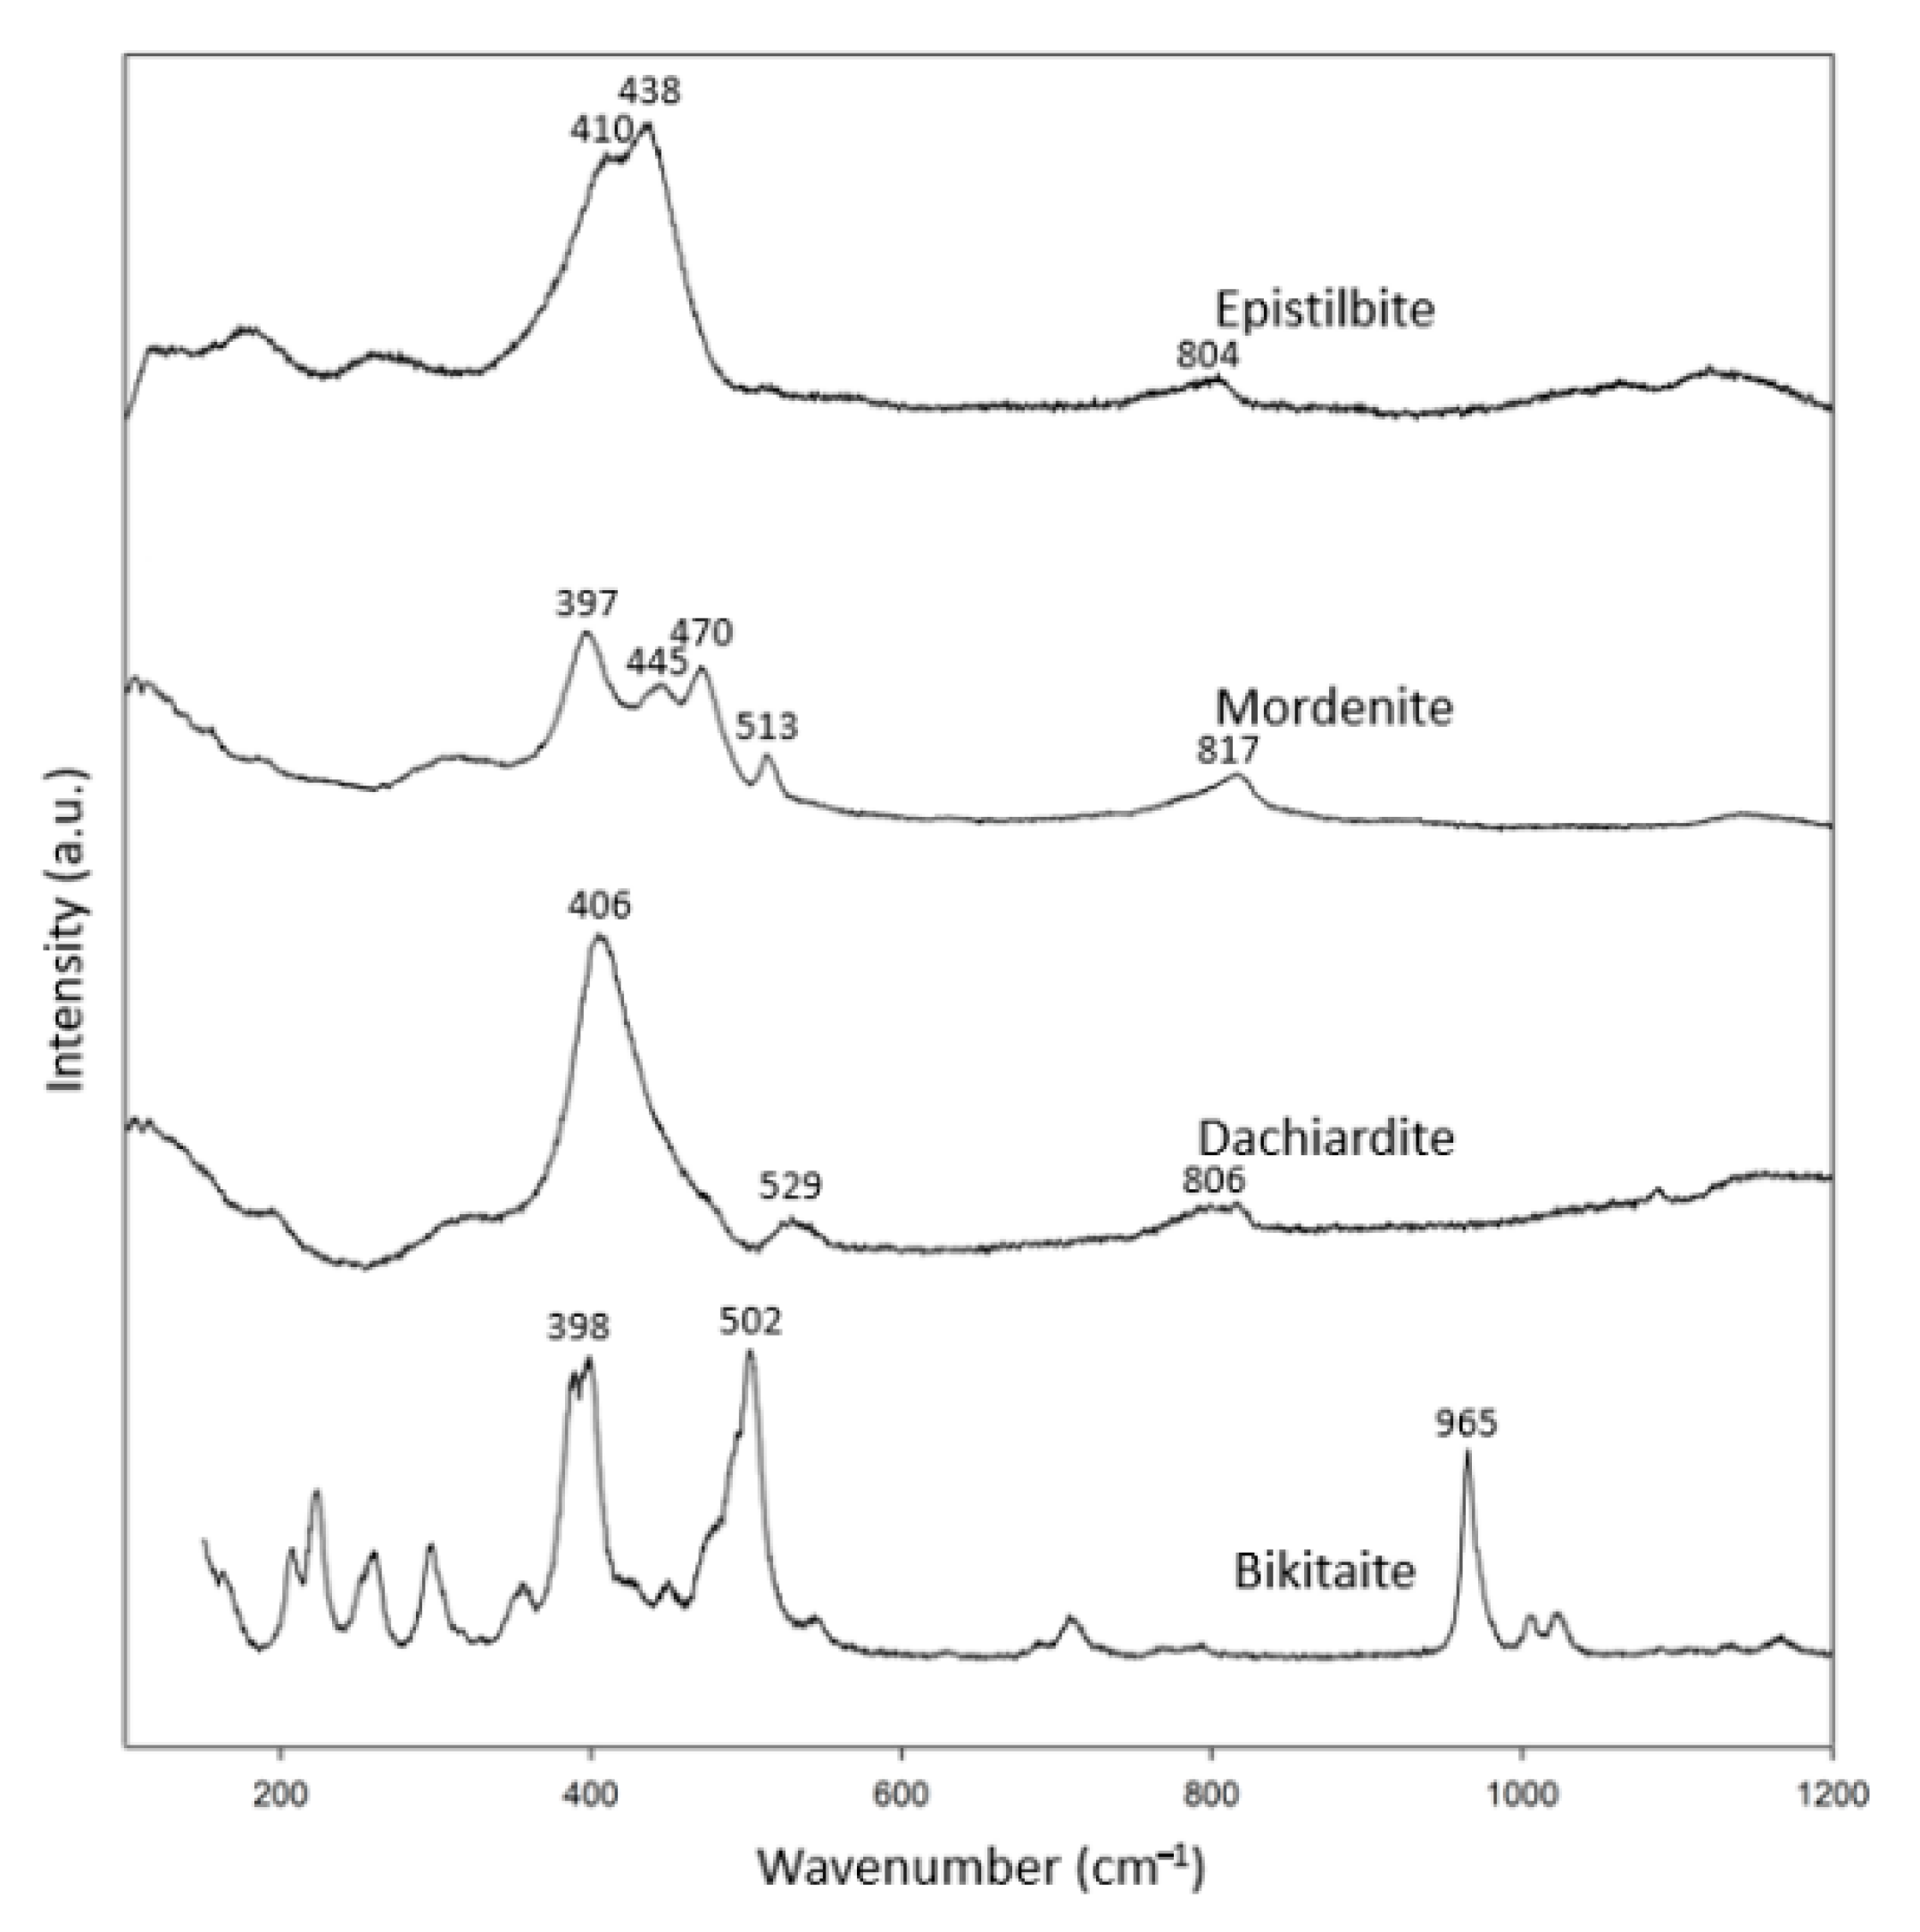
Zeolites of the mordenite group (Figure 1f) are also rare; therefore, only one specimen from each of epistilbite, mordenite, dachiardite and bikitaite was analyzed (Table 6). The Raman spectra of zeolites in the mordenite group were more diversified (Figure 6). Knops-Gerrits et al. (1997) [18] reported that mordenite has its most intense peak at 395 cm−1, which is consistent with our mordenite [18]. According to Monsgawa (2001) [17], the most intense peak of mordenite is at 534 cm−1, which is different from our observation and the RRUFF data. In addition, the dachiardite of Mozgawa (2001) [17] had its most intense peak at 714 cm−1, which is also different from our result and the RRUFF data on dachiardite. We suspect that the result of Mozgawa (2001) [17] for dachiadite may not be reliable since most of the zeolites have their most intense peak in the spectral range of 379–538 cm−1.

Table 6.
Mordenite group zeolite specimens (chemical formula in blue analyzed by EDS).
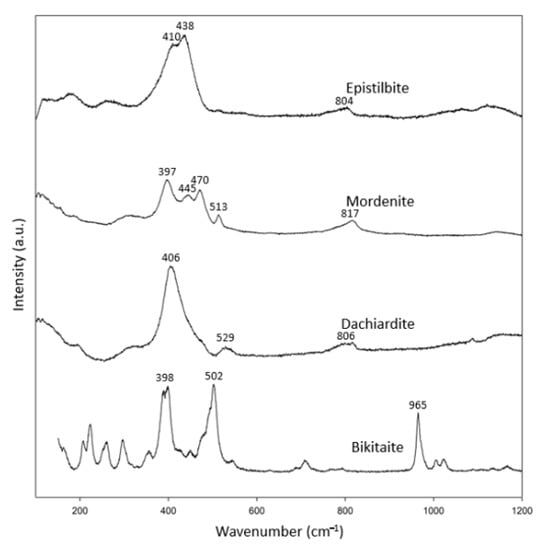
Figure 6.
Raman spectra of mordenite group zeolites.
The epistilbite in the RRUFF data bank (R061105) shows peaks at 397, 438, 469 and 805 cm−1, but our epistilbite only showed peaks at 410 and 438 cm−1. However, our Raman spectrum for epstilbite agrees well with that of Mozgawa (2001) [17]. It is likely that R061105 may contain Raman signals from two minerals, with most of its characteristic peaks similar to those of mordenite. However, our epistilbite specimen is a single crystal, which yields a more reliable Raman spectrum. In short, in combination with the RRUFF data, these specimens showed more than one characteristic peak in the spectral range 397–470 cm−1, and another peak in the spectral range 502–529 cm−1. In this group, an additional peak appeared in the spectral range of 800–965 cm−1.
3.1.6. Heulandite Group
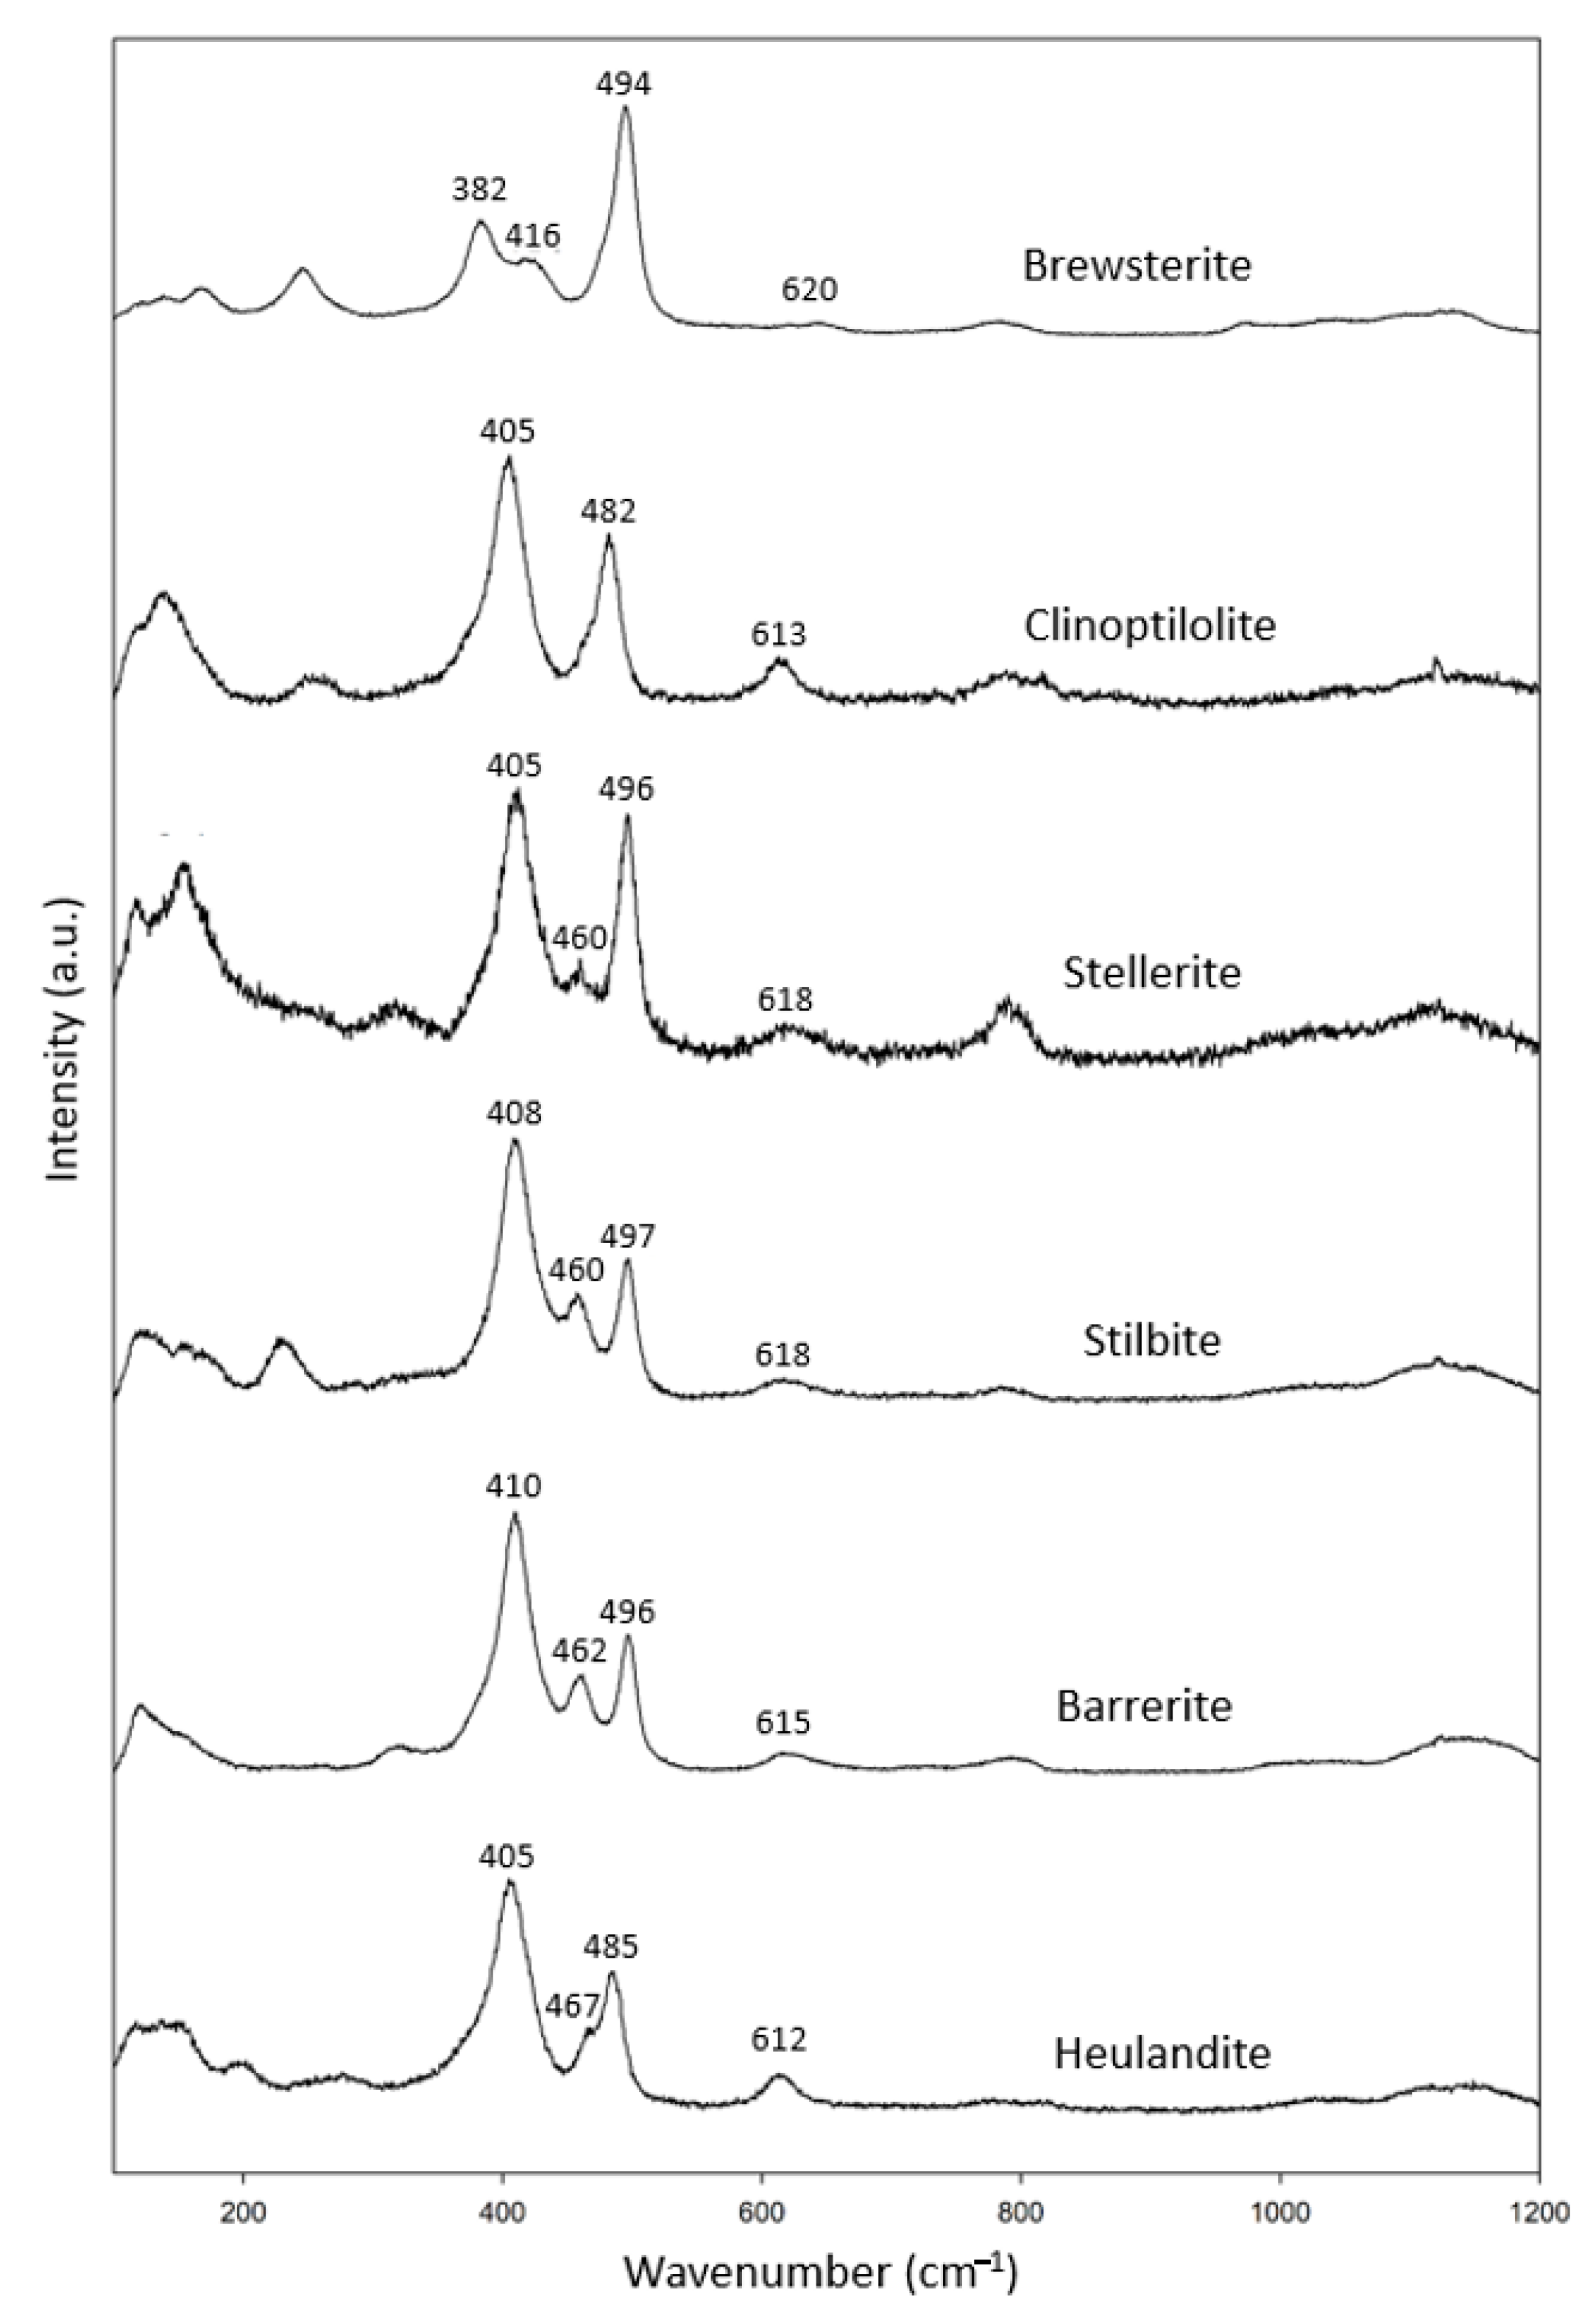
We had a complete set of zeolites in the heulandite group (Figure 1g), including two specimens of clinoptilolite, stellerite and stilbite, and one specimen of brewsterite, stilbite, barrerite and heulandite (Table 7). In combination with the RRUFF data, these specimens showed common characteristic peaks at 402–416 cm−1, 480–500 cm−1 and 612–620 cm−1 (Figure 7).

Table 7.
Heulandite group zeolite specimens (chemical formula in blue analyzed by EDS).
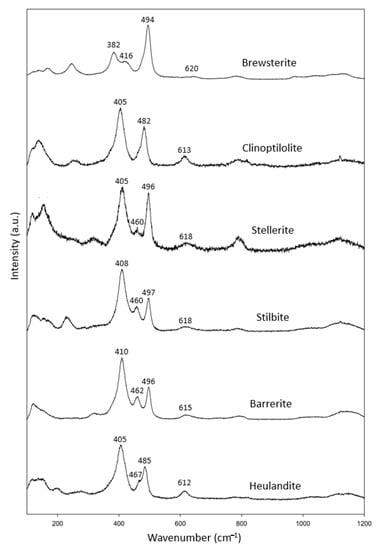
Figure 7.
Raman spectra of heulandite group zeolites.
3.1.7. Unknown Structure
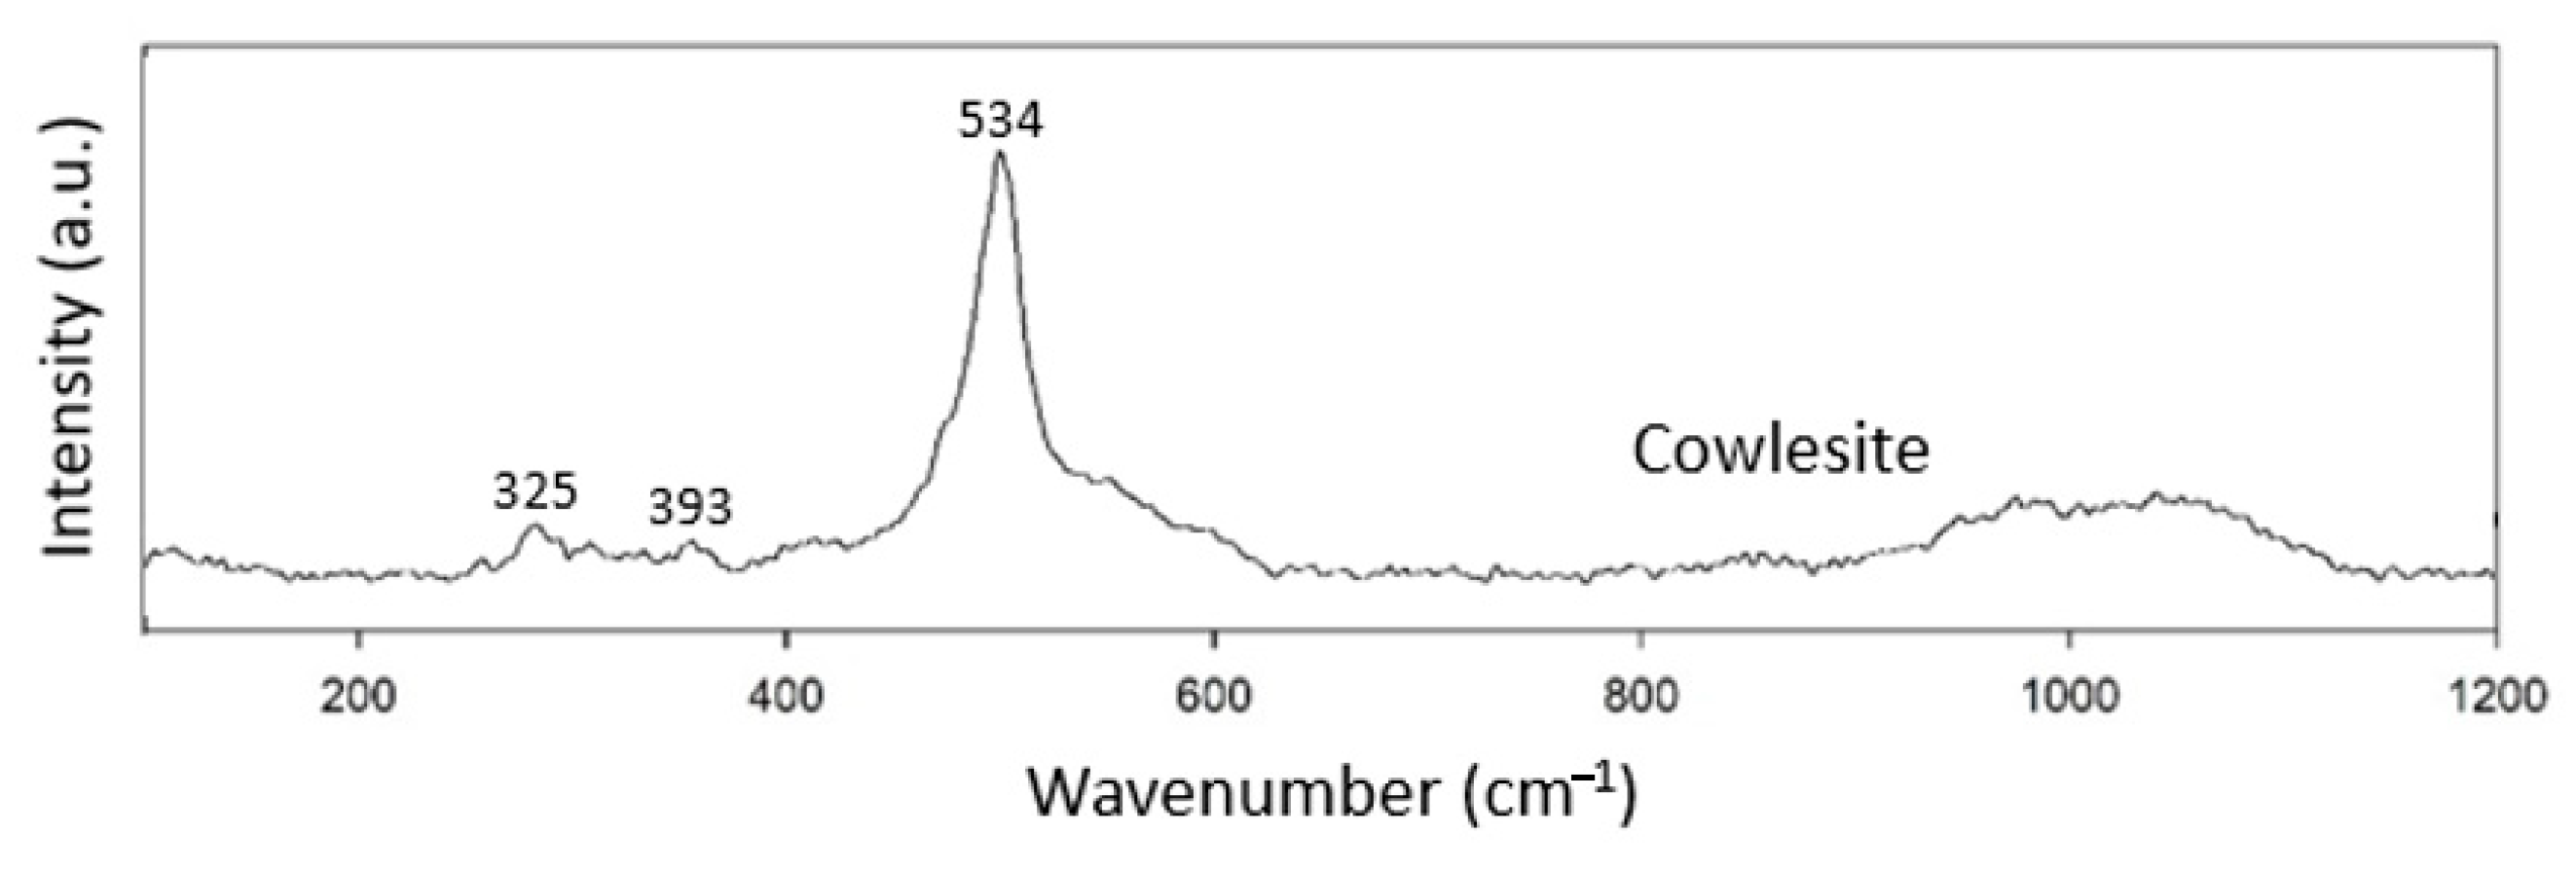
Cowlesite is not classified as belonging to any of the zeolite structural groups yet (Table 8). The Raman spectrum of cowlesite was not very complicated and only showed peaks at 325, 393 and 534 cm−1. The peaks at 325 and 393 cm−1 were not very prominent (Figure 8). Since no other zeolites are classified in this group, we tentatively take 534 cm−1 as the characteristic peak for zeolites of the unknown group.

Table 8.
Unknown structure group zeolite specimen.
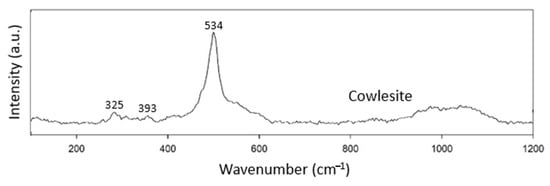
Figure 8.
Raman spectra of cowlesite.
3.2. Comparison between Different Zeolite Groups
According to Gujar et al. (2005) [19], the Raman peaks in the spectral range of 380–530 cm−1 represent the vibration modes of T-O-T bonding, where T stands for Si or Al. In this study, we have integrated our results for Raman spectra in Table 9. All zeolites invariantly showed two separated regions of peak locations in the spectral range of 379–538 cm−1. One location was in the spectral range 379–447 cm−1 and the other was in the spectral range of 463–538 cm−1. We tentatively suggest that the former and the latter sets of peaks may be associated with Al-O-Al and Si-O-Si, respectively. All the Al-O-Al modes were in the spectral range of 379–447 cm−1 except for the chabazite group. However, zeolites in the chabazite group showed another characteristic peak at 320–340 cm−1, which can be used as a criterion to distinguish it from other groups. The relatively complicated structure of the mordenite and heulandite groups showed additional peaks in the spectral ranges of 612–620 cm−1 and 800–965 cm−1, which were also unique among the zeolite groups. Another interesting phenomenon was the most intense peak at 463–538 cm−1 for most zeolite groups except the mordenite and heulandite groups, which showed their most intense peak at 397–416 cm−1.

Table 9.
The Al-O-Al and Si-O-Si modes of each group of zeolites (unit: cm−1).
After carefully comparing the characteristic Raman peaks of all zeolites, we obtained the following rules for the identification of different zeolite groups, as shown in Figure 9.

Figure 9.
Characteristic Raman spectrum peaks of each group of zeolites.
- (1)
- The fibrous natrolite group can be identified by the characteristic peaks at 528–538 cm−1.
- (2)
- The singly-connected four-cycle chain analcime group can be identified by the characteristic peaks at 379–392 cm−1.
- (3)
- The doubly-connected four-cycle chain gismondine group has a pattern almost overlapping the zeolites of other groups, and only the characteristic peaks at 391–432 cm−1 can be used for the recognition of this group. The Al-O-Al modes of gismondine, amicite and gobbinsite fall in the spectral range of 391–432 cm−1, which overlaps with the Al-O-Al modes in the mordenite and heulandite groups. This group has a very wide composition.
- (4)
- The six-cycle ring chabazite group can be recognized by the unique presence of a characteristic peak at 320–340 cm−1.
- (5)
- The spectra of the mordenite group overlap with other zeolites, and the peaks at 800–965 cm−1 are suitable for its identification.
- (6)
- The spectra of the heulandite group also overlap with other zeolites in prominent characteristic peaks, and only the peak at 612–620 cm−1 can be used for its identification.
- (7)
- Most mordenite and heulandite groups have higher intense peaks in the range of Al-O-Al modes, which are different from the gismondine group.
3.3. The Meaning of Characteristic Vibration Modes
Zeolite minerals are numerous, and their structures are diverse. Therefore, it is difficult to distinguish their identity, irrespective of which XRD or Raman spectroscopic method is applied for the identification. It is quite common for more than two zeolite minerals to coexist in a rock due to their similarity in occurrence. The presence of solid solution in zeolites [13,14,20] may also cause a shift in the position of Raman characteristic peaks [11,21,22]. The results of this study provide the first-principle qualitative identification of zeolites among various structural groups, which makes the further classification of zeolites easier.
Mozgawa (2001) [17] analyzed the vibrational modes of zeolites by means of IR and Raman spectroscopy and concluded that the 390–415 cm−1 and 480–500 cm−1 ranges are associated with five-ring (heulandite group) and four-ring zeolites, respectively. This structural relationship was confirmed by Yu et al. (2001) [23], who concluded that 370–430 cm−1 and 470–530 cm−1 modes are related to five-ring and four-ring zeolites, respectively [23]. Yu et al. (2001) [23] further proposed that peaks at 290–410 cm−1 and 220–280 cm−1 can be related to six-ring and eight-ring zeolite structures, respectively.
Mozgawa (2001) [17] also concluded that IR provides more significant evidence than Raman spectra regarding the relationship of vibrational modes and structural types in zeolites, which is currently under investigation. However, we believe that our systematic work on zeolites indicates that Raman spectroscopic data can also provide sufficient evidence for the assignment of vibrational modes to structural types in zeolite.
The physical significance of various vibrational modes was investigated by Gujar et al. (2005) [19] who compiled previous studies on zeolites and assigned their vibration modes as shown in Table 10. These modes are mostly attributed to the linear stretching vibration and non-linear bending vibration modes. All zeolite minerals have their characteristic peaks in the spectral range of 380–538 cm−1, which denotes the T-O-T vibration modes. As described above, these peaks have been tentatively assigned as the Al-O-Al and Si-O-Si modes. The relative intensity and wavenumber of the Al-O-Al and Si-O-Si modes may be influenced by the Al/Si, which is an issue that needs further study. As for the M-O vibration mode, only the chabazite group shows obvious peaks at 320–340 cm−1. The characteristic peaks in the range of 800–965 cm−1 may be due to the vibration of Si in the tetrahedrons, which only occurs in more complex structures such as the mordenite and heulandite groups. Further investigation regarding zeolites of new species or species with unknown structures is required.

Table 10.
Raman vibration modes of zeolites (modified from Ref. [19]).
4. Conclusions
The most intense Raman peaks occur in the spectral range of 379–538 cm−1, representing the T-O-T vibrational modes, almost invariantly containing the Al-O-Al and Si-O-Si modes. The fibrous natrolite group is most easily recognized by the specific T-O-T vibrational modes at 433–447 cm−1 and the T-O mode at 528–538 cm−1. The singly-connected four-ring chain analcime group processes a specific Al-O-Al mode at 379–392 cm−1, which is separable from other groups of zeolites. The six-ring chabazite group lacks an Al-O-Al mode, but the specific M-O mode at 320–340 cm−1 is unique among all zeolites. In the mordenite group, additional modes of Si-O-Si at 470–529 cm−1 and Si in the tetrahedron mode at 800–965 cm−1 can be used as a criterion to distinguish it from other groups. The heulandite group stands apart due to the presence of a vibrational mode at 612–620 cm−1. The doubly-connected four-ring chain of the gismondine group overlaps its T-O-T mode with the mordenite and heulandite groups, but the gismondine group has minor T-O-T modes at 391–432 cm−1. In the gismondine group, only gobbinsite has no specific criterion for the recognition of its identity, which is an issue that requires further research or more detailed spectral investigation.
Band positions correspond only to the samples tested in this study. The band positions may differ due to different types of equipment, excitation laser source, chemical composition and crystal orientation when results from other laboratories are compared. More work needs to be done to justify the achievements in this study. Despite the fact that numerous data can be obtained through websites such as RRUFF, it is necessary that systematic investigations of zeolites are performed in order to obtain meaningful results.
Author Contributions
Y.-L.T. prepared the manuscript; E.H. provided the idea and offered instruction on the Raman technique; H.-F.C. coordinated and planned the experiments, as well as synthesizing special zeolites; Y.-H.L. collected zeolites and repeated the experiments; H.-T.H. and J.-H.J. conducted previous experiments; T.-C.L. and J.-N.F. supported the Raman operation. All authors have read and agreed to the published version of the manuscript.
Funding
This study was sponsored by a research grant from the Center of Excellence for Oceans, National Taiwan Ocean University, and the Ministry of Science and Technology in Taiwan (grant number MOST 109-2116-M-019-006).
Data Availability Statement
The data presented in this study are available on request from the corresponding author Huei-Fen Chen, because most data were established in our lab. The data are not publicly available due to “we want to construct a software for mineral identification by Raman spectrum peaking” in the future.
Conflicts of Interest
The authors declare no conflict of interest.
References
- Cronstedt, A.F. Observation and description of an unknown kind of rock to be named zeolites: Kongl. Vetenskaps. Acad. Handl. Stockh. 1756, 17, 120–123. [Google Scholar]
- Flenigen, E.M. Chapter 2 Zeolites and molecular sieves: An historical perspective. Stud. Surf. Sci. Catal. 2001, 137, 11–35. [Google Scholar]
- Nguyen, M.L.; Tanner, C.C. Ammonium removal from wastewaters using natural New Zealand zeolites. N. Zeal. J. Agric. Res. 1998, 41, 427–446. [Google Scholar] [CrossRef]
- Wiesmann, U. Biological nitrogen removal from wastewater. Adv. Biochem. Eng. Biotechnol. 1994, 51, 114–153. [Google Scholar]
- Chen, H.F.; Lin, Y.J.; Chen, B.H.; Yoshiyuki, I.; Liou, S.Y.H.; Huang, R.T. A further investigation of NH4+ removal mechanisms by using natural and synthetic zeolites in different concentrations and temperatures. Minerals 2018, 8, 499. [Google Scholar] [CrossRef]
- Gottardi, G.; Galli, E. Natural Zeolites; Springer: Berlin/Heidelberg, Germany, 1985; pp. 1–422. [Google Scholar]
- Hey, M. Studies on zeolites: Part Ι. General review. Miner. Mag. 1930, 22, 422–437. [Google Scholar] [CrossRef]
- Zoltai, T. Classification of Silicates and other minerals with tetrahedral structures. Am. Mineral. 1960, 45, 960–973. [Google Scholar]
- Meier, W.M. Zeolite structures. In Molecular Sieves; Society of Chemical Industry: London, UK, 1968; pp. 10–27. [Google Scholar]
- Ghobarkar, H.; Schaf, O.; Massiani, Y.; Knauth, P. The Reconstruction of Natural Zeolites; Springer: Dordrecht, The Netherlands, 2003; pp. 1–154. [Google Scholar]
- Hong, S.T. Raman Spectroscopic Study of Zeolite Group Minerals. Master’s Thesis, National Taiwan Normal University, Taipei, Taiwan, 2005; 103p. (In Chinese). [Google Scholar]
- Chiang, Z.H. A Study on Raman Spectroscopy and Thermogravimetric Analysis of Natural and Synthetic Zeolites. Master’s Thesis, National Taiwan Ocean University, Keelung, Taiwan, 2008; 159p. (In Chinese). [Google Scholar]
- Chen, H.F.; Fang, J.N.; Lo, H.J.; Song, S.R.; Chung, S.H.; Chen, Y.L.; Lin, I.C.; Li, L.J. Syntheses of zeolites of the gismondine group: West. Pac. Earth Sci. 2002, 2, 331–346. [Google Scholar]
- Chen, H.F.; Fang, J.N.; Lo, H.J.; Song, S.R.; Chen, Y.L.; Chung, S.H.; Lee, C.Y.; Li, L.J.; Lin, I.C. The synthesis of merlinoite. West. Pac. Earth Sci. 2002, 2, 371–386. [Google Scholar]
- Goryainov, S.V.; Smirnov, M.B. Raman spectra and lattice-dynamical calculations of natrolite. Eur. J. Mineral. 2001, 13, 507–519. [Google Scholar] [CrossRef]
- Wopenka, B.; Freeman, J.J.; Nikischer, T. Raman Spectroscopic Identification of Fibrous Natural Zeolites. Appl. Spectrosc. 1998, 52, 54–63. [Google Scholar] [CrossRef]
- Mozgawa, W. The relation between structure and vibrational spectra of natural zeolites. J. Mol. Struct. 2001, 596, 129–137. [Google Scholar] [CrossRef]
- Knops-Gerrits, P.P.; Vos, D.E.D.; Feijen, E.J.P.; Jacobs, P.A. Raman spectroscopy on zeolites. Microporous Mater. 1997, 8, 3–17. [Google Scholar] [CrossRef]
- Gujar, A.C.; Moye, A.A.; Coghill, P.A.; Teeters, D.C.; Roberts, K.P.; Price, G.L. Raman investigation of the SUZ-4 zeolite. Microporous Mesoporous Mater. 2005, 78, 131–137. [Google Scholar] [CrossRef]
- Chen, H.F.; Lo, H.J.; Song, S.R.; Fang, J.N.; Chen, Y.L.; Li, L.J.; Lin, I.C.; Chung, S.H.; Lee, Y.T. The synthesis of phillipsite. West. Pac. Earth Sci. 2002, 2, 409–420. [Google Scholar]
- Dutta, P.K.; Barco, B.D. Raman Spectroscopy of Zeolite A: Influence of Si/Al Ratio. J. Phys. Chem. 1988, 92, 354–357. [Google Scholar] [CrossRef]
- Dutta, P.K.; Twu, J. Influence of Framework Silicon-Aluminum Ratio on the Raman Spectra of Faujasitic Zeolites. J. Phys. Chem. 1991, 95, 2498–2501. [Google Scholar] [CrossRef]
- Yu, Y.; Xiong, G.; Li, C.; Xiao, F.S. Characterization of aluminosilicate zeolites by UV Raman spectroscopy. Microporous Mesoporous Mater. 2001, 46, 23–34. [Google Scholar] [CrossRef]
Publisher’s Note: MDPI stays neutral with regard to jurisdictional claims in published maps and institutional affiliations. |
© 2021 by the authors. Licensee MDPI, Basel, Switzerland. This article is an open access article distributed under the terms and conditions of the Creative Commons Attribution (CC BY) license (http://creativecommons.org/licenses/by/4.0/).

