
Petrogenesis of Granitic Rocks in the Hisakajima Island, Goto Archipelago, Southwestern Japan: A Geochemical Study


Abstract
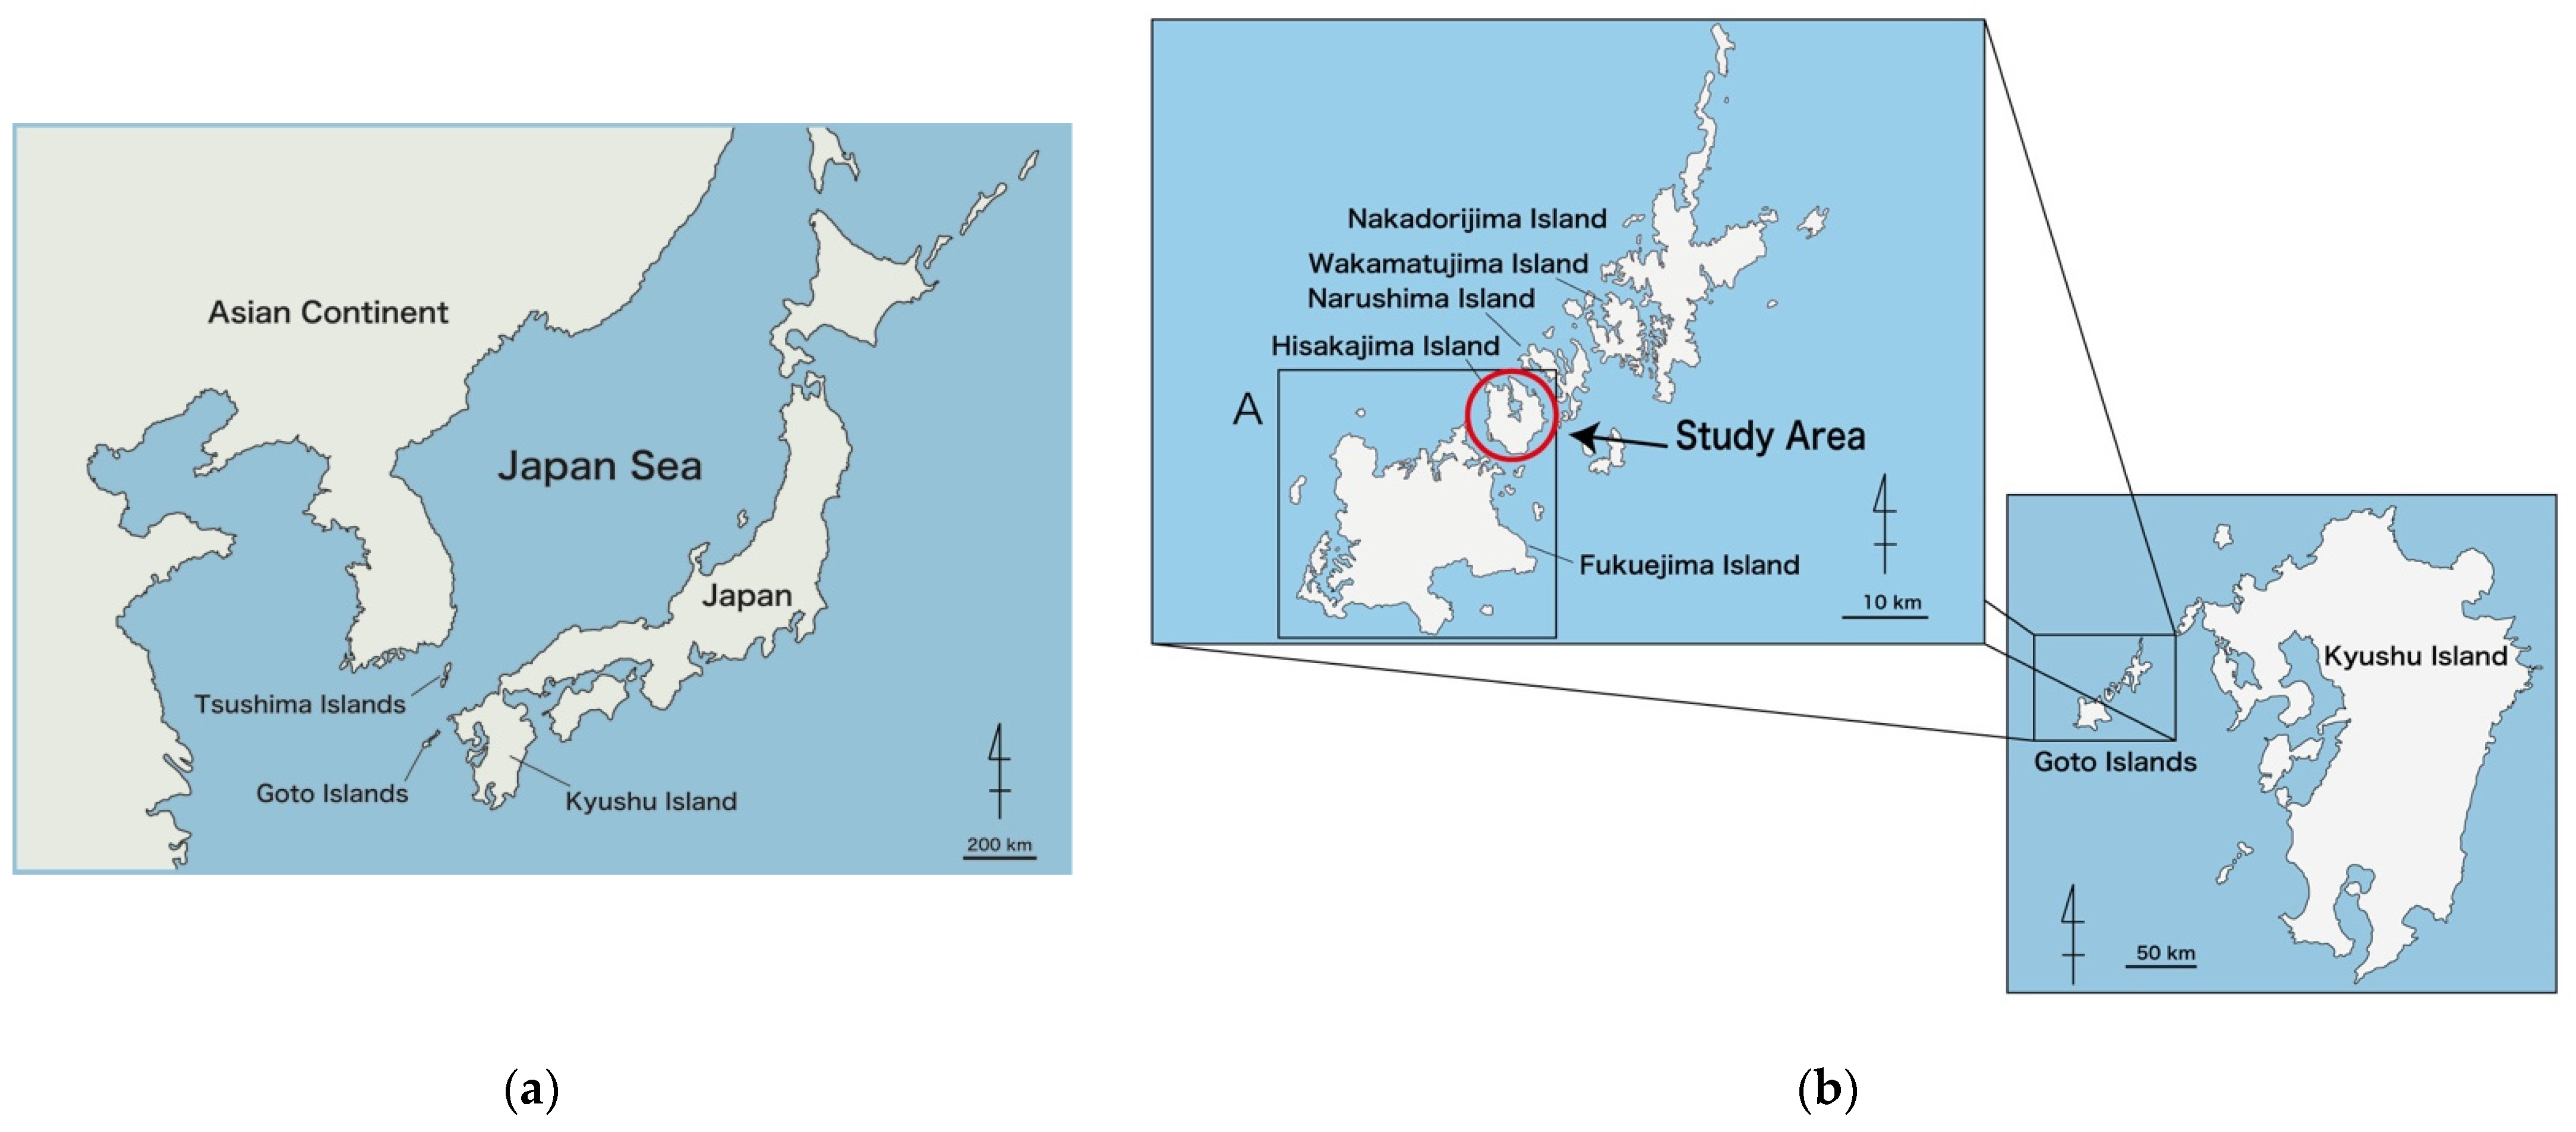
:1. Introduction
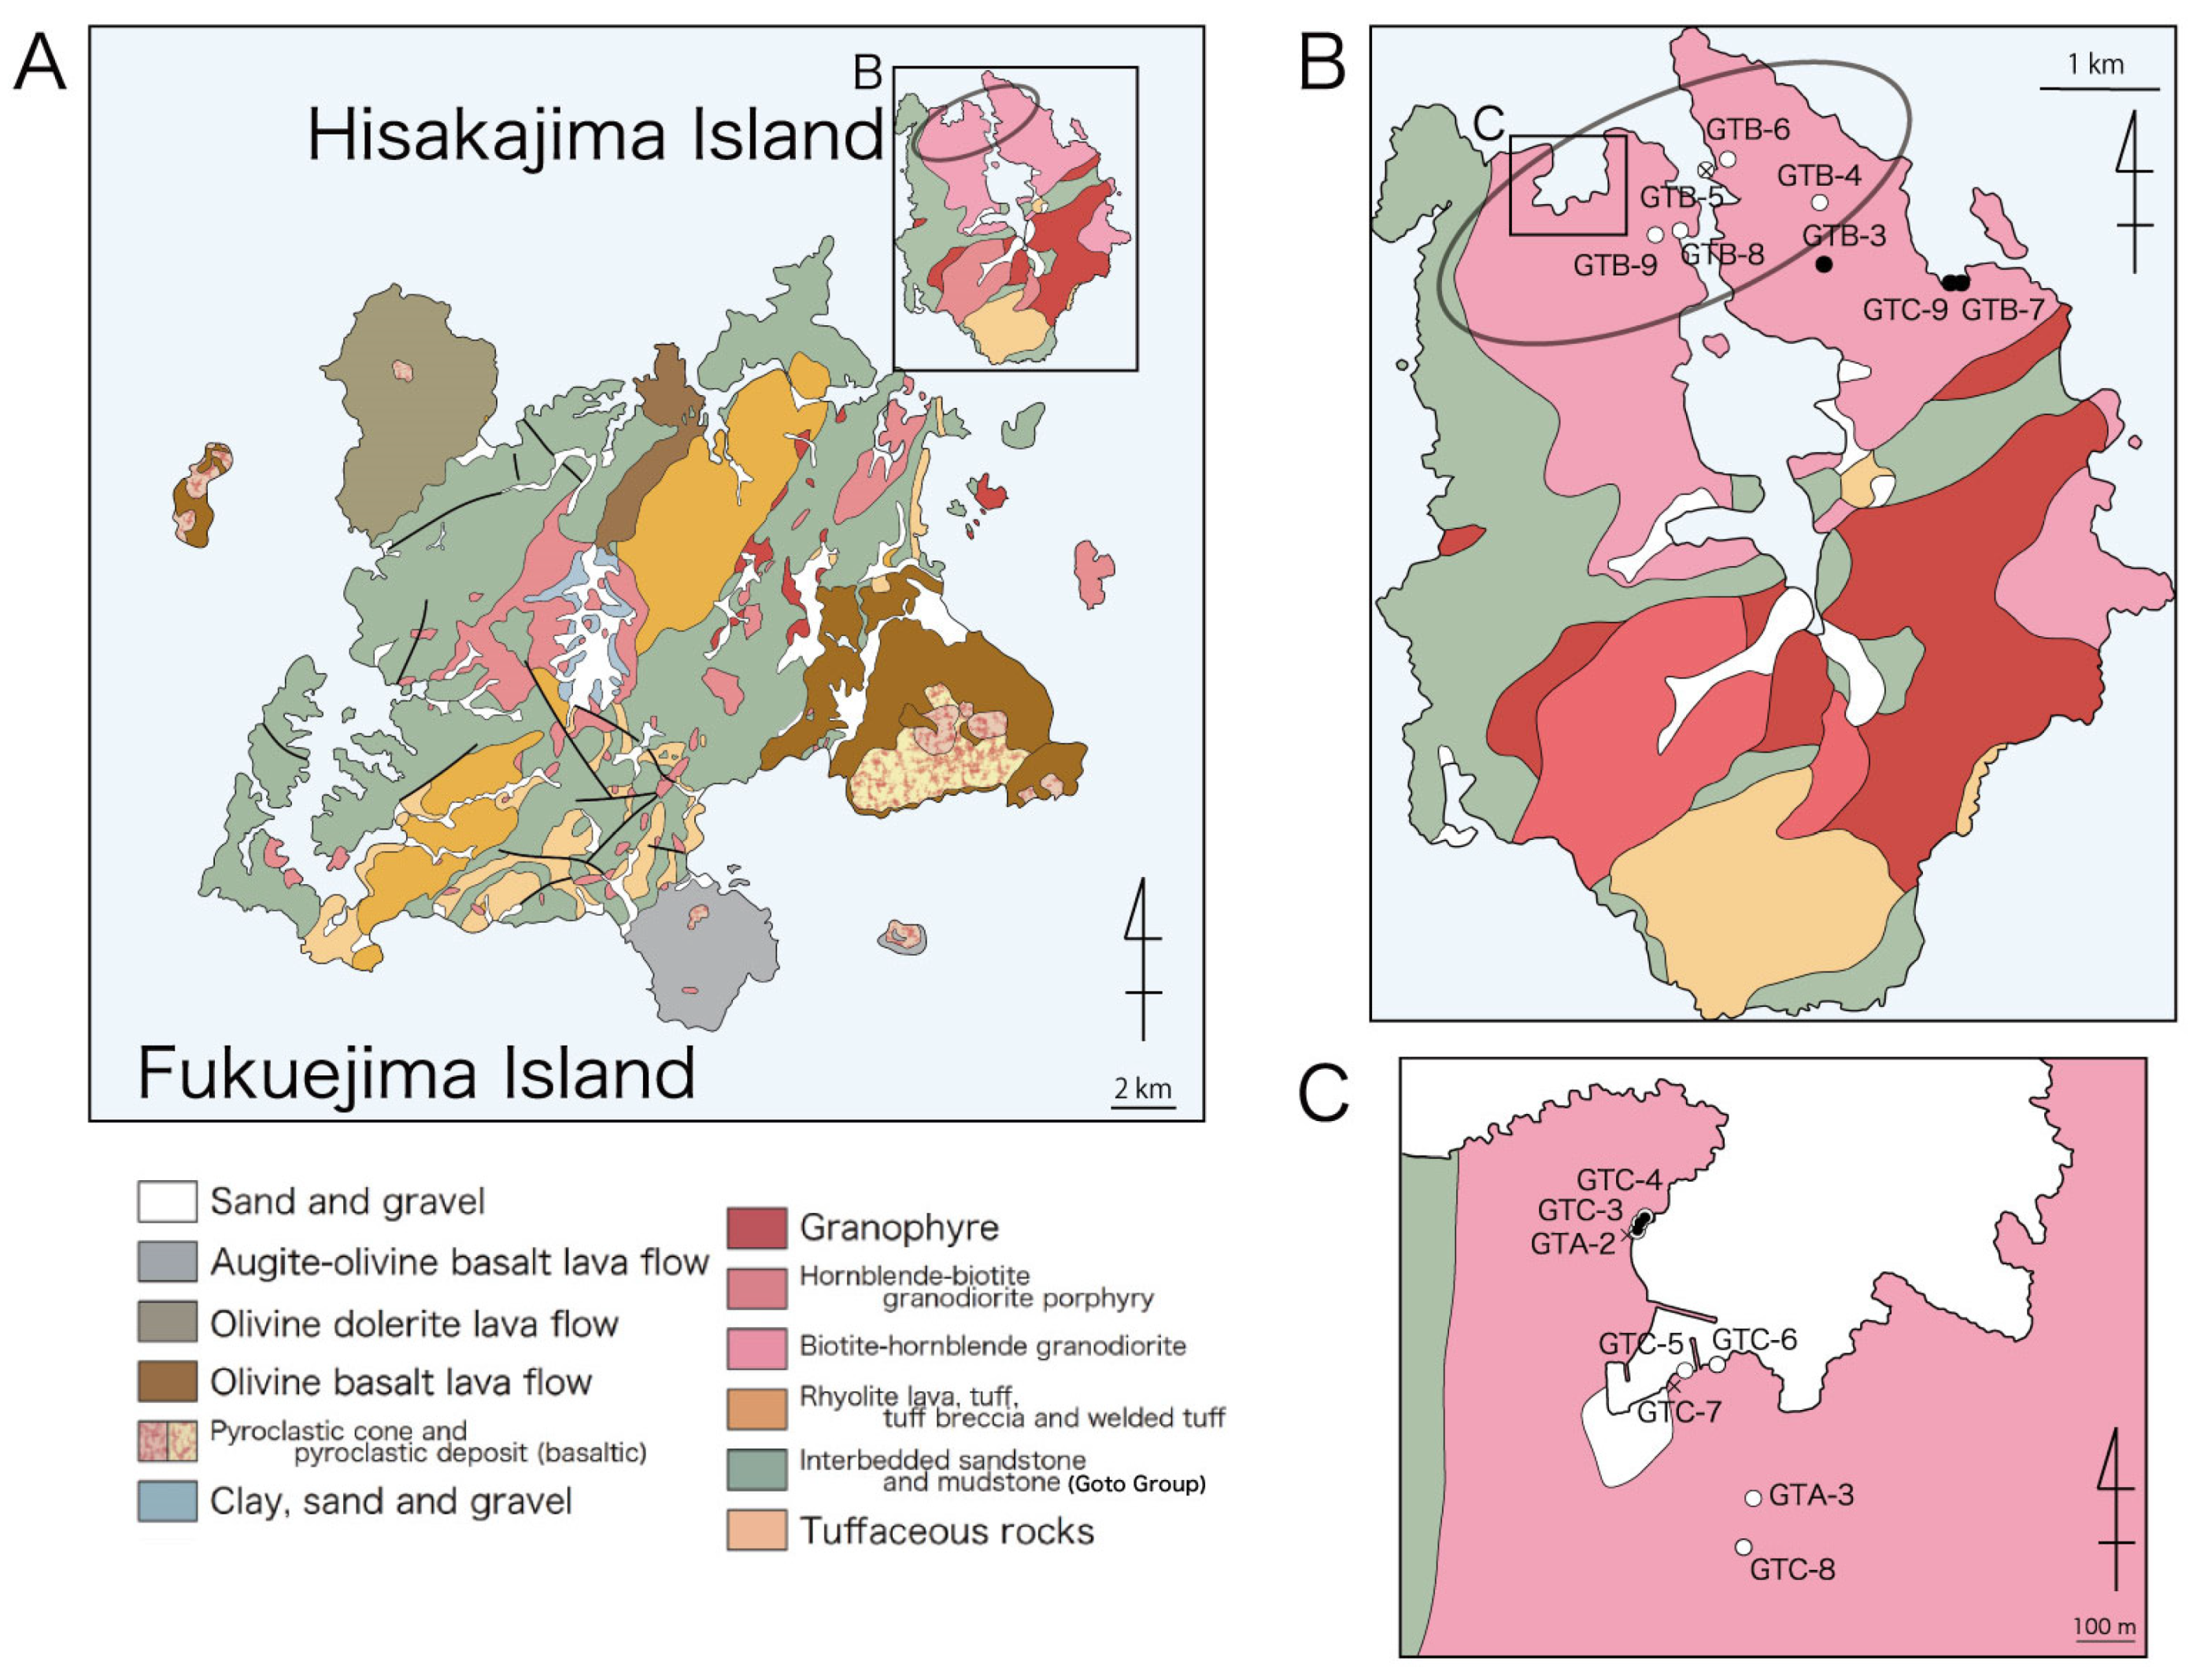
2. Geological Setting and Petrogenetic Information
3. Analytical Methods
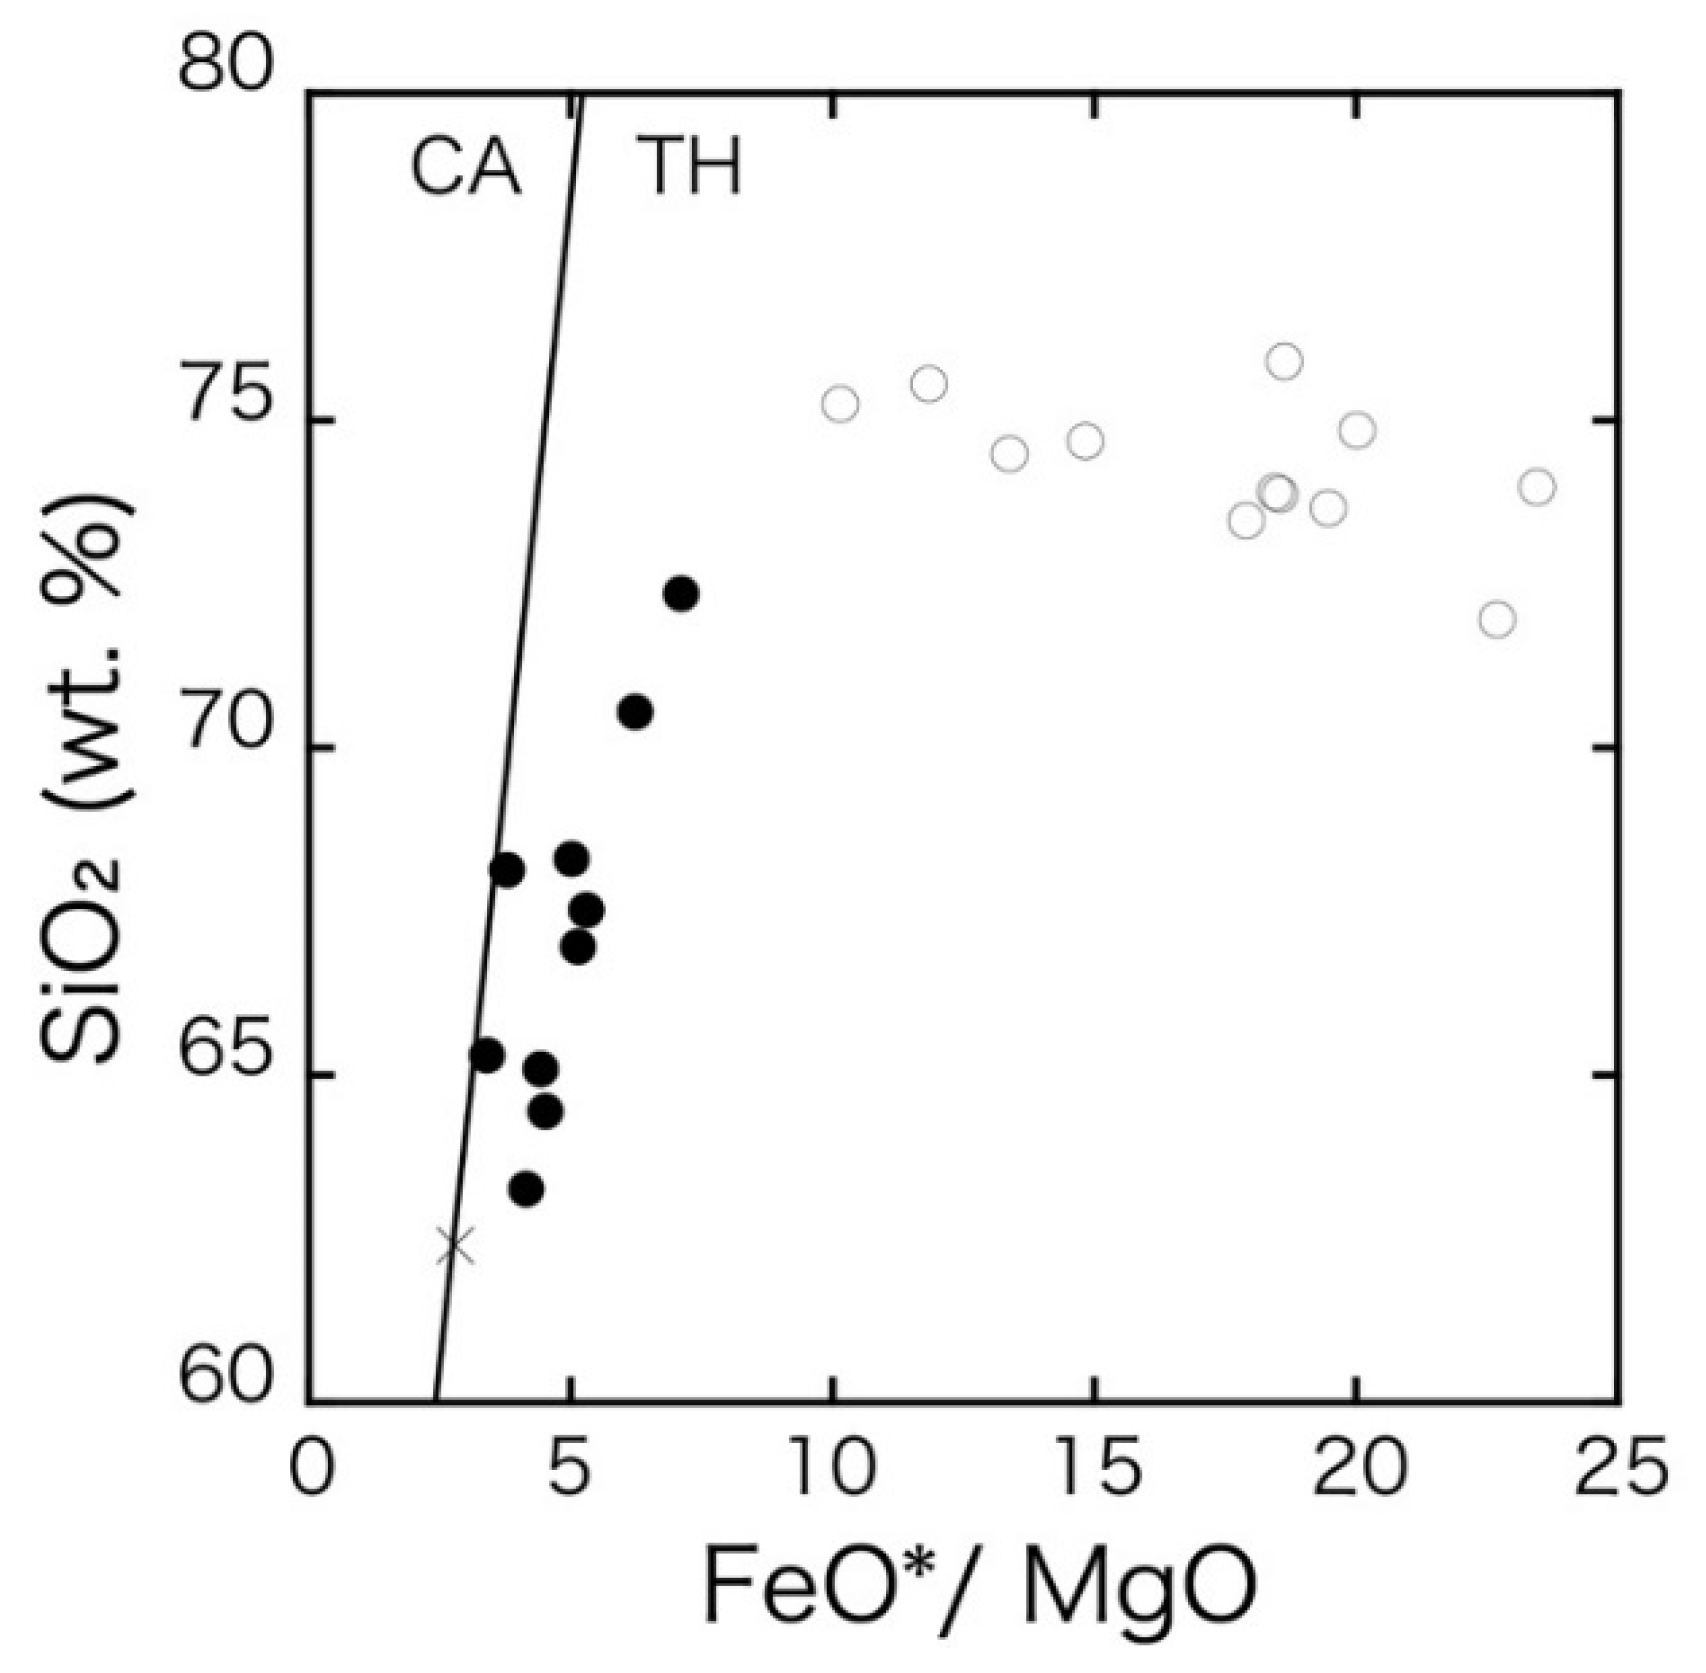
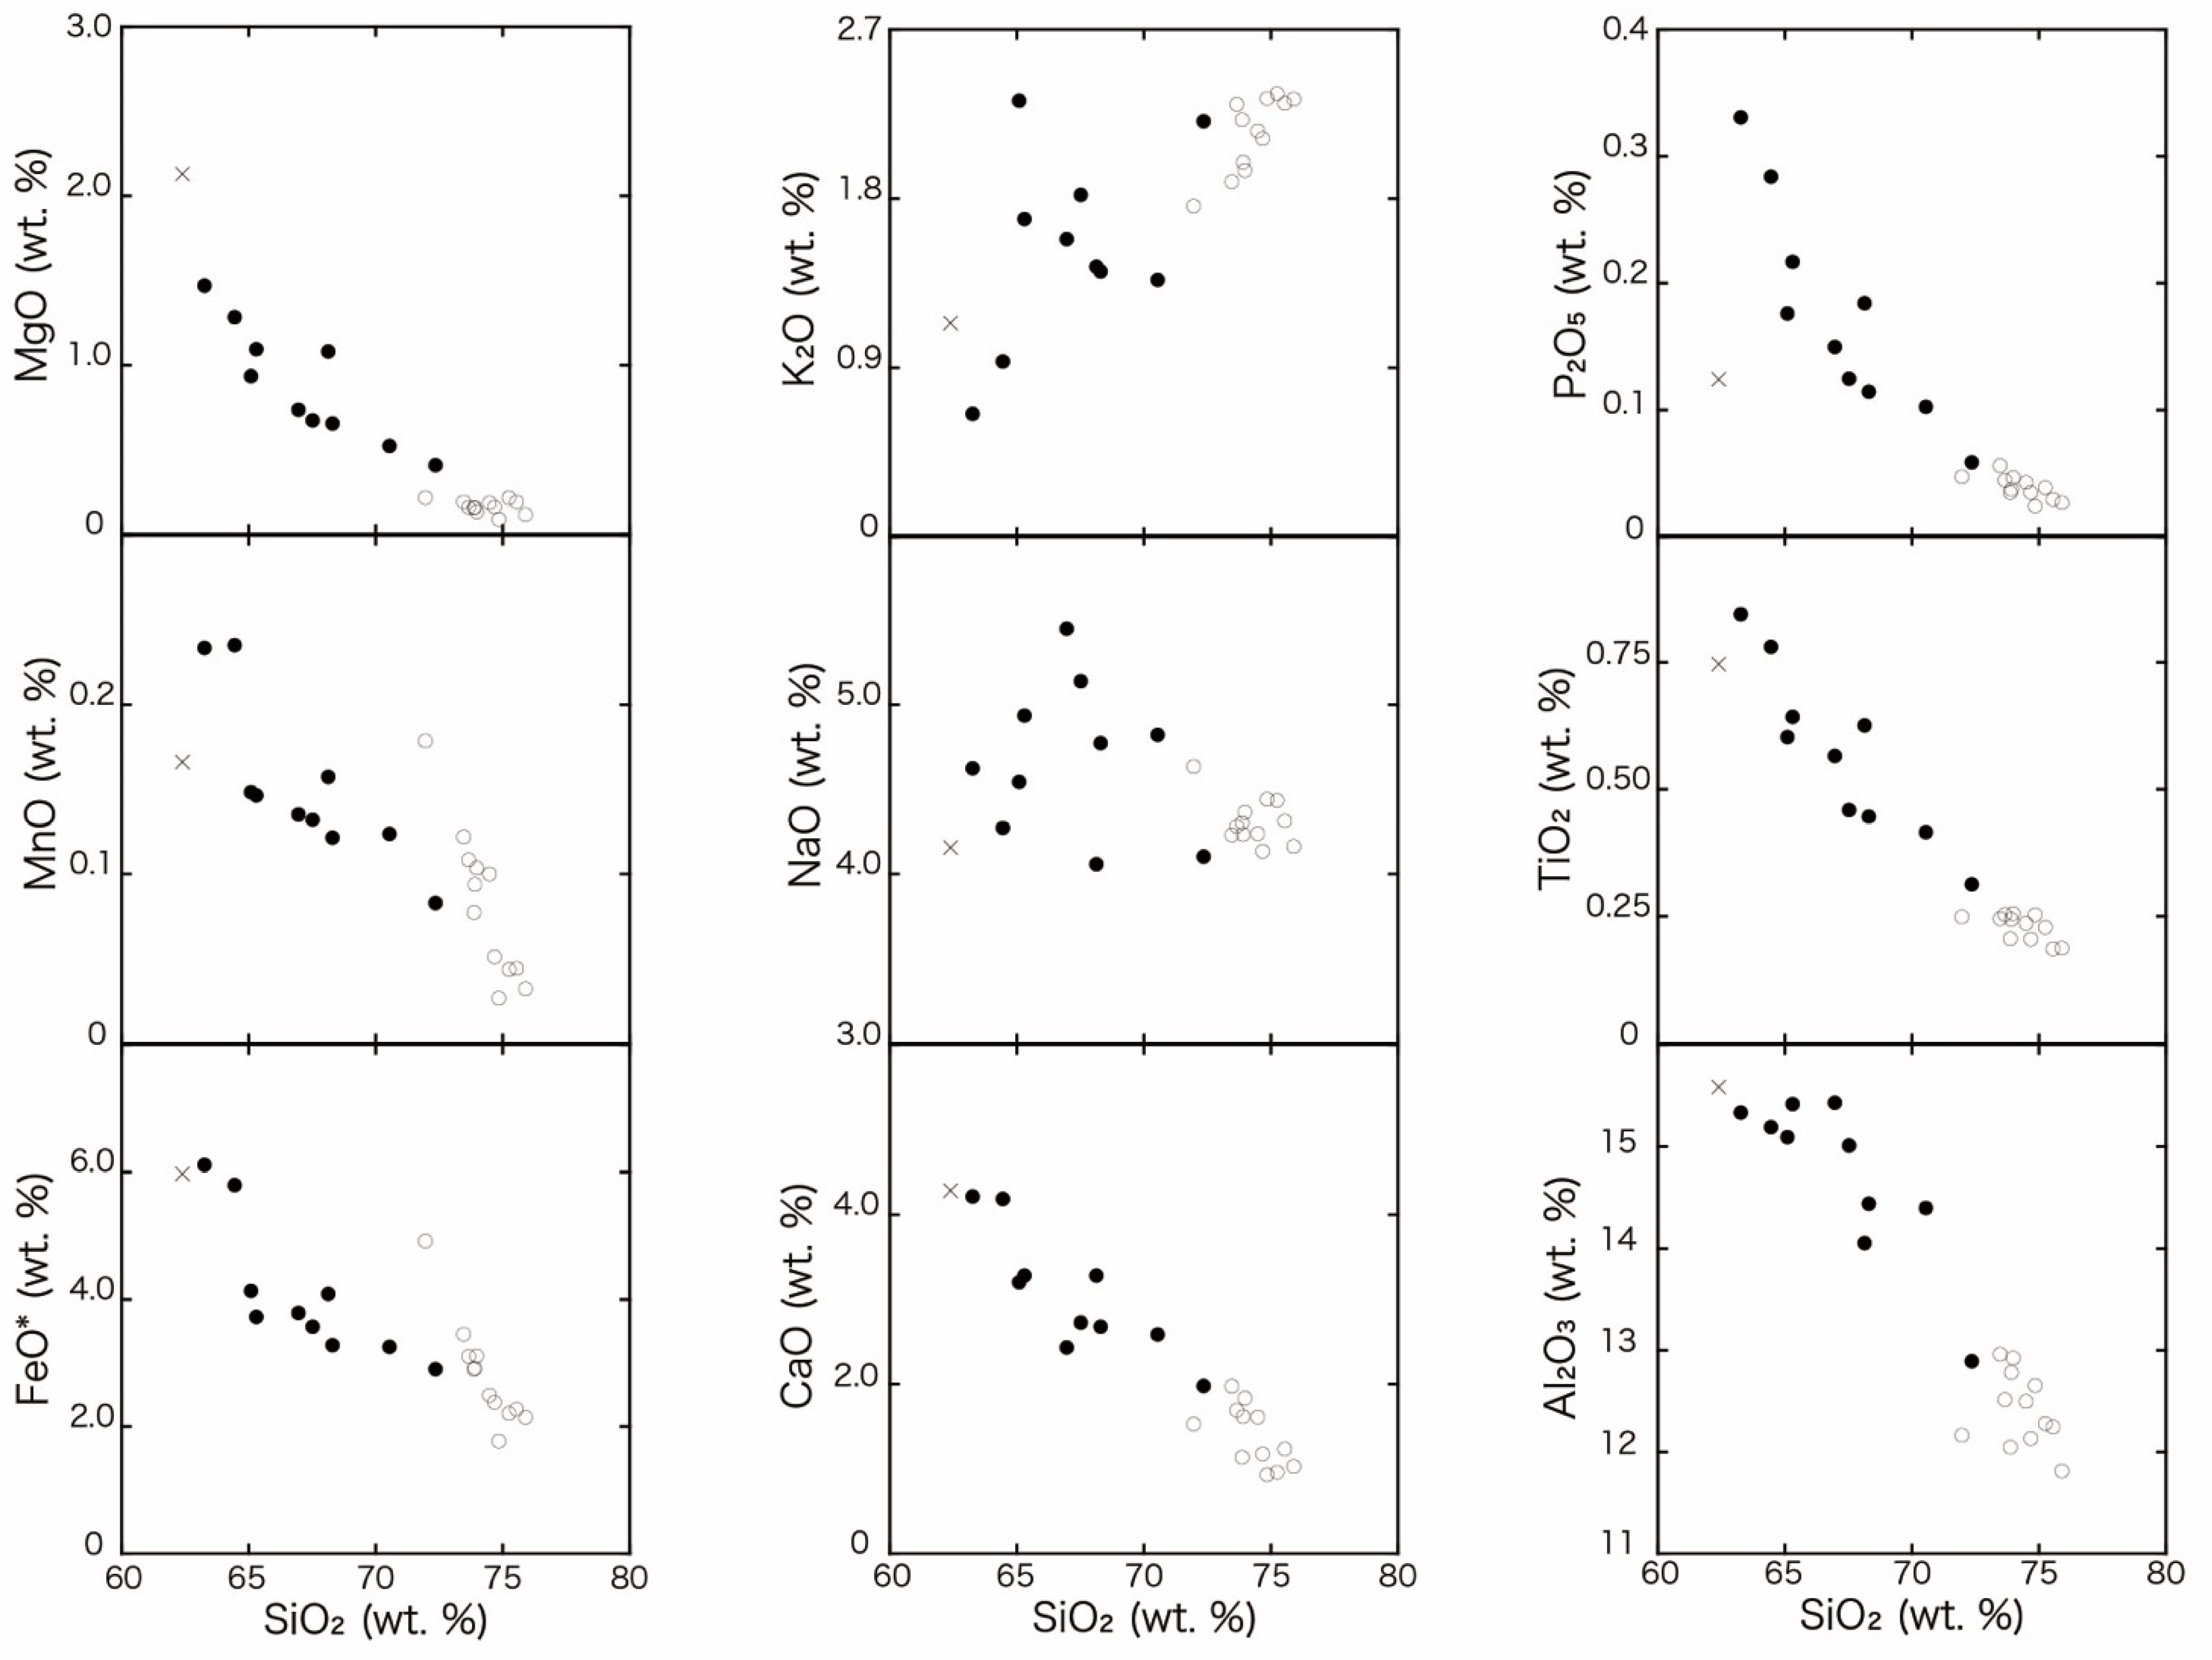
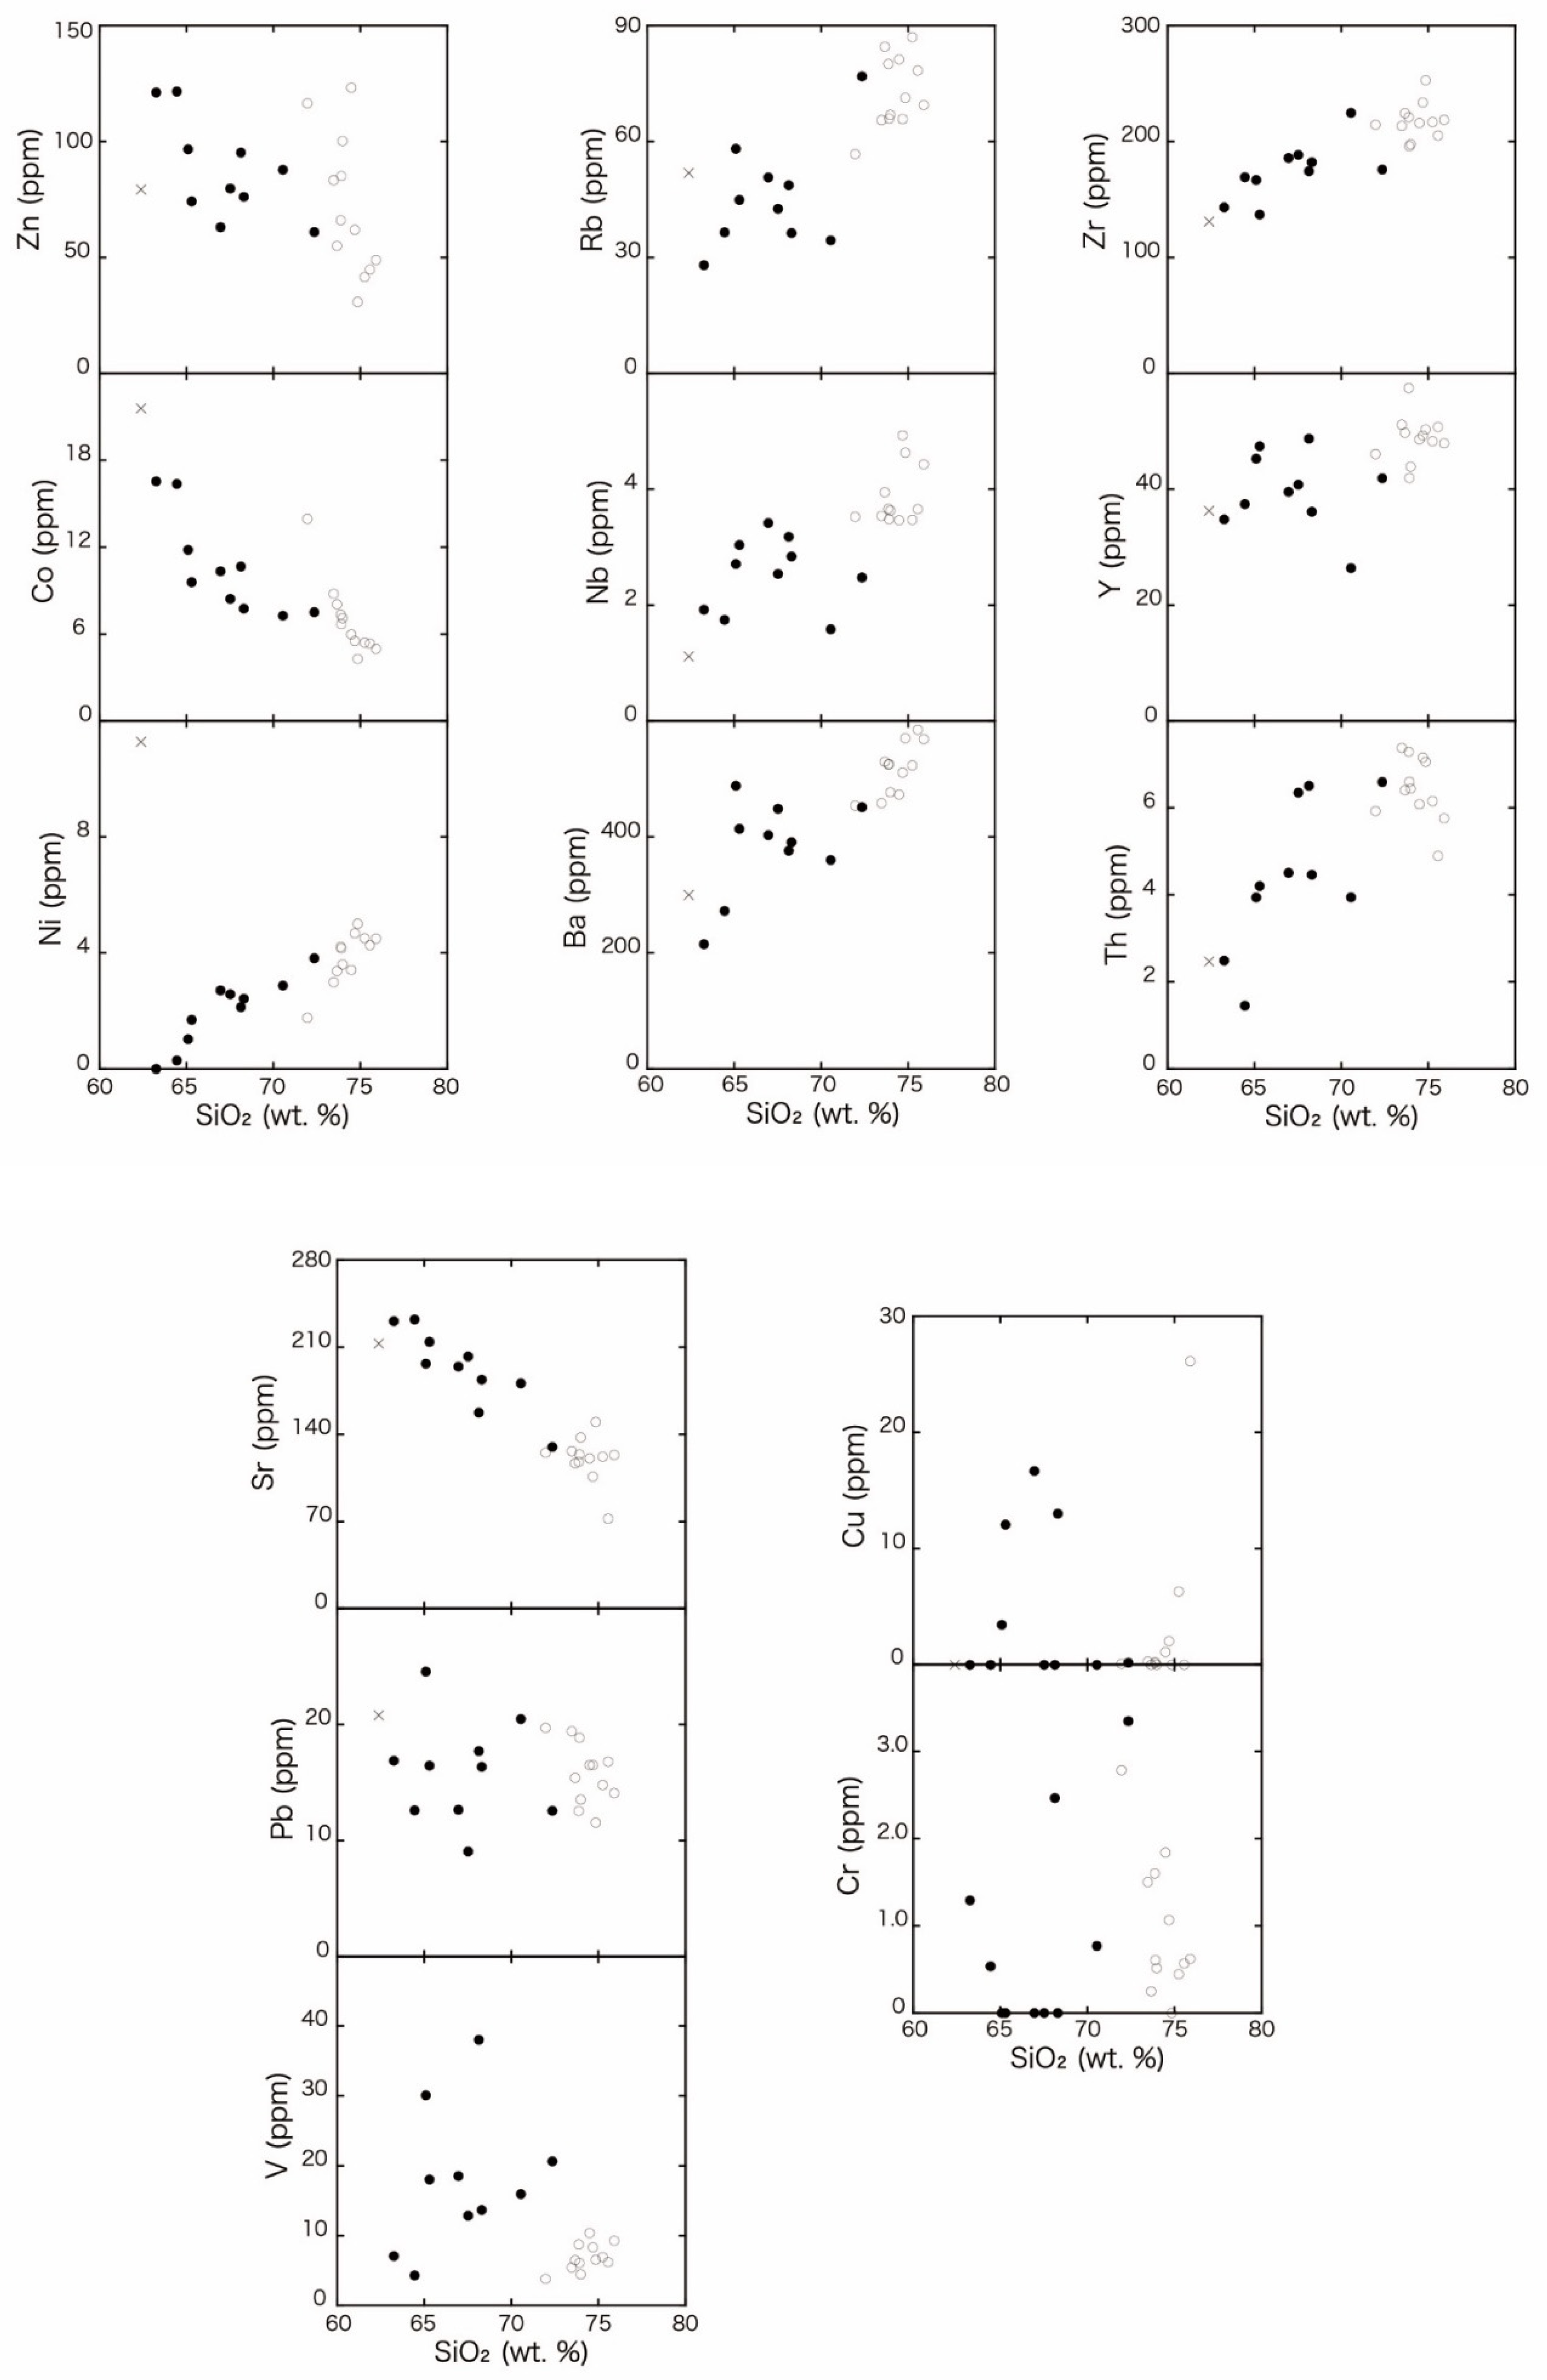
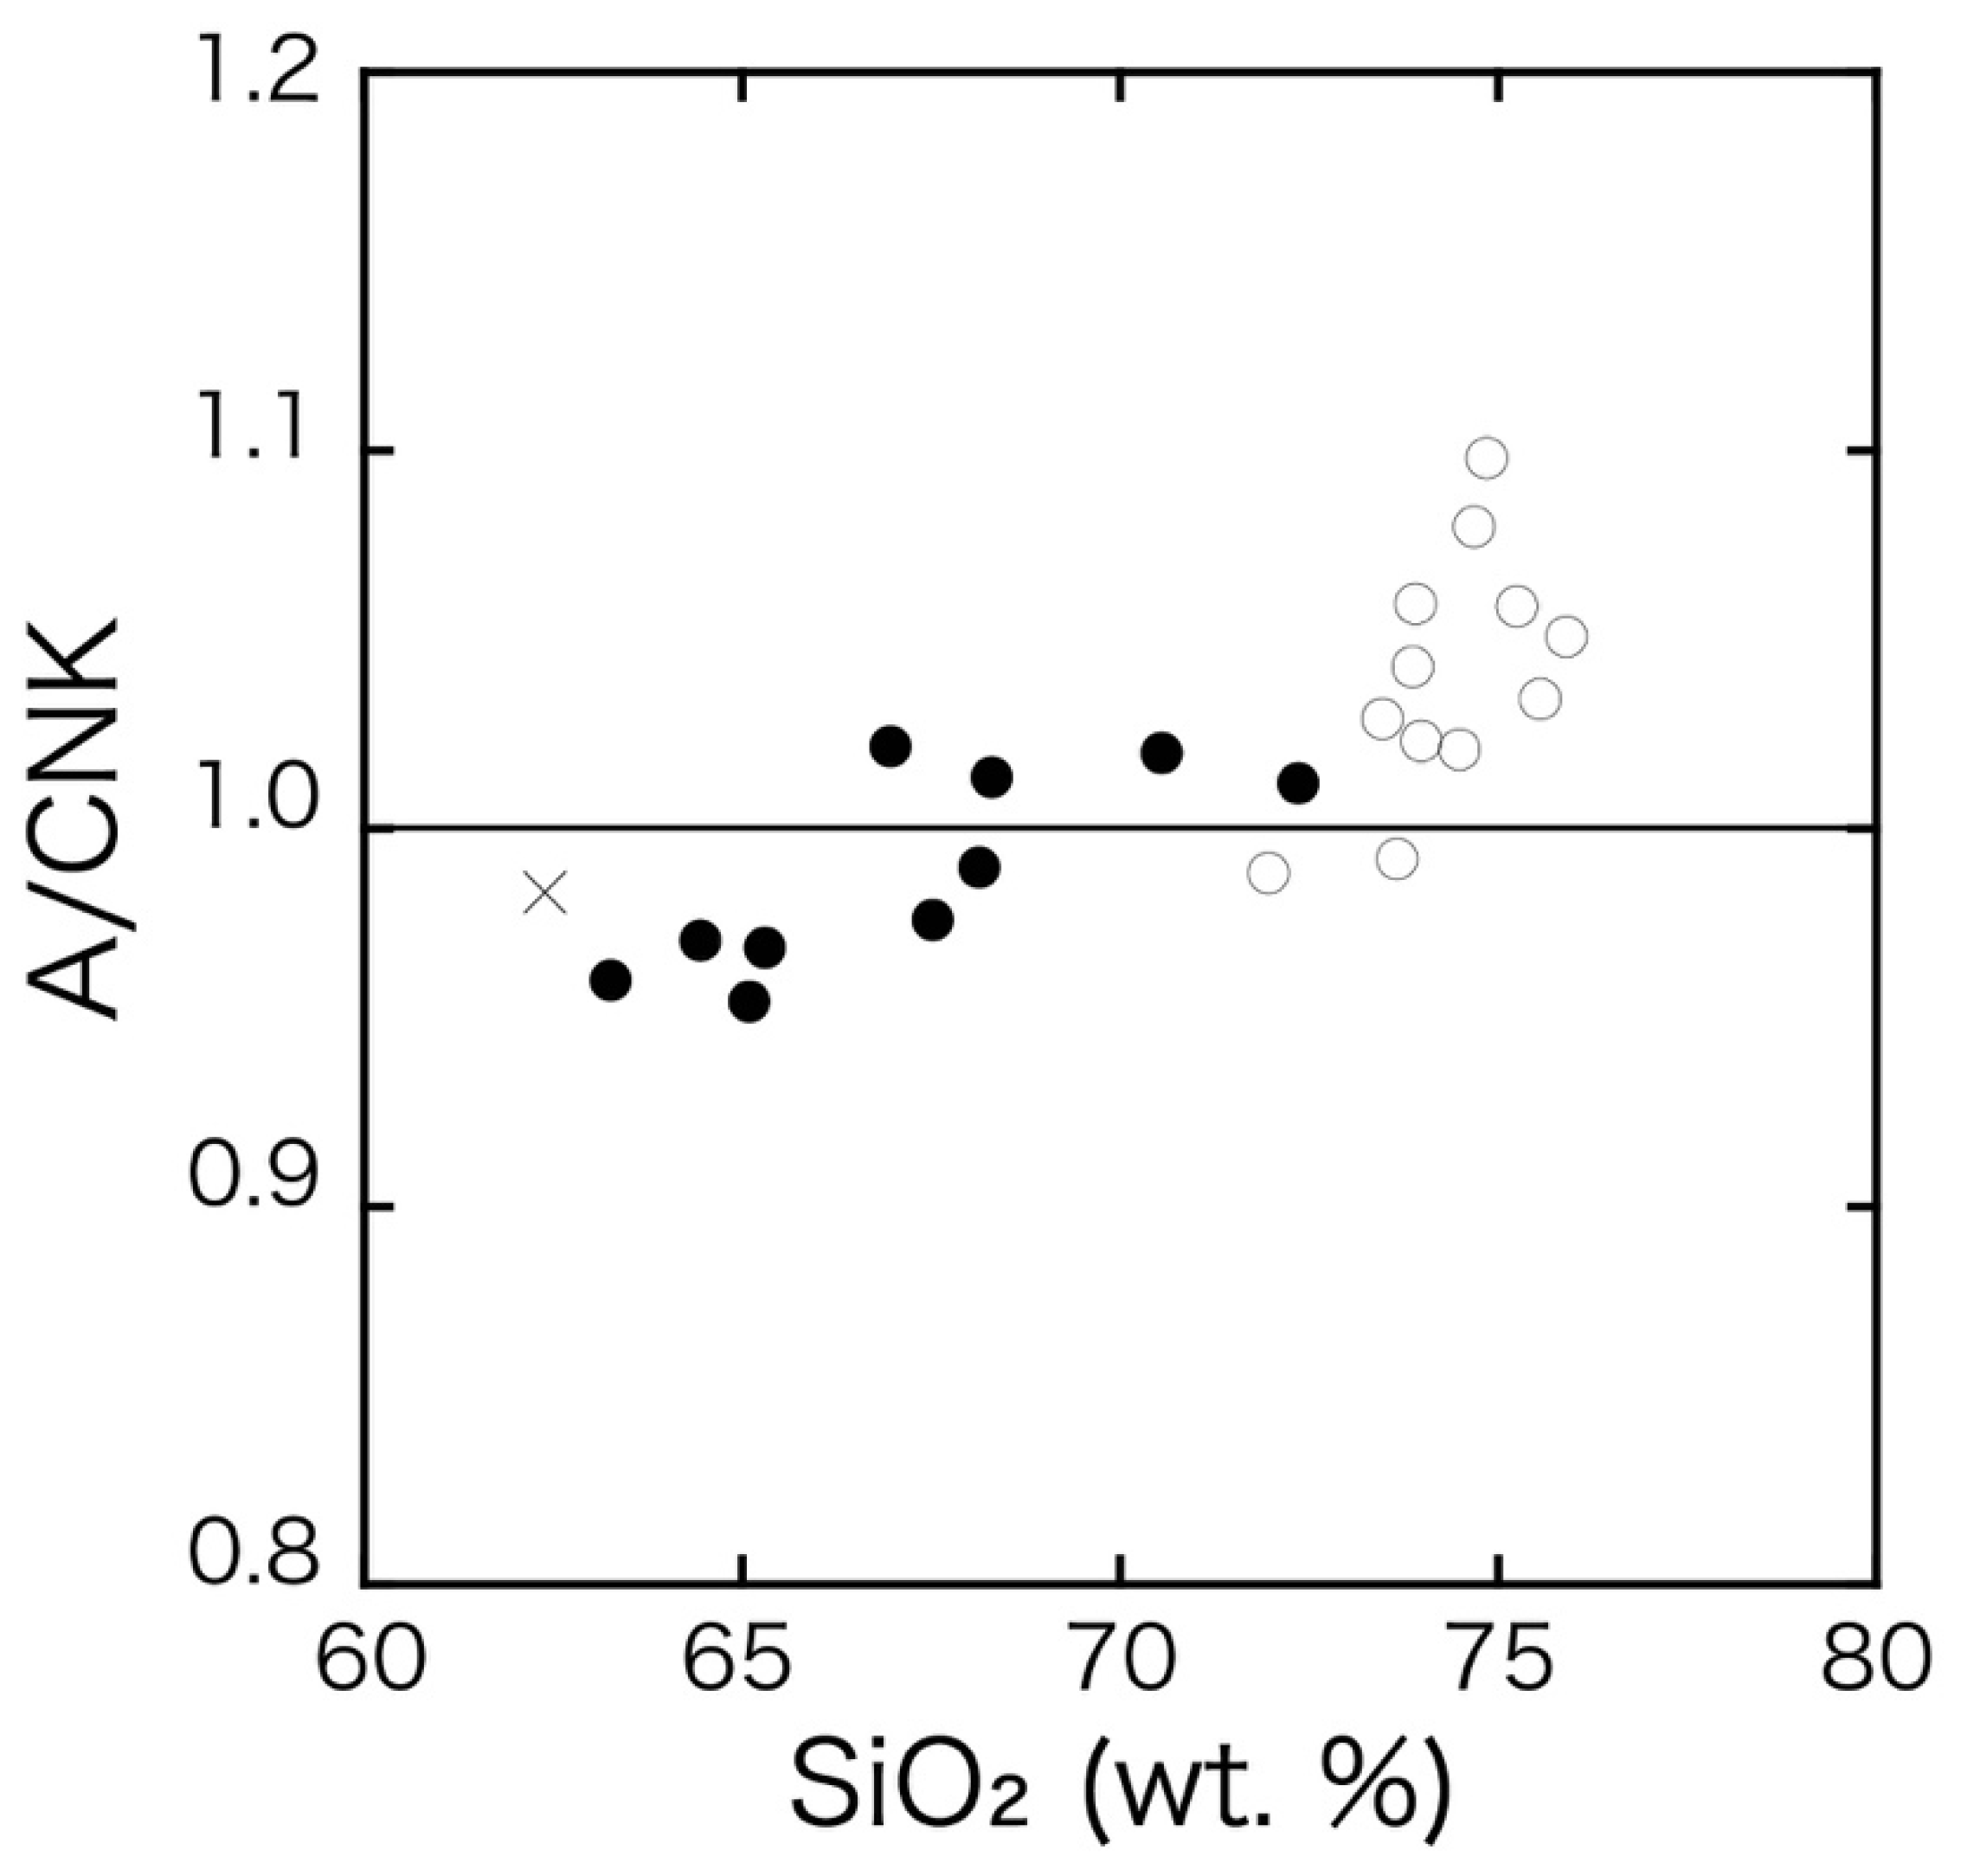
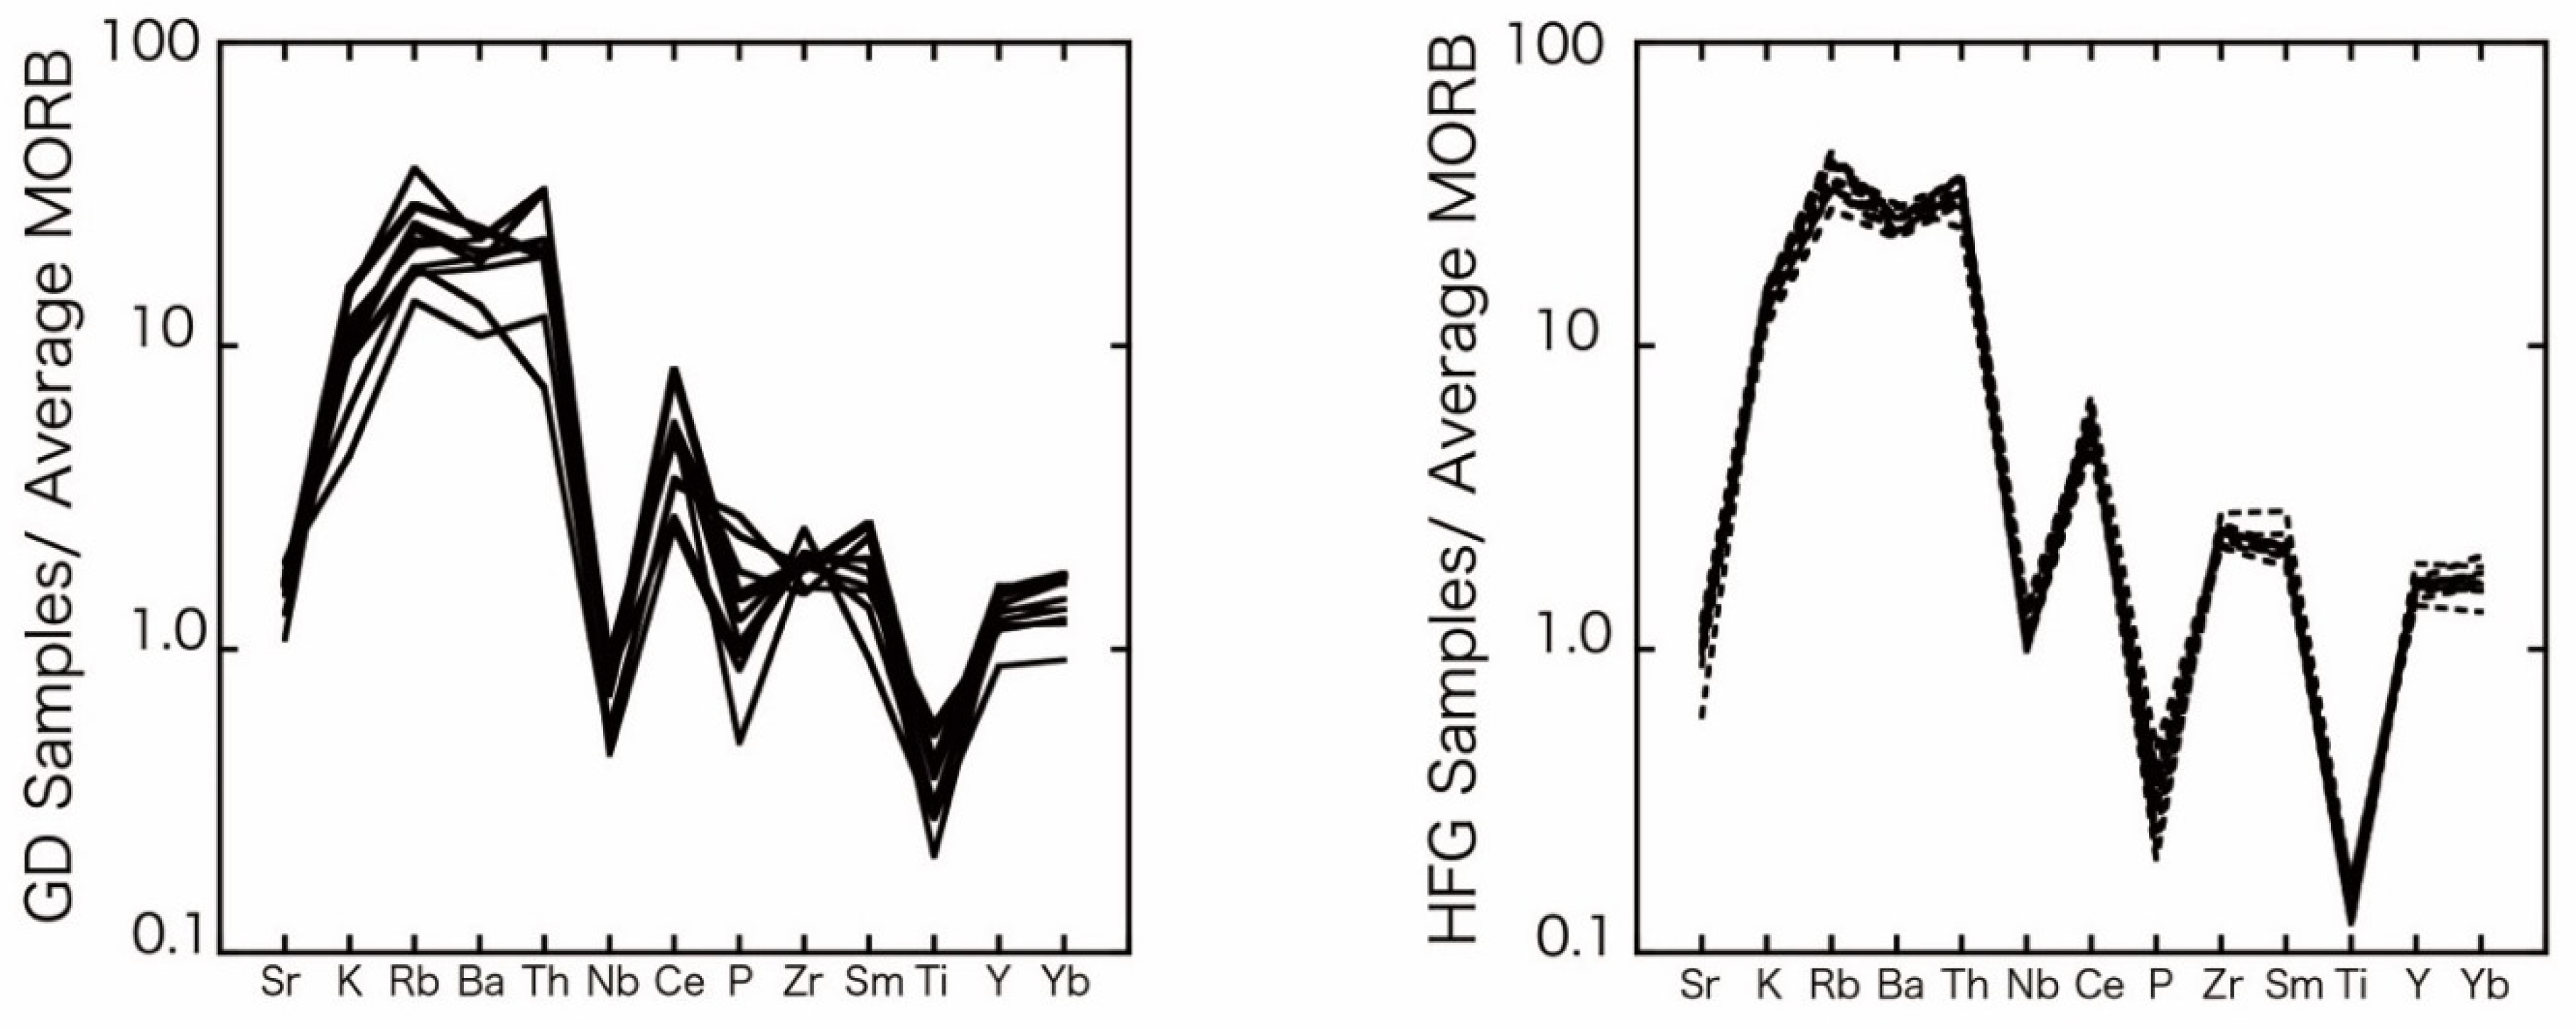
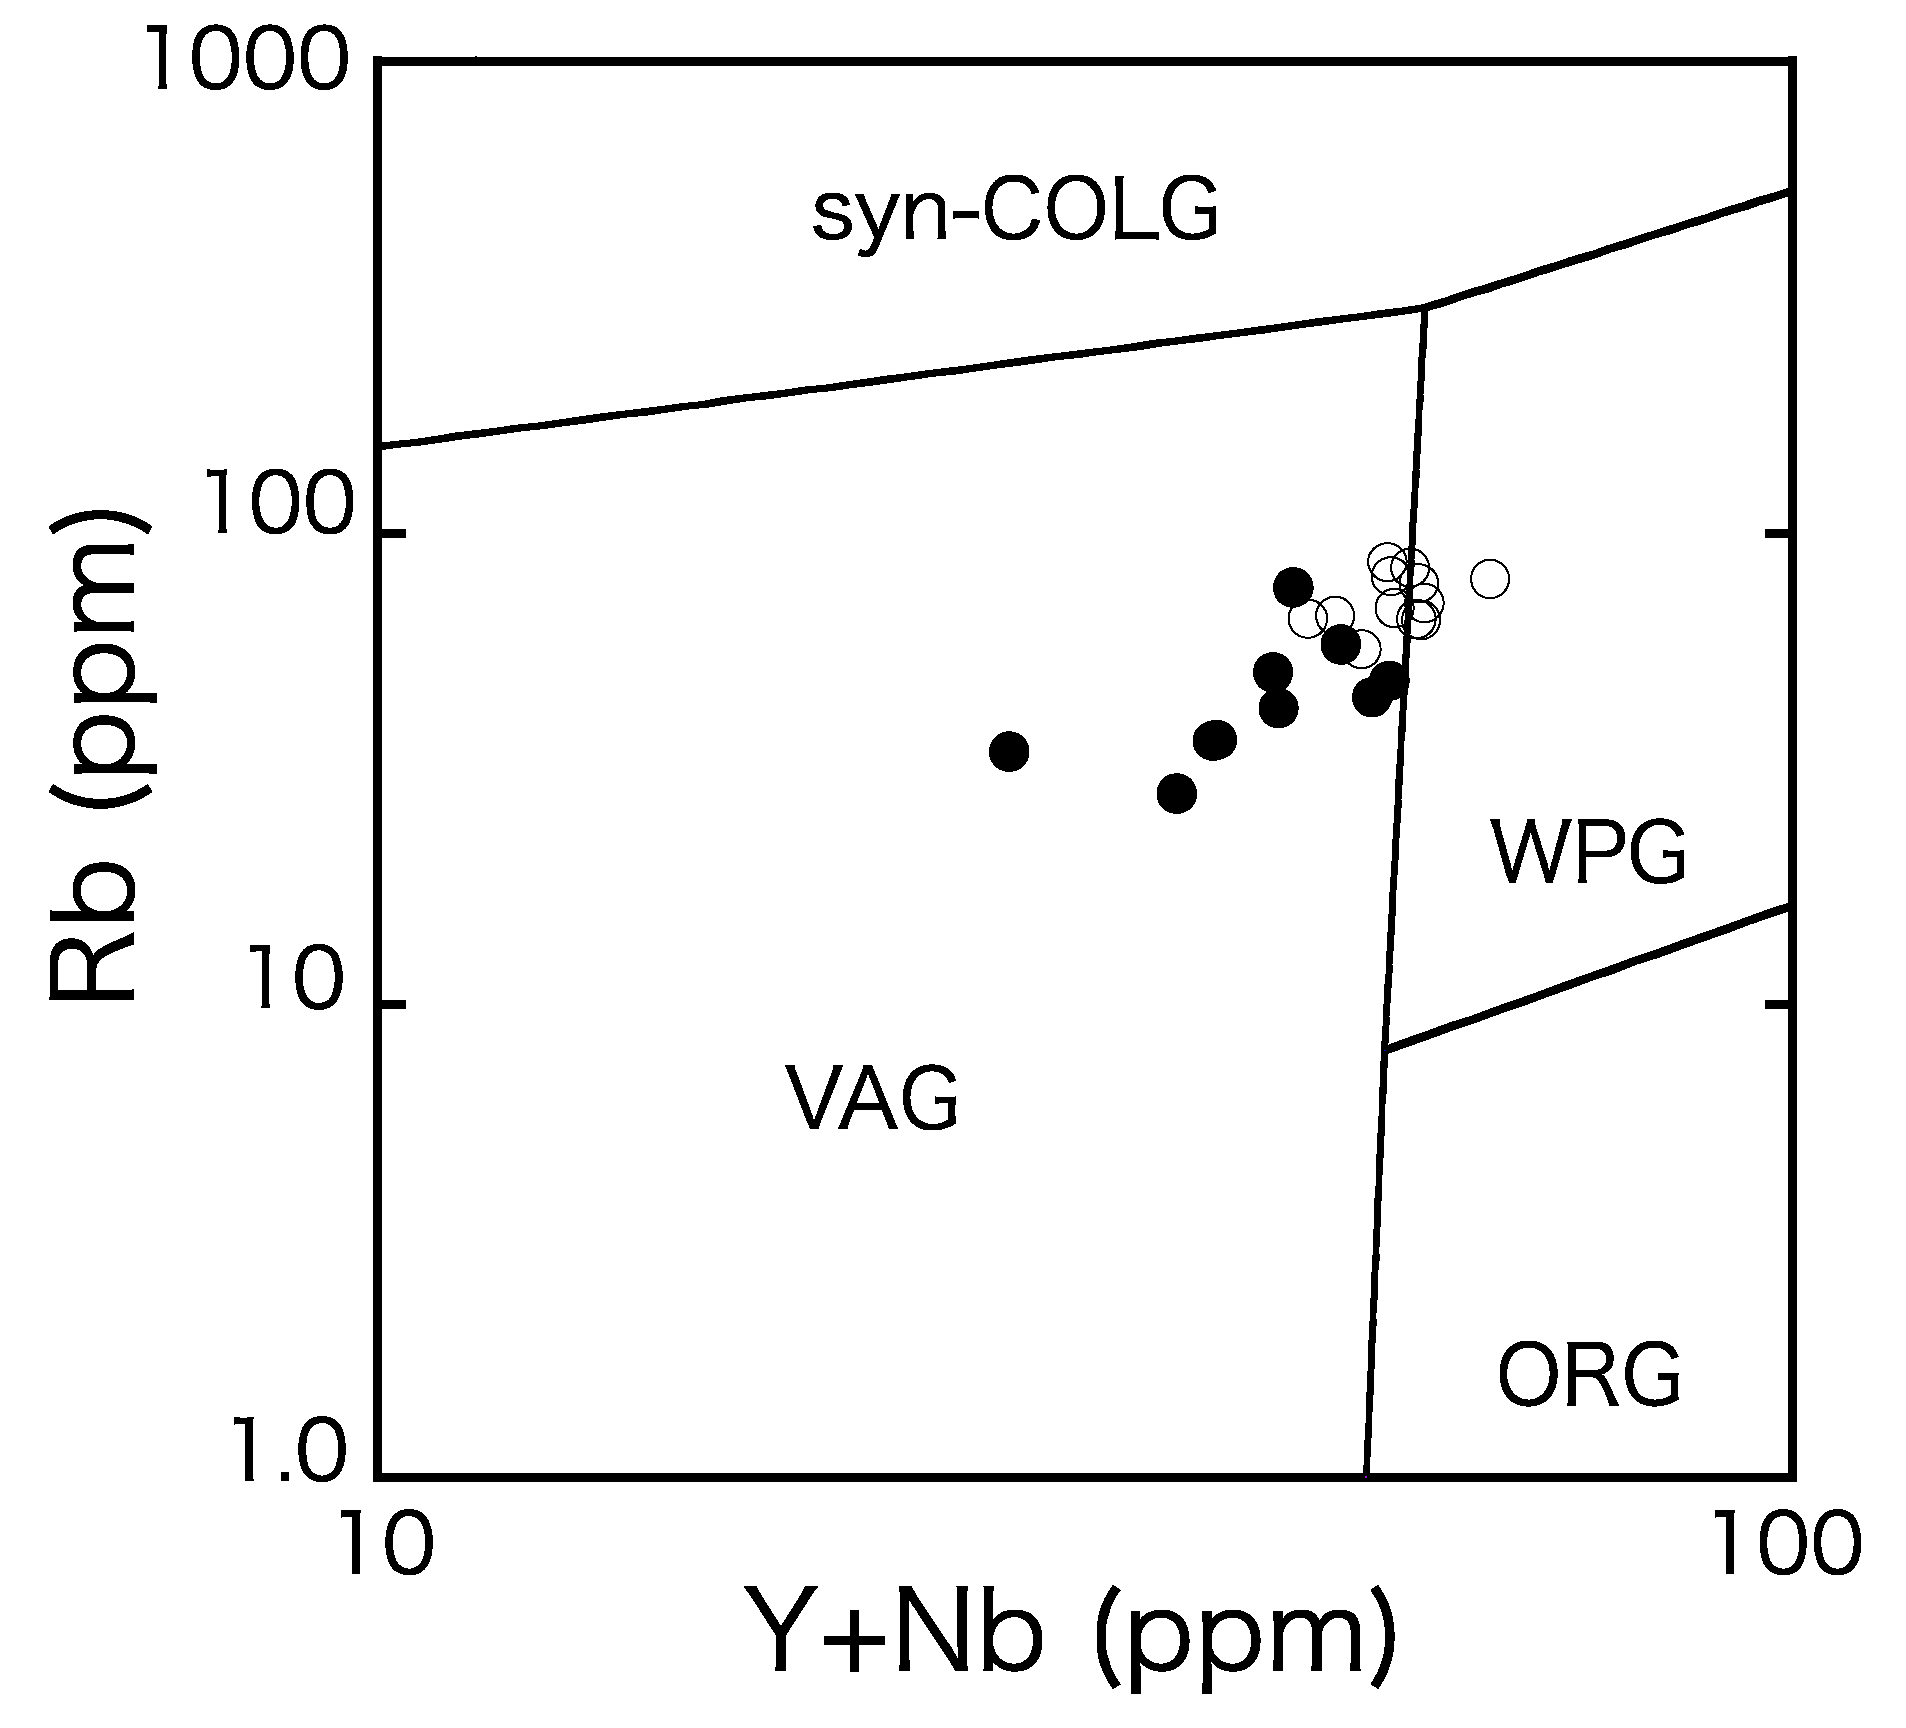
4. Results and Discussion
Author Contributions
Funding
Data Availability Statement
Acknowledgments
Conflicts of Interest
References
- Otofuji, Y.; Matsuda, T.; Nohda, S. Paleomagnetic evidence for the Miocene counter-clockwise rotation of Northeast Japan—rifting process of the Japan Arc. Earth Planet. Sci. Lett. 1985, 75, 265–277. [Google Scholar] [CrossRef]
- Otofuji, Y.; Matsuda, T. Paleomagnetic evidence for the clockwise rotation of Southwest Japan. Earth Planet. Sci. Lett. 1983, 62, 349–359. [Google Scholar] [CrossRef]
- Otofuji, Y.; Hayashida, A.; Torii, M. When was the Japan Sea opened? Paleomagnetic evidence from Southwest Japan. In Formation of Active Ocean Margins; Nasu, N., Uyeda, S., Kushiro, I., Kobayashi, K., Kagami, H., Eds.; Terrapub: Tokyo, Japan, 1985; pp. 551–566. [Google Scholar]
- Pouclet, A.; Lee, J.-S.; Vidal, P.; Cousens, B.; Bellon, H. Cretaceous to Cenozoic volcanism in South Korea and in the Sea of Japan: Magmatic constraints on the opening of the back-arc basin. Geol. Soc. London Spec. Publ. 1994, 81, 169–191. [Google Scholar] [CrossRef]
- Nakada, S.; Takahashi, M. Regional variation in chemistry of the Miocene intermediate to felsic magmas in the Outer Zone and the Setouchi Province of Southwest Japan. J. Geol. Soc. Jpn. 1979, 85, 571–582, (In Japanese with English abstract). [Google Scholar] [CrossRef]
- Ishikawa, N.; Tagami, T. Paleomagnetism and Fission-Track Geochronology on the Goto and Tsushima Islands in the Tsushima Strait Area: Implications for the Opening Mode of the Japan Sea. J. Geomag. Geoelectr. 1991, 43, 229–253. [Google Scholar] [CrossRef]
- Ishikawa, N.; Torii, M.; Koga, K. Paleomagnetic Study of the Tsushima Islands, Southern Margin of the Japan Sea. J. Geomag. Geoelectr. 1989, 41, 797–811. [Google Scholar] [CrossRef]
- Shin, K.-C.; Kurosawa, M.; Anma, R.; Nakano, T. Genesis and mixing/mingling of mafic and felsic magmas of back-arc granite: Miocene tsushima Pluton, Southwest Japan. Resour. Geol. 2009, 59, 25–50. [Google Scholar] [CrossRef]
- Miyachi, M. Fission-Track ages of granites and pyroclastic rocks from Fukuejima Island, Goto Islands, Japan. Earth Monthly 1989, 10, 116–118, (translated from Japanese). [Google Scholar]
- The western part of Fukuejima Island. In Report on Survey to Identify and Promote Geothermal Development; New Energy and Industrial Technology Development Organization: Kanagawa, Japan, 1990; (translated from Japanese).
- Kawada, K.; Kamada, Y.; Matsui, K. Geology of the Fukue District. With Geological Sheet Map at 1: 50,000; Geological Survey of Japan (GSJ): Honshu, Japan, 1994; (In Japanese with English abstract). [Google Scholar]
- Ueda, Y. A study of the Goto Group. Sci. Rep. Dept. Geol. Kyushu Univ. 1961, 5, 51–61, (In Japanese with English abstract). [Google Scholar]
- Sato, H. Geography and Geology of the Goto Islands. In Scientific Research of Goto Islands–Kujuku Islands–Hirado Island, General Introduction; Nagasaki Prefecture: Nagasaki, Japan, 1952; pp. 11–35, (translated from Japanese). [Google Scholar]
- Sakaguchi, K. On the fossils of the tertiary system including the Nojima Group in Hirashima, Nishiheiki-gun, Nagasaki Prefecture. J. Geosi. 1961, 12, 161, (translated from Japanese). [Google Scholar]
- Sakaguchi, K. Neogene dross-stratification of the Komosaki formation in Hirashima, Nishiheiki-gun, Nagasaki Prefecture. J. Geosi. 1974, 25, 383–388, (translated from Japanese). [Google Scholar]
- Nagahama, H.; Mizuno, A. The miocene fresh-water molluscan fauna from Naru-shima in the central part of the Islands of Go-tô, with some notes on the related geological problems. J. Geol. Soc. Jpn. 1965, 71, 228–236. [Google Scholar] [CrossRef] [Green Version]
- Matsui, K.; Kawada, K. 1:200,000 Geological map Fukue and Tomie. Geol. Surv. Jpn. 1986. [Google Scholar]
- Yamamoto, K.; Tanaka, T.; Minami, M.; Mimura, K.; Asahara, Y.; Yoshida, H.; Yogo, S.; Takeuchi, M.; Inayoshi, M. Geochemical mapping in Aichi prefecture, Japan: Its significance as a useful dataset for geological mapping. Appl. Geochem. 2007, 22, 306–319. [Google Scholar] [CrossRef]
- Nakazaki, M.; Tsuboi, M.; Kanagawa, K.; Kato, T.; Suzuki, K. Quantitative chemical analysis of rocks with X-ray fluorescence analyzer XRF-1800. Bull. Nagoya Univ. Museum. 2004, 20, 79–91. [Google Scholar]
- Yang, X.M.; Lentz, D.R.; Chi, G. Ferric-ferrous iron oxide ratios: Effect on crystallization pressure of granites estimated by Qtz-geobarometry. Lithos 2021, 380–381, 105920. [Google Scholar] [CrossRef]
- Miyashiro, A. Volcanic rock series in island arcs and active continental margins. Am. J. Sci. 1974, 274, 321–355. [Google Scholar] [CrossRef]
- Pearce, J.A. Continental basalts and mantle xenoliths. In Shiva Geology Series; Hawkesworth, C.J., Norry, M.J., Eds.; Shiva Pub: Cheshire, UK, 1983; pp. 230–249. [Google Scholar]
- Pearce, J.A.; Harris, N.B.W.; Tindle, A.G. Trace element discrimination diagrams for the tectonic interpretation of granitic rocks. J. Petrol. 1984, 25, 956–983. [Google Scholar] [CrossRef] [Green Version]
- Hirai, Y.; Yoshida, T.; Okamura, S.; Tamura, Y.; Sakamoto, I.; Shinjo, R. Breakdown of residual zircon in the Izu arc subducting slab during backarc rifting. Geology 2018, 46, 371–374. [Google Scholar] [CrossRef] [Green Version]
- Anders, E.; Grevesse, N. Abundances of the elements: Meteoritic and solar. Geochim. Cosmochim. Acta 1989, 53, 197–214. [Google Scholar] [CrossRef]


| GD Group Rocks | Dikes | ||||||||||||
|---|---|---|---|---|---|---|---|---|---|---|---|---|---|
| Sample | GTA-2a | GTB-3 | GTB-7a | GTB-7b | GTC-3a | GTC-4a | GTC-9a | GTC-9b | GTC-9c | GTC-9d | GTA-2b | GTB-5b | GTC-7 |
| Lat. N32° | 49′56″ | 49′29″ | 49′25″ | 49′25″ | 49′56″ | 49′57″ | 49′25″ | 49′26″ | 49′27″ | 49′28″ | 49′56″ | 49′58″ | 49′48″ |
| Lon. E128° | 50′54″ | 52′37″ | 53′25″ | 53′25″ | 50′55″ | 50′55″ | 53′25″ | 53′26″ | 53′27″ | 53′28″ | 50′54″ | 51′57″ | 50′56″ |
| SiO2 (wt.%) | 68.14 | 72.35 | 68.30 | 67.52 | 63.26 | 64.45 | 70.55 | 65.30 | 66.96 | 65.09 | 48.93 | 48.81 | 62.40 |
| TiO2 | 0.63 | 0.31 | 0.45 | 0.46 | 0.85 | 0.78 | 0.42 | 0.64 | 0.57 | 0.60 | 1.46 | 1.45 | 0.75 |
| Al2O3 | 14.05 | 12.89 | 14.44 | 15.01 | 15.33 | 15.19 | 14.40 | 15.42 | 15.43 | 15.09 | 15.69 | 15.69 | 15.58 |
| FeO* | 4.09 | 2.90 | 3.28 | 3.57 | 6.11 | 5.80 | 3.26 | 3.73 | 3.79 | 4.14 | 12.70 | 12.69 | 5.97 |
| MnO | 0.16 | 0.08 | 0.12 | 0.13 | 0.23 | 0.24 | 0.12 | 0.15 | 0.14 | 0.15 | 0.26 | 0.26 | 0.17 |
| MgO | 1.08 | 0.41 | 0.65 | 0.67 | 1.47 | 1.28 | 0.52 | 1.09 | 0.74 | 0.93 | 5.06 | 5.05 | 2.13 |
| CaO | 3.28 | 1.98 | 2.68 | 2.73 | 4.21 | 4.19 | 2.59 | 3.28 | 2.43 | 3.21 | 9.21 | 9.22 | 4.28 |
| Na2O | 4.06 | 4.10 | 4.77 | 5.14 | 4.62 | 4.27 | 4.82 | 4.94 | 5.45 | 4.54 | 3.01 | 3.03 | 4.15 |
| K2O | 1.44 | 2.21 | 1.41 | 1.82 | 0.66 | 0.93 | 1.37 | 1.69 | 1.59 | 2.32 | 0.50 | 0.50 | 1.14 |
| P2O5 | 0.18 | 0.06 | 0.11 | 0.12 | 0.33 | 0.28 | 0.10 | 0.22 | 0.15 | 0.18 | 0.16 | 0.15 | 0.12 |
| LOI | 0.86 | 0.78 | 1.03 | 0.67 | 0.94 | 0.87 | 0.38 | 0.77 | 1.01 | 0.56 | 0.73 | 1.93 | 1.56 |
| Total | 97.97 | 98.09 | 97.26 | 97.85 | 98.02 | 98.29 | 98.53 | 97.23 | 98.24 | 96.81 | 97.72 | 98.80 | 98.25 |
| FeO*/MgO | 3.79 | 7.11 | 5.01 | 5.30 | 4.16 | 4.52 | 6.23 | 3.40 | 5.15 | 4.43 | 2.51 | 2.51 | 2.80 |
| K2O+Na2O | 5.50 | 6.31 | 6.19 | 6.96 | 5.28 | 5.21 | 6.19 | 6.63 | 7.03 | 6.87 | 3.51 | 3.54 | 5.29 |
| ASI | 0.99 | 1.01 | 1.01 | 0.98 | 0.96 | 0.97 | 1.02 | 0.97 | 1.02 | 0.95 | 0.71 | 0.70 | 0.98 |
| Th (ppm) | 6.51 | 6.59 | 4.46 | 6.35 | 2.49 | 1.45 | 3.94 | 4.20 | 4.51 | 3.94 | — | — | 2.47 |
| Pb | 17.7 | 12.6 | 16.3 | 9.07 | 16.9 | 12.6 | 20.5 | 16.4 | 12.7 | 24.5 | 11.5 | 11.3 | 20.8 |
| Ba | 376 | 451 | 391 | 449 | 215 | 272 | 360 | 414 | 403 | 488 | 109 | 100 | 300 |
| Nb | 3.18 | 2.48 | 2.84 | 2.54 | 1.92 | 1.75 | 1.58 | 3.04 | 3.42 | 2.71 | 1.06 | — | 1.11 |
| Zr | 174 | 176 | 182 | 188 | 143 | 169 | 225 | 137 | 186 | 167 | 71.2 | 54.0 | 131 |
| Y | 48.7 | 41.9 | 36.1 | 40.8 | 34.8 | 37.4 | 26.4 | 47.4 | 39.5 | 45.2 | 17.2 | 25.4 | 36.2 |
| Sr | 157 | 130 | 184 | 203 | 231 | 232 | 181 | 214 | 194 | 197 | 237 | 314 | 213 |
| Rb | 48.7 | 76.8 | 36.3 | 42.6 | 28.0 | 36.5 | 34.5 | 44.9 | 50.7 | 58.1 | 28.36 | 41.77 | 51.86 |
| Zn | 95.3 | 61.0 | 76.2 | 79.8 | 121 | 122 | 87.8 | 74.2 | 63.1 | 96.6 | 108 | 104 | 79.3 |
| Cu | — | 0.19 | 13.0 | — | — | — | — | 12.1 | 16.7 | 3.45 | 20.2 | — | — |
| Ni | 2.13 | 3.81 | 2.42 | 2.57 | — | 0.29 | 2.87 | 1.69 | 2.71 | 1.02 | 1.29 | 19.5 | 11.3 |
| Co | 10.7 | 7.52 | 7.77 | 8.43 | 16.5 | 16.4 | 7.27 | 9.58 | 10.3 | 11.8 | 67.5 | 35.6 | 21.6 |
| Cr | 2.47 | 3.35 | — | — | 1.29 | 0.54 | 0.77 | — | — | — | 42.0 | 91.3 | 43.7 |
| V | 38.0 | 20.7 | 13.7 | 12.9 | 7.10 | 4.3 | 16.0 | 18.1 | 18.5 | 30.1 | 435 | 284 | 157 |
| Y + Nb | 51.9 | 44.4 | 38.9 | 43.3 | 36.7 | 39.2 | 28.0 | 50.4 | 42.9 | 48.0 | 18.3 | 25.4 | 37.4 |
| La (ppm) | 21.6 | 26.1 | 12.6 | 26.4 | 16.0 | 16.8 | 12.0 | 24.7 | 25.3 | 40.0 | 6.37 | 13.4 | 15.7 |
| Ce | 48.8 | 55.1 | 27.4 | 56.2 | 34.9 | 36.7 | 25.5 | 55.7 | 55.7 | 82.9 | 15.5 | 12.9 | 32.5 |
| Pr | 6.21 | 6.70 | 3.80 | 6.74 | 4.49 | 4.64 | 3.09 | 7.05 | 6.80 | 9.69 | 2.20 | 3.88 | 4.44 |
| Nd | 26.5 | 28.0 | 17.4 | 27.4 | 20.1 | 20.7 | 13.3 | 31.1 | 28.4 | 39.0 | 10.6 | 17.3 | 19.4 |
| Sm | 6.53 | 6.61 | 4.50 | 5.87 | 5.15 | 5.29 | 3.08 | 7.72 | 6.46 | 8.53 | 2.95 | 4.73 | 5.04 |
| Eu | 1.09 | 1.49 | 1.67 | 1.71 | 1.68 | 1.66 | 1.69 | 1.80 | 1.73 | 1.87 | 1.16 | 1.92 | 1.39 |
| Gd | 7.05 | 7.10 | 4.92 | 6.23 | 5.88 | 6.01 | 3.28 | 8.29 | 6.56 | 8.93 | 3.44 | 5.38 | 5.53 |
| Tb | 1.31 | 1.30 | 0.92 | 1.08 | 1.06 | 1.10 | 0.57 | 1.47 | 1.14 | 1.55 | 0.64 | 1.01 | 1.03 |
| Dy | 8.75 | 8.50 | 6.10 | 6.91 | 6.86 | 7.22 | 3.76 | 9.63 | 7.34 | 9.85 | 4.16 | 6.54 | 6.85 |
| Ho | 1.87 | 1.84 | 1.31 | 1.49 | 1.48 | 1.56 | 0.86 | 2.07 | 1.58 | 2.08 | 0.89 | 1.34 | 1.48 |
| Er | 5.85 | 5.71 | 4.07 | 4.64 | 4.48 | 4.83 | 2.82 | 6.27 | 4.93 | 6.30 | 2.69 | 3.97 | 4.58 |
| Tm | 0.84 | 0.82 | 0.60 | 0.68 | 0.63 | 0.68 | 0.43 | 0.89 | 0.71 | 0.88 | 0.38 | 0.57 | 0.67 |
| Yb | 5.59 | 5.69 | 4.14 | 4.59 | 4.28 | 4.61 | 3.14 | 6.06 | 4.98 | 5.94 | 2.49 | 3.79 | 4.56 |
| Lu | 0.82 | 0.86 | 0.63 | 0.70 | 0.63 | 0.69 | 0.49 | 0.87 | 0.74 | 0.88 | 0.37 | 0.55 | 0.65 |
| HFG Group Rocks | |||||||||||||
| Sample | GTA-2c | GTA-3 | GTB-4 | GTB-5a | GTB-6 | GTB-8 | GTB-9 | GTC-3b | GTC-4b | GTC-5 | GTC-6 | GTC-8 | |
| Lat. N32° | 49′56″ | 49′41″ | 49′49″ | 49′58″ | 50′2″ | 49′41″ | 49′41″ | 49′56″ | 49′57″ | 49′49″ | 49′48″ | 49′39″ | |
| Lon. E128° | 50′54″ | 51′2″ | 52′32″ | 51′57″ | 52′1″ | 51′44″ | 51′38″ | 50′55″ | 50′55″ | 50′59″ | 50′57″ | 51′2″ | |
| SiO2 (wt.%) | 75.90 | 71.96 | 73.98 | 74.85 | 73.47 | 73.91 | 73.87 | 74.68 | 75.55 | 74.49 | 75.25 | 73.67 | |
| TiO2 | 0.19 | 0.25 | 0.26 | 0.25 | 0.25 | 0.24 | 0.21 | 0.21 | 0.19 | 0.24 | 0.23 | 0.25 | |
| Al2O3 | 11.81 | 12.17 | 12.92 | 12.65 | 12.96 | 12.78 | 12.05 | 12.13 | 12.25 | 12.50 | 12.28 | 12.51 | |
| FeO* | 2.15 | 4.92 | 3.11 | 1.77 | 3.45 | 2.92 | 2.91 | 2.38 | 2.27 | 2.49 | 2.20 | 3.11 | |
| MnO | 0.03 | 0.18 | 0.10 | 0.03 | 0.12 | 0.09 | 0.08 | 0.05 | 0.04 | 0.10 | 0.04 | 0.11 | |
| MgO | 0.12 | 0.22 | 0.13 | 0.09 | 0.19 | 0.16 | 0.16 | 0.16 | 0.19 | 0.19 | 0.22 | 0.16 | |
| CaO | 1.03 | 1.53 | 1.83 | 0.93 | 1.97 | 1.62 | 1.14 | 1.18 | 1.24 | 1.61 | 0.96 | 1.69 | |
| Na2O | 4.16 | 4.63 | 4.37 | 4.44 | 4.23 | 4.23 | 4.30 | 4.13 | 4.31 | 4.24 | 4.43 | 4.28 | |
| K2O | 2.33 | 1.76 | 1.95 | 2.33 | 1.89 | 1.99 | 2.22 | 2.12 | 2.31 | 2.16 | 2.36 | 2.30 | |
| P2O5 | 0.03 | 0.05 | 0.05 | 0.02 | 0.06 | 0.04 | 0.04 | 0.04 | 0.03 | 0.04 | 0.04 | 0.04 | |
| LOI | 0.62 | 0.62 | 0.85 | 1.31 | 1.25 | 0.81 | 0.88 | 0.67 | 0.58 | 0.48 | 0.68 | 0.62 | |
| Total | 98.36 | 98.28 | 99.56 | 98.69 | 99.85 | 98.80 | 97.83 | 97.75 | 98.96 | 98.54 | 98.70 | 98.75 | |
| FeO*/MgO | 18.6 | 22.7 | 23.5 | 20.0 | 17.9 | 18.5 | 18.5 | 14.8 | 11.8 | 13.4 | 10.2 | 19.5 | |
| K2O+Na2O | 6.49 | 6.40 | 6.32 | 6.78 | 6.12 | 6.23 | 6.52 | 6.25 | 6.62 | 6.40 | 6.79 | 6.58 | |
| ASI | 1.05 | 0.99 | 1.02 | 1.10 | 1.03 | 1.06 | 1.04 | 1.08 | 1.03 | 1.02 | 1.06 | 0.99 | |
| Th (ppm) | 5.76 | 5.93 | 6.44 | 7.05 | 7.38 | 6.60 | 7.29 | 7.16 | 4.89 | 6.08 | 6.16 | 6.41 | |
| Pb | 14.1 | 19.7 | 13.5 | 11.6 | 19.4 | 18.8 | 12.5 | 16.5 | 16.8 | 16.5 | 14.8 | 15.4 | |
| Ba | 568 | 454 | 477 | 570 | 458 | 525 | 525 | 511 | 585 | 473 | 523 | 529 | |
| Nb | 4.43 | 3.52 | 3.63 | 4.63 | 3.54 | 3.48 | 3.66 | 4.93 | 3.65 | 3.46 | 3.47 | 3.95 | |
| Zr | 219 | 215 | 198 | 253 | 213 | 196 | 221 | 234 | 205 | 216 | 217 | 224 | |
| Y | 47.9 | 46.1 | 43.9 | 50.3 | 51.1 | 41.9 | 57.4 | 49.3 | 50.8 | 48.6 | 48.3 | 49.7 | |
| Sr | 123 | 125 | 138 | 150 | 127 | 124 | 118 | 106 | 72.4 | 121 | 122 | 117 | |
| Rb | 69.4 | 56.7 | 66.9 | 71.3 | 65.5 | 65.9 | 80.1 | 65.8 | 78.4 | 81.2 | 87.0 | 84.5 | |
| Zn | 49.0 | 116 | 100 | 30.9 | 83.4 | 85.1 | 66.1 | 62.0 | 44.8 | 123 | 41.6 | 55.1 | |
| Cu | 26.1 | 0.08 | — | — | 0.29 | 0.17 | 0.22 | 2.04 | — | 1.12 | 6.32 | — | |
| Ni | 4.50 | 1.76 | 3.60 | 5.00 | 2.99 | 4.15 | 4.21 | 4.67 | 4.27 | 3.41 | 4.50 | 3.37 | |
| Co | 5.00 | 14.0 | 7.10 | 4.30 | 8.79 | 6.69 | 7.35 | 5.53 | 5.35 | 5.98 | 5.43 | 8.05 | |
| Cr | 0.62 | 2.79 | 0.51 | — | 1.50 | 0.61 | 1.60 | 1.07 | 0.57 | 1.84 | 0.45 | 0.25 | |
| V | 9.29 | 3.81 | 4.45 | 6.56 | 5.44 | 6.11 | 8.75 | 8.34 | 6.23 | 10.4 | 6.94 | 6.47 | |
| Y + Nb | 52.3 | 49.6 | 47.5 | 54.9 | 54.6 | 45.4 | 61.1 | 54.2 | 54.4 | 52.0 | 51.7 | 53.7 | |
| La (ppm) | 28.1 | 23.0 | 25.4 | 40.6 | 28.5 | 22.4 | 24.5 | 26.5 | 25.6 | 25.7 | 28.6 | 23.4 | |
| Ce | 60.8 | 50.3 | 55.4 | 55.8 | 67.9 | 46.3 | 52.3 | 57.5 | 55.2 | 56.9 | 61.4 | 52.1 | |
| Pr | 7.43 | 6.27 | 6.86 | 10.7 | 7.78 | 6.23 | 6.67 | 7.04 | 6.77 | 7.15 | 7.43 | 6.51 | |
| Nd | 31.1 | 27.1 | 29.1 | 42.3 | 33.0 | 26.4 | 28.8 | 29.7 | 28.5 | 30.5 | 31.1 | 27.9 | |
| Sm | 7.10 | 6.59 | 6.86 | 9.40 | 7.91 | 6.20 | 7.19 | 7.14 | 6.70 | 7.34 | 7.22 | 6.85 | |
| Eu | 1.55 | 1.66 | 2.06 | 2.06 | 2.04 | 1.69 | 1.61 | 1.46 | 1.63 | 1.70 | 1.52 | 1.68 | |
| Gd | 7.22 | 7.00 | 7.17 | 8.55 | 8.60 | 6.43 | 8.06 | 7.45 | 7.13 | 7.50 | 7.30 | 7.40 | |
| Tb | 1.29 | 1.29 | 1.32 | 1.55 | 1.59 | 1.15 | 1.49 | 1.37 | 1.31 | 1.35 | 1.30 | 1.36 | |
| Dy | 8.29 | 8.41 | 8.50 | 9.49 | 10.5 | 7.24 | 9.85 | 8.97 | 8.60 | 8.66 | 8.21 | 8.94 | |
| Ho | 1.75 | 1.80 | 1.79 | 1.87 | 2.23 | 1.52 | 2.15 | 1.92 | 1.86 | 1.85 | 1.75 | 1.95 | |
| Er | 5.43 | 5.57 | 5.52 | 5.58 | 6.96 | 4.67 | 6.63 | 5.91 | 5.80 | 5.60 | 5.28 | 6.03 | |
| Tm | 0.79 | 0.82 | 0.80 | 0.80 | 1.02 | 0.68 | 0.96 | 0.88 | 0.84 | 0.82 | 0.77 | 0.87 | |
| Yb | 5.33 | 5.66 | 5.49 | 5.57 | 6.90 | 4.52 | 6.37 | 6.07 | 5.87 | 5.67 | 5.29 | 5.94 | |
| Lu | 0.81 | 0.86 | 0.81 | 0.83 | 1.02 | 0.67 | 0.94 | 0.89 | 0.86 | 0.83 | 0.80 | 0.89 | |
Publisher’s Note: MDPI stays neutral with regard to jurisdictional claims in published maps and institutional affiliations. |
© 2021 by the authors. Licensee MDPI, Basel, Switzerland. This article is an open access article distributed under the terms and conditions of the Creative Commons Attribution (CC BY) license (http://creativecommons.org/licenses/by/4.0/).
Share and Cite
Koga, K.; Tsuboi, M. Petrogenesis of Granitic Rocks in the Hisakajima Island, Goto Archipelago, Southwestern Japan: A Geochemical Study. Minerals 2021, 11, 248. https://doi.org/10.3390/min11030248
Koga K, Tsuboi M. Petrogenesis of Granitic Rocks in the Hisakajima Island, Goto Archipelago, Southwestern Japan: A Geochemical Study. Minerals. 2021; 11(3):248. https://doi.org/10.3390/min11030248
Chicago/Turabian StyleKoga, Kazuhiro, and Motohiro Tsuboi. 2021. "Petrogenesis of Granitic Rocks in the Hisakajima Island, Goto Archipelago, Southwestern Japan: A Geochemical Study" Minerals 11, no. 3: 248. https://doi.org/10.3390/min11030248