3.2. Analysis of the Electrostatic Separation Efficiency
Based on the density of the products obtained from electrostatic separation (
Table 2), it can be concluded that its efficiency, manifested by the purity of the concentrate (the presence of metals with a minimum amount of plastic and ceramic materials) and waste (the presence of plastic and ceramic materials with a minimum amount of metals), increases with the degree of PCB grinding. The higher the density of the separation product, the higher the metal content and the lower the plastic and ceramic content. The highest and lowest densities of the concentrate and the lowest and highest densities of waste were obtained for options 2 and 4, respectively. This is correlated with the grain size, which in turn is related to the release of useful components (i.e., metals). A high purity of the concentrate and waste was also achieved for option 1. However, at low temperatures (option 2 of the grinding process), due to the use of liquid nitrogen to cool the feed, there was no significant increase in temperature in the mill’s working chamber, and no plasticisation of the shredded material, and no (or less) solid metal–plastic–ceramic compounds.
However, the yield of concentrates and intermediates in options 1 and 2 is the lowest. In both cases, as previously noted, the presence of plastic and ceramic materials was minimised. The most concentrate and the least waste were obtained for option 4. However, taking into account the densities of plastics, ceramics, and metals, it is concluded that the separation products for option 4 are highly contaminated. This is due to the low degree of grinding, which did not allow the sufficient release of useful substances (metals in the free state) from the PCB composite.
Figure 2,
Figure 3 and
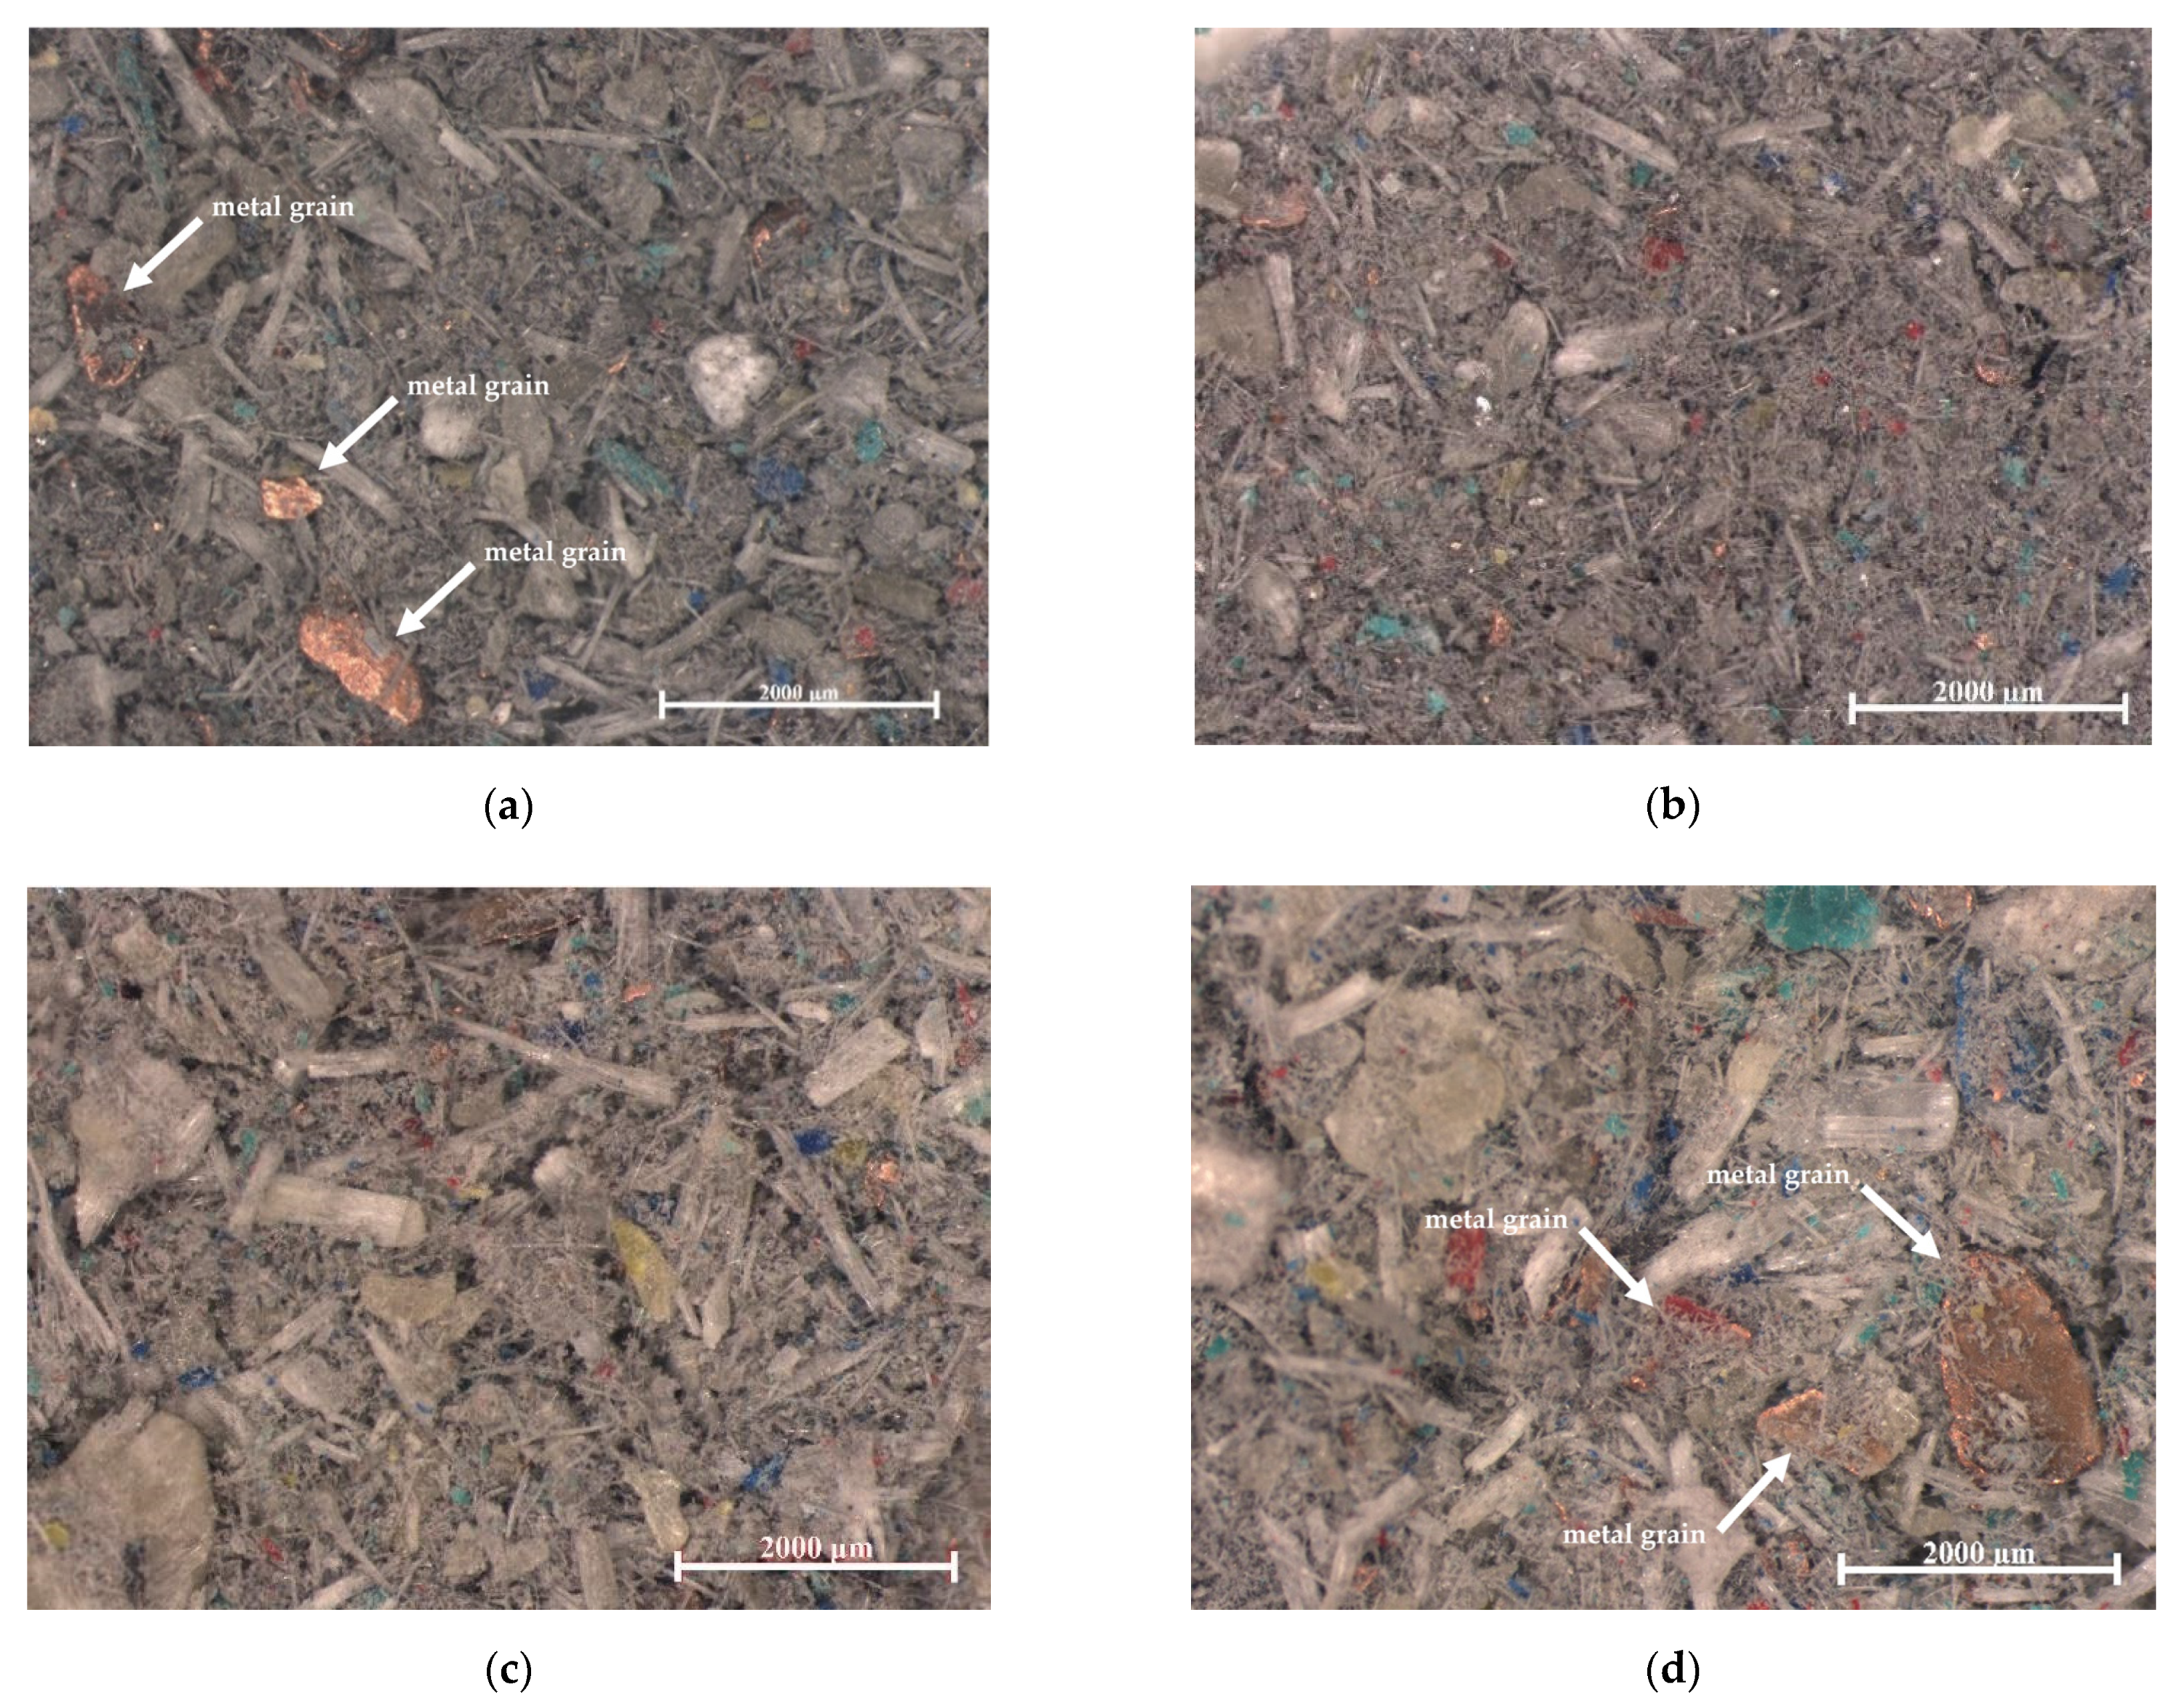
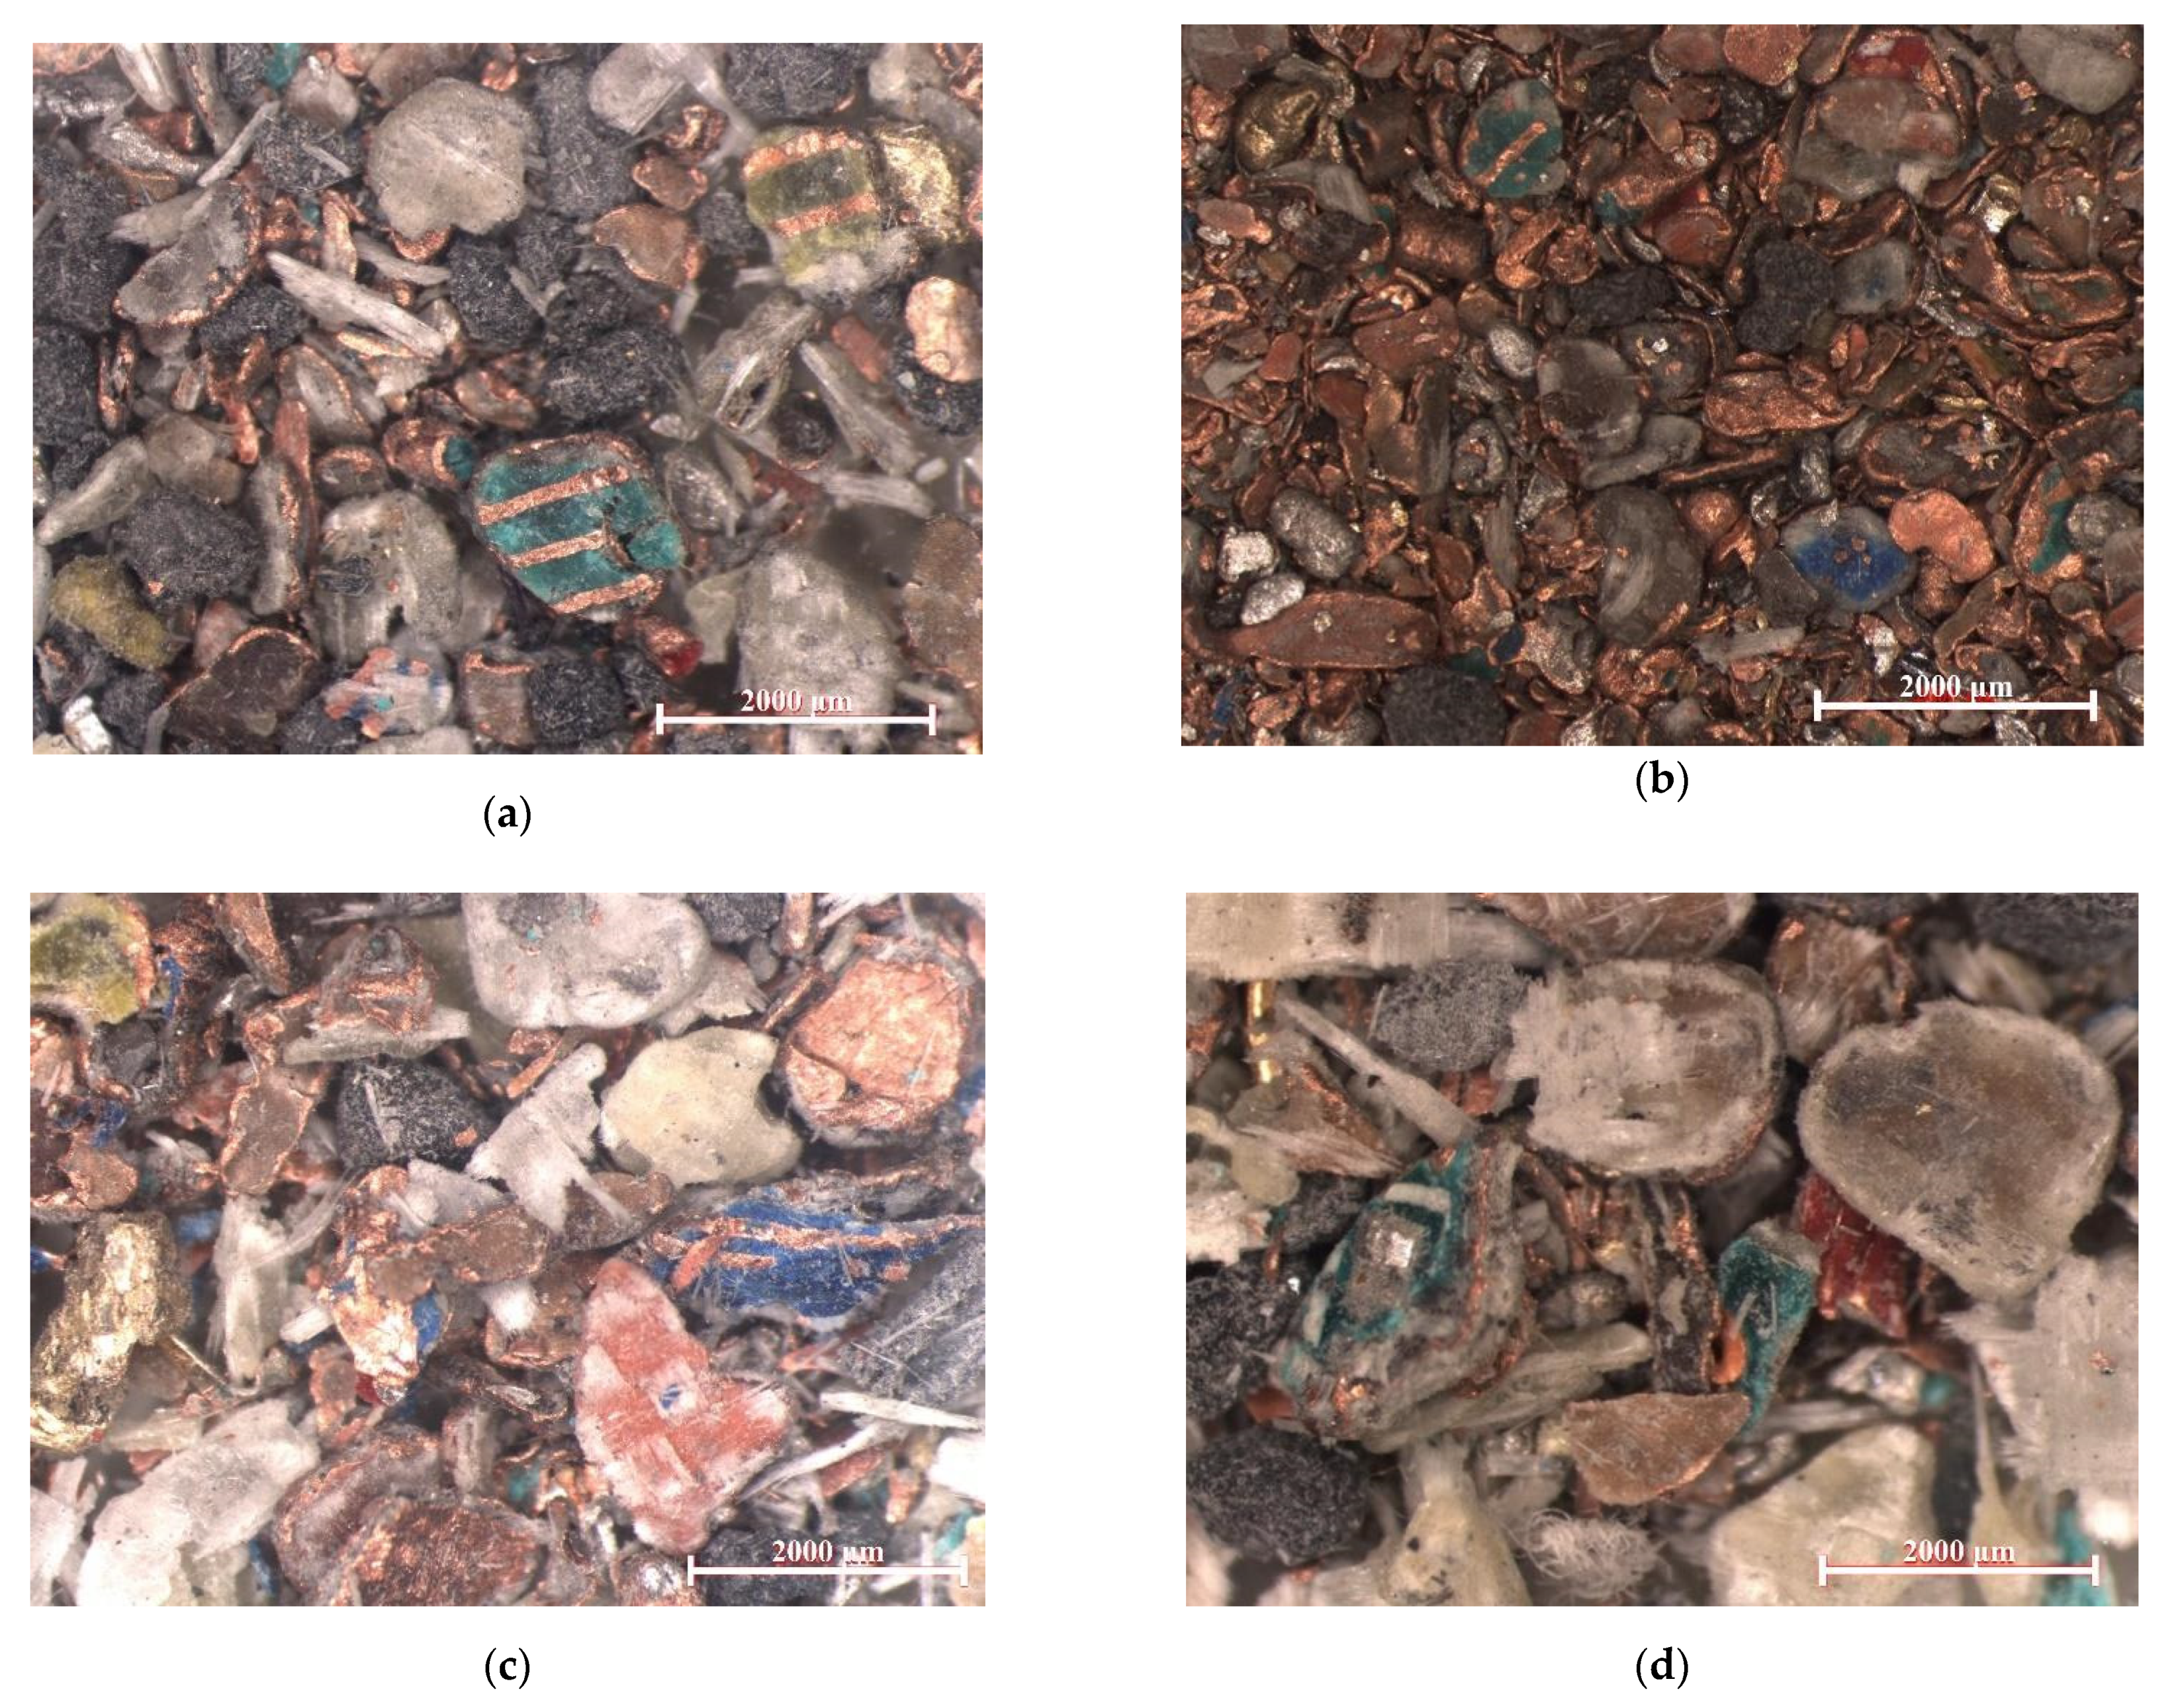
Figure 4 present pictures of the waste, intermediate, and concentrate (made with a stereo microscope), respectively, from the electrostatic separation process obtained for different grinding options. They confirm that the sizes of all grains decreased along with the reduction of perforation in the knife mill screens. Using additional cooling of the feed in option 2, the smallest grain sizes were obtained, which is particularly noticeable for the intermediate (
Figure 3b).
In the waste for all grinding options (
Figure 2), there were small amounts of metal grains or metal–plastic–ceramic conglomerates, while in the intermediates (
Figure 3), there were many grains that clearly indicated these compounds. The waste (
Figure 2) consisted mainly of fibrous and needle-shaped grains. Compared with other separation products, the greatest diversity of grains was observed in terms of their size, from less than 50 μm (fibre/needle thickness) to over 2000 μm. However, in the waste for options 1 and 2, grains larger than 1000 μm were relatively the scarcest. The penetration of grains larger than the screen used in the mill resulted from the elongated shape of the grains. The intermediates (
Figure 3) consisted mainly of patch grains and globular grains. The grains presented in
Figure 3c,d have a layer structure characteristic of PCBs. This shows that the level of grinding is insufficient. For option 2, the grain size was the least diversified (
Figure 2b). There were mainly thin patch grains with a diameter of 150 to 1000 μm. The yield of intermediates for options 1 and 2 was, however, very small, amounting to 2.8%. This shows that only a small fraction of the metals was not released sufficiently in the grinding process. In the intermediate of option 2, the least compounds of this type are observed, which may indicate the highest degree of release of the useful substance from the composite among the options. This part can be recycled for further grinding or processed using other metal recovery methods, such as bioleaching [
28,
52].
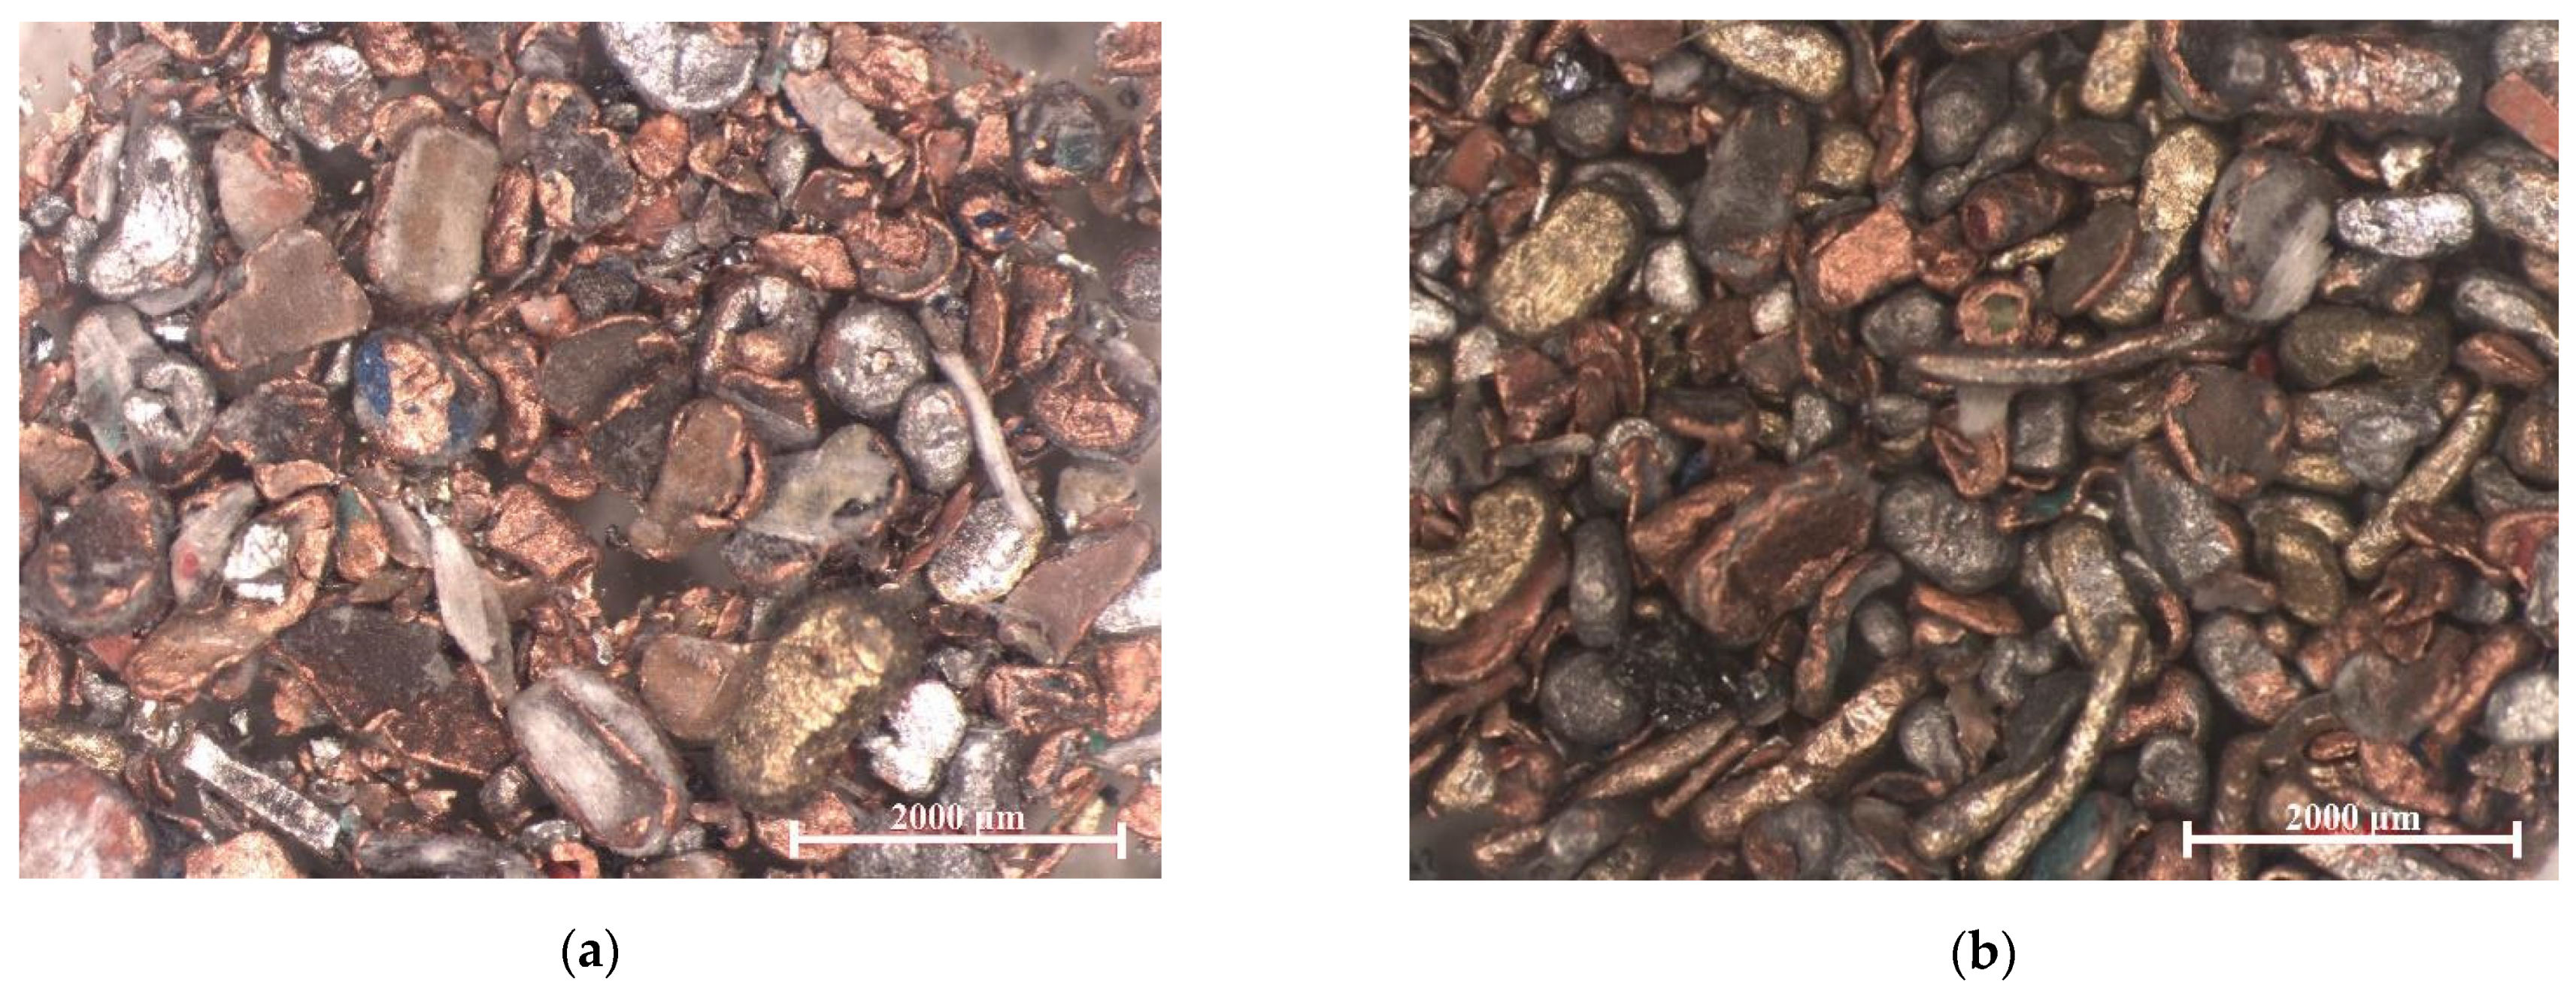
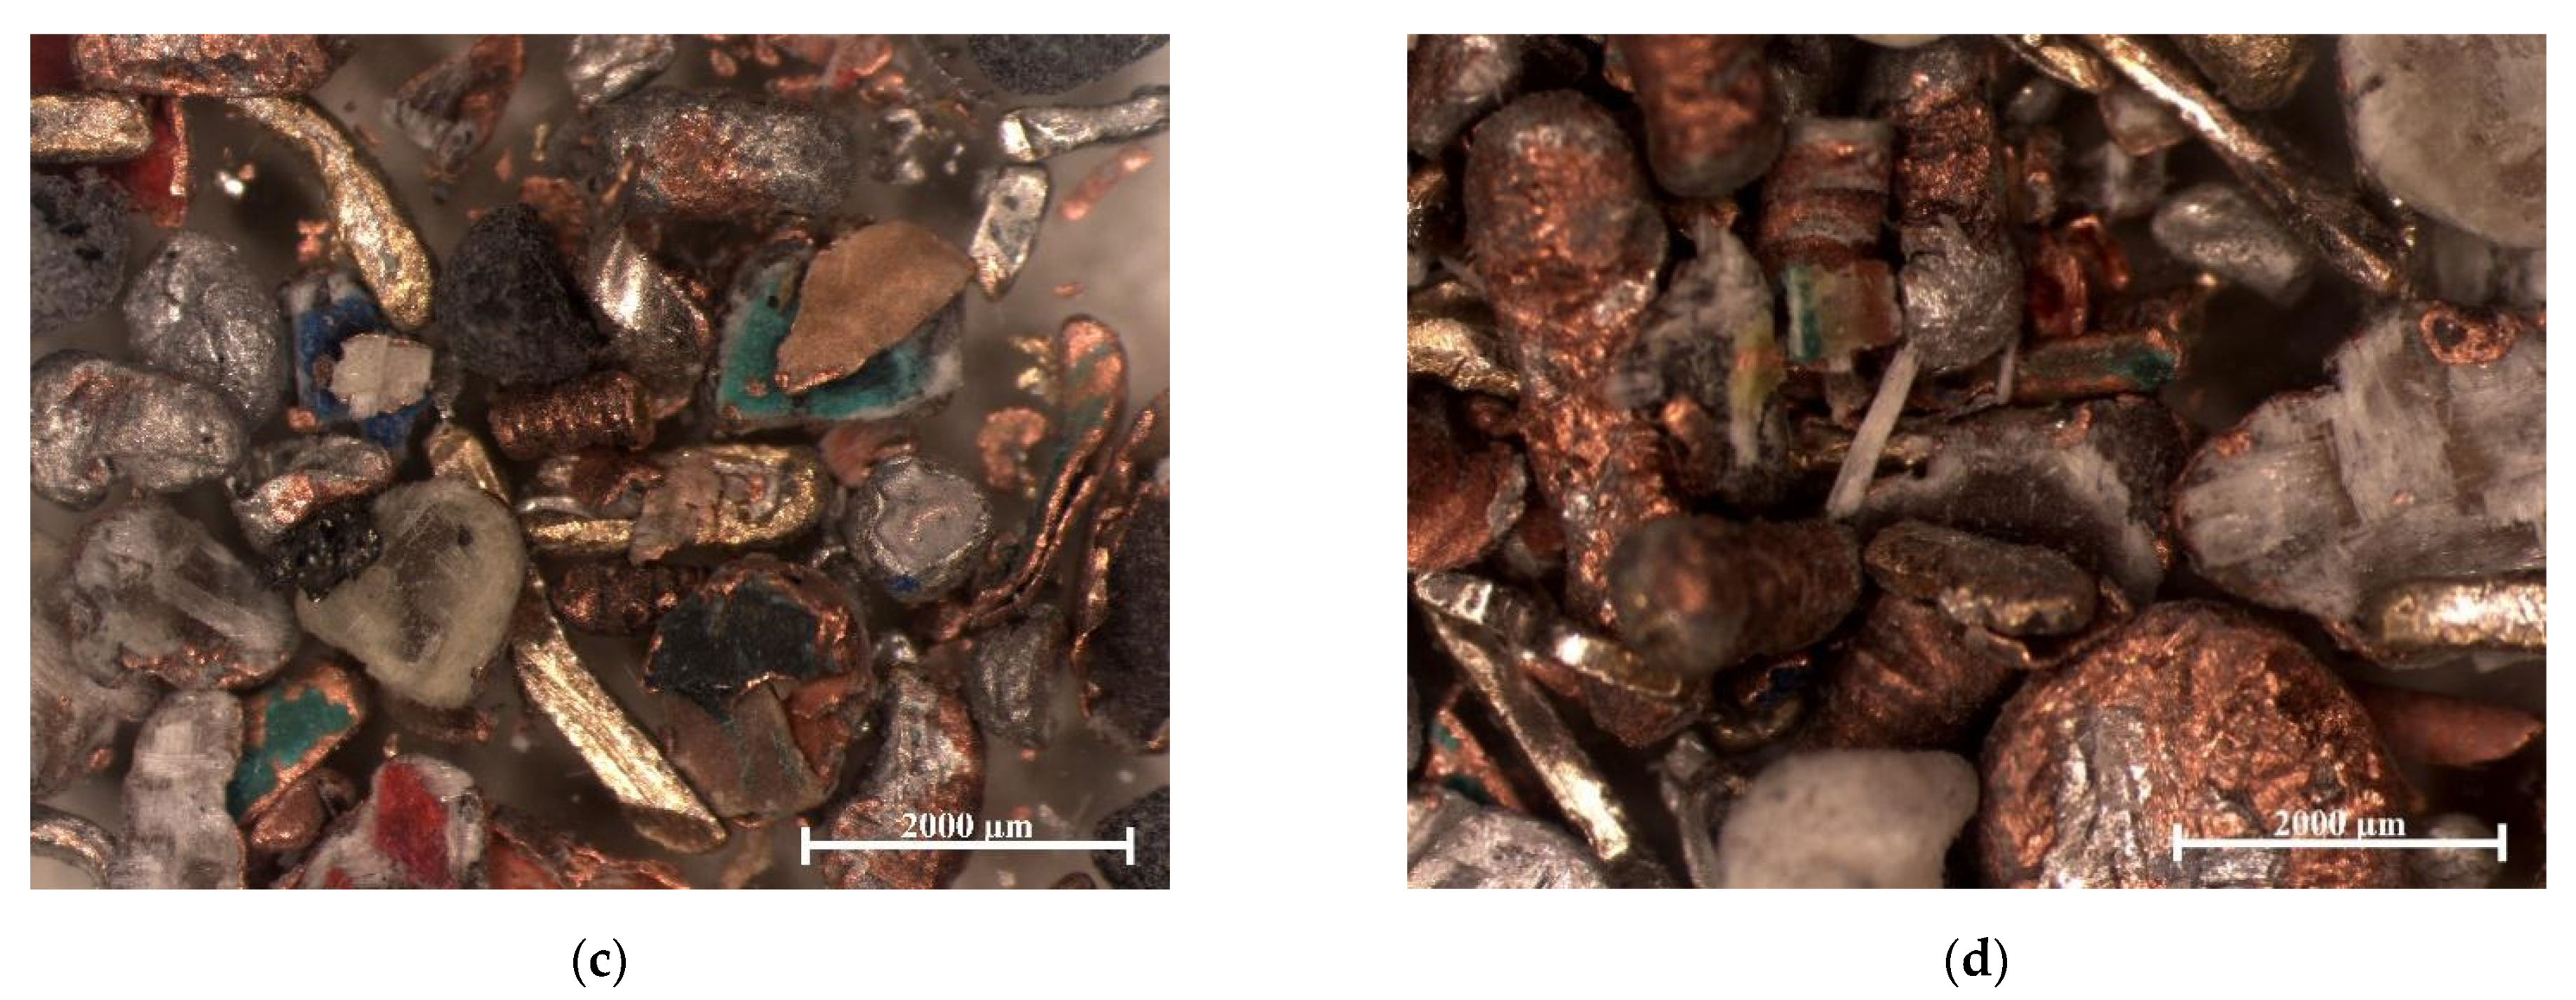
For the concentrates obtained in the third and fourth grinding options (
Figure 4c,d), numerous metal–plastic–ceramic compounds are visible, which is not the case for option 1 (
Figure 4a), and especially option 2 (
Figure 4b). In the group of all concentrates (
Figure 4), the greatest differentiation in terms of grain shape can be observed. There were polyhedral, globular, patch, and irregular grains here. The concentrate for option 2 (
Figure 4b), as compared with the others, was characterised by the smallest differentiation in terms of grain size and shape (the grains were more rounded). This shows that the strength properties of PCBs have changed at cryogenic temperatures due to the application of liquid nitrogen. Option 2 was dominated by grains of globular shape (most abundant in the range of 250–500 μm) and patch shape (patch thickness, >30 μm; width, ~500 μm). In the case of polyhedral grains, the transverse dimensions ranged from 200 to 350 μm. Irregular grains were probably created as a result of crushing the patch grains.
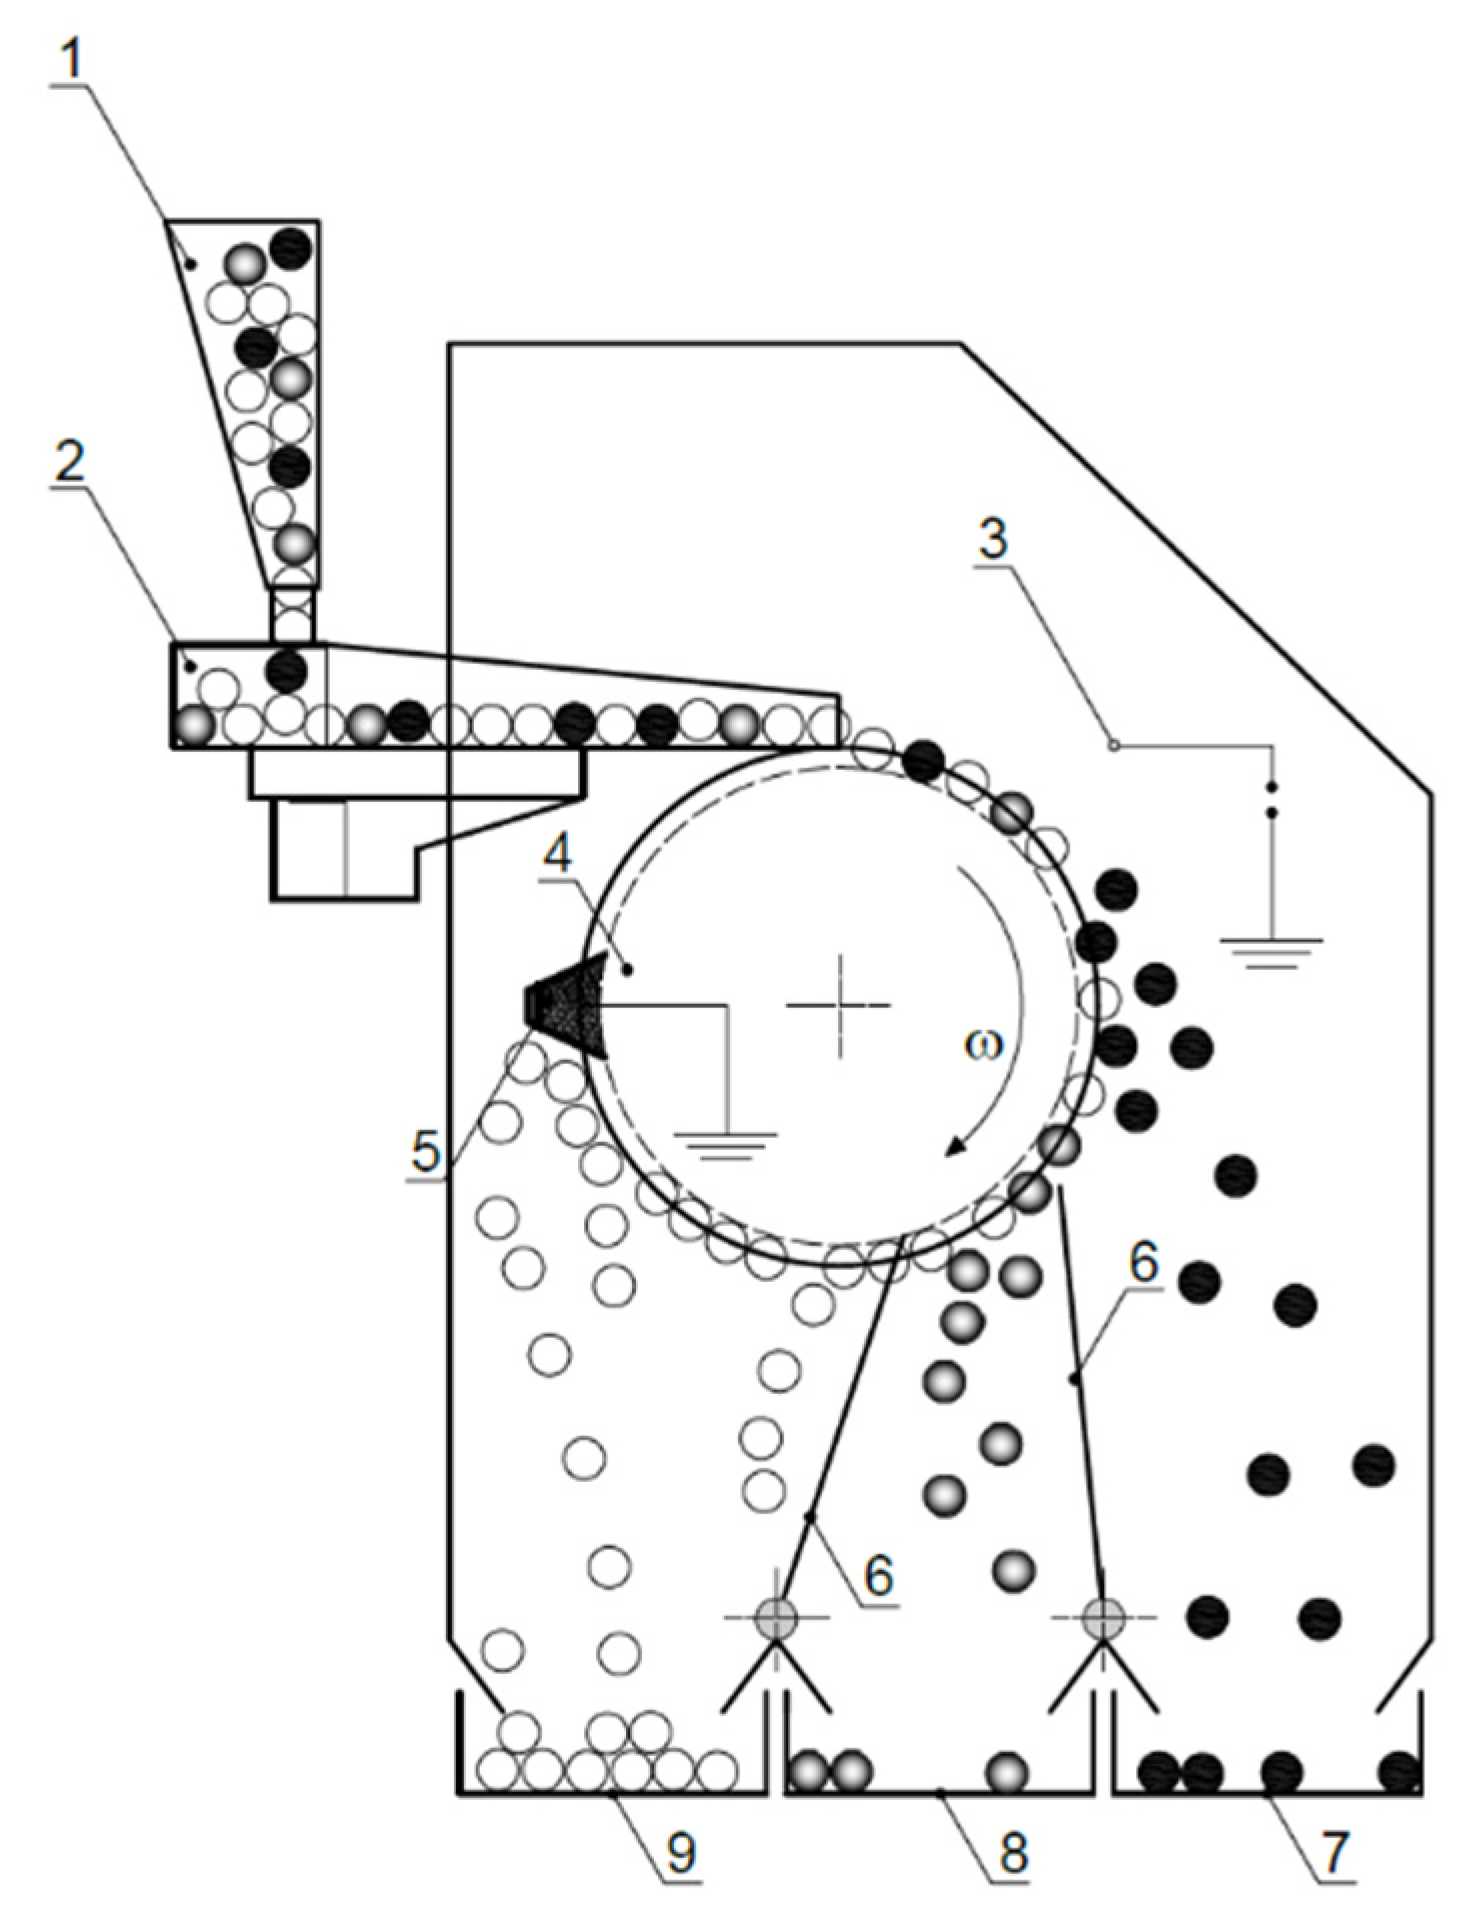
In order to improve the efficiency of electrostatic separation, the process can be optimised by adjusting the voltage applied to the electrode, the distance between the electrode and the device’s shaft, and the shaft rotation speed. Failure to adjust the last of the mentioned parameters could cause very fine metal particles to penetrate into the intermediate and waste. These particles were affected by a very small centrifugal force due to the movement of the separator shaft.
The grains of metals, probably copper, with dimensions of 450, 800, and 1200 μm, visible in
Figure 2a,d, characterised by a patch shape, could have penetrated into the waste and the intermediate due to the presence of plastic and ceramic materials in the grain or as a result of being covered by grains made of plastic and ceramic materials (aggregation effect) [
36]. The results of the tests of the chemical compositions of the feed and electrostatic separation products for all analysed grinding options are presented in
Table 3 (the measurements were made using ICP-AES). In the feed, the main identified elements were Cu (17.70%), Si (12.02%), Ca (6.56%), Sn (2.92%), Al (1.95%), Br (1.64%), and less than 1% of Zn, Mg, Pb, Fe, Ba, Ti, Sb, Ni, Cr, Mn, and Ag (0.0301%), and Au (0.0029%). The remaining unidentified part of the feed probably consists of the components of epoxy resins, which mainly include polyphenols, less often polyglycols, and epichlorohydrin or oligomers [
53,
54,
55].
Concentrates obtained from electrostatic separation, first, second, third, and fourth grinding options, contained 86.6%, 93.3%, 76.0%, and 54.4% of valuable metals, respectively, among which for the most effective option 2, 68.5% Cu, 0.1074% Ag, 0.0142% Au, and 2.7%, 2.0%, 9.6%, and 9.8% residues constituting nonvaluable elements were identified. The second group of elements includes Sb, Ca, Br, Ba, Mg, Mn—components of epoxy resins used to improve the properties of PCBs, especially as flame retardants [
12]—and Si, a component of glass fabrics [
10].
In the concentrate for option 2, the share of precious metals was clearly visible, which was 0.1074% for silver and 0.0092% for gold. The most abundant metal in the concentrate was copper (68.5%), followed by tin (11.5%) and aluminium (6.8%). Higher amounts of metals as compared with the other options also applied to metals such as zinc, magnesium, lead, barium, calcium, iron, nickel, titanium, and chromium.
As can be seen above, the concentrate obtained from option 2 contained much larger amounts of valuable metals than those from options 3 and 4 and slightly larger amounts than that from option 1. This demonstrates that the efficiency of the electrostatic separation process is influenced by the method of preparing the feed for the separator—first, the perforation in the knife mill screen, and then the cooling of the feed to the knife mill to cryogenic temperatures.
The yield of intermediates from the electrostatic separation process ranged, for the tested options of PCB grinding, from 2.8% for options 1 and 2 to 6.3% for option 4 (
Table 2). This is a small amount, especially for the first two grinding options. The ICP tests identified 22% (option 2) to 27% (option 3) of elements. The remaining part are probably, as for the remaining separation products, organic substances in the form of the previously mentioned polyphenols or polyglycols. Of the identified elements, 45%–60% were valuable elements. For the most effective grinding option, they were Cu (6.68%), Fe (1.50%), Al (1.34%), and Sn (1.18%). Among the nonvaluable elements, Si (3.19%), Ca (2.41%), Mg (1.51%), and Br (1.12%) should be mentioned.
There were small amounts of metals in the waste from electrostatic separation, especially in options 1 (1.99%) and 2 (0.54%). In this end product, apart from unidentified organic substances, Si (approximately 14%) and Ca (approximately 8%) as well as Mg and Br (approximately 2%) were identified. The waste yield in option 2 was as high as 71%. Taking into account the fact that there were almost no metals in the free state, it can be used for the production of various components/prefabricates [
12].
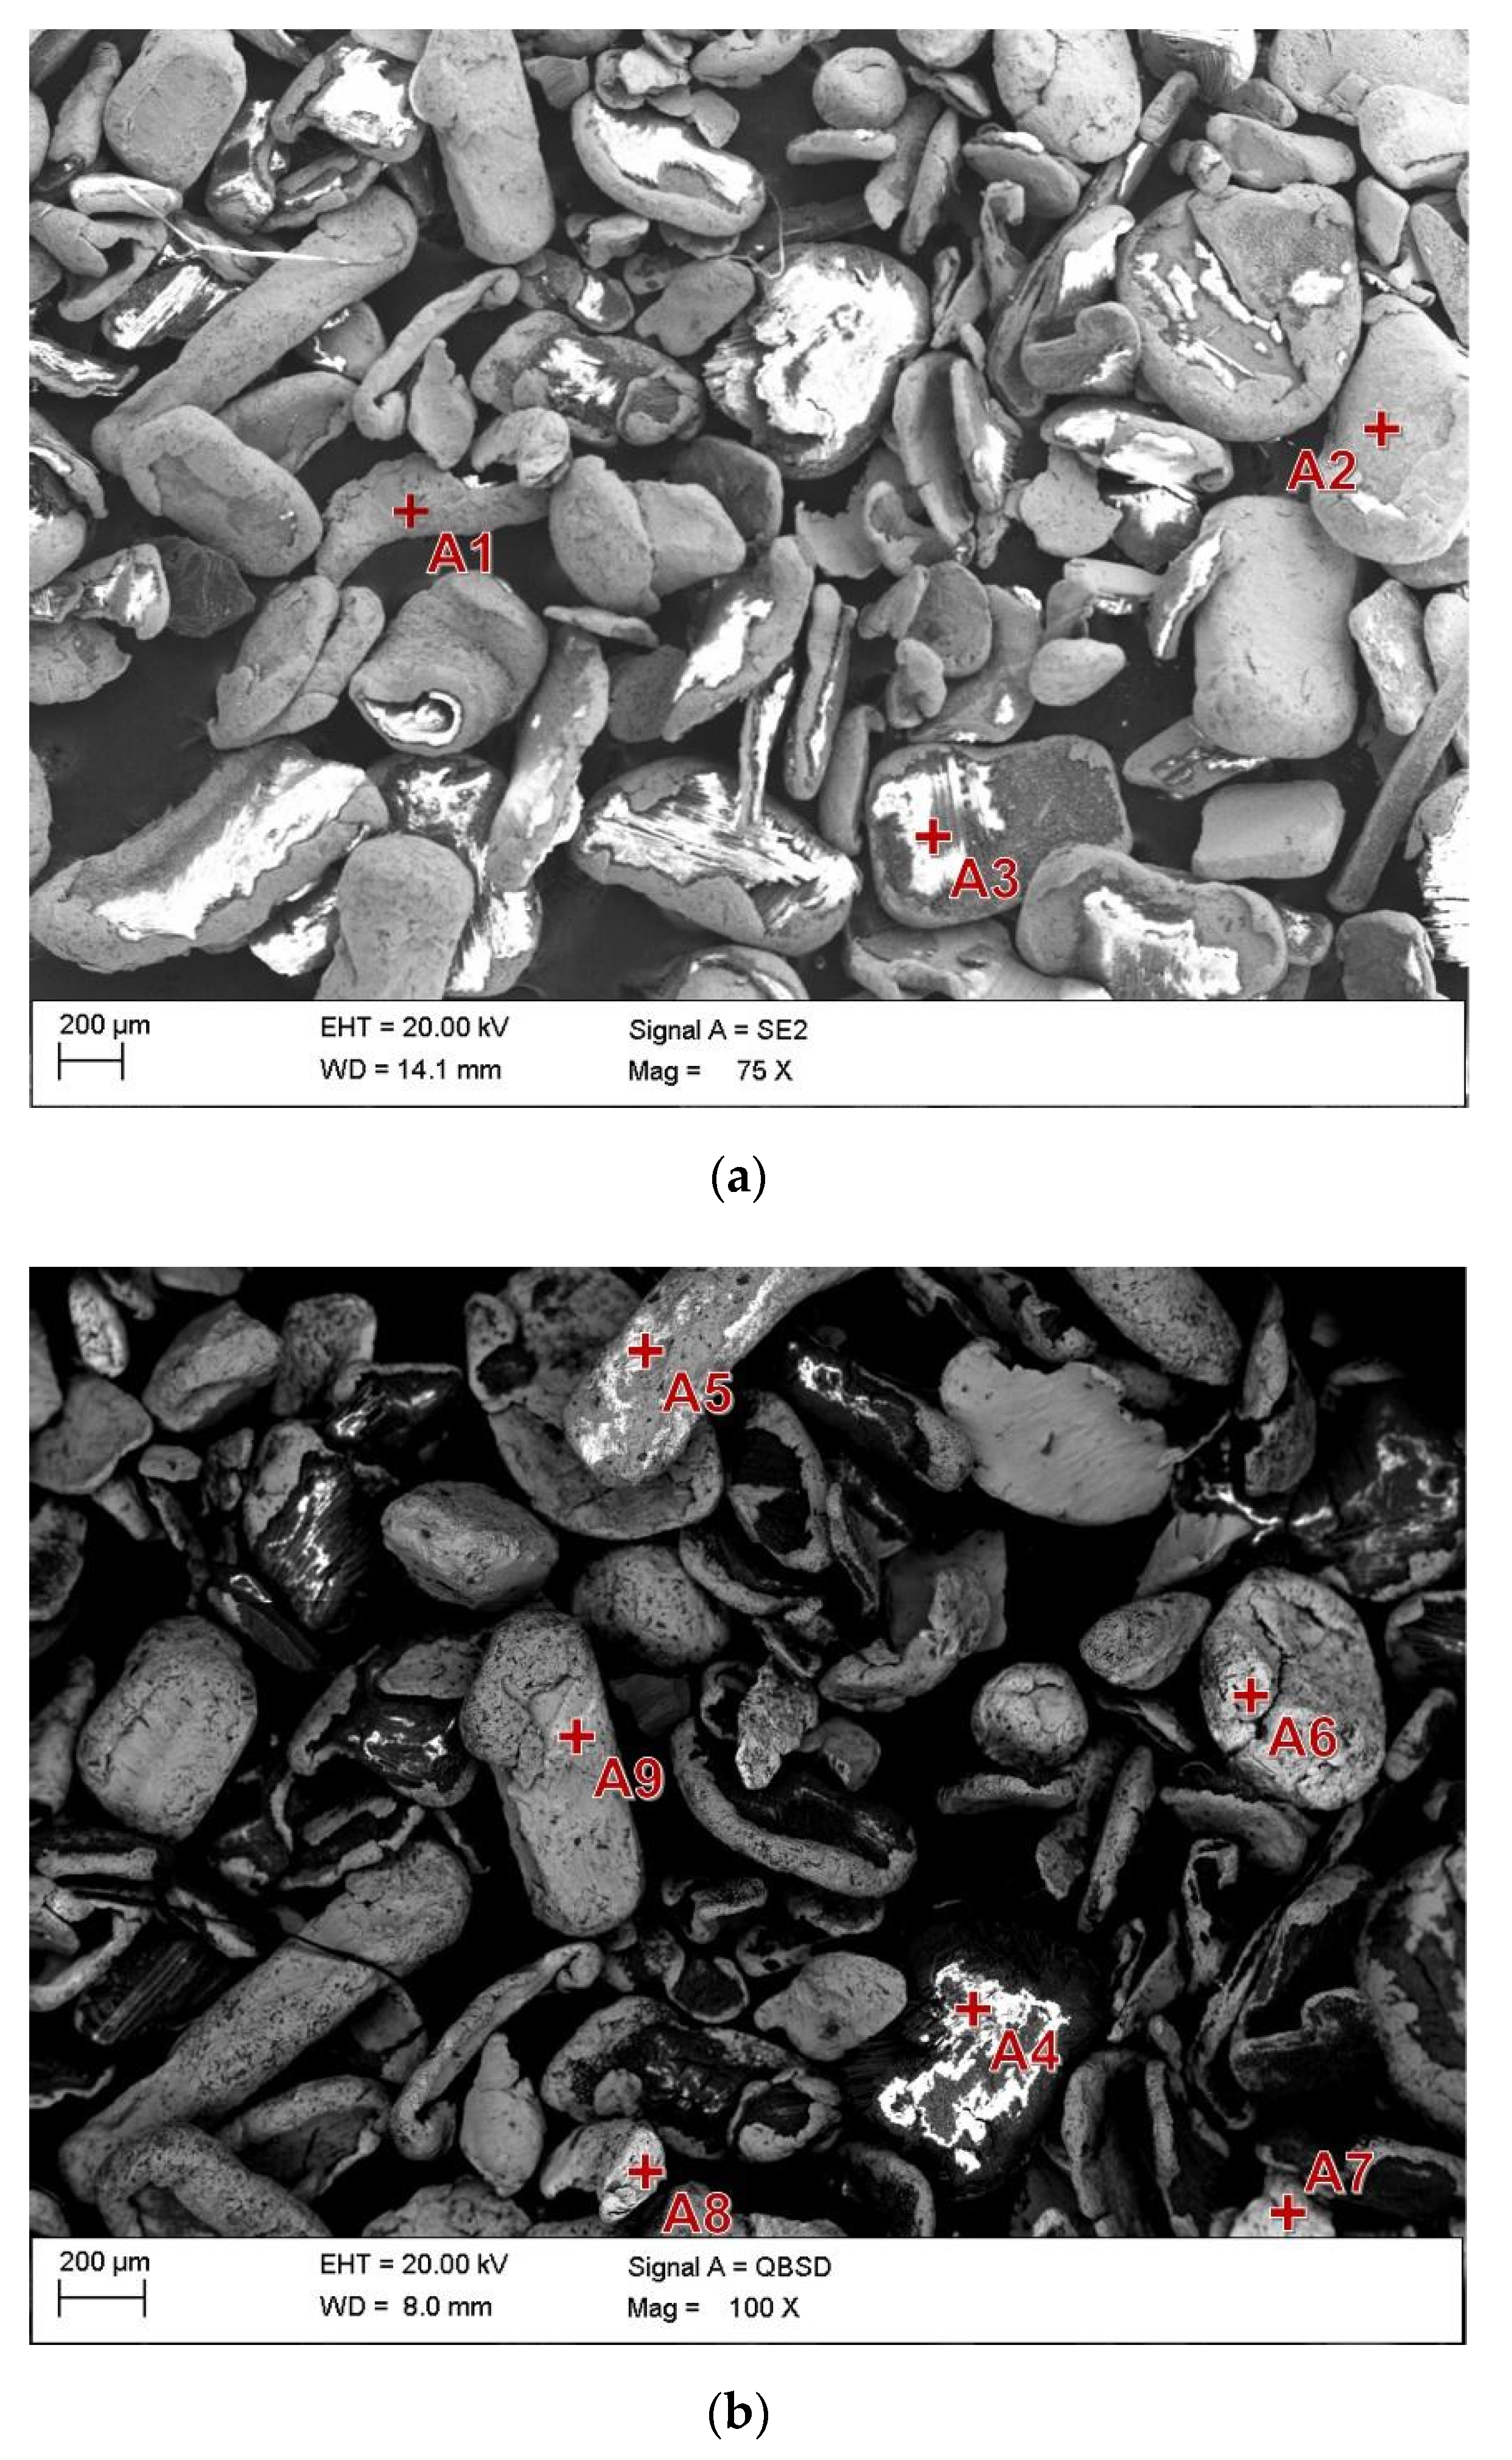
In order to investigate the morphology of the concentrate and intermediate grains obtained from the most effective option for preparing the feed for an electrostatic separator (option 2), and to determine the chemical composition in grain micro-areas, as well as to demonstrate the number and type of metal–plastic–ceramic or metal–metal compounds, photographs were taken using quadrant backscatter diffraction (QBSD) (
Figure 5 and
Figure 6), and measurements were performed using EDS (
Table 4 and
Table 5). The differences in grain contrast in these figures indicate their heterogeneous chemical composition. The lighter areas indicate the presence of elements with a higher atomic number, while the dark ones indicate the elements with a lower atomic number. However, one should take into account the possibility of accumulation of surface charges by plastics, which, in the case of electrification, can also appear as bright areas. The concentrate (
Figure 5) contained mostly homogeneous grains, without contrast. There were also a few grains forming metal–metal or metal–plastic–ceramic compounds. One the other hand, in the intermediate (
Figure 6), the opposite was true; mainly nonhomogeneous grains appeared—all grains are in two shades.
The concentrations of the elements measured for the selected micro-areas of the concentrate grains (
Figure 5) and the intermediate grains (
Figure 6) are presented in
Table 4 and
Table 5, respectively. The grains in the concentrate (
Figure 5) below 300 μm in size were mainly homogeneous—they did not display any contrast. The patch grains and the irregular grains obtained were mainly made up of copper (e.g., points A1 and A2 in
Figure 5). In the case of patch grains >600 μm in size (e.g., point A3 in
Figure 5 marked on a grain with a diameter of 900 μm), an insufficient degree of metal release from nonvaluable elements is observed, from Si and Al in this case. The investigated micro-area of this grain consisted of 66% of these elements. In the remaining micro-areas of Si concentrate grains examined by means of EDS, it was absent or there was only a small amount (less than 5%). At point A5 (
Figure 5,
Table 4), the presence of gold was indicated for the elongated grain. It can be assumed that the grain came from gold-plated contacts. Elongated grains exhibit the highest purity, regardless of their size. It can therefore be assumed that these grains came mainly from contacts that had no connections with the PCB composite. Each tested area in the concentrate contained different amounts of aluminium.
On the basis of the presented analysis and observation of all concentrate grains, it can be summarised and generalised that metals contained in grains with size >800 μm are insufficiently released from plastic and ceramic materials. They should be ground again under the conditions in line with option 2.
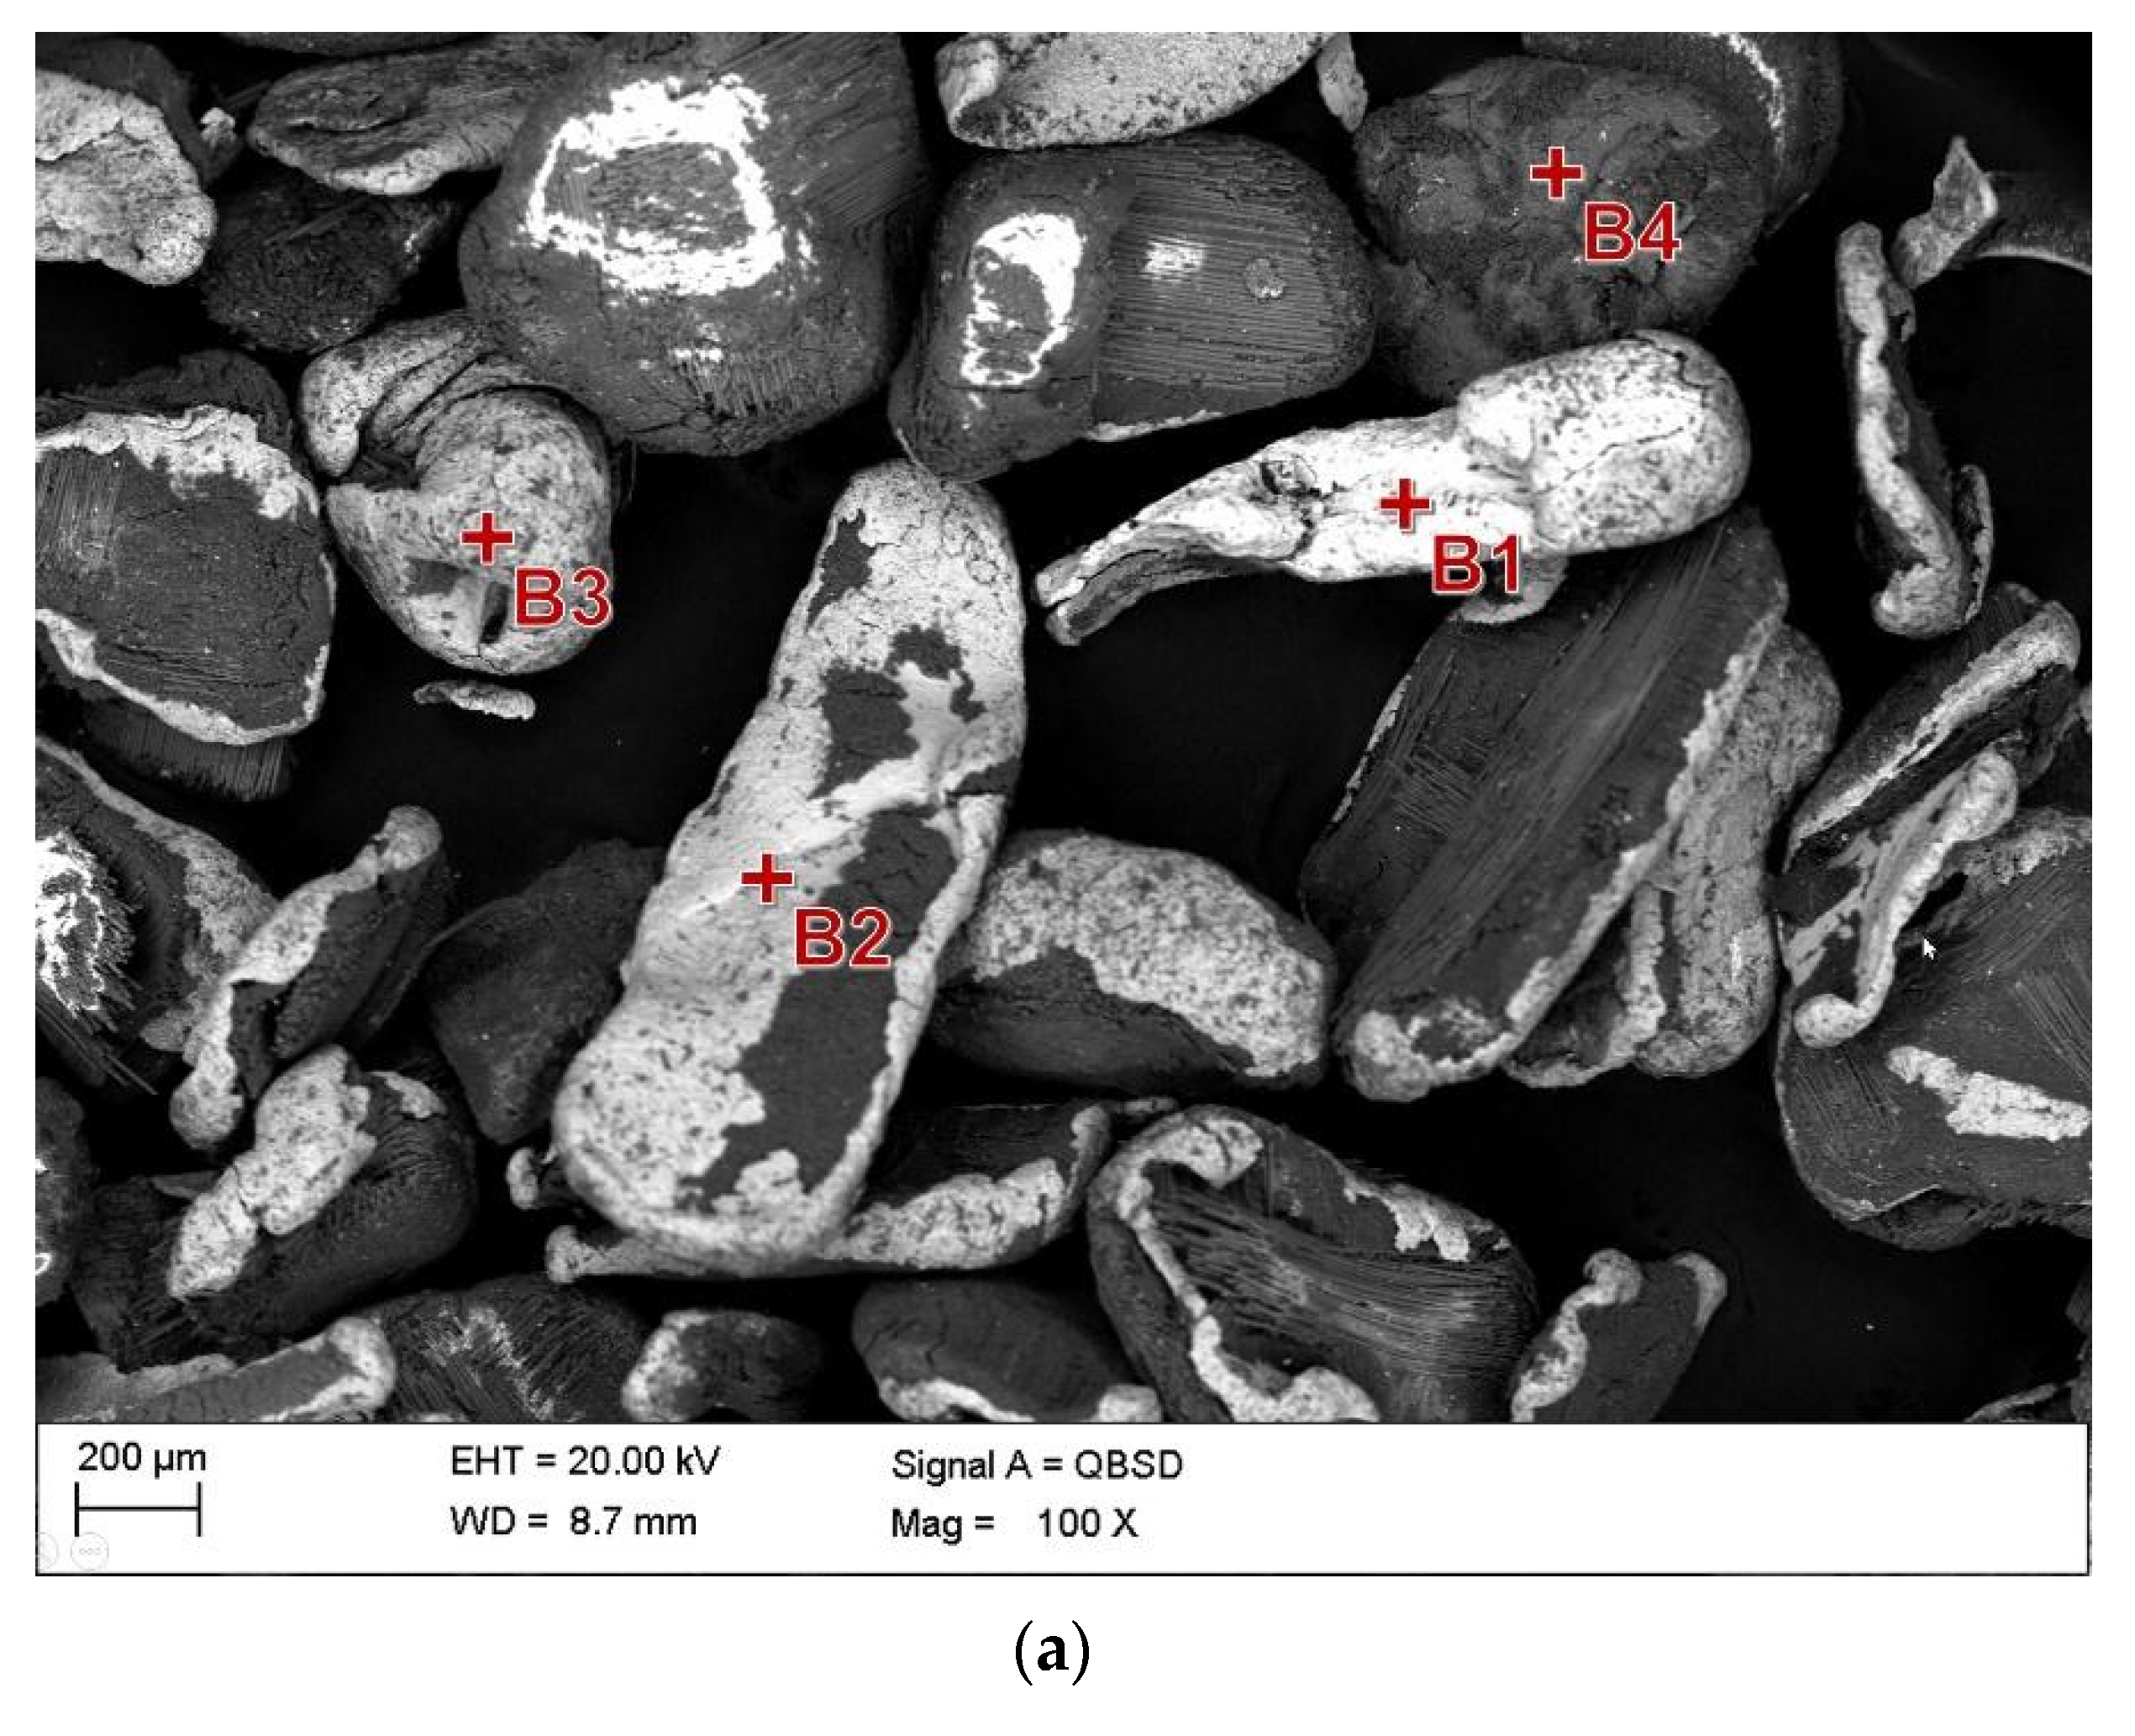
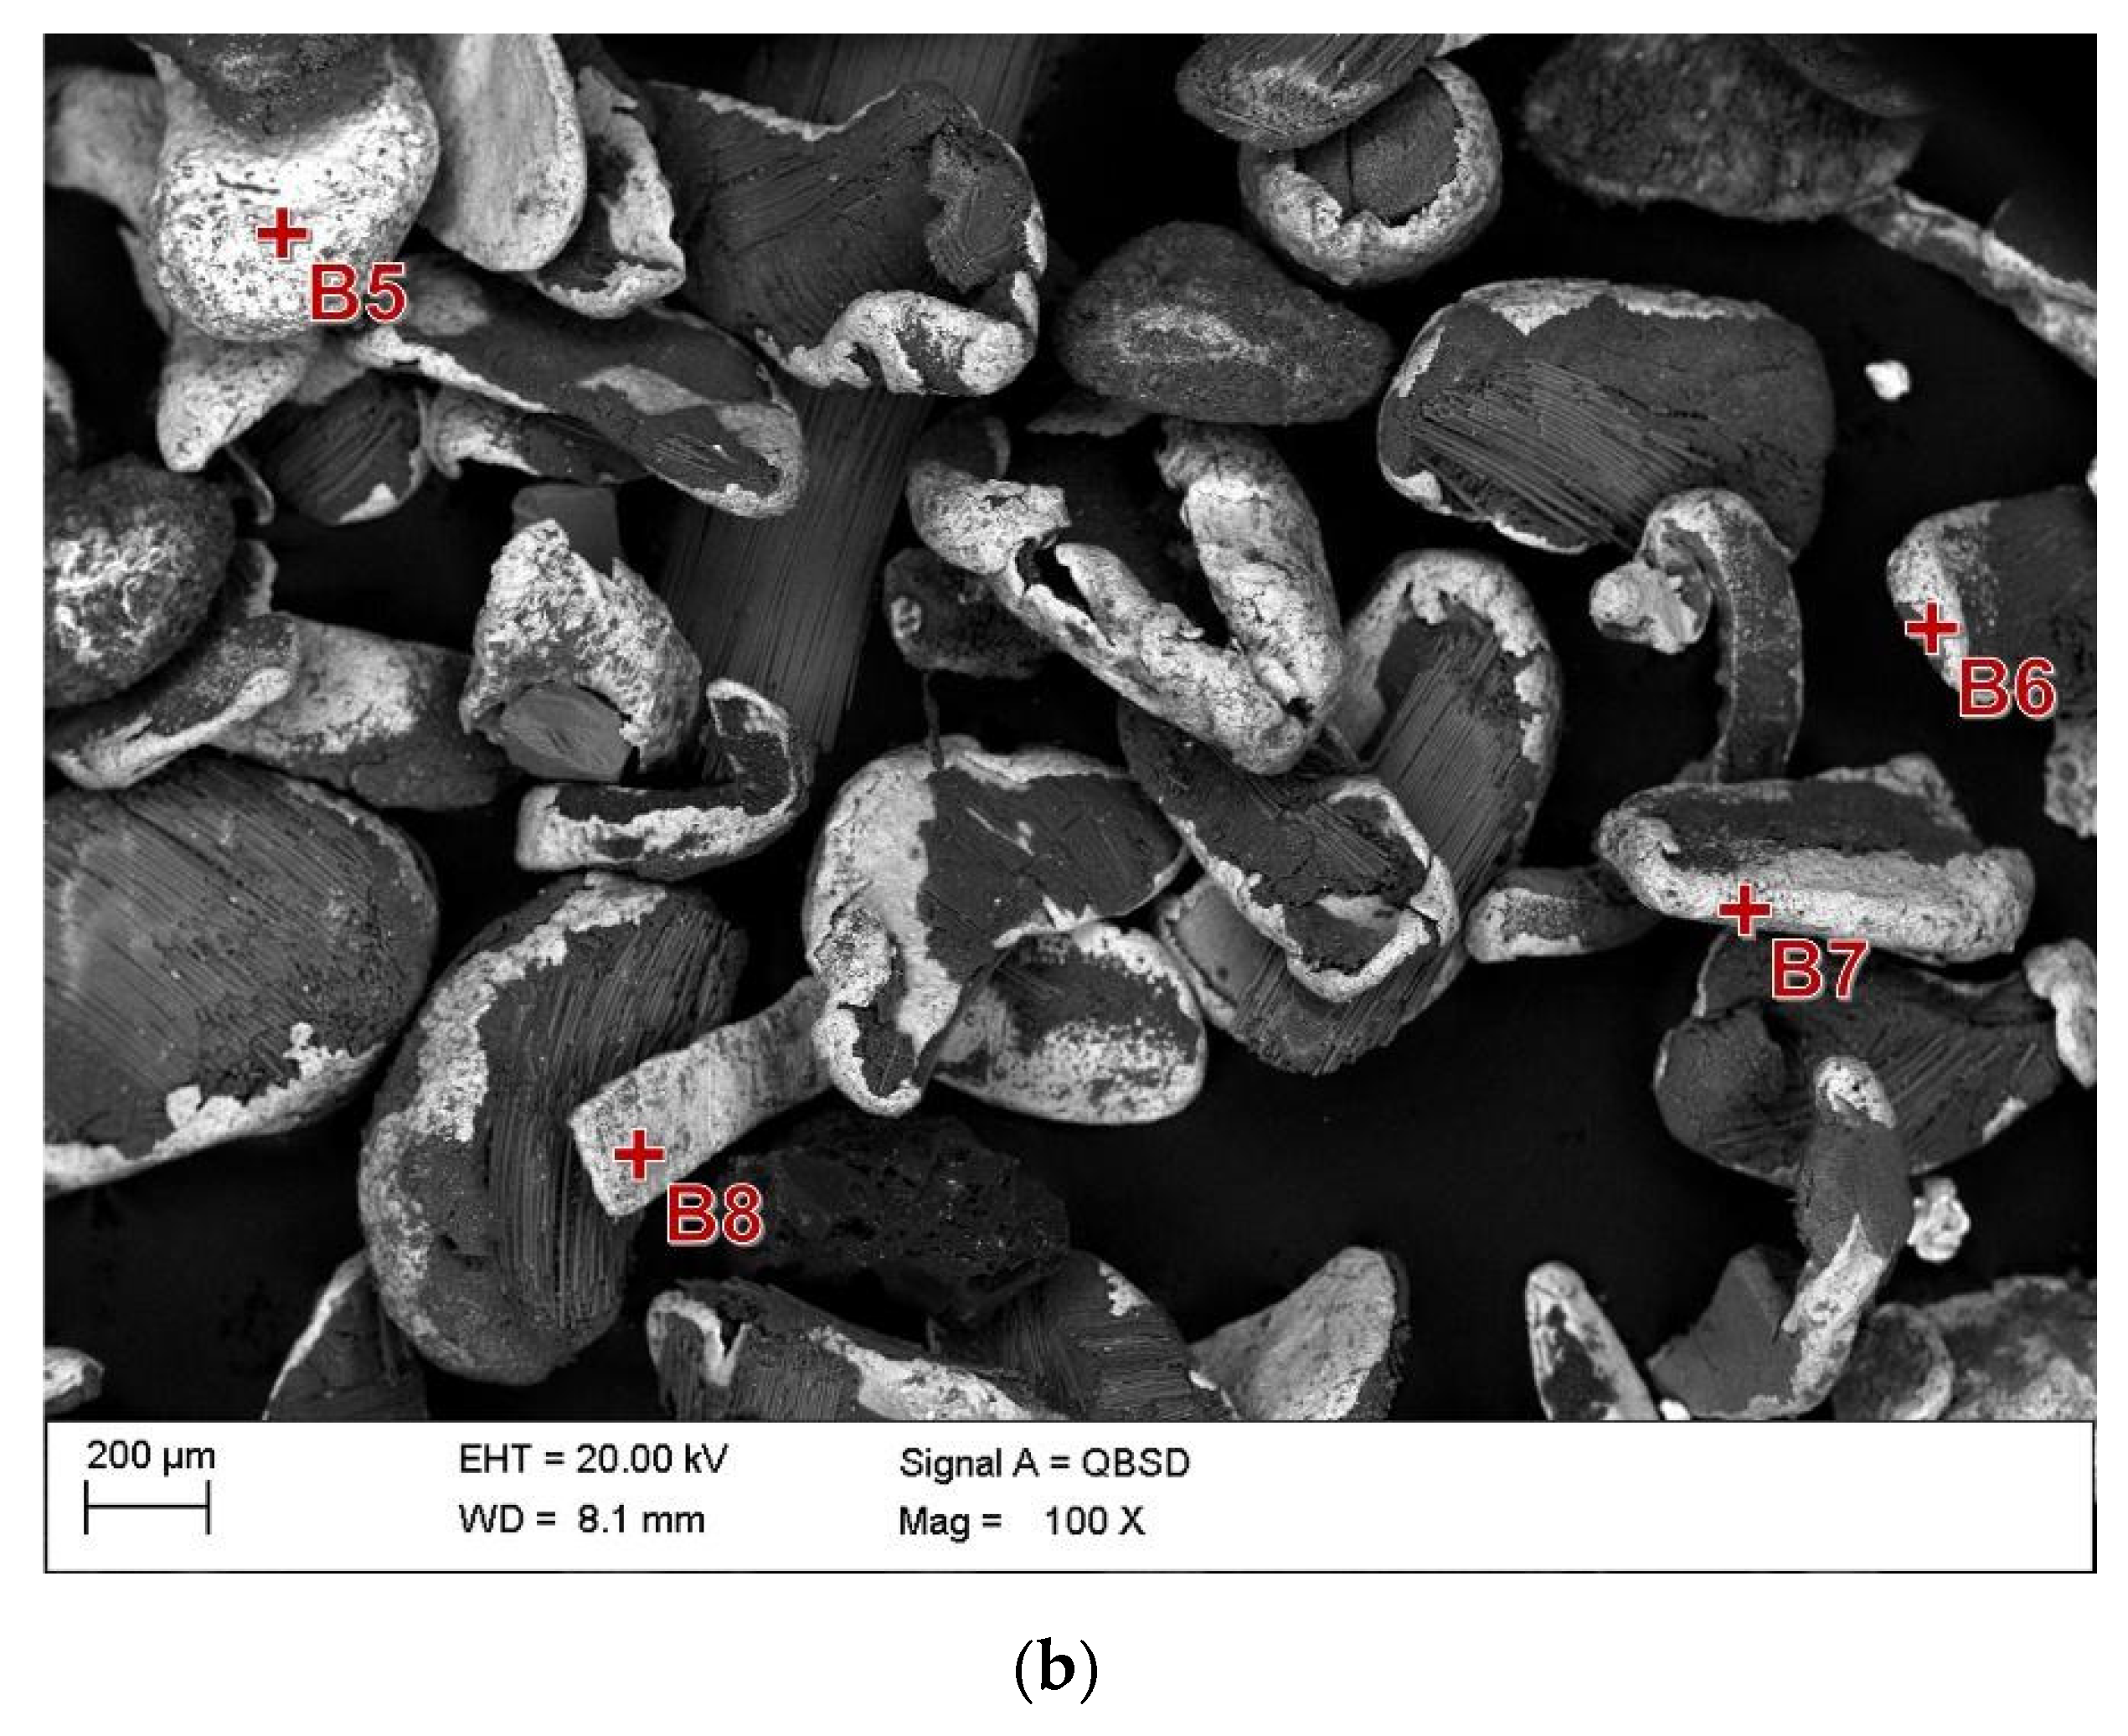
Compared with the concentrate, the grains present in the intermediate were larger and ranged from about 500 μm to 1000 μm (
Figure 6). The fibrous structure characteristic of ceramics can be seen in almost every grain. The grains’ shape, their two-sided connections with plastic and ceramic materials, and their high copper content (
Table 5) may indicate that these grains mainly come from the internal PCB layers. Due to the size of the grains, the intermediate can be reground or subjected to digestion with leaching solutions.
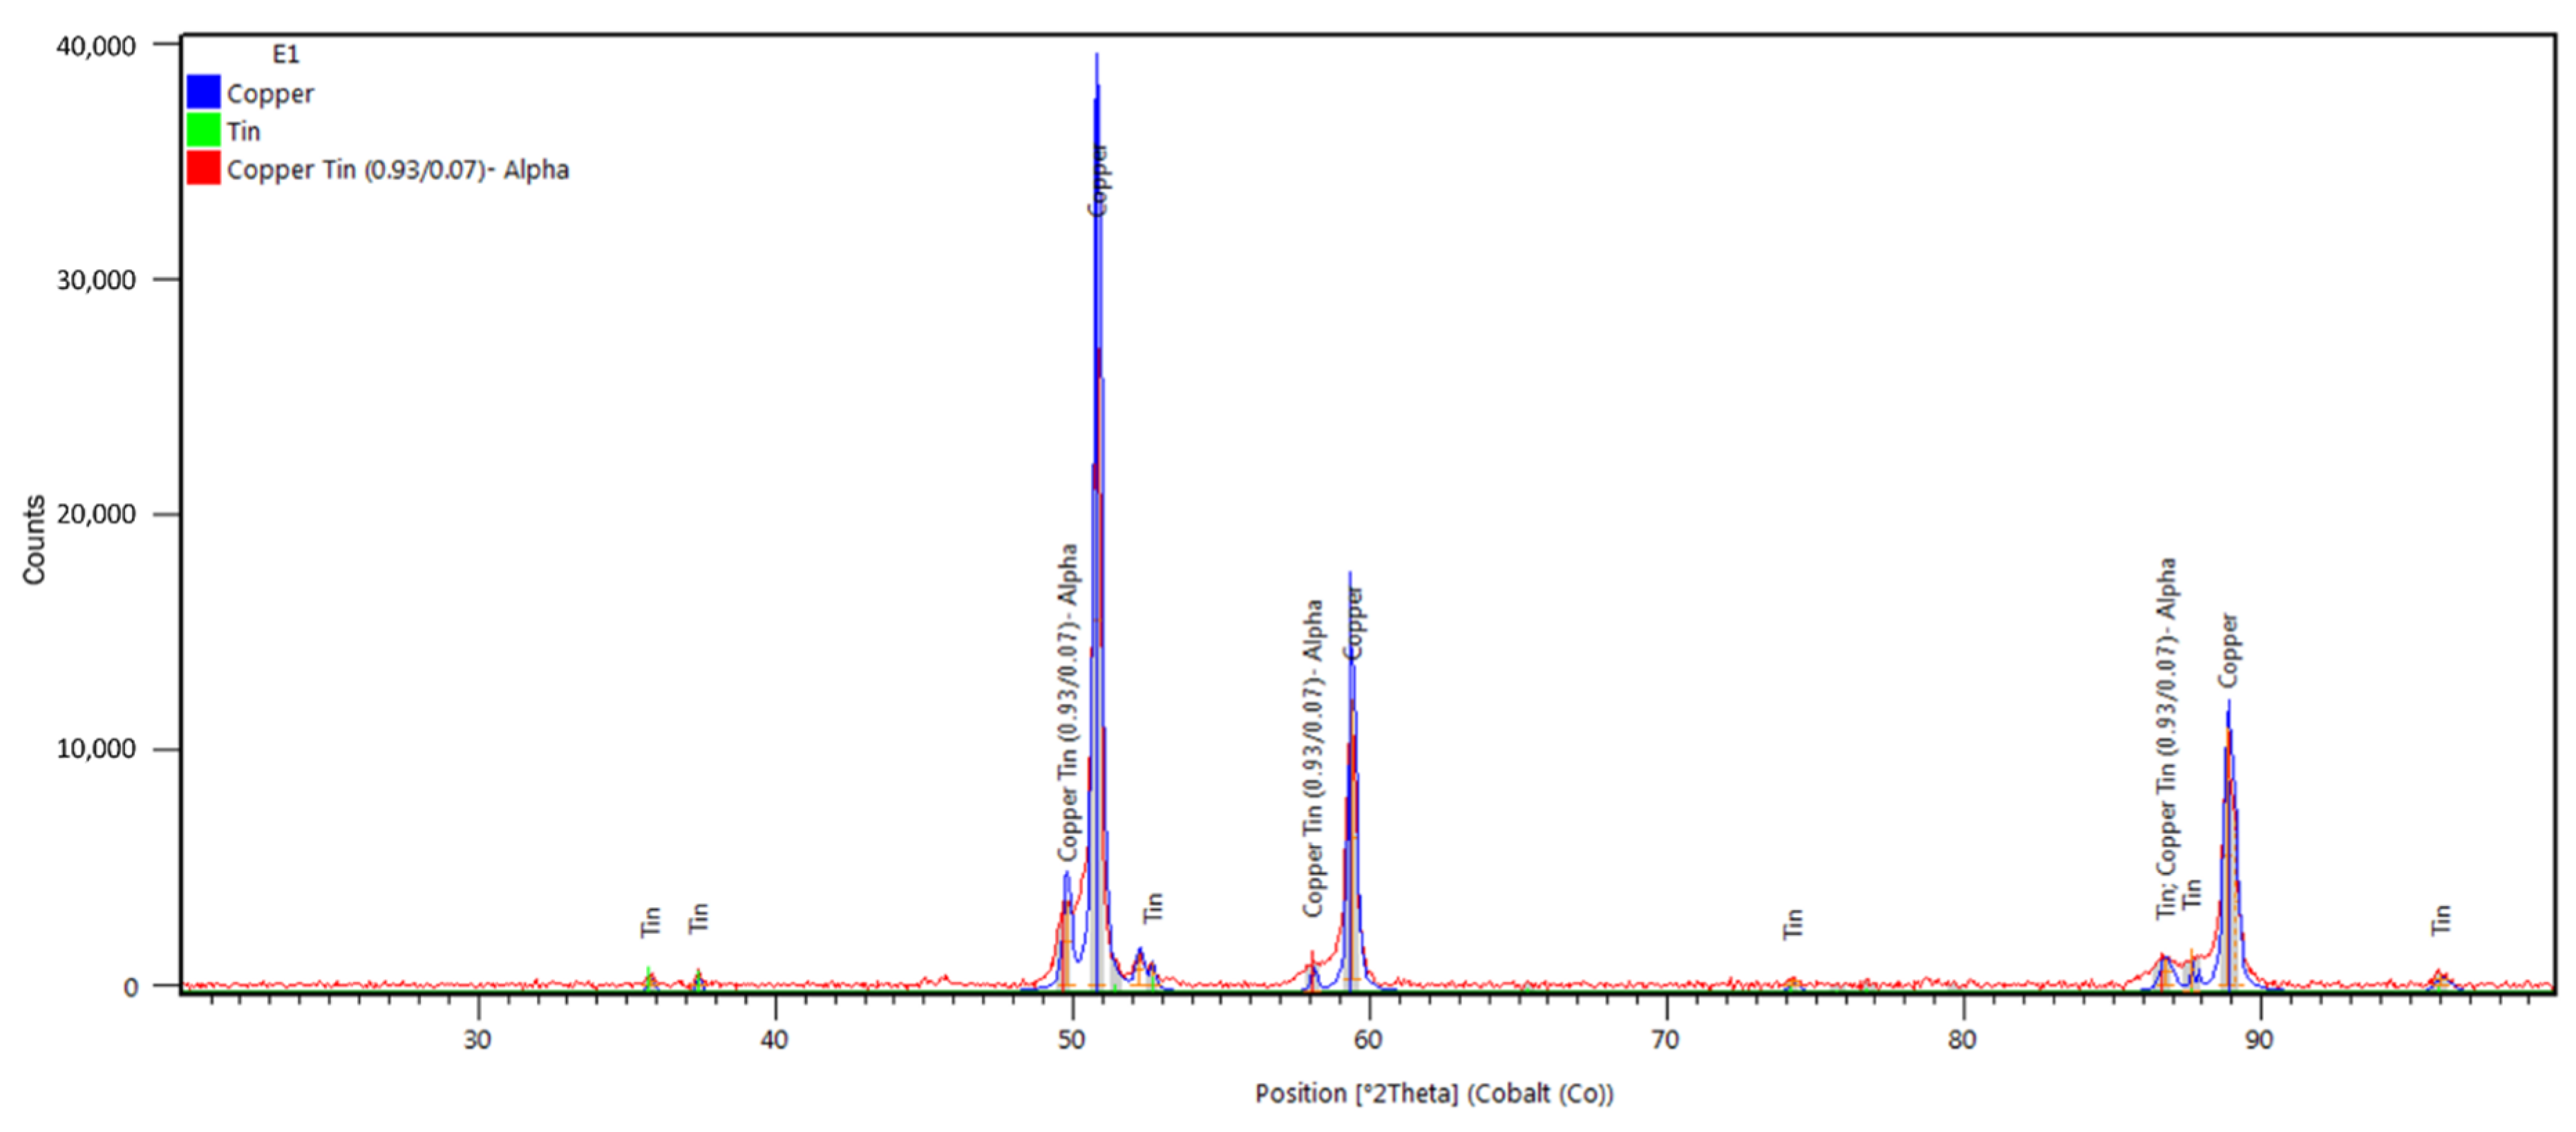
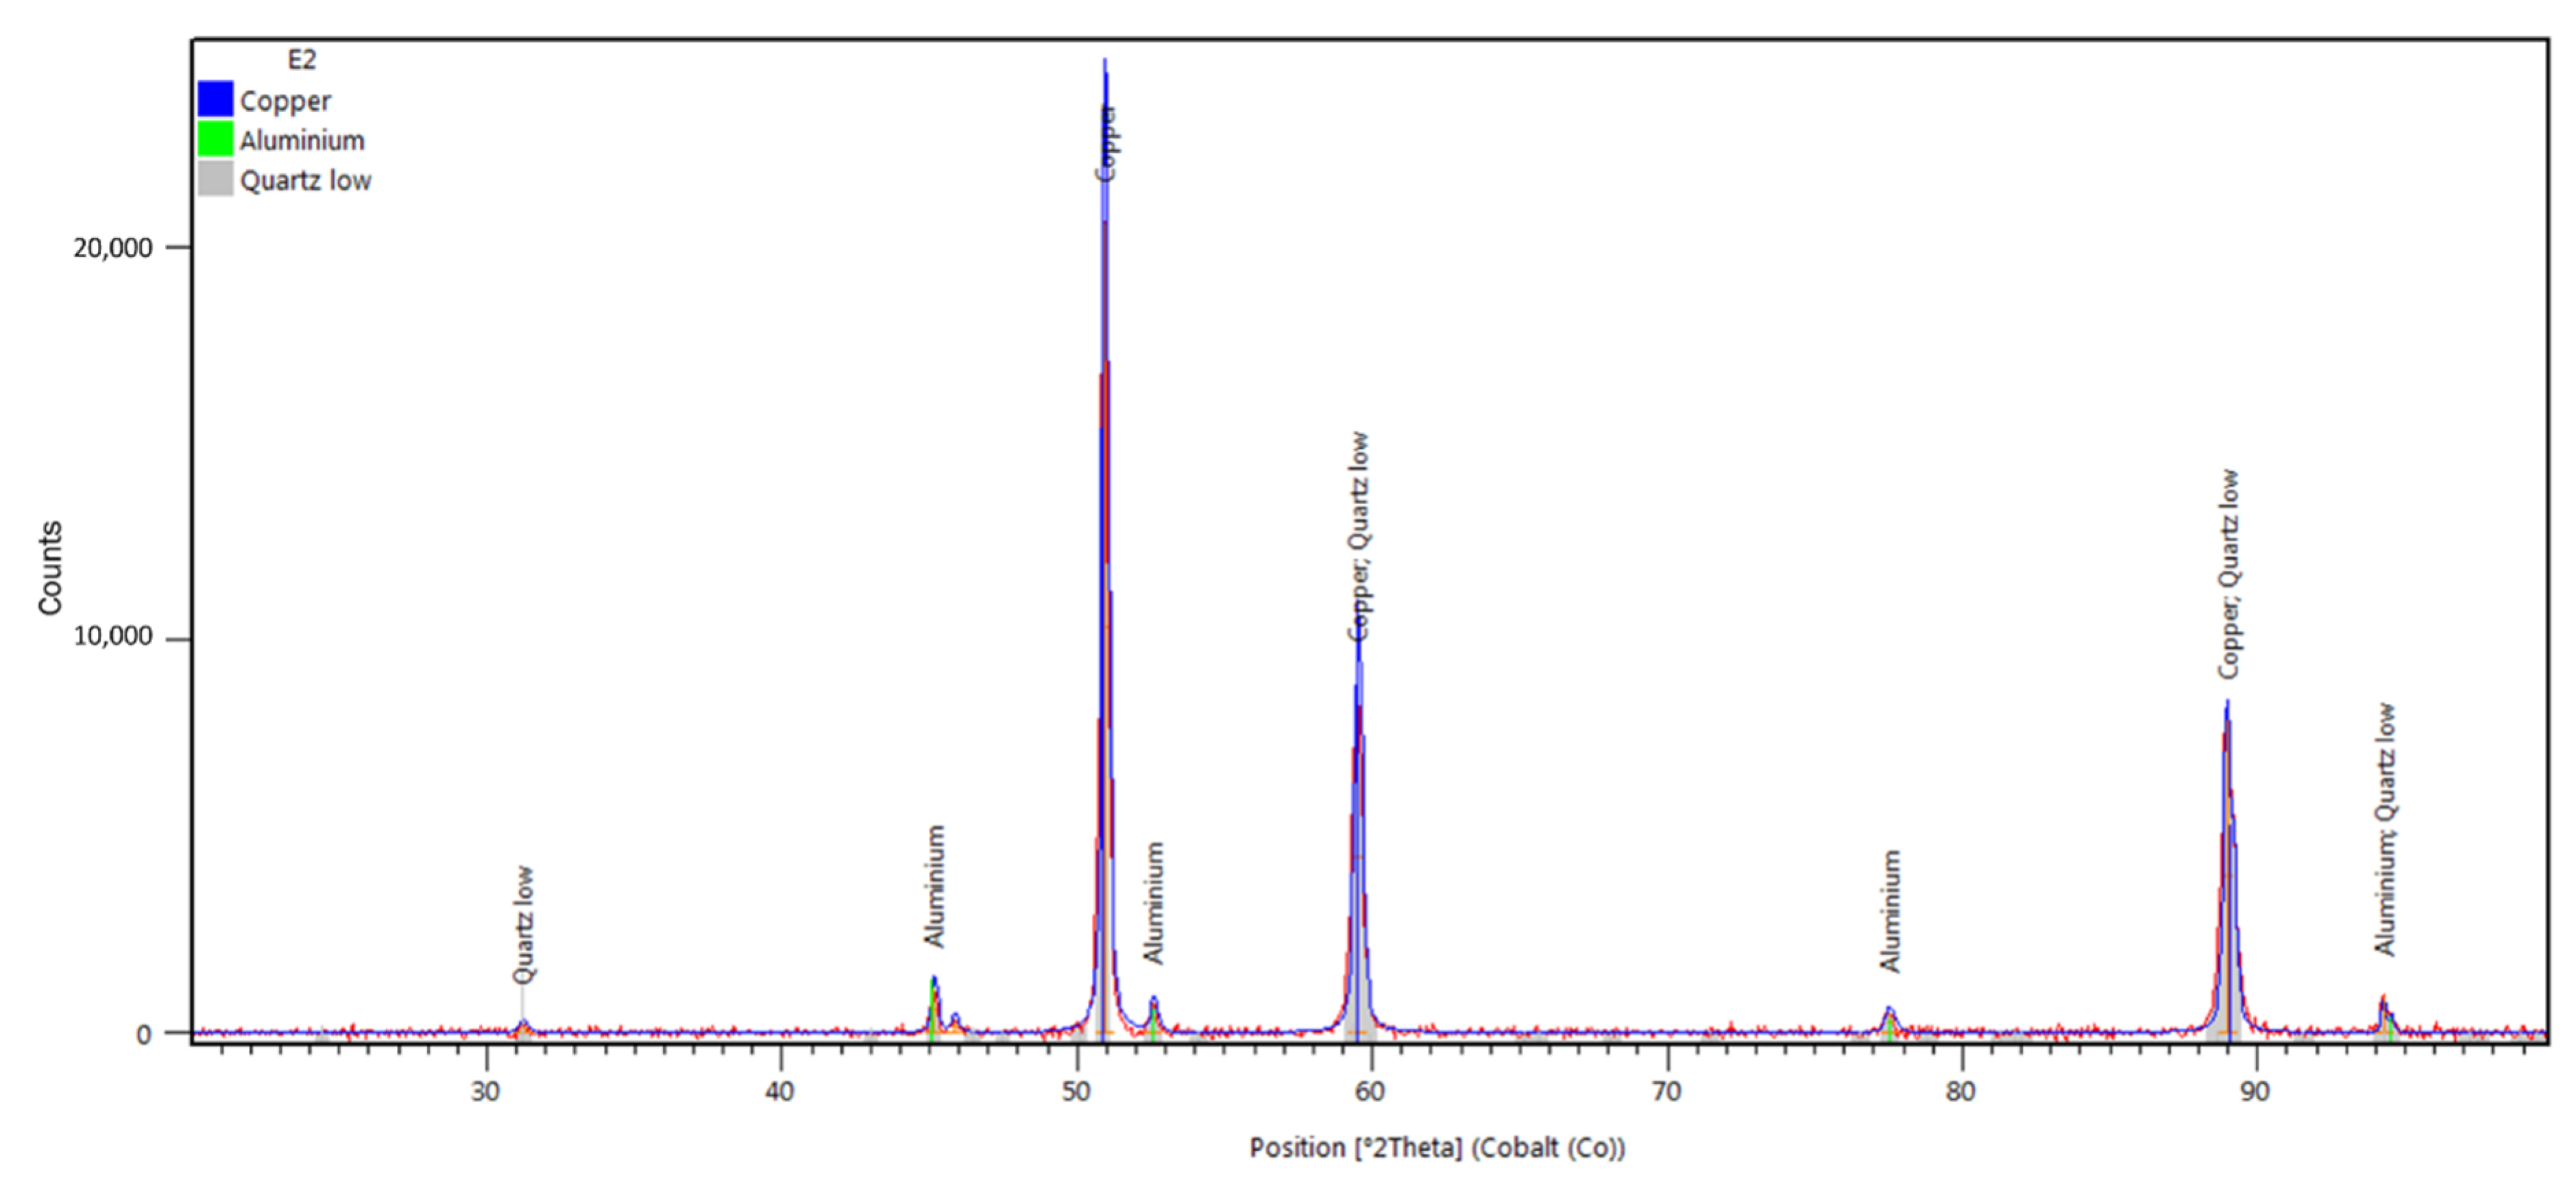
X-ray qualitative phase analysis was carried out for the concentrate and the intermediate also obtained from the most effective option for preparing the feed for an electrostatic separator (i.e., option 2). The analysis of the phase composition of the concentrate (
Figure 7) did not indicate phases that could suggest the presence of impurities, nonvaluable elements, unlike that of the intermediate (
Figure 8), where the diffraction lines from silicon were identified. Phases such as copper, tin, and CuSn (bronze) were identified in the concentrate (
Figure 7), while in the intermediate, apart from silicon, copper and aluminium were also present. Due to the limited sensitivity of the method, the presence of other metallic/nonmetallic phases in small amounts cannot be excluded.


 ,
, 


