Article

Deformation Microstructures of Phyllite in Gunsan, Korea, and Implications for Seismic Anisotropy in Continental Crust

Tectonophysics Laboratory, School of Earth and Environmental Sciences, Seoul National University, Seoul 08826, Korea
*
Author to whom correspondence should be addressed.
Minerals 2021, 11(3), 294; https://doi.org/10.3390/min11030294
Submission received: 31 December 2020 / Revised: 5 March 2021 / Accepted: 6 March 2021 / Published: 11 March 2021

Abstract

:
Muscovite is a major constituent mineral in the continental crust that exhibits very strong seismic anisotropy. Muscovite alignment in rocks can significantly affect the magnitude and symmetry of seismic anisotropy. In this study, deformation microstructures of muscovite-quartz phyllites from the Geumseongri Formation in Gunsan, Korea, were studied to investigate the relationship between muscovite and chlorite fabrics in strongly deformed rocks and the seismic anisotropy observed in the continental crust. The [001] axes of muscovite and chlorite were strongly aligned subnormal to the foliation, while the [100] and [010] axes were aligned subparallel to the foliation. The distribution of quartz c-axes indicates activation of the basal<a>, rhomb<a> and prism<a> slip systems. For albite, most samples showed (001) or (010) poles aligned subnormal to the foliation. The calculated seismic anisotropies based on the lattice preferred orientation and modal compositions were in the range of 9.0–21.7% for the P-wave anisotropy and 9.6–24.2% for the maximum S-wave anisotropy. Our results indicate that the modal composition and alignment of muscovite and chlorite significantly affect the magnitude and symmetry of seismic anisotropy. It was found that the coexistence of muscovite and chlorite contributes to seismic anisotropy constructively when their [001] axes are aligned in the same direction.

1. Introduction

Seismic anisotropy originating in the interior of the earth provides important information for understanding tectonic processes, deep earth structures and geodynamics [1,2,3,4,5,6,7,8]. In continental crust, strong seismic anisotropies have been observed in large-scale tectonic structures such as mountain belts in orogenic systems [9,10,11], strike-slip faults or shear zones near plate boundaries [3,4], and the overriding upper crust in subduction zones [12,13]. In many cases, the fast S-wave polarization direction in continental crust is parallel to the major tectonic boundary formed by compressive regime [4,11,13]. These seismic patterns are usually attributed to the fault or fluid-filled cracks [14,15,16] and the orientation of anisotropic fabrics and structures [2,12,17].
Many studies using the receiver function technique [9,18], acoustic wave velocity measurements in laboratory settings [15,16,19], and fabric analysis on naturally [5,19,20,21,22,23] and experimentally [24,25] deformed rock samples have suggested that the layering and lattice preferred orientation (LPO) of anisotropic minerals is one of the important factors controlling the seismic anisotropy in the middle crust below the depth of microcrack closure (P ≈ 150–250 MPa [15,16,18,26]). Mica and amphibole groups are major constituent minerals in continental crust, which are elastically anisotropic [27,28,29]. In particular, phyllosilicate minerals show very strong anisotropy and it has been suggested that these minerals play an important role in affecting seismic anisotropies observed in various tectonic settings [5,17,22,30,31,32,33,34].
Owing to its abundance in the crust, the deformation mechanism and LPO of quartz have long been investigated. Quartz has been analyzed to provide structural data to construct the tectonic history of regional geology [35,36,37,38,39,40] and to understand its deformation mechanism [41,42,43,44,45,46,47]. The LPO data of albite or plagioclase have also been extensively studied [48,49,50,51,52,53,54,55,56,57,58,59]. Because quartz and albite crystals do not develop strong LPO in rocks, seismic anisotropy seems to be weakened when seismic waves pass through quartz- and albite-rich rocks [15,60,61]. Their diluting effect on seismic anisotropy must be compared with other phyllosilicate minerals based on their modal composition and LPOs to elucidate the relationship between the observed seismic anisotropy in the crust and the elastic properties of deformed rocks.
The phyllite from the Geumseongri Formation in Gunsan, Korea, has typical greenschist-facies mineral assemblages including muscovite, chlorite, biotite, quartz, and albite. The metamorphic condition and constituent minerals of this phyllite are representative of the middle crust where rocks were plastically deformed and subsequent LPO was formed. Electron backscatter diffraction (EBSD) analysis using fast and high-resolution mapping techniques is necessary because seismic properties should be calculated based on representative LPOs of minerals that reflect the exact volume proportions and deformation structures of natural rock samples. In this paper, we present data on deformation microstructures and LPOs of minerals revealed by EBSD, and the seismic properties of strongly deformed phyllite collected from the Geumseongri Formation in Gunsan, Korea, to understand the deformation mechanism of minerals and the causes of seismic anisotropy in the middle crust of highly deformed tectonic boundaries.

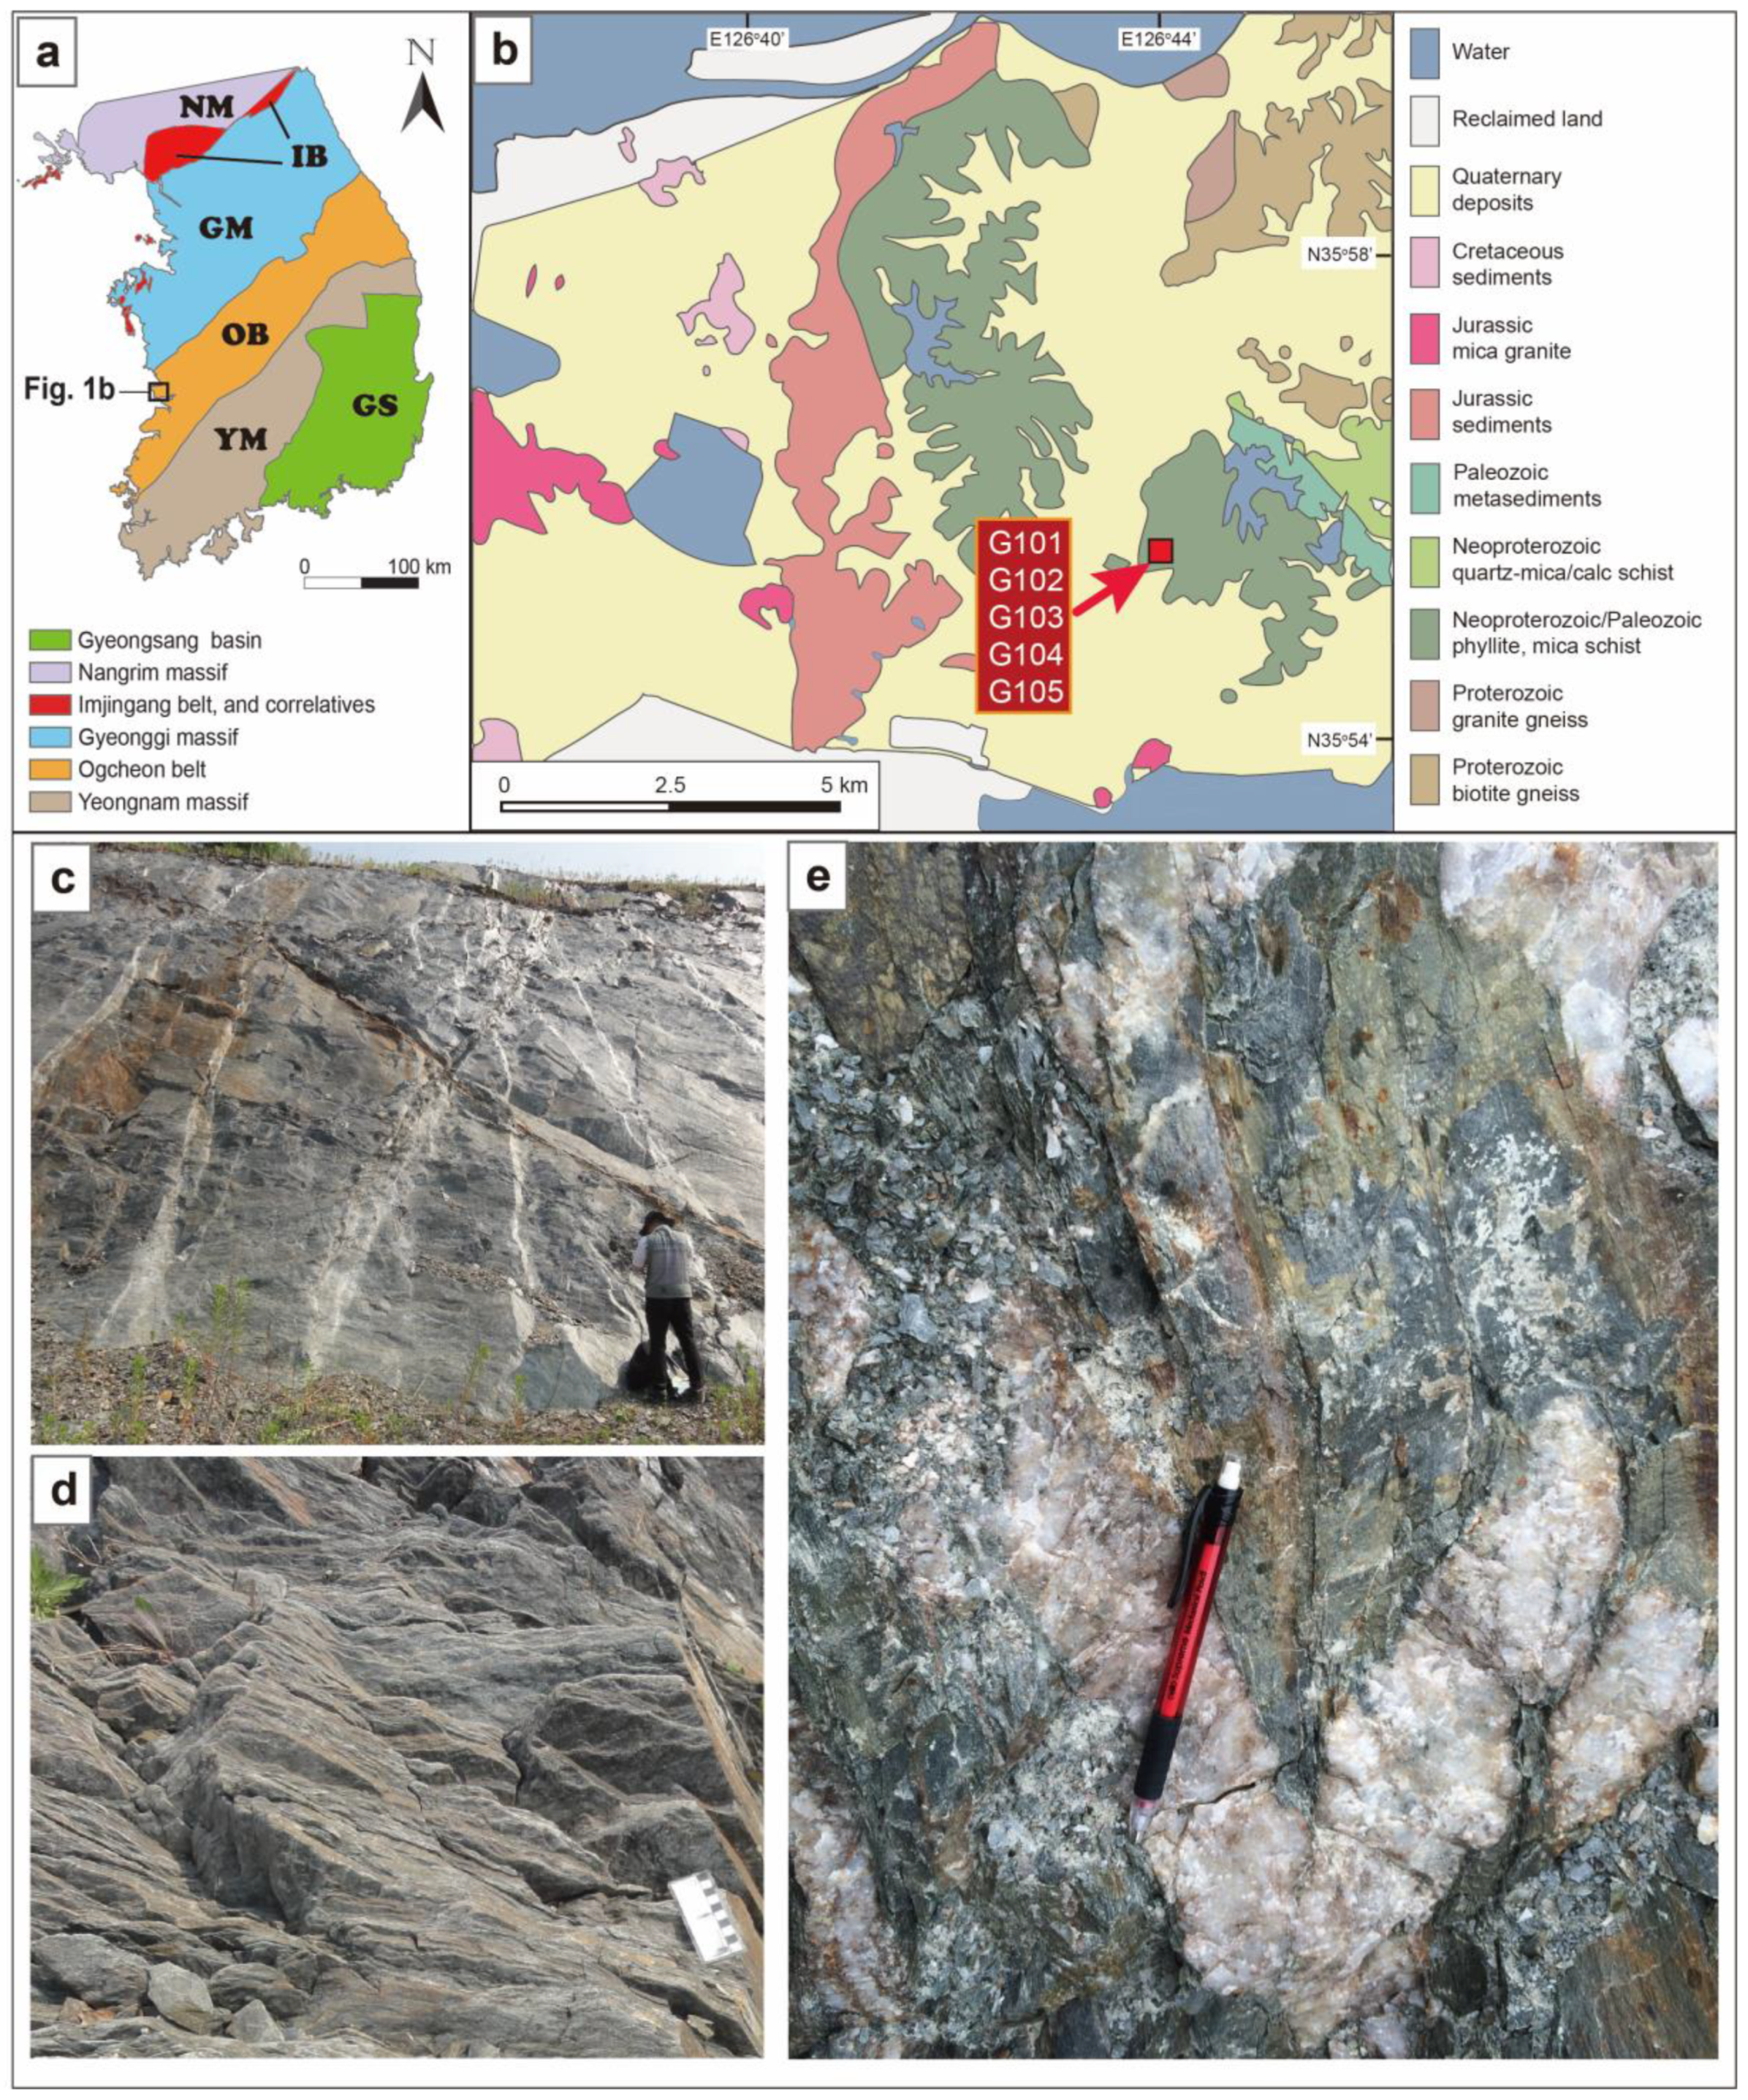
2. Geological Setting and Outcrop Description

The Korean Peninsula is composed of three Precambrian crystalline basements, the Nangrim, Gyeonggi and Yeongnam massifs from north to south (Figure 1a). Regional metamorphism and magmatism occurred around 1.9–1.8 Ga in these Paleoproterozoic massifs [62,63]. Two metamorphic belts, the Imjingang Belt and the Ogcheon Belt, comprising intensely deformed and metamorphosed sedimentary and volcanic rocks, separate these terranes. Permo-Triassic high-grade metamorphism strongly affected the Gyeonggi massif and two metamorphic belts, which have often been considered the possible eastward extension of the Qinling-Dabie-Sulu HP/UHP metamorphic belt in China. However, the Permo-Triassic tectonic model of the Korean Peninsula remains controversial [64,65,66,67,68,69,70,71,72,73]. All terranes were extensively intruded by Mesozoic plutonic rocks.
The Ogcheon Belt consists of Neoproterozoic to Paleozoic sedimentary and volcanic rocks which have been metamorphosed and strongly deformed in the Permian to Triassic. This fold-thrust belt separates the Gyeonggi and Yeongnam massifs, delineating the major tectonic boundary. The Ogcheon Belt is subdivided into two tectonic provinces: non-metamorphosed or slightly deformed early to late Paleozoic Taebaeksan Basin and strongly deformed and metamorphosed Neoproterozoic to Paleozoic Ogcheon Metamorphic Belt [68].
Most petrological and structural studies have focused on the northeastern part of the Ogcheon Metamorphic Belt. Cluzel et al. [64,65] divided the Ogcheon Metamorphic Belt into five main tectonic units bounded by thrusts: Iwharyeong, Poeun, Turungsan, Chungju, and Pibanryeong units. Although there has been some controversy regarding deformation stages and the exact timing of metamorphism, it has been suggested that bimodal volcanisms and sedimentation in the rift setting occurred from the Neoproterozoic [67,74,75,76,77] to late Paleozoic [78,79], followed by the subsequent Permian to Triassic tectonic event that extensively affected the Ogcheon Metamorphic Belt, forming the southeastward stacking of the nappes [64,65,67,72,79,80].
The P-T conditions of metamorphism of the NE Ogcheon Metamorphic Belt have been calculated in the range of 4.2–8.2 kbar and 490–540 °C in the Poeun unit and 5.4–9.4 kbar and 520–630 °C in the Pibanryeong unit based on garnet-biotite geothermometer and garnet-plagioclase-biotite-quartz or muscovite geobarometer [67,84]. A decrease in metamorphic grade towards the southwest along the strike of the Ogcheon Metamorphic Belt was suggested based on the change in the mineral assemblage of the Poeun unit [85]. Another study suggested the lower metamorphic condition of the Poeun unit (3.6–4.4 kbar and 350–450 °C) close to the study area in the SE Ogcheon Metamorphic Belt, based on the mineral assemblage and chemistry of muscovite [72,86].
The studied samples were obtained from the Geumseongri Formation in Gunsan, Korea (Figure 1a,b). There have not been many petrological and structural studies on the southwestern edge of the Ogcheon Metamorphic Belt. The lithologies in the study area consist of Paleoproterozic gneiss, Neoproterozoic to Paleozoic phyllite, schist and metasediments, Jurassic sedimentary rock, and granites (Figure 1b). The depositional age of the Geumseongri Formation is controversial. Two geological maps of adjacent regions [82,83] proposed different depositional ages of the protolith of the Geumseongri Formation as Neoproterozoic and Paleozoic, respectively. The detrital zircon age distribution of the Geumsengri Formation showed the youngest age of 806±19 Ma, which is the maximum age of sedimentation [82]. The ages of metamorphism and deformation in the Geumseongri Formation have not yet been reported.
At the sample location, dark-grey phyllite outcrops with shiny mica-rich foliation are observed (Figure 1c,d). Kink bands and chevron folds are abundant. Folded and boudinaged 10–50 cm thick quartz veins, with some including fragments of phyllite, discordantly cut the phyllite foliation (Figure 1e). The axial planes and fold limbs of quartz veins are typically subparallel to the foliation of phyllite, indicating the contemporary ductile deformation of the quartz vein and phyllite. Outcrop-scale folds and faults affected the strikes of phyllites, which are WSW–ENE to WNW–ESE with varying dips.

3. Methods

Five samples of phyllite were selected from the Geumseongri Formation in Gunsan, Korea. The foliation and lineation of each sample were determined by observing the compositional layering and stretching lineation of muscovite and quartz. For samples showing no clear lineation in the hand specimen, we analyzed grain shapes of digitized lines from elongated minerals on the foliation to ensure that lineation was determined by the orientation of maximum elongation, following the method of Panozzo [87]. Based on the decided foliation and lineation, standard 30 μm thick–thin sections of the XZ plane were made, where X is parallel to the lineation and Z is perpendicular to the foliation of each sample. Thin sections were polished using 1 μm powder and colloidal silica (0.06 μm) to remove surface damage.
The LPOs of the minerals were measured using a scanning electron microscope equipped with an EBSD system. EBSD data were collected using a JEOL JSM-7100F field emission scanning electron microscope (FE-SEM, JEOL, Tokyo, Japan) equipped with a Symmetry detector (Oxford Instruments, Abingdon, UK) installed at the School of Earth and Environmental Sciences, Seoul National University, Korea. The samples were analyzed with an accelerating voltage of 20 kV at a 25.0 mm working distance on a stage tilted 70°. The Kikuchi patterns were automatically obtained and indexed using AZtec software (Version 4.3, Oxford Instrument, Abingdon, UK) with a step size of 5 μm for four samples (Table 1). The step size was determined to be approximately 1/10 of the average diameter of the major minerals forming each sample, which clearly demonstrated the shape of the grains. We analyzed one additional sample with a step size of 0.31 μm to observe the internal microstructures of the deformed grains (Table 1). The rates of zero solutions in raw data ranged from 4.7% to 18.3%, which were usually found along grain boundaries and fractures. We conducted zero solution correction as follows: (1) wild spikes were eliminated first; (2) zero solutions were corrected if each was surrounded by at least six consistent pixels; and (3) wild spikes were eliminated again. By performing minimal correction in (2), EBSD data were conserved, and grain shape was not distorted by correction. To avoid oversampling from large grains, pole figures were plotted from one point per grain using HKL Channel 5. Mean aspect ratios of grains were calculated for quartz and albite composed of more than 10 pixels (60 pixels for G105) (Table 1).
To understand the relationship between the fabric strength of the constituent minerals and seismic anisotropy, the misorientation index (M-index [88]) was calculated for minerals in each sample (Table 2) using the MTEX toolbox for Matlab, version 5.4.0 [89], using one point per grain data. We used the Bootstrap method to estimate the uncertainties of M-index [90]. First, a group of grains was drawn from the original data with replacement. Based on the number of grains in the original data, about 1/6–1/15 of grains (for example, 200 grains for quartz from each sample) were drawn for each group [91]. Second, this process was replicated 1000 times for each mineral. Third, the M-index was calculated for each random group of grains. Finally, with the M-indices of groups, the mean and ±95% confidence intervals were calculated (Table 2) except for G105, which had too few grains.
The seismic velocity and anisotropy of each mineral in the samples were calculated using the single-crystal elastic constant, all LPOs, and crystal density. We used the Voigt–Reuss–Hill averaging scheme and Fortran program created by Mainprice [92]. Single crystal elastic constants were used for quartz [93], plagioclase [94], muscovite [29], and chlorite [28]. Using volume proportions measured by EBSD analysis, the seismic velocity and anisotropy of whole rocks were calculated. To investigate the relationship between the seismic properties of platy minerals, quartz and albite, the P-wave anisotropy (AVp) and the maximum S-wave anisotropy (max. AVs) of muscovite + quartz + albite, chlorite + quartz + albite and muscovite + chlorite + quartz + albite for sample G102 were calculated.

4. Results

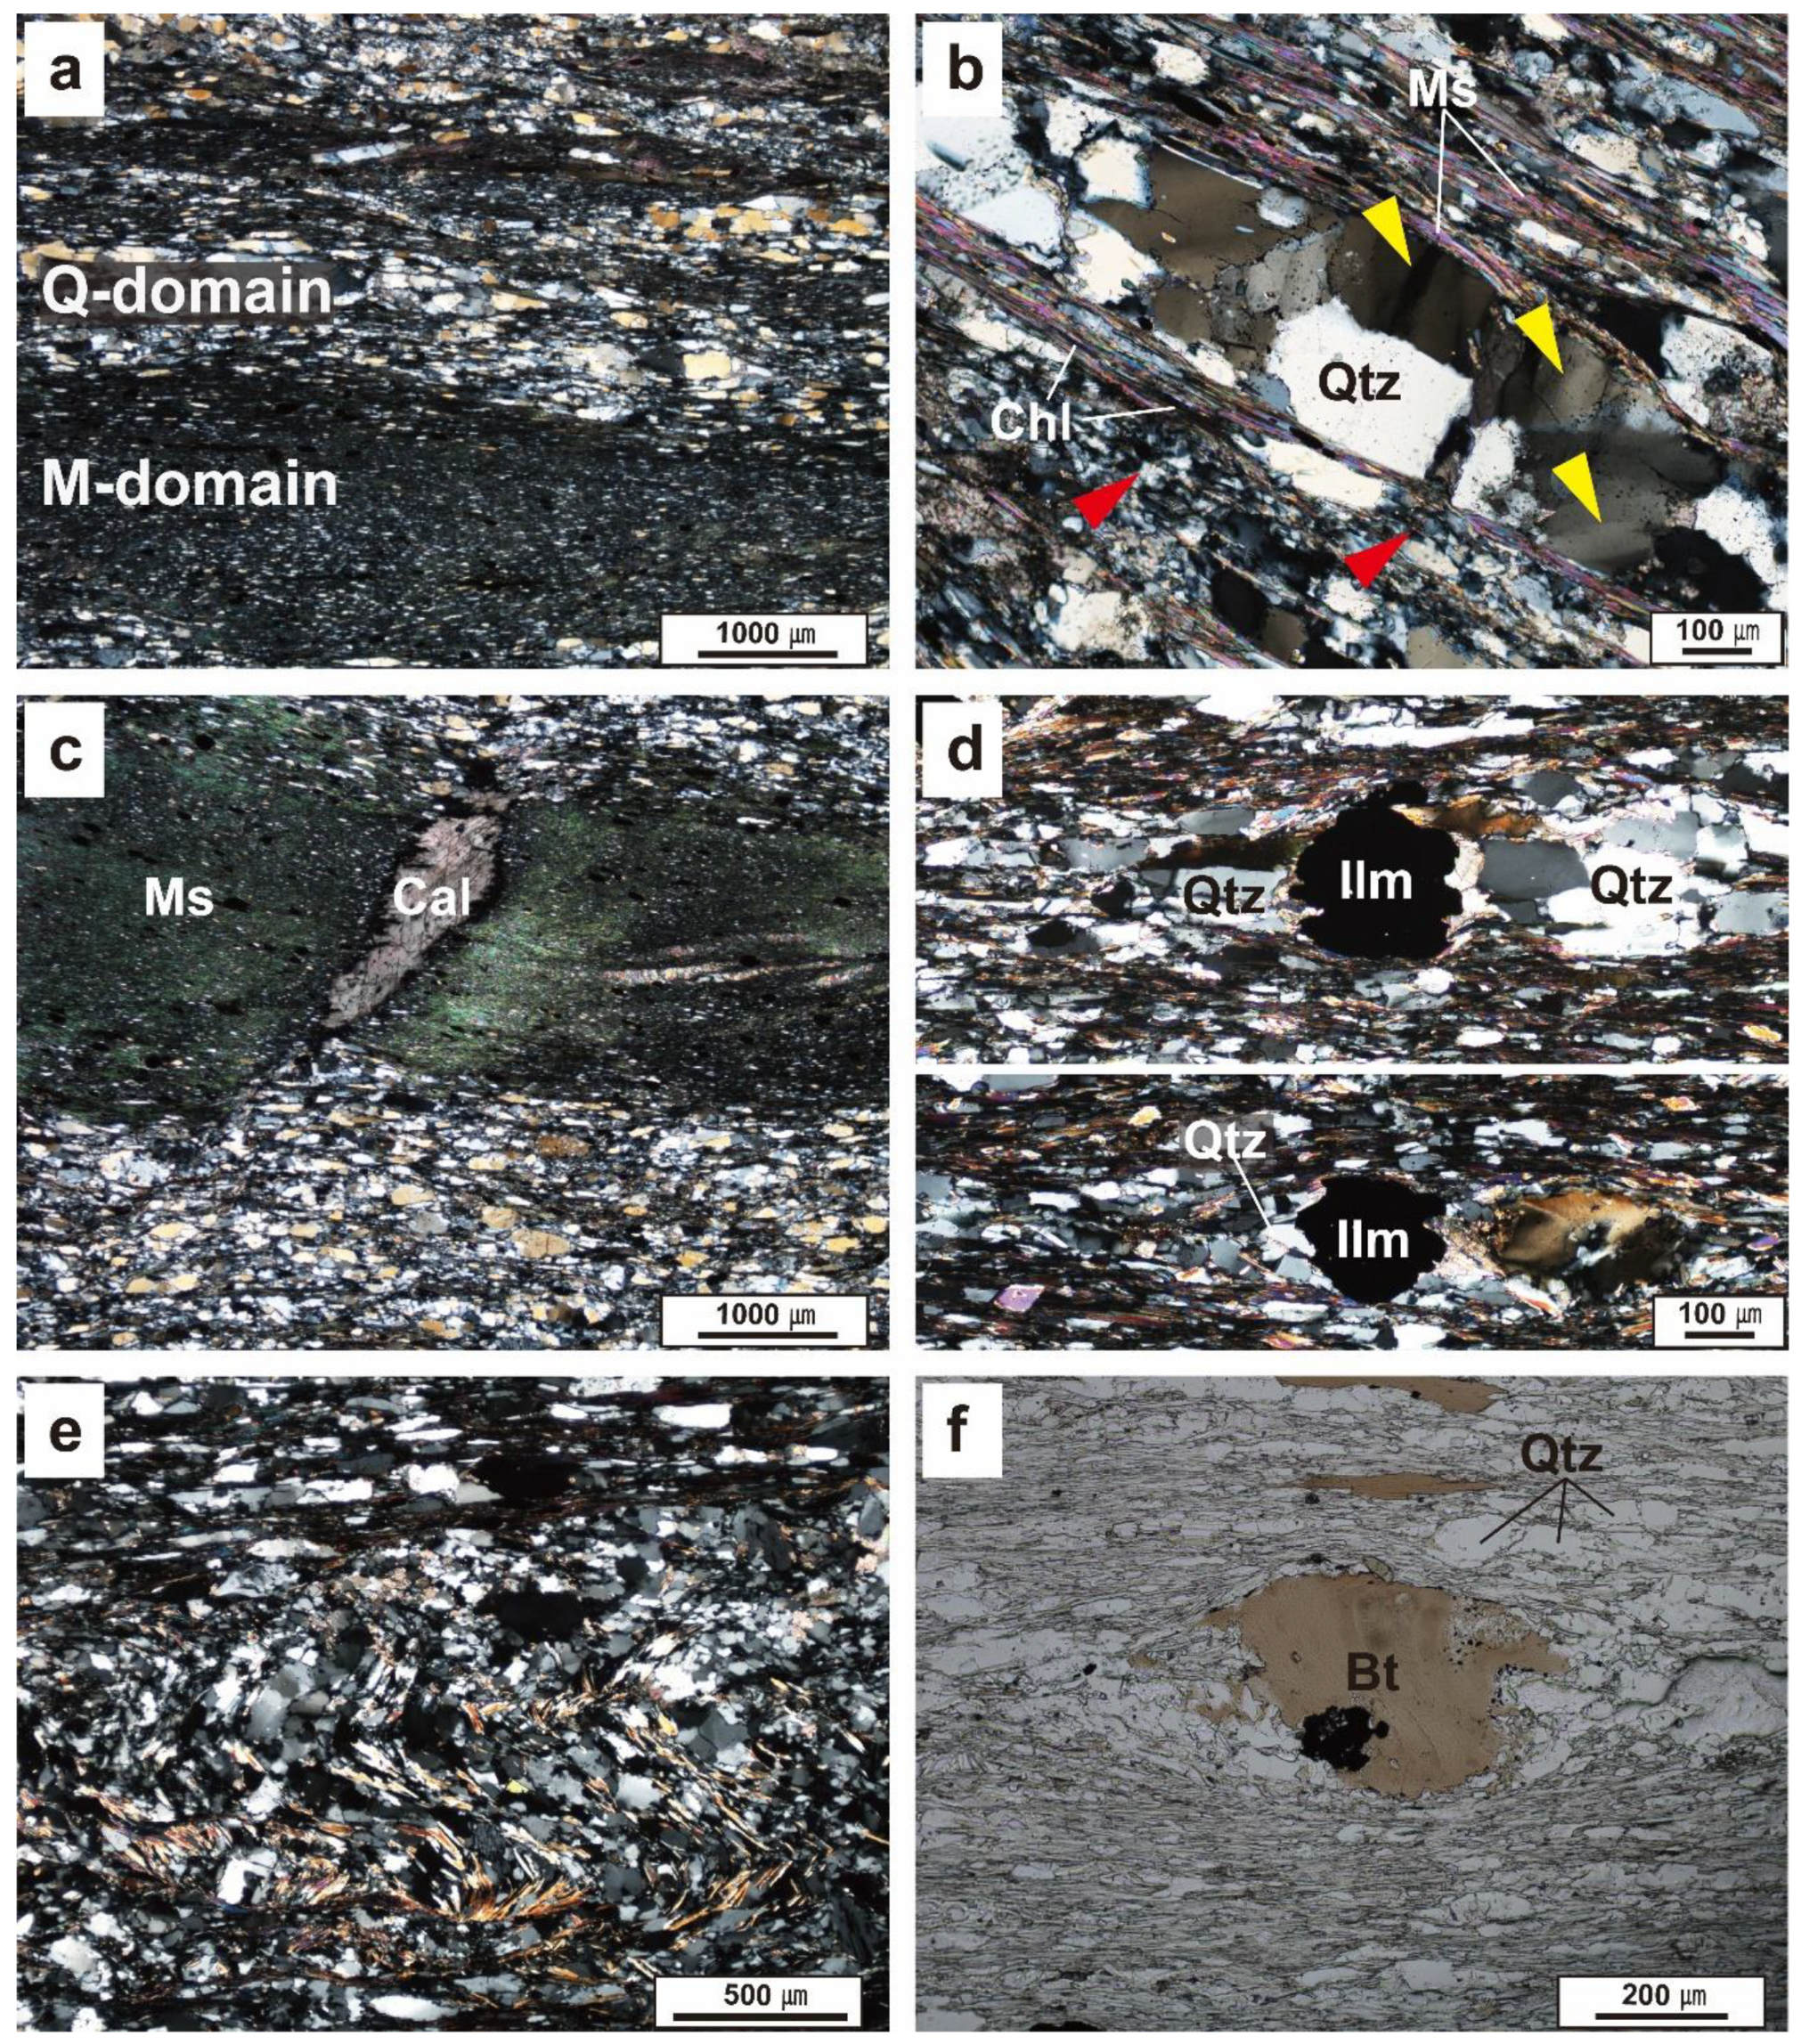
4.1. Sample Description and Microstructures

The phyllite samples are mainly composed of quartz (33–68%), albite (12–23%), muscovite (5–35%), chlorite (6–14%), with minor biotite, calcite, and ilmenite (Table 1). Hand specimens are fine-grained and exhibit shiny mica-rich foliation. All samples were strongly foliated and compositionally layered, showing alternating Q-domain (quartz and albite) and M-domain (muscovite and chlorite) in photomicrographs (Figure 2a). The grain sizes of quartz and albite vary in the range of 0.02 to 0.5 mm, and they have a subangular and elliptical grain shape elongated parallel to the foliation of each sample.
Mica grains usually fill intergranular spaces and/or are strongly aligned parallel to the foliation, forming relatively thick mica bands (Figure 2a,c).The old, relatively large quartz grains exhibit undulose extinction (Figure 2b) and subgrain boundaries indicating intracrystalline deformation, which can be observed in the inverse pole figure map created using a fine step size (Figure 3b and Figure 4a). Quartz grains commonly form ribbons consisting of deformed quartz grains with some recrystallized small grains (Figure 2b).
The pressure shadow of quartz grains around ilmenite porphyroclasts was observed frequently, indicating that the dissolution–precipitation was active (Figure 2d). Small-scale microfolds showing limbs and axial planes parallel to the foliation of the sample are observed, indicating overlapped deformation stages (Figure 2e). Asymmetrically deformed and rotated porphyritic biotite grains are occasionally observed, showing concordant shear direction in each sample (Figure 2f). However, penetrative non-coaxial deformation structures such as S-C fabric are not well developed (Figure 2 and Figure 3). Albite is difficult to distinguish from quartz in an optical microscope with the exception of rare grains exhibiting twinning.

4.2. LPO and Fabric Strength of Minerals

4.2.1. LPO of Muscovite and Chlorite

The LPOs of muscovite and chlorite are shown in Figure 5. In general, [001] axes of both muscovite and chlorite show strong point maxima normal to foliation while (110) poles, [100] axes and (010) poles are aligned in a girdle parallel to the foliation (Figure 5). The fabric strength of each mineral is shown as an M-index in Table 2. The M-index of muscovite was the strongest among minerals, ranging from 0.169 to 0.317, while that of quartz was the weakest. Chlorite also showed a strong fabric strength in the range of M = 0.158–0.293.

4.2.2. LPO of Quartz

The LPOs of quartz are generally weak, with the c-axes aligned around the pole of foliation. In samples G102 and G104, the c-axes are also aligned subnormal to the lineation. The G102 sample shows a typical pattern of quartz LPO forming a crossed girdle. Sample G104 showed some c-axes aligned subparallel to the lineation. The fabric strength of quartz is weak in the range of M = 0.033–0.090 (Table 2). No significant difference was observed in the M-index of quartz among the samples, excluding sample G105. Note that the LPO and fabric strength of quartz from sample G105 was overestimated because the number of analyzed grains was too small.

4.2.3. LPO of Albite

The most common pattern of albite LPOs was characterized by the (001) pole aligned subnormal to the foliation (samples G101, G102, G103, and G104). In two samples (G102, G104), (001) poles are also partly aligned subparallel to lineation (X), forming two conjugate maxima in the XZ plane. One sample (G103) showed the (001) pole aligned subparallel to the lineation. Two samples (G101 and G104) showed that the (010) poles strongly aligned subnormal to the foliation. The fabric strength of albite is in the range of M = 0.063–0.082, and it is weaker than other minerals, excluding that in sample G105 (Table 2). Note that the LPO and fabric strength of albite from sample G105 were overestimated because too few grains were analyzed. In Figure S1, additional LPOs of the albite axes measured in this study are displayed as pole figures. The <001> axes of two samples (G102 and G104) and the <100> axis of one sample (G101) were aligned subparallel to the lineation (Figure S1).

4.3. Seismic Anisotropies of Phyllite Samples

The seismic properties of muscovite, chlorite, quartz, albite, and whole rocks are shown in Figure 6, Figure 7, Figure 8, Figure 9 and Figure 10 and Table 3. The seismic anisotropies of the P-wave (AVp) were in the range of 43.4–51.1% for muscovite, 21.4–29.4% for chlorite, 2.8–7.1% for quartz, and 1.2–15.6% for albite. The maximum anisotropy of the S-wave (max. AVs) was in the range of 41.9–59.1% for muscovite, 34.9–56.8% for chlorite, 3.5–9.8% for quartz, and 1.3–24.8% for albite. Muscovite showed the strongest P- and S-wave anisotropy while albite showed the weakest P- and S-waves anisotropy. The abnormally high AVp and maximum AVs of albite in sample G105 resulted from the exaggerated LPO data due to the limited number of albite grains analyzed. Therefore, the realistic AVp and maximum AVs for albite in this study are in the ranges of 1.2–2.1% and 1.3–1.7%, respectively. Integrating all seismic anisotropies of minerals based on the modal composition of each sample, the calculated AVp and maximum AVs of whole rocks were 9.0–21.7% and 9.6–24.2%, respectively. The patterns of contours and the polarization direction of the fast S-wave of whole rocks were quite similar to those of muscovite and chlorite, except for sample G105, which has ~80% quartz and albite (Figure 10).
To understand the relationship between various mineral assemblages in phyllite and seismic anisotropies, the AVp and maximum AVs of sample G102 were calculated based on different groups of minerals (Figure 11). The calculated results showed that the anisotropies of the P-wave were 18.9% for muscovite + chlorite + quartz + albite (Figure 11a), 17.7% for muscovite + quartz + albite (Figure 11b), and 6.2% for chlorite + quartz + albite (Figure 11c). The maximum anisotropies of the S-wave were 8.2% for chlorite + quartz + albite, 16.5% for muscovite + quartz + albite, and 19.7% for muscovite + chlorite + quartz + albite. The results also elucidated the constructive role of coexisting muscovite and chlorite on seismic anisotropy.

5. Discussion

5.1. LPO Development of Minerals

The [001] axes of both muscovite and chlorite show strong point maxima normal to foliation while (110) poles, [100] axes and (010) poles are aligned in a girdle parallel to the foliation (Figure 5). The LPOs of muscovite and chlorite in this study are well known fabric patterns of phyllosilicates reported from naturally [34,95,96,97,98,99,100] and experimentally deformed rocks [101]. The platy shape of muscovite and chlorite is a primary factor in the rotation of these minerals parallel to foliation during deformation [102]. Recrystallization has also been suggested as the main deformation mechanism of muscovite [34]. The strong alignment of the muscovite [001] axis in this study is interpreted as the easy glide on the (001) planes [95,97,99,103]. Experimental studies have reported <100>(001) and <110>(001) slip systems of muscovite [103]. Muscovite bands in M-domains clearly showed undulose extinction of muscovite and chlorite (Figure 3a and Figure 4a) indicating the operation of dislocation creep in muscovite and chlorite. Therefore, it is suggested that strong LPOs of muscovite and chlorite were formed due to dislocation creep on the basal plane and crystal rotation parallel to the foliation.
The LPO of quartz depends on many factors, including the deformation mechanism, active slip system, strain rate, temperature, kinematic framework, and water contents [38,42,43]. However, in naturally deformed samples, it is very difficult to measure the strain rate of samples in thin sections.
Therefore, we focused on the role of temperature in this study. Folds of quartz veins in the outcrop (Figure 1e) and prevalent subgrain boundaries of quartz (Figure 3b and Figure 4b) indicate that the deformation temperature was high enough for the ductile deformation of quartz. In the quartz LPO data, one of the main features observed was the c-axes maximum at a small angle to the direction normal to the foliation (Figure 5). It is correlated to the basal<a> slip system, which is active under relatively low temperature conditions [38,102]. In sample G102, the cross girdle of the quartz c-axis indicates multiple slip systems activated including basal<a>, rhomb<a>, and prism<a>. An early study of naturally deformed quartz reported that an abrupt change from these multiple slip systems to a single slip system (prism<a>) occurs at approximately 500 °C, which was observed in metasedimentary rocks with similar mineral assemblages to those of our phyllites in the Tonale fault zone [37]. This is also supported by the observation of subangular albite grains with rare intracrystalline deformation structures in this study (Figure 3a and Figure 4a), indicating that albite was mainly deformed in brittle manner. In addition, the mineral assemblage of phyllites seems to correspond to the Poeun unit in the area of the decreased metamorphic condition [85,86], which might indicate a lower metamorphic grade than the NE Ogcheon Metamorphic Belt [84]. Therefore, it is suggested that the deformation temperature of phyllite was below 490–540 °C and possibly in the range of 350–450 °C [86]. This argument reflects our finding of the suggested maximum deformation temperature (about 500 °C) of quartz based on the measured LPO. Additional petrological analysis should be performed to confirm the exact metamorphic conditions and deformation temperature of the phyllite.
In sample G104, some quartz c-axes are aligned subparallel to the lineation, which might indicate the increased prism<c> slip. However, we did not observe any evidence of high-temperature deformation of quartz, such as grain boundary migration recrystallization, chessboard extinction pattern, or pinning structure. Several studies have reported that water can change the relative activity of different slip systems [41,104], and decreasing the strain rate can increase the activity of prism<c> slip [38,41]. Anisotropic growth promoted by dissolution–precipitation creep could affect the quartz c-axes aligned subparallel to the lineation [105,106]. In this study, pressure shadows of quartz around ilmenite porphyroclasts were frequently observed (Figure 3d), indicating the dissolution–precipitation process of quartz. We suggest that the main deformation mechanism of quartz is represented by dislocation creep on the basal<a>, prism<a>, and rhomb<a> slip system, and some alignment of quartz c-axes subparallel to the lineation might have been affected by the dissolution–precipitation creep where the fluid was abundant.
Notably, the LPO of plagioclase in this study showed that the (010) and (001) poles simultaneously showed maxima subnormal to the foliation (Figure 5), which has been documented independently from the study of magmatic processes on anorthosite [51] and the deformation mechanism of amphibolite and mafic schist [52]. In the case of anorthosite, the LPO of plagioclase was interpreted as the interchange between the poles of (010) and (001) of rod-shaped prismatic plagioclase crystals in melt flow [51]. The LPO of plagioclase in the amphibolite and mafic schist was explained by changes in dislocation slip systems influenced by strain and temperature [52]. Our albite LPO data may indicate that multiple slip planes of dislocation glide have been activated. The LPO of albite (G104) indicates an activation of the (010)[001] slip system, which has been reported as the dominant slip system in plagioclase (Figure 5 and Figure S1; [57,58,59]). However, the phyllites in this study are thought to have been deformed in greenschist facies where the temperature is lower than 500 °C. Subangular albite grains (Figure 3a and Figure 4a) and a relatively small number of internal structures such as subgrain boundaries (Figure 4a) indicate that crystal plastic deformation was only a minor component. In addition, the low symmetries of feldspar and the large unit cell may make it difficult to have multiple activated slip systems particularly in low temperature conditions [54,107]. The suitable interpretation in this study is based on the physical properties of albite with two good (001) and (010) cleavage planes [107]. These planes formed via brittle deformation can be related to the shape preferred orientation (SPO) of albite with a mean aspect ratio of about two in this study (Table 1). Fracturing has been pointed out as the active deformation mechanism of plagioclase even at high temperatures [53,57,59,107,108]. Particularly, the LPO of albite in two samples (G102 and G104) showed their (001) poles (and partly, (010) poles) aligned subnormal to the foliation and (001) poles aligned subparallel to the lineation, indicating interchange of two poles during rotation of albite grains. Therefore, it is suggested that the predominant deformation mechanism of albite in the samples is represented by rigid body rotation with alignment of (010) and (001) cleavage planes parallel to the foliation, combined with a minor dislocation creep with a (010)[001] slip system. This interpretation is concordant with the quartz LPO showing multiple slip systems that are active at relatively low temperature conditions below 500 °C [37,102]. It is also possible that anisotropic growth by dissolution–precipitation creep might have affected the LPO of albite [53,105].

5.2. Implications for Seismic Anisotropy in Continental Crust

Because the mineral assemblages of the phyllite samples analyzed in this study correspond to typical greenschist-facies minerals of a pelitic protolith (biotite zone [67]), it is suggested that the calculated seismic properties reflect a part of the observed seismic anisotropies in the highly deformed middle crustal zone. Tectonic processes during compressive or extensional regimes in the middle and lower crust result in ductilely deformed planar structures aligned subnormal to compressive or extensional stress, inducing strong seismic anisotropies when the rocks are rich in mica and/or amphibole [5,18,20,22,60,109]. It is particularly important below the depth of microcrack closure (approximately 200–250 MPa [15,16,18]), where the plastically deformed shear fabrics and aligned minerals play an important role in controlling the seismic properties.
If the seismic waves pass through the strongly foliated phyllites rich in muscovite, the maximum P-wave velocity (Vp) would be observed where the seismic wave propagated subparallel to the foliation, according to the results of this study (Figure 10). In particular, the maximum Vp was observed in the direction subparallel to lineation. The S-wave anisotropy (AVs) of the samples were also dramatically high in the direction subparallel to the foliation (Figure 10). These seismic patterns are closely related to the hexagonal symmetry with the slow symmetry axis of phyllosilicates [19]. The overall results, including very high AVp and maximum AVs measured from phyllites (Table 3), imply that phyllosilicate-rich deformed rocks comprising fold-thrust belts in continental collision belts, subduction zones or strike-slip shear zones may significantly affect the observed crustal seismic anisotropies parallel to the tectonic boundaries [4,9,11,12,13,109,110] where the foliation of rocks is steeply aligned owing to tectonic processes.
The fabric strength of rock-forming minerals has been suggested as an important factor for controlling seismic anisotropies in nature [22,97,111,112]. Figure 12 shows the relationship between the seismic anisotropy of whole rock samples, volume proportion and fabric strength of muscovite and chlorite. The general trend of seismic anisotropy shows that AVp and maximum AVs increase with increasing muscovite and chlorite proportions (Figure 12a,b). However, the volume proportion of phyllosilicates is not the sole factor controlling the magnitudes of seismic anisotropy in this study. The proportion of Ms + Chl in G102 was larger than that in G104. However, the seismic anisotropy of G102 is similar to that of G104 because of the stronger fabric of G104. The role of fabric strength was also clarified when the seismic anisotropies of G102 were compared with G101, yielding an increase of approximately 14% and 22% for AVp and maximum AVs, respectively, owing to fabric strength. These results show that the fabric strength of muscovite and chlorite, as well as their proportion can affect the seismic properties of phyllite.
Additional seismic properties were calculated to understand the role of the coexistence of muscovite and chlorite (Figure 11). Whole rock seismic anisotropies of sample G102 with the assemblages of Qtz + Ab + Ms + Chl, Qtz + Ab + Ms, and Qtz + Ab + Chl were calculated. The calculated data showed that both AVp and maximum AVs increased with increasing proportion of muscovite and chlorite (Figure 11a). The strongest anisotropy was calculated in the assemblage of Qtz + Ab + Ms + Chl, indicating the constructive role of muscovite and chlorite.
This contribution to the whole rock seismic anisotropies is due to their similar seismic patterns. Both minerals showed the maximum and minimum Vp and AVs passing in the subparallel and subnormal directions to the foliation, respectively (Figure 6 and Figure 7). The coincident seismic patterns related to their [001] axes were aligned subnormal to the foliation (Figure 5) and induced a constructive effect on the whole rock seismic anisotropy (Figure 10 and Figure 11). This pattern can be applied to rocks including other phyllosilicate minerals such as serpentine, biotite, phengite, and talc, which have their [001] axes subnormal to the foliation and similar seismic properties [20,22,95,97,99,100,113].

6. Conclusions

The deformation microstructures and seismic anisotropies of greenschist-facies phyllites from the Geumseongri Formation in Gunsan, Korea, were studied to understand the relationship between LPOs, deformation conditions, mineral assemblages, and seismic patterns of deformed rocks in the middle crust. EBSD map data combined with observations of deformation microstructures revealed that the dominant deformation mechanism of quartz was dislocation creep with multiple slip systems and a minor dissolution–precipitation creep. It is also suggested that albite was mainly deformed by rigid body rotation, combined with a minor dislocation creep. The LPOs of muscovite and chlorite were formed by dislocation creep and crystal rotation parallel to the foliation. Based on our results and previous literature, we suggest that the phyllites in this study were deformed under typical greenschist-facies conditions.
Calculated seismic anisotropies based on the LPOs and volume proportions of constituent minerals indicated that muscovite and chlorite in phyllites play a significant role in controlling the seismic pattern and magnitude of seismic anisotropy. The whole rock seismic properties showed typical hexagonal symmetry with slow-axis symmetry. It was also revealed that fabric strength is a primary factor controlling the strength of seismic anisotropy, especially for muscovite and chlorite in phyllites. The increase in fabric strength of muscovite and chlorite induced significant increase of seismic anisotropy in this study. The calculation of seismic anisotropy based on various mineral assemblages showed that the coexistence of muscovite and chlorite contributes to seismic anisotropy constructively when their [001] axes are aligned in the same direction. Finally, it is suggested that the strong LPOs of muscovite and chlorites in phyllosilicates in greenschist-facies rocks play an important role in inducing large seismic anisotropy observed in crustal tectonic boundaries such as the continental collision zone or strike-slip shear zone.

Supplementary Materials

The following are available online at https://www.mdpi.com/2075-163X/11/3/294/s1, Figure S1: Pole figures of the albite axes presented in the lower hemisphere using equal-area projection.

Author Contributions

Conceptualization, H.J.; methodology, S.H. and H.J.; software, S.H.; validation, S.H. and H.J.; formal analysis, S.H.; investigation, S.H.; resources, H.J.; data curation, S.H.; writing—original draft preparation, S.H.; writing—review and editing, S.H. and H.J.; visualization, S.H.; supervision, H.J.; project administration, H.J.; funding acquisition, H.J. All authors have read and agreed to the published version of the manuscript.

Funding

This research was funded by the Korea Meteorological Administration Research Development Program (KMI2019-00110) to H.J.

Institutional Review Board Statement

Not applicable.

Informed Consent Statement

Not applicable.

Data Availability Statement

Not applicable.

Acknowledgments

The authors are grateful to the anonymous reviewers whose suggestions and comments have notably improved the manuscript.

Conflicts of Interest

The authors declare no conflict of interest.

References

  1. Kern, H.; Wenk, H.R. Fabric-related velocity anisotropy and shear wave splitting in rocks from the Santa Rosa mylonite zone, California. J. Geophys. Res. 1990, 95. [Google Scholar] [CrossRef]
  2. Mainprice, D.; Ildefonse, B. Seismic Anisotropy of Subduction Zone Minerals–Contribution of Hydrous Phases. In Subduction Zone Geodynamics; Lallemand, S., Funiciello, F., Eds.; Springer: Berlin/Heidelberg, Germany, 2009; pp. 63–84. [Google Scholar]
  3. Ozacar, A.A.; Zandt, G. Crustal structure and seismic anisotropy near the San Andreas Fault at Parkfield, California. Geophys. J. Int. 2009, 178, 1098–1104. [Google Scholar] [CrossRef] [Green Version]
  4. Bonnin, M.; Barruol, G.; Bokelmann, G.H.R. Upper mantle deformation beneath the North American–Pacific plate boundary in California from SKS splitting. J. Geophys. Res. 2010, 115, 1–17. [Google Scholar] [CrossRef] [Green Version]
  5. Lloyd, G.E.; Butler, R.W.H.; Casey, M.; Tatham, D.J.; Mainprice, D. Constraints on the seismic properties of the middle and lower continental crust. In Deformation Mechanisms, Rheology and Tectonics: Microstructures, Mechanics and Anisotropy; Prior, D.J., Rutter, E.H., Tatham, D.J., Eds.; Geological Society: London, UK, 2011; Volume 360, pp. 7–32. [Google Scholar]
  6. Long, M.D.; Silver, P.G. Shear wave splitting and mantle anisotropy: Measurements, interpretations, and new directions. Surv. Geophys. 2009, 30, 407–461. [Google Scholar] [CrossRef] [Green Version]
  7. Long, M.D.; Wirth, E.A. Mantle flow in subduction systems: The mantle wedge flow field and implications for wedge processes. J. Geophys. Res. Solid Earth 2013, 118, 583–606. [Google Scholar] [CrossRef]
  8. Castellanos, J.; Perry-Houts, J.; Clayton, R.; Kim, Y.; Stanciu, A.C.; Niday, B.; Humphreys, E. Seismic anisotropy reveals crustal flow driven by mantle vertical loading in the Pacific NW. Sci. Adv. 2020, 6, eabb0476. [Google Scholar] [CrossRef] [PubMed]
  9. Ozacar, A.A.; Zandt, G. Crustal seismic anisotropy in central Tibet: Implications for deformational style and flow in the crust. Geophys. Res. Lett. 2004, 31, 1–4. [Google Scholar] [CrossRef] [Green Version]
  10. Kong, F.; Wu, J.; Liu, K.H.; Gao, S.S. Crustal anisotropy and ductile flow beneath the eastern Tibetan Plateau and adjacent areas. Earth Planet. Sci. Lett. 2016, 442, 72–79. [Google Scholar] [CrossRef] [Green Version]
  11. Agius, M.R.; Lebedev, S. Complex, multilayered azimuthal anisotropy beneath Tibet: Evidence for co-existing channel flow and pure-shear crustal thickening. Geophys. J. Int. 2017, 210, 1823–1844. [Google Scholar] [CrossRef] [Green Version]
  12. Brocher, T.M.; Christensen, N.I. Seismic anisotropy due to preferred mineral orientation observed in shallow crustal rocks in southern Alaska. Geology 1990, 18, 737–740. [Google Scholar] [CrossRef]
  13. Huang, Z.; Zhao, D.; Wang, L. Shear wave anisotropy in the crust, mantle wedge, and subducting Pacific slab under northeast Japan. Geochem. Geophys. Geosyst. 2011, 12, 1–17. [Google Scholar] [CrossRef]
  14. Crampin, S. Geological and industrial implications of extensive-dilatancy anisotropy. Nature 1987, 328, 491–496. [Google Scholar] [CrossRef]
  15. Ji, S.; Shao, T.; Michibayashi, K.; Long, C.; Wang, Q.; Kondo, Y.; Zhao, W.; Wang, H.; Salisbury, M.H. A new calibration of seismic velocities, anisotropy, fabrics, and elastic moduli of amphibole-rich rocks. J. Geophys. Res. Solid Earth 2013, 118, 4699–4728. [Google Scholar] [CrossRef]
  16. Hefny, M.; Zappone, A.; Makhloufi, Y.; de Haller, A.; Moscariello, A. A laboratory approach for the calibration of seismic data in the western part of the Swiss Molasse Basin: The case history of well Humilly-2 (France) in the Geneva area. Swiss J. Geosci. 2020, 113, 1–30. [Google Scholar] [CrossRef]
  17. Almqvist, B.S.G.; Mainprice, D. Seismic properties and anisotropy of the continental crust: Predictions based on mineral texture and rock microstructure. Rev. Geophys. 2017, 55, 367–433. [Google Scholar] [CrossRef] [Green Version]
  18. Bianchi, I.; Bokelmann, G. Probing crustal anisotropy by receiver functions at the deep continental drilling site KTB in Southern Germany. Geophys. Prospect. 2019, 67, 2450–2464. [Google Scholar] [CrossRef]
  19. Brownlee, S.J.; Schulte-Pelkum, V.; Raju, A.; Mahan, K.; Condit, C.; Orlandini, O.F. Characteristics of deep crustal seismic anisotropy from a compilation of rock elasticity tensors and their expression in receiver functions. Tectonics 2017, 36, 1835–1857. [Google Scholar] [CrossRef] [Green Version]
  20. Lloyd, G.E.; Butler, R.W.H.; Casey, M.; Mainprice, D. Mica, deformation fabrics and the seismic properties of the continental crust. Earth Planet. Sci. Lett. 2009, 288, 320–328. [Google Scholar] [CrossRef]
  21. Brownlee, S.J.; Hacker, B.R.; Salisbury, M.; Seward, G.; Little, T.A.; Baldwin, S.L.; Abers, G.A. Predicted velocity and density structure of the exhuming Papua New Guinea ultrahigh-pressure terrane. J. Geophys. Res. 2011, 116, B08206. [Google Scholar] [CrossRef]
  22. Ji, S.; Shao, T.; Michibayashi, K.; Oya, S.; Satsukawa, T.; Wang, Q.; Zhao, W.; Salisbury, M.H. Magnitude and symmetry of seismic anisotropy in mica- and amphibole-bearing metamorphic rocks and implications for tectonic interpretation of seismic data from the southeast Tibetan Plateau. J. Geophys. Res. Solid Earth 2016, 3782–3803. [Google Scholar] [CrossRef] [Green Version]
  23. Wenk, H.R.; Vasin, R.N.; Kern, H.; Matthies, S.; Vogel, S.C.; Ivankina, T.I. Revisiting elastic anisotropy of biotite gneiss from the Outokumpu scientific drill hole based on new texture measurements and texture-based velocity calculations. Tectonophysics 2012, 570–571, 123–134. [Google Scholar] [CrossRef]
  24. Kim, J.; Jung, H. New Crystal Preferred Orientation of Amphibole Experimentally Found in Simple Shear. Geophys. Res. Lett. 2019, 46, 1–10. [Google Scholar] [CrossRef] [Green Version]
  25. Ko, B.; Jung, H. Crystal preferred orientation of an amphibole experimentally deformed by simple shear. Nat. Commun. 2015, 6, 6586. [Google Scholar] [CrossRef] [Green Version]
  26. Jung, H. Crystal preferred orientations of olivine, orthopyroxene, serpentine, chlorite, and amphibole, and implications for seismic anisotropy in subduction zones: A review. Geosci. J. 2017, 21, 985–1011. [Google Scholar] [CrossRef]
  27. Brown, J.M.; Abramson, E.H. Elasticity of calcium and calcium-sodium amphiboles. Phys. Earth Planet. Inter. 2016, 261, 161–171. [Google Scholar] [CrossRef]
  28. Alexandrov, K.S.; Ryzhova, T.V. The Elastic Properties of Rock-Forming Minerals. II: Layered Silicates; Geophysics Series; Bulletin USSR Academy of Science: Moscow, Russia, 1961; Volume 9. [Google Scholar]
  29. Vaughan, M.T.; Guggenheim, S. Elasticity of Muscovite and Its Relationship to Crystal Structure. J. Geophys. Res. 1986, 91, 4657–4664. [Google Scholar] [CrossRef]
  30. Weiss, T.; Siegesmund, S.; Rabbel, W.; Bohlen, T.; Pohl, M. Seismic velocities and anisotropy of the lower continental crust: A review. Pure Appl. Geophys. 1999, 156, 97–122. [Google Scholar] [CrossRef]
  31. Shapiro, N.M.; Ritzwoller, M.H.; Molnar, P.; Levin, V. Thinning and flow of Tibetan crust constrained by seismic anisotropy. Science 2004, 305, 233–236. [Google Scholar] [CrossRef] [Green Version]
  32. Mahan, K. Retrograde mica in deep crustal granulites: Implications for crustal seismic anisotropy. Geophys. Res. Lett. 2006, 33, 1–6. [Google Scholar] [CrossRef]
  33. Meissner, R.; Rabbel, W.; Kern, H. Seismic lamination and anisotropy of the lower continental crust. Tectonophysics 2006, 416, 81–99. [Google Scholar] [CrossRef]
  34. Wenk, H.R.; Yu, R.; Cárdenes, V.; Lopez-Sanchez, M.A.; Sintubin, M. Fabric and anisotropy of slates: From classical studies to new results. J. Struct. Geol. 2020, 138. [Google Scholar] [CrossRef]
  35. Law, R.D. Crystallographic fabrics: A selective review of their applications to research in structural geology. In Deformation Mechanisms, Rheology and Tectonics; Knipe, R.J., Rutter, E.H., Eds.; Geological Society Special Publication: London, UK, 1990; Volume 54, pp. 335–352. [Google Scholar]
  36. Little, T.A.; Hacker, B.R. Microstructures and quartz lattice-preferred orientations in the eclogite-bearing migmatitic gneisses of the D’Entrecasteaux Islands, Papua New Guinea. Geochem. Geophys. Geosyst. 2013, 14, 2030–2062. [Google Scholar] [CrossRef] [Green Version]
  37. Stipp, M.; Stünitz, H.; Heilbronner, R.; Schmid, S.M. The eastern Tonale fault zone: A “natural laboratory” for crystal plastic deformation of quartz over a temperature range from 250 to 700 °C. J. Struct. Geol. 2002, 24, 1861–1884. [Google Scholar] [CrossRef]
  38. Law, R.D. Deformation thermometry based on quartz c-axis fabrics and recrystallization microstructures: A review. J. Struct. Geol. 2014, 66, 129–161. [Google Scholar] [CrossRef]
  39. Cross, A.J.; Kidder, S.; Prior, D.J. Using microstructures and TitaniQ thermobarometry of quartz sheared around garnet porphyroclasts to evaluate microstructural evolution and constrain an Alpine Fault Zone geotherm. J. Struct. Geol. 2015, 75, 17–31. [Google Scholar] [CrossRef]
  40. Savignano, E.; Reddy, S.M.; Bridges, J.; Mazzoli, S. Quartz fabric variations across the greenschist facies shear zone separating the zermatt-saas and combin ophiolitic zones, upper val gressoney, western alps. Ofioliti 2016, 41, 85–98. [Google Scholar] [CrossRef]
  41. Tullis, J.; Christie, J.M.; Griggs, D.T. Microstructures and preferred orientations of experimentally deformed quartzites. In Bulletin of the Geological Society of America; Geological Society of America: Boulder, CO, USA, 1973; Volume 84, pp. 297–314. [Google Scholar]
  42. Lister, G.S.; Hobbs, B.E. The simulation of fabric development during plastic deformation and its application to quartzite: The influence of deformation history. J. Struct. Geol. 1980, 2, 355–370. [Google Scholar] [CrossRef]
  43. Schmid, S.M.; Casey, M. Complete fabric analysis of some commonly observed quartz C-axis patterns. Geophys. Monogr. 1986, 36, 263–286. [Google Scholar] [CrossRef]
  44. Hirth, G.; Tullis, J. Dislocation creep regimes in quartz aggregates. J. Struct. Geol. 1992, 14, 145–159. [Google Scholar] [CrossRef]
  45. Heilbronner, R.; Tullis, J. Evolution of c axis pole figures and grain size during dynamic recrystallization: Results from experimentally sheared quartzite. J. Geophys. Res. 2006, 111, 1–19. [Google Scholar] [CrossRef]
  46. Faleiros, F.M.; Moraes, R.; Pavan, M.; Campanha, G.A.C. A new empirical calibration of the quartz c-axis fabric opening-angle deformation thermometer. Tectonophysics 2016, 671, 173–182. [Google Scholar] [CrossRef]
  47. Tokle, L.; Hirth, G.; Behr, W.M. Flow laws and fabric transitions in wet quartzite. Earth Planet. Sci. Lett. 2019, 505, 152–161. [Google Scholar] [CrossRef]
  48. Wenk, H.R.; Bunge, H.J.; Jansen, E.; Pannetier, J. Preferred orientation of plagioclase-neutron diffraction and U-stage data. Tectonophysics 1986, 126, 271–284. [Google Scholar] [CrossRef]
  49. Prior, D.J.; Wheeler, J. Feldspar fabrics in a greenschist facies albite-rich mylonite from electron backscatter diffraction. Tectonophysics 1999, 303, 29–49. [Google Scholar] [CrossRef]
  50. Jiang, Z.; Prior, D.J.; Wheeler, J. Albite crystallographic preferred orientation and grain misorientation distribution in a low-grade mylonite: Implications for granular flow. J. Struct. Geol. 2000, 22, 1663–1674. [Google Scholar] [CrossRef]
  51. Morales, L.F.G.; Boudier, F.; Nicolas, A. Microstructures and crystallographic preferred orientation of anorthosites from Oman ophiolite and the dynamics of melt lenses. Tectonics 2011, 30, 1–21. [Google Scholar] [CrossRef]
  52. Díaz-Azpiroz, M.; Lloyd, G.E.; Fernández, C. Deformation mechanisms of plagioclase and seismic anisotropy of the Acebuches metabasites (SW Iberian massif). In Deformation Mechanisms, Rheology and Tectonics: Microstructures, Mechanics and Anisotropy; Prior, D.J., Rutter, E.H., Tatham, D.J., Eds.; Geological Society Special Publications: London, UK, 2011; pp. 79–95. ISBN 9781862393387. [Google Scholar]
  53. Menegon, L.; Stünitz, H.; Nasipuri, P.; Heilbronner, R.; Svahnberg, H. Transition from fracturing to viscous flow in granulite facies perthitic feldspar (Lofoten, Norway). J. Struct. Geol. 2013, 48, 95–112. [Google Scholar] [CrossRef]
  54. Eberlei, T.; Habler, G.; Grasemann, B.; Abart, R. Upper-greenschist facies intragrain deformation of albite in mylonitic meta-pegmatite and the influence of crystallographic anisotropy on microstructure formation. J. Struct. Geol. 2014, 69, 47–58. [Google Scholar] [CrossRef]
  55. Ji, S.; Shao, T.; Salisbury, M.H.; Sun, S.; Michibayashi, K.; Zhao, W.; Long, C.; Liang, F.; Satsukawa, T. Plagioclase preferred orientation and induced seismic anisotropy in mafic igneous rocks. J. Geophys. Res. Solid Earth 2014, 119, 8064–8088. [Google Scholar] [CrossRef]
  56. Miranda, E.A.; Hirth, G.; John, B.E. Microstructural evidence for the transition from dislocation creep to dislocation-accommodated grain boundary sliding in naturally deformed plagioclase. J. Struct. Geol. 2016, 92, 30–45. [Google Scholar] [CrossRef]
  57. Stünitz, H.; Fitz Gerald, J.D.; Tullis, J. Dislocation generation, slip systems, and dynamic recrystallization in experimentally deformed plagioclase single crystals. Tectonophysics 2003, 372, 215–233. [Google Scholar] [CrossRef]
  58. Olsen, T.S.; Kohlstedt, D.L. Analysis of dislocations in some naturally deformed plagioclase feldspars. Phys. Chem. Miner. 1984, 11, 153–160. [Google Scholar] [CrossRef]
  59. Marshall, D.B.; McLaren, A.C. Deformation mechanisms in experimentally deformed plagioclase feldspars. Phys. Chem. Miner. 1977, 1, 351–370. [Google Scholar] [CrossRef]
  60. Erdman, M.E.; Hacker, B.R.; Zandt, G.; Seward, G. Seismic anisotropy of the crust: Electron-backscatter diffraction measurements from the Basin and Range. Geophys. J. Int. 2013, 195, 1211–1229. [Google Scholar] [CrossRef] [Green Version]
  61. Ward, D.; Mahan, K.; Schulte-Pelkum, V. Roles of quartz and mica in seismic anisotropy of mylonites. Geophys. J. Int. 2012, 190, 1123–1134. [Google Scholar] [CrossRef] [Green Version]
  62. Lee, S.R.; Cho, K. Precambrian Crustal Evolution of the Korean Peninsula. J. Petrol. Soc. Korea 2012, 21, 89–112. [Google Scholar] [CrossRef] [Green Version]
  63. Cho, M.; Kim, T.; Yang, S.; Yi, K. Paleoproterozoic to Triassic crustal evolution of the Gyeonggi Massif, Korea: Tectonic correlation with the North China craton. In Linkages and Feedbacks in Orogenic Systems; Law, R.D., Thigpen, J.R., Merschat, A.J., Stowell, H., Eds.; Geological Society of America Memoir: Boulder, CO, USA, 2017; Volume 213, pp. 165–197. [Google Scholar]
  64. Cluzel, D.; Cadet, J.P.; Lapierre, H. Geodynamics of the Ogcheon Belt (South Korea). Tectonophysics 1990, 183, 41–56. [Google Scholar] [CrossRef]
  65. Cluzel, D.; Jolivet, L.; Cadet, J. Early Middle Paleozoic Intraplate Orogeny in the Ogcheon Belt (South Korea): A new insight on the Paleozoic buildup of east Asia. Tectonics 1991, 10, 1130–1151. [Google Scholar] [CrossRef] [Green Version]
  66. Ree, J.H.; Cho, M.; Kwon, S.T.; Nakamura, E. Possible eastward extension of Chinese collision belt in South Korea: The Imjingang belt. Geology 1996, 24, 1071–1074. [Google Scholar] [CrossRef]
  67. Cho, M.; Kim, H. Metamorphic Evolution of the Ogcheon Belt, Korea: A Review and New Age Constraints. Int. Geol. Rev. 2005, 47, 41–57. [Google Scholar] [CrossRef]
  68. Chough, S.K.; Kwon, S.-T.; Ree, J.H.; Choi, D.K. Tectonic and sedimentary evolution of the Korean peninsula: A review and new view. Earth Sci. Rev. 2000, 52, 175–235. [Google Scholar] [CrossRef]
  69. Kwon, S.; Sajeev, K.; Mitra, G.; Park, Y.; Kim, S.W.; Ryu, I.C. Evidence for Permo-Triassic collision in Far East Asia: The Korean collisional orogen. Earth Planet. Sci. Lett. 2009, 279, 340–349. [Google Scholar] [CrossRef]
  70. Cho, M.; Lee, Y.; Kim, T.; Cheong, W.; Kim, Y.; Lee, S.R. Tectonic evolution of Precambrian basement massifs and an adjoining fold-and-thrust belt (Gyeonggi Marginal Belt), Korea: An overview. Geosci. J. 2017, 21, 845–865. [Google Scholar] [CrossRef]
  71. Lee, Y., II; Lee, J., II. Paleozoic sedimentation and tectonics in Korea: A review. Isl. Arc 2003, 12, 162–179. [Google Scholar] [CrossRef]
  72. Oh, C.W.; Kim, S.W.; Ryu, I.C.; Okada, T.; Hyodo, H.; Itaya, T. Tectono-metamorphic evolution of the Okcheon Metamorphic Belt, South Korea: Tectonic implications in East Asia. Isl. Arc 2004, 13, 387–402. [Google Scholar] [CrossRef]
  73. Oh, C.W.; Choi, S.G.; Seo, J.; Rajesh, V.J.; Lee, J.H.; Zhai, M.; Peng, P. Neoproterozoic tectonic evolution of the Hongseong area, southwestern Gyeonggi Massif, South Korea; implication for the tectonic evolution of Northeast Asia. Gondwana Res. 2009, 16, 272–284. [Google Scholar] [CrossRef]
  74. Cho, M.; Kim, T.; Kim, H. SHRIMP U-Pb Zircon Age of a Felsic Meta-tuff in the Ogcheon Metamorphic Belt, Korea: Neoproterozoic (ca. 750 Ma) Volcanism. J. Petrol. Soc. Korea 2004, 13, 119–125. [Google Scholar]
  75. Choi, D.K.; Woo, J.; Park, T. The Okcheon Supergroup in the Lake Chungju area, Korea: Neoproterozoic volcanic and glaciogenic sedimentary successions in a rift basin. Geosci. J. 2012, 16, 229–252. [Google Scholar] [CrossRef]
  76. Lee, K.S.; Chang, H.W.; Park, K.H. Neoproterozoic bimodal volcanism in the central Ogcheon belt, Korea: Age and tectonic implication. Precambrian Res. 1998, 89, 47–57. [Google Scholar] [CrossRef]
  77. Kim, S.W.; Kee, W.S.; Santosh, M.; Cho, D.L.; Hong, P.S.; Ko, K.; Lee, B.C.; Byun, U.H.; Jang, Y. Tracing the Precambrian tectonic history of East Asia from Neoproterozoic sedimentation and magmatism in the Korean Peninsula. Earth Sci. Rev. 2020, 209, 103311. [Google Scholar] [CrossRef]
  78. Lim, S.; Chun, H.Y.; Kim, Y.B.; Kim, B.C.; Cho, D. Geologic ages, stratigraphy and geological structures of the metasedimentary strata in BibongYeonmu area, NW Okcheon belt, Korea. J. Geol. Soc. Korea 2005, 41, 335–368. [Google Scholar]
  79. Kang, J.-H.; Hayasaka, Y.; Ryoo, C.-R. Tectonic evolution of the Central Ogcheon Belt, Korea. J. Petrol. Soc. Korea 2012, 21, 129–150. [Google Scholar] [CrossRef]
  80. Cho, M.; Min, K.; Kim, H. Geology of the 2018 Winter Olympic site, Pyeongchang, Korea. Int. Geol. Rev. 2018, 60, 267–287. [Google Scholar] [CrossRef]
  81. De Jong, K.; Han, S.; Ruffet, G. Fast cooling following a Late Triassic metamorphic and magmatic pulse: Implications for the tectonic evolution of the Korean collision belt. Tectonophysics 2015, 662, 271–290. [Google Scholar] [CrossRef] [Green Version]
  82. Kim, H.; Kihm, Y.H.; Kee, W. Geological Report of the Iri Sheet (Scale 1:50,000); Korea Institute of Geoscience and Mineral Resources: Daejeon, Korea, 2012. [Google Scholar]
  83. Choi, P.; Hwang, J.H. Geological Report of the Gunsan, Buan, Banchukdo, Jangjado Sheets (Scale 1:50,000); Korea Institute of Geoscience and Mineral Resources: Daejeon, Korea, 2013. [Google Scholar]
  84. Kim, H.; Cho, M.; Koh, H.J. Tectonometamorphic evolution of the central Ogcheon belt in the Jeungpyeong-Deokpyeong area. J. Geol. Soc. Korea 1995, 31, 299–314. [Google Scholar]
  85. Kim, H.; Cho, M. Polymetamorphism of Ogcheon Supergroup in the Miwon area, central Ogcheon metamorphic belt, South Korea. Geosci. J. 1999, 3, 151–162. [Google Scholar] [CrossRef]
  86. Kim, S.W.; Itaya, T.; Hyodo, H.; Matsuda, T. Metamorphic K-Feldspar in Low-grade Metasediments from the Ogcheon Metamorphic Belt in South Korea. Gondwana Res. 2002, 5, 849–855. [Google Scholar] [CrossRef]
  87. Panozzo, R.H. Two-dimensional analysis of shape-fabric using projections of digitized lines in a plane. Tectonophysics 1983, 95, 279–294. [Google Scholar] [CrossRef]
  88. Skemer, P.; Katayama, I.; Jiang, Z.; Karato, S.I. The misorientation index: Development of a new method for calculating the strength of lattice-preferred orientation. Tectonophysics 2005, 411, 157–167. [Google Scholar] [CrossRef]
  89. Mainprice, D.; Hielscher, R.; Schaeben, H. Calculating anisotropic physical properties from texture data using the MTEX open-source package. In Deformation Mechanisms, Rheology and Tectonics: Microstructures, Mechanics and Anisotropy; Prior, D.J., Rutter, E.H., Tatham, D.J., Eds.; Geological Society Special Publications: London, UK, 2011; pp. 175–192. [Google Scholar]
  90. Efron, B.; Tibshirani, R.J. An Introduction to the Bootstrap; Chapman & Hall/CRC: Boca Raton, FL, USA, 1994; ISBN 9781000064988. [Google Scholar]
  91. Morales, L.F.G.; Mainprice, D.; Kern, H. Olivine-antigorite orientation relationships: Microstructures, phase boundary misorientations and the effect of cracks in the seismic properties of serpentinites. Tectonophysics 2018, 724–725, 93–115. [Google Scholar] [CrossRef]
  92. Mainprice, D. A Fortran Program to Calculate Seismic Anisotropy from the Lattice Preferred Orientation of Minerals. Comput. Geosci. 1990, 16, 385–393. [Google Scholar] [CrossRef]
  93. McSkimin, H.J.; Andreatch, P.; Thurston, R.N. Elastic moduli of quartz versus hydrostatic pressure at 25°and −195.8 °C. J. Appl. Phys. 1965, 36, 1624–1632. [Google Scholar] [CrossRef]
  94. Ryzhova, T.V. Elastic properties of plagioclases. Akad SSSR Izv Ser Geofiz 1964, 7, 1049–1051. [Google Scholar]
  95. Wenk, H.R.; Kanitpanyacharoen, W.; Voltolini, M. Preferred orientation of phyllosilicates: Comparison of fault gouge, shale and schist. J. Struct. Geol. 2010, 32, 478–489. [Google Scholar] [CrossRef]
  96. Kim, D.; Jung, H. Deformation microstructures of olivine and chlorite in chlorite peridotites from Almklovdalen in the Western Gneiss Region, southwest Norway, and implications for seismic anisotropy. Int. Geol. Rev. 2015, 57, 650–668. [Google Scholar] [CrossRef]
  97. Park, M.; Jung, H. Relationships Between Eclogite-Facies Mineral Assemblages, Deformation Microstructures, and Seismic Properties in the Yuka Terrane, North Qaidam Ultrahigh-Pressure Metamorphic Belt, NW China. J. Geophys. Res. Solid Earth 2019, 124, 1–24. [Google Scholar] [CrossRef]
  98. Ha, Y.; Jung, H.; Raymond, L.A. Deformation fabrics of glaucophane schists and implications for seismic anisotropy: The importance of lattice preferred orientation of phengite. Int. Geol. Rev. 2019, 61, 720–737. [Google Scholar] [CrossRef]
  99. Puelles, P.; Beranoaguirre, A.; Ábalos, B.; Gil Ibarguchi, J.I.; García de Madinabeitia, S.; Rodríguez, J.; Fernández-Armas, S. Eclogite inclusions from subducted metaigneous continental crust (Malpica-Tui Allochthonous Complex, NW Spain): Petrofabric, geochronology, and calculated seismic properties. Tectonics 2017, 36, 1376–1406. [Google Scholar] [CrossRef]
  100. Lee, J.; Jung, H.; Klemd, R.; Tarling, M.S.; Konopelko, D. Lattice preferred orientation of talc and implications for seismic anisotropy in subduction zones. Earth Planet. Sci. Lett. 2020, 537, 116178. [Google Scholar] [CrossRef]
  101. Kim, D.; Jung, H.; Lee, J. Strain-induced fabric transition of chlorite and implications for seismic anisotropy in subduction zones. Minerals 2020, 10, 503. [Google Scholar] [CrossRef]
  102. Passchier, C.W.; Trouw, R.A.J. Microtectonics, 2nd ed.; Springer: New York City, NY, USA, 2005; ISBN 978-3-540-64003-5. [Google Scholar]
  103. Mares, V.M.; Kronenberg, A.K. Experimental deformation of muscovite. J. Struct. Geol. 1993, 15, 1061–1075. [Google Scholar] [CrossRef]
  104. Okudaira, T.; Takeshita, T.; Hara, I.; Ando, J. A new estimate of the conditions for transition from basal 〈a〉 to prism [c] slip in naturally deformed quartz. Tectonophysics 1995, 250, 31–46. [Google Scholar] [CrossRef]
  105. Bons, P.D.; Den Brok, B. Crystallographic preferred orientation development by dissolution-precipitation creep. J. Struct. Geol. 2000, 22, 1713–1722. [Google Scholar] [CrossRef]
  106. Stallard, A.; Shelley, D. Quartz c-axes parallel to stretching directions in very low-grade metamorphic rocks. Tectonophysics 1995, 249, 31–40. [Google Scholar] [CrossRef]
  107. Tullis, J.; Yund, R.A. Transition from cataclastic flow to dislocation creep of feldspar: Mechanisms and microstructures. Geology 1987, 15, 606–609. [Google Scholar] [CrossRef]
  108. Fitz Gerald, J.D.; Stünitz, H. Deformation of granitoids at low metamorphic grade. I: Reactions and grain size reduction. Tectonophysics 1993, 221, 299–324. [Google Scholar] [CrossRef]
  109. Wang, K.; Jiang, C.; Yang, Y.; Schulte-Pelkum, V.; Liu, Q. Crustal Deformation in Southern California Constrained by Radial Anisotropy From Ambient Noise Adjoint Tomography. Geophys. Res. Lett. 2020, 47, 1–12. [Google Scholar] [CrossRef]
  110. Han, C.; Xu, M.; Huang, Z.; Wang, L.; Xu, M.; Mi, N.; Yu, D.; Gou, T.; Wang, H.; Hao, S.; et al. Layered crustal anisotropy and deformation in the SE Tibetan plateau revealed by Markov-Chain-Monte-Carlo inversion of receiver functions. Phys. Earth Planet. Inter. 2020, 306, 106522. [Google Scholar] [CrossRef]
  111. Cao, Y.; Jung, H. Seismic properties of subducting oceanic crust: Constraints from natural lawsonite-bearing blueschist and eclogite in Sivrihisar Massif, Turkey. Phys. Earth Planet. Inter. 2016, 250, 12–30. [Google Scholar] [CrossRef]
  112. Meltzer, A.; Christensen, N. Nanga Parbat crustal anisotropy: Implications for interpretation of crustal velocity structure and shear-wave splitting. Geophys. Res. Lett. 2001, 28, 2129–2132. [Google Scholar] [CrossRef] [Green Version]
  113. Jung, H. Seismic anisotropy produced by serpentine in mantle wedge. Earth Planet. Sci. Lett. 2011, 307, 535–543. [Google Scholar] [CrossRef]
Figure 1. (a) Simplified tectonic sketch map showing the major tectonic units in the southern part of the Korean Peninsula. NM: Nangrim massif; GM: Gyeonggi massif; YM: Yeongnam massif; IB: Imjingang belt and correlatives; OB: Ogcheon belt; GS: Gyeongsang basin (reprinted with permission from ref. [81]. Copyright 2020 Elsevier). (b) Geological map of the Gunsan area and sample location (reprinted with permission from ref. [82] and ref. [83]. Copyright 2020 Korea Institute of Geoscience and Mineral Resources). (c) Field photograph showing phyllite outcrop of the Geumseongri Formation. (d) Close-up view of a strongly deformed phyllite showing well-developed foliation. (e) Folded and boudinaged quartz veins discordantly cutting phyllite foliation.
Minerals 11 00294 g001
Figure 2. Optical photomicrographs of phyllite samples from the Geumseongri Formation. (a) Phyllite showing well-developed foliation with compositional layering of alternating Q-domain mainly composed of quartz and albite, and M-domain of mica (sample G103). (b) Quartz ribbon displaying undulose extinction and subgrain boundaries (sample G104). Yellow arrows represent undulose extinction of quartz. Red arrows represent recrystallized small grains of quartz. Qtz: quartz, Ms: muscovite. (c) Microcrack in M-domain filled with a calcite crystal (sample G103). Cal: calcite. (d) Pressure shadow of quartz around ilmenite porphyroclasts. Strain cap is partly observed (sample G102). Ilm: ilmenite. (e) Small-scale microfolds showing limbs and axial planes parallel to the foliation (G101). (f) Sheared biotite grain showing dextral shear sense (G102). Bt: biotite.
Minerals 11 00294 g002
Figure 3. EBSD phase maps (a,c), and Euler maps (b,d) of phyllite samples. (a,b) Sample G105 analyzed with step size of 0.31 μm. (c,d) Sample G102 analyzed with step size of 5 μm. Magnified EBSD map of the yellow box in Figure 3a is shown in Figure 4. Ms: muscovite, Qtz: quartz, Chl: chlorite, Ab: albite, Cal: calcite, Ap: apatite, Ilm: ilmenite.
Minerals 11 00294 g003
Figure 4. Magnified EBSD maps of sample G105 (Yellow box in Figure 3a). (a) Inverse pole figure showing crystallographic axes aligned parallel to the lineation. Quartz grains have subgrain boundaries, indicating intracrystalline plastic deformation, while albite rarely show microstructures of ductile deformation. (b) Low-angle (1°–10°) and high-angle (<10°) grain boundary map of quartz on the band contrast map. Note that grain boundaries of albite were excluded.
Minerals 11 00294 g004
Figure 5. Pole figures of the quartz, muscovite, albite, and chlorite presented in the lower hemisphere using equal-area projection. A half-scatter width of 20° was used. The color coding indicates the data point density. Multiples of uniform distribution are denoted as the numbers in the legend. E–W direction of each figure corresponds to stretching lineation (X), and N–S direction (Z) is perpendicular to the foliation. N = number of data points.
Minerals 11 00294 g005
Figure 6. Seismic properties of muscovite calculated from lattice preferred orientation (LPO) and elastic constant. The P-wave velocity (Vp), amplitude of the shear-wave anisotropy (AVs), and polarization direction of the faster shear wave (Vs1) are plotted in the lower hemisphere using an equal-area projection. E–W direction of each figure corresponds to stretching lineation (X), and Z is normal to the foliation. N = number of data points.
Minerals 11 00294 g006
Figure 7. Seismic properties of chlorite calculated from LPO and elastic constant. The P-wave velocity (Vp), amplitude of the shear-wave anisotropy (AVs), and polarization direction of the faster shear wave (Vs1) are plotted in the lower hemisphere using an equal-area projection. E–W direction of each figure corresponds to stretching lineation (X), and Z is normal to the foliation. N = number of data points.
Minerals 11 00294 g007
Figure 8. Seismic properties of quartz calculated from LPO and elastic constant. The P-wave velocity (Vp), amplitude of the shear-wave anisotropy (AVs), and polarization direction of the faster shear wave (Vs1) are plotted in the lower hemisphere using an equal-area projection. E–W direction of each figure corresponds to stretching lineation (X), and Z is normal to the foliation. N = number of data points.
Minerals 11 00294 g008
Figure 9. Seismic properties of albite calculated from LPO and elastic constant. The P-wave velocity (Vp), amplitude of the shear-wave anisotropy (AVs), and polarization direction of the faster shear wave (Vs1) are plotted in the lower hemisphere using an equal-area projection. E–W direction of each figure corresponds to stretching lineation (X), and Z is normal to the foliation. N = number of data points.
Minerals 11 00294 g009
Figure 10. Whole rock seismic properties calculated from LPOs, volume proportions and elastic constant of each minerals. The P-wave velocity (Vp), amplitude of the shear-wave anisotropy (AVs), and polarization direction of the faster shear wave (Vs1) are plotted in the lower hemisphere using an equal-area projection. E–W direction of each figure corresponds to stretching lineation (X), and Z is normal to the foliation.
Minerals 11 00294 g010
Figure 11. Whole rock seismic property of sample G102 calculated from LPOs, volume proportions and elastic constant of each mineral. (a) Seismic anisotropy of muscovite + chlorite + quartz + albite. (b) Seismic anisotropy of muscovite + quartz + albite. (c) Seismic anisotropy of chlorite + quartz + albite. The P-wave velocity (Vp), amplitude of the shear-wave anisotropy (AVs), and polarization direction of the faster shear wave (Vs1) are plotted in the lower hemisphere using an equal-area projection. E–W direction of each figure corresponds to stretching lineation (X), and Z is normal to the foliation.
Minerals 11 00294 g011
Figure 12. Whole rock seismic anisotropies depending on modal compositions and fabric strengths of phyllosilicates. The order of samples follows the increasing volume proportion of muscovite. (a) anisotropy of P-wave (AVp) and maximum anisotropy of S-wave (max. AVs) for each sample. (b) Modal composition of muscovite and chlorite for each sample. (c) M-index indicating fabric strengths for each mineral. Ms: muscovite; Chl: chlorite.
Minerals 11 00294 g012
Table 1. Mineral modal composition, mean aspect ratio of grains in the phyllite samples, and step size of electron backscatter diffraction (EBSD) analysis.
Sample No.Modal Composition (%) 1Mean Aspect RatioStep Size (μm)
MsChlQtzAbCalAccessoryQtzAb
G10134.77.638.613.40.94.81.912.445
G10231.111.333.015.00.98.71.932.115
G10323.48.835.722.84.64.71.872.255
G10422.113.847.614.00.81.72.123.395
G1054.65.767.612.12.37.72.041.870.31
1 Modal composition was estimated based on the EBSD map data. Ms: muscovite, Qtz: quartz, Chl: chlorite, Ab: albite, Cal: calcite
Table 2. Fabric strength of minerals in phyllite samples.
Sample No.M-Index
MsChlQtzAb
MeanCI 1MeanCIMeanCIMeanCI
G1010.3172±0.011700.2510±0.047700.0387±0.008900.0627±0.01395
G1020.1693±0.023350.1711±0.049800.0326±0.006700.0632±0.01460
G1030.2194±0.020900.1578±0.045750.0537±0.010550.0639±0.01295
G1040.3175±0.027750.2928±0.060800.0555±0.005700.0821±0.01860
G1050.21-0.293-0.09-0.379-
1 CI: ± 95% confidence interval. Ms: muscovite, Qtz: quartz, Chl: chlorite, Ab: albite.
Table 3. Mineral and whole-rock Seismic velocity and anisotropy in phyllite samples.
Sample No.MuscoviteChloriteQuartzAlbiteWhole Rock
AVp (%)Max. AVs (%)AVp (%)Max. AVs (%)AVp (%)Max. AVs (%)AVp (%)Max. AVs (%)AVp (%)Max. AVs (%)
G10151.158.126.751.14.55.71.21.521.724.2
G10243.441.925.340.22.83.52.11.318.919.7
G10344.447.721.434.93.94.71.31.714.315.4
G10451.159.129.456.84.35.71.31.617.220.3
G10543.942.826.547.47.19.815.624.899.6
Publisher’s Note: MDPI stays neutral with regard to jurisdictional claims in published maps and institutional affiliations.

