Abstract
Hyperspectral reflectance has the potential to provide rapid and low-cost mineralogical and chemical information that can be used to vector in mineral systems. However, the spectral signature of white mica and chlorite, despite numerous studies, is not fully understood. In this study, we review the mineralogy and chemistry of different white mica and chlorite types and investigate what mineralogical and chemical changes are responsible for the apparent shifts in the shortwave infrared (SWIR) spectroscopic absorption features. We demonstrate that the spectral signature of white mica is more complex than previously documented and is influenced by the Tschermak substitution, as well as the sum of interlayer cations. We show that an increase in the interlayer deficiencies towards illite is associated with a change from steep to shallow slopes between the wavelength position of the 2200 nm feature (2200 W) and Mg, Al(VI) and Si. These changes in slope imply that white micas with different elemental chemistry may be associated with the same 2200 W values and vice versa, contrary to traditional interpretation. We recommend that traditional interpretations should only be used in true white mica with sum interlayer cations (I) > 0.95. The spectral signature of trioctahedral chlorite (clinochlore, sheridanite, chamosite and ripidolite) record similar spectral relationships to those observed in previous studies. However, dioctahedral Al-rich chlorite (sudoite, cookeite and donbassite) has a different spectral response with Mg increasing with 2250 W, which is the opposite of traditional trioctahedral chlorite spectral interpretation. In addition, it was shown that dioctahedral chlorite has a 2200 W absorption feature that may introduce erroneous spectral interpretations of white mica and chlorite mixtures. Therefore, care should be used when interpreting the spectral signature of chlorite. We recommend that spectral studies should be complemented with electron microprobe analyses on a subset of at least 30 samples to identify the type of muscovite and chlorite. This will allow the sum I of white mica to be obtained, as well as estimate the slope of 2200 W absorption trends with Mg, Al(vi), and Si. Preliminary probe data will allow more accurate spectral interpretations and allow the user to understand the limitations in their hyperspectral datasets.
1. Introduction
Hydrothermal ore deposits are commonly associated with phyllosilicate alteration haloes that contain variable mineralogical, geochemical, geophysical and spectral characteristics depending on the deposit type [1,2]. Of these, hyperspectral reflectance has the potential to provide rapid and low cost mineralogical and chemical information that can be used to vector towards and within mineralized zones [3]. The spectral characteristics of white mica and chlorite are widely used in exploration, as they have been the focus of several studies (e.g., [4,5,6,7,8,9,10,11]) and are thought to be well understood. The spectral signature of white mica is strongly influenced by the Tschermak substitution between the octahedral (Al(VI), Mg, Fe) and tetrahedral (Si, Al(VI)) sites, whereas the spectral signature of chlorite is influence by Mg and Fe substitutions in the octahedral site [5,6,7,8]. The correlation between white mica and chlorite chemistry and spectral response is generally high for each specific area studied (e.g., [7,8]), but greatly decreases when data from different areas are combined and compared, suggesting that unknown mineralogical or chemical parameters also control the spectral signature of white mica and chlorite. Understanding these parameters is critical, as there are often specific mica and chlorite species associated with mineralization (e.g., [10,11]), such that improved interpretation of spectral data may lead to the identification of new exploration targets that may have been missed in historical datasets.
This study aims to review the mineralogy and chemistry of different white mica and chlorite types to investigate what mineralogical and chemical changes are responsible for shifts in the shortwave infrared (SWIR) spectroscopic absorption features. It uses original and publicly available databases to demonstrate that the spectral signature of white mica and chlorite is more complex than previously documented.
2. Mineralogy Background
2.1. White Mica Group
White micas are phyllosilicates in which the unit structure consists of one octahedral sheet between two opposing tetrahedral sheets. These are separated from adjacent layers by planes of non-hydrated interlayer cations with no less than 0.6 cations per formula unit [12]. If the interlayer cations are between 0.6 and 0.85, the white mica is characterized as an interlayer-deficient mica. If the interlayer cations are greater than 0.95, they are of the muscovite-celadonite series, and if the interlayer cations are near 0.65 they are of the illite series. The simplified formula is written as I0.6–1.0 M2–3 ❏1–0 T4 O10 A2, where:
I: interlayered cation that is K, Na and Ca, and less commonly Cs, NH4, Rb and Ba
M: octahedral cation that is Fe (di- or trivalent), Mg, Al, Ti and Li, and less commonly Mn (di- or trivalent), Zn, Cr and V
❏: vacancy in the octahedral sheet
T: tetrahedral cation that is Si, Al and Fe (trivalent), and less commonly Be and B
A: anion that is OH, F and Cl, and less commonly O (oxy-micas) and S.
White micas can be divided into true micas if more than 50% of I cations are monovalent, and brittle micas if more than 50% of I cations are divalent. White micas are dioctahedral if the M site contains less than 2.5 cations and trioctahedral if it contains more than 2.5 cations [12].
Muscovite-celadonite series contain true dioctahedral mica with I greater than 0.95. They vary between a K-rich muscovite end-member with a general formula of KAl2❏(Si3Al)O10(OH)2 and a Fe-Mg-rich celadonite end-member with a general formula of KFe3+(Mg, Fe2+)❏Si4O10(OH)2. The mica is classified as muscovite when Al# (VIAl/(VIAl + Fetot + Mg) is greater than 0.5 and celadonite when it is less than 0.5 [12,13]. Although not a recognized mineral, in this study we identify the mica as phengite when the Si:Al ratio in the tetrahedral layer is greater than 3.25, following the classification of Deer et al. [14]. The main substitutions in the muscovite-celadonite series are the Tschermak substitution (Al3+tet + Al3+oct ↔ Si4+tet + Mg2+oct or Fe2+oct) in the octahedral and tetrahedral sites, and the Na+int ↔ K+int substitution in the interlayer plane. Tischendorf et al. [12] showed that the Na+int ↔ K+int substitution does not constitute a solid-solution with a paragonite end-member (NaAl2❏(Si3Al)O10(OH)2). They identified an immiscibility gap between approximately 0.4 to 0.6 Na atoms per formula unit and argue that this immiscibility gap results from the large difference in ionic radius between Na+ (0.95 Å) and K+ (1.33 Å).
Illite series contain dioctahedral interlayer-deficient micas between 0.6 and 0.85 with an ideal general formula K0.65Al2❏(Si3.35Al0.65)O10(OH)2 [12]. The deficiency in illite originates from excess Si+4tet that is compensated by a deficiency in K in the interlayer plane (Si+4tet ↔ Al3+tet + K+ int; Deer et al., 1992). Other substitutions that can occur are Na+int ↔ K+int, similar to the muscovite series, and Ca2+int ↔ Mg2+oct or Fe2+oct substituting for Al3+oct.
2.2. Chlorite Group
Chlorite is a hydrous phyllosilicate in which the unit structure consists of alternating a negatively charged tetrahedral–octahedral–tetrahedral talc-like 2:1 layer (TOT; M6T8O20(OH)4) with a positively charged octahedral brucite-like layer (O; M6(OH)12), resulting in a 2:1:1 stacking pattern [14,15,16]. The simplified formula is written as ((R2+xR3+y❏6-x-y)6(SizR3+4-z)4O10(OH)8, where:
R2+x: octahedral divalent cation that is Fe, Mg and Mn and less commonly Ni, Co, Zn, and Cu
R3+y: octahedral trivalent cation that is Al and Fe, and less commonly Cr and V
❏: vacancy in the octahedral sheet
R3+y: tetrahedral trivalent cation that is Al and less commonly B and Fe.
Chlorites are divided into type I (dioctahedral) and type II (di-trioctahedral and trioctahedral) based on their Mg, Fe, Al and ❏ content. They are classified as dioctahedral when the sum of Mg and Fe is greater than the sum of Al and vacancy, and as trioctahedral when the sum of Al and vacancy is greater than the sum Mg and Fe [15] Chlorites are further classified based on their Si and vacancy (or R2+ or R3+) content and, lastly, based on their Mg number [17]. Type I chlorite with low Si (2.5 apfu) is classified as sheridanite (Mg# > 0.5) and ripidolite (Mg# < 0.5), with moderate Si (3.0 apfu) as clinochlore (Mg# > 0.5) and chamosite (Mg# < 0.5), and with high Si (3.5 apfu) as pennantite (Mg# > 0.5) and diabantite (Mg# < 0.5). Type II chlorite with vacancy of 1 apfu (R2+ = 2 or R3+ = 3 apfu) is classified as sudoite and as donbassite with vacancy of 1.5 apfu (R2+ = 0.5 or R3+ = 4 apfu) [17].
3. Spectral Reflectance Background
Spectral reflectance is a non-destructive technique that measures the relative absorption of photons interacting with minerals over a specific wavelength interval relative to a reference standard [4]. Absorption features in the visible–near infrared–shortwave infrared (380–2500 nm, VNIR/SWIR) occur due to electronic processes from wavelengths of 10 to about 1300 nm and vibrational processes for wavelengths above 900 nm [18,19,20,21]. For a molecule with N atoms, there are 3N − 6 normal modes of vibrations, which are called fundamentals. Additional vibrations, termed overtones, occur near multiples of original fundamental frequency using wave numbers (cm−1). Libration, which is a type reciprocating motion, also occurs at low frequencies. Additional weaker vibrations occur at multiples of a single fundamental mode and/or combinations thereof [4].
3.1. OH Stretching Vibrations
In hydroxyl-bearing silicates (e.g., amphibole, chlorite, mica), the stretching bond with OH is responsible for the main absorption features in the near infrared (NIR) and shortwave infrared (SWIR) regions. The fundamental OH stretching vibrations (ν(OH)) occur near 3600 cm−1 (2775 nm) and have been the focus of several studies (Table 1, e.g., [18,22,23,24,25,26,27]). The frequency of vibration depends on the strength of the bond in a molecule, which is affected by the combined mass of the pair forming the bond, the valence of the cation (e.g., divalent versus trivalent), and the stacking order angle (ρ) (or crystallinity). Bonds with the heavier Fe2+–Fe2+ pair are associated with the lowest frequency ν(OH) at 3505 cm−1 (2853 nm), whereas bonds with the lighter Al–Al pair have the highest frequency at 3621 cm−1 (2762 nm) (Table 1). In addition, cations with the highest charge have absorption features with the lowest frequency (e.g., ν(OH)Fe2+–Fe2+ at 3505 cm−1 (2853 nm) versus ν(OH)Fe3+–Fe3+ at 3535 cm−1 (2829 nm); [22]. Besson and Drits [25,26] observed that the ν(OH)Al–Al is associated with multiple frequencies and documented a change in ν(OH) frequency based on the ρ angle between sheets in micas, wherein a small ρ angle is associated with stronger OH–O interactions and lower ν(OH) frequency. They estimated that on average, a change in the ρ angle by 1° may change the band frequency by up to 2.5 cm−1. Besson and Drits [25,26] also observed that in mica with very low Fe and Mg, the dominant absorption feature tends to occur at higher frequency near 3640 cm−1 (2747 nm) instead of 3621 cm−1 (2762 nm). They attributed this shift to the increased amount of Al(VI) cations and the different Al(VI) and Al(VI) configuration in the tetrahedral and octahedral layers, which may result in a greater ρ angle [28] and an increase in the OH stretching frequency. It should be remembered that, until recently, these fundamental vibrations, so important for observing OH-bearing silicates, were outside the range of most hand-held field instruments.

Table 1.
OH stretching vibration, overtones and the octahedral cations bonded to OH group.
3.2. White Mica Group
White micas have diagnostic overtone absorption features at 2200 nm and 2340 nm (Figure 1 and Figure 2; [4,6,7]). The wavelength position of the 2200 nm feature (herein referred to as 2200 W) varies between 2190 and 2225 nm and is the result of overtones between the fundamental OH stretching vibrations of the OHAl–Al, OHAl–Mg and OHAl–Fe near 3600 cm−1 (2775 nm) and OHAl–Al librational vibration (δ(OH)) near 915 cm−1 (10,929 nm) (Table 2; [22]). The position of the absorption feature was documented to negatively correlate with the abundance of Al(VI) in the octahedral layer, which also coincides with an increase in Si and Mg–Fe due to the Tschermak substitution [5,7,30,31]. White micas have been empirically classified as paragonite when the 2200 nm feature occurs between 2180 and 2195 nm, muscovite between 2195 and 2215 nm, and phengite between 2215 and 2225 nm [6], whereas illite has been distinguished by its deeper 1900 nm absorption feature, but it cannot be reliably distinguished from muscovite in the SWIR region [32].
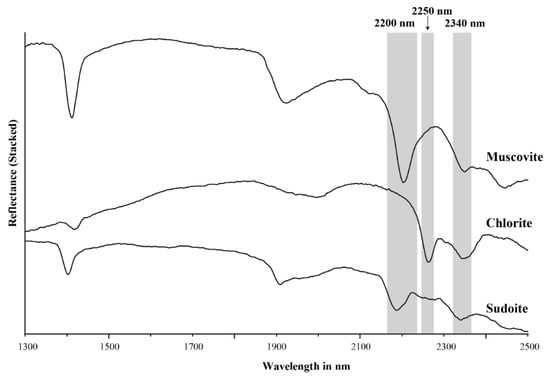
Figure 1.
Stacked NIR/SWIR reflectance spectra of muscovite, chlorite and sudoite.
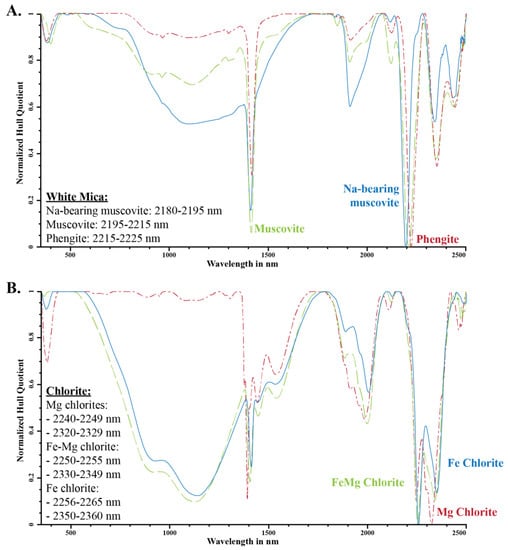
Figure 2.
Variation in spectral absorption feature for (A) white mica and (B) trioctahedral chlorite (after Clark et al. [4]; Pontual et al. [6], and Kokaly et al. [33]; modified from Cloutier et al. [3]).
Table 2.
OH stretching vibration, overtones and the octahedral cations bonded to OH group for white mica.
3.3. Chlorite Group
Trioctahedral chlorites have diagnostic overtone absorption features at 2250 and 2340 nm (Figure 1 and Figure 2; [6,8,34]. These absorption features arise from bonds in the octahedral sheets and are due to combinations of fundamental Al–, Fe– and Mg–OH stretching near 3600 cm−1 (2775 nm) with OH librational vibrations near 800 cm−1 (12,500 nm) for the 2250 nm feature and near 650 cm−1 (15,385 nm) for the 2340 nm feature [18,25,26,34]. The position of the 2250 nm (herein referred to as 2250 W) and 2340 nm absorption features correlate with their Mg number and their Mg and Fe content, wherein an increase in Mg number shifts the position of the absorption feature to shorter wavelengths [6,8,34]. Chlorites have been empirically classified as Mg-rich chlorite when their absorption features vary between 2240 and 2249 nm and 2320 and 2329 nm, intermediate (or Mg–Fe) when they vary between 2250 and 2255 nm and 2330 and 2349 nm, and Fe-rich when they vary between 2256 and 2265 nm and 2350 and 2360 nm [6,8,34]. Al-rich dioctahedral chlorites, such as sudoite (Al), have a well-developed 2200 nm feature in addition to the 2250 nm (shallow) and 2340 nm (deep) features, due to their high Al content (Figure 1; [8,35,36]).
4. Methodology
Fourteen white mica samples and 16 chlorite samples were analysed for their mineral chemistry by electron probe microanalysis (EPMA) on polished thin sections and by approximately 1.5 cm wide spot VNIR/SWIR spectral reflectance on thin section off cuts. The samples were selected on the basis of their 2200 (white mica) and 2250 nm (chlorite) absorption feature to cover the variability of the datasets. The mineral chemistry of samples from the Lemarchant volcanogenic massive sulfide (VMS) deposit in Newfoundland and Labrador, Canada were analysed at the Central Science Laboratory of the University of Tasmania, Australia, using a JEOL JXA-8530F Plus electron microprobe equipped with 5 tunable wavelength dispersive spectrometers, whereas the Athabasca Basin samples from Saskatchewan, Canada, were analysed on an automated 4-spectrometer Cameca Camebax MBX electron probe by the wavelength dispersive X-ray method (WDS) at Carleton University in Ottawa, Canada.
At the University of Tasmania, operating conditions were: 15 kV accelerating voltage, 10 nano-amperes (nA) beam current. Specimens were analysed using a defocused electron beam of 5 μm in diameter. Counting times for analysis and background varied from 10 to 30 s. Background positions were carefully selected to avoid instances of peak overlap. Raw X-ray data were converted to elemental wt percent by the Armstrong/Love-Scott matrix correction algorithm. A suite of well-characterized natural and synthetic minerals and compounds were used as calibration standards. Precision is <1% relative for majors and 1–3% relative for minors.
At the University of Ottawa, operating conditions were: 15 kV accelerating voltage, 20 nano-amperes (nA) beam current. Specimens were analysed using a rastered electron beam 5 × 5 to 10 × 10 μm in size. Counting times were 15 to 40 s or 40,000 accumulated counts. Background measurements were made at 50 percent peak counting time on each side of the analysed peak. Background positions were carefully selected to avoid instances of peak overlap. Raw X-ray data were converted to elemental wt percent by the Cameca PAP matrix correction program. A suite of well-characterized natural and synthetic minerals and compounds were used as calibration standards. Analyses are accurate to 1 to 2 percent relative for major elements (>10 wt%), 3 to 5 percent relative for minor elements (>0.5 to <5.0 wt%).
Spectral reflectance was measured using an Analytical Spectral Devices (ASD) TerraSpec 4 for the Lemarchant samples at the Centre for Ore Deposits and Earth Sciences (CODES), University of Tasmania, Australia, and a Portable Infrared Mineral Analyzer II (PIMA) for the Athabasca Basin samples at Queen’s University, Canada. To enable comparison with spectral data where the spot size is approximately 1.5 cm in diameter compared to 5–10 µm for EPMA, an average of at least 6 EPMA analyses from across the thin section was used in order to account for mineral chemistry heterogeneity in each sample. The ASD TerraSpec 4 standard spectrometer has a spectral range of 350 to 2500 nm across VNIR/SWIR light with a spectral resolution of 10 nm, whereas the PIMA II has a spectral range of 1200 to 2500 nm across NIR/SWIR light with a spectral resolution of 4 nm. Published datasets from Scott and Yang [7] (102 white mica), Scott et al. [8] (78 chlorite), and Buschette and Piercey [10] (10 white mica and 10 chlorite) were used to complement the datasets used in this study.
Mineral formulas for white mica were calculated on the basis of 11 oxygen (22 charge) following the method described in Rieder et al. [12] and 14 oxygen (28 charge) for chlorite following the method described in Zane and Weiss [15]. A mineral name was obtained based on atoms per formula units (apfu) as per the descriptions in the mineralogy background section above.
5. Results
5.1. White Mica Chemistry
Three types of white mica were identified based on interlayer deficiency (I), Al, Si, R2+(oct), R3+(oct) and Ca (Figure 3). All white micas in this study are true micas with more than 50% monovalent I cations.
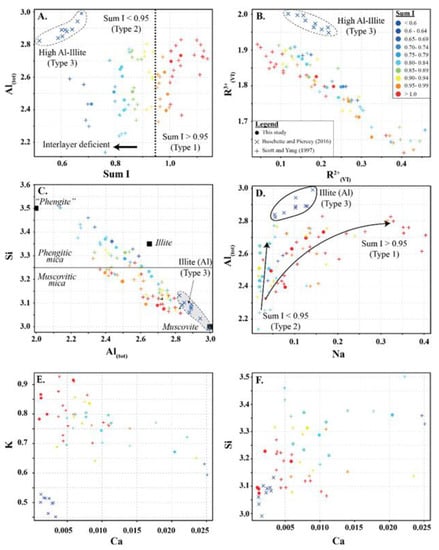
Figure 3.
White mica scatter plots for (A) Al(tot) vs. sum I (interlayer cations), (B) R2+(VI) vs. R3+(VI), (C) Si vs. Al(tot), (D) Al(tot) vs. Na, (E) Ca vs. K, and (F) Si vs. Ca showing the three types of white mica used in this study. Symbols are: • (this study), + (Scott and Yang, [7]) and  (Buschette and Piercey, [10]).
(Buschette and Piercey, [10]).
Type 1 are not interlayer deficient (sum I > 0.95) and contain high K and variable Si, Al, R2+(oct), and R3+(oct). Si records inverse abundance relationships with Al and R3+(oct), and a positive abundance relationship with R2+(oct). In contrast, Al records an inverse abundance relationship with R2+(oct) and a positive relationship with R3+(oct) (Figure 3A–C and Figure 4). Type 1 white mica is part of the muscovite series and records a trend between muscovite (Si = 3.05) and muscovitic phengite (Si = 3.3), with the majority of analyses being muscovite (Si < 3.25) (Figure 3C). Na shows a positive correlation with Al (Figure 3D).
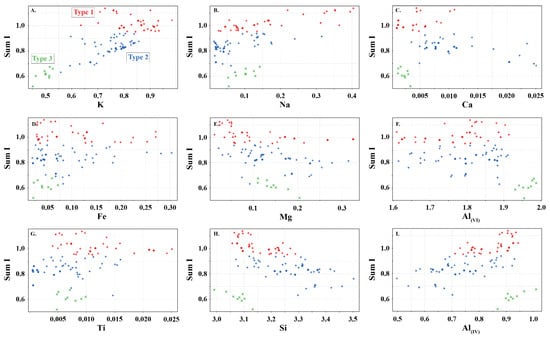
Figure 4.
Sum of interlayer cations (sum I) in white mica versus (A) K, (B) Na, (C) Ca, (D) Fe, (E) Mg, (F) Al(VI), (G) Ti, (H) Si, and (I) Al(IV) showing the elemental variability in apfu of the white micas used in this study. Symbols are: • (this study), + (Scott and Yang, [7]) and (Buschette and Piercey, [10]).
(Buschette and Piercey, [10]).
Type 2 are interlayer deficient with sum I between 0.68 and 0.95, with the majority above 0.75 (Figure 3A and Figure 4). They contain variable Si, Al, R2+(oct), and R3+(oct), with similar abundance relationships to Type 1 white mica, but are enriched in Si and Mg relative to Type 1 at similar Al(VI) or R3+(oct) values. They are also enriched in Si and R3+(oct) relative to R2+(oct) (Figure 3B) and depleted in K and Na (Figure 3D,E) and record a different trend relative to Type 1 in an Al(tot) vs. Na scatter plot (Figure 3D). Analyses with the highest Ca record the lowest K and highest Si (Figure 3E,F), suggesting that Ca substitutes for K in the interlayer position and complements the Si+4tet ↔ Al3+tet + K+int substitution. Type 2 are technically part of the illite series due to their I site deficiency of less than 0.95. However, they form a continuum between muscovite and phengite, similar to Type 1 white mica but with greater Si, and do not show a progression towards the ideal illite composition (Figure 3C). Overall, they are enriched in Ca, Mg, Al(VI), sum M, and Si, and depleted in K, Na, sum I, Fe, Ti, Al(IV) and Al(tot) relative to Type 1 white mica (Figure 5).
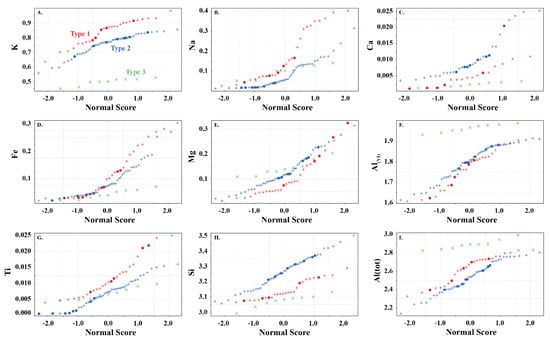
Figure 5.
White mica split probability plots for (A) K, (B)Na, (C) Ca, (D) Fe, (E) Mg, (F) Al(VI), (G) Ti, (H) Si, and (I) Al(tot) showing the elemental variability in apfu in the white mica used in this study. Symbols are: • (this study), + (Scott and Yang, [7]) and (Buschette and Piercey, [10]).
(Buschette and Piercey, [10]).
Type 3 are highly deficient white micas with sum I between 0.52 and 0.67 (Figure 3A and Figure 4). They have the highest Al content with total Al varying between 2.82 and 2.99 apfu and lowest K and Si content ranging between 0.45 and 0.53 and 2.99 and 3.31 apfu, respectively. They plot near the muscovite pole in the Si versus Al(tot) plot (Figure 3C) and plot closer to the muscovite–illite trend compare to Type 1 and 2 white micas. We classify them as Al-rich illite due to their highly deficient nature.
5.2. White Mica SWIR Reflectance
Type 1 and 2 white micas show similar but distinct relationships with the wavelength position of the 2200 nm absorption feature, except for the Athabasca Basin samples (open black circles; Figure 6), which do not show any correlation with 2200 W. Overall, Mg, Al(VI), Si and Al(tot) show different slopes in their correlation with 2200 W. However, differences in the trends of each white mica type are observed. In general, Type 1 is associated with steeper slopes and higher correlation coefficients with 2200 W than Type 2 white mica.
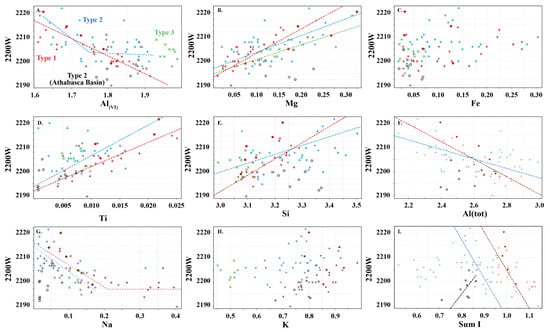
Figure 6.
Relationship between wavelength of the 2200 nm absorption feature (2200 W) and content of major cations in Type 1 (red), Type 2 (blue) and Type 3 (green) white micas. (A) Al(VI), (B) Mg, (C) Fe, (D) Ti, (E) Si, (F) total Al, (G) Na, (H) K, and (I) sum I. Symbols are: • (this study), + (Scott and Yang, [7]) and (Buschette and Piercey, [10]). Additionally, shown are trends of Type 1, Type 2 and Type 3 (excluding Athabasca Basin samples; open black circles) and their correlation coefficients. A separate trend is shown for the Athabasca Basin samples.
(Buschette and Piercey, [10]). Additionally, shown are trends of Type 1, Type 2 and Type 3 (excluding Athabasca Basin samples; open black circles) and their correlation coefficients. A separate trend is shown for the Athabasca Basin samples.
Interlayer cations do not correlate with 2200 W (Figure 6G–I), except possibly the Type 2 Athabasca Basin samples (Figure 6I) and Na in Type 1 mica, where a negative correlation exists with 2200 W up to ~2200 nm. However, when Na is greater than 0.15 apfu, this correlation ceases and the 2200 W value remains constant near 2200 nm (Figure 6G). This correlation does not appear to be as consistent in Type 2 and 3 white micas. No correlation is observed with K and Ca.
The 2200 W values of Type 3 Al-rich illite show a weak correlation with Mg and Na, with the other elements not correlating with 2200 W.
No correlation is observed with Fe in the three types of white mica. This may be due to variable oxidation states of Fe or due to erroneous spectral analysis arising from the different spot size between ASD TerraSpec (~1.5 cm) and EPMA (~15 µm), which may introduce mineral mixes.
5.3. Chlorite Chemistry
Two types of chlorite were identified based on Si, Mg, Fe and Al (Figure 7). Type 1 chlorites correspond to trioctahedral chlorite of Zane and Weiss [15], and define a trend that varies from Si-deficient sheridanite (Mg# > 0.5) and ripidolite (Mg# < 0.5) to clinochlore (Mg# > 0.5) and chamosite (Mg# < 0.5) (Figure 7). Chlorites near the sheridanite/ripodilite end-member contain low Si and R2+ cations and high Al(VI) (Figure 7). As the chemical composition approaches the clinochlore/chamosite end-member, they become progressively enriched in Si and R2+ cations and depleted in Al(VI), reflecting Tschermak substitution between the octahedral and tetrahedral layers in the chlorite (Al3+tet + Al3+oct ↔ Si4+tet + Mg2+oct or Fe2+oct).
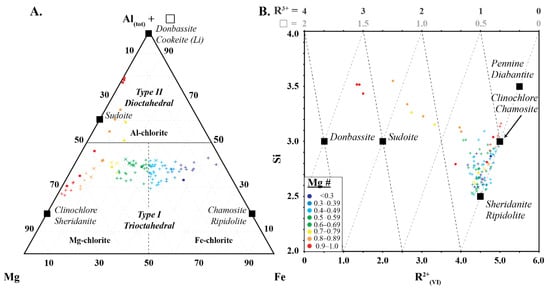
Figure 7.
(A) Ternary diagram of Al + ❏ (octahedral vacancy)-Mg–Fe, and (B) Si vs. R2+(VI) showing the two types of chlorite used in this study. Symbols are: • (this study), + (Scott et al. [8]) and (Buschette and Piercey, [10]).
(Buschette and Piercey, [10]).
Type 2 chlorites correspond to dioctahedral Type II chlorite of Zane and Weiss [15] and show a progressive increase in Si, R3+ and ❏ from a Type 1 chlorite pole with an Mg number of approximately 0.8 towards the Si-rich sudoite composition with an end-member at 3.5 apfu Si, 3.2 apfu R3+ and 1.5 apfu ❏ (Figure 7). This progressive increase in Si, R3+ and ❏ is associated with a progressive decrease in R2+, and reflects the substitution of 3R2+ ↔ ❏ + 2Al(VI) and/or 3R2+ ↔ 2❏ Si4+ + 2❏.
5.4. Chlorite SWIR Reflectance
The two types of chlorite show similar relationships with the wavelength position of the 2250 nm absorption feature, except for Mg, Al(oct), and octahedral vacancy (Figure 8). In Type 1 chlorite, Fe, Al(VI) and Si correlate positively with 2250 W, whereas Mg and Mg number correlate negatively. In Type 2 chlorite, Mg and Fe show a positive relationship with 2250 W, whereas Al(VI) shows an inverse relationship. In both types, Fe and Mg number record similar relationships, wherein an increase in Fe correlates with longer 2250 W absorption features.
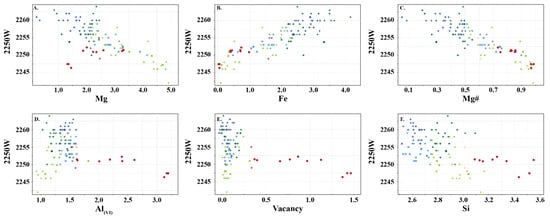
Figure 8.
(A–F) Relationship between wavelength of the 2250 nm absorption feature and content of major cations in Type 1 (light green: clinochlore; dark green: chamosite; light blue: sheridanite; dark blue: ripidolite) and Type 2 (pink: sudoite) chlorite. Symbols are: • (this study), + (Scott et al. [8]) and (Buschette and Piercey, [10]).
(Buschette and Piercey, [10]).
6. Discussion
6.1. Spectral Signatures of White Mica
White micas in this study display similar spectral relationships to those observed in previous studies (e.g., [5,6,7]). The 2200 W correlates negatively with Al(VI), and positively with Mg and Si (Figure 6), highlighting the importance of the Tschermak substitution in influencing the spectral signature of white micas. However, a new spectral correlation between 2200 W and the sum of interlayer cations is identified, wherein muscovite series white micas (Type 1) are associated with steeper slopes with 2200 W compared to interlayer depleted white micas of the muscovitic illite series (Type 2) (Figure 6I and Figure 9A–D). The slope of these trends is controlled by the amount of Al, Mg and Fe in the octahedral site. In white mica, the position of the 2200 nm absorption feature is strongly controlled by the interaction of Al with OH bonds in the mineral structure and has been referred to as the Al–OH feature (e.g., [5,6,7]). The exact position of the absorption feature is influenced by minor variations in Mg and Fe concentration. When Mg and Fe concentrations are very low, fundamental OH stretching vibrations are associated with several higher frequency ν(OHAl–Al) absorption features near 3621, 3641 and 3658 cm−1, which when coupled with librational δ(OH)Al–Al near 915 cm−1 produce overtones with short wavelengths at 2205, 2195 and 2186 nm, respectively (Table 1; [25,26,27]). The 3621 cm−1 fundamental frequency appears to be the dominant ν(OHAl–Al) but it is not clear what chemical or structural mineralogical parameters activate each centre [25,26,27]. As Mg and Fe concentrations increase, the position of the absorption feature is associated with an apparent shift to longer wavelengths, due to lower frequencies of fundamental OH stretching vibrations near 3573 cm−1 for Fe (ν(OHAl–Fe)) compared to 3604 cm−1 for Mg (ν(OHAl–Mg)). When coupled with a librational Al–Al frequency (δ(OH)Al–Al) near 915 cm−1, this results in overtones near 2228 nm for Fe-enriched white mica and near 2213 nm for Mg-enriched white mica (Table 1; [25,26,27]). Together, this suggests that samples with higher concentrations of Fe relative to Mg are expected to be associated with longer 2200 nm absorption features and will produce a steeper correlation with 2200 W over the expected range of 2200 W, as the maximum predicted variability of 2200 W in a white mica suite with Al-rich and Fe-rich end members is 42 nm (2186 nm for Al-rich vs. 2228 nm for Fe-rich) compared to 27 nm (2186 nm for Al-rich vs. 2213 nm for Mg-rich) for a mica suite with Al-rich and Mg-rich end members.
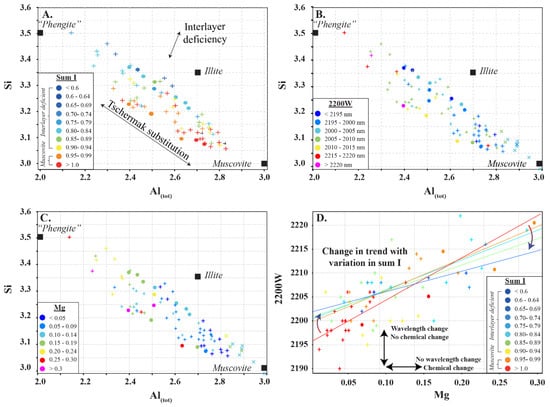
Figure 9.
Summary of features that influence the spectral response in white mica. (A–C) Si (apfu) vs. Al(tot) (apfu) showing chemical variations due to Tschermak and interlayer deficiency substitutions as well as the poles for muscovite, phengite and illite, with data points coloured by (A) sum I, (B) 2200 W, and (C) Mg (apfu). (D) 2200 W vs. Mg (apfu) showing a decrease in slope with decreasing sum of interlayer cations (Sum I). Symbols are: • (this study) and + (Scott and Yang, [7]).
Type 1 white micas have on average greater abundances of Fe compared to Type 2 white micas (Figure 5D). As interlayer deficiency increases towards Type 2 white mica, Mg, Al(VI) and Si slopes progressively decrease with decreasing sum I (Figure 6A,B,E and Figure 9B). However, the data show some variability between Mg and 2200 W that may be associated with chemical variability due to difference in spot size of the analyses (~1.5 cm for ASD TerraSpec versus ~15 µm for EPMA), or may be due to differences in oxidation state of Fe (Fe2+ is associated with longer 2200 W than Fe3+; Table 1). Nevertheless, the observed trends suggest that sum I has an influence on the position of the 2200 nm absorption feature (Figure 6I and Figure 9). The decrease in sum I correlates with an increase in Si, Ca and Mg, a decrease in K and Na and does not correlate with Al(VI) (Figure 4A–C,E,F,H). This agrees with the substitutions observed in illites, where (1) Si+4(IV) ↔ Al3+(IV) + K+ int is associated with an increase in interlayer deficiency and (2) Ca2+int ↔ Mg2+(VI) or Fe2+(VI) corresponds to a progressive enrichment in Ca in the interlayer position [12]. In addition, the Tschermak substitution ((3) Al3+(IV) + Al3+(VI) ↔ Si4+(IV) + Mg2+(VI)) also appears to have an important role by increasing Si and Mg concentrations in the white mica, which results in a narrower 2200 W range and shallower slopes with 2200 W in interlayer deficient white mica (Figure 9A–D). Exceptions to this are the samples with short 2200 W that are enriched in Ca from the Athabasca Basin, which do not plot along the Mg vs. 2200 W trend and show a positive trend between sum I and 2200 W, contrary to both types of white mica (e.g., black open circles in Figure 6I). They suggest that the presence of Ca in the interlayer position of the white mica structure may disrupt the crystal structure and activate different fundamental OHAl–Al stretching vibration centres (3641 cm−1 compared to the dominant 3621 cm−1 ν(OHAl–Al)) that result in shorter wavelengths. More research is needed to elucidate the role of Ca in the spectral response of white mica.
In summary, our data show a transition from steep to shallow slopes between 2200 W and Al(VI), Mg and Si with increasing interlayer deficiencies in the micas as they approach illite compositions. This implies that micas with different elemental chemistry may be associated with the same 2200 W values, and that shifts in 2200 W may be associated with micas with similar elemental chemistry (Figure 9D). The net result of this effect is that the spectral signature of white mica creates data clouds instead of clear linear relationships between 2200 W and Al(VI), Mg and Si, and care is needed when interpreting spectral signatures using traditional interpretations (e.g., paragonite between 2180 and 2195 nm, muscovite between 2195 and 2215 nm, and phengite between 2215 and 2225 nm). Traditional interpretations should only be used in true muscovite series white mica with sum I > 0.95. It is recommended that a statistically representative subset of white mica from each area studied should be analysed using EPMA to obtain sum I and to facilitate more robust interpretations of real time spectral data.
6.2. Spectral Signature of Chlorite
The chlorites analysed in this study record similar spectral relationships to those observed in previous studies (e.g., [6,7,34]) with trioctahedral chlorite recording negative correlations between 2250 W and Mg and Mg number, and positive correlations between 2250 W and Fe, Al(VI), and Si (Figure 7). This study shows that dioctahedral chlorites (sudoite, cookeite and donbassite) have a different spectral response, recording negative correlations between 2250 W and Al(VI) and Mg number, and positive correlations between 2250 W and Mg and Fe. This shows that traditional spectral interpretation can be used on trioctahedral chlorite, regardless of the subtype, but cannot be used for dioctahedral chlorite. In addition, dioctahedral chlorite has a 2200 nm absorption feature that may affect correct mineral identification in samples containing more than one infrared responsive mineral. Fe and Mg# are the only shared feature between both types of chlorite and this suggests that the current interpretation nomenclature of Mg-rich, intermediate and Fe-rich chlorite should only be used for trioctahedral chlorite (clinochlore, sheridanite, chamosite and ripidolite). It is recommended that chlorites with spectral signatures between 2240–2249 nm should be identified as Fe-poor, as high Mg# or Mg-chlorite is erroneous when trioctahedral chlorite is present.
7. Conclusions
This study demonstrates that the spectral signature of white mica is more complex than previously interpreted and shows that in addition to the Tschermak substitution, the sum of interlayer cations is also important in determining the wavelength position of the 2200 nm absorption feature. With an increase in interlayer deficiency, the slope of the trend between 2200 W and Mg, Al(VI) and Si decreases due to the progressive Mg and Si enrichment during illitization. This shift in the trend implies that white micas with similar chemistry but different interlayer deficiency can have variable 2200 W, and that white mica with variable chemistry may have similar 2200 W. It is recommended that spectral reflectance studies on white mica are accompanied by a subset of EPMA result on various mineral species. It is recommended that a minimum of 30 EPMA analyses of each mineral type be obtained for a statistically robust verification of spectral results and to provide guidance on the expected trends between 2200 W and the interlayer cation distributions. It is possible that EPMA analysis will also assist in separating background mineralogical variations from alteration processes, thus potentially aiding with vectoring within a given mineral deposit. Although not the scope of this study, no paragonite was identified even though 2200 W values shorter than 2195 nm were observed. We recommend that the spectral nomenclature of white mica be updated from paragonite to Na-bearing muscovite when the 2200 W absorption feature is between 2180 and 2195 nm. More studies are needed to fully characterize the spectral response of paragonite and white mica with 2200 W absorption features below 2195 nm. Lastly, we demonstrate that the current nomenclature of white mica should only be used for white mica with sum I > 0.95 and cannot be used for white mica with sum I < 0.95.
The spectral signature of trioctahedral chlorite (clinochlore, sheridanite, chamosite and ripidolite) appears to record similar spectral relationships to those observed in previous studies (e.g., [6,7,34]). However, dioctahedral chlorite (sudoite, cookeite and donbassite) has a different spectral response with Mg increasing with 2250 W, which is the opposite of trioctahedral chlorite. This demonstrates that the traditional spectral interpretation should only be used for trioctahedral chlorite, regardless of the subtype. It is recommended that chlorites with spectral signatures between 2240 and 2249 nm should be identified as Fe-poor, as high Mg# or Mg-chlorite can be misleading when trioctahedral chlorite is present.
Author Contributions
Conceptualization, J.C.; methodology, J.C., S.J.P. and J.H.; formal analysis, J.C.; writing—original draft preparation, J.C.; writing—review and editing, J.C., S.J.P. and J.H. All authors have read and agreed to the published version of the manuscript.
Funding
Financial support for this project was provided by the Centre for Ore Deposits and Earth Science (CODES). Stephen Piercey and his research program is also funded by an NSERC Discovery Grant.
Acknowledgments
The manuscript benefited from constructive reviews by David Green from Mineral Resource Tasmania.
Conflicts of Interest
The authors declare no conflict of interest.
References
- Ridley, J. Ore Deposit Geology; Cambridge University Press: Cambridge, UK, 2013; 398p. [Google Scholar]
- Robb, L. Introduction to Ore-Forming Processes; Blackwell Science, Ltd.: Oxford, UK, 2013; 373p. [Google Scholar]
- Cloutier, J.; Piercey, S.J. Tracing Mineralogy and Alteration Intensity Using the Spectral Alteration Index and Depth Ratios at the Northwest Zone of the Lemarchant Volcanogenic Massive Sulfide Deposit, Newfoundland, Canada. Econ. Geol. 2020, 115, 1055–1078. [Google Scholar] [CrossRef]
- Clark, R.N.; King, T.V.V.; Klejwa, M.; Swayze, G.A.; Vergo, N. High spectral resolution reflectance spectroscopy of minerals. J. Geophys. Res. 1990, 95, 12653–12680. [Google Scholar] [CrossRef]
- Post, J.L.; Noble, P.L. The near-infrared combination band frequencies of dioctahedral smectites, micas and illites. Clays Clay Miner. 1993, 41, 639–644. [Google Scholar] [CrossRef]
- Pontual, S.; Merry, N.; Gamson, P. G-Mex Volume l: Spectral Interpretation Field Manual; Ausspec International, Pty. Ltd.: Arrowtown, New Zealand, 1997. [Google Scholar]
- Scott, K.M.; Yang, K. Spectral Reflectance Studies of White Micas; CSIRO/AMIRA Project P435, Report 439R; Australian Mineral Industries Research Association, Ltd.: Parkville, Australia, 1997; 35p. [Google Scholar]
- Scott, K.M.; Yang, K.; Huntington, J.F. The Application of Spectral Reflectance Studies of Chlorites in Exploration; CSIRO/AMIRA Project P435A, CSIRO Exploration and Mining Report P545R; North Ryde NSW: Sydney, Australia, 1998; 88p. [Google Scholar]
- Herrmann, W.; Blake, M.; Doyle, M. Short Wavelength Infrared (SWIR) Spectral Analysis of Hydrothermal Alteration Zones Associated with Base Metal Sulfide Deposits at Rosebery and Western Tharsis, Tasmania, and Highway-Reward, Queensland. Econ. Geol. 2001, 96, 939–955. [Google Scholar] [CrossRef]
- Buschette, M.J.; Piercey, S.J. Hydrothermal alteration and lithogeochemistry of the Boundary volcanogenic massive sulphide deposit, central Newfoundland, Canada. Can. J. Earth Sci. 2016, 53, 506–527. [Google Scholar] [CrossRef]
- Ross, P.-S.; Bourke, A.; Schnitzler, N.; Conly, A. Exploration Vectors from Near Infrared Spectrometry near the McLeod Volcanogenic Massive Sulfide Deposit, Matagami District, Québec. Econ. Geol. 2019, 114, 613–638. [Google Scholar] [CrossRef]
- Rieder, M.; Cavazzini, G.; D’Yakonov, Y.S.; Frank-Kamenetskii, V.A.; Gottardi, G.; Guggenheim, S.; Koval, P.V.; Müller, G.; Neiva, A.M.R.; Radoslovich, E.W.; et al. Nomenclature of the micas. Miner. Mag. 1999, 63, 267–279. [Google Scholar] [CrossRef]
- Tischendorf, G.; Förster, H.-J.; Gottesmann, B.; Rieder, M. True and brittle micas: Composition and solid-solution series. Miner. Mag. 2007, 71, 285–320. [Google Scholar] [CrossRef]
- Deer, W.A.; Howie, R.A.; Zussman, J. An Introduction to the Rock-Forming Minerals; Longman Group Limited: London, UK, 1992; 696p. [Google Scholar]
- Zane, A.; Weiss, Z. A procedure for classifying rock-forming chlorites based on microprobe data. Rend. Lincei Sci. Fis. Nat. 1998, 9, 51–56. [Google Scholar] [CrossRef]
- Meunier, A. Argiles; Contemporary Publishing International—GB Science Publisher: Paris, France, 2003; 433p. [Google Scholar]
- Wiewióra, A.; Weiss, Z. Crystallochemical classifications of phyllosilicates based on the unified system of projection of chemical composition: II. The chlorite group. Clay Miner. 1990, 25, 83–92. [Google Scholar] [CrossRef]
- Farmer, V.C. The Infrared Spectra of Minerals; Mineralogical Society: London, UK, 1974; 539p. [Google Scholar]
- Hunt, G.R. Spectral signatures of particulate minerals in the visible and near infrared. Geophysics 1977, 42, 501–513. [Google Scholar] [CrossRef]
- Clark, R.N. Spectroscopy of Rocks and Minerals, and Principles of Spectroscopy. In Remote Sensing for the Earth Sciences: Manual of Remote Sensing, 3rd ed.; Rencz, A.M., Ed.; Wiley: New York, NY, USA, 1999; Chapter 1; Volume 3, 728p. [Google Scholar]
- Swayze, G.A.; Clark, R.N.; Goetz, A.F.; Livo, K.E.; Breit, G.N.; Kruse, F.A.; Sutley, S.J.; Snee, L.W.; Lowers, H.A.; Post, J.L.; et al. Mapping Advanced Argillic Alteration at Cuprite, Nevada, Using Imaging Spectroscopy. Econ. Geol. 2014, 109, 1179–1221. [Google Scholar] [CrossRef]
- Vedder, W.; McDonald, R.S. Vibrations of the OH Ions in Muscovite. J. Chem. Phys. 1963, 38, 1583–1590. [Google Scholar] [CrossRef]
- Slonimskaya, M.V.; Besson, G.; Dainyak, L.G.; Tchoubar, C.; Drits, V.A. Interpretation of the IR spectra of celadonites and glauconites in the region of OH-stretching frequencies. Clay Miner. 1986, 21, 377–388. [Google Scholar] [CrossRef]
- Robert, J.-L.; Kodama, H. Generalization of the correlations between hydroxyl-stretching wavenumbers and composition of micas in the system K2O–MgO–Al2O3–SiO2–H2O: A single model for trioctahedral and dioctahedral mica. Am. J. Sci. 1988, 288, 196–212. [Google Scholar]
- Besson, G.; Drits, V.A. Refined relationships between chemical composition of dioctahedral fine-dispersed mica minerals and their infrared spectra in the OH stretching region. Part I. Identification of the stretching bands. Clays Clay Miner. 1997, 45, 158–169. [Google Scholar] [CrossRef]
- Besson, G.; Drits, V.A. Refined relationship between chemical composition of dioctahedral fine-dispersed mica minerals and their infrared spectra in the OH stretching region. Part II. The main factors affecting OH vibration and quantitative analysis. Clays Clay Miner. 1997, 45, 170–183. [Google Scholar] [CrossRef]
- Martínez-Alonso, S.; Rustad, J.R.; Goetz, A.F. Ab initio quantum mechanical modeling of infrared vibrational frequencies of the OH group in dioctahedral phyllosilicates. Part II: Main physical factors governing the OH vibrations. Am. Miner. 2002, 87, 1224–1234. [Google Scholar] [CrossRef]
- Bookin, A.S.; Drits, V.A. Factors affecting orientation of OH vector in mica. Clays Clay Miner. 1982, 30, 415–421. [Google Scholar] [CrossRef]
- Redhammer, G.J.; Beran, A.; Schneider, J.; Amthauer, G.; Lottermoser, W. Spectroscopic and structural properties of synthetic micas on the annite- siderophyllite binary: Synthesis, crystal structure refinement, Mössbauer, and infrared spectroscopy. Am. Mineral. 2000, 85, 449–465. [Google Scholar] [CrossRef]
- Duke, E.F. Near infrared spectra of muscovite, Tschermak substitution, and metamorphic reaction progress: Implications for remote sensing. Geology 1994, 22, 621–624. [Google Scholar] [CrossRef]
- Duke, E.F.; Lewis, R.S. Near infrared spectra of white mica in the Belt Supergroup and implications for metamorphism. Am. Miner. 2010, 95, 908–920. [Google Scholar] [CrossRef]
- van Ruitenbeek, F.J.A.; Cudahy, T.; Hale, M.; van der Meer, F.D. Tracing fluid pathways in fossil hydrothermal systems with near-infrared spectroscopy. Geology 2005, 33, 597–600. [Google Scholar] [CrossRef]
- Kokaly, R.F.; Clark, R.N.; Swayze, G.A.; Livo, K.E.; Hoefen, T.M.; Pearson, N.C.; Wise, R.A.; Benzel, W.M.; Lowers, H.A.; Driscoll, R.L.; et al. USGS Spectral Library Version 7: U.S. Geological Survey Data Series 1035; U.S. Geological Survey: Reston, VA, USA, 2017; 61p. [CrossRef]
- McLeod, R.L.; Gabell, A.R.; Green, A.A.; Gardavsky, V. Chlorite infrared spectral data as proximity indicators of volcanogenic massive sulphide mineralization. In Proceedings of the Pacific Rim Congress ’87, Gold Coast, QLD, Australia, 26–29 August 1987; pp. 321–324. [Google Scholar]
- Zhang, G.; Wasyliuk, K.; Pan, Y. The characterization and quantitative analysis of clay minerals in the athabasca basin, saskatchewan: Application of shortwave infrared reflectance spectroscopy. Can. Miner. 2001, 39, 1347–1363. [Google Scholar] [CrossRef]
- Percival, J.B.; Bosman, S.A.; Potter, E.G.; Peter, J.M.; Laudadio, A.B.; Abraham, A.C.; Shiley, D.A.; Sherry, C. Customized Spectral Libraries for Effective Mineral Exploration: Mining National Mineral Collections. Clays Clay Miner. 2018, 66, 297–314. [Google Scholar] [CrossRef]


Publisher’s Note: MDPI stays neutral with regard to jurisdictional claims in published maps and institutional affiliations. |
© 2021 by the authors. Licensee MDPI, Basel, Switzerland. This article is an open access article distributed under the terms and conditions of the Creative Commons Attribution (CC BY) license (https://creativecommons.org/licenses/by/4.0/).