Article

Application of Fluid Inclusions to Petroleum Basin Recognition—A Case Study from Poland

by
Katarzyna Jarmołowicz-Szulc
Department for Regional Geology, Polish Geological Institute-National Research Institute, Rakowiecka 4, 00-975 Warsaw, Poland
Minerals 2021, 11(5), 500; https://doi.org/10.3390/min11050500
Submission received: 10 March 2021 / Revised: 4 May 2021 / Accepted: 6 May 2021 / Published: 9 May 2021

Abstract

:
Fluid inclusions were studied in rocks from different wells from the Barnówko–Mostno–Buszewo (BMB), the largest oil field in Poland and from the Lubiatów field. Sampling was performed at depths between about 3120–3220 m and 3221–3256 m, respectively. Different minerals (dolomite, calcite, anhydrite, quartz) reveal the presence of aqueous (AQFI) and hydrocarbon (HCFI) inclusions, the differentiation of which was checked by UV fluorescence and microthermometry. Inclusions occur in different abundances and are of variable character. The microthermometric studies of fluid inclusions resulted in the determination of temperatures of eutectic melting, ice melting, and homogenization. Based on the results obtained, three types of inclusions have been found. Two-phase non-fluorescent inclusions (AQFI) contain brines of differentiated salinity (from about 6 to 10 and from about 17 to 22 wt% NaCl equivalent). Two-phase fluorescent inclusions (HCFI 1) contain light mature oil of paraffin character. The oil is characterized by API gravity of about 41–42 degrees. Small one-phase non-fluorescent inclusions (HCFI 2) that homogenize in deep freezing contain methane with admixtures. The abundance of inclusions varies, depending on the mineral or well. They have been discussed in the context of hydrocarbon migration and accumulation.

1. Introduction

For many years, the Zechstein Main Dolomite (Ca2) has been the object of studies and search for hydrocarbons in Poland (e.g., [1,2,3,4,5,6]). In this carbonate level, numerous small oil and gas fields have been discovered in the Gorzów Block in western Poland. Drillings conducted from 1992 in the western part of the Gorzów Block resulted in the discovery of the Barnówko–Mostno–Buszewo (BMB) oil and gas field in the Ca2 level. The field was previously interpreted as three separated structures in the Ca2 [2]. The later drilling, seismic imaging, and well log surveys, showed that the Ca2 consists of one oil-gas field with an extension of about 32 km2 and three culminations called BMB [3]. According to [7], the gas accumulation (so-called the gas cap) occurs in the field at the depth of 2990 to 3047.5 m, while the oil is present deeper—between 3047.5 and 3107 m.
Carbonates of the Ca2 are the reservoir rocks ranging in thickness from 33 to 83.5 m. Barrier sediments occur at the Barnówko and Mostno culminations, while lagoonal sediments are present at the Buszewo culmination (Figure 1). Both types of dolomite display good reservoir properties with a porosity in the interval of 8–14% [4,5,6,8].
Recognition of the Zechstein basin until the end of the 20th century resulted in the determination of the extent of the carbonate platform, platform slope, and the basin plain [9,10]. A predominance of marine-algal, oil-forming type of kerogen was found in all Zechstein carbonate series, i.e., in the Zechstein limestone and in the Main Dolomite and the Platy Dolomite [6]. Detailed geochemical research has proven that hydrocarbons accumulated in the Ca2 in the Pomeranian area formed during the initial phase of the thermogenic stage from the source organic matter related to the same stratigraphic level. A microbial origin of hydrocarbons has been discussed recently [11,12].
Isotopic analyses of methane and propane in the Carboniferous and Permian limestones in the Polish Lowlands have shown that these hydrocarbons formed during high-temperature alteration of terrestrial organic matter [13,14]. As detected in the gas from the Paproć gas field, nitrogen shows mantle signatures and is probably of abiogenic origin [14,15]. On the other hand, the natural gas accumulated in the Ca2 deposits can be related to the low temperature stage of thermogenic alteration of sapropel organic matter [13].
The aim of the present paper is to show the application and the importance of fluid inclusion studies in the context of petroleum basins and systems on the example of the largest Polish oil and gas field—the BMB field. Microthermometric results obtained may be further used for an intensive modeling of the basin.

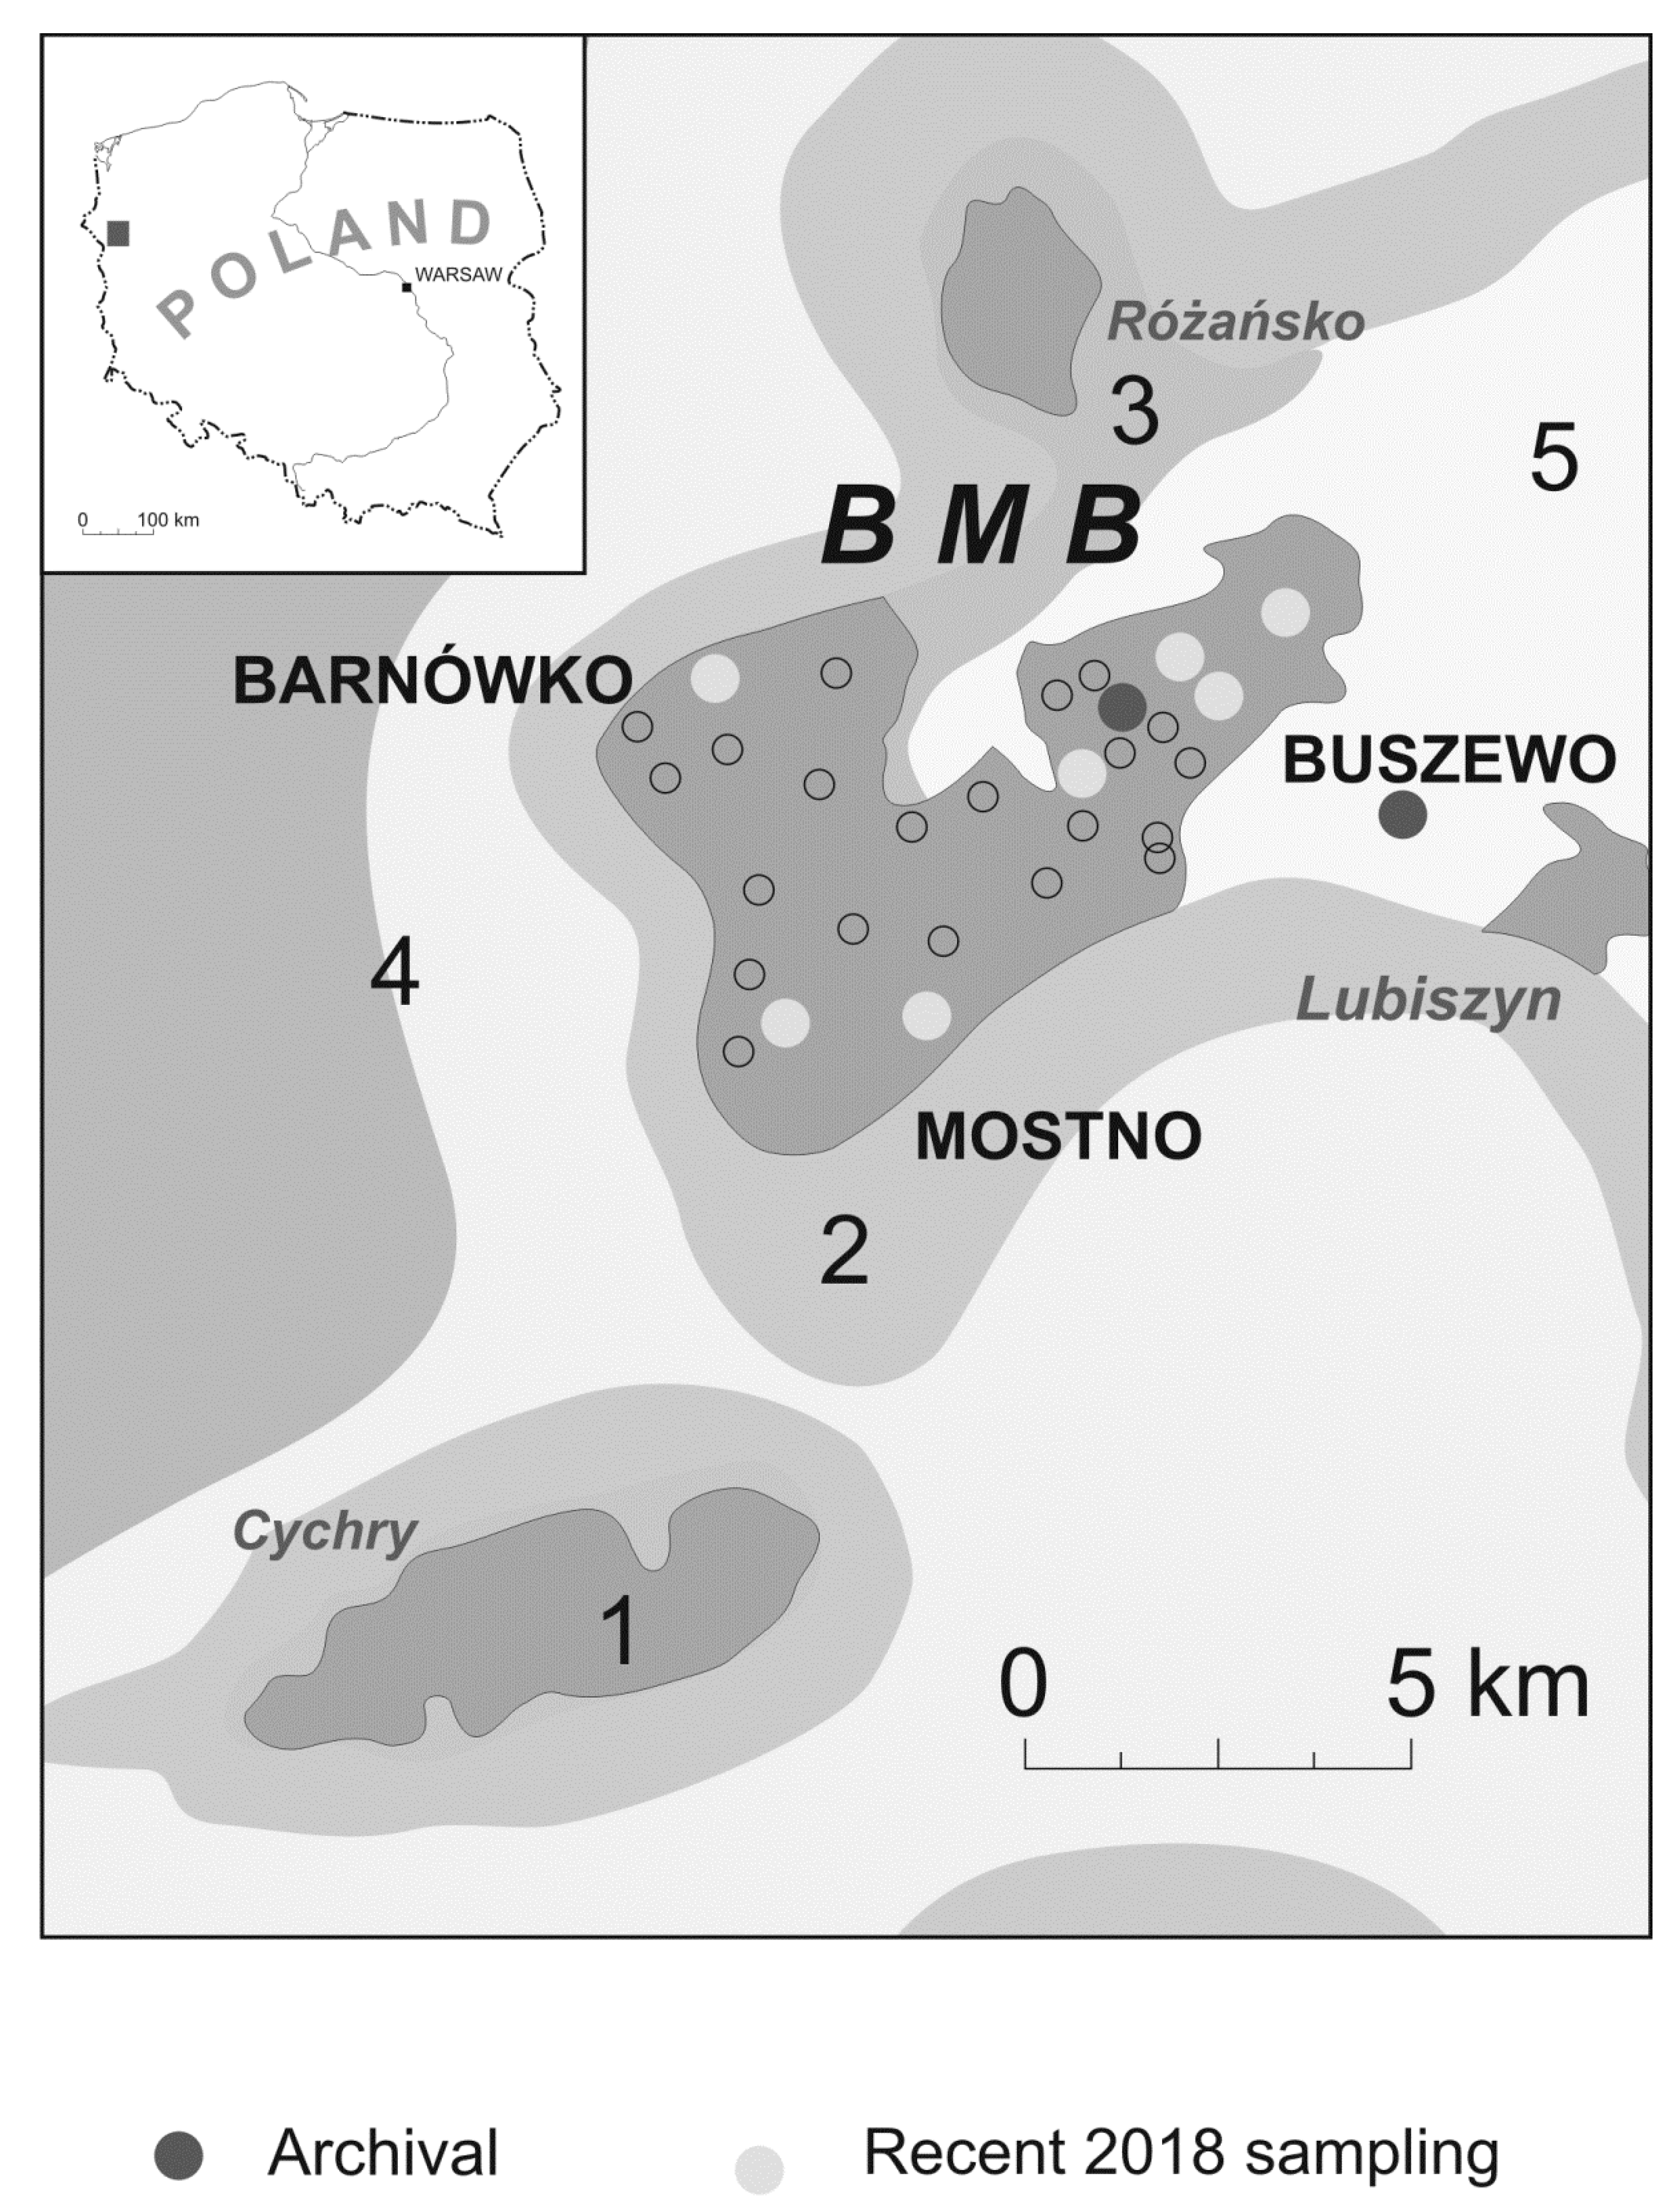
2. Geological and Lithological Setting

The study area is located near Gorzów Wielkopolski in the western part of the Wolsztyn Ridge in the BMB field. The oil-gas field is situated at the slope of the Ca2 carbonate platform [16] (Figure 1). The geological conditions and the sedimentation sequence for the area have been presented in a number of papers bibliography, e.g., [6,12,16]. Four deposition intervals of the Main Dolomite have been described: 1. deep-marine interval—represented by dark grey limestone, highly clayey and sometimes slightly dolomitic (clayey mudstone facies); 2. front barrier interval—found at the foot of a sulfate platform slope of cyclothem PZ1 (carbonates characterized by alternating limestones and dolomites with dolomites dominating; dolomites of grainstone or packstone fabric [1]; 3. barrier interval—a border between the open sea and the lagoon (dolomite); 4. lagoon interval—the facies usually separated from the sea by a carbonate barrier.
From the lithological point of view, three levels and facies can be distinguished in the study area [6,8]. Crystalline dolomites represent level A in the lowest part of Ca2, where highly developed processes of recrystallization, dissolution, and anhydritization obliterated primary structural and textural features. Occasionally, oncolitic and intraclastic relics can be found. In the lowest part, thin anhydrite stringers with bitumen-containing microstylolites occur. The level B in the middle part of Ca2 is formed as knobby-oncolitic grainstones, organodetrital grainstones, and knobby-oncolitic mudstones, which are slightly impregnated with anhydrite, and oncolitic grainstones with numerous intraclasts. The Level C in the upper part of Ca2 is represented by (1) recrystallized organodetrital oolitic to intraclastic grainstones with a considerable amount of vadose cement; (2) oolitic to peloidal packstones with well visible vadose cements; (3) algal and laminar biolothites; and (4) biolaminar ooids with abundant anhydrite impregnation. Dissolution of carbonates and secondary sulfate cements are common. The C level exhibits a very strong influence from vadose processes resulting in cements and vadose coats. These features obliterate the primary structures and textures of the rock [1].

3. Materials and Methods

3.1. Sampling

The samples were taken in the PGNiG archives core-shed in Chmielnik from the following wells: B 9, Bu10k, B 11, B 12, B 13, B 16, B 17, and Ba 7, i.e., those located in the western and eastern parts of the BMB field (Figure 1), and from the SG1 well. The sampling was done from drilling cores from depths between 3126.3 and 3141.35 m (B 9, B11, B 13, B 16), 3210.90–3213.75 (Bu10k) and at 3121.6 m (Ba 7) by Depowska [4], and by Jasionowski (SG1). More recently, the author herself collected 50 samples from selected BMB wells (Mo 1, Mo 6; B 5, B 9, B 17; Ba 7).

3.2. Analytical Methods

In total, 30 thick sections were prepared for fluid inclusion studies using one of two techniques described by Jarmołowicz-Szulc [18]. Rock fragments were glued on the glass slides and step-wise polished from both sides. They were analyzed using freezing–heating Fluid Inc. System. Another group of samples as unglued two-sided polished thin wafers was analyzed at a Linkam stage. General microscopic observations were conducted applying a polarization microscope both in transmitted and reflected lights. The following steps were performed: microscopic analysis of fluid inclusions (Leitz Orthoplan), fluorescence studies and microphotography (Nikon polarization microscope equipped in UV device, prod. Nikon, Japan), cathodoluminescence (CL) studies on rock wafers. Glass and wafer cutting followed the preliminary steps described above, so that the samples could fit the freezing–heating stages. Microthermometric analyses were calibrated against melting temperatures of pure chemicals and phase transitions in synthetic fluid inclusions (Synflinc standards, manual, [19]). The uncertainty limits of freezing-heating modes are 0.2 °C below −100 °C, 0.1 °C between −100 °C, and +100 °C and 1 °C above 100 °C until the equipment’s temperature threshold. CL analyses were conducted using hot cathode in conditions of 400 μA and 12kV.
The fluorescence of hydrocarbons was induced in ultraviolet range in the plates prepared for fluid inclusion microthermometric studies and observed both in the transmitted and the reflected lights. The long wavelength light (368 nm) was provided by the 1200 W mercury lamp and a set of filters. Isochores were calculated using the programs available from [20,21,22]. Based on isochore data, graphs of selected brine-hydrocarbon chemical systems were constructed aiming at estimation of pressure–temperature trapping conditions (PT).
Comparative geochemical analyses were performed for three samples aiming at determination of the bitumen character [23]. Extraction of extractable organic matter was conducted being followed by fractional separation to saturated and aromatic fractions, resins, and asphaltenes. Gas Chromatography-Mass Spectrometer analyses were conducted aiming at determination of biomarker composition. Mass spectrograms of aromatic and saturated fractions were further computed in terms of identification of: hopanes (m/z = 191), steranes (m/z = 217), naphthalene compounds (m/z = 142, m/z = 156, m/z = 170), phenanthrene compounds (phenanthrene and its methyl derivates, m/z = 178, m/z = 192), sulfur compounds (methylodibenzotiophenes m/z = 198), and triaromatic steroids (m/z = 231). Detailed methodology is presented in the papers of INiG in Cracow (e.g., [24]), while interpretation of results was conducted based on bibliography, e.g., [25,26].

4. Results

Detailed lithological studies were conducted in the BMB area by several authors at the end of the 20th century and the results are presented in, e.g., [1,27,28].
The following minerals occur in the BMB rocks: dolomite, calcite, quartz, anhydrite, and fluorite in form of grains or cements, being the object of the present studies. Fluid inclusions were studied in these minerals based on the petrographic in descriptions of [4,29,30], on recent petrologic results of Kuberska and Kozłowska in collaboration with the author as well [31]. Present petrographic observations conducted using a polarizing microscope prior to the microthermometric studies are presented below. CL studies on the thin sections followed microthermometry. Petrographic results are shown in Figures 2 and 3. The results of microthermometric determinations are presented in Table 1 and introduced to Figure 3.
Photomicrographs arranged in plates show the fluorescence of hydrocarbon inclusions and non-fluorescent individuals (Figure 4). Other results are presented in the histograms and plates (Figures 5 and 6).

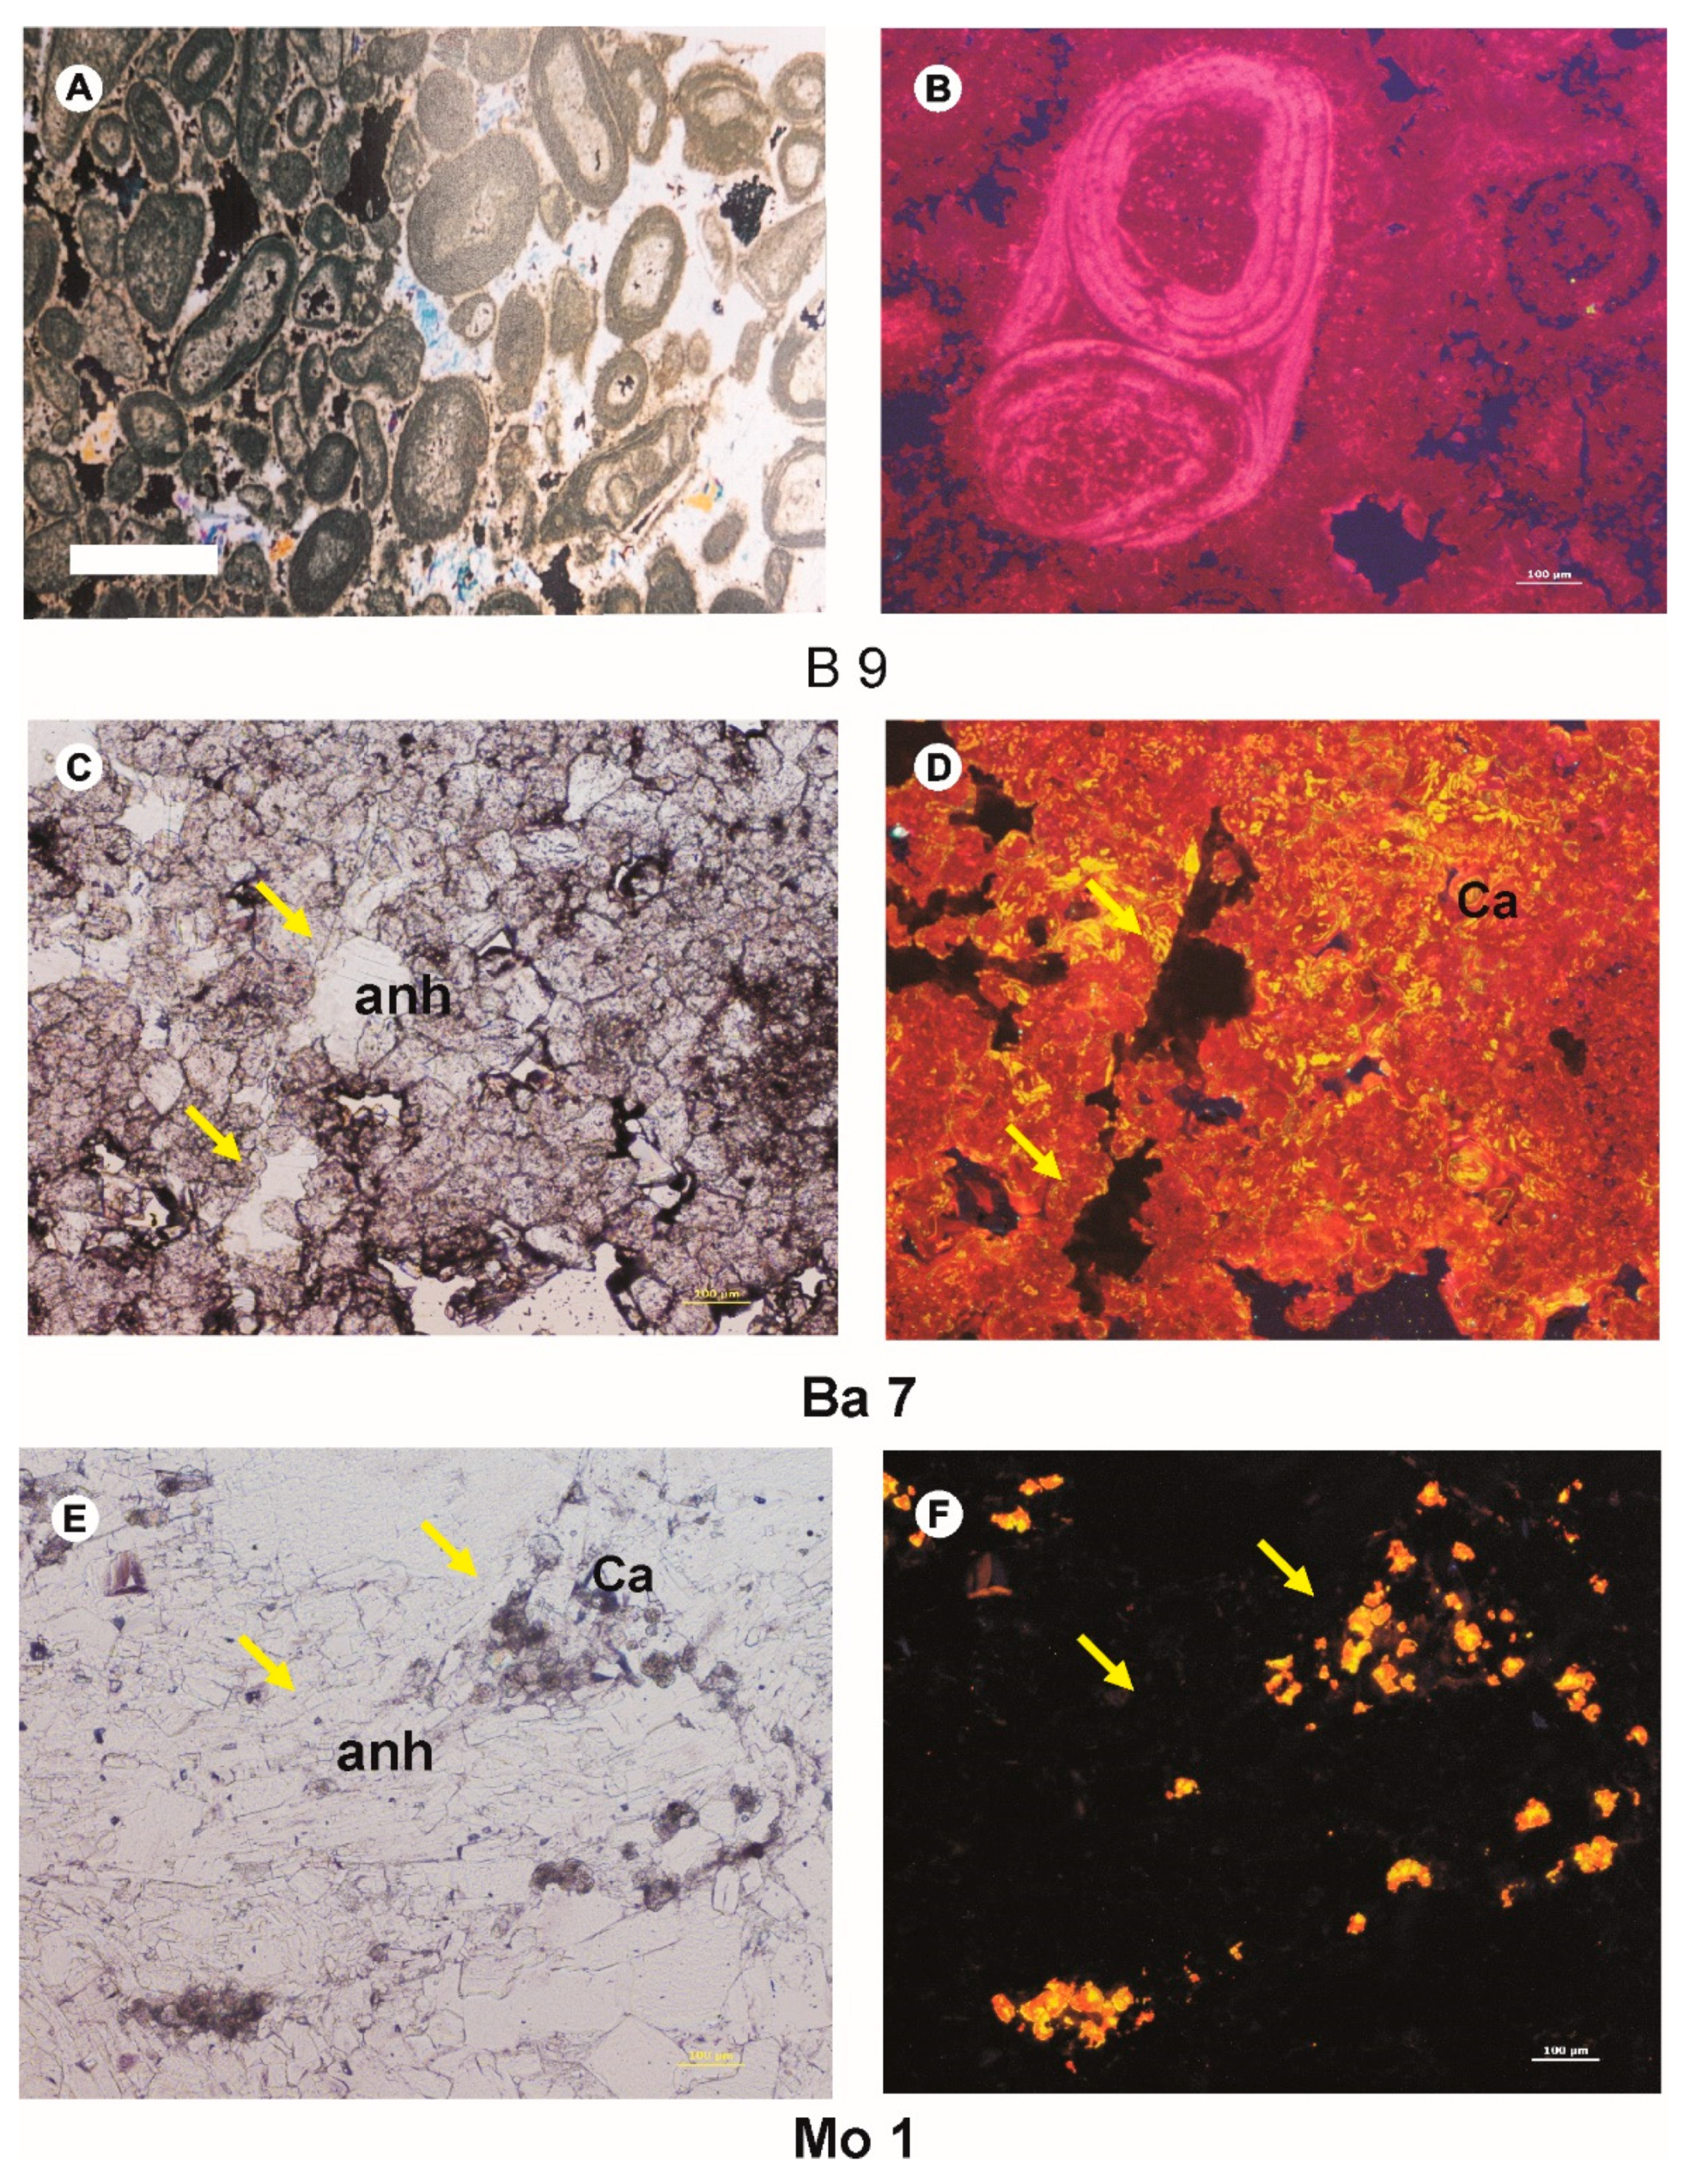
4.1. Description of Rocks

Rocks present in the geological section of the selected wells belong to Main Dolomite (Ca2)—[4,29]. Macroscopically they are micritic dolomites, partly ooidal-sparry, grey to beige with occasional layers of clay minerals, and abundant laminae of white anhydrite. In general. They are recrystallized packstones and grainstones. The examples of the rocks are shown in Figure 2.
As it is seen in the figure, the dolomite, e.g., the ooid grainstone is built of calcite ooids displaying concentric and radial structures. Sometimes, bioclasts form a core of ooids. Ooids are built of micrite and calcite microsparite with rims of drusal calcite (well seen in CL images). They are cemented by sparitic Mn-calcite, occasionally by anhydrite. Occasionally, anhydrite is present in veinlets and aggreagates.
Another type of dolomite, oncoid grainstones are built of oncoids, the majority of which is recrystallized. Primary oncoids were most probably built of calcite (violet in CL image). Oncoids are cemented by microsparr or dolomitic spar. A part of the pore space is filled with a tabular anhydrite (black in CL). Small intragranular and intergranular space is partly filled by kaolinite (blue in CL).

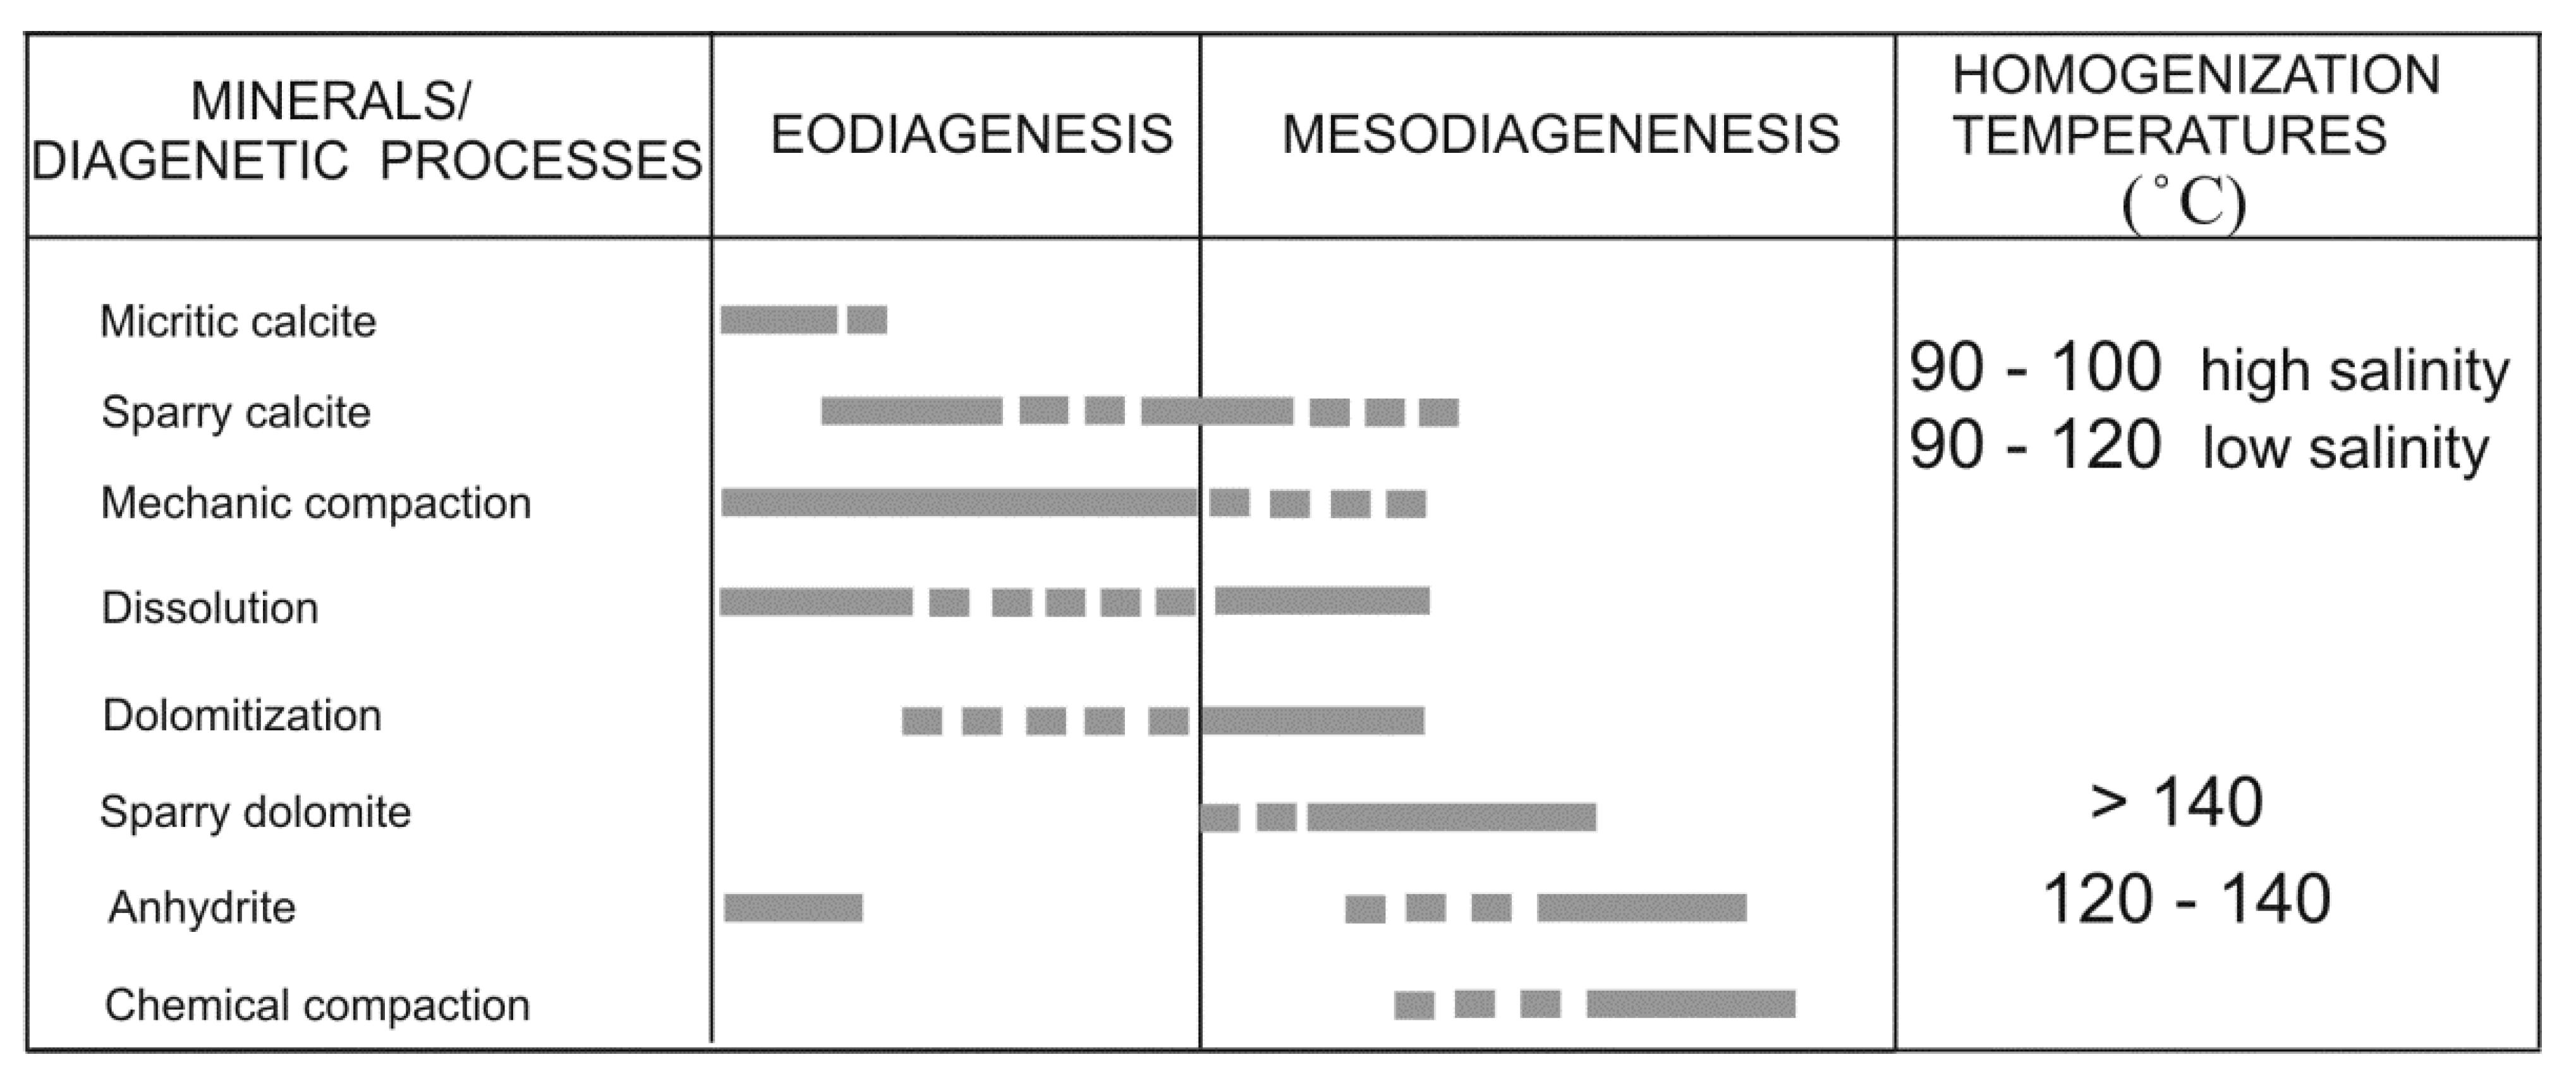
4.2. Diagenetic History

Based on the petrographic investigations, a general diagenetic history can be reconstructed. Calcite, dolomite, and anhydrite are main minerals which build the rocks under research. Their cementation occurred in several stages that results in some generations of these minerals (Figure 3). The eo- and mesodiagenesis can be distinguished. Micritic, drusal, and rim calcite cements are the early cements. Sparry and blocky cements (calcite, dolomite, and anhydrite) that fill empty pore space and microfissures form at later stages. The dolomitic rocks are most probably a product of dolomitization of limestones. Dissolution of cements and carbonatic grains was another important diagenetic process resulting in intragranular and intergranular voids. Effects of mechanical and chemical compaction are observed too.

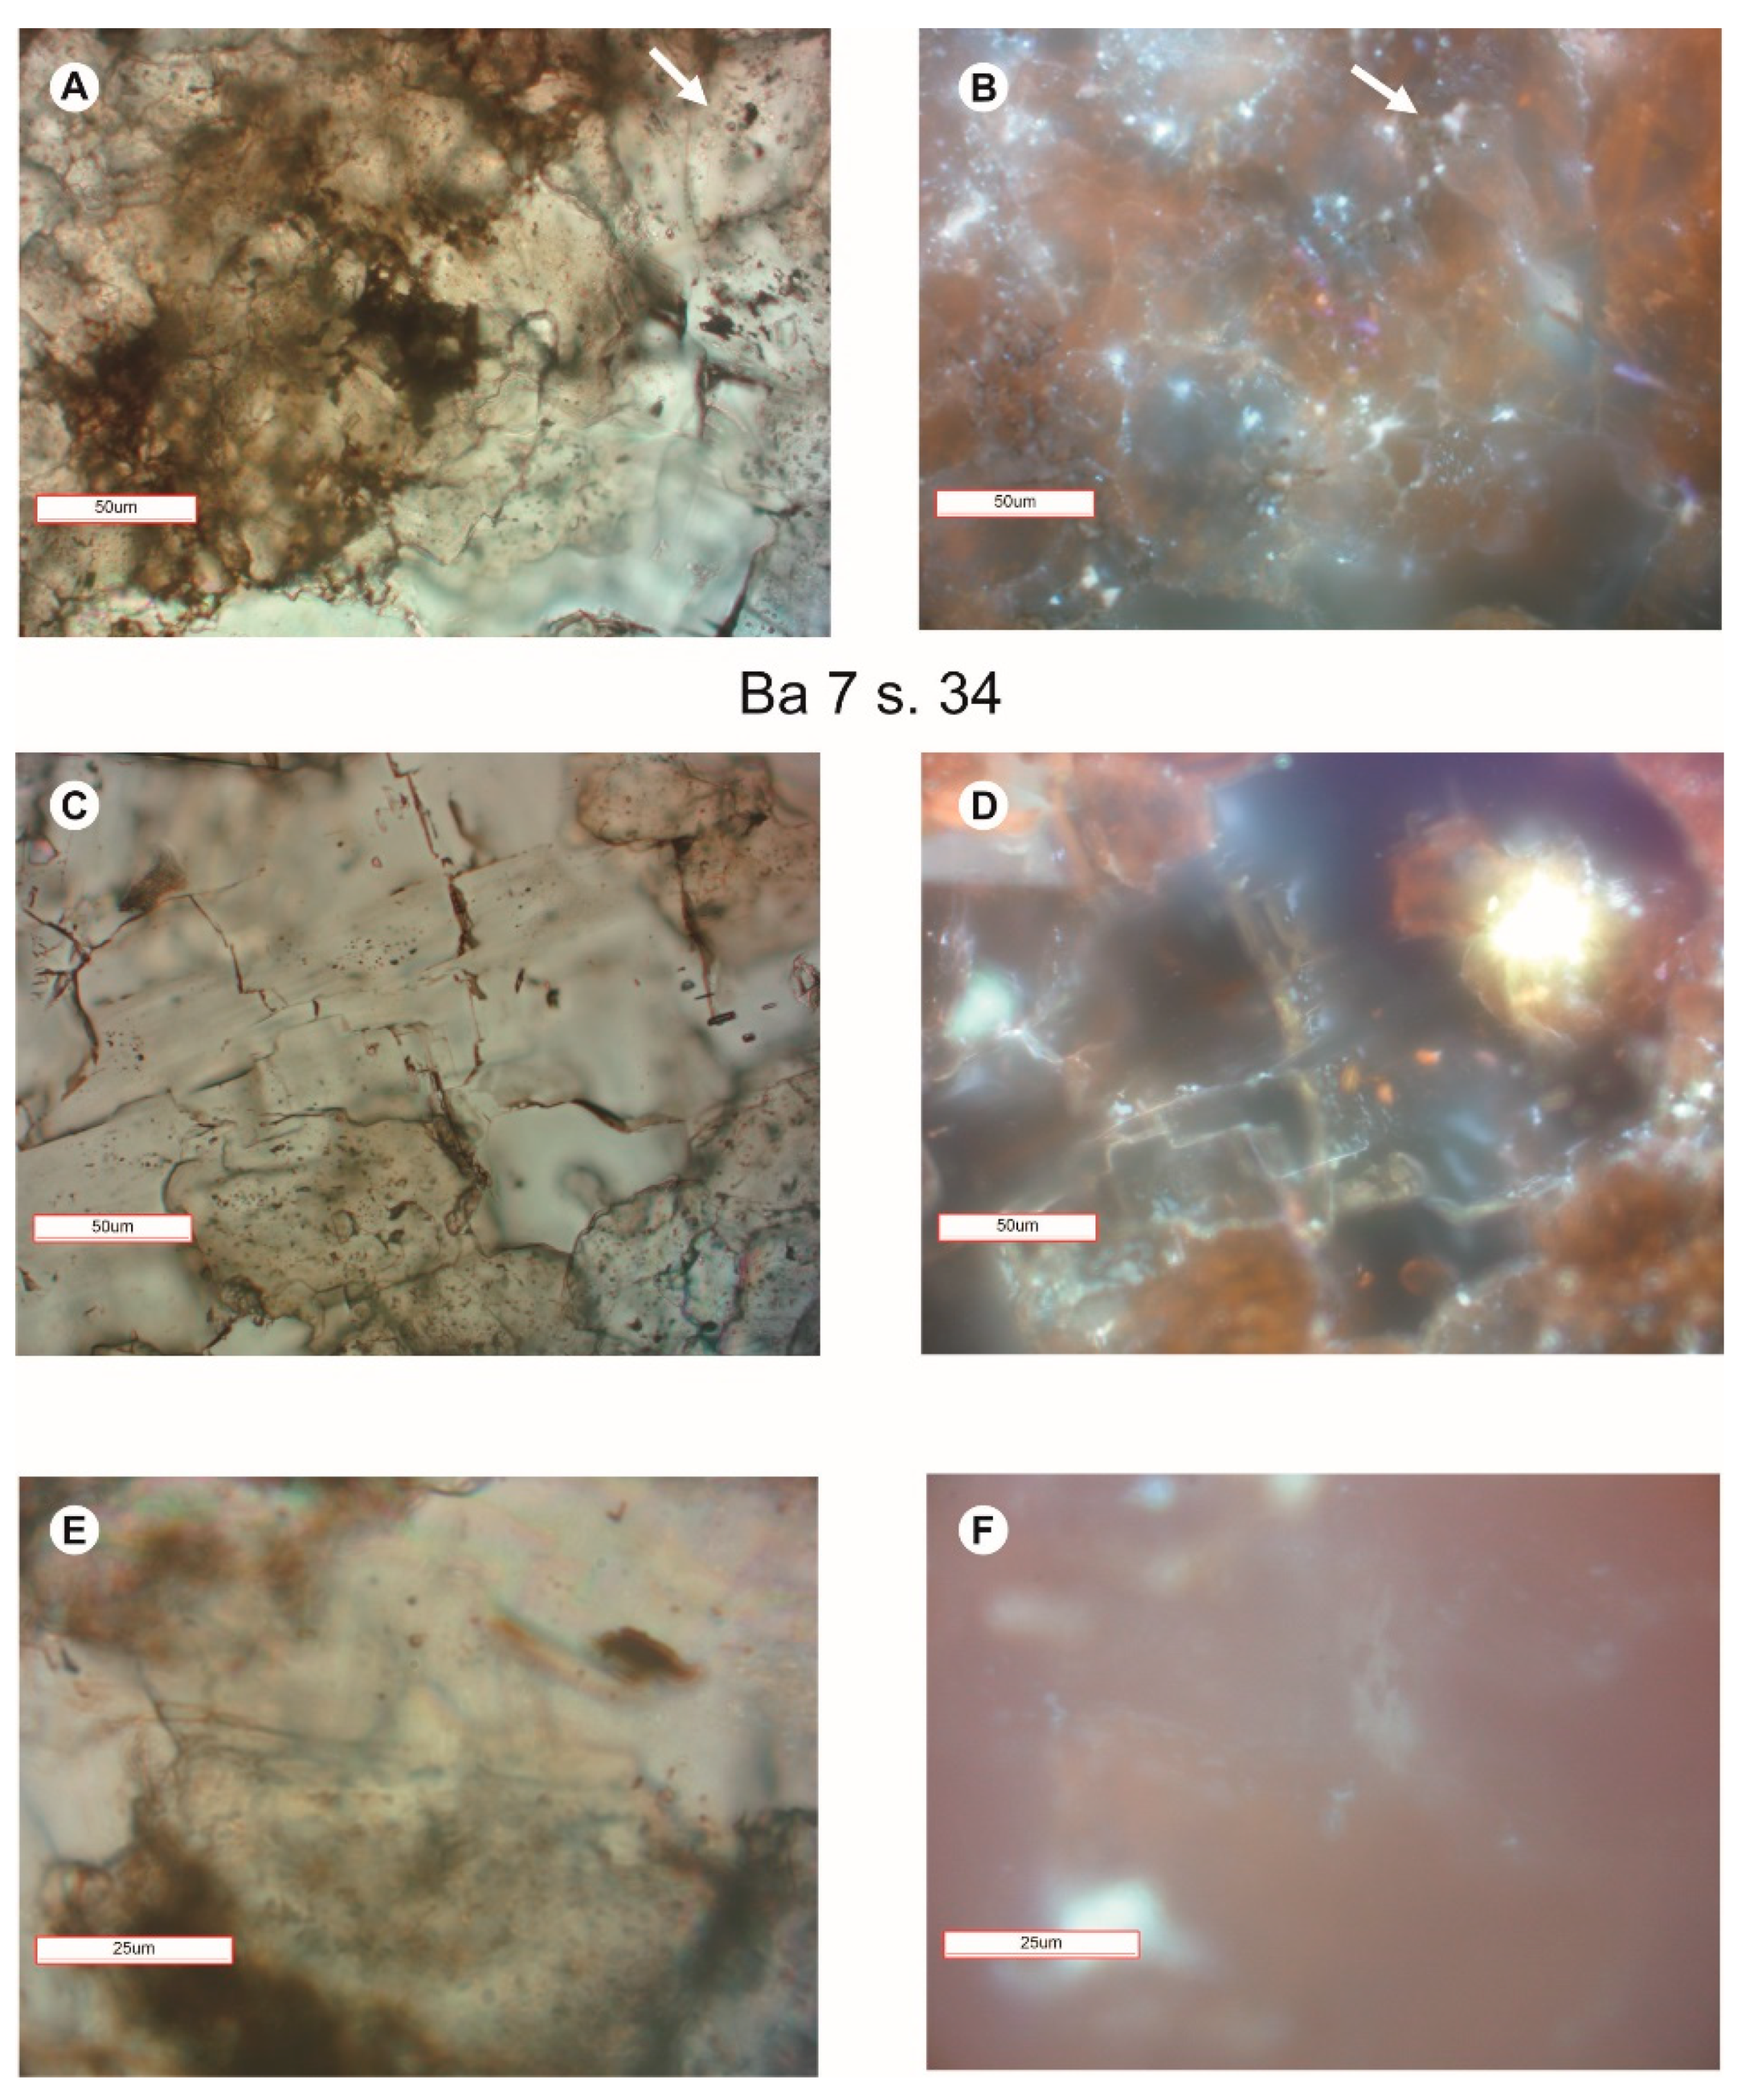
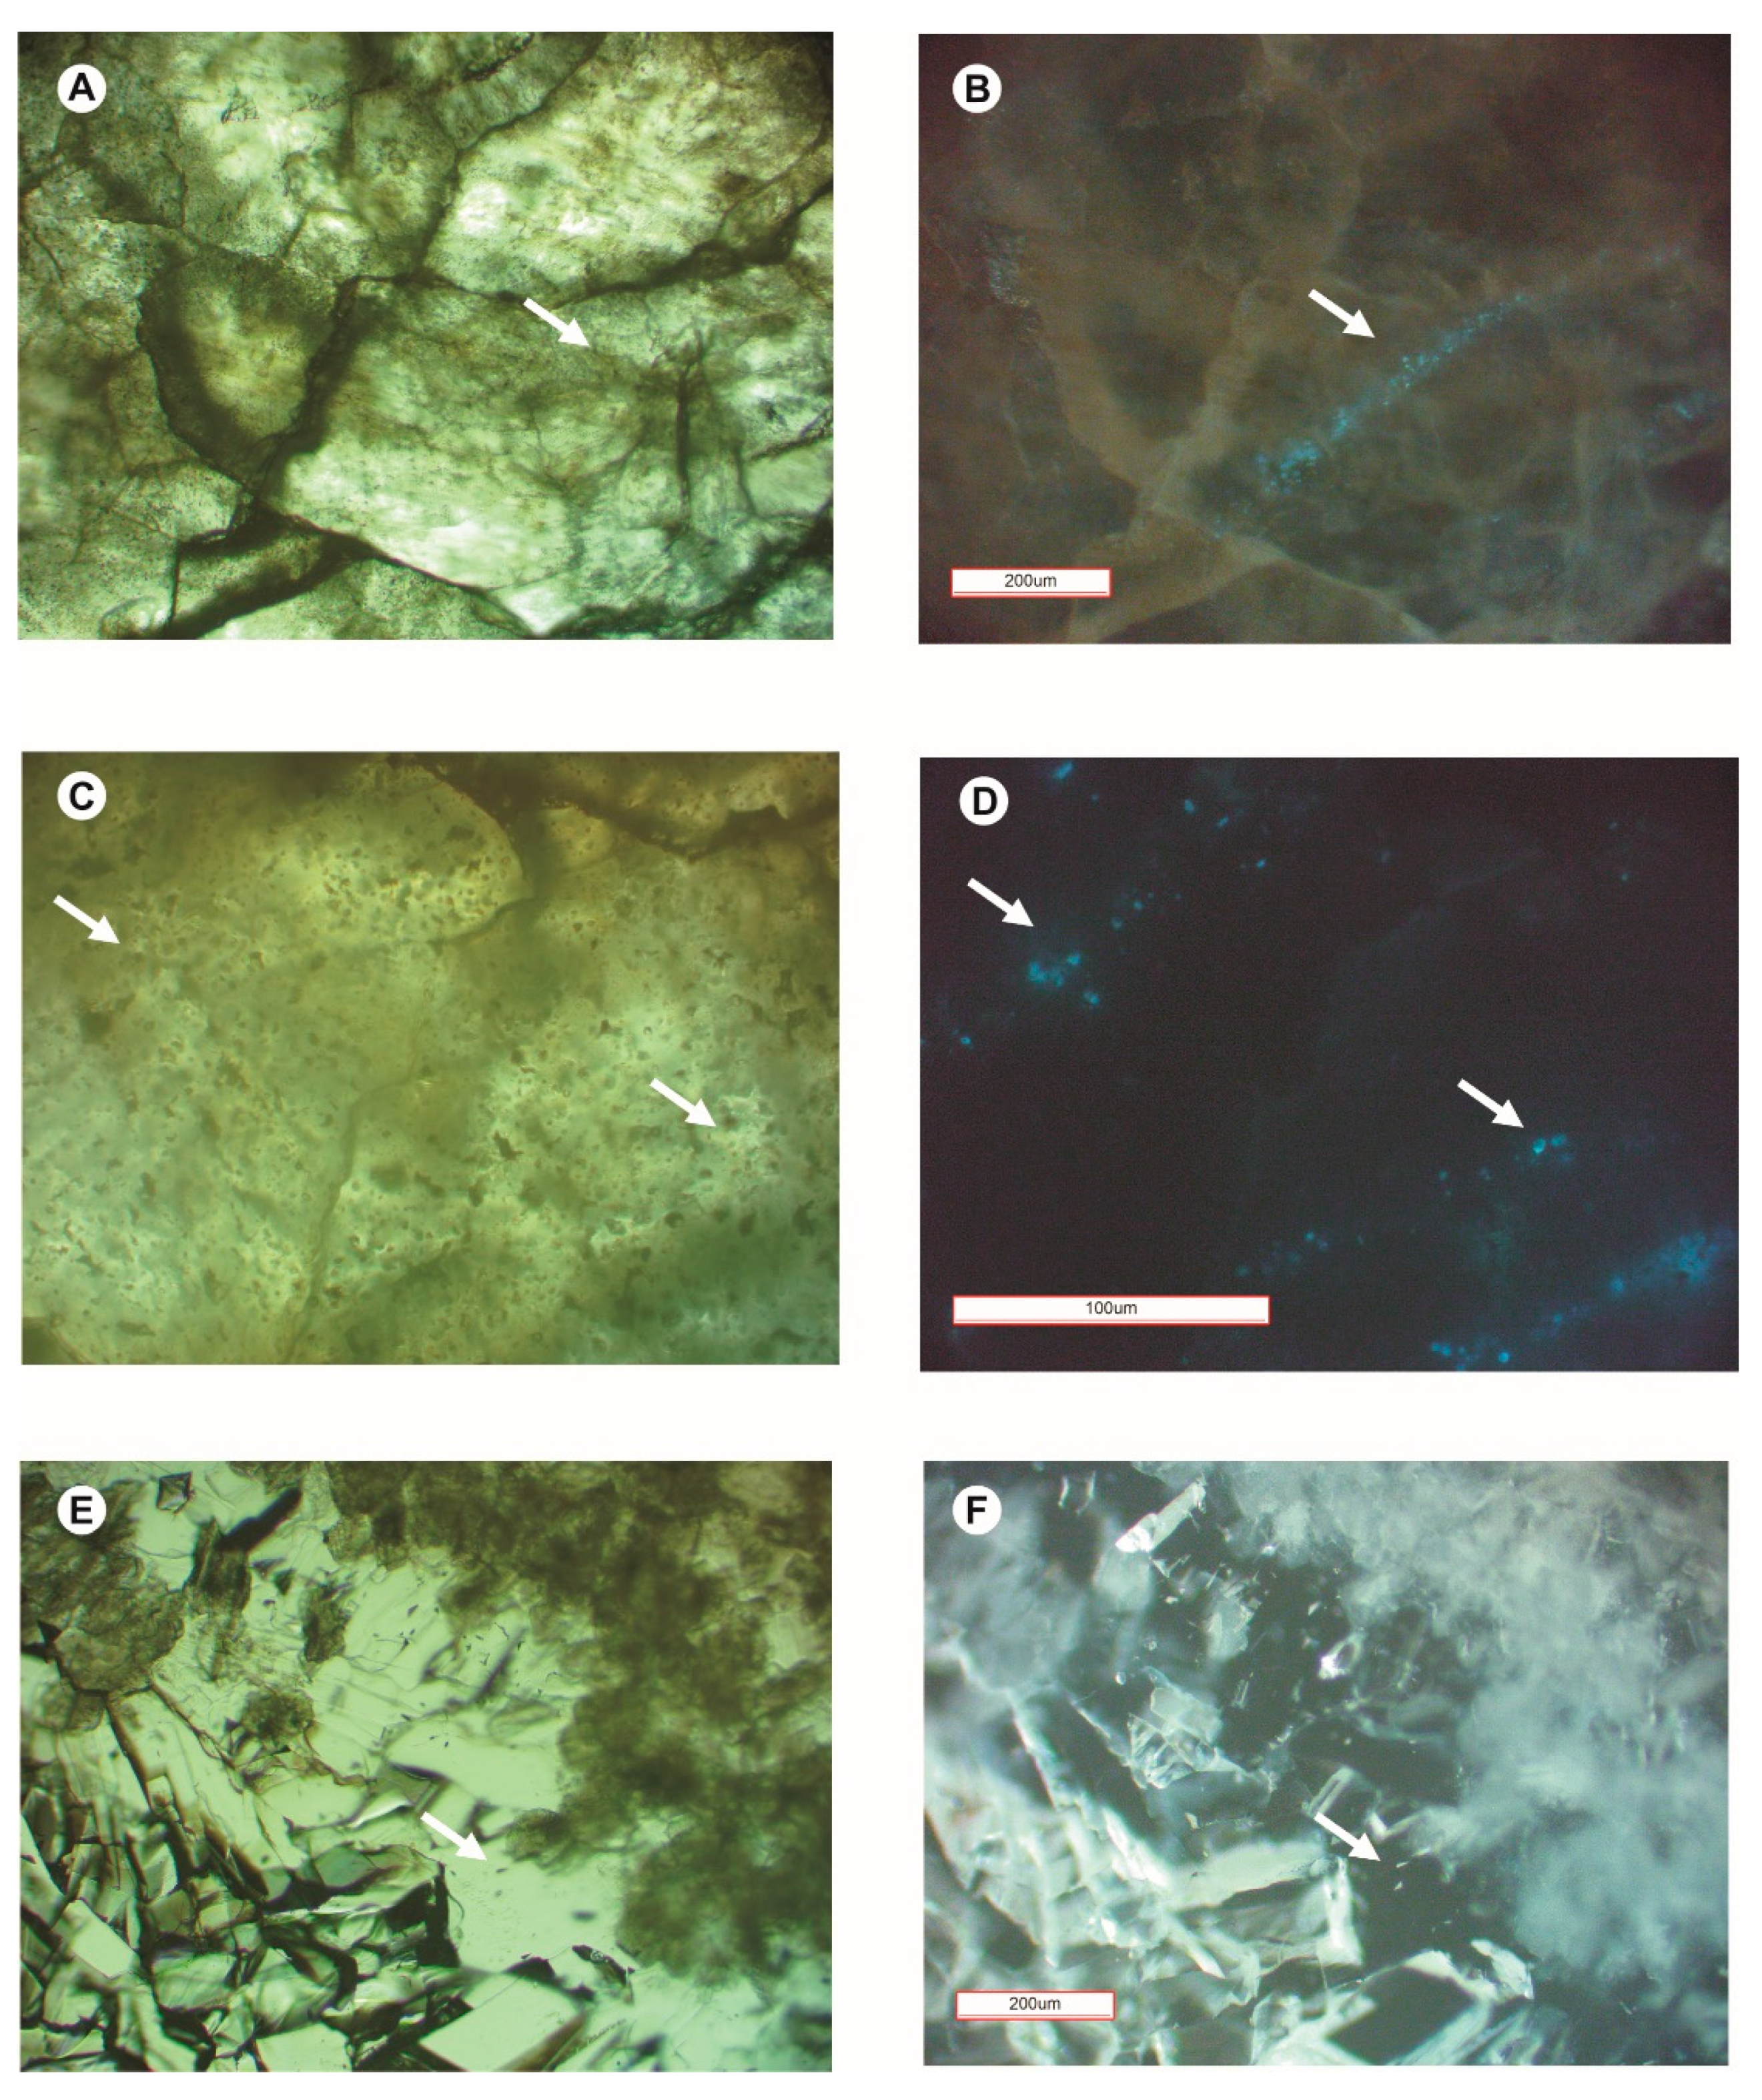
4.3. Fluid Inclusion Petrography

Fluid inclusions are abundant in all minerals studied, i.e., calcite, dolomite, anhydrite, quartz, and fluorite. Their distribution is either random, or they are connected with the primary zones of crystal growth. The inclusions have either primary or pseudo-secondary character. Secondary inclusions are present, too.
The rhombohedra-shaped inclusions are predominant in the dolomite. Other shapes tend to be rectangular or oval and less regular (anhydrite, calcite, quartz). Inclusions are between 1 and 5 µm in size, occasionally larger. They are sometimes one-phase; two-phase inclusions being abundant. There are also three phases in some inclusions.

4.4. Results of Fluorescence Studies

All 30 thin sections were observed both in transmitted and reflected lights, in the illumination within the UV range as well. The fluorescence phenomenon was noticed in some samples from the B and Ba wells (B 16; B 12; B 13; B 9; Ba 7), in contrary to the Mo wells where fluorescence phenomenon of inclusions generally does not occur, or is faint. The luminescence color of individual groups (fluid inclusion assemblages—FIA) of the fluorescent inclusions varies from white-blue to pale yellow. The fluorescent inclusions occur in different types of cements and in variable abundance (Figure 4 and Figure 5).
The fluorescent inclusions are present in both dolomite and anhydrite (B 16), in dolomite (B 16), in fluorite (B 13) and in calcite (B 9). Fluorescence is sporadically observable in calcite from the wells B 12 and B 11, while some traces of luminescence were in B 9, B 5 (calcite), and B 13 (anhydrite). The fluorescent inclusions display either a primary or a secondary character. They show a characteristic distribution in crystals and occur in different positions in host crystals. They are present in lines parallel to crystallographic directions in the crystal (e.g., dolomite B 16), in clouds genetically related to the host mineral (Figure 5), and in lines cutting the crystals, often in association with solid bitumen inclusions. The homogenization temperatures for these fluorescent inclusions are diversified, but generally over 100 °C. Detailed values are shown in histograms and tables (Figure 6, Table 1 and Table 2).
Sound microscopic observations reveal the presence of non-fluorescent inclusions in Mo1 well, or those with a faint dull blue fluorescence (e.g., Mo 6, Ba 7). Their size varies from very small (about 1 μm) to a few micrometers. The non-fluorescent inclusions are either two-phase, or one-phase; their phase character is often difficult to determine in very small individuals (Figure 6).

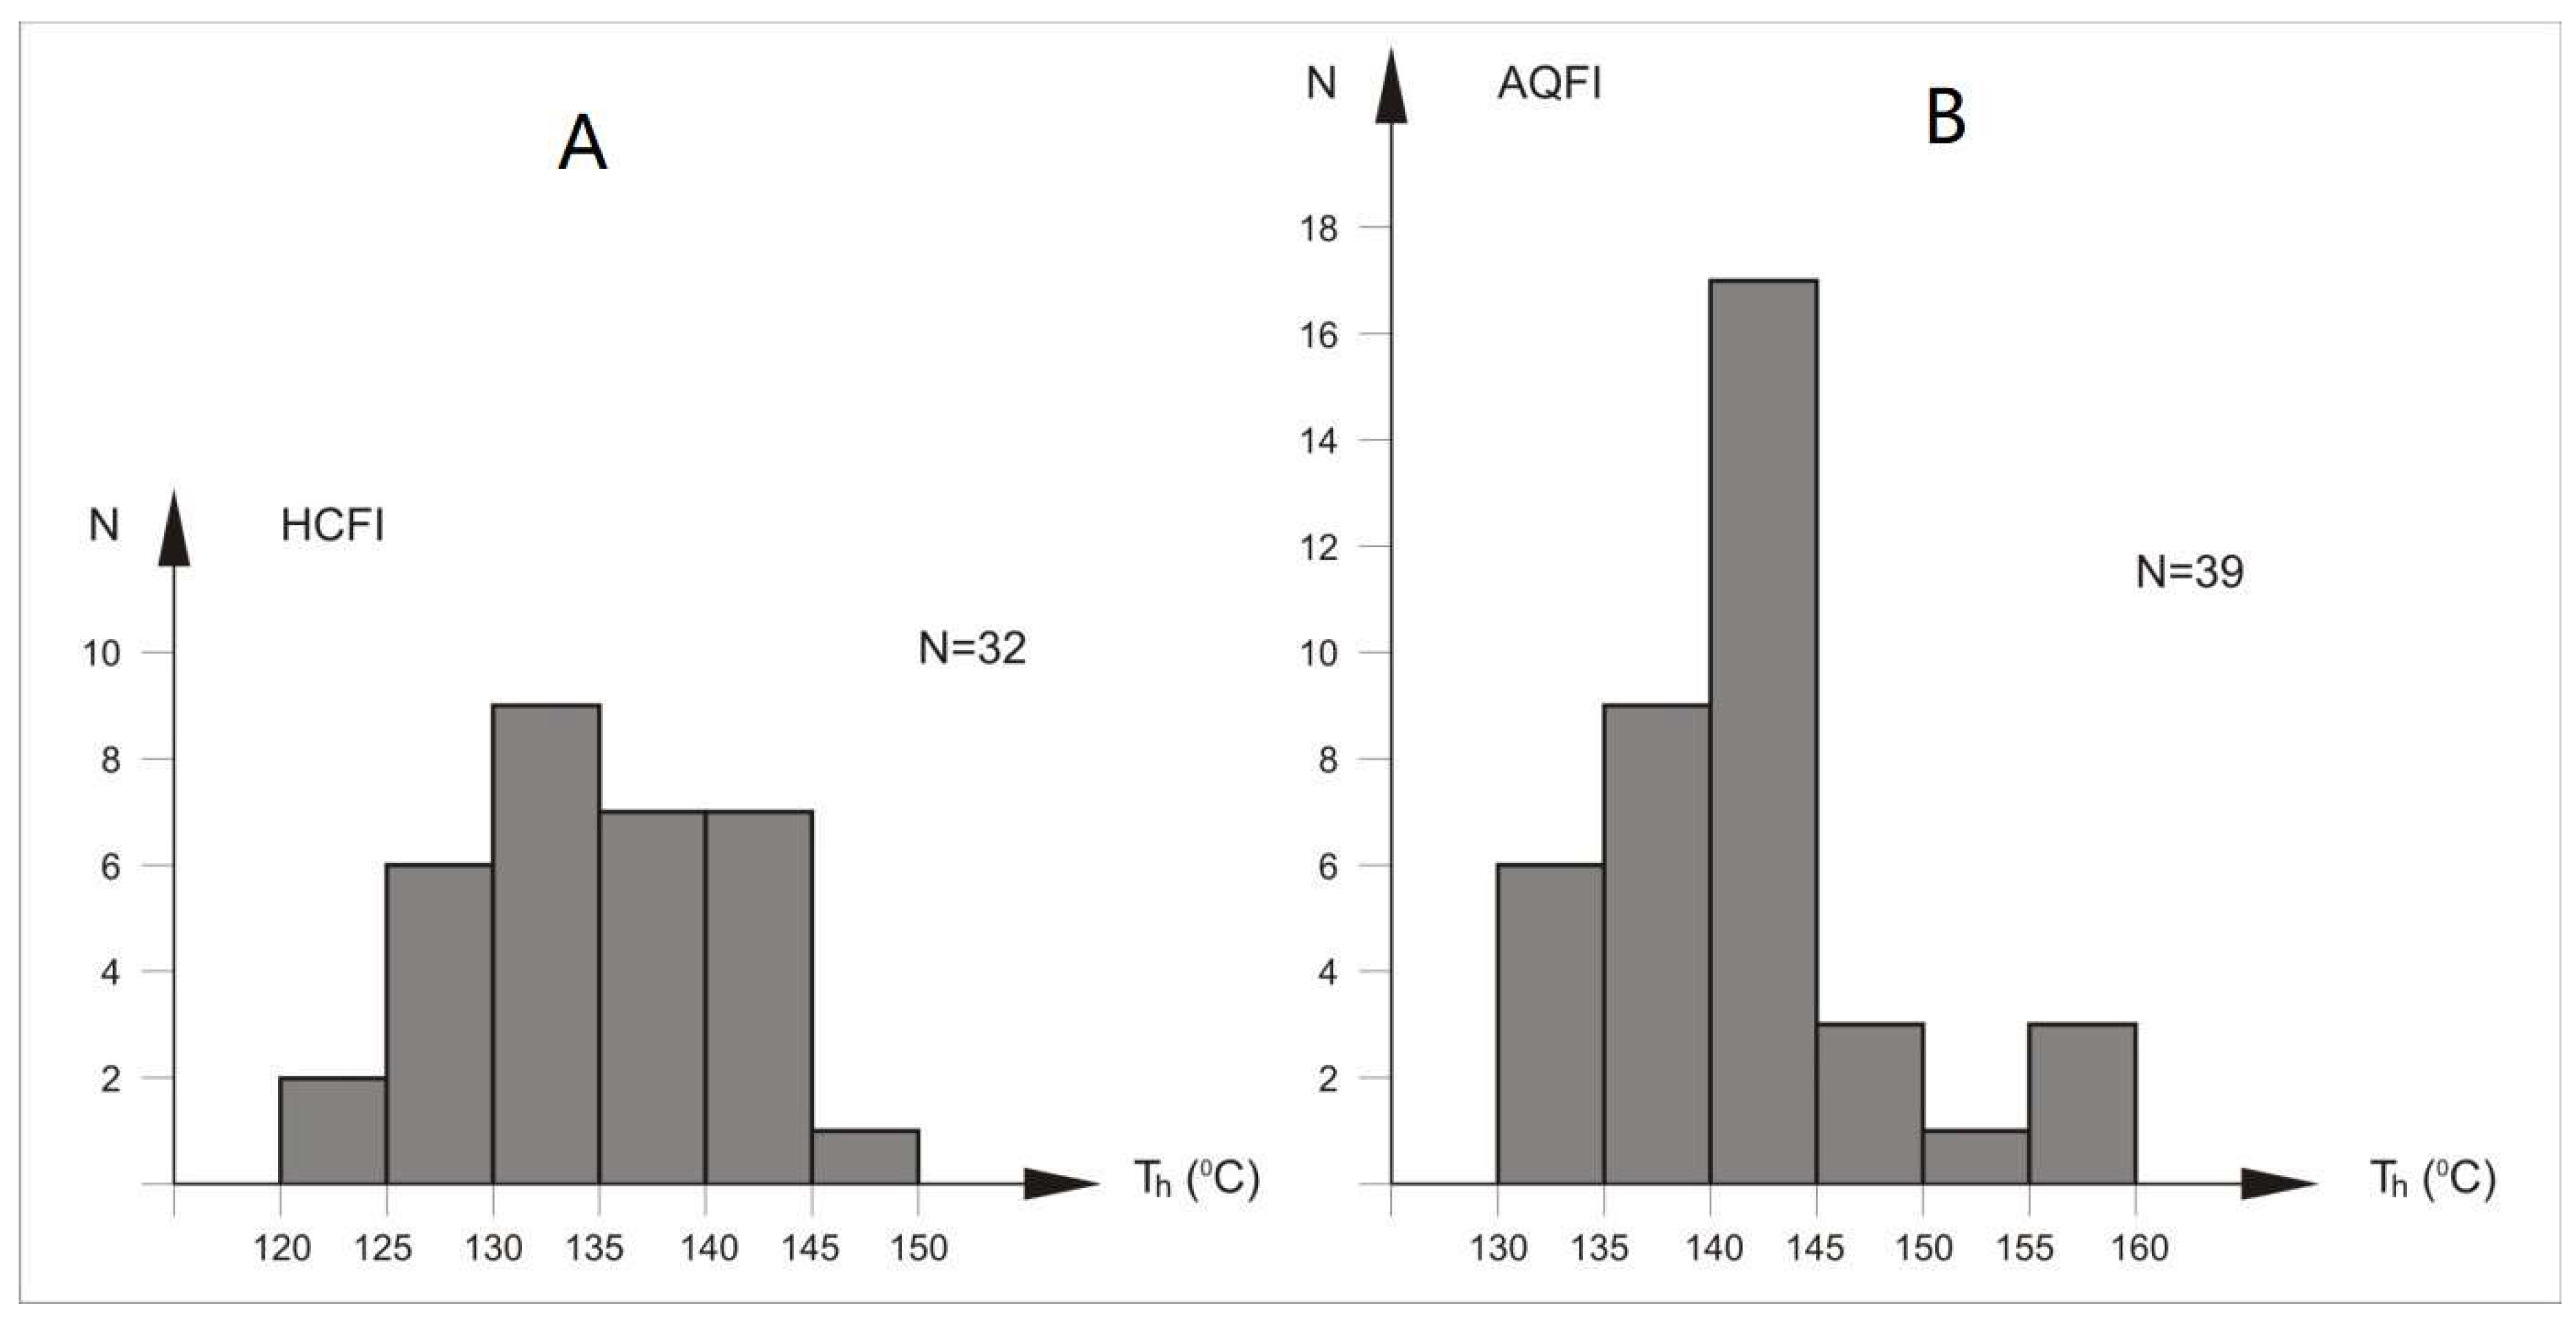
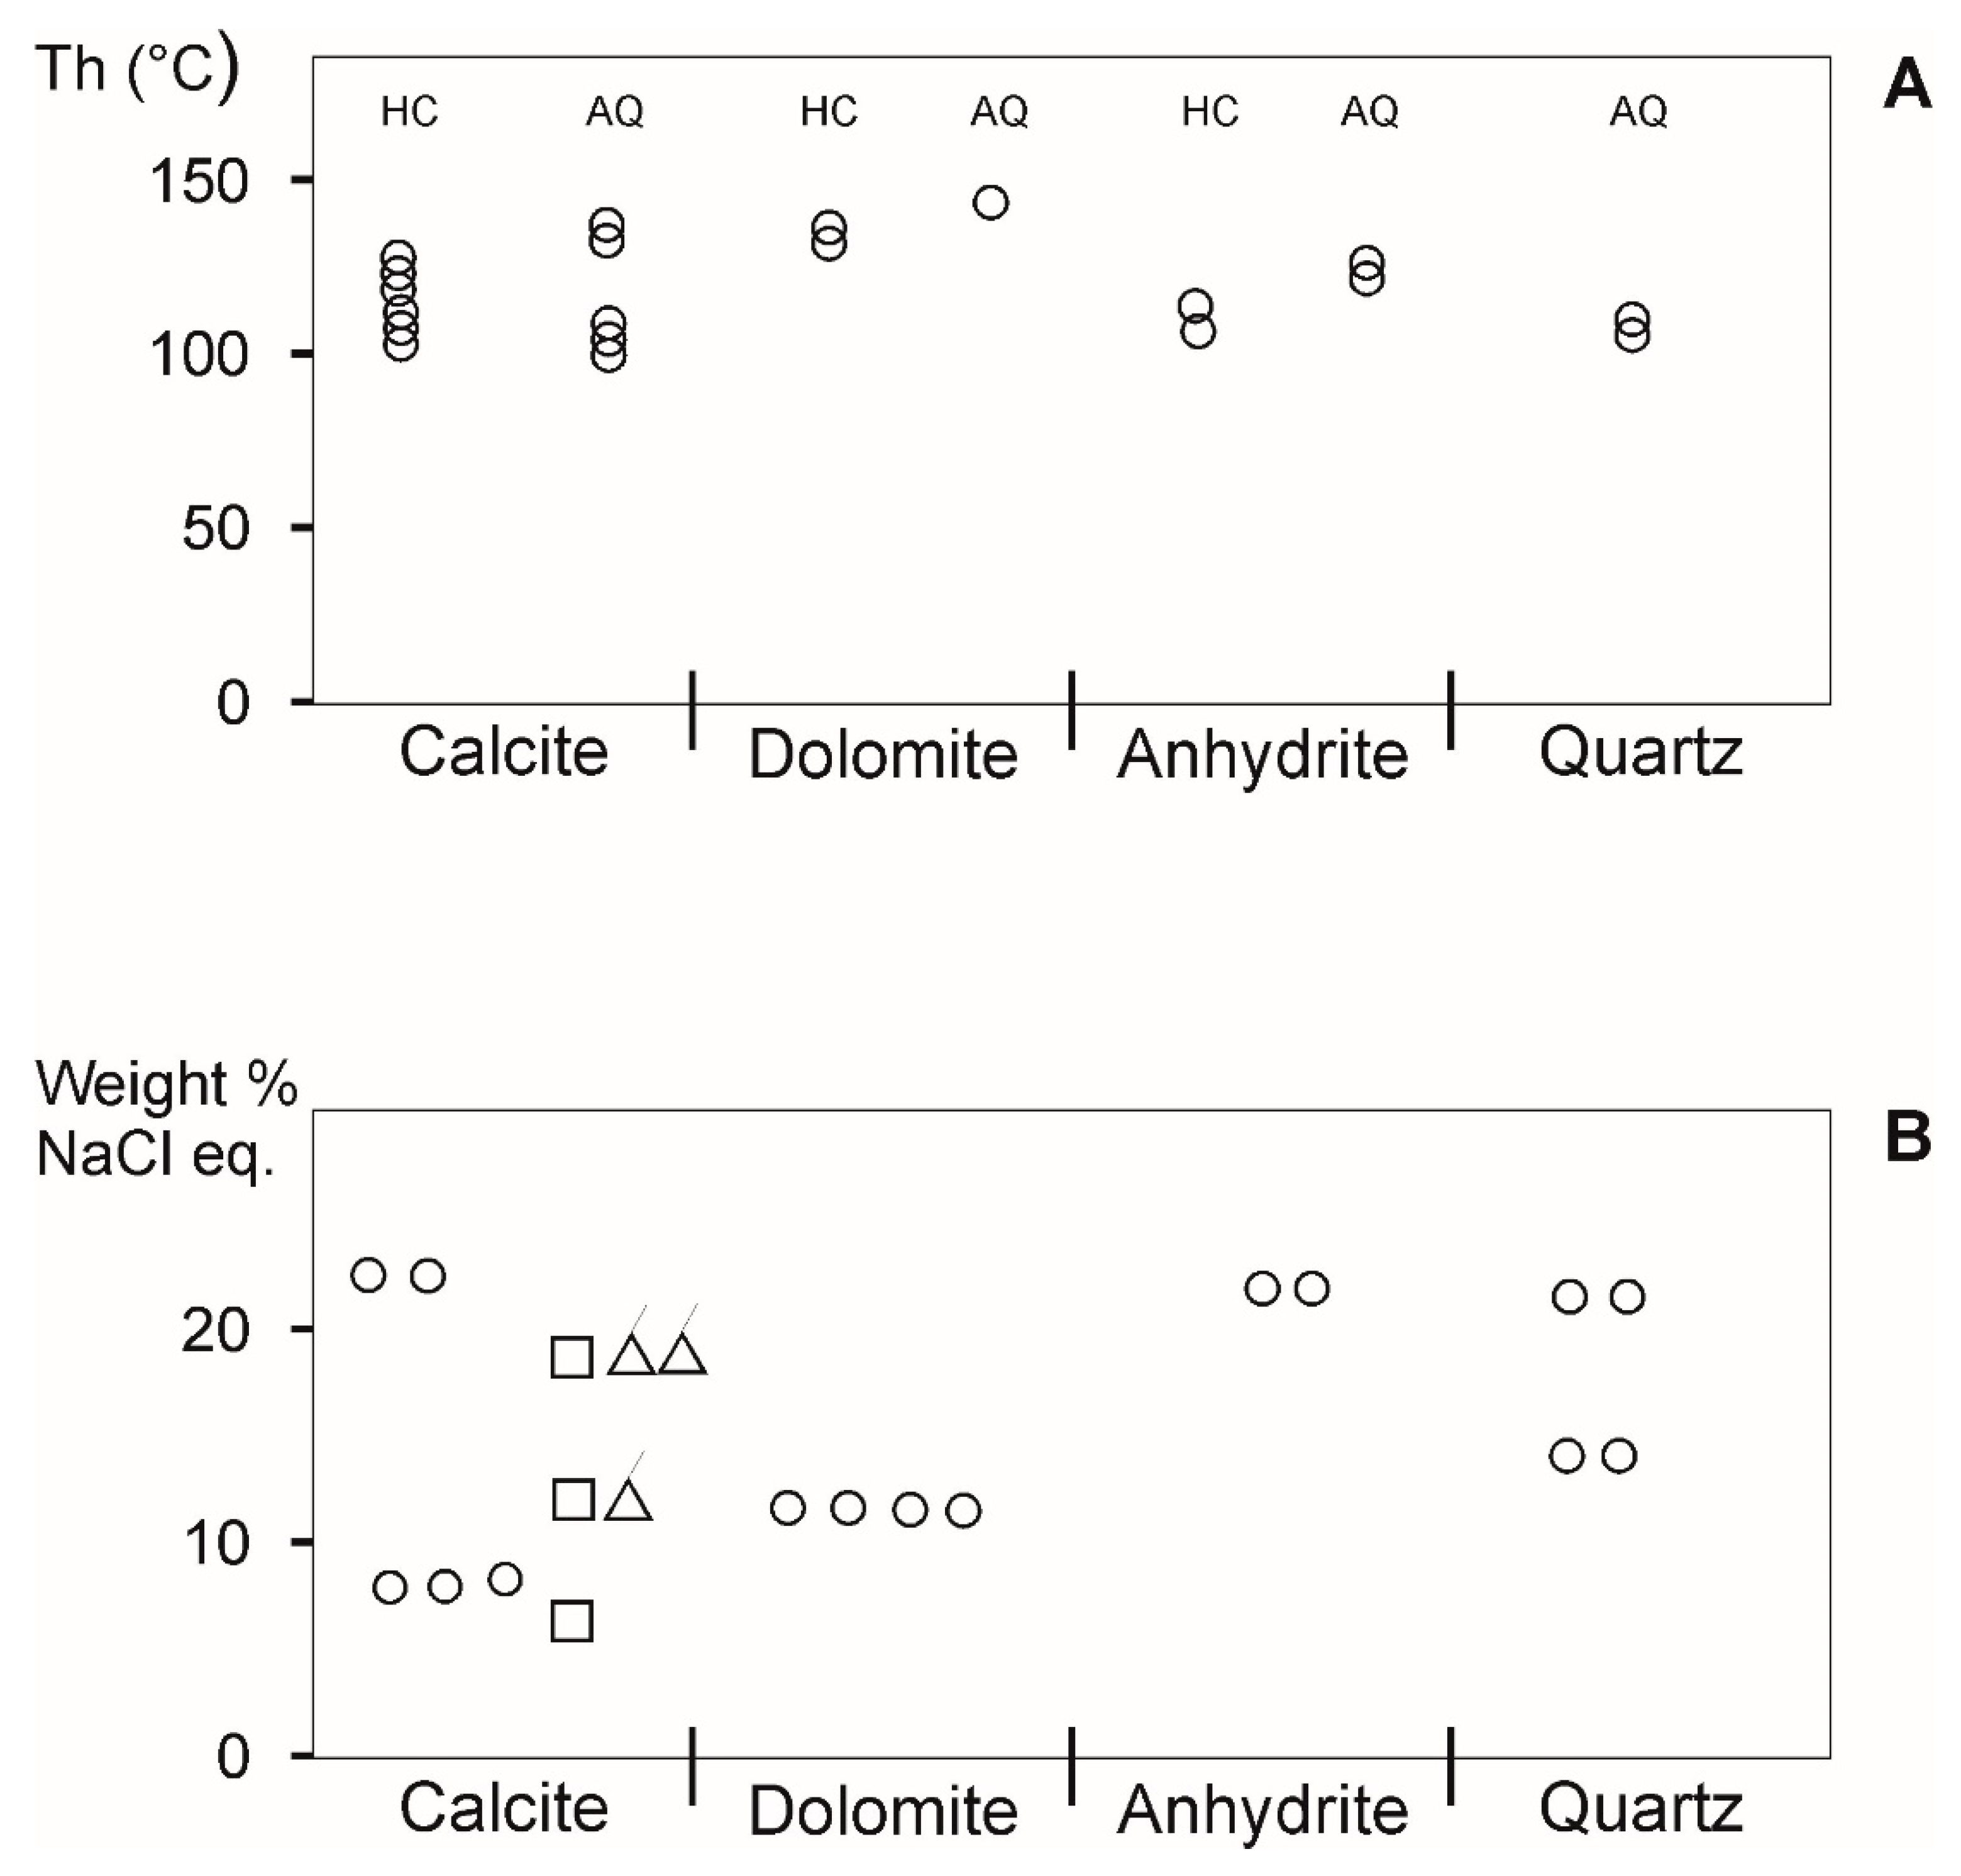
4.5. Results of Microthermometric Studies

Temperature measurements were conducted for two-phase inclusions from different types of minerals and different samples from the boreholes in the BMB area, taken at the depth between 3121.6 m (Ba 7) and 3141.85 m (B 13).
The homogenization temperatures of two-phase inclusions fall into different intervals for the brine (Table 2) and hydrocarbon inclusions (Table 1).
Two-phase HCFI in the dolomite generally homogenize between 120 and 150 °C, with a frequency maximum of 128 and 138 °C (Figure 6A). The homogenization temperatures of brine inclusions in the same mineral are between 135 and 160 °C (Figure 6B). Generally, there is a tendency of slightly higher values for AQFI than for HCFI in the same mineral (e.g., B 16 or B 12 wells).
The eutectic temperatures for most non-fluorescent two-phase inclusions (aqueous) fall into different intervals: −60 to −50 °C (dolomite, calcite); −49 to −47 (anhydrite) and −40 to −34 (dolomite, quartz). These temperatures are distinctly lower than −20.8 °C, diagnostic for the pure sodium brine [27]. Inclusions turn brown during freezing. The ice is the last melting phase and the ice-melting temperatures vary from −19 °C to −13 °C for calcite and fan-like dolomite, −6.5 °C for mosaic dolomite; −17.0 °C for anhydrite; −11.4 to −7.8 °C for dolomite, and −6.8 to −4.3 °C for calcite.
As it is shown above, the ice-melting temperatures obtained for the brine inclusions change from −4.0 to 19.7 °C (Table 2), depending on the minerals and wells.
In contrast to sensu stricto two-phase inclusions (liquid and vapor phases), there are also some two-phase individuals that may be artifacts. Those individuals, concerned two-phase ones when observed at a small magnification, maybe in fact the results of stretching, or they represent co-trapped two liquid phases L1+L2 (compare: [33]).
The one-phase inclusions, which do not fluoresce or seem to have a dull blue fluorescence, were supposed to contain gas (methane)- compare [33]. Their size, however, is often too small to observe the processes occurring inside the inclusion during freezing and heating. In the B 9 well, larger, one-phase inclusions were noticed. Although stretched, they confirm the suggestion of a methane filling. When frozen deep, they create a bubble that homogenizes to gas at −89 °C, which is the microthermometric evidence of their CH4 content.
A very interesting microthermometry result was also observed in inclusions in anhydrite from the Mo 1 well. There occur groups of small (1 µm or less) or large, highly stretched inclusions that at first glance seem to be one-phase. In fact, they are indistinct two-phase ones with a well-visible and large gas bubble. That distinct phase creates another phase during deep freezing (up to −186 °C) and when heated, it is homogenized at −138 °C, showing the characteristics of methane with a possible nitrogen admixture. The exact composition of the inclusion bubble could have been confirmed by the Raman spectroscopy. The Raman studies have not been conducted, however. No changes were observed in other parts of the inclusions under description. The inclusions are elongated, often stretched or necked down.
Apart from one- and two-phase inclusions, also three-phase inclusions with solids occur in the studied minerals and rocks. The solid individuals in inclusions, as well as black one-phase inclusions, should be studied by means of Raman microscopy [34]. This is the direction of further studies, being, however, rather difficult in the study area due to the fluorescence phenomena of some individuals and the general small size of gas inclusions.

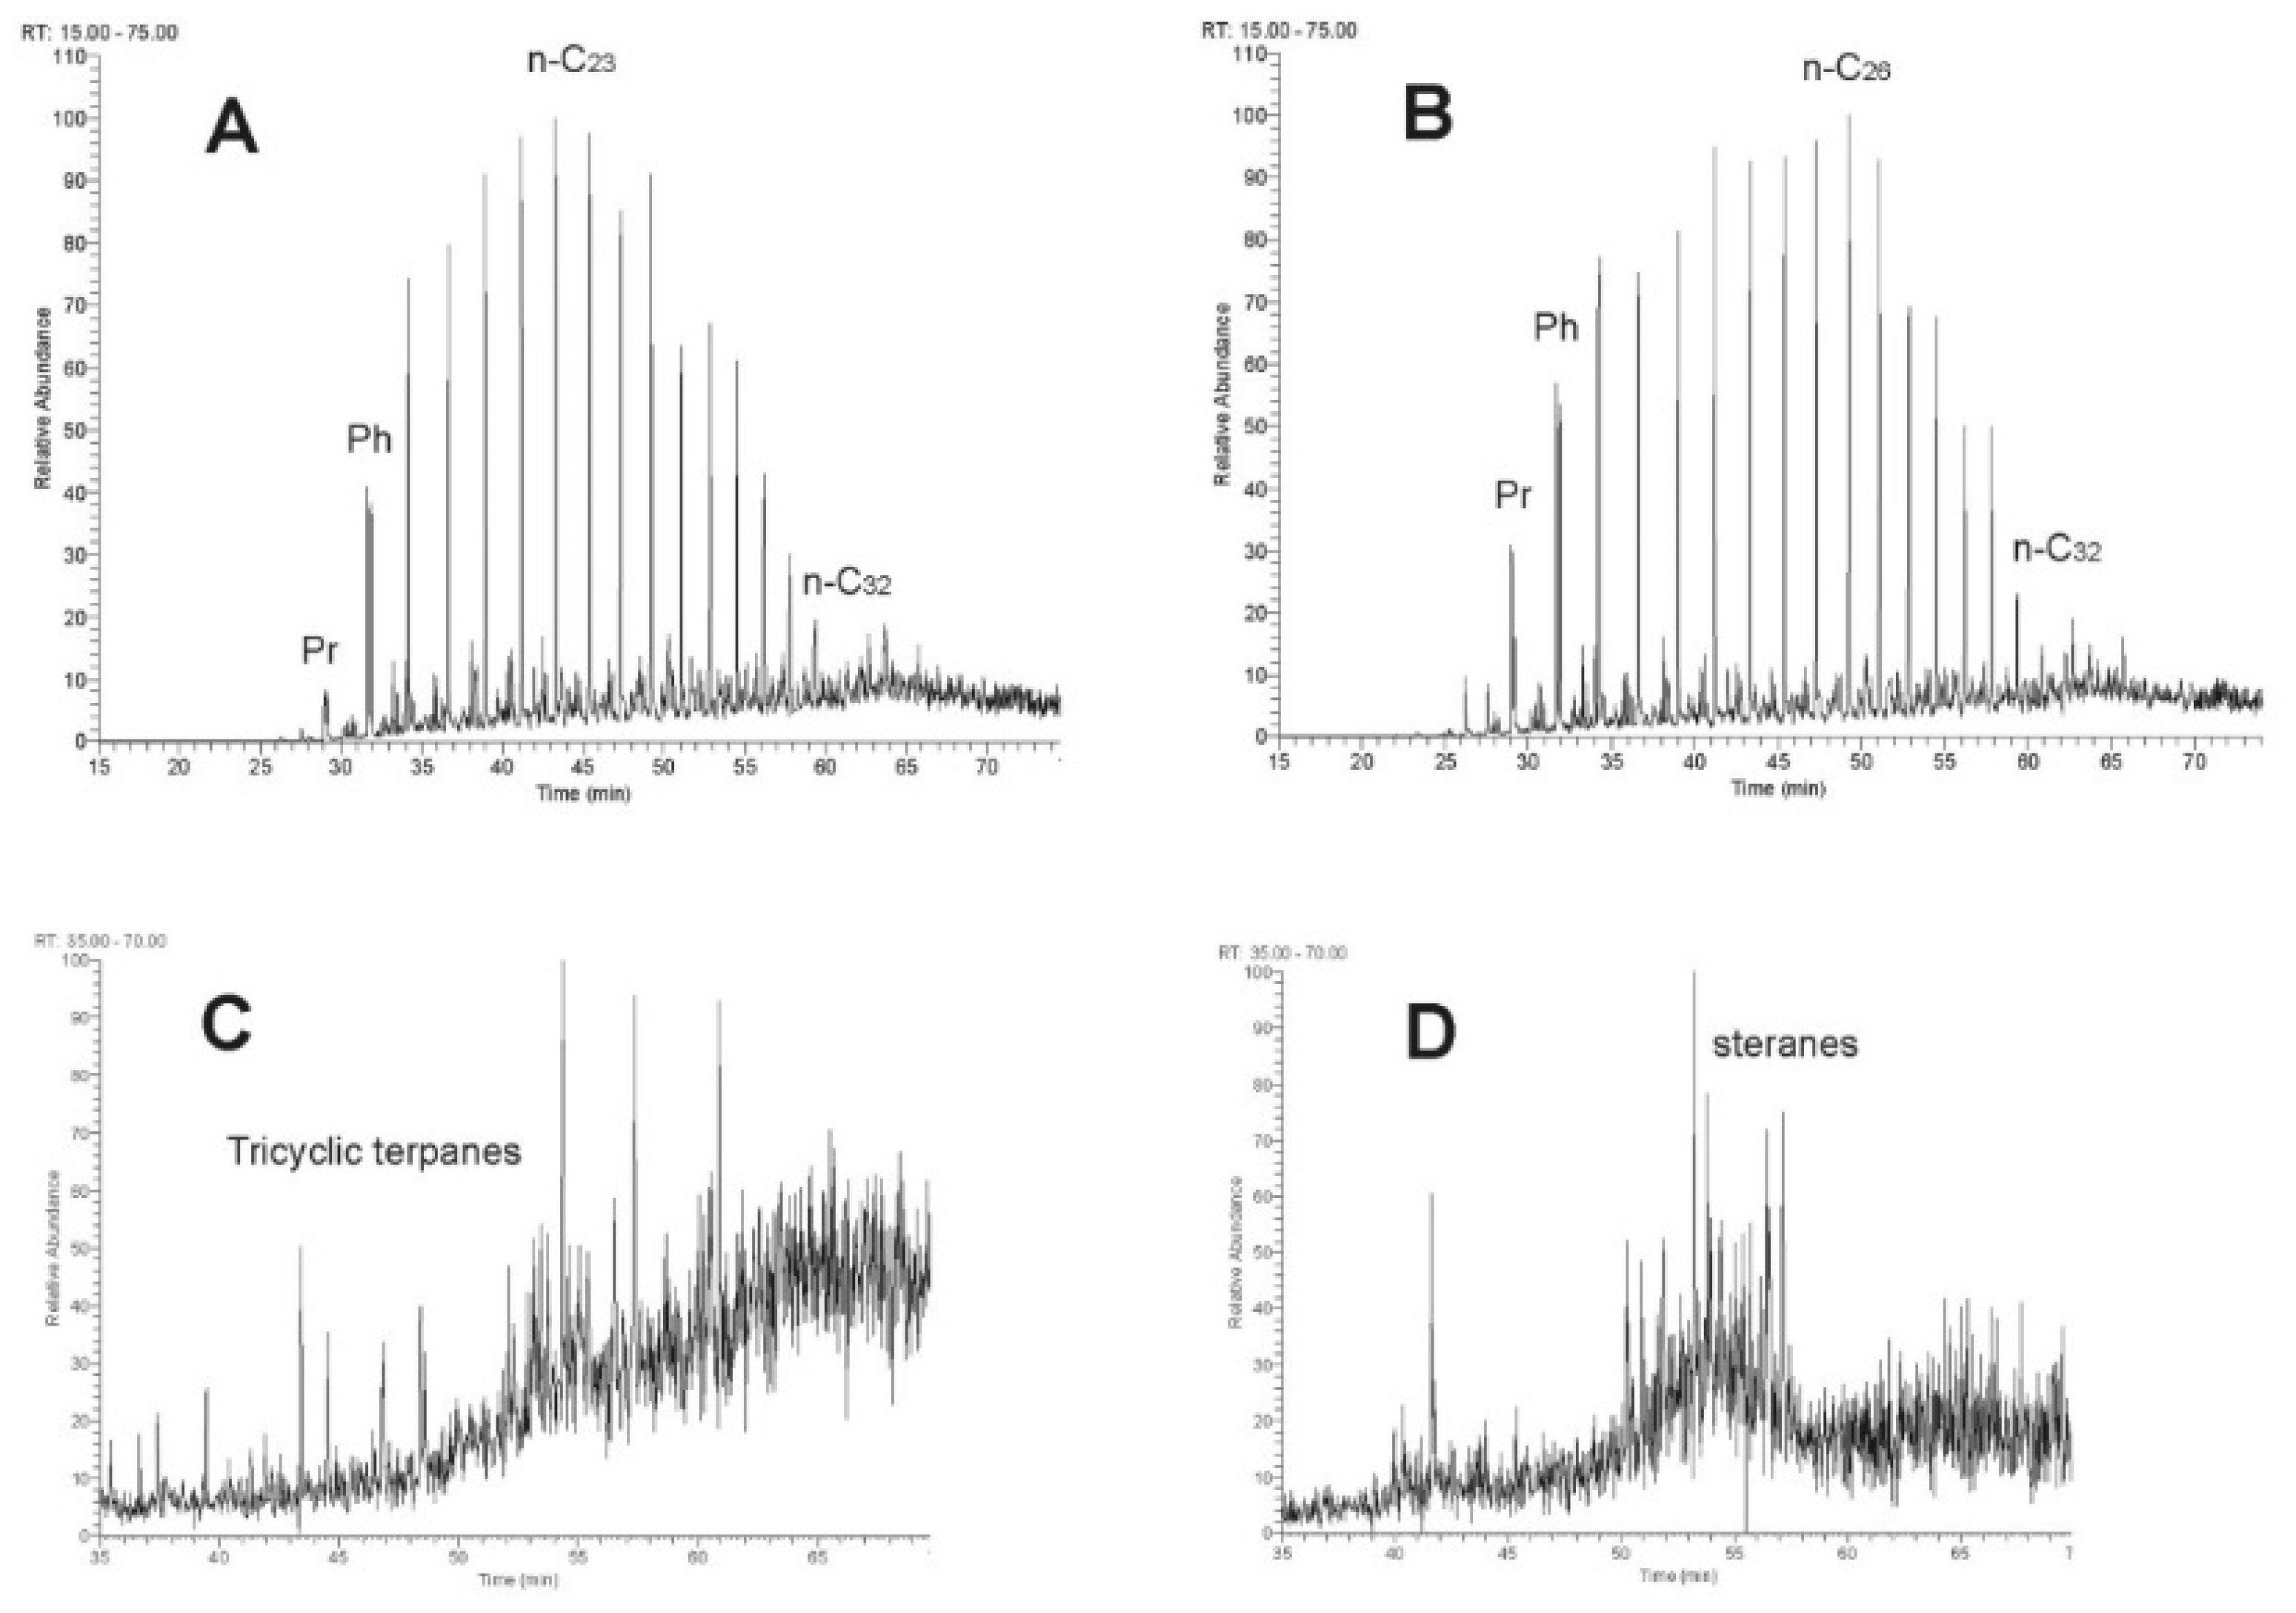
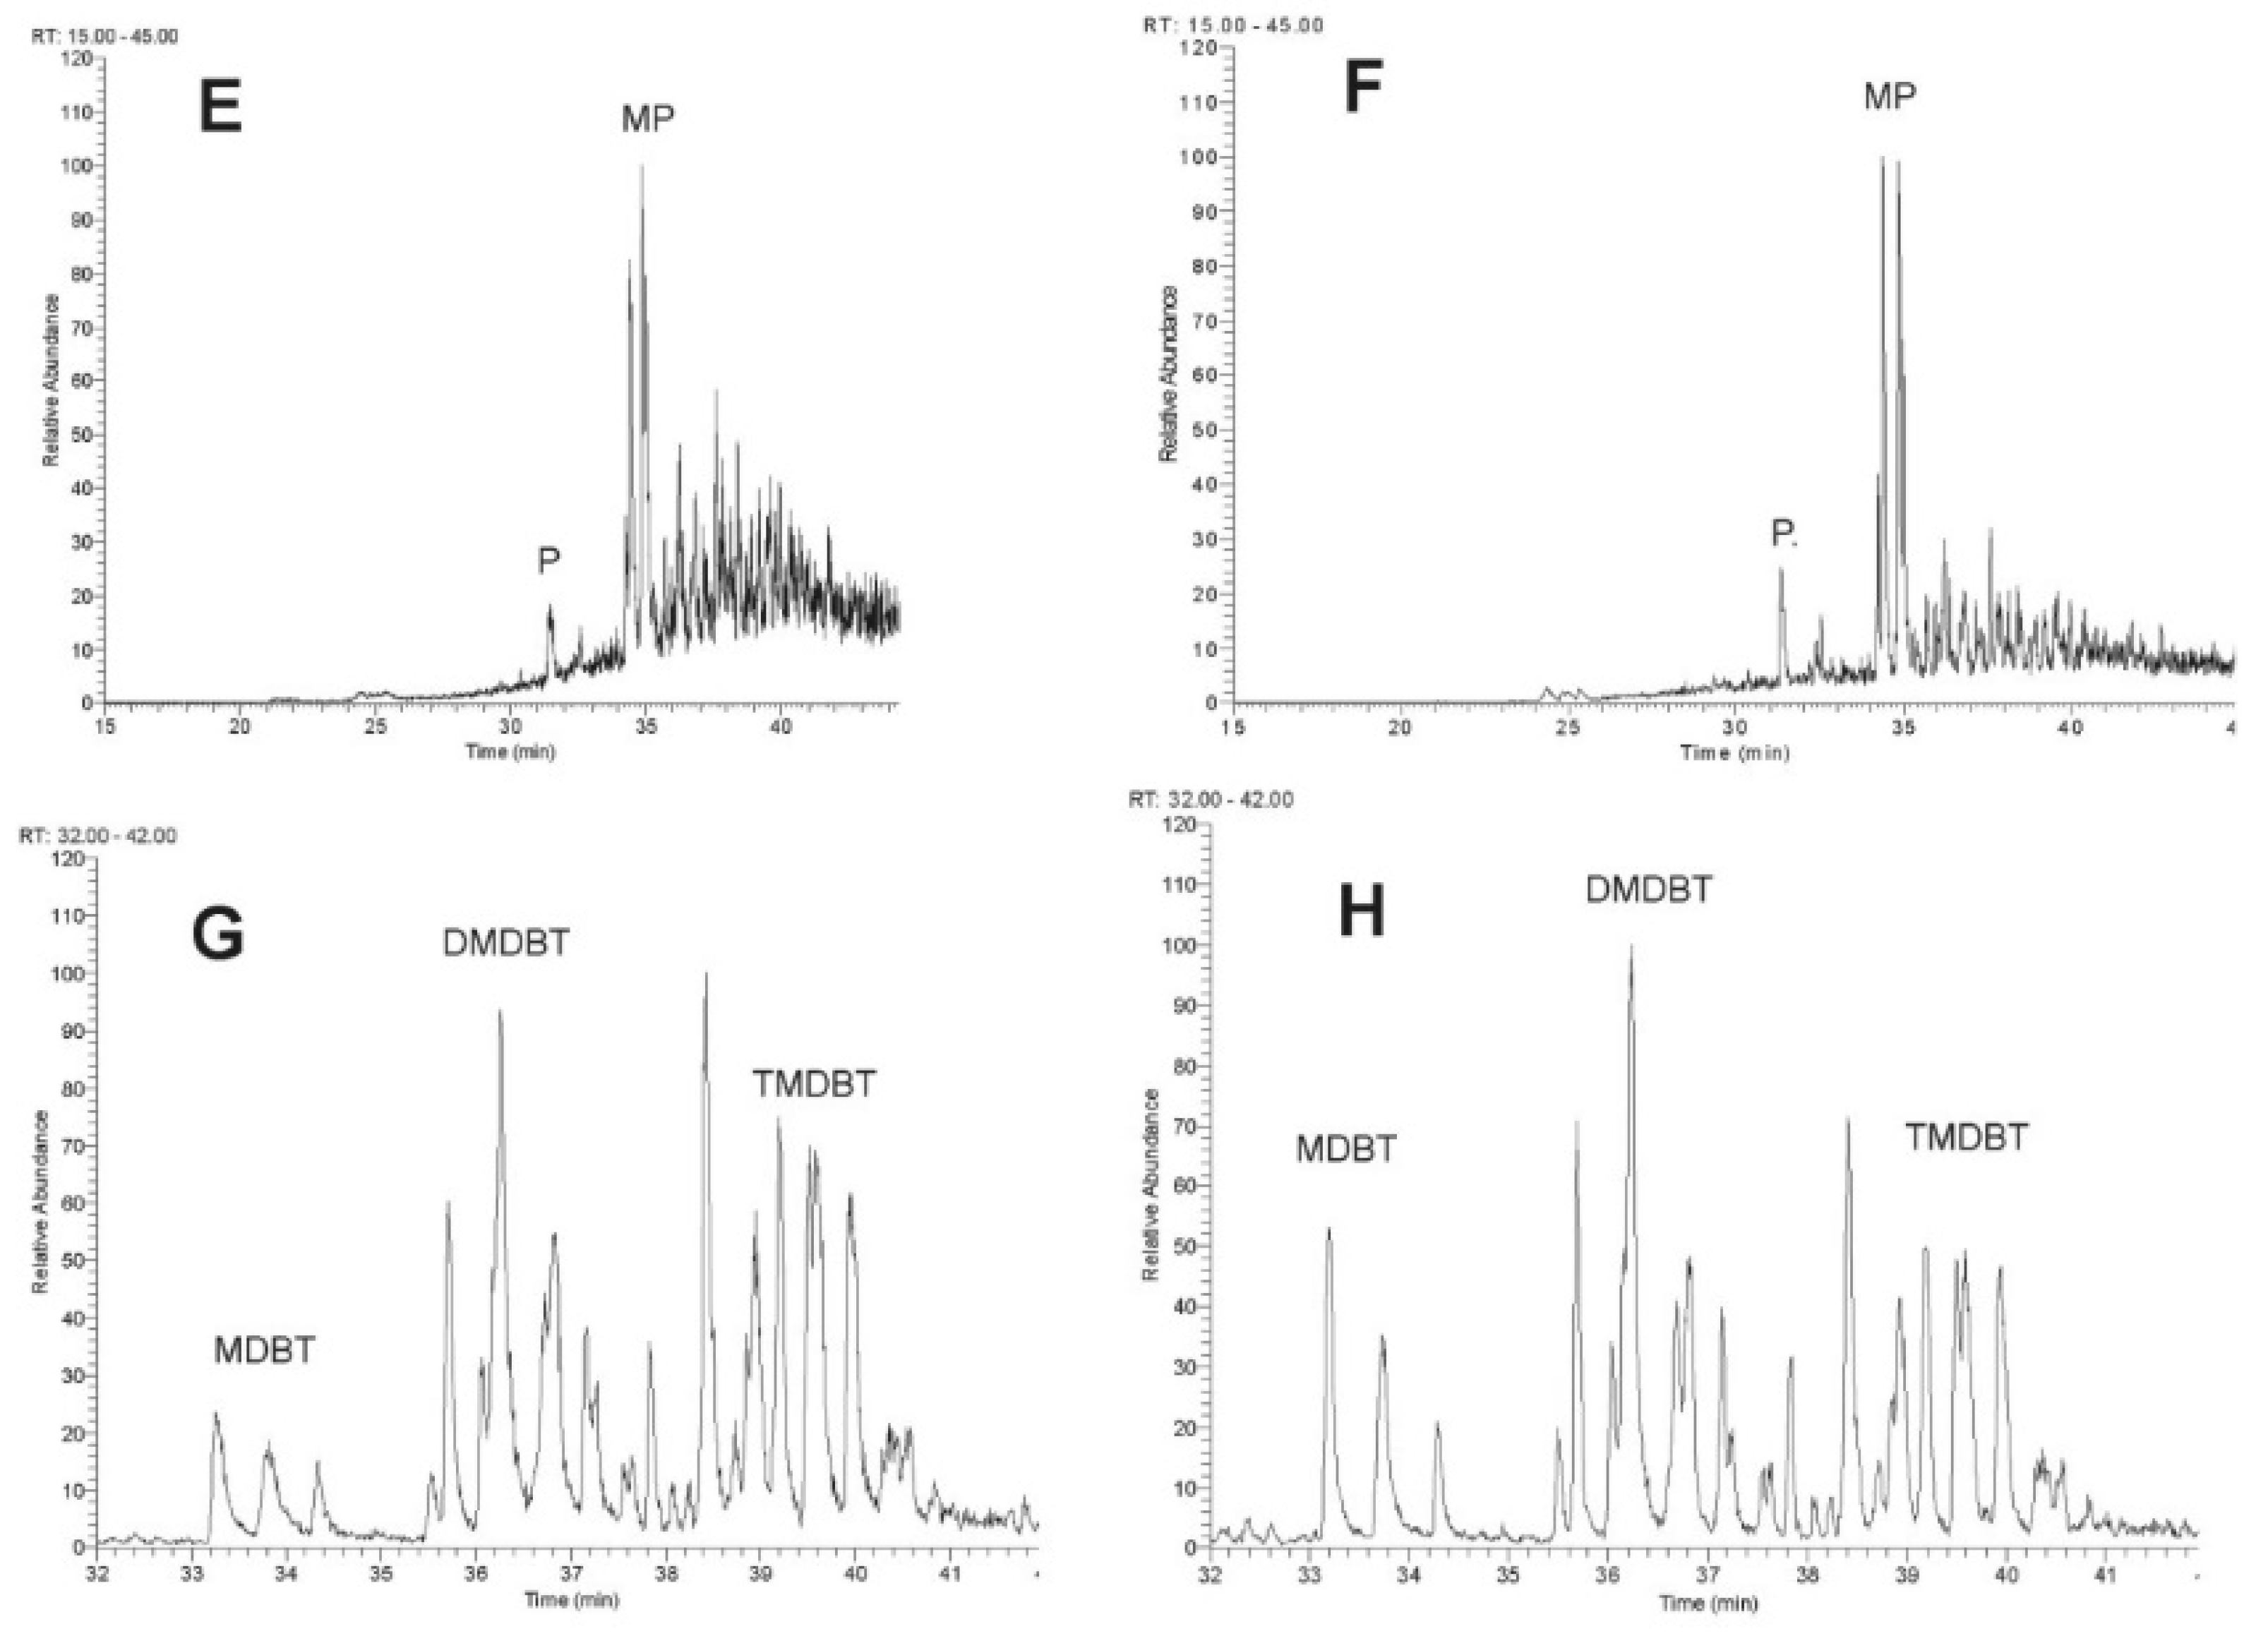
4.6. Results of Bitumen Analyses

Out of three samples analyzed, the B 9 sample displays a very high saturation of bitumen at the level of 8997 ppm in regard to two other samples with high saturation of 3090 and 1875 ppm (Table 3). Saturated hydrocarbons are predominant (about 70%) in the fractional composition of the extractable organic matter, being followed by aromatic hydrocarbons (about 18%), resins, and asphaltenes.
The saturated fraction was analyzed by GC/MS and the chromatograms are presented in Figure 7. Geochemical parameters are calculated based on the analyses and presented in Table 4. There are some slight differences in the distribution of n-alkane between samples B 9 and Ba 7, namely a shift to a lower carbon content (n-C23 toward n-C25/26, respectively)—Figure 7A,B. A bimodal character of the distribution may be noticed in the case of the Ba7 sample. The pristane/phytane ratio varies from 0.20 to 0.35 (Table 4).
Besides the parameters calculated for hydrocarbons from the saturated fraction, aiming at characterization of the environment, sterane parameters were calculated due to identification of biomarkers (hopanes, steranes, and tricyclic terpanes—Figure 7C,D; Table 4). The mass spectrograms of the aromatic fraction are also presented in Figure 7E–H. In the aromatic fraction, naphthalene is absent, while phenanthrene and its methyl derivatives, as well as aromatic compounds of sulfur, are present in all samples. Table 4 contains adequate calculated indices.

5. Discussion

Fluid inclusion studies have been conducted for some years in some geological structures of the Polish Lowlands. Those studies concentrated mostly on diagenetic relations, e.g., in the Paproć–Cicha Góra field, close to the BMB region [35,36,37], or in the Lubiatów field itself [30].
The present paper concerns fluid inclusion analyses in minerals from the rocks in the wells in the BMB field in the western part of the Wielkopolska Petroleum Province [7,38]. The rocks are mostly grey dolomites cut by white and grey veinlets mostly filled with anhydrite. Microscopic observations point to the fluorescence phenomenon in the UV range. That suggests a presence of high hydrocarbons in the rocks studied. That fact enlarges the general interval of HC occurrence in BMB since samples studied come from deeper parts of the geological section than the interval of 3047.5 to 3107 m, pointed out by [7] as the depth of oil occurrence.
Generally, two types of the inclusion-filling fluids were observed—brines (AQFI) and hydrocarbons (HCFI). They either display a fluoresence habit or not. The fluorescent and non-fluorescent inclusions are either co-present, or they occur separately in the minerals studied.
The fluorescent inclusions display luminescence in white-blue to pale yellow colors. They are evidently filled with high hydrocarbons since the aromatic compounds display fluorescence when illuminated in UV range [39,40,41], those not fluorescent contain either brine or light hydrocarbons (± admixtures).
HCFI were found in almost all minerals studied; however, in different abundances and character in mineral crystals. They occur in different positions (e.g., in the host crystals). The primary inclusions are in lines parallel to crystallographic directions in the crystal, and in clouds genetically related to the host dolomite (Bu 16), while the secondary inclusions are in lines cutting the crystals, often in association with solid bitumen (Figure 2 and Figure 3). The homogenization temperatures for the most abundant fluorescent HCFI inclusions fall into the interval of 107–135 °C (Table 1).
The fluorescence of inclusions in white-blue [42] or blue, sensu: [41], to slightly yellow colors points to the oil as the liquid phase filling the inclusions [39,40,41,42]. Based on the fluorescence colors, a character of hydrocarbons can be estimated [32,42]. In majority of cases, the oil in inclusions in BMB minerals is light and mature; its gravity varies between 41 and 42 °API (Figure 3 and Figure 5; Table 3). However, such an estimation of gravity is only an approximation. Colors of fluorescence are, namely, not the absolute factor for composition determinations. Many authors totally discredit the visual estimation of fluorescence colors and a possibility of estimation the maturity in relationship to the fluorescence colors (e.g., [40]). Only fluorescence spectra are concerned reliable [40,41,43]. Colors may vary due to different factors, even with a change in the equipment used, according to the author’s own observations under the microscope.
However, the results obtained in the present paper for oil in inclusions and those reported by [42] correspond to the data reported by [13] for typical oil in the Bu 12 well, occurring at the depth of 3116.5–3137.0 m in the BMB area. According to [13], the oil displays the density of 39 °API (0.826 g/cm3) and contains 0.38 weight% of sulfur. The values obtained for the oil in inclusions at present are comparable to those quoted, and may be compared to those by [44]. Another parameter estimated at present, Q—red/green ratio (sensu: [45]), lies in the interval between 0.1 to 0.2, being most frequently equal to 0.2. It is shown in the Table 2 based on estimations performed using the adequate diagram by [32,42].
The hydrocarbon inclusions are most frequent in the dolomite from the B 16 well, in which they display high homogenization temperatures ranging from 126 to 140 °C (depth of about 3140 m). Solid bitumen are present, too. The corresponding brine inclusions (AQFI) homogenize, even at higher temperatures in the interval of 135–148 °C.
Both AQFI and HCF were observed in the same well in anhydrite, homogenizing at lower temperatures of 118–132.8 °C and 106–113 °C, respectively.
Both types of fluids are also present in calcite (Bu 9; Figure 3; Table 1 and Table 2). The AQFI homogenize between 92 and 130 °C (at maximum), most of them between 120 and 125 °C. Two-phase oil inclusions homogenize between 92 and 101 °C (B 9), i.e., similar to the temperatures obtained at the same depth for the fan-like and mosaic calcites from the B 11 well.
The brine fluids in those two last calcite types display, however, different salinity (Table 3). The fan-like calcite must have crystallized from more saline brines (17–19 wt% NaCl equivalent) as compared to the mosaic calcite in the rock (about 9 wt % NaCl equivalent). The fluid responsible for the crystallization of calcite in the B 9 well shows the salinity comparative to that of the fan-like calcite in the B 11 well.
Summing up the hitherto discussed facts, both hydrocarbons and brines were found in the inclusions in dolomite and anhydrite in the Bu16 well; in calcite (B 12, B 9); and in fluorite (B 13). Some of these aspects have been recently presented in short by [42].
Due to the small size of inclusions, it was often difficult or, in some cases, even impossible to conduct microthermometric studies. Generally, in one-phase inclusions, bubbles can appear after freezing, which points to unstable conditions and is the start point to observations conducted in the heating mode [19,39,46]. The size of inclusions is, therefore, very important to conduct direct research. In other cases, a composition of the fluid may be estimated. In very small inclusions, observation of the processes inside seems to be impossible, which limits interpretation. It cannot be excluded, therefore, that some non-fluorescent (one phase) inclusions observed, e.g., in B 13, dolomite could contain methane similarly to those proved in Bu 9, although the lack of adequate microthermometric studies exactly there has not confirmed this suggestion yet. The presence of methane in inclusions in anhydrite is also possible (although not proved) if we refer to some observations of anhydrite in the Paproć–Cicha Góra area [35,36]. What is important is that, CH4 occurs in inclusions in anhydrite in the B 9 and in the Mo1 anhydrite, with the nitrogen admixture (compare: [31]).
Light hydrocarbons may be dissolved in brine inclusions, which is proved when observing inclusions at very low temperatures (formation of extra phases). Some similarities in the inclusion behavior and content may be also observed when comparing the results with those from the SG-1 well (east of the area shown in Figure 1; compare: [30]).
Generally, the Ca2 deposits in the Gorzów Wielkopolski area have suffered strong diagenetic alteration. The most important process recognized is pervasive dedolomitization (e.g., in the SG-1 well, resulting in fine-crystalline dolomite mosaics). Alteration in the BMB area includes anhydrite cementation/anhydritization and dedolomitization. The detailed diagenetic sequence in the adjacent Mo-1 well after Kozłowska and Kuberska (in: [30]) may be combined with homogenization temperatures of brine inclusions in minerals (Figure 3).
Formation conditions have been distinguished for at least two types of calcite (Table 2; Figure 2 and Figure 3). One calcite type crystallized from very saline solutions (about 17–22 wt % NaCl equivalent) with a density of about 1.09 g/cm3 and high homogenization temperatures, while the second one from less saline solutions (about 6–11 wt% NaCl equivalent), and lower density fluids (around 1.0 g/cm3) (B 12; B 9). When comparing the results for fan-like and mosaic calcites, it can be stated that inclusions in the first type display much higher salinity and fluid density than those in the mosaic type (B 11 well; Table 2).
The dolomite, displaying rather low homogenization temperatures between 92 and 97 °C, crystallized from the solutions of moderate salinity (between 11 and 15 wt % NaCl equivalent) [46,47,48].
The quartz revealed moderate homogenization temperatures between 103 and 107 °C and formed from high-saline solutions (21 wt % NaCl equivalent) with a density of about 1.06 g/cm3 [48].
The eutectic temperatures below −21 °C point to the presence of calcium and magnesium together with NaCl in the fluid, e.g., [19]. The eutectic temperatures around −56 °C and co-tectic temperatures of about −40 °C point to NaCl-CaCl2-MgCl2-H2O, which means they characterize a chemical system of dissolved ions of Cl-, Ca2+, Mg2+, and Na+ [46].
Homogenization temperatures of inclusions in calcite, dolomite, anhydrite, and quartz (both HCFI and AQFI), as well as the salinity of brines expressed in weight % NaCl equivalent, are presented in Figure 8A,B).
This presentation shows that there existed at least two types of brines responsible for mineral formation and that the temperatures pointed out by hydrocarbon and aqueous inclusions are diverse.
As presented above, the first approximation of composition and salinities of formation brines are expressed as the NaCl equivalent [20,47,48]. The chemical systems in some groups of inclusions are more complicated, so they should be referred to % equivalent. CaCl2 [21,22,47]. That especially concerns the dolomites (e.g., from the Ba 7 well, depth 3121.6 m), in which the heating after deep freezing reveals two distinct eutectic temperatures and two melting intervals. For exact calculation, however, the percentage of different composition phases should be known, which is not the case due to the lack of suitable Raman studies [21].
The homogenization temperatures of fluid inclusion often represent the minimum trapping temperature [46]. Temperatures of both brine and hydrocarbon inclusions are generally higher than 100 °C, and those of AQFI in different minerals exceed the HCFI values (Figure 8; Table 2).
When using average temperatures of homogenization and ice melting for AQFI in dolomite (B 16) and constructing separate isochores for the oil inclusion, trapping conditions for brine and oil in the mineral may be estimated from crossed isochores [34]. The conditions of intersecting isochores may be around 150–160 °C and 400–420 bars [34]. These calculations, however, should be treated only as a rough estimation since they should be based on the co-trapped inclusion, while the present calculation for the B 16 inclusions has been made on separate individuals.
The occurrence of HCFI in minerals provides information on the diagenetic position of hydrocarbons in individual boreholes. Primary accumulations in the crystal (e.g., dolomite, calcite) point to a common hydrocarbon-brine front, while the secondary position is a proof of the later hydrocarbon migration and cementation. Some of these aspects have been already discussed in short [42] and will be highlighted in a close future [44], and remain in concordance with data by [49].
Based on the character of the organic matter and diagenetic development, some researchers [6,8,10,11] believe that the process of hydrocarbon migration and accumulation in the Main Dolomite occurred in at least two stages. The first stage took place before the Kimmeridgian tectonic restructuring, and was essential for the formation of the present hydrocarbon fields (in that of BMB). The diagenetic events in Ca2 (mainly the anhydritization and the dissolution, and the secondary cementation) have caused a slow healing of primary voids that represented excellent migration paths. The first fluid migration ended before the Kimmeridgian tectonic restructuring with the pore healing by anhydrite. The oil in the primary fluorescing inclusions maybe referred to the first stage of hydrocarbon migration and accumulation. The general characteristics of typical oil corresponds to that shown by [13,14]. The second phase of fluid migration was connected with the formation of structural traps and started after the Kimmeridgian tectonic restructuring. The earlier formed elevations, such as the presently studied Buszewo region, were buried. The hydrocarbons generally migrated concordant to the area dip, i.e., from the NE to SW, filling new structural forms. Most probably, the primary traps remained sealed, being well closed, and sealed with huge complexes of anhydrite and salt deposits [10,12,49]. That process may be reflected in the homogenization temperatures of AQFI and by the secondary hydrocarbon inclusions. Apart from the oil, gas (methane with nitrogen) is present in the area (especially in Mo1), being trapped in inclusions.

6. Conclusions

Although the diagenetic minerals studied come from a large depth of below 3100 m and are easily susceptible to the influence of outer pressures and temperatures, they may have preserved some primary features. The studies conducted in the deposits of the Main Dolomite in the area of the Polish largest gas and oil field Barnówko–Mostno–Buszewo (BMB) and in the Lubiatów field (SG1 well) allow drawing the following conclusions: hydrocarbons occur as inclusions in different types of cements in the rocks; two types of hydrocarbons (oil and gas) are present, trapped as fluid inclusions; primary HCFI are abundant in dolomite and calcite, less frequent in anhydrite and fluorite; their presence points to hydrocarbon migration in the area; the HC inclusions are connected with later stages of diagenetic processes, i.e., they post-date the primary infill of the field; AQFI are often co-present with the HCFI in minerals; brines trapped in inclusions are diversified in their chemical composition and salinity; primary accumulations in crystals (e.g., in calcite) point to common hydrocarbon-brine front, while the secondary position is a proof of hydrocarbon migration later than the formation of the cement studied; if using the results of average temperatures of homogenization and ice melting for dolomite, trapping conditions for brine and oil inclusions may be estimated from crossed isochores for around 150–160 °C and 400–420 bars.
The study material is still too scarce and random to make any trial to predict directions of hydrocarbon migration in the basin.

Funding

The research was financed by the PGI-NRI project No 61.2805.1704.00.0.

Data Availability Statement

Data sharing is not applicable

Acknowledgments

Thanks are due to the management of Polskie Górnictwo Naftowe i Gazownictwo enterprize for the access to rock samples and the publication permission. The author thanks Anna Depowska for her past co-operation. Jan Turczynowicz is acknowledged for the graphics of some figures. Aleksandra Kozłowska and Marta Kuberska are thanked for the development of the petrologic sequence in the Mo1 well. Irena Matyasik and co-workers are acknowledged for the organic matter studies. Thanks should be expressed to Łukasz Karwowski and Tomasz Toboła, whose corrections and kind suggestions helped to improve the first version of the manuscript. Krzysztof Leszczyński is thanked for language corrections. Two anonymous reviewers are thanked for their critical comments and correction suggestions, the application of which resulted in the final version of the paper.

Conflicts of Interest

The author declares no conflict of interest

References

  1. Peryt, T.M.; Dyjaczyński, K. An Isolated Carbonate Bank in the Zechstein Main Dolomite Basin in Western Poland. J. Pet. Geol. 1991, 14, 445–458. [Google Scholar] [CrossRef]
  2. Weil, W.; Radecki, S.; Karnkowski, P.; Jastrzębski, M. Search for Oil and Gas in 1993 and Future Trends. Nafta Gaz 1994, 50, 227–230. [Google Scholar]
  3. Górski, M.; Trela, M. Barnówko-Mostno–Buszewo (BMB)—The Greatest Oil Field in Poland: Geometry and Reservoir Description Based on 3D Survey. Prz. Geol. 1997, 45, 685–692, (In Polish with English Summary). [Google Scholar]
  4. Depowska, A.; (Polskie Górnictwo i Gazownictwo, Warsaw, Poland). Personal communication, 1992.
  5. Mamczur, S.; Radecki, S.; Wojtkowiak, Z. On the Biggest Barnówko-Mostno-Buszewo (BMB) Oil Field in Poland. Prz. Geol. 1997, 45, 582–588, (In Polish with English Summary). [Google Scholar]
  6. Pikulski, L. Sedimentation and Lithofacial Development of the Main Dolomite Deposits (Ca2) in the W Region of the Barnówko-Mostno-Buszewo (BMB) Field, West Poland. Prz. Geol. 1998, 46, 426–435. [Google Scholar]
  7. Karnkowski, P. Development of the Exploration in the Zechstein Deposits on the Polish Lowlands in the years 1945–2000. Prz. Geol. 2000, 48, 423–428, (In Polish with English Summary). [Google Scholar]
  8. Pikulski, L.; Wolnowski, T. Geological Analysis of the Main Dolomite Formation (Ca2) in Western Poland. American Association of Petroleum Geologists Search and Discovery Article. In Proceedings of the AAPG/EAGE International Research Conference, El Paso, TX, USA, 1–5 October 2000; p. 53. [Google Scholar]
  9. Dyjaczyński, K.; Mamczur, S.; Dziadkiewicz, M. From Rybaki to LMG. 45 Years of Oil Production in Polish Lowlands. In Proceedings of the Konferencja Naukowo-Techniczna, Piła, Poland, 1–2 June 2006; pp. 59–76. (In Polish). [Google Scholar]
  10. Dyjaczyński, K.; Kwolek, K.; Mikołajewski, Z.; Peryt, T.M.; Słowakiewicz, M. Microplatforms of the Main Dolomite (Ca2) in Western Poland in the Aspect of Hydrocarbon Prospection. In Proceedings of the 6th Annual Conference of SEPM-CES SEDIMENT, Kraków, Poland, 24–25 June 2009; pp. 14–15. [Google Scholar]
  11. Czekański, E.; Kwolek, K.; Mikołajewski, Z. Hydrocarbon Deposits in the Zechstein Main Dolomite (Ca2) at the Gorzów Block (in Polish with English Abstract). Prz. Geol. 2010, 58, 695–703. [Google Scholar]
  12. Słowakiewicz, M.; Mikołajewski, Z. Upper Permian Main Dolomite Microbial Carbonates as Potential Source Rocks for Hydrocarbons (W Poland). Mar. Pet. Geol. 2011, 28, 1572–1591. [Google Scholar] [CrossRef]
  13. Kotarba, M.J.; Więcław, D.; Kowalski, A. Composition, Genesis and Environment of Oil Generation in the Main Dolomite Deposits in the Western Part of the Foresudetic Area. Prz. Geol. 2000, 48, 436–442. [Google Scholar]
  14. Kotarba, M.J.; Wagner, R. Generation Potential of the Zechstein Main Dolomite (Ca2) Carbonates in the Gorzów Wielkopolski-Międzychód-Lubiatów Area: Geological and Geochemical Approach to Microbial-algal Source Rock. Prz. Geol. 2007, 55, 1025–1036. [Google Scholar]
  15. Dąbrowska–Żurawik, E.; Kotarba, M.J.; Piela, J.; Żołnierczuk, T. On the Results of Isotopic Studies of Hydrocarbons in the Foresudetic Area. Prz. Geol. 1993, 4, 721–724. [Google Scholar]
  16. Biernat, H.; Kulik, S.; Noga, H.; Protas, A. STOP 2. Geology and Resource Potential of the Lower Zechstein. In LXXX Zjazd Naukowy PTG, Szczecin 11–14 września 2010 r. Conference Materials; Karnkowski, P., Piotrowski, A., Eds.; Wydawnictwa Geologiczne: Szczecin, Poland, 2010; pp. 60–65. [Google Scholar]
  17. Wagner, R.; (Polish Geological Institute, Warsaw, Poland). Personal communication, 2000.
  18. Jarmołowicz-Szulc, K. Characteristic Features of Vein Fillings in the Southeastern Part of the Polish Carpathians (Calcite, Quartz, Bitumens). Prz. Geol. 2001, 49, 492–785. [Google Scholar]
  19. Goldstein, R.H.; Reynolds, T.J. Systematics of Fluid Inclusions in Diagenetic Minerals. SEPM Short Course 1994, 31, 199. [Google Scholar]
  20. Brown, P.E. Flincor: A Microcomputer Program for the Reduction and Investigation of Fluid Inclusion Data. Am. Mineral. 1989, 7, 1390–1393. [Google Scholar]
  21. Bakker, R.J. Package FLUIDS 1. Computer Programs for Analysis of Fluid Inclusion Data and for Modeling Bulk Fluid Properties. Chem. Geol. 2003, 194, 3–23. [Google Scholar] [CrossRef]
  22. Bakker, R.J.; Brown, P.E. Computer Modeling in Fluid Inclusion Research. In Fluid Inclusions: Analysis and Interpretation; Samson, I., Anderson, A., Marshall, D., Eds.; Mineralogical Association of Canada: Vancouver, BC, Canada, 2003; Volume 32, pp. 185–203. [Google Scholar]
  23. Matyasik, I.; (Gas and Oil Institute, Cracow, Poland). Personal communication, 2018.
  24. Matyasik, I. Petroleum System of the Silesia and Dukla Units in the Jasło-Krosno-Sanok Region. Nafta Gaz 2009, 3, 201–206. [Google Scholar]
  25. Radke, M.; Welte, D.H.; Willsch, D. Maturity Parameters Based on Aromatic Hydrocarbons: Influence of the Organic Matter Type. Org. Geochem. 1986, 10, 51–63. [Google Scholar] [CrossRef]
  26. Thompson, K.F.M. Fractionated Aromatic Petroleum and the Generation of Gas-condensates. Org. Geochem. 1987, 11, 573–590. [Google Scholar] [CrossRef]
  27. Peryt, T.M.; Piątkowski, T.S. Neomorphic Processes in Oncolitic Deposits of the Zechstein Carbonate in the Peri-Baltic Syneclize. Kwart. Geol. 1977, 21, 257–265, (In Polish with English Summary). [Google Scholar]
  28. Gąsiewicz, A.; Wichrowska, M.; Darłak, B. Sedimentation and diagenesis toward reservoir conditions of the Main Dolomite (Ca2) deposits in the Polish Zechstein basin. In: Analysis of sedimentary basins in the Polish Lowlands. Narkiewicz M. (ed.). Prace Państw Inst. Geol. 1998, 165, 195–206. [Google Scholar]
  29. Sylwestrzak, J. Lithology of sediments and effects of diagenetic processes. Upper Permian–Zechstein. In: Diagenesis of the Upper Permian and Mesozoic sediments of the Kujawy area. Maliszewska A (ed.). Prace Państw Inst. Geol. 1999, 167, 9–21. [Google Scholar]
  30. Jarmołowicz-Szulc, K.; Jasionowski, M. Fluid Inclusion and Isotopic Characterization of Diagenetic Minerals in the SG-1 Borehole, W Poland. In ECROFI-XX 20th Biennial Conferences: ECROFI. Fluid and Melt Inclusions, Using Bubbles to Decode the Earth, Granada, Spain, 21–27 September 2009. Programme and Abstracts; Cambridge University Press: Cambridge, UK, 2009; pp. 121–122. [Google Scholar]
  31. Jarmołowicz-Szulc, K.; Kuberska, M.; Kozłowska, A.; Matyasik, I. A petrographical, mineralogical and geochemical study of the Main Dolomite in Mo-1 borehole. Prz. Geol. 2020, 67, 161–163. [Google Scholar] [CrossRef]
  32. Jarmołowicz-Szulc, K. Estimation of Oil Characteristics: Results Based on Fluorescence Phenomenon and Fluid Inclusion Synthesis and Analysis. Int. J. Curr. Adv. Res. 2017, 6, 2014–2021. [Google Scholar]
  33. Dudok, I.V.; Jarmołowicz-Szulc, K. Hydrocarbon Inclusions in Vein Quartz (the “Marmarosh Diamonds”) from the Krosno and Dukla Zones of the Ukrainian Carpathians. Geol. Q. 2000, 44, 415–424. [Google Scholar]
  34. Munz, I.A. Petroleum Inclusions in Sedimentary Basins: Systematics, Analytical Methods and Applications. Lithos 2001, 55, 195–212. [Google Scholar] [CrossRef]
  35. Jarmołowicz-Szulc, K. Studies on the Filling of the Pore Space in the Rotliegendes Sedimentary Rocks, SW Poland: Fluid Inclusions, Luminescence, Isotopes. In Proceedings of the PACROFI VII., Program and Abstracts, Las Vegas, NV, USA, 1–4 June 1998; p. 36. [Google Scholar]
  36. Jarmołowicz-Szulc, K. Fluid Inclusion Analysis in Minerals in the Sedimentary Rocks in Polan-an Overview and Remarks. Biul. Państw Inst. Geol. 2015, 464, 25–41, (In Polish with English Summary). [Google Scholar] [CrossRef]
  37. Jarmołowicz-Szulc, K. Hydrocarbon Inclusions in Cements of Sedimentary Rocks and in Vein Minerals–Characteristics and Significance. Biul Państw Inst. Geol. 2016, 466, 87–102, (In Polish with English Summary). [Google Scholar] [CrossRef]
  38. Karnkowski, P.H. Permian Basin as a Main Exploration Target in Poland. Prz. Geol. 2007, 55, 1003–1015. [Google Scholar]
  39. Goldstein, R.H. Fluid Inclusions in Sedimentary and Diagenetic Systems. Lithos 2001, 55, 159–193. [Google Scholar] [CrossRef]
  40. George, S.C.; Ruble, T.E.; Dutkiewicz, A.; Eadington, P.J. Assessing the Maturity of Oil Trapped in Fluid Inclusions Using Molecular Geochemistry Data and Visually-determined Fluorescence Colors. J. Appl. Geochem. 2001, 16, 451–473. [Google Scholar] [CrossRef]
  41. Ping, H.; Chen, H.; George, S.C. Quantitatively Predicting the Thermal Maturity of Paleo-oil Trapped in Fluid Inclusions Based on Fluorescent and Molecular Geochemical Data of Oil Inclusions in the Dongying Depression, Bohai Bay Basin. AAPG Bull. 2020, 104, 1751–1791. [Google Scholar] [CrossRef]
  42. Jarmołowicz-Szulc, K. Selected Elements of Petrologic Research in Main Dolomite from the BMB Deposit. Prz. Geol. 2019, 67, 161–163. [Google Scholar]
  43. Nandakumar, V.; Jayanthi, J.L. Hydrocarbon Fluid Inclusions, API Gravity of Oil, Signature Fluorescence Emissions and Emission Ratios: An Example from Mumbai Offshore, India. Energy Fuels 2016, 30, 3776–3782. [Google Scholar] [CrossRef]
  44. Jarmołowicz-Szulc, K.L. Using Hydrocarbon and Aqueous Inclusions to Trace Fluids in Different Geological Environments in Poland-A Review. Geol. Q. 2021. In Review. [Google Scholar]
  45. Li, B.; Mai, B. The Application of Fluorescence Spectrum of Organic Inclusions to Studying Evolution and Migration of Petroleum. In Proceedings of the Fourth Biennial Pan-American Conference on Research on Fluid Inclusions, PACROFI IV, Program and Abstracts, Lake Arrowhead, CL, USA, 22–24 May 1992; p. 53. [Google Scholar]
  46. Roedder, E. Fluid Inclusions. In Reviews in Mineralogy; Mineralogical Society of America: Blacksburg, VA, USA, 1984; Volume 12, p. 646. [Google Scholar]
  47. Shepherd, T.J.; Rankin, A.H.; Alderton, D.H. A Practical Guide to FI Studies; Blackie: New York, NY, USA, 1985; 430p. [Google Scholar]
  48. Bodnar, R.J. Interpretation of Data from Aqueous-electrolyte Fluid Inclusion. In Fluid Inclusions: Analysis and Interpretation. Short Course; Samson, I., Anderson, A., Marshall, D., Eds.; Mineralogical Association of Canada: Vancouver, BC, Canada, 2003; Volume 32, pp. 81–101. [Google Scholar]
  49. Kosakowski, P.; Krajewski, M. Hydrocarbon Potential of the Zechstein Main Dolomite in the Western Part of the Wielkopolska Platform, SW Poland: New Sedimentological and Geochemical Data. Mar. Petrol. Geol. 2013, 49, 99–120. [Google Scholar] [CrossRef]
Figure 1. Location and geological structure of the BMB field. After [17], modified. 1—oil or gas field; 2—slope of carbonate platform; 3—marginal oolitic barrier; 4—basin plains (generalized); 5—carbonate platform; o—wells. Cychry—name of another small field.
Minerals 11 00500 g001
Figure 2. Petrography of the rocks under studies. (A,B)—Ooid grainstone, B 9, depth 3133.45 m; Scale bar—500 μm (A). Ooids are cemented by anhydrite (anh) or carbonates (Ca). CL image shows detailed complicated structure of ooids. (C,D)—Anhydrite crystals (anh) filling space between fine crystallized carbonates (Ca). Ba 7, depth 3123.55 m; (E,F)—Anhydrite and small carbonate aggregates. Mo 1, depth 3402.7 m. Arrows point to the same places in transmitted and CL images.
Minerals 11 00500 g002
Figure 3. Diagenetic sequence in BMB wells combined with homogenization temperatures of brines in inclusions (partly based on the sequence by [31]).
Minerals 11 00500 g003
Figure 4. Fluid inclusions in minerals in the Ba 7 well and their fluorescence. (A) Inclusions in dolomite crystal. Ba 7, depth 3123.35 m. (B) Some secondary FIAs display fluorescence in UV. (C) Inclusions in anhydrite crystal. (D) Fluorescent inclusions in anhydrite crystal. E. Inclusions in calcite. (F) No fluorescence of inclusions. (A,B,E)—Polarizing microscope; transmitted light, one polarizer; (B,D,F)—reflected light, ultraviolet. Arrows in A and B images show corresponding fluid inclusion assemblages (selected).
Minerals 11 00500 g004
Figure 5. Fluid inclusions in calcite and anhydrite in B 5 and B 17 wells. (A) Fluid inclusions in calcite crystals. B 5, depth 3116.4 m. (B) Faint fluorescence discovers a secondary assemblage. (C) Two-phase inclusions (AQFI) in calcite. B 5, depth 3116.4 m (D) Fluorescence of some inclusions. (E) Inclusions in anhydrite veinlet. B 17, depth 3117.4 m. (F) Fluorescence of inclusions in anhydrite. (A,C,E)—Polarizing microscope; transmitted light, one polarizer; (B,D,F)—Polarizing microscope; reflected light, ultraviolet. Scale of images—the same in pairs. Arrows in both types of images show corresponding FIA (selected).
Minerals 11 00500 g005
Figure 6. Histograms of homogenization temperatures of two-phase hydrocarbon (HCFI) and brine (AQFI) inclusions in dolomite (B 16, depth 3141.35 m). (A) Homogenization temperatures of hydrocarbon inclusions (HCFI); (B) Homogenization temperatures of brine inclusions (AQFI).
Minerals 11 00500 g006
Figure 7. Chromatograms of saturated and aromatic bitumen fractions in samples from B 9 and Ba7 wells. (A) Composition of hydrocarbons from saturated fraction of bitumen extract in range from n-C16 to n-C32 (B 9). (B) Composition of hydrocarbons from saturated fraction of bitumen extract in range from n-C15 to n-C32 (Ba7). (C) Composition of hopanes (m/z = 191) in the sample of bitumen extract (Ba7). (D) Composition of steranes (m/z = 217) in the sample of bitumen extract (Ba7). (EH): The mass spectrograms of the aromatic fraction. (E) Composition of phenantrene and its derivatives in aromatic fraction of bitumen extract (B 9). (F) Composition of phenantrene and its derivatives in aromatic fraction of bitumen extract (Ba7). Abbreviations: MP—methylophenentrenes; MDBT—methylodibenzotiophenes; DMBT—dimethylodibenzotiophenes; TMDBT—trimethylodibenzotiophenes.
Minerals 11 00500 g007aMinerals 11 00500 g007b
Figure 8. Characteristics of fluids trapped in inclusions in minerals from BMB wells. (A) Homogenization temperature of fluid inclusions in calcite, dolomite, anhydrite, and quartz; (B) Salinity of brines (calculated using Flincor [20]).
Minerals 11 00500 g008
Table 1. Characteristics of hydrocarbons in inclusions in dolomite, calcite, fluorite, and anhydrite.
MineralWellFluorescence ColorShape and Distribution of InclusionsCharacter of InclusionsHomogenization
(Th)
(°C)
Estimation of Q Parameter *Estimation of Gravity
(°API) *
DolomiteB 16White–blueSlightly elongated, linear arrangement according to crystal directionsPrimary126–1350.2–0.1Light oil, paraffin, mature
41–42
DolomiteB 16White–blue/yellow
AnhydriteB 16White–blueGeometric, two-phasePrimary107–123 0.2Light oil, paraffin, mature
Over 41
FluoriteB 13White–blueFine FI, linear arrangement or clouds around fissuresPseudo-secondary Over 41Light oil, paraffin, mature
0.2
CalciteB 9 White–blueSlightly elongated, FI, sporadic groupsSecondary115–130 Over 41Light oil, paraffin, mature
0.2
* Estimations conducted based on the method proposed in [32].
Table 2. Characterization of the filling of AQFI in different minerals in the B and Ba wells *.
WellMineralTh
(°C)
Tm
(°C)
Weight
% NaCl Equivalent
Mole Fraction NaClFluid Density (g/cm3)
B 12Calcite138−19.722.150.0811.09
B 12Calcite136−19.722.150.0811.09
B 12Calcite142−19.722.150.0811.08
B 12Calcite110−4.67.250.0240.99
B 12Calcite112−4.06.370.0210.99
B 12Calcite113−4.06.370.0210.99
B 11Calcite (fan-like)91.6−13.517.330.0611.08
B 11Calcite (fan-like)93−19.018.710.0791.13
B 11Calcite (mosaic)93−6.59.840.0331.02
B 9Calcite92−17.09.840.0721.02
B 9Calcite101−14.017.780.0621.08
B 9Calcite114−6.810.230.0341.01
B 9Calcite114−4.36.820.0220.99
Ba 7 Dolomite92.5−7.811.460.0381.03
Ba 7Dolomite97.6−7.811.460.0381.02
Ba 7Dolomite92.5−11.415.370.0531.06
Ba 7Dolomite97.6−11.415.370.0531.06
B 13Anhydrite106−17.920.870.0751.11
B 13Anhydrite132−17.920.870.0751.08
B 13Quartz115−8.712.520.0421.02
B 13Quartz112−8.712.520.0421.02
B 13Quartz120−8.712.520.0421.02
B 10Quartz103−19.421.940.0801.12
B 10Quartz110−19.421.940.0801.12
* Calculations using Flincor program according to [20].
Table 3. Results of analyses of extractable organic matter.
WellTOC 1
[% m/m]
ESO
[ppm]
Group Content of Bitumen [% m/m]ESO
TOC
HC
TOC
HC
HZ
Hydrocarbons HCHeterocompounds HZ
SaturatedAromaticResinsAsphaltenes
B9 1.74899771.018.57.82.7517.1462.88.5
Ba7 0.50309072.218.56.13.2618.0560.59.8
Ba7 0.60187572.317.66.14.0312.5280.98.9
1 TOC—total organic carbon, ESO—extractable organic matter; HC—hydrocarbons, HZ—heterocompounds.
Table 4. Results of calculation of geochemical parameters.
WellPr/PhPr/n-C17Ph/n-C18Sterane
C27[%]
Sterane
C28[%]
Sterane
C29[%]
S/(S+R)
C29αα ster
ββ/(αα+ββ)
C29 ster
MPI-1R(MPI-1)
[%]
MDRR(MDR) [%]
B 9 0.201.351.341529560.410.521.211.132.960.73
Ba7 0.310.781.34n.d.n.d.n.d.0.430.431.401.243.190.74
Ba7 0.350.901.38n.d.n.d.n.d.0.460.461.101.063.590.77
n.d.—not determined.
Publisher’s Note: MDPI stays neutral with regard to jurisdictional claims in published maps and institutional affiliations.

