Article

Analytical Approach for the Study of Teotihuacan Mural Paintings from the Techinantitla Complex

by
José Luis Ruvalcaba-Sil
1,*,
Luis Barba
2,
Edgar Casanova-González
3,
Alejandro Mitrani
1,
Margarita Muñoz
4,
Isaac Rangel-Chavez
1,
Miguel Ángel Maynez-Rojas
1 and
Jaqueline Cañetas
1
1
Laboratorio Nacional de Ciencias para la Investigación y Conservación del Patrimonio Cultural, Instituto de Física, Universidad Nacional Autónoma de México, Circuito de la Investigación Científica s/n, Ciudad Universitaria, Mexico City 04510, Mexico
2
Laboratorio de Prospección Arqueológica, Instituto de Investigaciones Antropológicas, Universidad Nacional Autónoma de México, Mexico City 04510, Mexico
3
CONACyT–Laboratorio Nacional de Ciencias para la Investigación y Conservación del Patrimonio Cultural, Instituto de Física, Universidad Nacional Autónoma de México, Circuito de la Investigación Científica s/n, Ciudad Universitaria, Mexico City 04510, Mexico
4
Posgrado en Historia del Arte, Universidad Nacional Autónoma de México, Mexico City 04510, Mexico
*
Author to whom correspondence should be addressed.
Minerals 2021, 11(5), 508; https://doi.org/10.3390/min11050508
Submission received: 6 April 2021 / Revised: 4 May 2021 / Accepted: 6 May 2021 / Published: 11 May 2021

Abstract

:
Techinantitla building complex, in the Amanalco neighborhood of the ancient city of Teotihuacan, is famous for the iconography and quality of the mural paintings found in this site. A significant part of this heritage has been lost due to looting. In recent years, an interdisciplinary research project was developed to study the limited patrimony that was left. As part of this study, we first employed geophysical techniques to reconstruct the architectural pattern of the compound’s remaining walls, where other paintings may still be found. Then, we applied a non-invasive methodology to characterize a large set of fragments recovered in the 1980s and to gain information on their pigments and manufacturing techniques. This methodology included False Color Infrared Imaging, X-ray Fluorescence and Fiber-Optics Reflectance Spectroscopy, and led to the identification of hematite, calcite, malachite, azurite and an unidentified blue pigment. The results were compared with a previous study performed on a set of Techinantitla mural paintings looted in the 1960s. A broader comparison with contemporary mural paintings from other Teotihuacan complexes shows good agreement in the materials used. These results may suggest a standardization in the making of Teotihuacan mural painting during the Xolapan period (350 to 550 AD).

1. Introduction

Mural paintings were an important part of the Mesoamerican landscape, and its remains include outstanding and sophisticated artworks. Particularly in Teotihuacan, one of the main civilizations in Central Mexico, the techniques and the use of materials reached a high level of development from the first century BC until 550 AD, when the city began to be abandoned [1,2,3,4].
The city was organized in neighborhoods around the civic and ceremonial center, with several of these complexes standing out for their mural paintings: Tetitla, Tepantitla, Quetzalpapalotl, Zacuala and Techinaltitla [3,5]. These mural paintings underwent a technical and material evolution, as proposed and described by Magaloni [6,7,8]. with additional contributions by other authors [9,10,11,12,13], which reached its peak in quality of the pictorial and manufacturing techniques during the Xolalpan period (350 to 550 AD).
Techinantitla was located in the neighborhood of Amanalco (Figure 1), northeast of Teotihuacan’s civic and ceremonial center. This neighborhood is well known for its mural paintings of high plastic and aesthetic quality. Sadly, the site was seriously looted in the 1960s, and the limited remains that were left have been poorly studied.
The corpus of mural paintings looted from the site comprises 145 wall painting fragments with images of medium and large dimensions. The fragments were illegally sold on the black market between 1962 and 1965, and are kept in different museums, as well as in public and private collections in the United States, Mexico, Europe and the Middle East. Almost all of them have been restored, so now only limited information can be obtained about their materials and pictorial techniques. In 1976, about 80 of these fragments were bequeathed to the Fine Arts Museums of San Francisco, Ca.—now at the de Young Museum—with just over half of the pieces returning to Mexico in 1986. A previous study of all 80 fragments that were part of this collection provides some information on the materials used [14].
A second set, made up of almost 1500 small and medium fragments, was found and collected in 1984 on the surface of the site by René Millon. The Arizona State University Teotihuacan Research Laboratory (located in San Juan Teotihuacan, Mexico) is in charge of this collection. These fragments, due to their line and iconography, have been linked to those stolen sixty years ago and to other mural paintings located in situ.
The analysis of this second set—which has not been intervened—can provide information on the material culture in the last phase of ancient Teotihuacan (late Xolalpan, 450–550 AD), and offers a great opportunity for an interdisciplinary study using non-invasive techniques, approaching the problem from art history, archaeometry, physics, chemistry and earth sciences.
As part of the methodology followed, the site was first studied with geophysical techniques to reconstruct the architectural pattern of the compound’s remaining walls. This included drone aerial photography, topography, magnetic gradient, electric resistivity and georadar surveys, and allowed identifying dipole lines produced by walls.
Afterwards, a non-invasive methodology was applied on a selection of the small fragments of mural painting recovered by Millon to characterize the pigments and obtain information on their manufacturing techniques. The methodology involved False Color Infrared imaging (FCIR) to scan the pictorial surface and, depending on its response, classify the main pigmented areas. This also provided a first approach for the characterization of the materials present, which was then verified by X-ray Fluorescence (XRF) and Fiber Optic Reflectance (FORS) spectroscopies. To complement these results, Scanning Electron Microscopy (SEM) was applied on select samples.
We compared the information obtained from our study with that available from the report of the previous study performed at the de Young museum [14]. In this way, we expect to recover the dignity of a badly damaged cultural heritage and provide some information on the painting techniques used in this important neighborhood.
The establishment of links between architecture and the remaining mural painting fragments related to the Amanalco neighborhood may provide new insights about the origin and possible location of the images and motifs extracted from the site.

2. Materials and Methods

2.1. Geophysical Prospection

Between 2016 and 2018, the Archaeological Prospection Laboratory carried out geophysical studies in order to detect buried walls in Techinantitla, covering an area of 140 by 60 m, slightly larger to the north than the area studied by René Millon [11,15]. The strategy included the magnetic gradient for detecting dipole alignments, but due to the presence of stones dispersed on the surface, it was important to verify the presence of some walls with electric resistivity. Information concerning depth was provided by georadar and allowed to confirm the location and the shape of some of the buried structures.

2.1.1. Magnetic Gradient

The magnetic survey was carried out on the surface immediately after completion of the field-walking reconnaissance. The selected area was surveyed in 20 by 20 m grid units using a Geoscan FM36 fluxgate gradiometer (Geoscan Research, Clayton, UK), and the land was sampled at intervals of 0.25 m in transects with Teotihuacan’s north direction and a 1 m distance between them, resulting in a total of 25,600 magnetic gradient readings.

2.1.2. Electrical Resistivity

In order to establish a correlation between the magnetic gradient data and the GPR, the electrical resistivity was measured in the central grids where the profiles with GPR were also acquired. Data was collected in 20 by 20 m grid units, with a Geoscan RM15 instrument (Geoscan Research, Clayton, UK) every 1 m.

2.1.3. Ground Penetrating Radar (GPR)

This part of the geophysical survey was performed using a ground penetrating radar GSSI, model SIR-3000 equipped with a 400 MHz monostatic antenna (Geophysical Survey Systems, Inc., Nashua, NH, USA). This device was used as a complementary method to the previous geophysical techniques, and lines of verification were selected in the main grids where the most important magnetic and electric anomalies appeared.

2.2. Mural Painting Analysis

2.2.1. Fragment Selection

Of the 1498 fragments recovered by Millon from Techinantitla, 889 are monochrome in red (59%), and 609 are polychrome in shades of green, yellow, blue-gray, blue, pink and red (41%). From these, a subset of 83 small fragments was selected for analysis (5.3% of the 1498 fragments). This sample is composed of 9 monochrome red fragments (11%), 10 bichromes in pink and red (12%), and 64 polychromes (77%); three of them have an iconography that can be related to fragments bequeathed to the museums of San Francisco, but most of the fragments are probably related to the mural remains that should still be in the site (Table 1).

2.2.2. False Color Infrared Imaging (FCIR)

Visible and near infrared (NIR) images were captured with a Sony Handycam HDR-PJ760V10 camera (Sony Group Corporation, Tokyo, Japan). NIR images were captured in Nightshot mode with an external IR 760 nm filter (Hoya, Tokyo, Japan) to eliminate the contribution of visible light. The photographed areas were illuminated using two Lowel Tota halogen lamps (3200 K). To generate the FCIR images, the visible and NIR images were processed with Photoshop CC (Adobe Inc., Mountain View, CA, USA). In this procedure, the data from the green and red channels of the visible image are transferred to the blue and green channels, respectively. Then, the data corresponding to the red channel in the infrared image is moved to the now available red channel in the visible image [17,18,19].

2.2.3. X-Ray Fluorescence (XRF)

Elemental information was acquired with a Tracer-III SD (Bruker Corporation, Billerica, MA, USA) handheld spectrometer equipped with a rhodium X-ray tube. Acquisition conditions were 40 kV, 11 μA and 30 s integration time. The acquired spectra were processed with PyMCA software (ESRF, Grenoble, France) [20] in order to measure the X-ray intensities from the specific elements. The analyzed surface is an ellipse with major and minor axes of approximately 9 and 7 mm, respectively.

2.2.4. Fiber-Optics Reflectance Spectroscopy (FORS)

A portable FieldSpect-4 (ASD Inc., Boulder, CO, USA) was used to acquire visible, NIR and shortwave near infrared (SWNIR) reflectance and absorbance (log(1/R)) spectra. A noncontact 8-degree probe was used which is placed eight cm above the sample. A D65 illuminant provides illumination over the whole spectral range. The analysis area is about 3 mm in diameter and spectra were obtained with a 0.2 s integration time. In absorbance mode, data is processed with the Kubelka–Munk theory [21,22]. Calibration was performed using a certified reflectance standard (AS-02035-000CSTM-SRM-990-362, ASD Inc). For analytical purposes, the visible and NIR regions are presented together in a region named visible-near infrared (VNIR). VNIR ranges from 300 nm to 1000 nm and SWNIR ranges from 1000 nm to 2500 nm. Inflection points were determined using the first derivative of the spectrum, which was obtained with Origin Software (OriginLab Corporation, Northampton, MA, USA).

2.2.5. Microscopic Examination

A portable digital microscope Dinolite model AF4915ZT (AnMo Electronics Corporation, Hsinchu City, Taiwan) with a polarizer was used for acquiring optical microscopy images at 100 and 200× enhancements.
Scanning Electron Microscopy (SEM) was carried out with a TM3030 microscope (Hitachi®, Tokyo, Japan). Both backscatter images (BSE) and elemental distribution maps via energy dispersive spectroscopy (SEM-EDS) were acquired with 15 keV electrons. This method was applied to characterize small bright inclusions present in the red areas of selected small fragments that could fit in the analysis chamber (less than 4 cm per side).

3. Results and Discussion

3.1. Geophysical Prospection

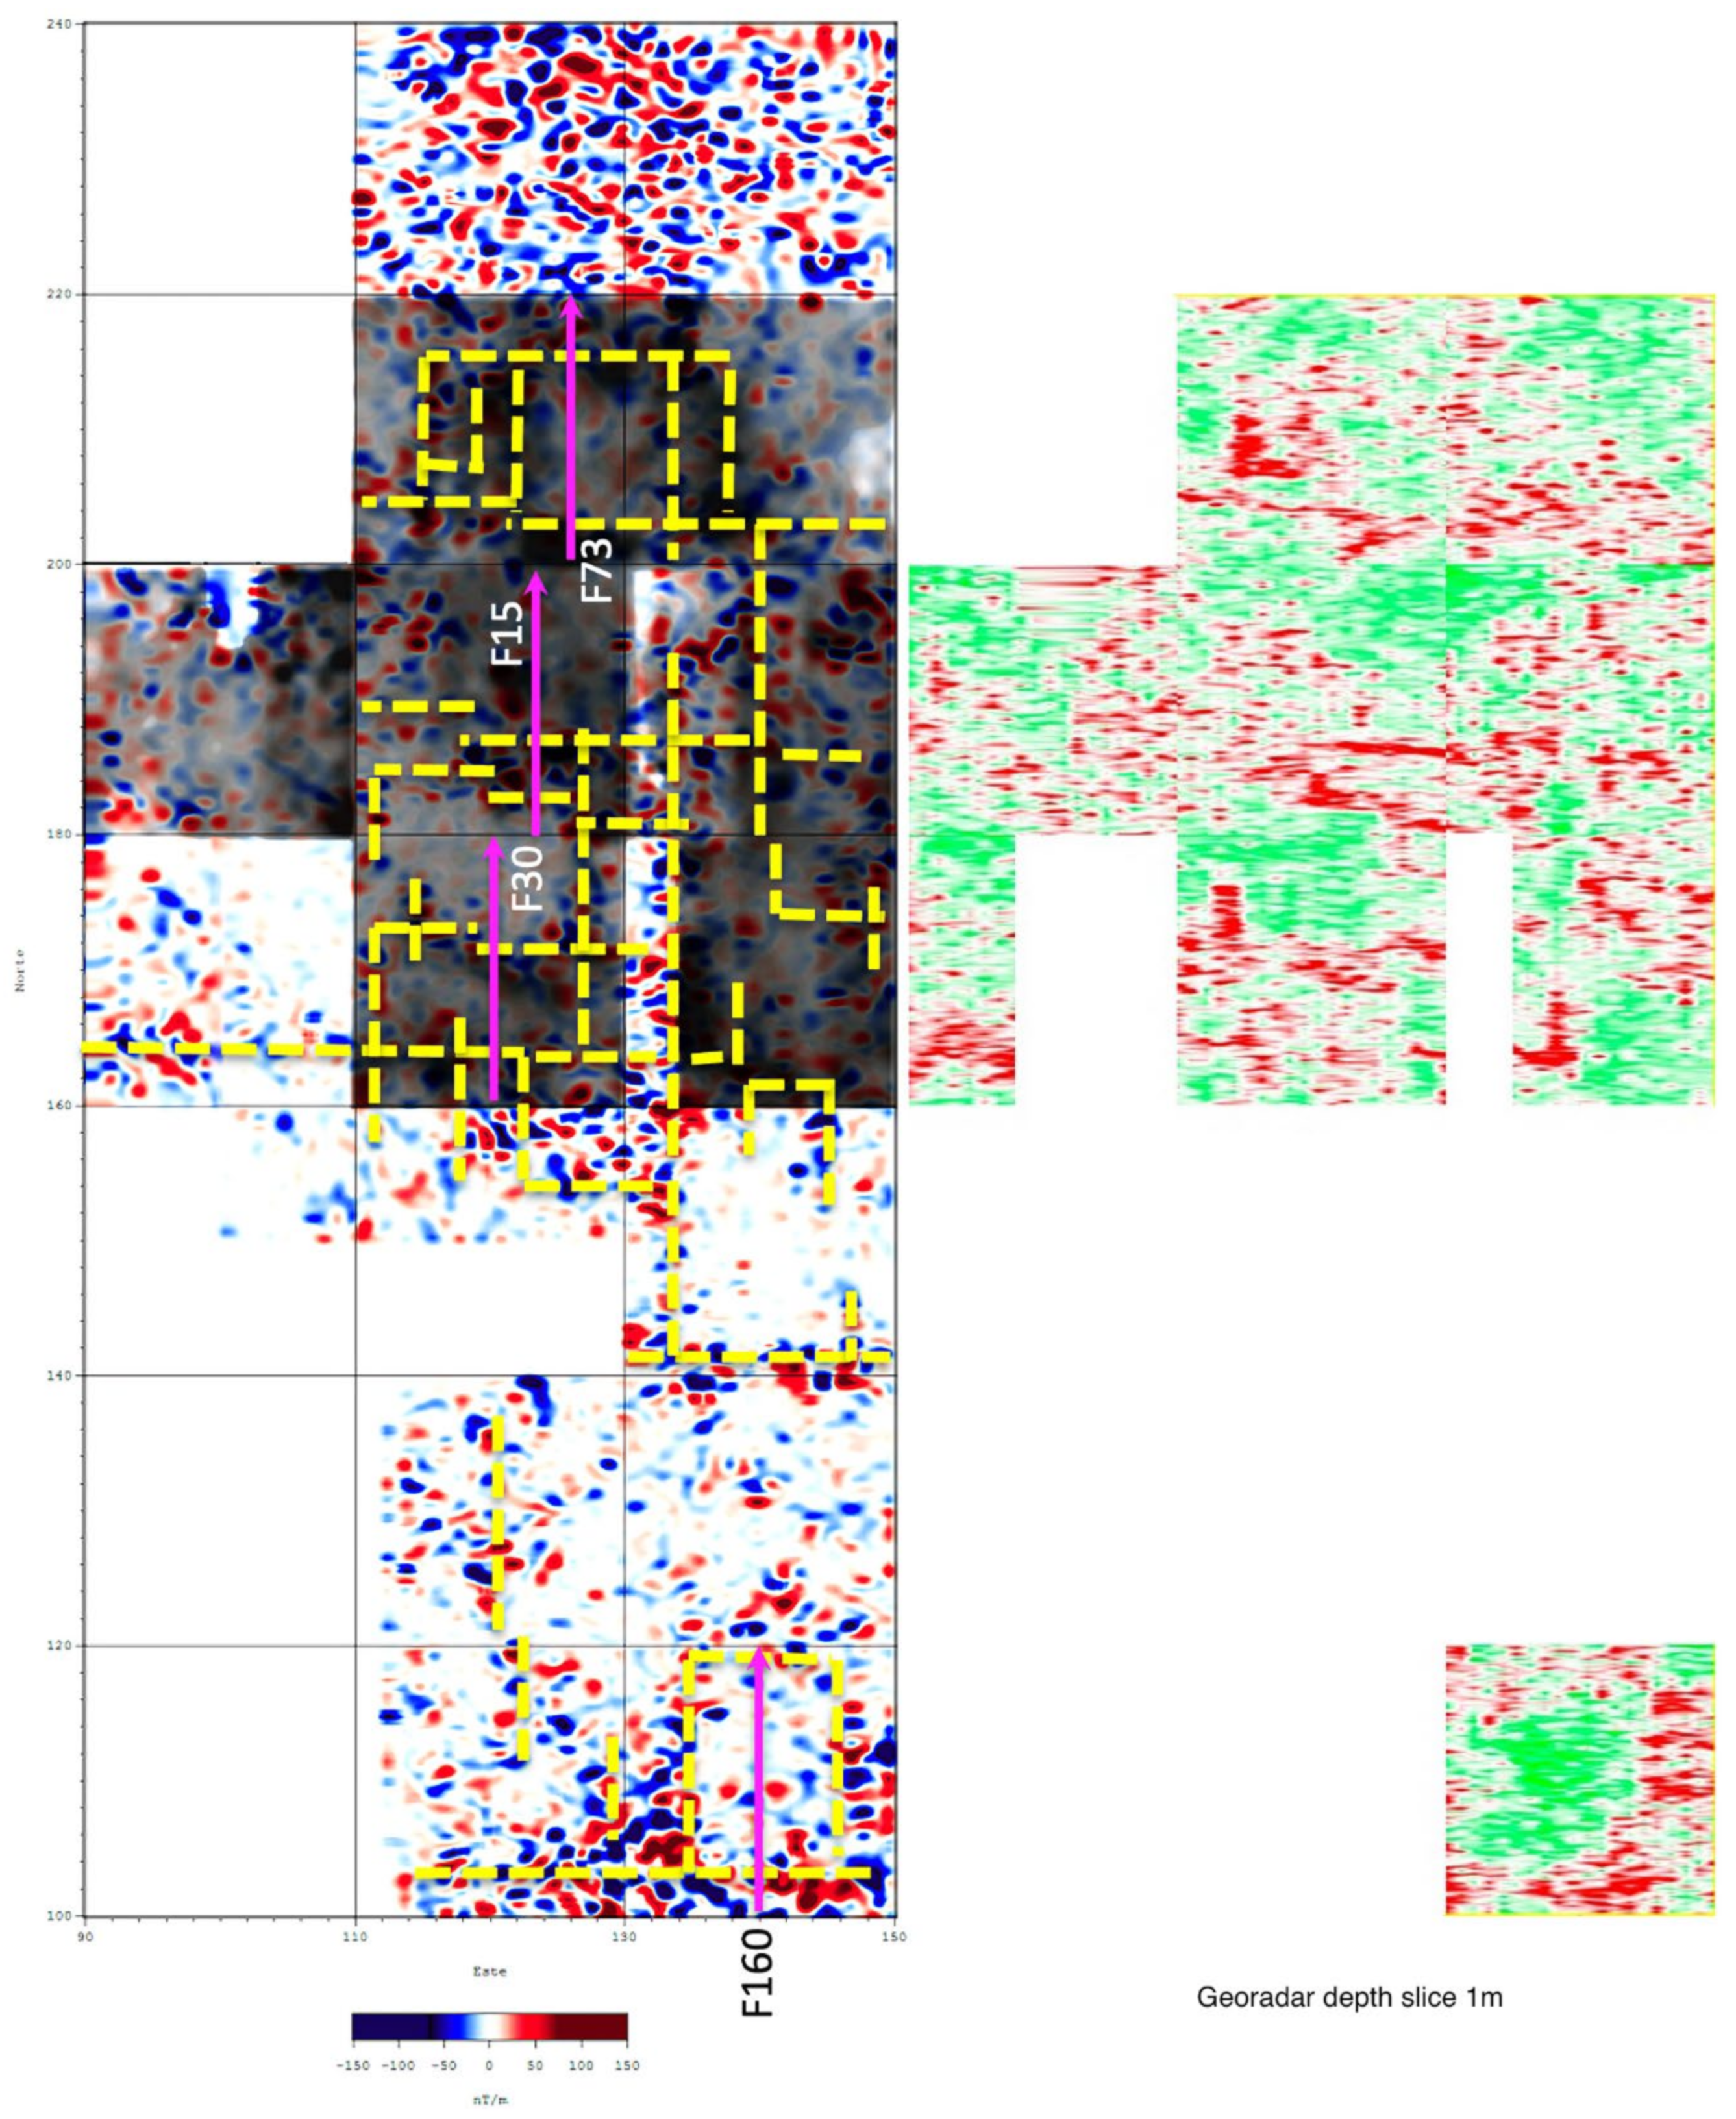
The surveyed area is shown in Figure 2. The magnetic gradient and the electric resistivity maps are shown integrated in Figure 3, along with the lines that were measured using the georadar.
Geophysical anomalies interpreted as walls were compared with the topographic map and some descriptions of the intervention performed by Millon in 1984. Geophysical data allowed us to identify four large open spaces interpreted as patios, but one of them seems to correspond to the temple described by Millon. Furthermore, we located some of the excavated areas where murals were looted and some of the walls where in situ murals were found in 1984.
In Figure 3, yellow dotted lines represent the hypothetical emplacement of the detected buried walls that form part of the architectural spaces. Due to the fact that the walls were built with volcanic stones glued together with clayish mortar, aligned magnetic dipoles are interpreted as walls that can be differentiated from the random surface dispersion of small stones. Subsequent discrimination and verification is a consequence of contrasting with electric resistivity and georadar maps as information layers.
Selected lines marked in pink in Figure 3, are presented as individual radargrams as an example of the characteristics of the underground.
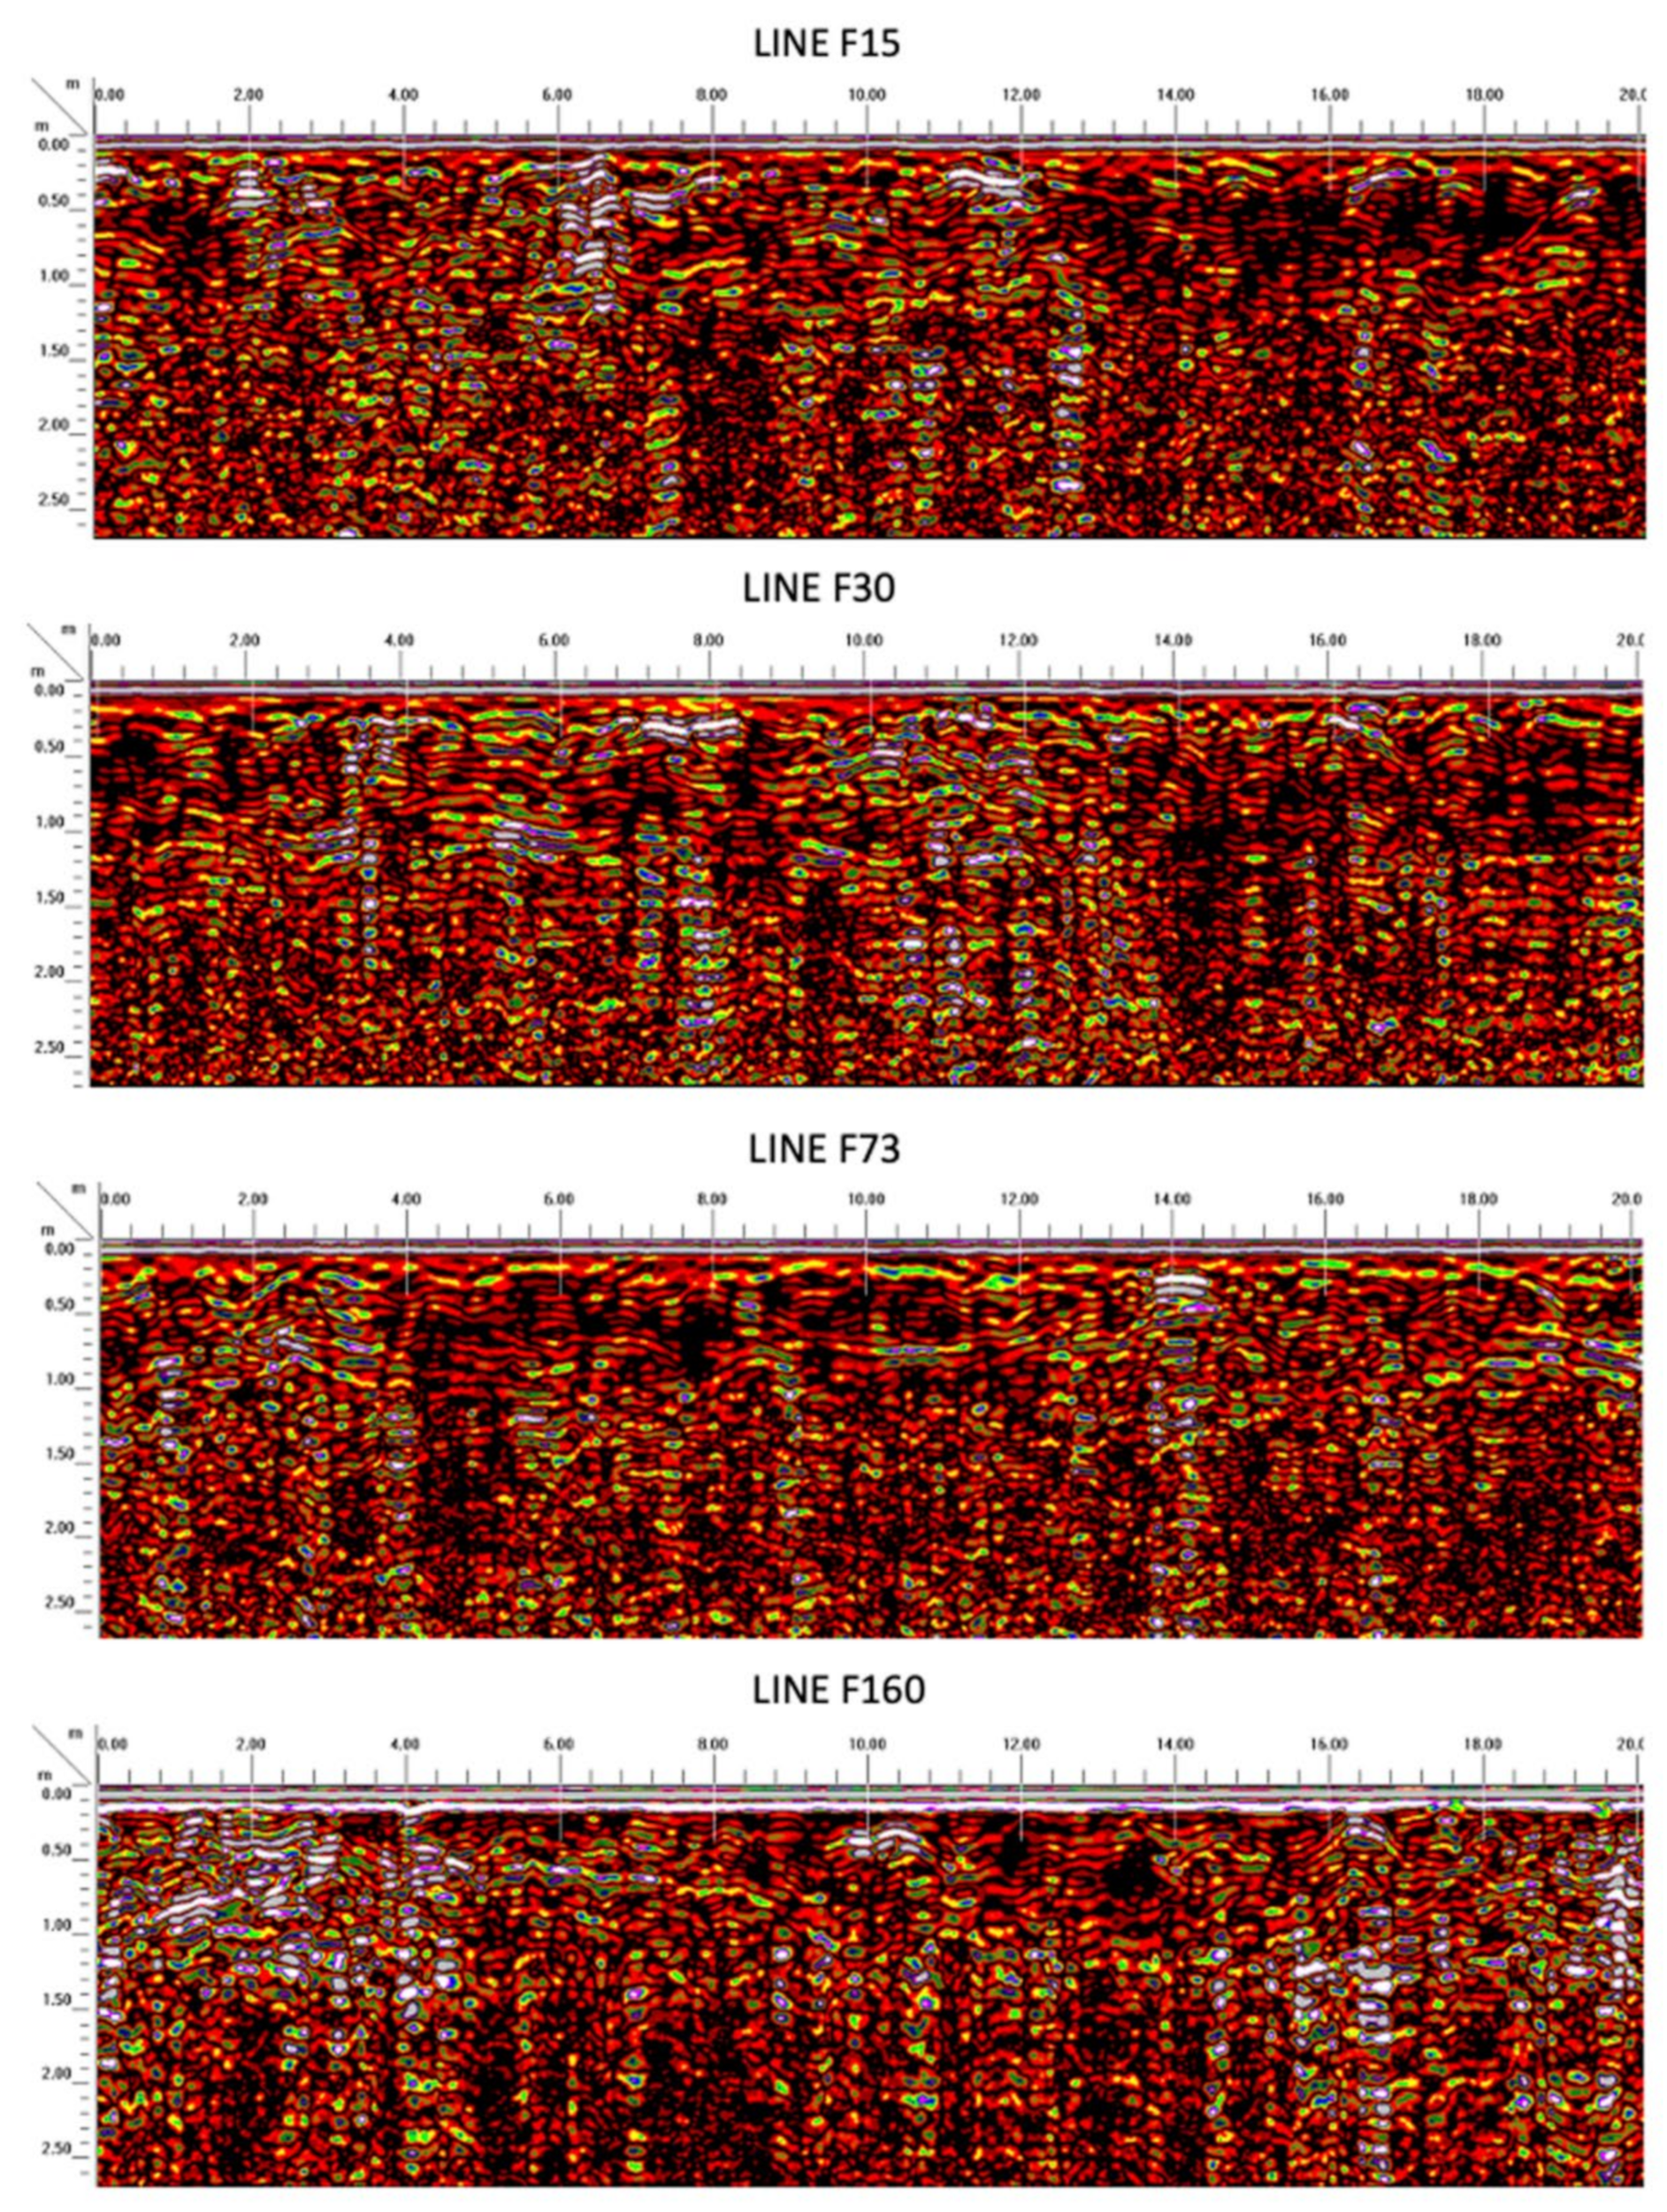
Line F73, in the north edge, shows the presence of two reflections interpreted as walls, in meter 3 and 14, both delimiting an open space about 11 m N-S. In the case of lines F15 and F30, they are placed in the topographic upper part of the terrain, and we can observe a diffuse horizontal contact about 1 m depth, interpreted as a floor.
Even more interesting, in line F15, we can see both shallow walls in meters 2, 6.5 and 11.5, but also the deeper ones, in meters 7 and 13, below one meter depth, that suggests a previous building stage (Figure 4). Reflection in 2 m corresponds to the northern limit of a square open space in the map (Figure 3). Between 2 and 6.5 m, we can identify a small room. Between 12 and 20 m, we can see another open space with no reflections.
Line F30 is in the upper, central part of the terrain. It shows a room placed between 3 and 8 m (Figure 4). Then, from 12 to 20 m, we can see a homogeneous fill that is part of a square open space. Deeper walls from a previous constructive stage, at a depth of more than 1 m, can be observed from 7.5 to 13 m in the central part of the radargram.
Line F160 was placed to verify the southernmost rectangular space. In 2–3 m, we can see reflections of a collapsed wall that closes the south side, while in 16–17 m, we have the opposite wall closing the north side of this rectangular space. In 10 m, it is possible to have a central altar in this plaza (Figure 4).
In general terms, radargrams verify the presence of walls in the places that magnetic and electric data had predicted, while they also provide information on the floor depth that allows the estimation of the wall’s height. With this information, we propose that in the central part of the site there are at least two construction stages, while only one in the peripheral areas.
Results from this study support the proposal that, besides the already looted walls, there are many other walls with high probability of having mural paintings. A scientific archaeological excavation might provide additional information to verify the relationship between in situ murals and those fragments exhibited in museums.

3.2. Mural Fragments Analysis

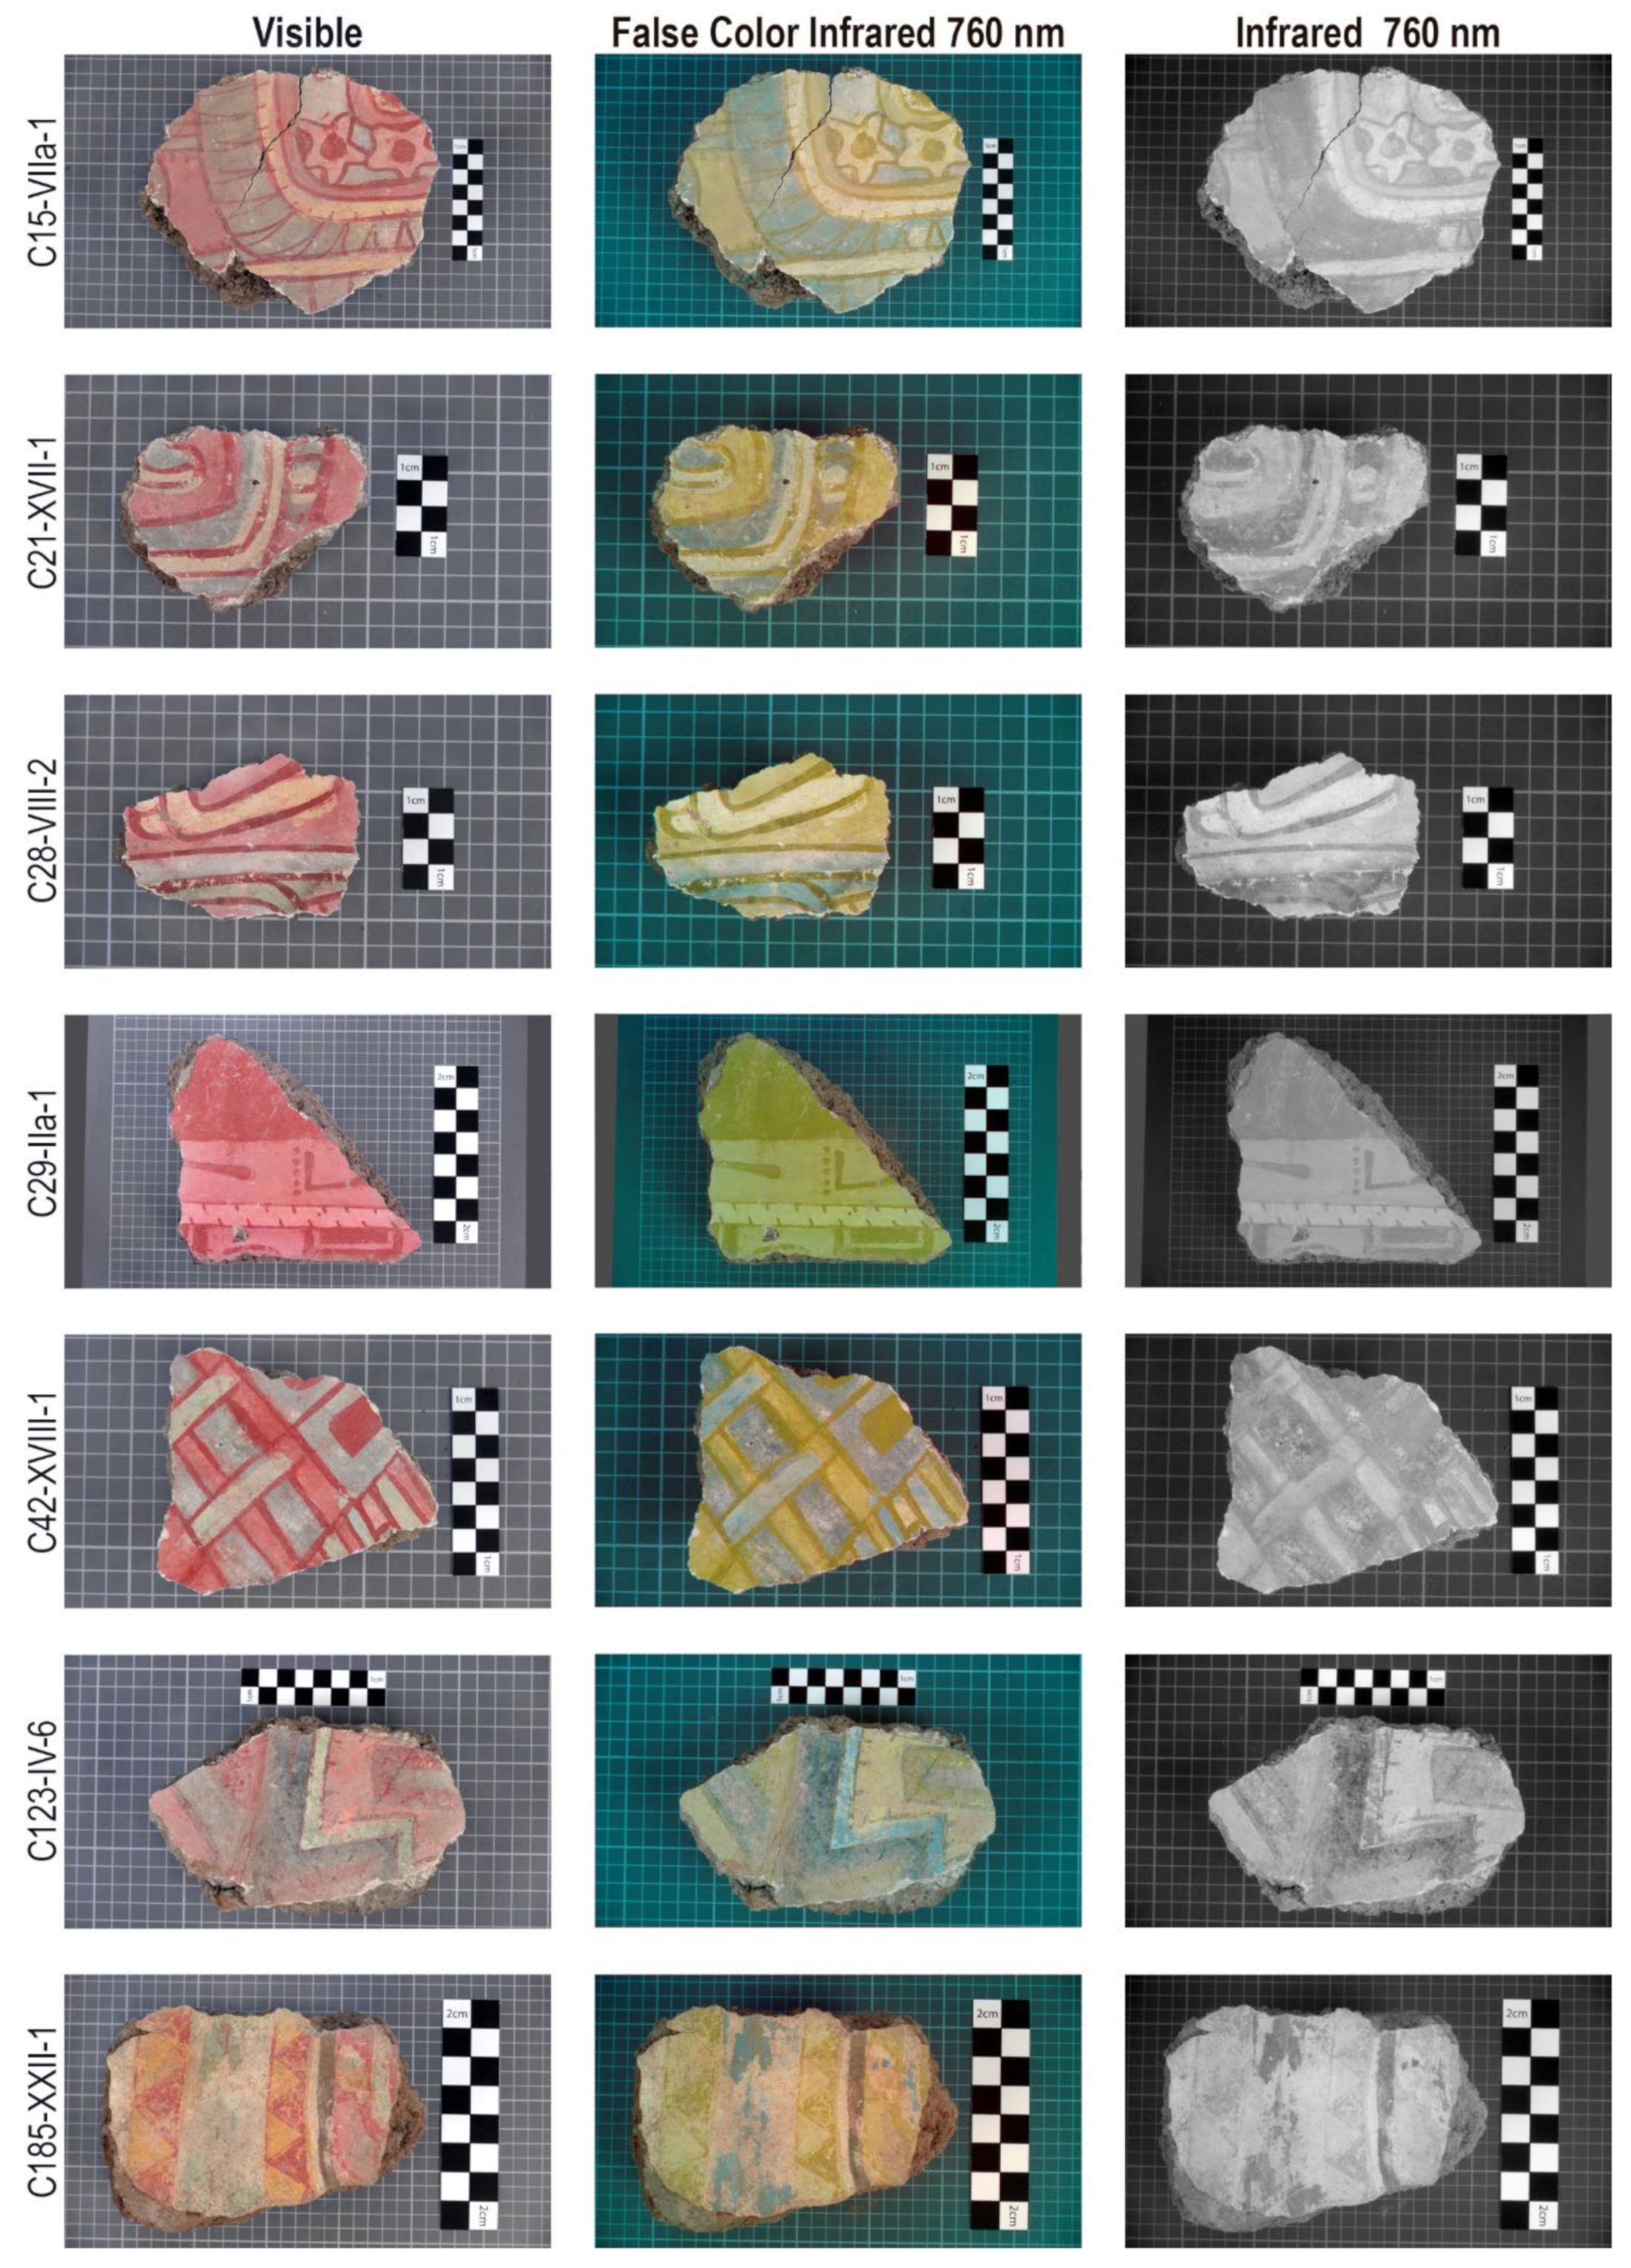
A general overview of the pigments can be established from the FCIR imaging and a comparison with pigment references. FCIR results for select fragments are shown in Figure 5. This method allows the selection of specific regions and representative fragments for further spectroscopic analyses, considering that the colors with the same behavior in FCIR correspond to the same pigments.
The results indicate the use of the typical Teotihuacan palette for the Xolalpan period—except for the color black that was not present in the fragments of the studied collection—evidencing the use of only one type of pigment for the reds, yellows, greens and whites, and two distinct blue pigments, one of them presenting a dark tone in the infrared images that can probably be related to azurite [17,18,19]. The second blue has a light gray color in the infrared images and a light blue color in FCIR that is not related to any of our references (Figure 5). Additionally, in these images, most red colors present a yellow-green hue in the FCIR images characteristic of earth pigments, while green colors show shades of blue in the FCIR images usually related to copper mineral pigments [17,18,19]. In general, yellow colors are difficult to distinguish by this method. Table 2 presents the results of the analysis, which are later discussed by color.

3.2.1. Red

FCIR results classified the red pigment found in all fragments analyzed as an earth pigment, probably hematite (Fe2O3). The red and yellow earths comprise a group of iron oxides and hydroxides (mainly hematite and goethite), where the amount of water present determines the red, orange or yellow color. The shade can be further modified by the presence of other white pigments [23].
FORS spectra from the red and pink areas of 24 fragments allowed identifying this red pigment as hematite (Figure 6), characterized by an inflection point around 580 nm and an apparent absorption maximum around 850 nm [23,24,25,26,27,28,29]. Twelve of these fragments were also analyzed by XRF, and the results support these findings with the identification of high amounts of iron in all cases (Figure 7). In one of the fragments, an increase in copper content was also observed in the red areas, which could indicate an underlying green layer.
Pink (or light red) areas display a similar behavior as red areas, with a lower Fe content, along with higher Ca, probably indicating the use of hematite mixed with lime in order to generate a lighter shade. Additionally, the Si/Fe ratio of the intensity of characteristic X-rays increases for the pink regions, which may hint at the use of a red clay or a clay added to this color to modify the shade and optimize the use of the available pure red pigment color [12]. This may be a manufacturing choice, as red has been used extensively in the mural paintings of Teotihuacan. Analyses on mural paintings from Tetitla’s complex have reported the addition of halloysite for red and yellow colors, in order to facilitate the burnishing of the surface that was carried out at the end of the process of creating a mural painting [6]. This finishing process led to a higher saturation of the colors and a more homogenous surface.
The use of hematite to achieve red hues was a common practice in Teotihuacan which has been reported before by a number of authors [6,9,12,13,14]. However, the absence of other red pigments, such as cinnabar, is worth noting. This pigment has been reported previously in mural painting fragments from the Avenue of the Dead [30], and recently in the Feathered Seashells from the Quetzalpapalotl complex [31]. Cinnabar was rarely applied for Teotihuacan mural paintings, especially compared to wall paintings in the Maya area [32,33].
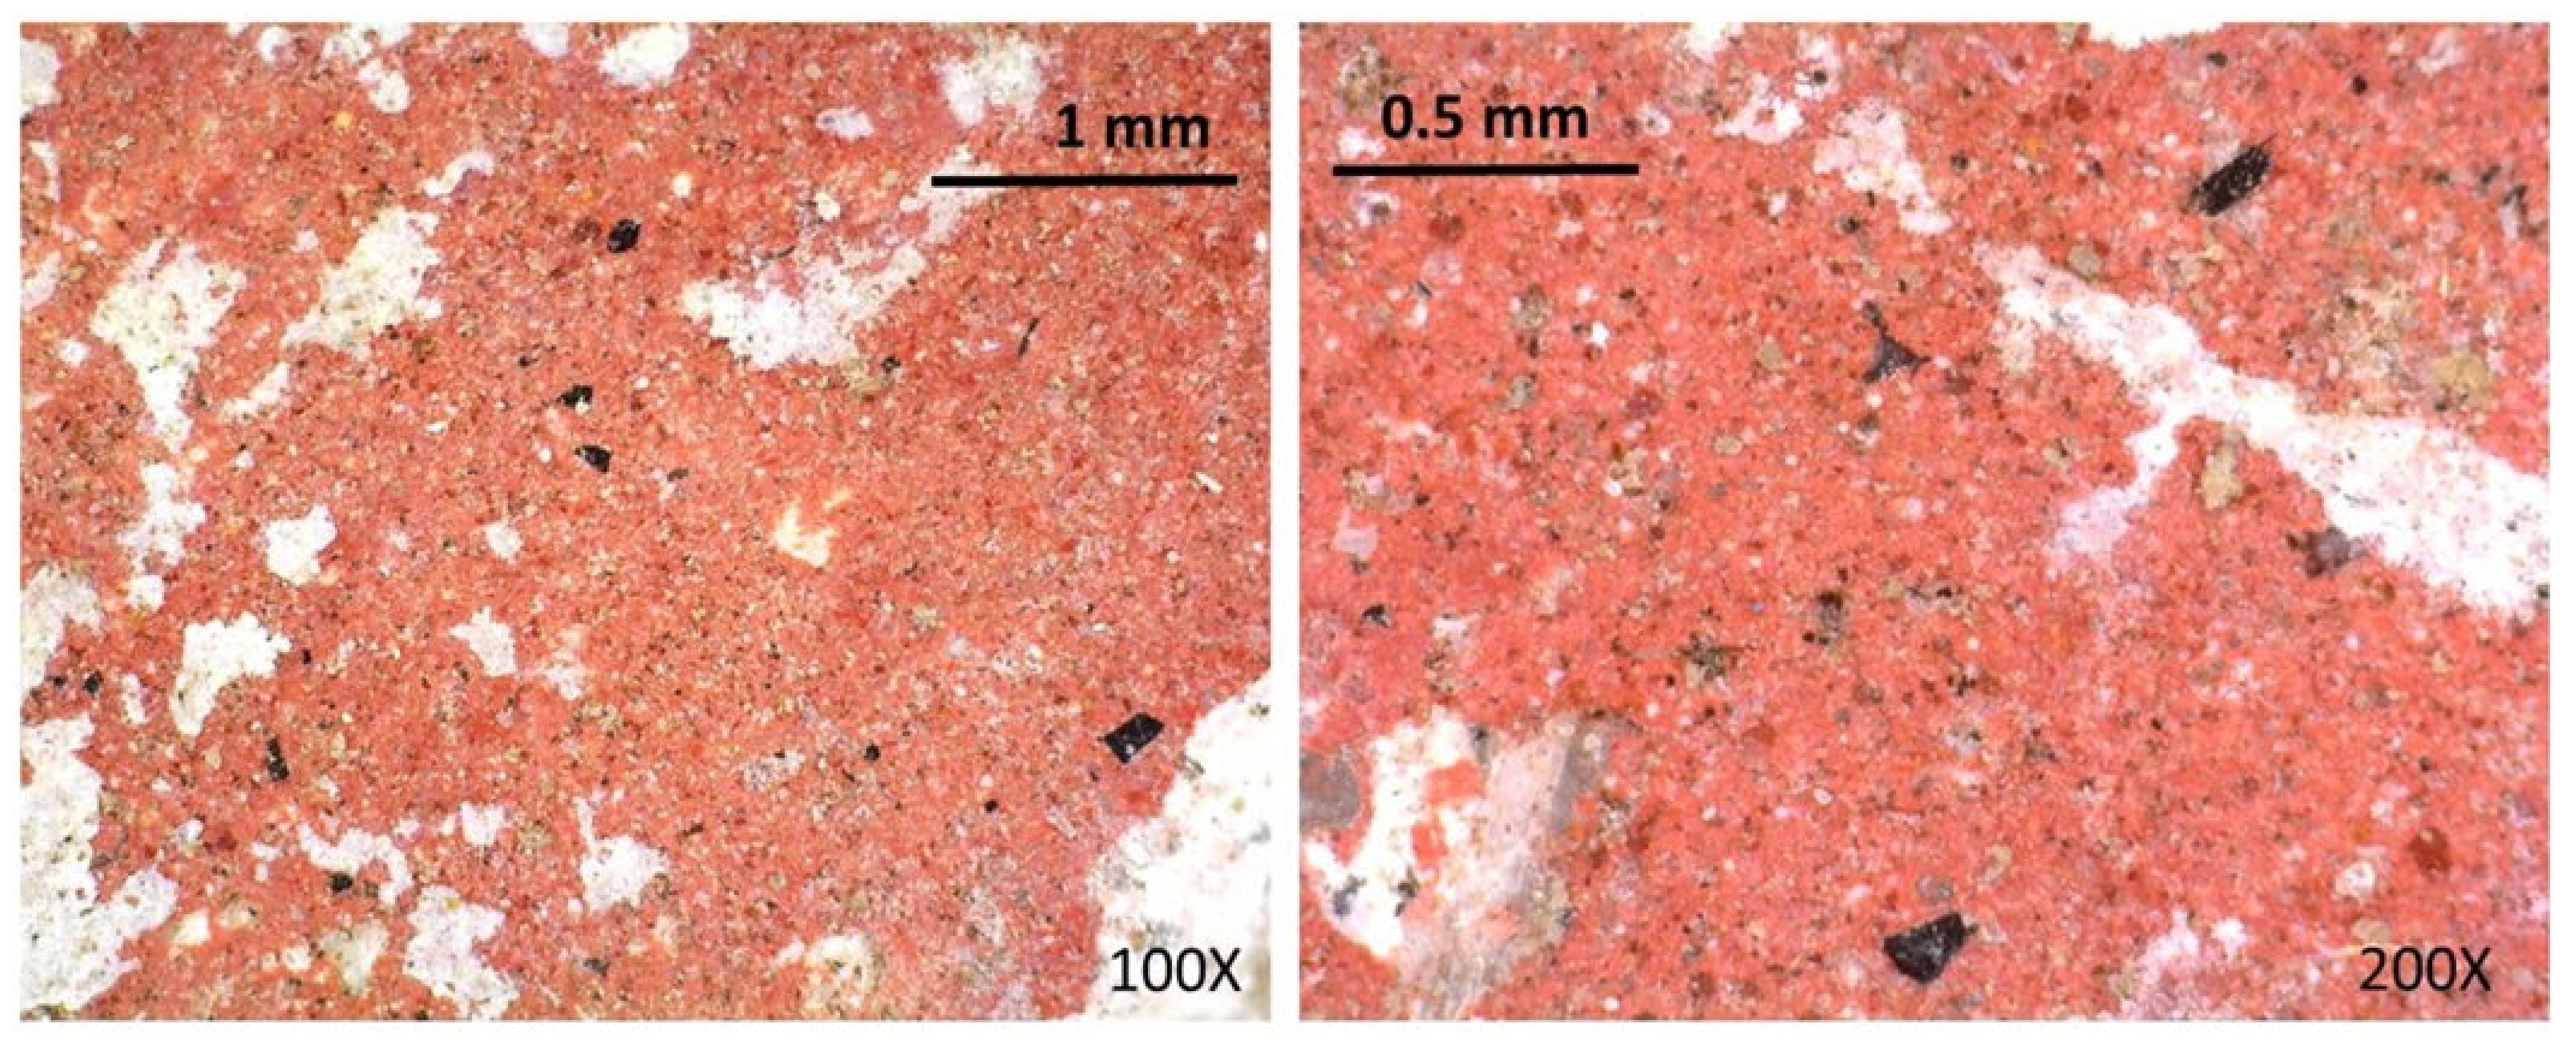
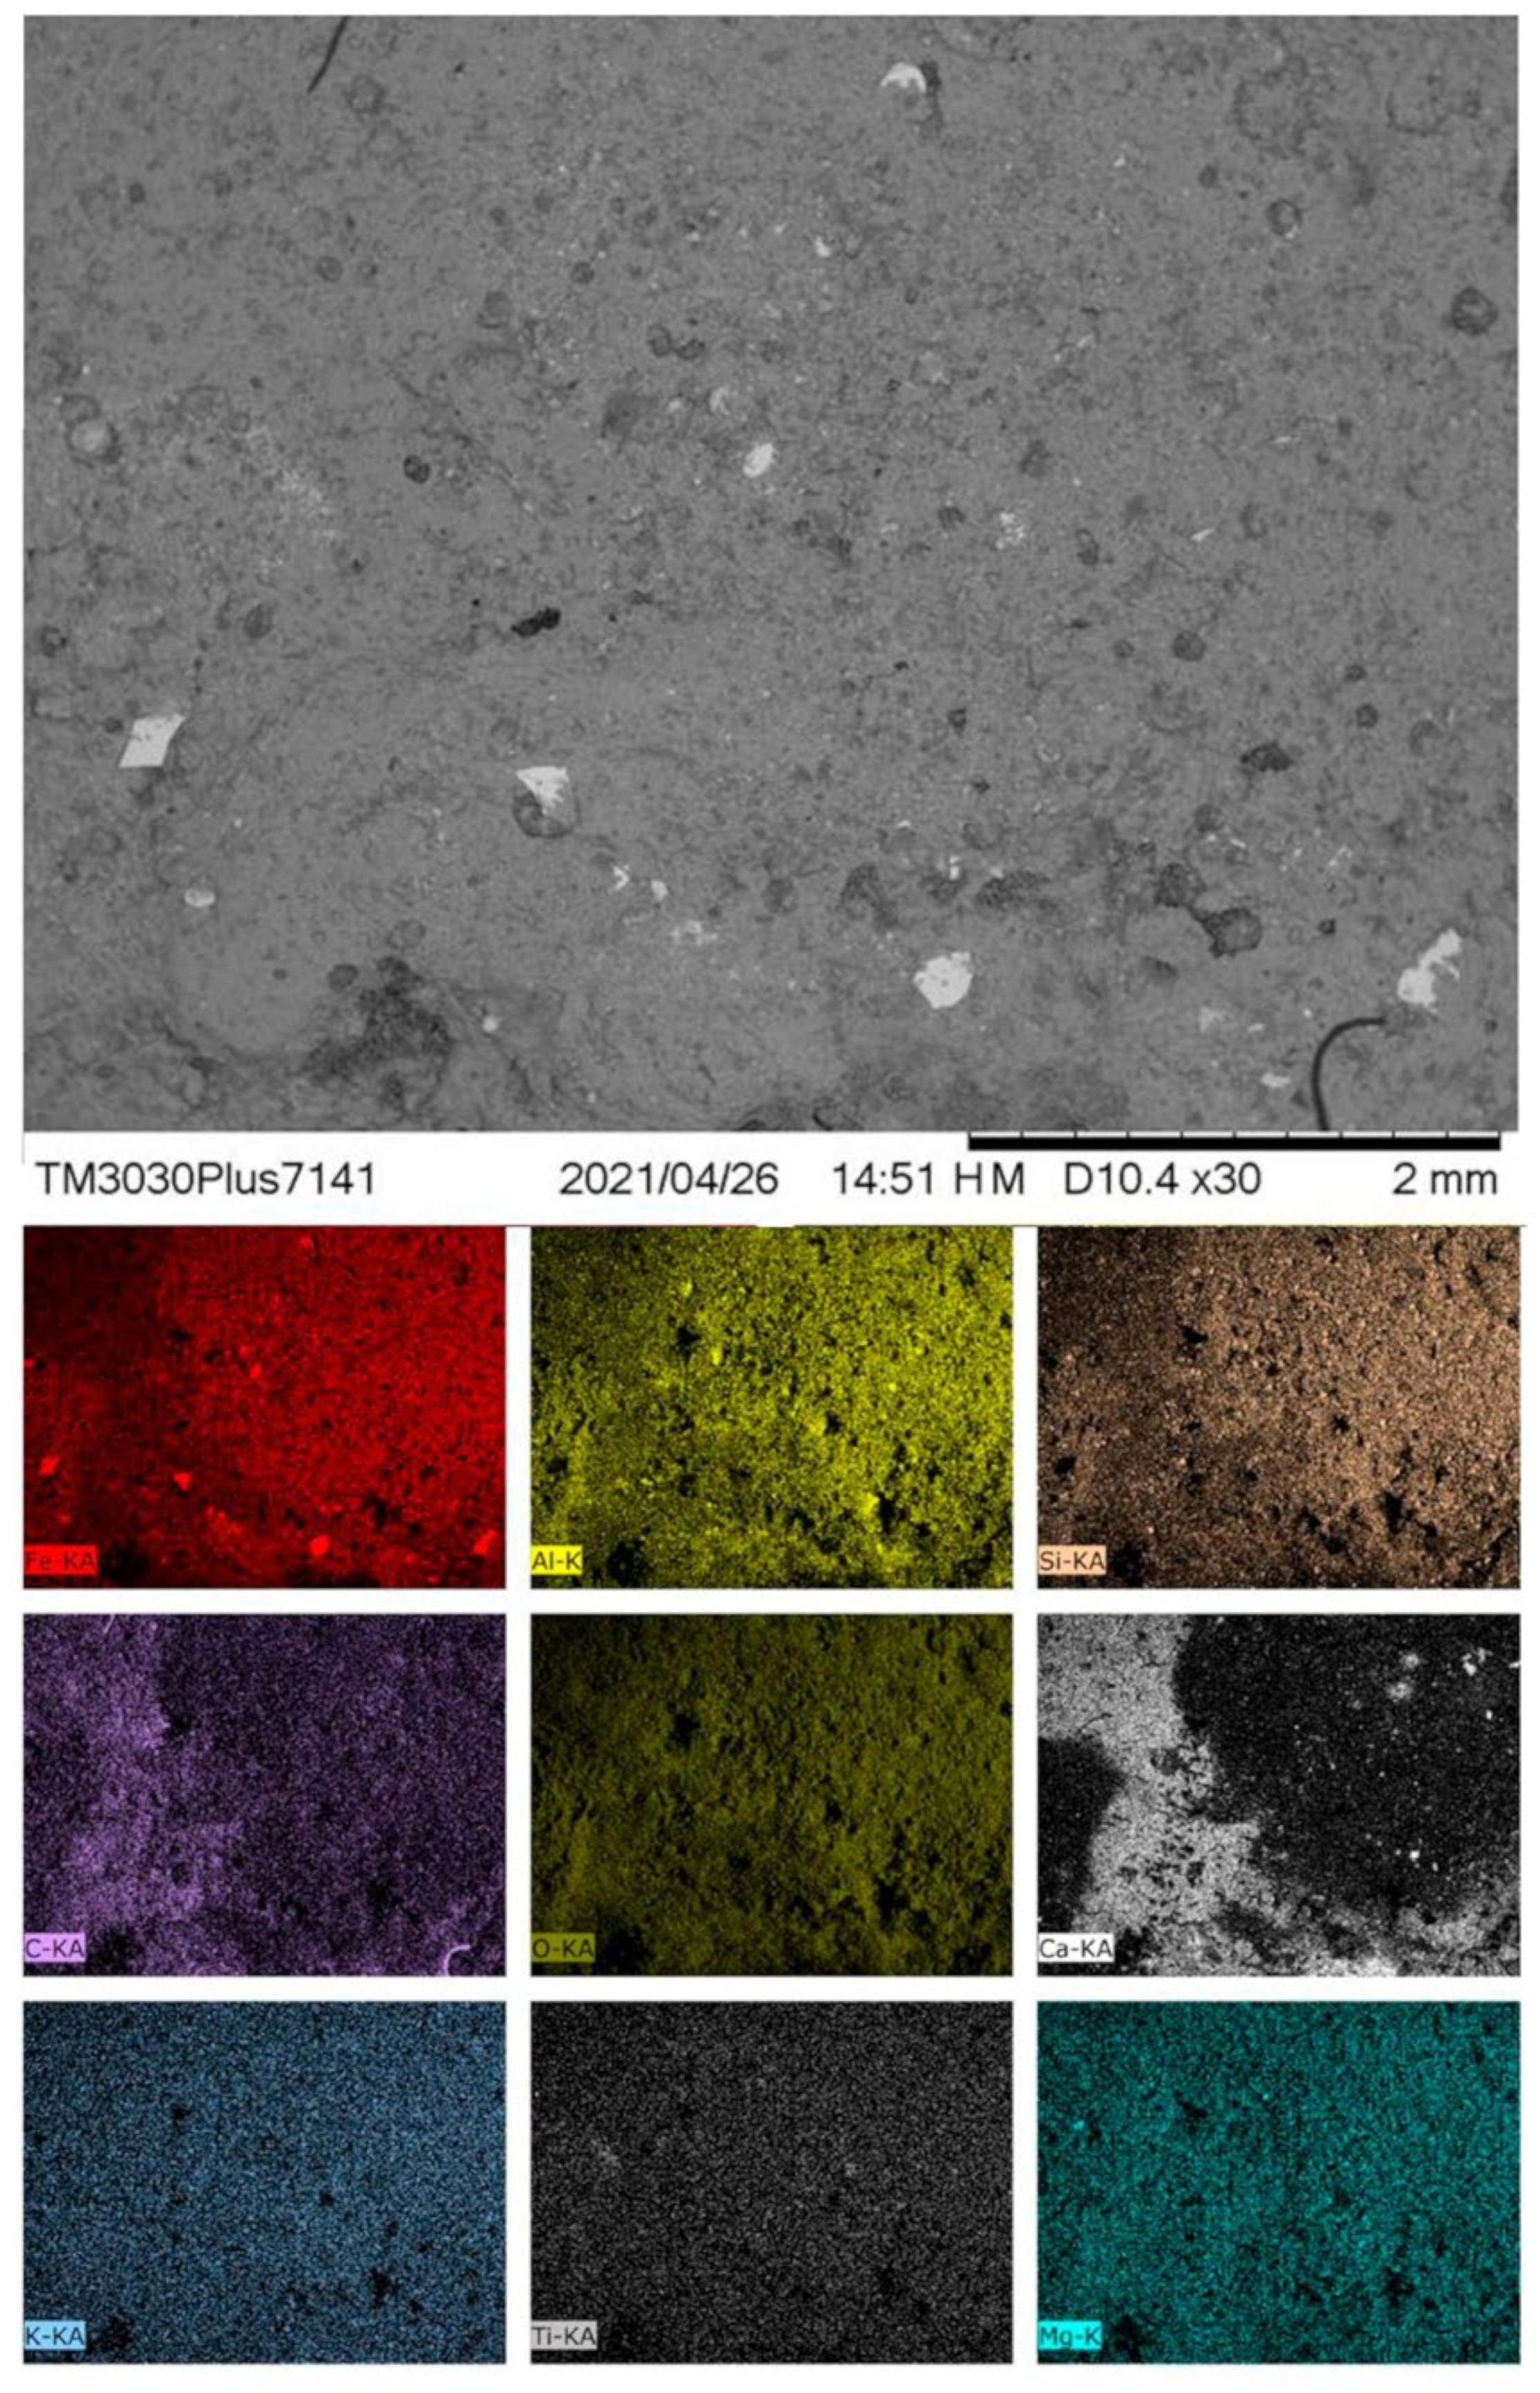
Optical microscopy (OM) and SEM-EDS analyses were applied on small fragments that present little black brilliant inclusions which give a sparkling aspect to the red color, typical in Teotihucacan mural paintings. Figure 8 shows two OM images of the surface where the use of a polarizer allows removing the bright reflections from the images and the black color of the inclusions can be clearly appreciated.
The surface of a red area was also analyzed by SEM (Figure 9). The high brightness of the inclusions in the SEM-BSE image indicates the presence of a heavier element. Elemental mappings from this area shows how the inclusions are rich in iron and poor in titanium. In the study of Techinantitla’s paintings by Margolis [14], these inclusions were reported as ilmenite (FeTiO3), but the elemental distribution presented in Figure 9 does not agree with this result. In fact, Ti has a homogeneous distribution with a very low concentration (>0.4 wt%). We instead propose the use of specular hematite for these inclusions. Specularite or specular hematite can either be found as an independent mineral, or mixed with hematite. Due to this, it is not possible to determine if specular hematite occurred naturally along with red hematite in the raw material sources used to prepare the red color, or if it was intentionally crushed and added to the red pigments in order to provide the sparkling aspect to this color. The nearest reported geological sources of specular hematite are in the modern state of Michoacan, Western Mexico, some 165 km from Teotihuacan [34,35].
The differences in the distribution of iron, calcium and carbon are related to the layer of red paint applied on the surface. Iron content is higher in the painted areas, while the presence of Ca and C points to the stucco ground in paint-free zones. Carbon enriched regions may correspond to remains of the charcoal used for firing the limestone during the preparation of the ground stucco layer, as it has been reported for Mesoamerica [36,37].

3.2.2. Yellow

FCIR analysis of the fragments suggested the presence of yellow earths, owing to the pale yellow hue observed in the processed images. This was confirmed by FORS on fifteen fragments, where the spectral features of natural sienna and/or natural umber were observed (inflection point at 550 nm and apparent absorption maxima at 660 and 870 nm) [23,24,25,26,27,28,29]. A high iron content was detected by XRF on all of the fragments analyzed, with copper also present in three of them (Figure 7). As in the case of the reds, only one pigment was used for the yellow hues.
Moreover, as in the red color, light yellow areas display an increment in the Si/Fe X-ray intensity ratio, also probably as a result of the addition of a clay. Orpiment, an arsenic sulfide, has been reported on mural paintings in central Mexico for later periods [38], and in pre-Hispanic codices [39,40], but no indication of its presence was found in the studied samples.

3.2.3. Green

Green areas display a blue color in the FCIR images, a behavior typical of copper pigments, probably malachite, as reported in other works [18,19,41]. The analysis of FORS spectra from thirteen fragments containing green pigments allowed determining the predominance of a mixture of malachite with earths [23,24,26,27,28,42], which was found on nine of the fragments, while pure malachite (Cu2CO3(OH)2) was identified on three of them (Figure 10). X-ray fluorescence supported these findings, confirming the presence of copper and iron on six of the fragments analyzed (Figure 7). In one set of three fragments (box 108), a particular mixture of azurite (Cu3(CO3)2(OH)2), malachite and earths was also detected. FORS spectra from box 108 present a local reflectance maximum around 450 nm and an apparent absorption maximum at 645 nm, both characteristic of azurite [24,26,27,28,42,43,44]. In between, a weak local reflectance maximum near 585 nm is typical of malachite. The combination of azurite and earths affects the shape of the spectra in the 700–900 nm interval. Similar characteristics were also observed in a spectrum of a blue area that is further discussed in the following section.
The Fe/Cu X-ray intensity ratio in the green areas increases for the pale shades (e.g., fragments 31, 42, 47, 136). This may be related with the addition of lepidocrocite (iron oxide–hydroxide), which has been reported before in Tetitla´s complex [6]. Interestingly, the ratio of Si/Cu X-ray intensities also increases in the same areas for the same fragments. Previous studies in Tetitla have also observed the application of malachite on top of a layer of pink, red and ochre [6]. This correlation may also be related to this particular way of applying the pigments and agree with the identification of earths in FORS measurements of green areas. The fact that earths were not observed in all the green colors is perhaps due to an increase in the thickness of the color layers.
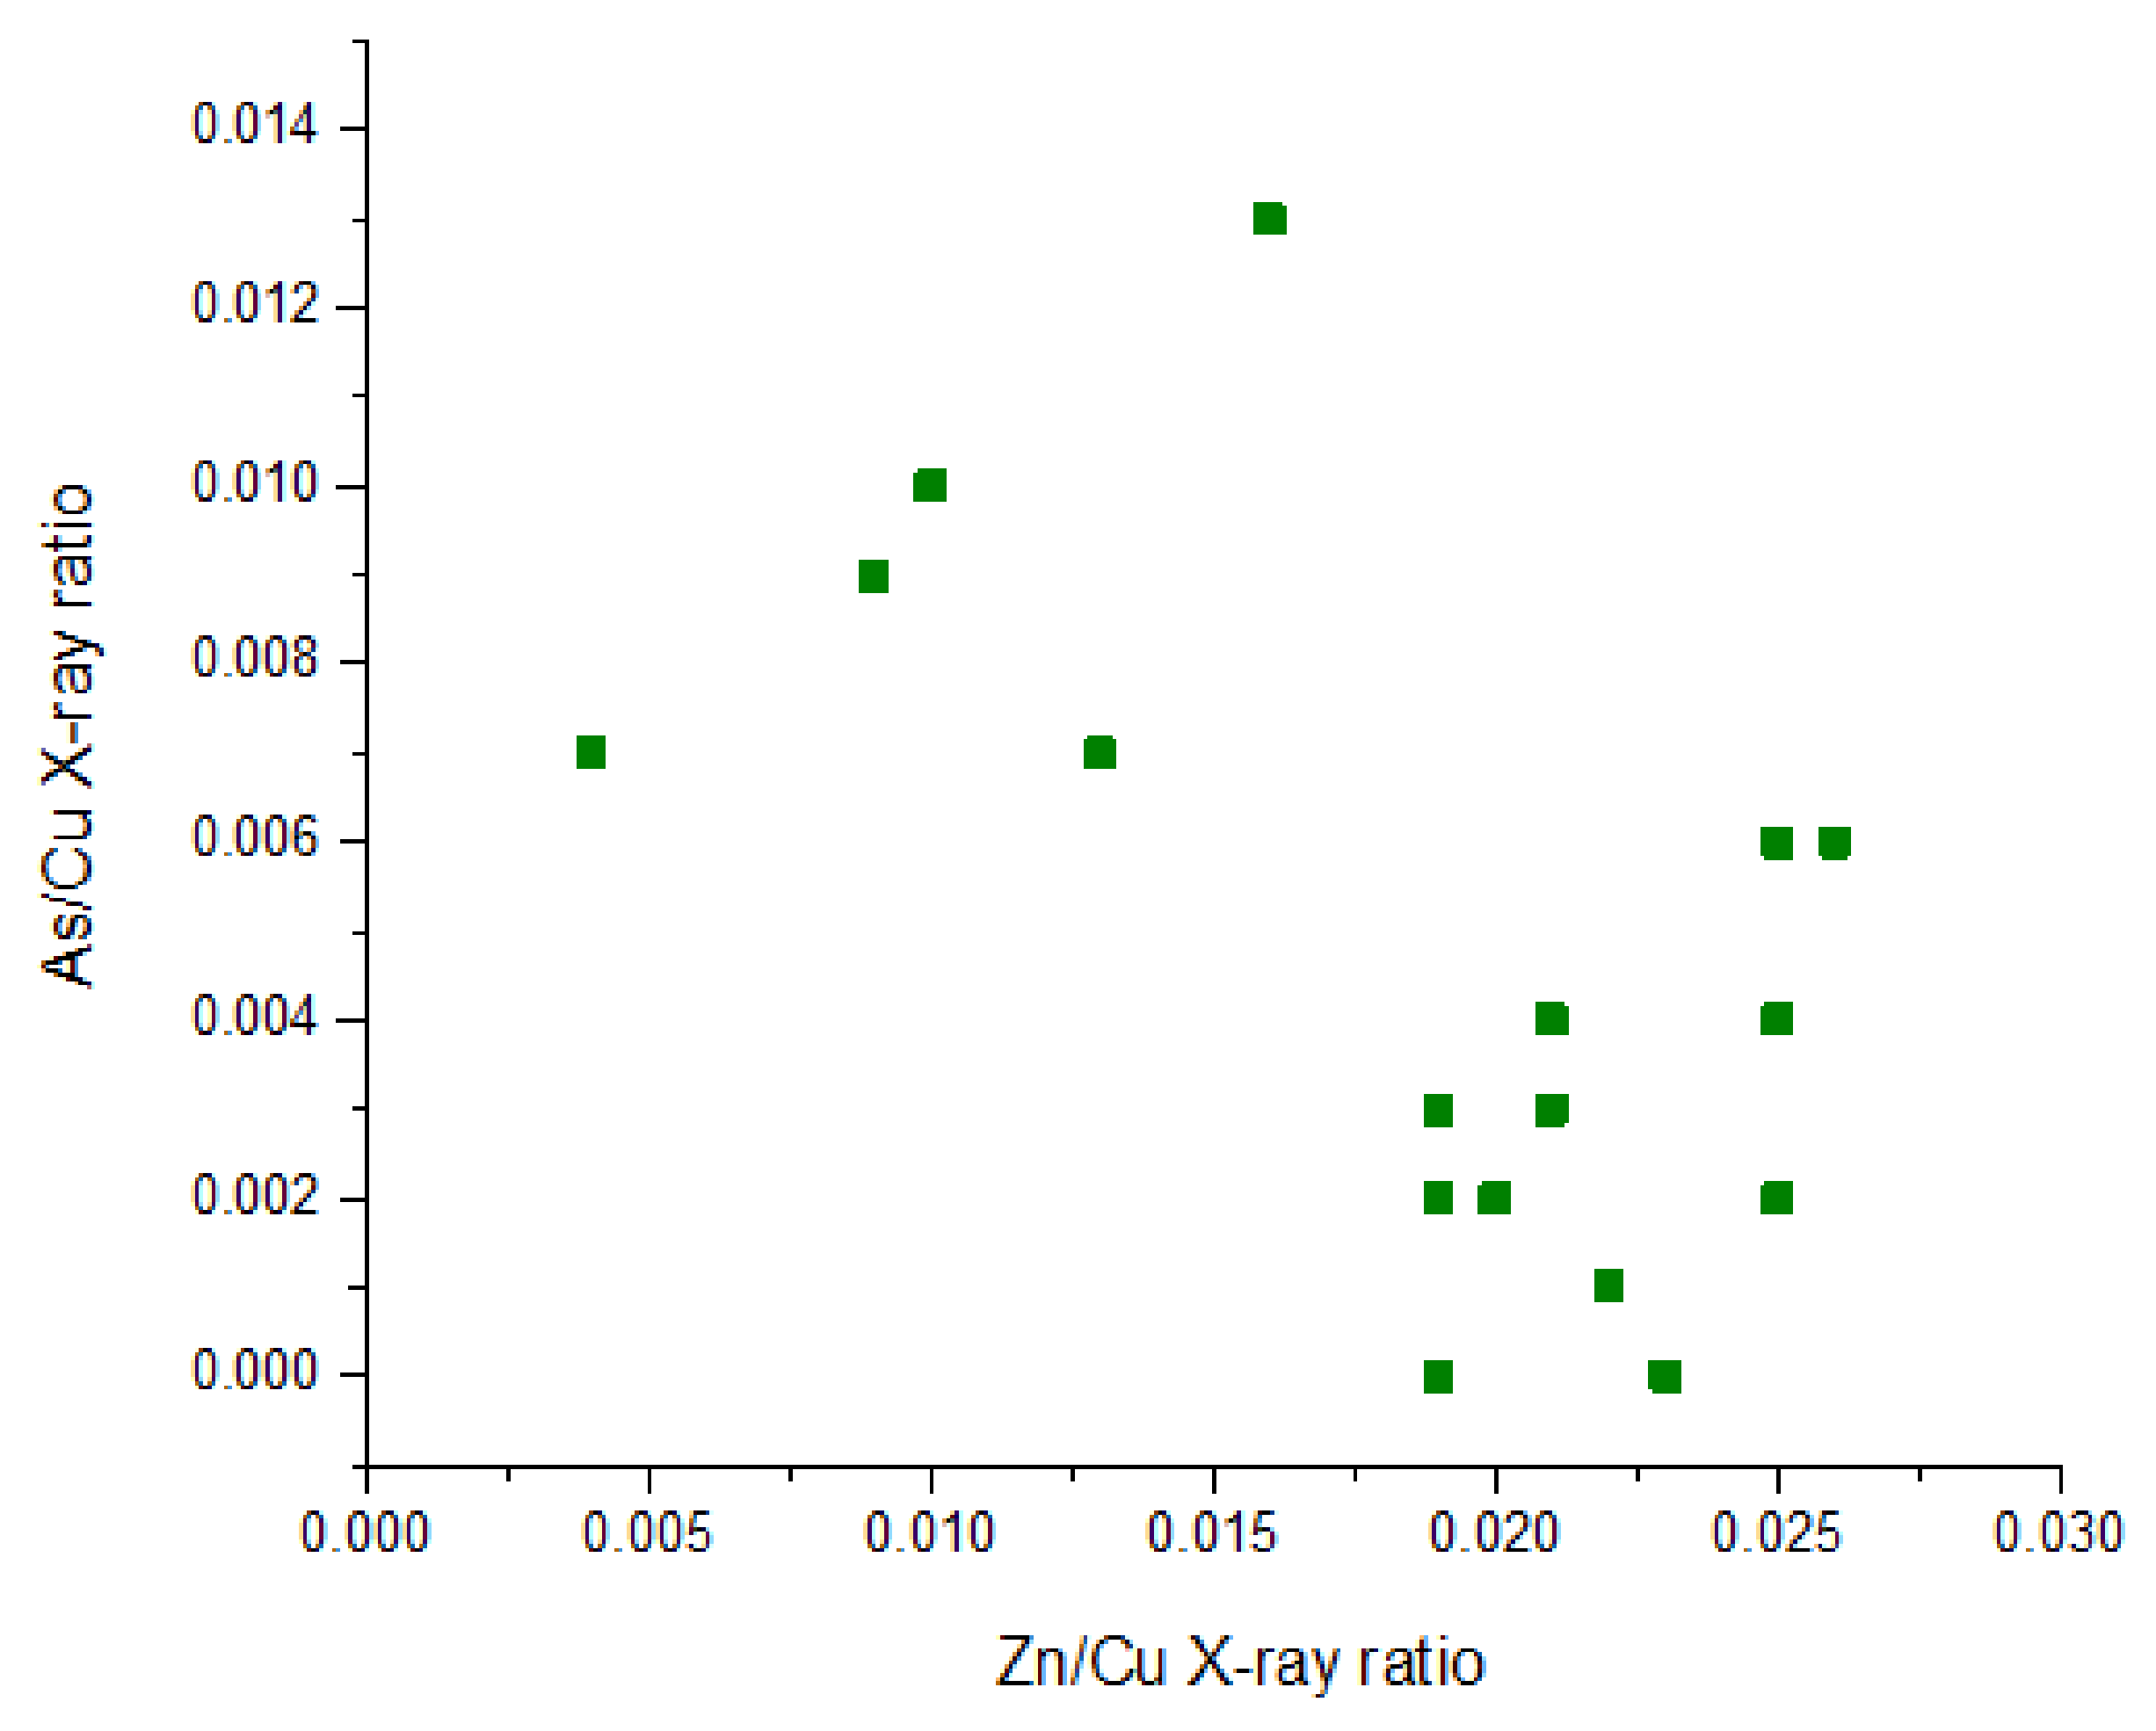
On the other hand, XRF has detected small amounts of As and Zn in areas identified as malachite. These may be related with elemental replacements in the crystalline structure of malachite that can be the origin of impurities, which in turn can be characteristic of the geological sources from where this mineral was extracted. We estimate that the Zn content is lower than 1.5 wt%, while As is lower than 0.5 wt%. The Zn content in malachite may correspond to aurichalcite ((Zn,Cu2+)5 (CO3)2 (OH)6), while the As contents with conichalcite (CaCuAsO4(OH)), a pigment that has been identified recently in the Xalla complex of Teotihuacan [13]. These minerals can be found as minor crystalline phases in malachite. The relationship between As/Cu vs. Zn/Cu X-ray intensities is displayed in Figure 11, where two groups can be observed; one with a higher Zn content, and a second one with higher As content. This may indicate the use of two malachite sources for the creation of these mural paintings.
Sources of malachite near Teotihuacan are reported in Hidalgo and Guanajuato [35]. Nevertheless, for the pre-Hispanic period, the best known copper mineral sources are in western Mexico (Michoacan), although they were related to the development of copper metallurgy in a later period [45].

3.2.4. Blue

Blue areas can be divided in two groups, according to their behavior in False Color Infrared Imaging. The first group shows a dark greyish hue in the IR images and a purple shade in FCIR, that seems to be associated with the presence of azurite [18,19], related to high copper content (Figure 7), and confirmed by XRF on fragments belonging to the first group (fragments 40 and 136).
The second group has a light blue color in FCIR that does not fit our references of common blue pigments. Additionally, XRF analysis of this second blue group is characterized by low copper content and the absence of any relevant elements, especially those that are typically related with blue pigments. While this would usually indicate the use of an organic compound, FORS spectra from these blue areas could not identify the presence of indigo, and this colorant was not observed in the FCIR, where it displays a distinct pink–violet hue.
On the other hand, FORS analysis could not verify these results, as similar spectra were obtained in 10 of the 11 fragments analyzed, regardless of their belonging to the first or second group (Figure 9). The spectral features observed are in good agreement with FORS spectra of earths (iron was also detected on all five of the fragments with high copper content) [23,24,25,26,27,28,29].
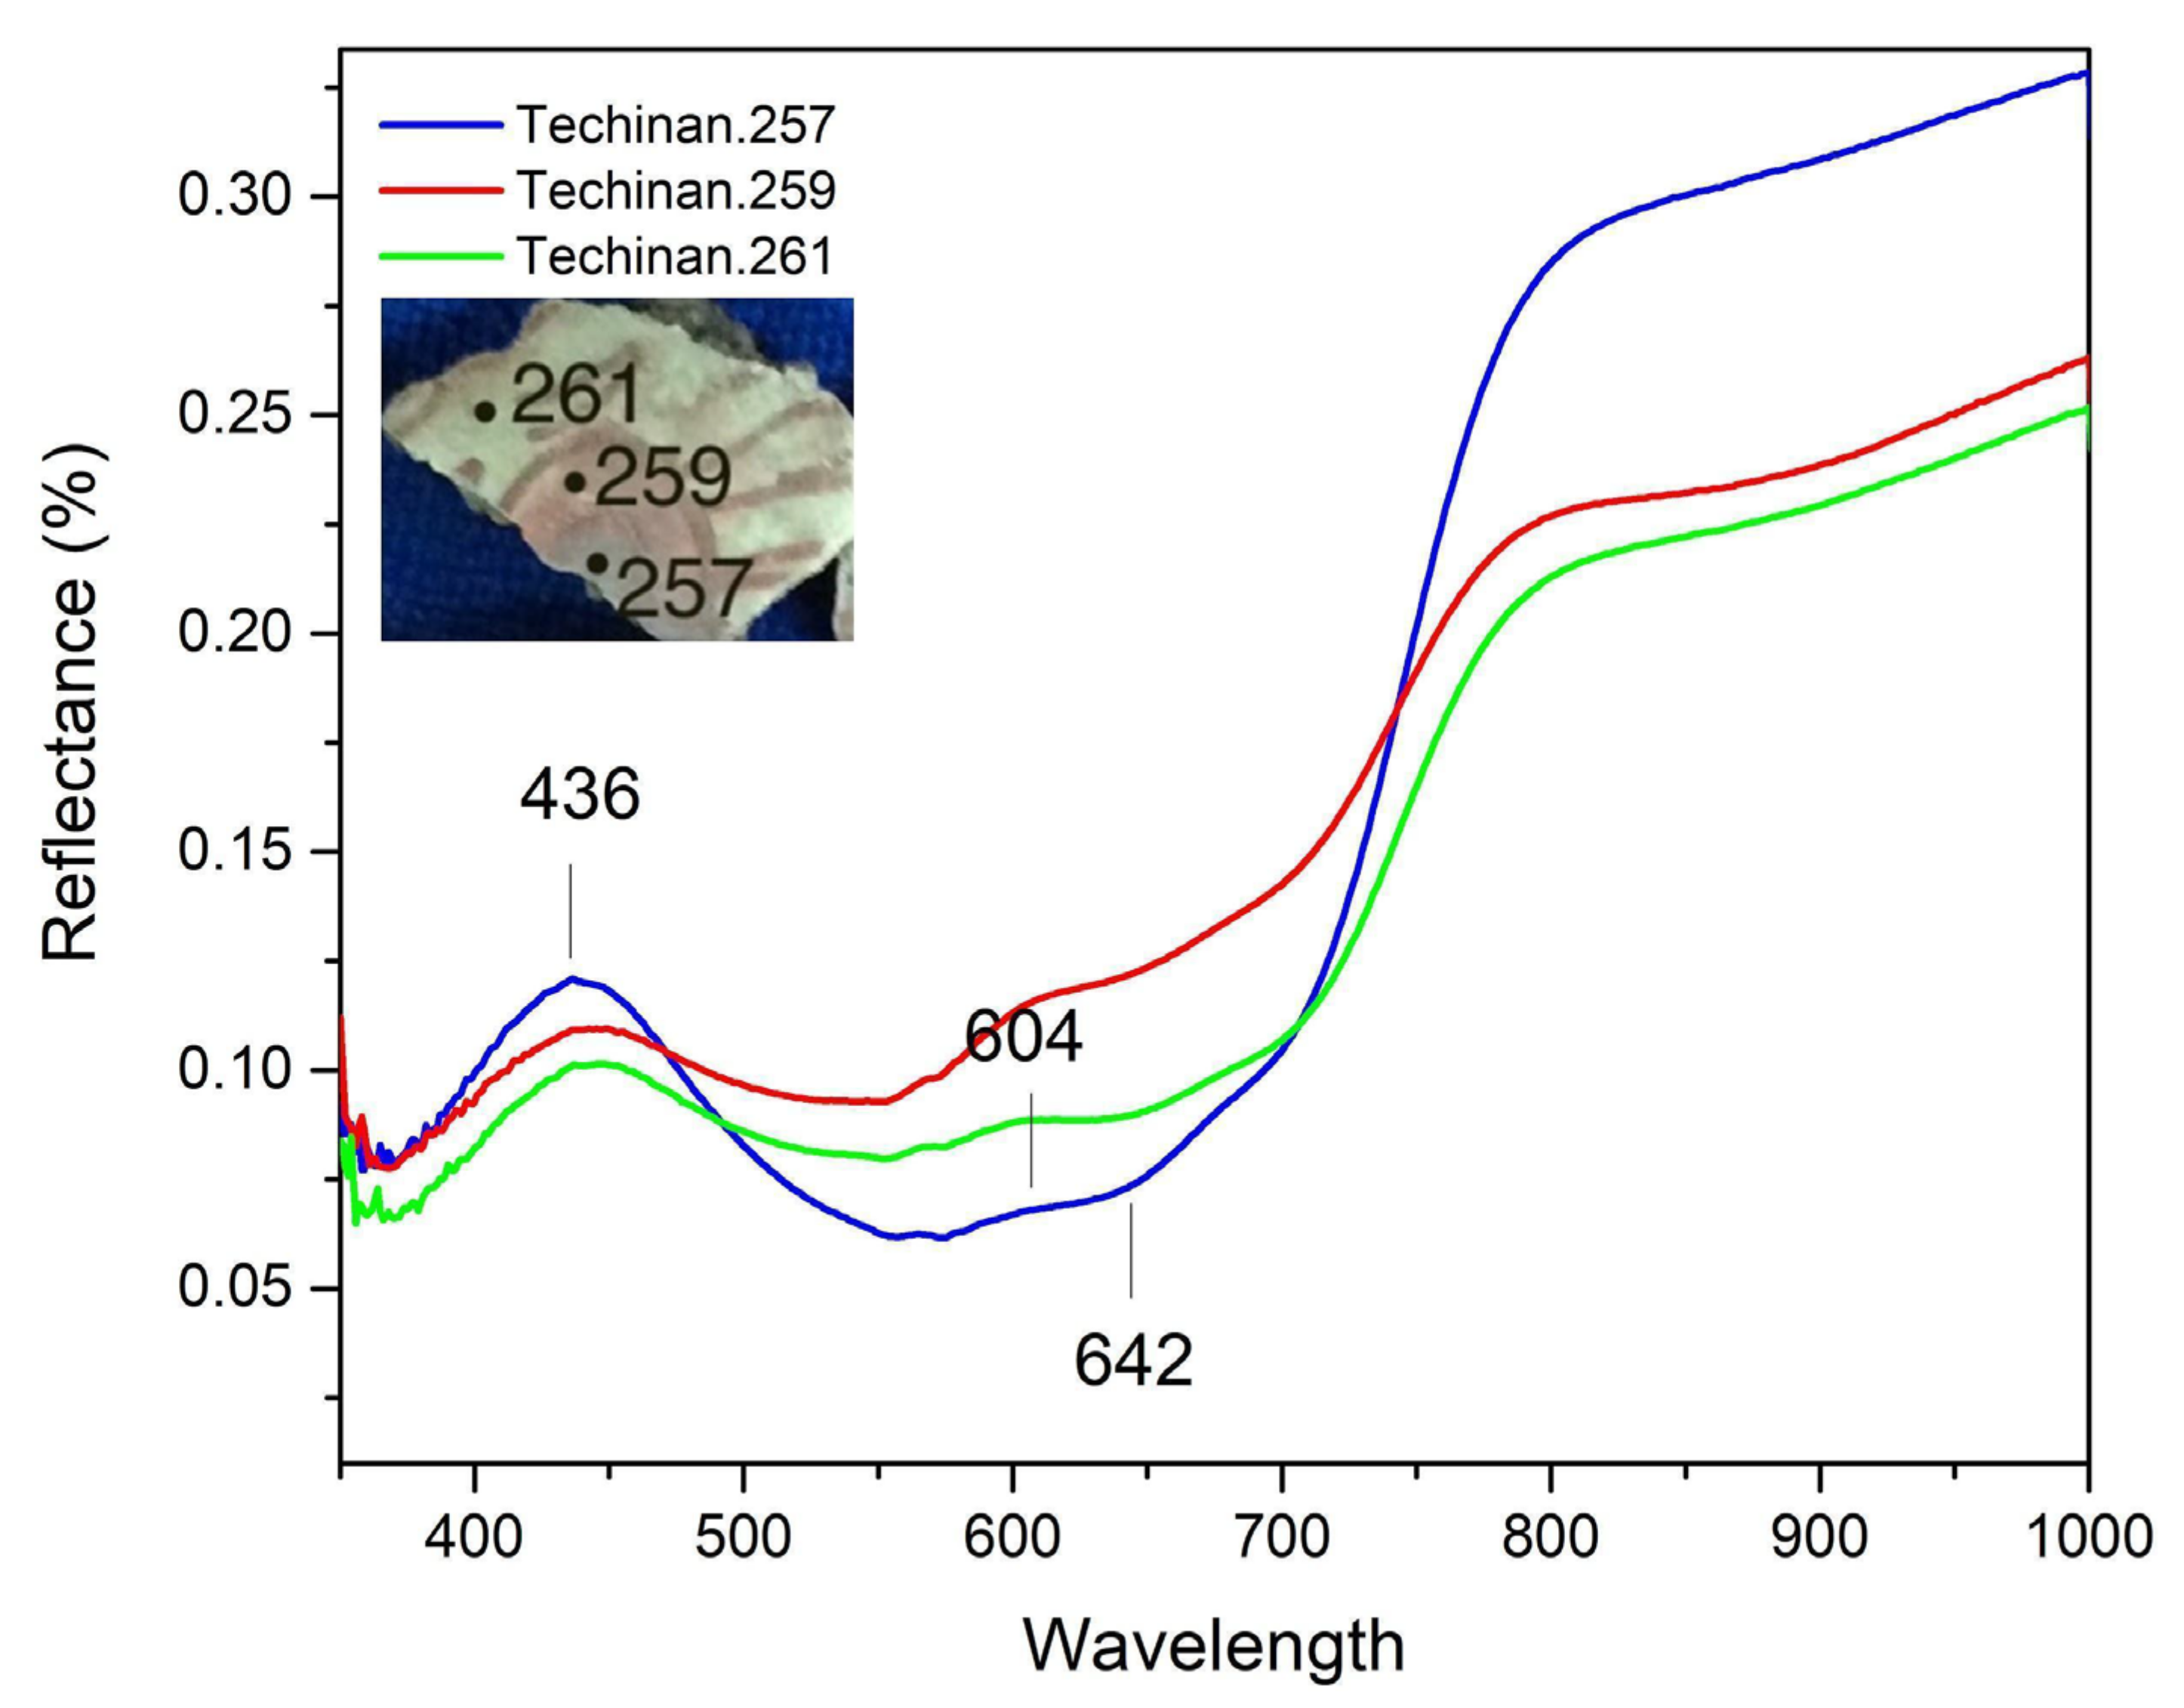
The remaining fragment studied by FORS yielded an interesting spectrum, with a feature characteristic of azurite (an absorption maxima at 642 nm) and a strong increase after 720 nm in the reflectance spectrum that can misleadingly suggest the presence of lapis lazuli (Figure 12) [24,26,27,28,42,43,44]. However, this was readily discarded, as there are no lapis lazuli deposits in (nor near) Mesoamerica. The most probable explanation is that the concurrence of earths in the same area provoked this increase in the reflectance spectrum. The small blue area analyzed is adjacent to a red area, and the presence of a mixture or a superimposition of layers cannot be discarded. This effect on the reflectance has been observed for mixtures of azurite and orpiment [46]. The presence of red earths would also explain the weak reflectance maximum at 604 nm, observed on the spectrum of the blue area.
In a previous study by Magaloni of the Tetitla complex [6], three blue colors were observed: one composed of a mixture of malachite and chalcanthite, a second one composed of azurite, and a third one labeled as having an “ultramarine” shade of blue in Magaloni’s work—with no relation to lapis-lazuli nor to ultramarine pigments—that has not been identified so far. This color is reported to have tones that range from light to dark blue if combined with pyrolusite (manganese dioxide). This blue pigment may correspond to the second group that was not identified in the present study. It requires further analyses, including Raman and infrared spectroscopies.

3.2.5. White

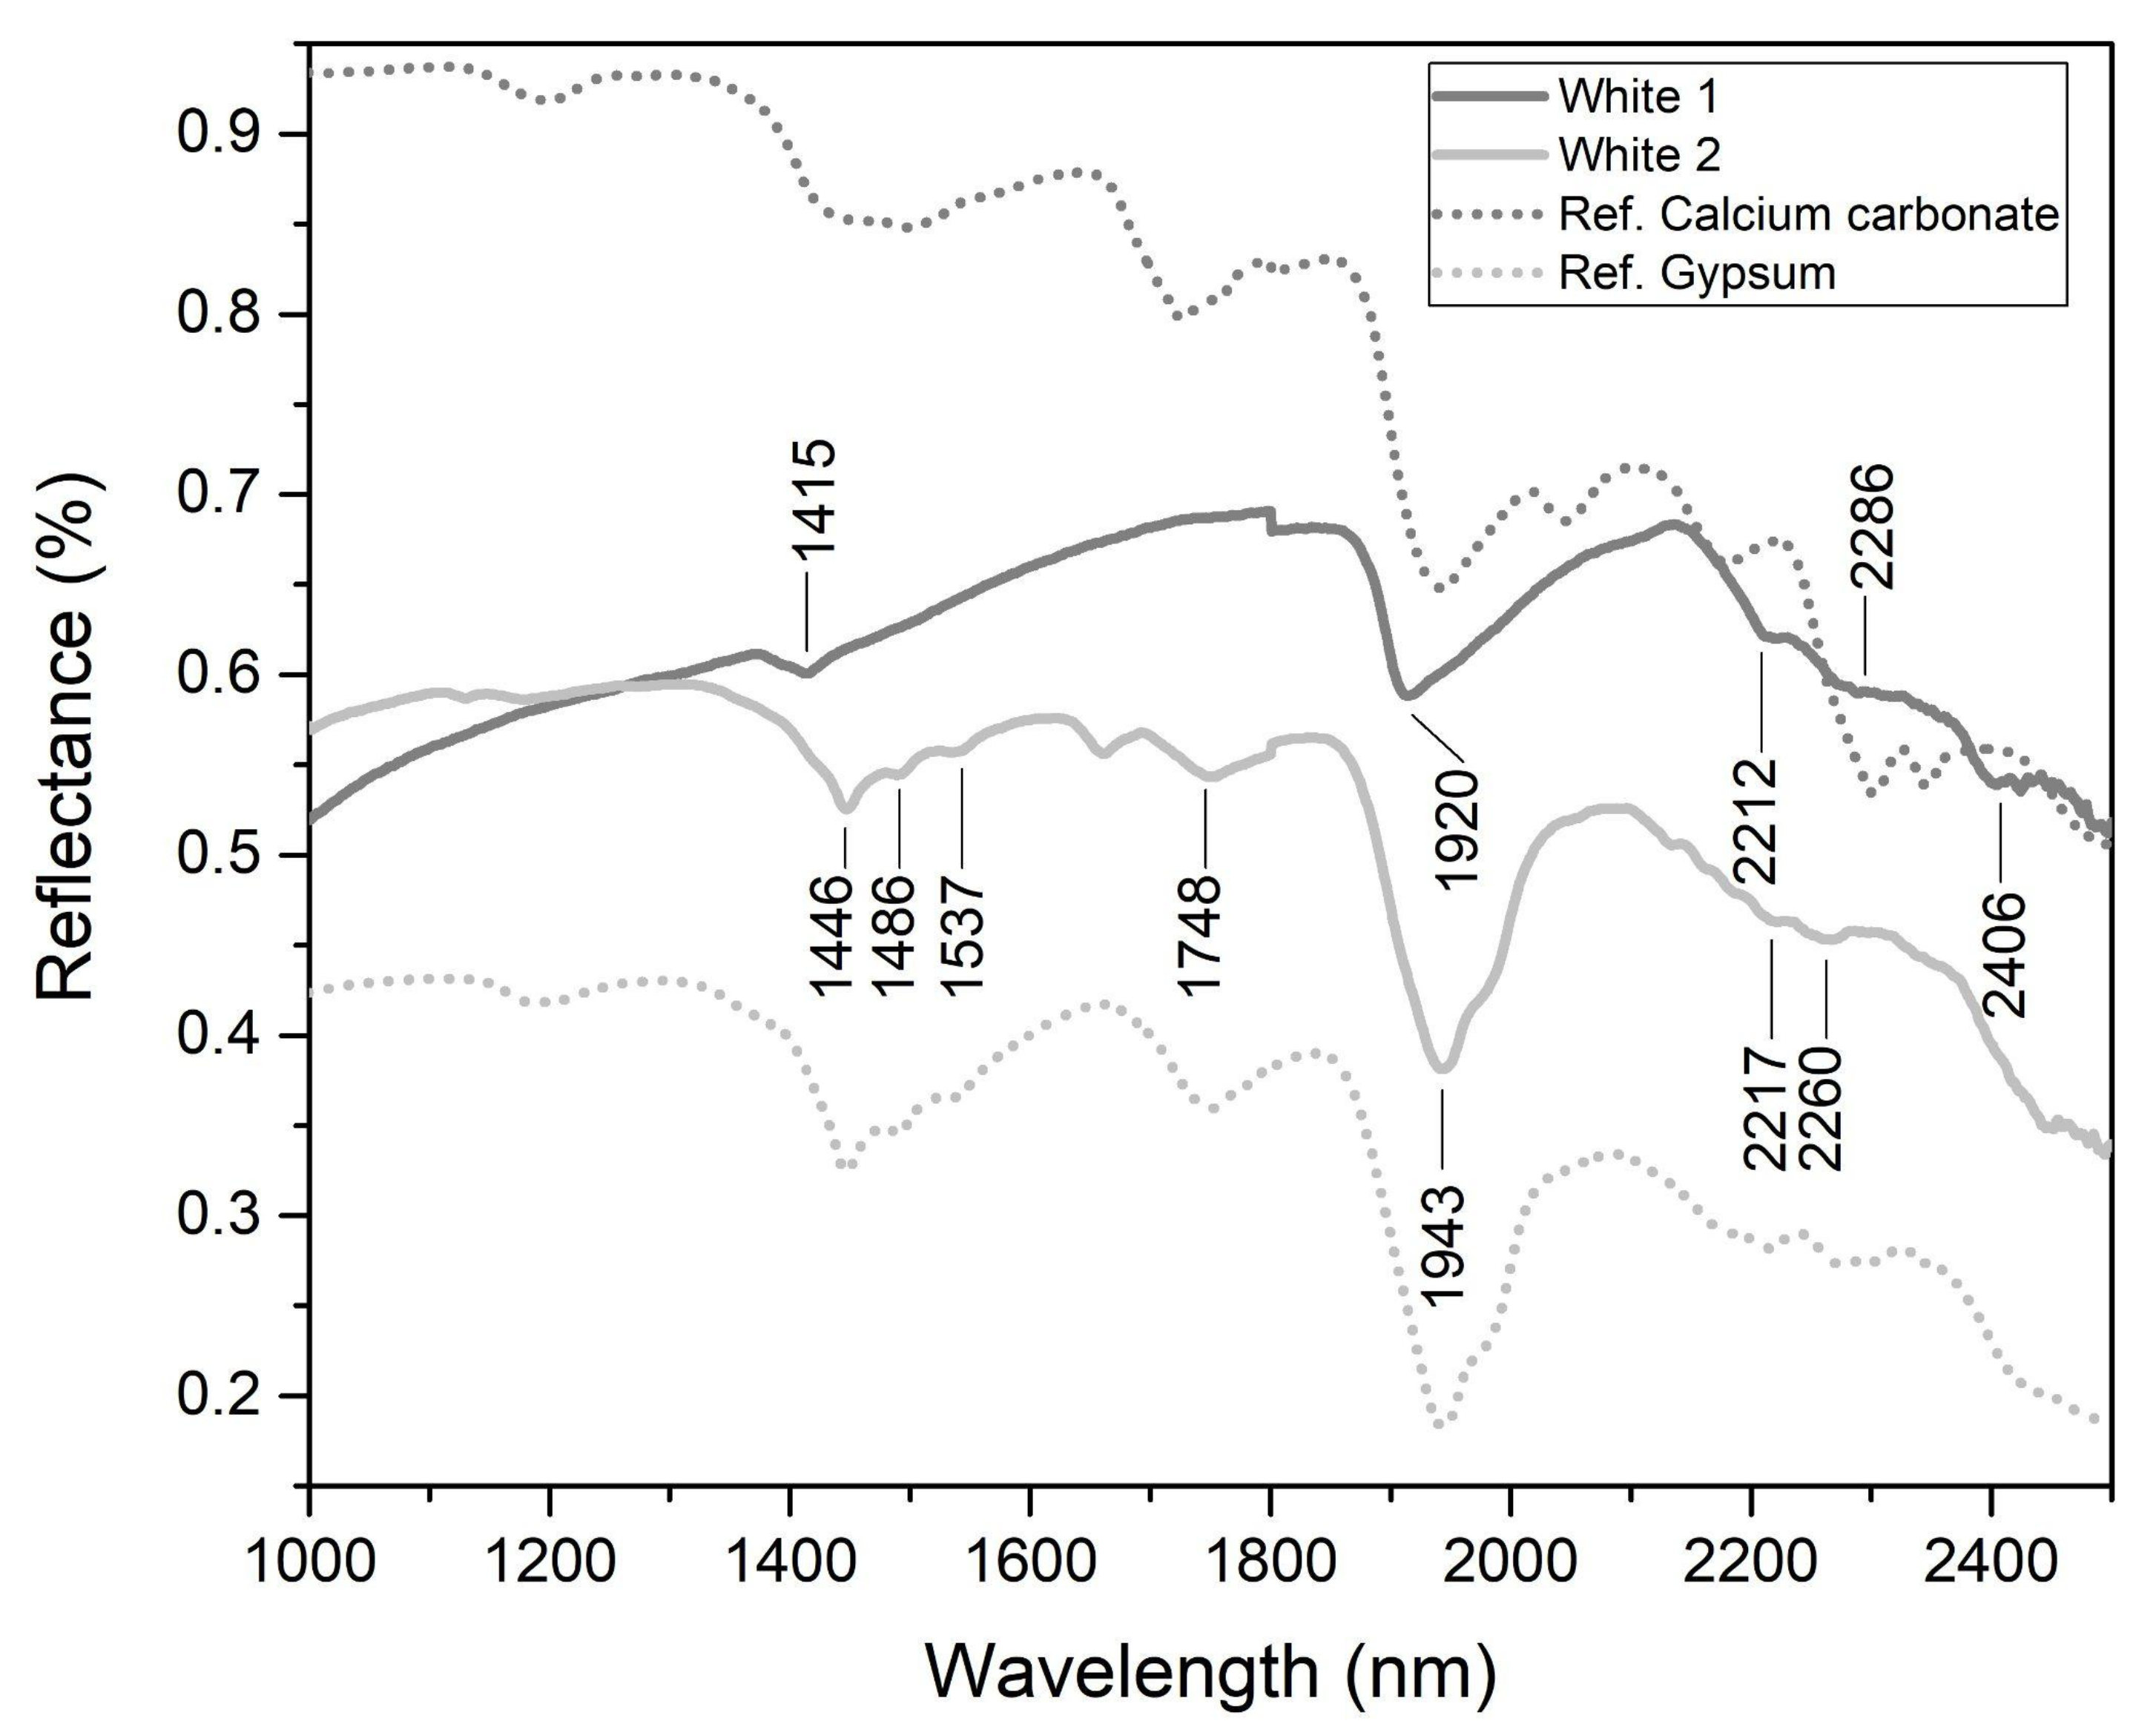
White areas were found on nine of the fragments studied. FORS spectra indicated the presence of earths, through its characteristic features in the visible interval. The information from the near infrared led to the identification of calcium carbonate on six of the fragments, while gypsum was present on the remaining three (Figure 13).
Spectra of calcium carbonate usually show two characteristic bands near 2300 and 2500 nm, and other weak bands in the 1800–2200 nm interval, all related to combinations and overtones of the vibrational modes of the CO32− ion [47,48,49,50]. However, these bands can be shifted due to the presence of other mineral phases and/or water in the analyzed samples [47,48]. In addition, water bands can mask the lower intensity bands of carbonates. In our case, the spectra are dominated by an intense and broad band of water at 1920 nm, while the hydroxyl band is observed at 1415 nm.
The NIR spectrum of gypsum is characterized by the presence of three bands at 1446, 1486 and 1537 nm, which are the first overtones of the hydroxyl stretch [42,51]. The very strong band at 1943 nm is related to the stretching of molecular water in the gypsum crystalline structure. Less intense bands at 1748, 2217 and 2260 nm are related to a combination of sulphate and water vibrational modes. Gypsum has been reported by several authors for other Teotihuacan complexes with mural paintings [6,31].

3.3. Comparison with Previous Analysis on Mural Paintings from Techinantitla

The results of the analysis of a set of fragments kept at San Francisco’s de Young museum, carried out by Margolis in 1985 [14], are in good agreement with our findings. The application of X-ray diffraction (XRD) allowed a more precise identification of the yellow mineral present, either limonite or goethite, than the one achieved by FORS. Nonetheless, the pigment identification for the red (hematite), green (malachite), blue (azurite) and white areas (calcite) was similar.
Elemental content can be hard to compare between both studies, as analysis conditions for XRF were not the same, and this previous study also used Particle Induced X-ray Emission spectroscopy (PIXE). Even so, our results appear to present a higher iron content in the green areas than what was detected by Margolis.
In the case of the blues, Margolis identified azurite by means of XRD, but found surprisingly low amounts of copper in these areas—in accordance with our results for a subset of the blue areas—and suggested that either the blue azurite layer was very thin, or that it was mixed with Maya blue, a hybrid pigment containing indigo and a clay. However, he gave no indication of having identified palygorskite or sepiolite on the blue samples, which would be expected if in fact Maya blue was present. In addition, FCIR did not identify indigo in any of the fragments, typically observed as a pink violet color in these images [52,53]. Even more so, our FORS spectra showed no indication of the presence of indigo, which can be clearly identified by its reflectance spectrum [54]. Hence, the use of a Maya blue is very unlikely.
It is interesting that Margolis found only calcite on the white areas, while our FORS analysis revealed the presence of gypsum in one third of the whites. Although gypsum was identified in the de Young’s samples, it was only present in crusts and was not associated with the pigments.
In the case of the blacks, FORS yielded no useful information, while XRF cannot detect light elements. Moreover, we did not analyze fragments with this color. As a consequence, our results are not comparable to this previous study for this particular shade.

4. Conclusions

The study of collections without an archaeological context is a challenge that demands comparative studies and in situ measurements. In our case, geophysical prospection allowed the examination of the remains of the walls, in order to infer the most probable areas from where the wall painting fragments were looted and the location of other mural paintings. The study of these small fragments may provide outstanding information on the mural paintings, even more so when we consider that the main paintings have been altered through restoration processes. Additionally, the iconography of these fragments helps support their relationship with the main paintings.
Following this approach, the geophysical study revealed the architectural patterns of wall remains that helped determine the most probable provenance of the mural paintings. In addition, a first study of Techinantitla mural paintings using a non-invasive approach on a set of small mural painting fragments selected from their iconography and polychromies has been successfully carried out. This study revealed the pigments palette and some manufacturing aspects.
The main palette is composed of hematite for the reds, ochre and yellow earths for the yellows, malachite and earths for the greens, and two types of blue colors, one corresponding to azurite and a second that could not be properly identified. Cinnabar was not present despite its use being identified in another complex (Quetzalpapalotl) from the same period. In general, there is a good agreement with the materials and manufacturing techniques used in mural paintings of other Teotihuacan complexes from the Xolapan period, such as Tetitla, which has been studied in detail. This fact may indicate a technological standardization in this period in the use of materials and pictorial techniques when the mural painting reached a high level of development.
Further analyses are required to confirm some of our results, such as in situ X-ray diffraction to provide a better identification of the mixture of pigments and clays, as well as optical microscopy and SEM-EDS measurements on samples, allowing the observation of any overlapping painting layers used to achieve some pictorial effects. In particular, the unidentified blue color requires additional analyses, including non-destructive methods like Raman and Infrared spectroscopies, and probably sampling for invasive tests.
Finally, the raw materials for some pigments, such as malachite and azurite, and the specularite identified in the red color may have been brought to Teotihuacan through long distance exchange routes from Western Mexico. It is a well-known fact that Teotihuacan had access to other objects and materials from different regions of Mesoamerica, such as jadeite from Guatemalan sources, limestone from Hidalgo and pottery (thin orange) from Puebla [55,56,57].

Author Contributions

J.L.R.-S.: Conceptualization, methodology, investigation, formal analysis, writing—original draft preparation, writing—review and editing, project administration, funding acquisition. L.B.: Conceptualization, methodology, investigation, formal analysis, writing—original draft preparation, project administration, funding acquisition. E.C.-G.: Investigation, formal analysis, writing—original draft preparation, writing—review and editing. A.M.: Investigation, formal analysis, writing—original draft preparation, writing—review and editing. M.M.: Conceptualization, investigation, formal analysis, writing—original draft preparation. I.R.-C.: Investigation, formal analysis, visualization. M.Á.M.-R.: Investigation, formal analysis, visualization. J.C.: Investigation, formal analysis, visualization. All authors have read and agreed to the published version of the manuscript.

Funding

This work was supported by CONACYT contracts: LN293904, LN299076, LN314846, LN315853 and by PAPIIT UNAM contracts IN112018 and IN108521.

Acknowledgments

Authors acknowledge the Arizona State University Teotihuacan Research Laboratory (located in San Juan Teotihuacan, Mexico) in charge of the Techinantitla collection and the technical support of Francisco Jaimes Beristain.

Conflicts of Interest

The authors declare no conflict of interest.

References

  1. Cowgill, G.L. State and society at Teotihuacan, Mexico. Annu. Rev. Anthropol. 1997, 29, 129–161. [Google Scholar] [CrossRef] [Green Version]
  2. Hirth, K.G.; Arroyo, D.M. (Eds.) Teotihuacan: The World Beyond the City; Dumbarton Oaks Research Library & Collection: Washington, DC, USA, 2020. [Google Scholar]
  3. de la Fuente, B. La Pintura Mural Prehispánica en México, Teotihuacan; Universidad Nacional Autónoma de México, Instituto de Investigaciones Estéticas: Ciudad de México, Mexico, 1995; Volume I. [Google Scholar]
  4. Robb, M.H. (Ed.) Teotihuacan: City of Water, City of Fire; Fine Arts Museums of San Francisco-de Young and University of California Press: San Francisco, CA, USA, 2017. [Google Scholar]
  5. Berrin, K.; Millon, C.; Millon, R.; Pasztory, E.; Seligman, T.K. (Eds.) Feathered Serpents and Flowering Trees: Reconstructing the Murals at Teotihuacan; Fine Arts Museums of San Francisco: San Francisco, CA, USA, 1988. [Google Scholar]
  6. Magaloni Kerpel, D. El espacio pictórico teotihuacano, tradición y técnica. In La Pintura Mural Prehispánica en México, Teotihuacan; de la Fuente, B., Ed.; Universidad Nacional Autónoma de México, Instituto de Investigaciones Estéticas: Ciudad de México, Mexico, 1996; Volume II, pp. 187–225. [Google Scholar]
  7. Magaloni Kerpel, D. Teotihuacan: El lenguaje del color. In El Color En El Arte Mexicano Universidad Nacional Autónoma De México; Roque, G., Ed.; Instituto de Investigaciones Estéticas: Ciudad de México, Mexico, 2003; pp. 163–204. [Google Scholar]
  8. Magaloni Kerpel, D. The Colors of Time: Teotihuacan Mural Painting Tradition. In Teotihuacan. City of Water, City of Fire; Robb, M.H., Ed.; Fine Arts Museums of San Francisco-de Young and University of California Press: San Francisco, CA, USA, 2017; pp. 174–180. [Google Scholar]
  9. Martínez García, C.; Ruvalcaba Sil, J.L.; Manzanilla, L.R.; Riquelme, F. Teopancazco y su pintura. Aplicación de técnicas analíticas PIXE, MEB-EDX DRX, FTIR y Raman. In Estudios Arqueométricos Del Centro De Barrio De Teopancazco En Teotihuacan; Manzanilla, L.R., Ed.; Universidad Nacional Autónoma de México: Ciudad de México, Mexico, 2012; pp. 165–210. [Google Scholar]
  10. Miller, A. The Mural Painting of Teotihuacan; Harvard University: Washington, DC, USA, 1973. [Google Scholar]
  11. Millon, C. The History of Mural art at Teotihuacan In Teotihuacan. XI Mesa Redonda; Ruz Lhuillier, A., Ed.; Sociedad Mexicana de Antropología: México City, Mexico, 1972; pp. 1–17. [Google Scholar]
  12. Sánchez Morton, L.S. Los Pigmentos Del Sitio 46c: n4e2. Su Manufactura Como Evidencia De Especialización Artesanal; Escuela Nacional de Antropología e Historia: Ciudad de México, Mexico, 2013. [Google Scholar]
  13. López-Puértolas, C.; Manzanilla-Naim, L.R.; Vázquez-de-Ágredos-Pascual, M.L. Characterization of color production in Xalla’s palace complex. Teotihuacan. Sci. Technol. Archaeol. Res. 2019, 5, 221–233. [Google Scholar] [CrossRef] [Green Version]
  14. Margolis, S.V. Geochemical and Mineralogical Analysis of Teotihuacan Murals, De Young Museum of San Francisco; Department of Geology, University of California: Davis, CA, USA, 1985. [Google Scholar]
  15. Millon, R. Where do they all come from? The provenance of the Wagner Murals from Teotihuacan. In Feathered Serpents and Flowering Trees: Reconstructing the Murals at Teotihuacan; Berrin, K., Millon, C., Millon, R., Pasztory, E., Seligman, T.K., Eds.; Fine Arts Museums of San Francisco: San Francisco, CA, USA, 1988; pp. 78–113. [Google Scholar]
  16. Muñoz-Fuentes, M. La Integración De La Pintura Mural De Techinantitla Y Tlacuilapaxco, Barrio De Amanalco, A La Plástica Teotihuacana. Ph.D. Thesis, Universidad Nacional Autónoma de México, Ciudad de México, Mexico, 2019. [Google Scholar]
  17. Aguilar-Téllez, D.M.; Ruvalcaba-Sil, J.L.; Claes, P.; González-González, D. False color and infrared imaging for the identification of pigments in paintings. Mater. Res. Soc. Symp. Proc. 2014, 1618, 3–15. [Google Scholar] [CrossRef]
  18. Moon, T.; Schilling, M.R.; Thirkettle, S. A Note on the Use of False-Color Infrared Photography in Conservation. Stud. Conserv. 1992, 37, 42. [Google Scholar] [CrossRef]
  19. Cosentino, A. Identification of pigments by multispectral imaging; A flowchart method. Herit. Sci. 2014, 2, 8. [Google Scholar] [CrossRef] [Green Version]
  20. Solé, V.A.; Papillon, E.; Cotte, M.; Walter, P.; Susini, J. A multiplatform code for the analysis of energy-dispersive X-ray fluorescence spectra. Spectrochim. Acta Part B At. Spectrosc. 2007, 62, 63–68. [Google Scholar] [CrossRef]
  21. Kubelka, P.; Munk, F. Ein Beitrag zur Optik der Farbanstriche. Z. Für Tech. Phys. 1931, 12, 593–601. [Google Scholar]
  22. Vargas, W.E.; Niklasson, G.A. Applicability conditions of the Kubelka–Munk theory. Appl. Opt. 1997, 36, 5580. [Google Scholar] [CrossRef]
  23. Elias, M.; Chartier, C.; Prévot, G.; Garay, H.; Vignaud, C. The colour of ochres explained by their composition. Mater. Sci. Eng. B Solid State Mater. Adv. Technol. 2006, 127, 70–80. [Google Scholar] [CrossRef]
  24. Aceto, M.; Agostino, A.; Fenoglio, G.; Idone, A.; Gulmini, M.; Picollo, M.; Ricciardi, P.; Delaney, J.K. Characterisation of colourants on illuminated manuscripts by portable fibre optic UV-visible-NIR reflectance spectrophotometry. Anal. Methods 2014, 6, 1488–1500. [Google Scholar] [CrossRef]
  25. Qiu, J.T.; Qi, H.; Duan, J.L. Reflectance spectroscopy characteristics of turquoise. Minerals 2017, 7, 3. [Google Scholar] [CrossRef] [Green Version]
  26. Cavaleri, T.; Buscaglia, P.; Migliorini, S.; Nervo, M.; Piccablotto, G.; Piccirillo, A.; Pisani, M.; Puglisi, D.; Vaudan, D.; Zucco, M. Pictorial materials database: 1200 combinations of pigments, dyes, binders and varnishes designed as a tool for heritage science and conservation. Appl. Phys. A Mater. Sci. Process. 2017, 123, 419. [Google Scholar] [CrossRef]
  27. Istituto Nazionale di Ricerca Metrologica. Pictorial Materials Database. 2017. Available online: https://webimgc.inrim.it/Hyperspectral_imaging/Database.aspx (accessed on 28 April 2021).
  28. Kokaly, R.F.; Clark, R.N.; Swayze, G.A.; Livo, K.E.; Hoefen, T.M.; Pearson, N.C.; Wise, R.A.; Benzel, W.M.; Lowers, H.A.; Driscoll, R.L.; et al. USGS Spectral Library Version 7. US Geol. Surv. Data Ser. 2017, 1035, 61. [Google Scholar] [CrossRef]
  29. Fang, Q.; Hong, H.; Zhao, L.; Kukolich, S.; Yin, K.; Wang, C. Visible and Near-Infrared Reflectance Spectroscopy for Investigating Soil Mineralogy: A Review. J. Spectrosc. 2018, 2018, 3168974. [Google Scholar] [CrossRef]
  30. Gazzola, J. Uso de cinabrio en la pintura mural de Teotihuacán. Arqueología 2009, 40, 57–70. [Google Scholar]
  31. Argote, D.L.; Torres, G.; Hernández-Padrón, G.; Ortega, V.; López-García, P.A.; Castaño, V.M. Cinnabar, hematite and gypsum presence in mural paintings in Teotihuacan, Mexico. J. Archaeol. Sci. Rep. 2020, 32, 102375. [Google Scholar] [CrossRef]
  32. Vandenabeele, P.; Bodé, S.; Alonso, A.; Moens, L. Raman spectroscopic analysis of the Maya wall paintings in Ek’Balam, Mexico. Spectrochim. Acta Part A Mol. Biomol. Spectrosc. 2005, 61, 2349–2356. [Google Scholar] [CrossRef] [PubMed]
  33. Alonso, A.; Pérez, N.A.; Ruvalcaba Sil, J.L.; Casanova, E.; Claes, P.; Aguilar Melo, V.; Cañetas, J. Comparative spectroscopic analysis of Maya wall paintings from Ek’Balam, Mexico. Mater. Res. Soc. Symp. Proc. 2014, 1618, 63–72. [Google Scholar] [CrossRef]
  34. Corona-Esquivel, R.; Enriquez, F. Modelo Magmático Del Yacimiento De Hierro De Peña Colorada, Colima Y Su Relación Con La Exploración De Otros Yacimientos De Hierro En México; Boletín 113; Instituto de Geología, Universidad Nacional Autónoma de México: Ciudad de México, Mexico, 2004. [Google Scholar]
  35. Panczner, W.D. Minerals of Mexico; Springer US: New York, NY, USA, 1987. [Google Scholar] [CrossRef]
  36. Russell, B.W.; Dahlin, B.H. Traditional burnt-lime production at Mayapán, Mexico. J. Field Archaeol. 2008, 32, 407–423. [Google Scholar] [CrossRef]
  37. Seligson, K.E.; Ortiz Ruiz, S.; Barba Pingarrón, L. Prehispanic Maya Burnt Lime Industries: Previous Studies and Future Directions. Anc. Mesoam. 2019, 30, 199–219. [Google Scholar] [CrossRef]
  38. Miranda, J.; Gallardo, M.L.; Grimaldi, D.M.; Román-Berrelleza, J.A.; Ruvalcaba-Sil, J.L.; Ontalba Salamanca, M.A.; Morales, J.G. Pollution effects on stone benches of the Eagle Warriors Precinct at the Major Temple, Mexico City. Nucl. Instrum. Methods Phys. Res. Sect. B Beam Interact. Mater. At. 1999, 150, 611–615. [Google Scholar] [CrossRef]
  39. Domenici, D.; Brunetti, B.G.; Miliani, C.; Sgamellotti, A. Non-invasive investigations on Mesoamerican codices: The MOLAB approach. Rend. Lincei 2020, 31, 773–778. [Google Scholar] [CrossRef]
  40. Domenici, D.; Buti, D.; Miliani, C.; Sgamellotti, A. Changing Colours in a Changing World. The Technology of Codex Painting in Post-Classic and Early Colonial Mesoamerica. In Materia Americana; The Body of Spanish American Images, (16th to Mid-19th Centuries); Siracusano, G., Romero, A.R., Eds.; Universidad Nacional de Tres de Febrero & The Getty Foundation: Buenos Aires, Argentina, 2020; pp. 45–57. [Google Scholar]
  41. Casanova-González, E.; Maynez-Rojas, M.Á.; Mitrani, A.; Rangel-Chávez, I.; García-Bucio, M.A.; Ruvalcaba-Sil, J.L.; Muñoz-Alcócer, K. An imaging and spectroscopic methodology for in situ analysis of ceiling and wall decorations in Colonial missions in Northern Mexico from XVII to XVIII centuries. Herit. Sci. 2020, 8, 91. [Google Scholar] [CrossRef]
  42. Ricciardi, P.; Pallipurath, A.; Rose, K. “It’s not easy being green”: A spectroscopic study of green pigments used in illuminated manuscripts. Anal. Methods 2013, 5, 3819–3824. [Google Scholar] [CrossRef] [Green Version]
  43. Dooley, K.A.; Lomax, S.; Zeibel, J.G.; Miliani, C.; Ricciardi, P.; Hoenigswald, A.; Loew, M.; Delaney, J.K. Mapping of egg yolk and animal skin glue paint binders in Early Renaissance paintings using near infrared reflectance imaging spectroscopy. Analyst 2013, 138, 4838–4848. [Google Scholar] [CrossRef]
  44. Gabrieli, F.; Dooley, K.A.; Facini, M.; Delaney, J.K. Near-UV to mid-IR reflectance imaging spectroscopy of paintings on the macroscale. Sci. Adv. 2019, 5. [Google Scholar] [CrossRef] [PubMed] [Green Version]
  45. Hosler, D.; Macfarlane, A. Copper sources, metal production, and metals trade in Late Postclassic Mesoamerica. Science 1996, 273, 1819–1824. [Google Scholar] [CrossRef]
  46. Lyu, S.; Liu, Y.; Hou, M.; Yin, Q.; Wu, W.; Yang, X. Quantitative analysis of mixed pigments for Chinese paintings using the improved method of ratio spectra derivative spectrophotometry based on mode. Herit. Sci. 2020, 8, 31. [Google Scholar] [CrossRef] [Green Version]
  47. Hunt, G.; Salisbury, J. Visible and near infrared spectra of minerals and rocks. II. Carbonates. Mod. Geol. 1971, 2, 23–30. [Google Scholar]
  48. Gaffey, S.J. Spectral reflectance of carbonate minerals in the visible and near infrared (0.35–2.55 microns): Calcite, aragonite, and dolomite. Am. Mineral. 1986, 71, 151–162. [Google Scholar]
  49. Clark, R.N.; King, T.V.V.; Klejwa, M.; Swayze, G.A.; Vergo, N. High spectral resolution reflectance spectroscopy of minerals. J. Geophys. Res. 1990, 95, 12653–12680. [Google Scholar] [CrossRef] [Green Version]
  50. Gomez, C.; Lagacherie, P.; Coulouma, G. Continuum removal versus PLSR method for clay and calcium carbonate content estimation from laboratory and airborne hyperspectral measurements. Geoderma 2008, 148, 141–148. [Google Scholar] [CrossRef]
  51. Liu, Y. Mid-IR, and NIR spectroscopic study of calcium sulfates and mapping gypsum abundances in Columbus crater, Mars. Planet. Space Sci. 2018, 163, 35–41. [Google Scholar] [CrossRef]
  52. Buti, D.; Domenici, D.; Miliani, C.; García Sáiz, C.; Gómez Espinoza, T.; Jímenez Villalba, F.; Verde Casanova, A.; Sabía de la Mata, A.; Romani, A.; Presciutti, F.; et al. Non-invasive investigation of a pre-Hispanic Maya screenfold book: The Madrid Codex. J. Archaeol. Sci. 2014, 42, 166–178. [Google Scholar] [CrossRef]
  53. Maynez-Rojas, M.A.; Casanova-González, E.; Ruvalcaba-Sil, J.L. Identification of natural red and purple dyes on textiles by Fiber-optics Reflectance Spectroscopy. Spectrochim. Acta A 2017, 178, 239–250. [Google Scholar] [CrossRef]
  54. Grazia, C.; Buti, D.; Amat, A.; Rosi, F.; Romani, A.; Domenici, D.; Sgamellotti, A.; Miliani, C. Shades of blue: Non-invasive spectroscopic investigations of Maya blue pigments. From laboratory mock-ups to Mesoamerican codice. Herit. Sci. 2020, 8, 1. [Google Scholar] [CrossRef] [Green Version]
  55. Manrique-Ortega, M.D.; Mitrani, A.; Casanova-González, E.; Pérez-Ireta, G.; García-Bucio, M.A.; Rangel-Chávez, I.; Sugiyama, S. Material study of green stone artifacts from a Teotihuacan complex. Mater. Manuf. Process. 2020, 35, 1431–1445. [Google Scholar] [CrossRef]
  56. Barba, L.; Blancas, J.; Manzanilla, L.R.; Ortiz, A.; Barca, D.; Crisci, G.M.; Pecci, A. Provenance of the limestone used in Teotihuacan (Mexico): A methodological approach. Archaeometry 2009, 51, 525–545. [Google Scholar] [CrossRef]
  57. Rattray, E.C. New findings on the origins of thin orange ceramics. Anc. Mesoam. 1990, 1, 181–195. [Google Scholar] [CrossRef]
Figure 1. Location of Techinantitla, northeast of the main ceremonial buildings in Teotihuacan’s city core. Teotihuacan is located in the central area of Mexico, Northeast of Mexico City.
Minerals 11 00508 g001
Figure 2. Location of Techinantitla (yellow square) in the northeastern corner of the archaeological zone of Teotihuacan. UTM coordinates: East longitude, 516,900 m and North latitude, 2,178,100 m.
Minerals 11 00508 g002
Figure 3. Integrated geophysical studies map. Left: magnetic gradient map in blue and red, and electric resistivity map in grey. Right: georadar depth slice 0.75 m in red and green. Interpreted walls in yellow dotted lines, and selected georadar lines are shown with pink arrows.
Minerals 11 00508 g003
Figure 4. Selected georadar lines F15, F30, F73 and F160.
Minerals 11 00508 g004
Figure 5. Representative selection of polychrome fragments. Visible, FCIR and IR imaging.
Minerals 11 00508 g005
Figure 6. Characteristic FORS spectra from red, pink and yellow areas.
Minerals 11 00508 g006
Figure 7. Cu and Fe X-ray intensities from selected samples, divided into the different colors identified in the mural painting fragments, with their box number indicated.
Minerals 11 00508 g007
Figure 8. OM images of the surface of the red color of two fragments. Fragment 1 (left) is observed at 100×, while the magnification for fragment 2 is 200× (right).
Minerals 11 00508 g008
Figure 9. SEM-BSE image and SEM-EDS elemental mappings of the black inclusions on the red color of fragment 2.
Minerals 11 00508 g009
Figure 10. Characteristic FORS spectra from green and blue areas.
Minerals 11 00508 g010
Figure 11. As/Cu vs. Zn/Cu X-ray intensities obtained from green areas identified as malachite. Two groups can be observed.
Minerals 11 00508 g011
Figure 12. FORS spectra of blue, red and green areas of fragment 141.
Minerals 11 00508 g012
Figure 13. Characteristic FORS spectra from white areas.
Minerals 11 00508 g013
Table 1. Selected fragments, their description and the relationship with previous studies and collections, as well as the polychromie, bichromie or monochromie of each piece.
BoxChromiaDescriptionRelationship
MonoBiPolyTotalDe Young Museum CollectionIn Situ MuralsOther Work [16]
15 11Tlaloc god corner 1
171 23Fragments 1
20 11Dot and bar 1
21 44Footprints 1
23 1 1Red and pink color1
28 22Eye drop/footprints 1
29 2 2Human figure with glyph1
30 1Red Drops 1
31 33Tlaloc god/godess 1
40 11Box with beads 1
42 22Tlaloc god 1
47 11Tlaloc god 1
43 1Hands with claws 1
62 123Slope corner 1
65 11Green circles on pink 1
7451 6Shades of red 1
84 1 1Peaks in pink 1
108 257Feathers 1
113 11Slope with Tlaloc god 1
116 11Slope with Green circle 1
1232 24Blue Peak with pink 1
132 1 Hands with claws 1
136 55Various, face shape 1
140 44Slope with green circles, yellow flower 1
141111517Bird fragments 1
142 22Red with claws 1
184 1 1Footprints & human figure with glyph1
185 11Spike bars 1
193 11Green feathers on pink 1
200 1Feathers 1
201 1Feathers with circles 1
Total9106483 3189
Table 2. Results from FCIR, FORS and XRF analyses of the fragments.
BoxRedYellowGreenBlueWhite
15Hematite *-Malachite *--
17Hematite *-Malachite *--
20Hematite *-Malachite *--
21Hematite *
Fe, Cu
Yellow earths
Fe, Cu
-Earths
-
23Hematite *----
28Hematite *-Malachite * + earths --
29Hematite *----
30Hematite *Yellow earths --Earths, CaCO3
31Hematite *
Fe
Yellow earth
Fe
Malachite * + earths -Earths, CaCO3
Ca
40Hematite *
Fe
-Malachite * + earths
Cu, Fe
Earths
Cu, Fe-Azurite
Earths, CaCO3
Cu, Fe
42Hematite *
Fe
Malachite * + earths
Cu, Fe
Earths
-
43Hematite *-Malachite *--
47Hematite *
Fe
Yellow earths
Fe
Malachite *Earths
Cu, Fe
Earths, CaCO3
62Hematite *-Malachite *--
65Hematite *-Malachite *--
74Hematite *Yellow earths ---
84Hematite *----
108Hematite Yellow earths Azurite + malachite + earths -Gypsum
113Hematite *-Malachite *--
116Hematite *-Malachite *--
123Hematite *
Fe
Yellow earths
Cu, Fe
Malachite *Earths
-
132Hematite
Fe
Yellow earth
Fe
Malachite + earths
Cu, Fe
Earths
Cu, Fe
-
136Hematite *
Fe
Yellow earths
Fe, Cu
Malachite * + earths /Earths
Cu, Fe
Earths
Cu, Fe-Azurite
Earths, CaCO3
Cu, Fe
140Hematite *-Malachite *--
141Hematite Yellow earths Malachite * + earths Azurite/Earths Probable gypsum
142Hematite *----
184Hematite *----
185Hematite *
Fe
Yellow earths
Fe
Malachite *Earths
Cu, Fe
Earths, CaCO3
Cu, Fe
193Hematite *
Fe
-Malachite *
Cu, Fe
--
200Hematite
Fe
Yellow earths
Fe
Malachite + earths Earths -
201Hematite Yellow earths Malachite Earths Earths, gypsum
* Suggested by FCIR; † identified by FORS; ‡ relevant elements detected by XRF; ∅: no relevant elements detected.
Publisher’s Note: MDPI stays neutral with regard to jurisdictional claims in published maps and institutional affiliations.