Article

Elimination of Ferric Ion Effect on Separation between Kyanite and Quartz Using Citric Acid as Regulator

1
Heilongjiang Province Geology Ore Test and Application Institute, Harbin 150000, China
2
College of Resources and Civil Engineering, Northeastern University, Shenyang 110816, China
3
State Key Laboratory of Mineral Processing, BGRIMM Technology Group, Beijing 100160, China
4
Heilongjiang Mining Group Co., Ltd., Harbin 150000, China
*
Author to whom correspondence should be addressed.
Minerals 2021, 11(6), 599; https://doi.org/10.3390/min11060599
Submission received: 6 May 2021 / Revised: 28 May 2021 / Accepted: 31 May 2021 / Published: 3 June 2021
(This article belongs to the Special Issue Flotation Chemistry, Volume II)

Abstract

:
Ferric ions produced during grinding influence the flotation separation between kyanite and quartz adversely. In this study, citric acid was used as a regulator to eliminate the effect of ferric ions on the separation of kyanite from quartz with sodium oleate (NaOL) as a collector. The microflotation test results indicated that the quartz was selectively activated by FeCl3 and maintained significant quartz recovery. However, the citric acid could selectively eliminate the effect of ferric ions on the quartz and minimally influenced the kyanite. Contact angle tests demonstrated that FeCl3 significantly increased the interaction between NaOL and quartz, resulting in the high hydrophobicity of quartz, and the addition of citric acid made the quartz surface hydrophilic again but slightly influenced the kyanite. Fourier-transform infrared spectroscopy showed that FeCl3 facilitated NaOL adsorption onto the quartz surface, and the addition of citric acid eliminated the activation of FeCl3 on the quartz, resulting in the nonadsorption of NaOL onto the quartz surface. However, the FeCl3 and citric acid exhibited a negligible effect on NaOL adsorption onto the kyanite surface. X-ray photoelectron spectroscopy analysis indicated that the citric acid eliminated FeCl3 activation on the quartz.

1. Introduction

Kyanite is an essential metamorphic nesosilicate with the chemical formula Al2SiO5, and it is widely used in metallurgy, building materials, ceramics, and other industrial sectors [1,2]. It can also be used for preparing silicon–aluminum alloys and metal fibers [3]. However, with the extensive exploitation of kyanite resources, low-grade kyanite, rich in quartz and muscovite impurities, has become relatively more abundant [4]. Thus, reducing the impurity contents (for example, quartz) is required to improve the quality of kyanite concentration powder.
Kyanite is produced in commercial grades using several mineral processing methods, such as hand sorting, gravity separation, magnetic separation, flotation, and roasting [5,6,7,8]. Because kyanite properties are becoming increasingly complex, flotation is widely applied for kyanite beneficiation. Many studies on the separation of kyanite and quartz were focused on the development of collectors, such as anionic sodium hexadecanesulfonate [9], dodecylamine hydrochloride [10], sodium dodecyl sulfate [11], and potassium oleate [12]. Nonetheless, despite the several novel collectors used in these experimental studies, sodium oleate (NaOL) remains the most widely used collector for the direct flotation separation between kyanite and quartz [13,14].
The minerals are crushed and ground before the flotation process is started, and ferric ions released from the steel-grinding medium may activate gangue minerals [15]. Therefore, the flotation separation of kyanite from quartz in the presence of NaOL as a collector can cause a large amount of quartz to float together with kyanite, reducing the grade of kyanite in the concentrate [16,17,18]. Thus, the activation of quartz by ferric ion should be eliminated to enhance flotation separation between kyanite and quartz efficiently.
Citric acid is an environmentally friendly organic chelating agent, which has been widely used in recent years. Many research studies have shown that citric acid can form a stable complex with iron, prevent iron precipitation, increase the concentration of soluble iron in water, and promote the production of more active oxygen free radicals [19,20,21]. Therefore, in this study, a citric acid regulator was employed to achieve efficient separation through flotation and increase the difference in the flotation performance of kyanite and quartz using NaOL as a collector in the presence of ferric ions. The effects of the citric acid and ferric ions on the flotation behavior of these two minerals were investigated through experimental microflotation tests. Furthermore, the effects of the different adsorption behaviors and selective reaction mechanisms of the citric acid and ferric ion on the flotation separation between the two minerals were determined through contact angle measurements, Fourier-transform infrared (FTIR) analysis, and X-ray photoelectron spectroscopy (XPS) measurements.

2. Materials and Methods

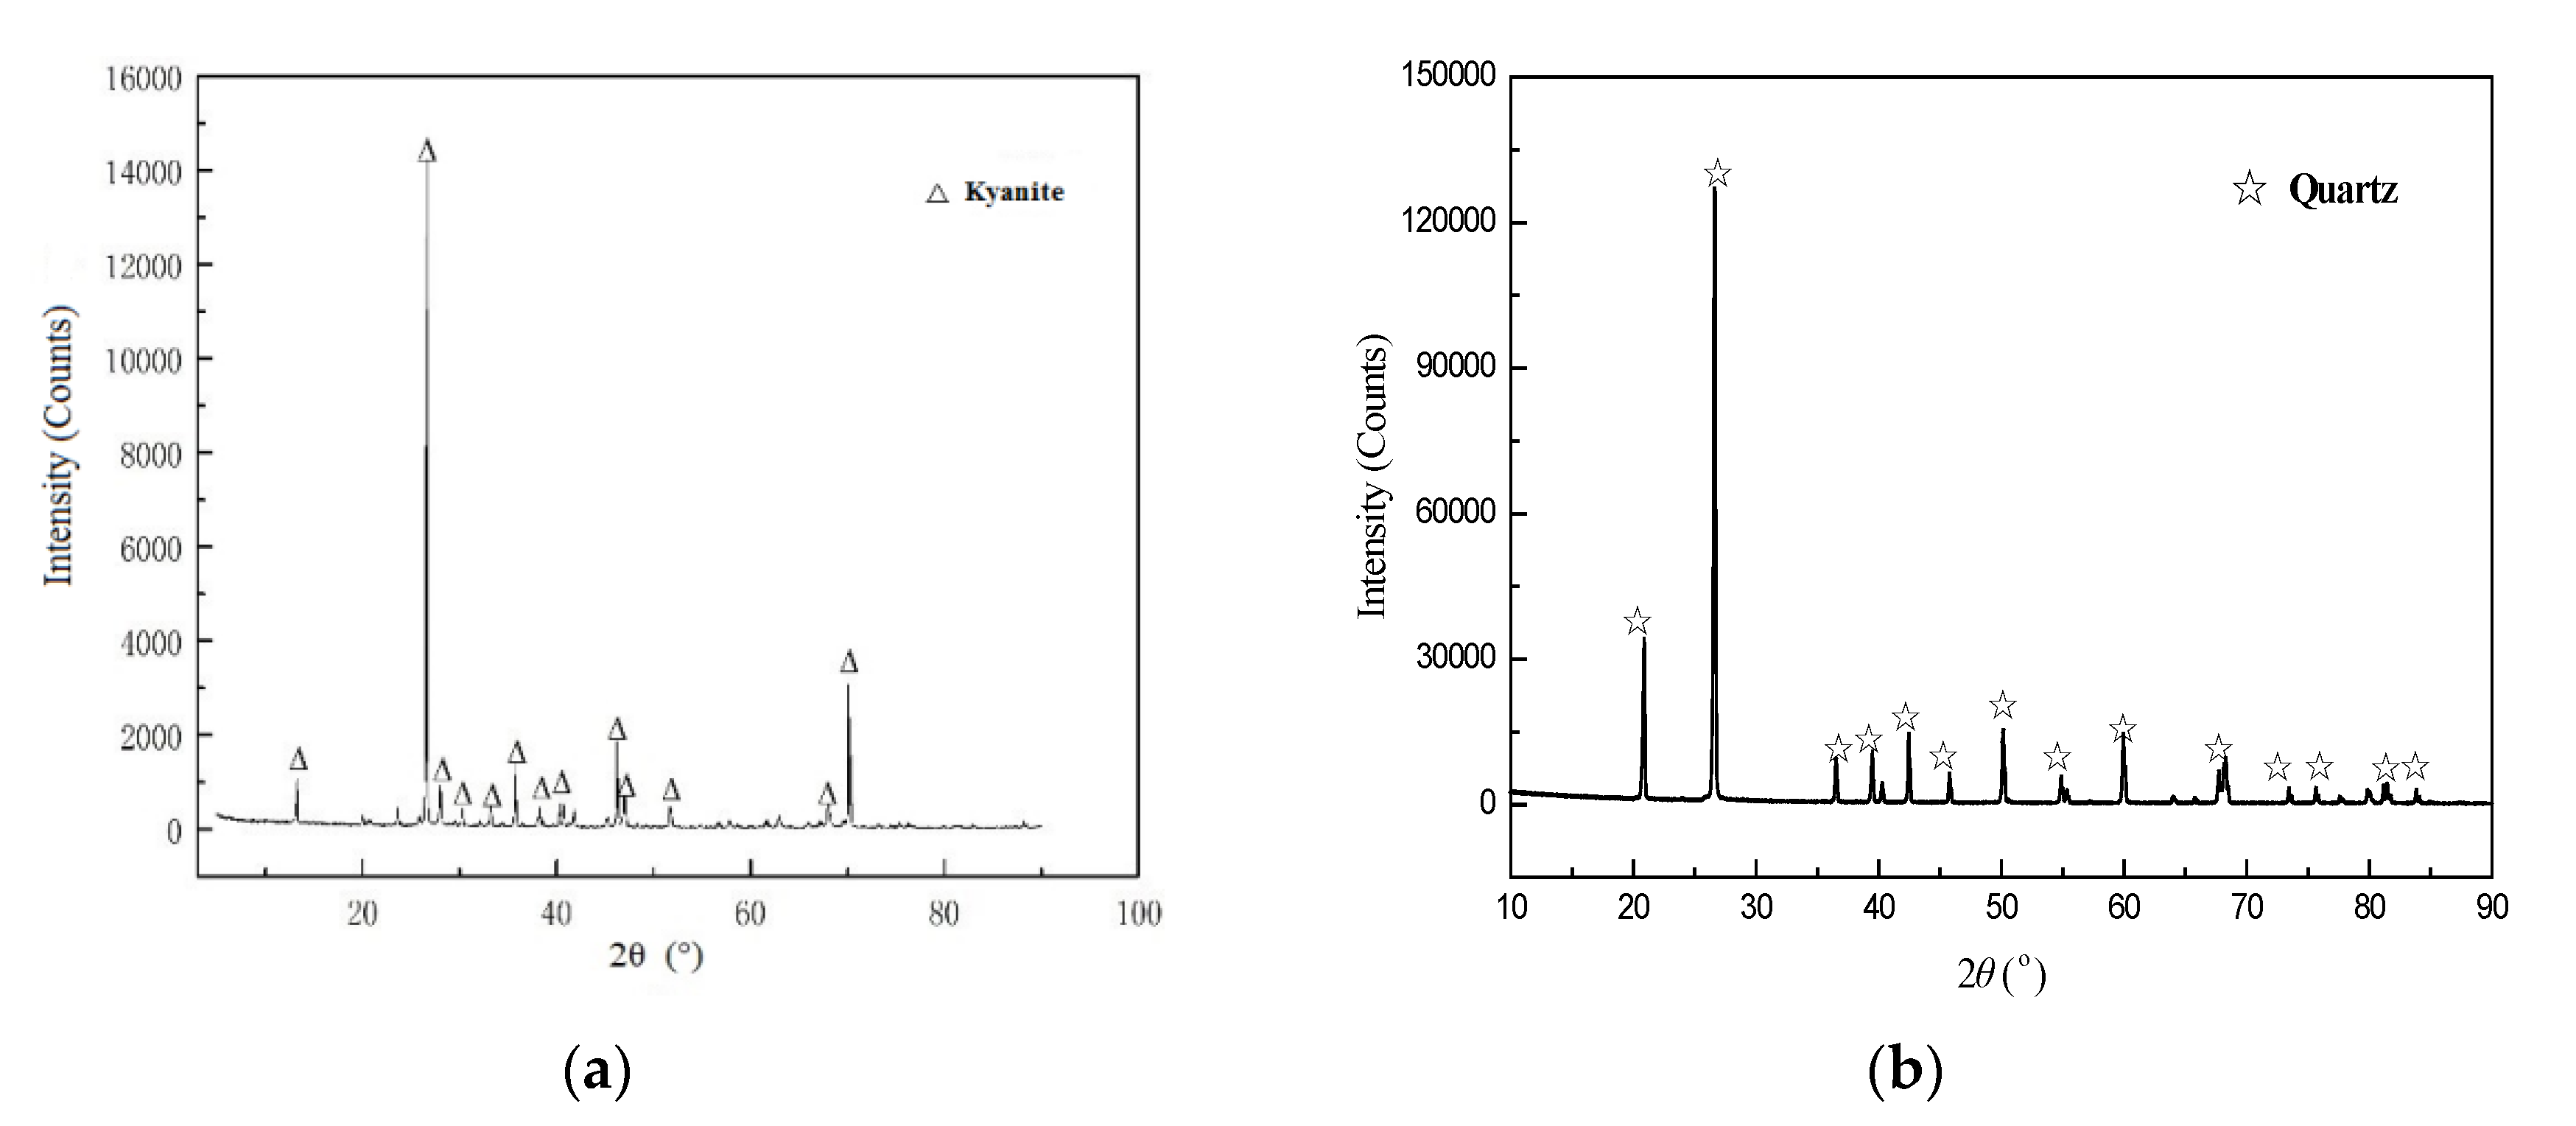
2.1. Materials and Reagents

Separate kyanite and quartz minerals were obtained from Henan and Hebei Provinces in China, respectively [22]. The X-ray powder diffraction patterns of the samples are shown in Figure 1, and the chemical analysis results are listed in Table 1. The kyanite and quartz purities were 98.60% and 99.31%, respectively.
The −0.074 + 0.045 mm fraction was used for the experimental flotation tests and contact angle analyses. Analytical grades of citric acid, NaOL, and FeCl3 were obtained from Aladdin Industrial Corporation, Shanghai, China, NaOH and HCl solutions were used to adjust the pH, and deionized water was used for all experimental tests.

2.2. Microflotation Tests

Microflotation tests were performed using an XFG flotation machine manufactured with a 30 mL plexiglass cell [22]. Deionized water (20 mL) and the sample (2.0 g) were placed in the microflotation cell and mixed at a stirring speed of 1920 rpm. Figure 2 shows the flotation test procedure for the microflotation test (a mixture of kyanite and quartz in a mass ratio of 1:1). First, the slurry was stirred for 2 min to ensure that the minerals were mixed thoroughly. Subsequently, NaOH or HCl was then added to adjust the slurry pH for 2 min. In addition, FeCl3, citric acid, and NaOL were then added sequentially, with each addition accompanied by pulp stirring for 3 min. Next, the froths were scraped manually with a plastic blade for 3 min. The froth products and scraping, drying, and weighing to calculate recovery. Furthermore, X-ray fluorescence analysis was performed to determine the chemical compositions of the artificially mixed mineral concentrations.

2.3. Contact Angle Tests

Contact angle measurements were detected using a OCA25 analyzer (Dataphysics). Then, 2 g of the sample were added to 20 mL of deionized water, and the pH of the pulp was adjusted. Subsequently, regulators were added during stirring on a magnetic stirrer, and the solution was stirred before 5 min. The pulp was adjusted based on the flotation process. Finally, the solid fraction was washed three times with distilled water and dried at 313 K for detect.

2.4. FTIR Spectroscopy Measurement

FTIR was tested using a FTIR-650S spectrometer at 298 ± 2 K within 4000–400 cm−1 [23]. The mineral samples were ground to approximately 5 μm. The solution was prepared using 1 g of the sample and 20 mL of distilled water. The pulp was adjusted based on the flotation process. Finally, the solid fraction was washed three times with distilled water and dried at 313 K. For the measurements, a 1 mg sample was mixed with 100 mg of spectrally pure KBr and pulverized using an agate mortar [24,25]. The resulting mixture was then pressed into a thin specimen for analysis.

2.5. XPS Measurement

XPS spectra were obtained using an Axis Ultra DLD Kratos AXIS SUPRA spectrometer. The binding energy scale was corrected using a C1s peak at approximately 284.80 eV as the internal binding energy standard [26,27]. A 2 g sample was added to 20 mL of distilled water and centrifuged at 2000 rpm, and the pulp was adjusted based on the flotation process. Finally, the centrifuged solid mineral was washed three times with deionized water and then dried at 313 K for analysis.

3. Results

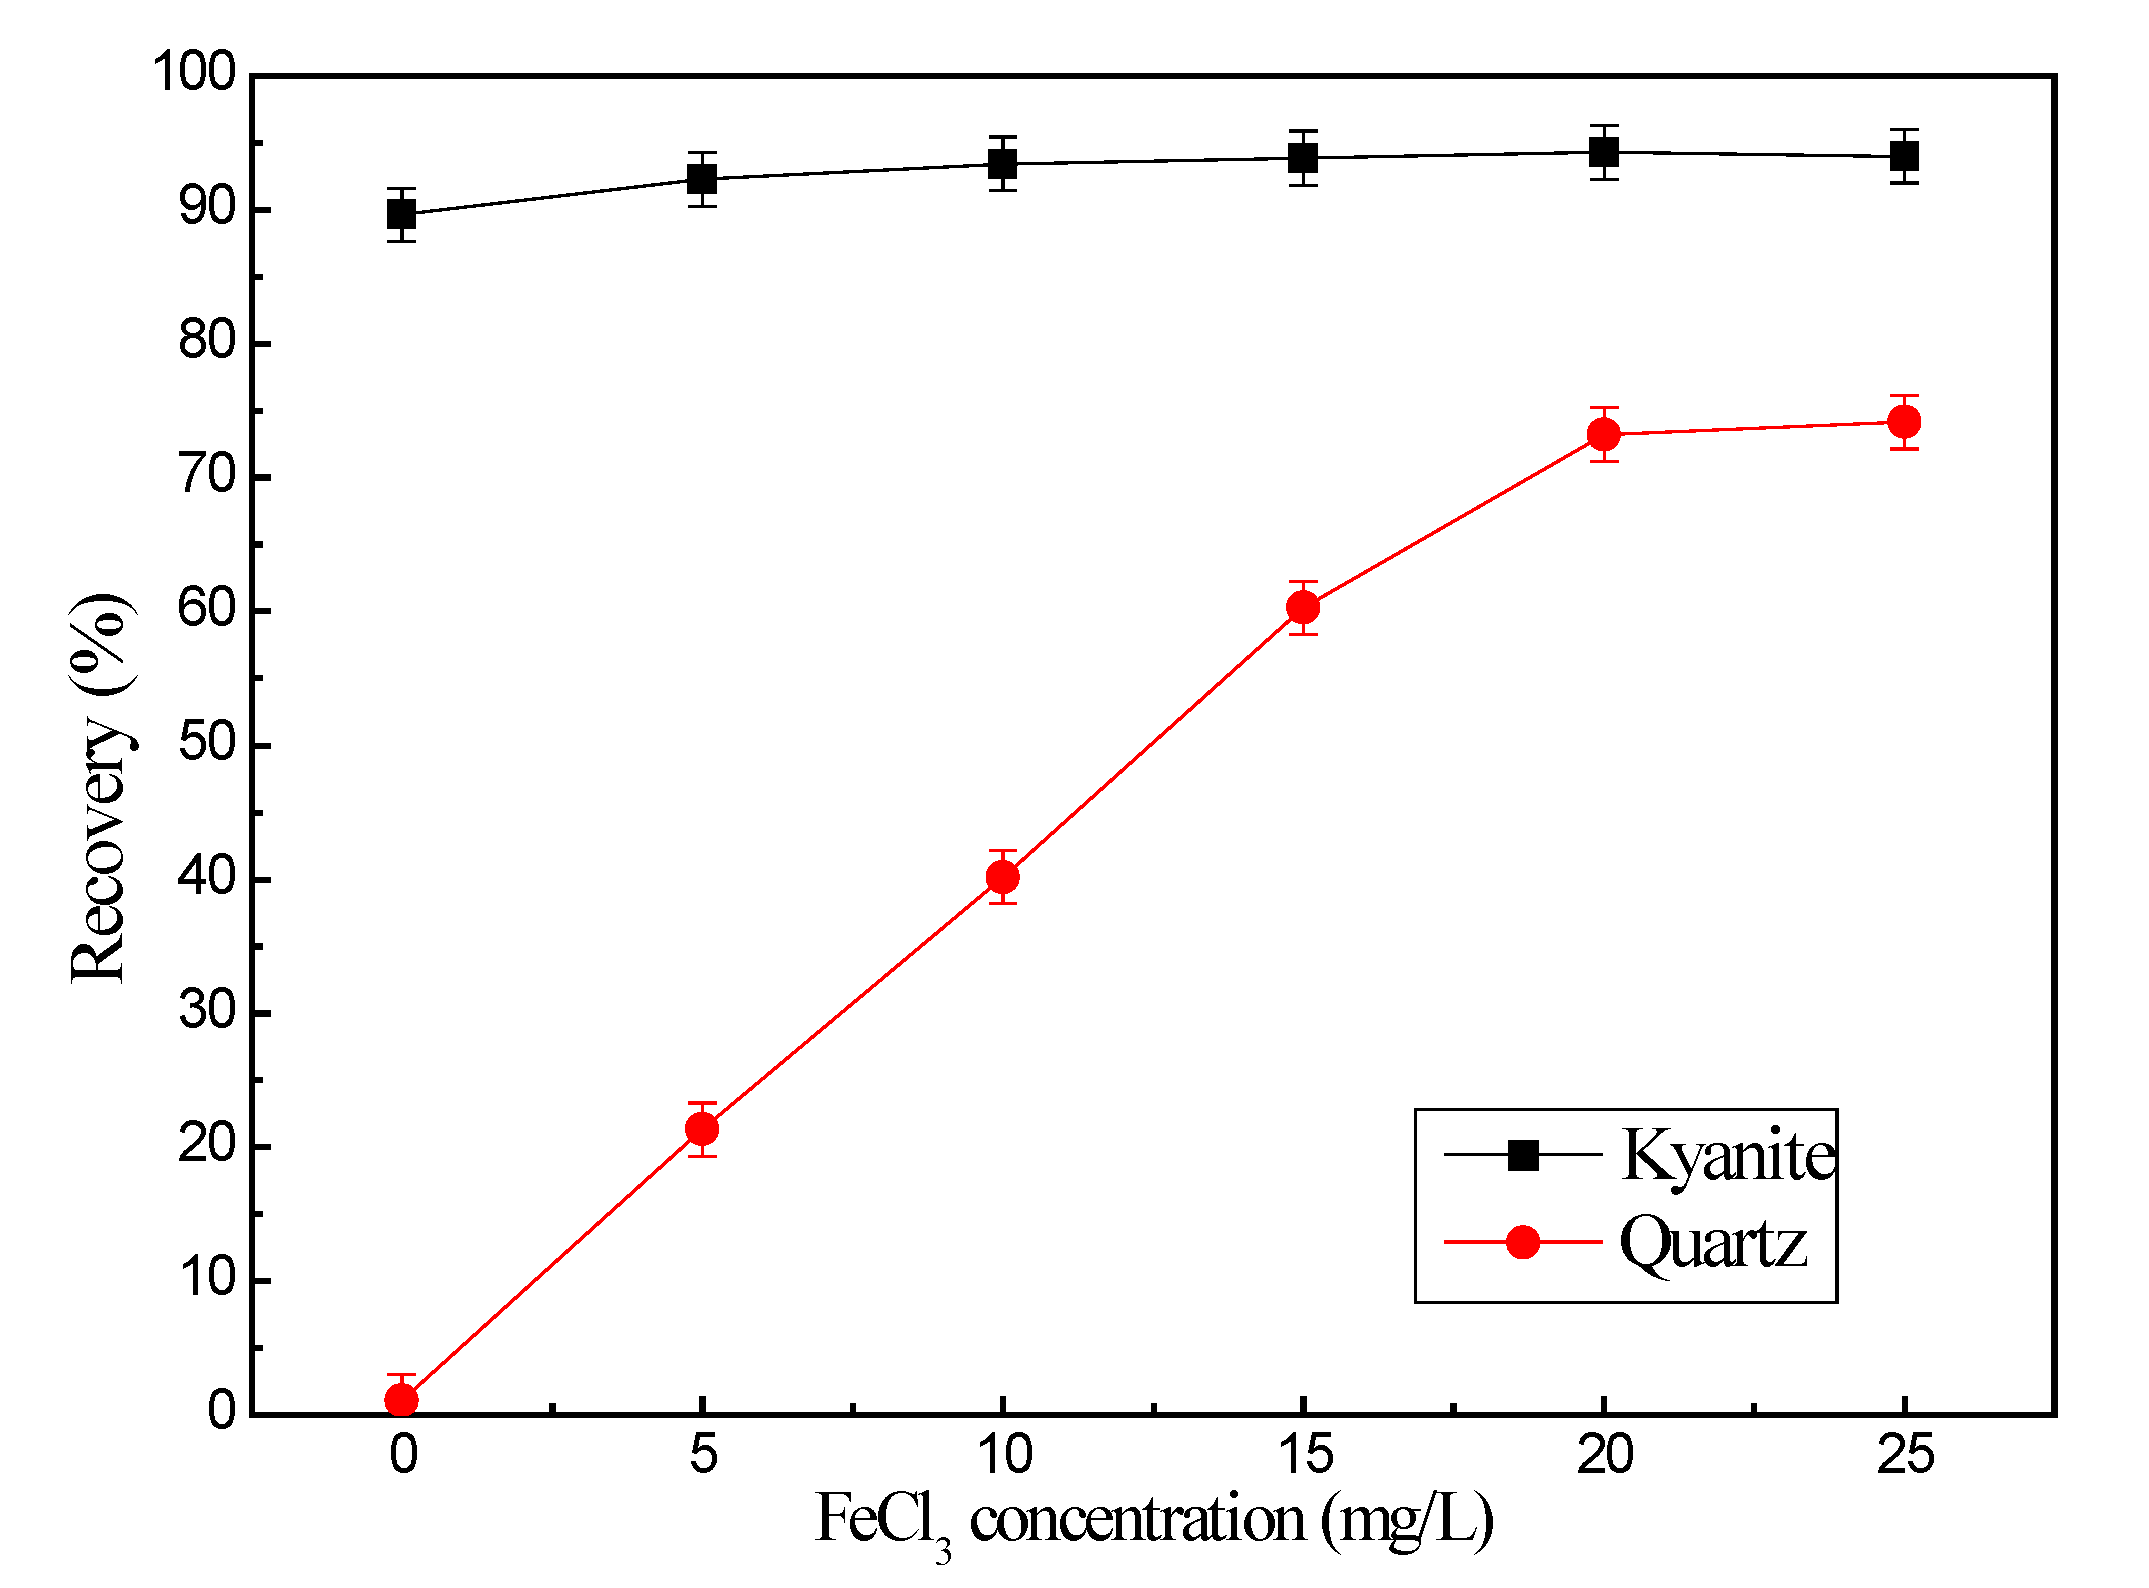
3.1. Microflotation Tests

Flotation tests were performed using NaOL as the collector to observe the floatability of the untreated minerals. Several research studies have illustrated that kyanite and quartz can be efficiently separated in a weakly alkaline environment, and the NaOL concentration is approximately 140–160 mg/L [2,3,9,22]. The flotation test results at a pH of 7.5 and 150 mg/L of NaOL at increasing the FeCl3 concentration are presented in Figure 3.
Within the evaluated range of the FeCl3 concentration (Figure 3), the kyanite recovery fluctuated between 90% and 94%, illustrating that the kyanite exhibited good floatability. However, when the FeCl3 content was increased from 0 to 20 mg/L, the quartz recovery increased from 1.06% to 73.22%, demonstrating that a certain amount of quartz could be floated [22]. With an increase in the FeCl3 concentration, the difference in floatability between the kyanite and quartz decreased gradually, and the difficulty in separating kyanite from quartz increased progressively. These trends shown that FeCl3 had a selective activation impact on quartz flotation, consistent with the results reported in the literature [3,22].
Flotation tests were performed using citric acid as a regulator to reduce the activation effect of ferric ions on the quartz during flotation. The flotation test results for the increasing citric acid concentration at a pH of 7.5, 40 mg/L NaOL, and 20 mg/L FeCl3 are shown in Figure 4.
Figure 4 shows that within the range of the citric acid concentration investigated in this study, the kyanite recovery decreased from 94.32 to 87.41 mg/L. Furthermore, the quartz recovery trend was similar to the kyanite recovery trend; when the citric acid was increased from 0 to 10 mg/L, the quartz recovery rate decreased from 73.22% to 11.83%. This result indicated that the citric acid could cause the depression of both the kyanite and quartz. However, the decrease in the quartz recovery was approximately 8.9 times that of the kyanite, and the recovery difference between the kyanite and quartz was the maximum when an 8 mg/L citric acid was added. Therefore, the citric acid could weaken the ferric ion effect on quartz flotation and minimally influenced the kyanite.
To further certificate the maximum flotation difference between the kyanite and quartz was measured at 8 mg/L citric acid content, the artificially mixed minerals (the mass ratio of kyanite and quartz is 1:1) was observed. The recoveries and grades of the minerals are listed in Table 2.
When citric acid was added, the yield of the concentrate decreased from 81.50% to 51.62%, the Al2O3 grade increased from 35.50% to 52.51%, and the grade of SiO2 decreased from 64.46% to 47.43% (Table 2). Moreover, the recovery of kyanite had little change, but the recovery of quartz decreased from 71.00% to 16.89% compared to NaOL + FeCl3, confirming that the citric acid significantly weakened the effect of ferric ions on quartz flotation and enhanced the separation efficiency between the kyanite and quartz.

3.2. Contact Angle Tests

After the flotation agents were adsorbed onto the mineral surfaces, their surface potentials changed, significantly influencing mineral floatability [23,28]. Under conditions similar to those of the flotation tests, contact angle measurements were conducted (Table 3).
In previous studies [22,29,30], the contact angles of natural kyanite and quartz were 23° and 14°, respectively, indicating that the minerals are hydrophilic. With only NaOL treatment, the contact angles of the kyanite and quartz obtained in this study were 92° and 17°, respectively, indicating that NaOL could significantly enhance kyanite hydrophobicity [3,19]. When FeCl3 and NaOL were added, the contact angles of quartz increased from 17° to 72°, demonstrating that FeCl3 significantly improved the interaction between NaOL and quartz, resulting in high hydrophobicity of quartz [22]. When FeCl3, citric acid, and NaOL coexisted, the contact angles of kyanite and quartz were 91° and 22°, respectively, suggesting that citric acid addition made the quartz surface hydrophilic; however, a slight influence on kyanite was observed, and the significant recovery of kyanite was maintained.

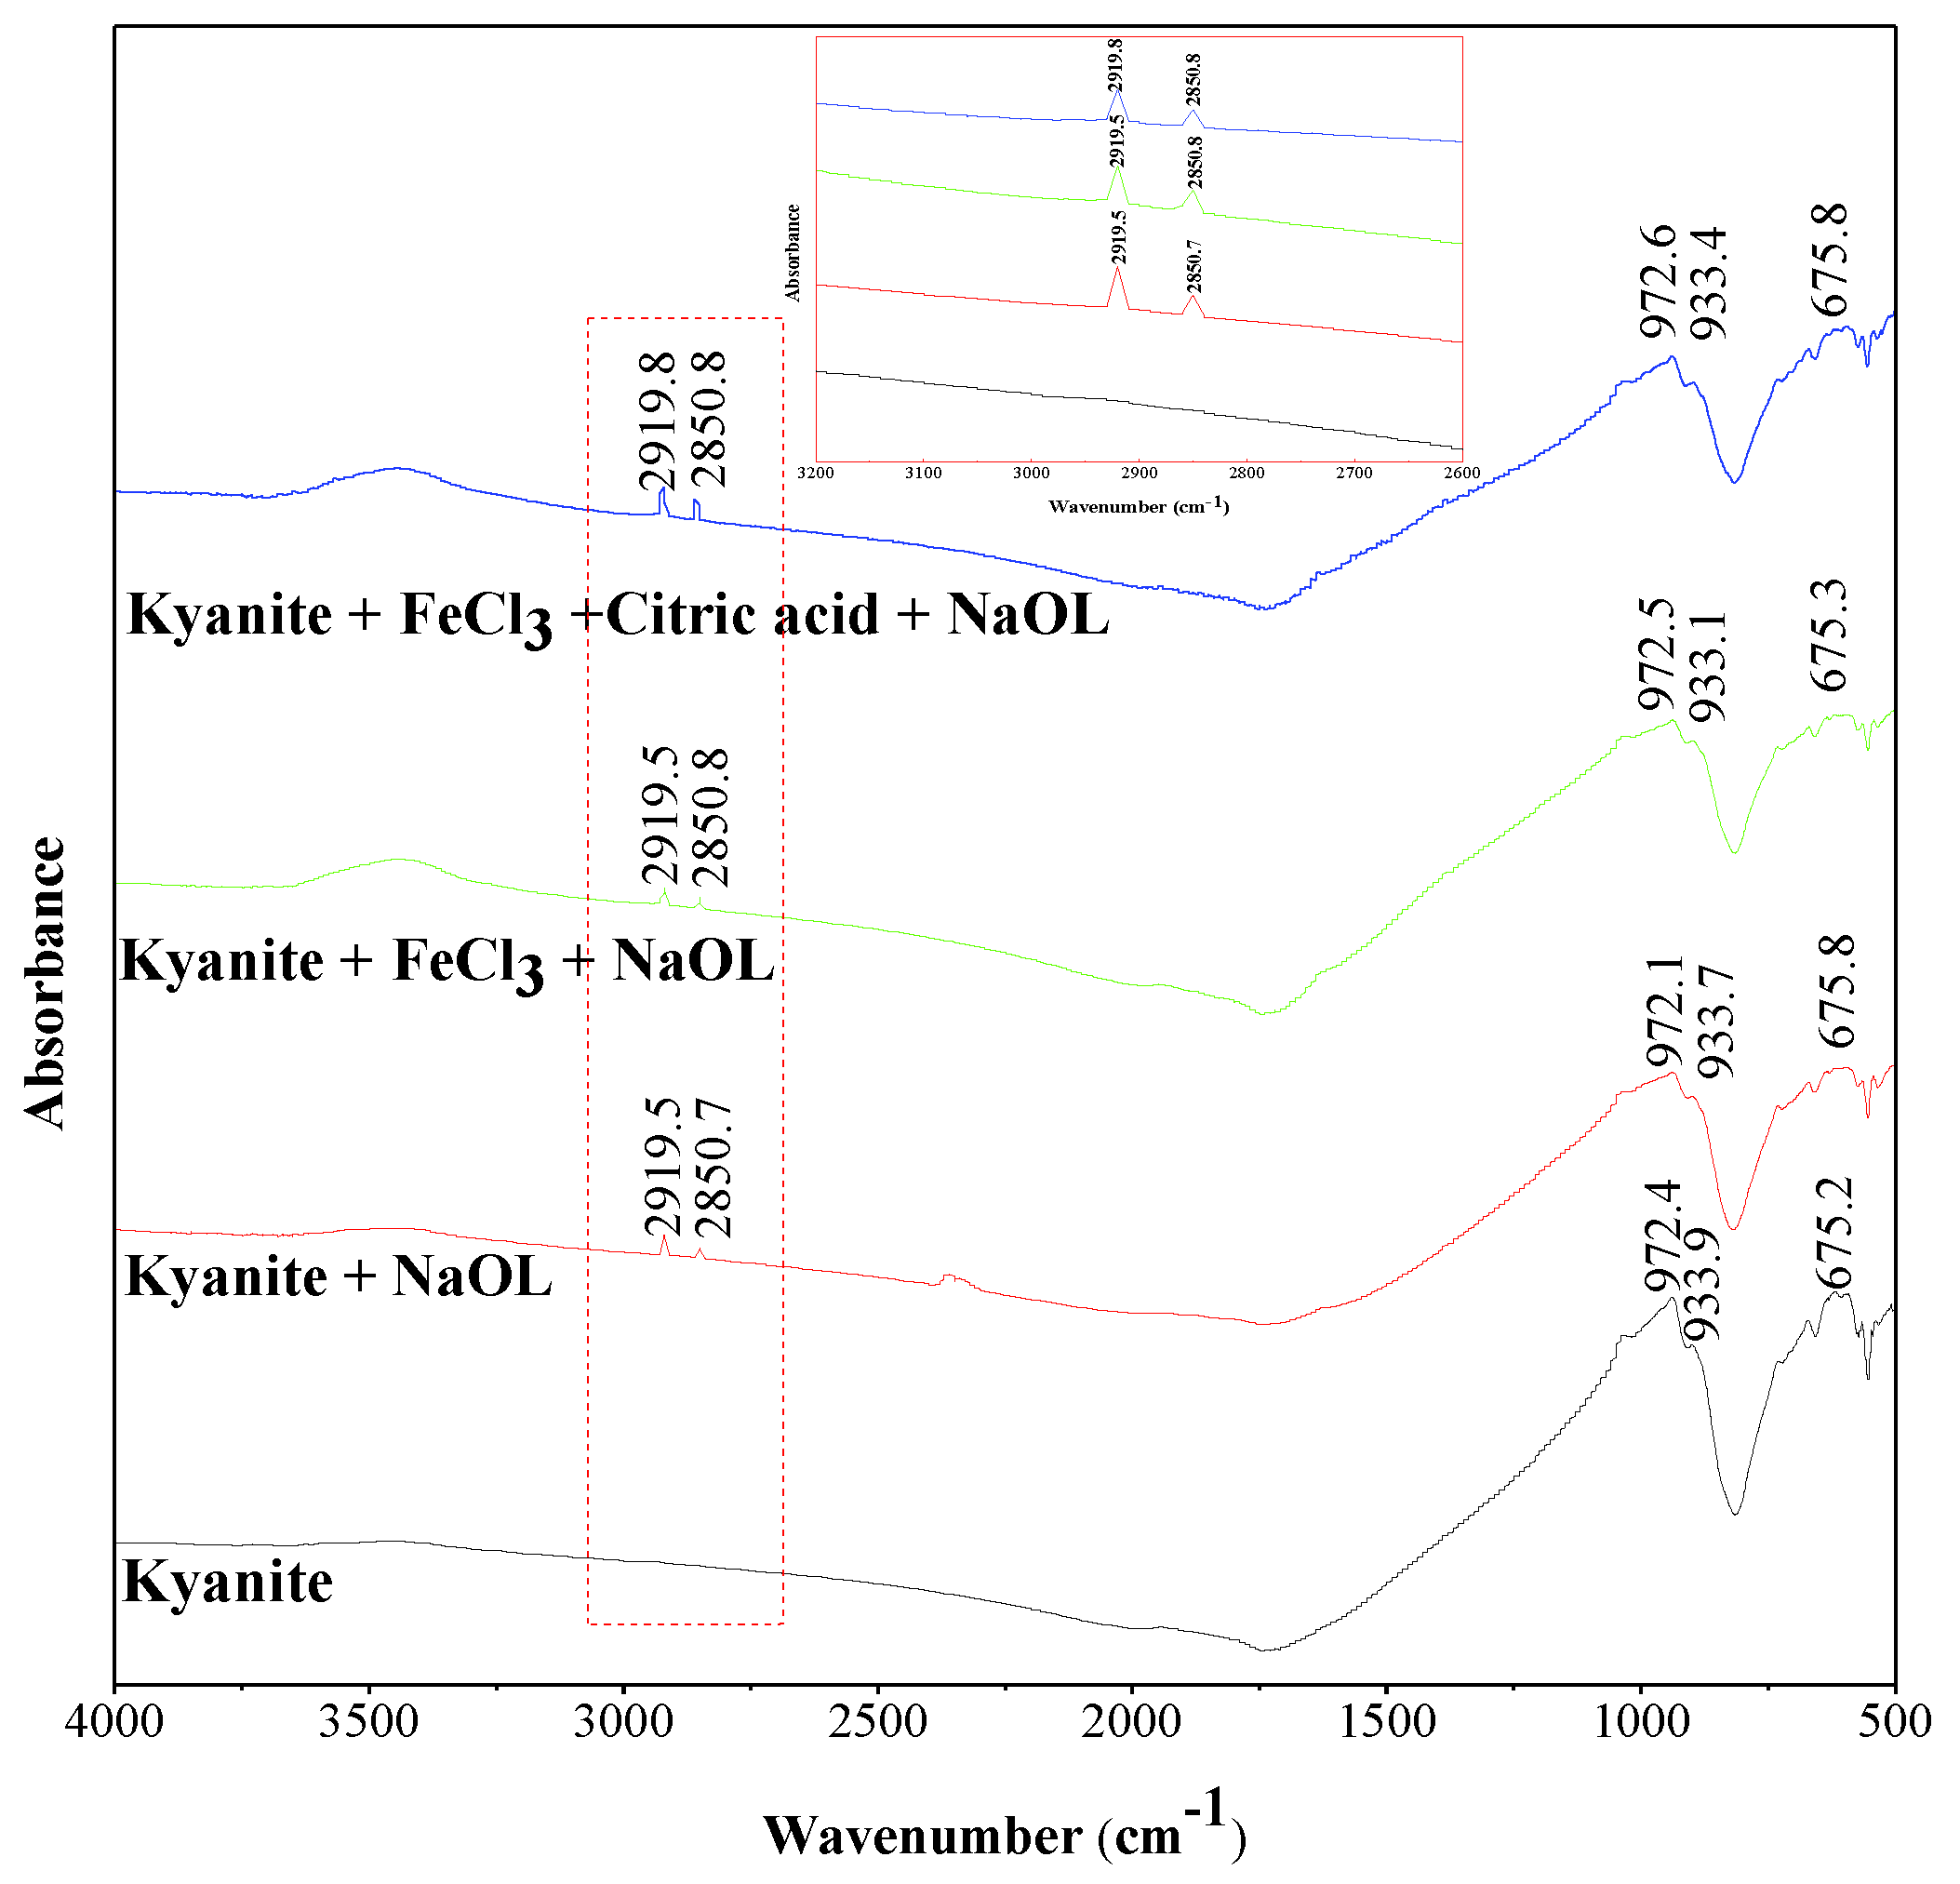
3.3. FTIR Measurements

The effects of the regulator on the NaOL adsorption onto the kyanite and quartz were investigated through FTIR measurements at a pH of 7.5 using 20 mg/L FeCl3, 8 mg/L citric acid, and 150 mg/L NaOL. The FTIR spectra of the reagents and samples are shown in Figure 5 and Figure 6, respectively.
The kyanite peak at approximately 675 cm−1 corresponded to the Si–O tetrahedron symmetrical bending vibration peak; however, the kyanite peaks at approximately 972 and 933 cm−1 were attributed to the Si–O asymmetric stretching vibration of the tetrahedron peaks [22] (Figure 5). Figure 6 shows that the characteristic peaks of quartz at approximately 778 and 693 cm−1 correspond to Si–O symmetrical bending vibrations and Si–O–Si asymmetrical bending vibrations, respectively [23,31].
When NaOL and kyanite coexist, the new peaks appearing at 2918.5 and 2850.7 cm−1 corresponded to the symmetrical of –CH3 and asymmetric stretching vibrations of –CH2 in NaOL, respectively [28,32] (Figure 5). These results suggested that the NaOL was adsorbed onto the kyanite surface. For the kyanite treated with FeCl3 and NaOL, symmetrical vibrations of methyl –CH3 and asymmetric stretching vibrations of methylene –CH2 were detected, and the same peaks were detected in the kyanite treated with FeCl3, citric acid, and NaOL. These results indicated that the FeCl3 and citric acid regulators had negligible effects on the adsorption of NaOL on the kyanite surface.
The FTIR spectra of natural quartz and quartz + NaOL were similar, indicating that NaOL was not adsorbed onto the quartz surface (Figure 6). With the addition of FeCl3 and NaOL, the new peaks appearing at 2921.3 and 2850.8 cm−1 corresponded to the symmetrical of –CH3 and asymmetric stretching vibrations of –CH2 in NaOL, respectively [28,32]. Hence, FeCl3 facilitated NaOL adsorption onto the quartz surface. For the quartz treated with FeCl3, citric acid, and NaOL, the characteristic peaks of quartz were somewhat equal to those of the quartz treated with only NaOL. This result indicated that the addition of citric acid eliminated the activation of FeCl3 on the quartz, resulting in nonadsorption of NaOL onto the quartz surface.

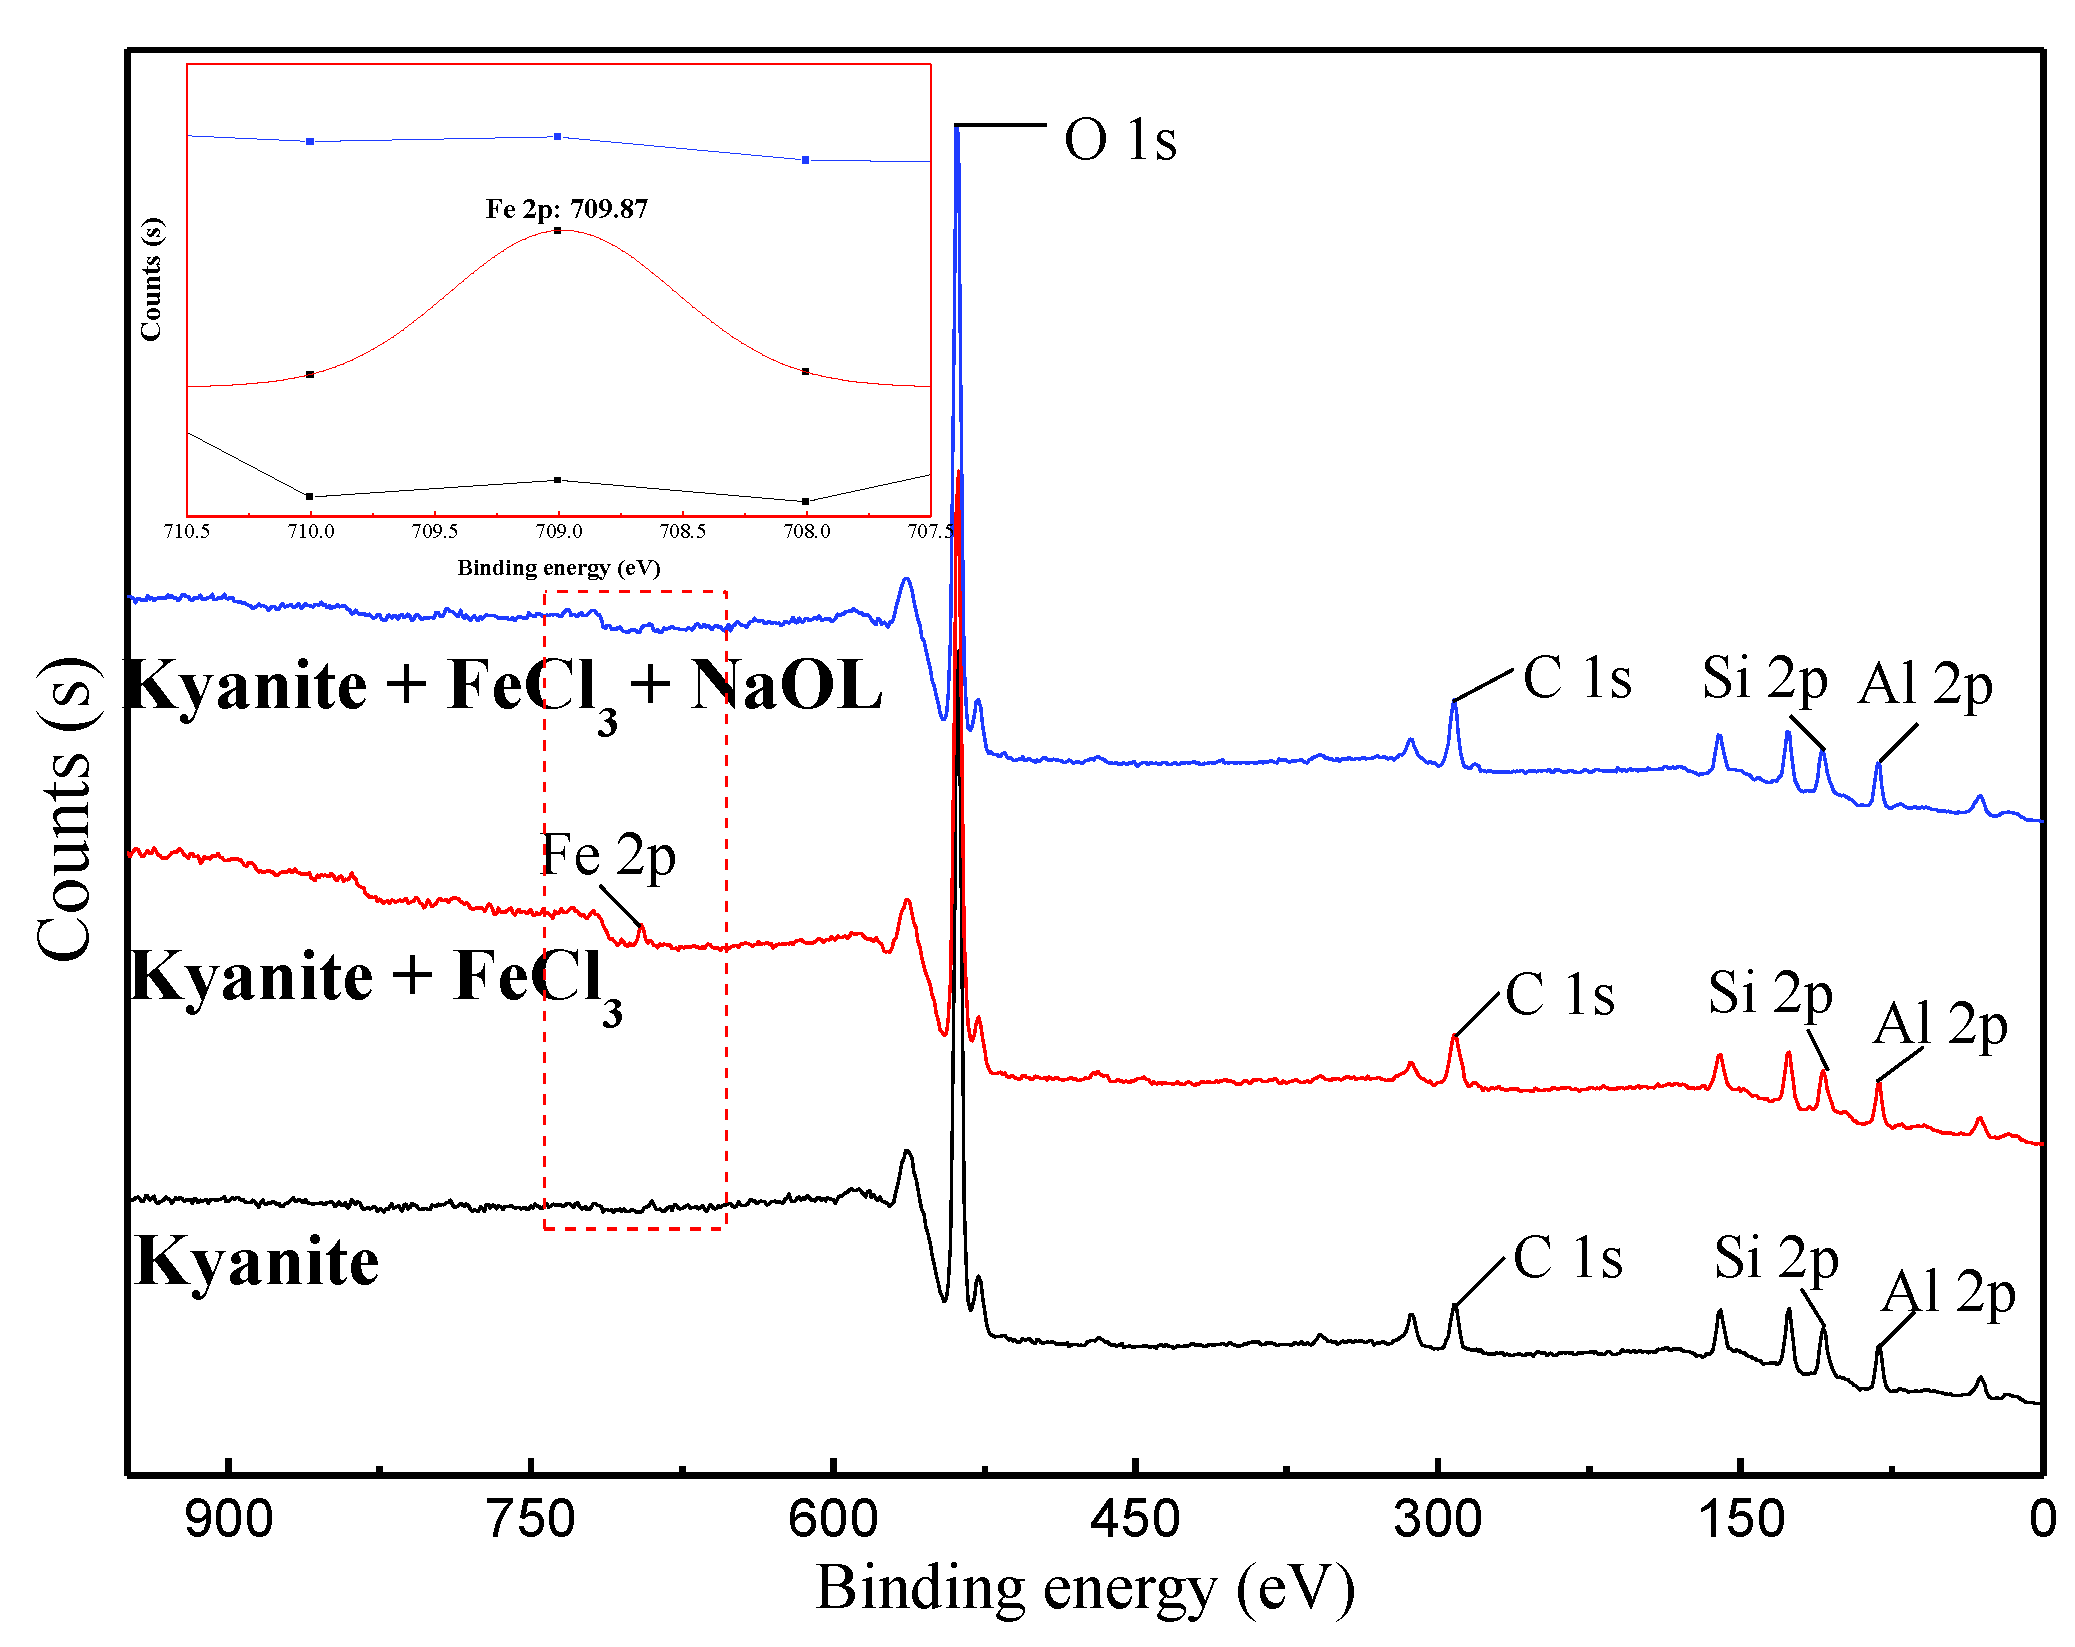
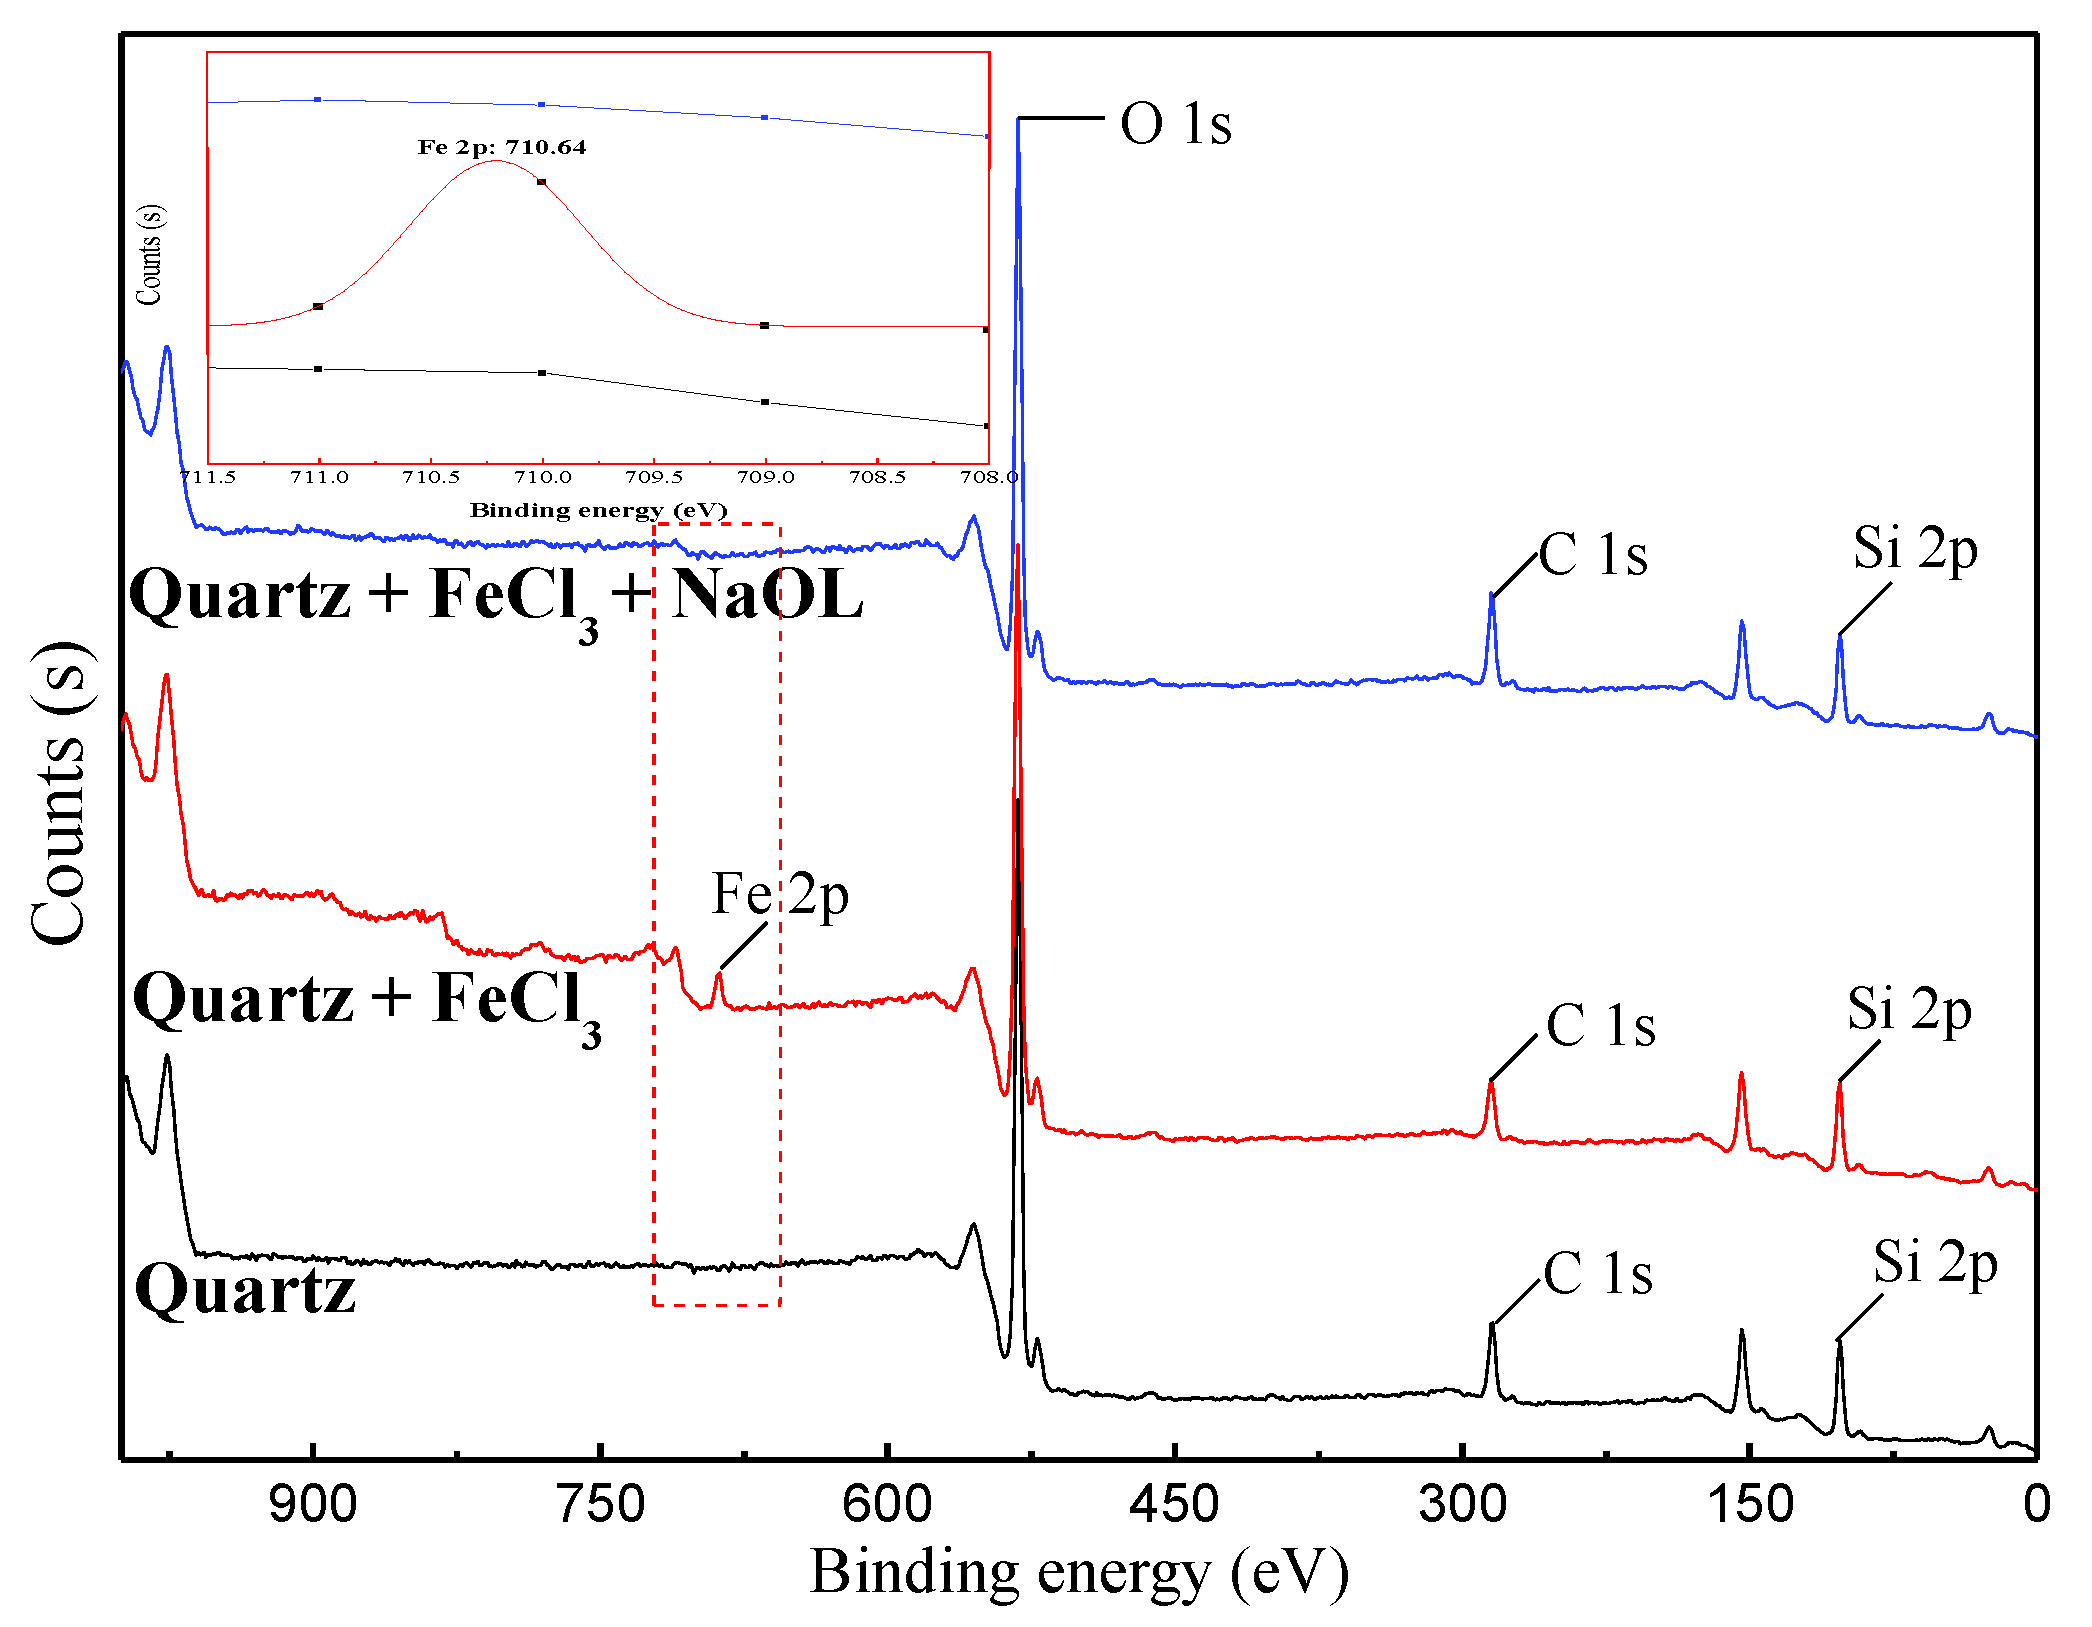
3.4. XPS Measurement

XPS measurements were performed for kyanite and quartz at a pH of 7.5, 20 mg/L FeCl3, and 8 mg/L citric acid to identify the reaction mechanisms between the regulator and the minerals. The binding energy results for the kyanite and quartz are shown in Figure 7 and Figure 8, respectively.
The XPS measurements could not detect Fe on the natural kyanite and quartz surfaces (Figure 7 and Figure 8). In the presence of FeCl3, Fe 2p peaks appeared on the kyanite and quartz surfaces at 709.87 and 710.64 eV, respectively, suggesting that Fe species could precipitate on the surfaces [22]. For the kyanite and quartz treated with FeCl3 + citric acid, the characteristic peaks of Fe 2p disappeared, indicating that the citric acid prevented the adsorption of Fe species onto the kyanite and quartz surfaces.
The relative contents of surface elements of minerals with and without regulator treatment were analyzed (Table 4) to evaluate the effect of the citric acid on the mineral adsorption of ferric ions.
The atomic percentages of Fe 2p in the kyanite and quartz surfaces when they were treated with only FeCl3 were 1.57% and 2.02%, respectively (Table 4). However, when citric acid was added after FeCl3, the atomic percentages of Fe 2p on the kyanite and quartz surfaces were 0.12% and 0.09%, respectively. These results showed that ferric ions in the solution were adsorbed onto the kyanite and quartz surfaces, and the citric acid could decrease the ferric ion content adsorbed onto the kyanite and quartz surfaces.

4. Conclusions

Based on the above results, the following conclusions are drawn.
  • The addition of citric acid weakened the effect of ferric ions on quartz flotation and had minimal influence on kyanite.
  • In the presence of NaOL and FeCl3, the addition of citric acid made the quartz surface hydrophilic again but also slightly deceased the hydrophobicity of the kyanite. Thus, the citric acid maintained the significant recovery of kyanite.
  • Citric acid could eliminate the activation of FeCl3 on the quartz, resulting in the nonadsorption of NaOL onto the quartz surface. However, the FeCl3 and citric acid had a negligible effect on NaOL adsorption onto the kyanite surface.
  • Citric acid decreased the ferric ion content adsorbed onto the kyanite and quartz surfaces.

Author Contributions

Validation, Y.N.; data curation, Y.L.; methodology, H.S.; conceptualization, C.S. and W.Y.; writing—original draft preparation, H.X. All authors have read and agreed to the published version of the manuscript.

Funding

This research was funded by the State Key Laboratory of Mineral Processing of BGRIMM Technology Group, China, grant number: BGRIMM-KJSKL-2017-11 and the Fundamental Research Funds for the Central Universities, China, grant number: N2001029.

Institutional Review Board Statement

Not applicable.

Informed Consent Statement

Not applicable.

Acknowledgments

The authors would like to express their sincere gratitude to the editors and the anonymous reviewers for their helpful remarks and constructive comments, which have improved the quality of the paper.

Conflicts of Interest

The authors declare no conflict of interest.

References

  1. Shackelford, J.F.; Doremus, R.H. Ceramic and Glass Materials: Structure, Properties and Processing, 3rd ed.; Springer: New York, NY, USA, 2008; p. 41. [Google Scholar]
  2. Andrey, D.K.; Oleg, G.P.; Leonid, A.S.; Sergey, N.V. Kyanite ore processing by carbochlorination. Int. J. Miner. Process. 2014, 126, 70–75. [Google Scholar]
  3. Jin, J.; Gao, H.; Chen, X.; Peng, Y. The separation of kyanite from quartz by flotation at acidic pH. Miner. Eng. 2016, 92, 221–228. [Google Scholar] [CrossRef]
  4. Zhang, W.; Meng, Q.; Dai, W. Research on application of kyanite in plastic refractory. Chin. J. Geochem. 2013, 32, 326–330. [Google Scholar] [CrossRef]
  5. Skoog, A.; Moore, R. Refractory of the past for the future: Mullite and its use as a bonding phasse. Am. Ceram. Soc. Bull. 1988, 67, 1180–1185. [Google Scholar]
  6. Brandao, P.R.G.; Mendes, S.I.C. Kyanite from Minas Gerais, Brasil: Characterization for use in ceramic. Innovations in Mineral and Coal Processing. In Proceedings of the 7th International Mineral Processing Symposium, Istanbul, Turkey, 29 April 1998. [Google Scholar]
  7. Jamerson, H.; Dixon, G.; Brown, J.J. Mineralogy of the kyanite beneficiation process. In Proceedings of the 7th United International Technical Conference on Refractories, Cancun, Mexico; 2001. [Google Scholar]
  8. Guanghuan, W. Chinese resources and processing technology for kyanite minerals. Ind. Miner. 1990, 95–98. [Google Scholar]
  9. Bulut, G.; Yurtsever, C. Flotation behaviour of Bitlis kyanite ore. Int. J. Miner. Process. 2004, 73, 29–36. [Google Scholar] [CrossRef]
  10. Belogurova, O.A.; Grishin, N.N. Carbidized heat insulation materials from kyanite ore. Refract. Ind. Ceram. 2012, 53, 26–30. [Google Scholar] [CrossRef]
  11. Amanullah, S.; Rao, G.M.; Satyanarayana, K. Beneficiation of mica-quartzbearing kyanite. Ind. Miner. 1990, 271, 24–29. [Google Scholar]
  12. Wildner, M.; Beran, A.; Koller, F. Spectroscopic characterisation and crystal field calculations of varicoloured kyanites from Loliondo. Tanzan. Mineral. Pet. 2013, 107, 289–310. [Google Scholar] [CrossRef]
  13. Wang, B.; Zhang, H.; Evans, D.G.; Duan, X. Surface modification of layered double hydroxides and incorporation of hydrophobic organic compounds. Mater. Chem. Phys. 2005, 92, 190–196. [Google Scholar] [CrossRef]
  14. Wang, F. Experimental Research on Low Grade Refractory Kyanite in Jiangsu Province. Master’s Thesis, Wuhan University of Technology, Wuhan, China, 2010. [Google Scholar]
  15. Abramov, A.A. Flotation Methods of Mineral Processing; Nedra: Moscow, Russia, 1993. [Google Scholar]
  16. Jin, J.; Gao, H.; Chen, X. The flotation of aluminosilicate polymorphic minerals with anionic and cationic collectors. Miner. Eng. 2016, 8, 1–10. [Google Scholar] [CrossRef]
  17. Alekseev, V.S.; Morozov, G.G. Rate of flotation of kyanite, quartz, and muscovite. Sov. Min. 1975, 11, 62–64. [Google Scholar] [CrossRef]
  18. Zhou, L.; Zhang, Y. Andalusite flotation using alkyl benzene sulfonate as the collector. Min. Procext. Met. Rev. 2011, 32, 267–277. [Google Scholar] [CrossRef]
  19. Huang, J.; Zhou, Z.; Ali, M.; Gu, X.; Danish, M.; Sui, Q.; Lyu, S. Degradation of trichloroethene by citric acid chelated Fe(II) catalyzing sodium percarbonate in the environment of sodium dodecyl sulfate aqueous solution. Chemosphere 2021, 281, 130798. [Google Scholar] [CrossRef]
  20. Yu, S.; Gu, X.; Lu, S.; Xue, Y.; Zhang, X.; Xu, M.; Qiu, Z.; Sui, Q. Degradation of phenanthrene in aqueous solution by a persulfate/percarbonate system activated with CA chelated-Fe(II). Chem. Eng. J. 2017, 333, 122–131. [Google Scholar] [CrossRef]
  21. Zhang, X.; Gu, X.; Lu, S.; Miao, Z.; Xu, M.; Fu, X.; Danish, M.; Brusseau, M.; Qiu, Z.; Sui, Q. Enhanced degradation of trichloroethene by calcium peroxide activated with Fe(III) in the presence of citric acid. Front. Environ. Sci. Eng. 2016, 10, 502–512. [Google Scholar] [CrossRef]
  22. Niu, Y.; Sun, C.; Yin, W.; Zhang, X.; Xu, H.; Zhang, X. Selective flotation separation of andalusite and quartz and its mechanism. Int. J. Min. Met. Mater. 2019, 26, 1059. [Google Scholar] [CrossRef]
  23. Sun, H.; Yang, B.; Zhu, Z.; Yin, W.; Sheng, Q.; Hou, Y.; Yao, J. New insights into selective-depression mechanism of novel depressant EDTMPS on magnesite and quartz surfaces: Adsorption mechanism, DFT calculations, and adsorption model. Miner. Eng. 2021, 160, 106660. [Google Scholar] [CrossRef]
  24. Yang, B.; Yin, W.; Zhu, Z.; Sun, H.; Sheng, Q.; Fu, Y.; Yao, J.; Zhao, K. Differential adsorption of hydrolytic polymaleic anhydride as an eco-friendly depressant for the selective flotation of apatite from dolomite. Sep. Purif. Technol. 2021, 256, 117803. [Google Scholar] [CrossRef]
  25. Yao, J.; Sun, H.; Yang, B.; Zhou, Y.; Yin, W.; Zhu, Z. Selective co-adsorption of a novel mixed collector onto magnesite surface to improve the flotation separation of magnesite from dolomite. Powder Technol. 2020, 371, 180–189. [Google Scholar] [CrossRef]
  26. Zhu, Z.; Yin, W.; Wang, D.; Sun, H.; Chen, K.; Yang, B. The role of surface roughness in the wettability and floatability of quartz particles. Appl. Surf. Sci. 2020, 527, 146799. [Google Scholar] [CrossRef]
  27. Liu, C.; Zhang, W.; Song, S.; Li, H.; Liu, Y. Flotation separation of smithsonite from calcite using 2-phosphonobutane-1,2,4-tricarboxylic acid as a depressant. Powder Technol. 2019, 352, 11–15. [Google Scholar] [CrossRef]
  28. Yao, J.; Yin, W.; Gong, E. Depressing effect of fine hydrophilic particles on magnesite reverse flotation. Int. J. Miner. Process. 2016, 149, 84–93. [Google Scholar] [CrossRef] [Green Version]
  29. Wei, B.; Ning, J.; He, J.; Lu, L.; Wang, Y.; Sun, L. Relation between brine-crude oil-quartz contact angle formed on flat quartz slides and in capillaries with brine composition: Implications for low-salinity waterflooding. Colloids Surf. A Physicochem. Eng. Asp. 2018, 555, 660–667. [Google Scholar] [CrossRef]
  30. Zhu, Z.; Wang, D.; Yang, B.; Yin, W.; Ardakanib, M.S.; Yao, J.; Drelich, J.W. Effect of nano-sized roughness on the flotation of magnesite particles and particle-bubble interactions. Miner. Eng. 2020, 151, 106340. [Google Scholar] [CrossRef]
  31. Liu, W.; Liu, W.; Wang, B.; Zhao, Q.; Duan, H.; Chen, X. Molecular-level insights into the adsorption of a hydroxy-containing tertiary amine collector on the surface of magnesite ore. Powder Technol. 2019, 355, 700–707. [Google Scholar] [CrossRef]
  32. Yao, J.; Sun, H.; Han, F.; Yin, W.; Hong, J.; Wang, Y.; Won, C.; Du, L. Enhancing selectivity of modifier on magnesite and dolomite surfaces by pH control. Powder Technol. 2020, 362, 698–706. [Google Scholar] [CrossRef]
Figure 1. X-ray powder diffraction patterns of (a) kyanite and (b) quartz.
Minerals 11 00599 g001
Figure 2. Procedure for flotation tests.
Minerals 11 00599 g002
Figure 3. Effect of FeCl3 concentration on flotation behavior of single minerals.
Minerals 11 00599 g003
Figure 4. Effect of citric acid concentration on flotation behavior of single minerals.
Minerals 11 00599 g004
Figure 5. FTIR analysis of kyanite.
Minerals 11 00599 g005
Figure 6. FTIR analysis of quartz.
Minerals 11 00599 g006
Figure 7. Binding energy of kyanite with and without regulator treatment.
Minerals 11 00599 g007
Figure 8. Binding energy of quartz with and without regulator treatment.
Minerals 11 00599 g008
Table 1. Chemical composition analysis of mineral samples (wt%).
MineralsSiO2Al2O3TFeMgOCaOTiO2MnLoss on Ignition
Kyanite36.5260.400.810.180.0600.51
Quartz99.310.08
Table 2. Mixed-mineral flotation test results.
Flotation ConditionsProductYield (%)Grade (%)Recovery (wt%)
Al2O3SiO2KyaniteQuartz
NaOL: 150 mg/L;
pH: 7.5;
FeCl3: 20 mg/L.
Concentrate81.5035.5064.4692.0071.00
Tailings18.5013.6086.398.0029.00
Feed100.0031.4559.26100.00100.00
NaOL: 150 mg/L;
pH: 7.5;
FeCl3: 20 mg/L;
Citric acid: 8 mg/L.
Concentrate51.6252.5147.4386.1116.89
Tailings48.389.0890.9113.8983.11
Feed100.0031.4559.26100.00100.00
Table 3. Contact angles of mineral samples under different test conditions.
Test ConditionsContact Angles of Minerals (°)
KyaniteQuartz
Natural minerals2314
NaOL: 150 mg/L9217
FeCl3: 20 mg/L; NaOL: 150 mg/L9772
FeCl3: 20 mg/L; Citric acid: 8 mg/L; NaOL: 150 mg/L9122
Table 4. Content of element of samples surface with and without regulator treatment.
MineralsReagentContent of Element (%)
C 1sO 1sSi 2pAl 2pFe 2p
KyaniteNone14.5156.3412.9216.24
FeCl317.2053.4812.0115.731.57
FeCl3 + Citric acid17.9453.1412.2316.570.12
QuartzNone12.1855.3532.48
FeCl318.3452.6726.97 2.02
FeCl3 + Citric acid22.1349.2828.50 0.09
Publisher’s Note: MDPI stays neutral with regard to jurisdictional claims in published maps and institutional affiliations.

