3.1. Atomic Structure and Mechanical Property of Na-MMT and Mg-MMT at Ideal Condition
Montmorillonite is a 2:1 type dioctahedral layered aluminosilicate mineral. Its layered structure consists of stacked layers, which were mainly linked by van der Waals force and electrostatic force [
39]. Each layer is composed of two silicon-oxygen tetrahedral sheets sandwiching one aluminum (magnesium)-oxygen octahedral sheet. The tetrahedral sheet is linked to adjacent tetrahedrons by sharing three corners forming a hexagonal network, and the remaining corner is shared with octahedron of adjacent octahedral sheet [
6]. The aluminum (magnesium)-oxygen octahedron is connected by oxygen or hydroxyl to form an octahedral sheet. In the present, the calculation models of Na-MMT and Mg-MMT taking Na
0.5Mg
0.5Al
1.5Si
4O
10(OH)
2 and Mg
0.75Al
1.5Si
4O
10(OH)
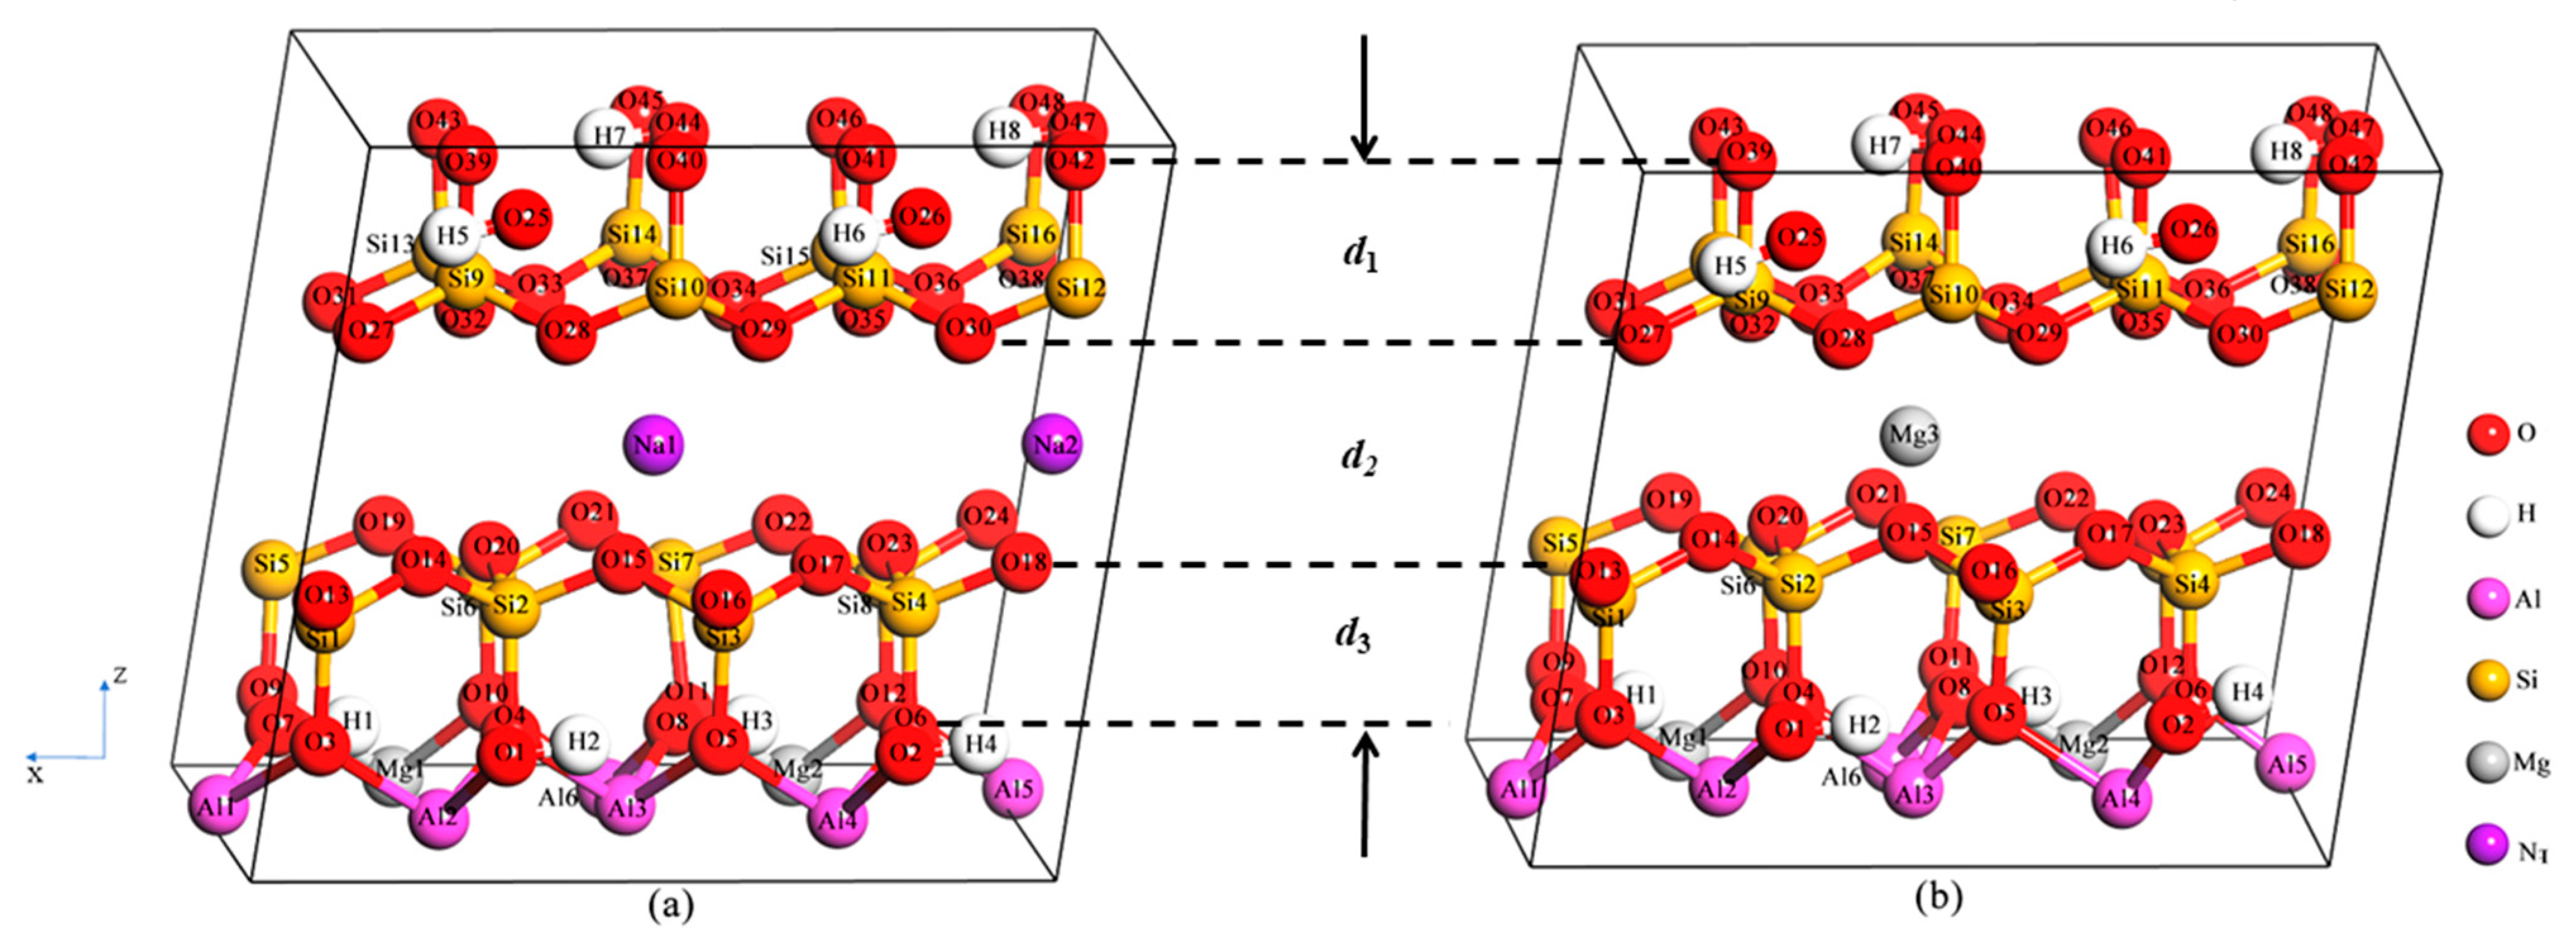
2 as ideal chemical formulas were constructed. The crystal structure of Na-MMT and Mg-MMT are shown in
Figure 1a,b, respectively. The unit cell of Na-MMT is composed of 82 atoms (6 Al atoms, 2 Mg atoms, 2 Na atoms, 16 Si atoms, 8 H atoms and 48 O atoms). The unit cell of Mg-MMT is composed of 81 atoms (6 Al atoms, 3 Mg atoms, 16 Si atoms, 8 H atoms and 48 O atoms). The calculated structural parameters of Na-MMT (2
a = 10.5 Å,
b = 9.07 Å,
c = 9.98 Å,
α = 83.48°,
β = 97.16°,
γ = 89.88°) and Mg-MMT (2
a = 10.49 Å,
b = 9.06 Å,
c = 9.69 Å,
α = 81.12°,
β = 96.95°,
γ = 89.85°) were listed in
Table 1. The calculated results are in good agreement with the existing data [
40,
41]. The exchange-correlation functional used in Ref. [
41] was DFT-D2, which was consistent with this work. The lattice
c of Na-MMT is larger than the value of Mg-MMT.
The major bond lengths of Na-MMT and Mg-MMT in ideal condition (0 K and 0 GPa) were listed in
Table 2. According to the difference of the connected atoms, the oxygen atoms are divided into five kinds: O
a is an oxygen atom connected to Al, Mg and H atom; O
b is an oxygen atom connected to one H atom and two Al atoms; O
c is an oxygen atom connected only to Si atom. O
d is an O atom connected to Al, Mg and Si atom; O
e is an O connected to two Al atoms and one Si atom. The result showed the length of O-Si bonds were shorter than that of O-Al bonds, which indicated that the strength of Al-O bonds was weaker than that of Si-O bonds. The length of O
d-Mg bonds was longer than O
d-Al and O
e-Al bonds, which implied that Mg
2+ instead of Al
3+ reduces the connection strength between aluminum–oxygen octahedron and silicon–oxygen tetrahedron.
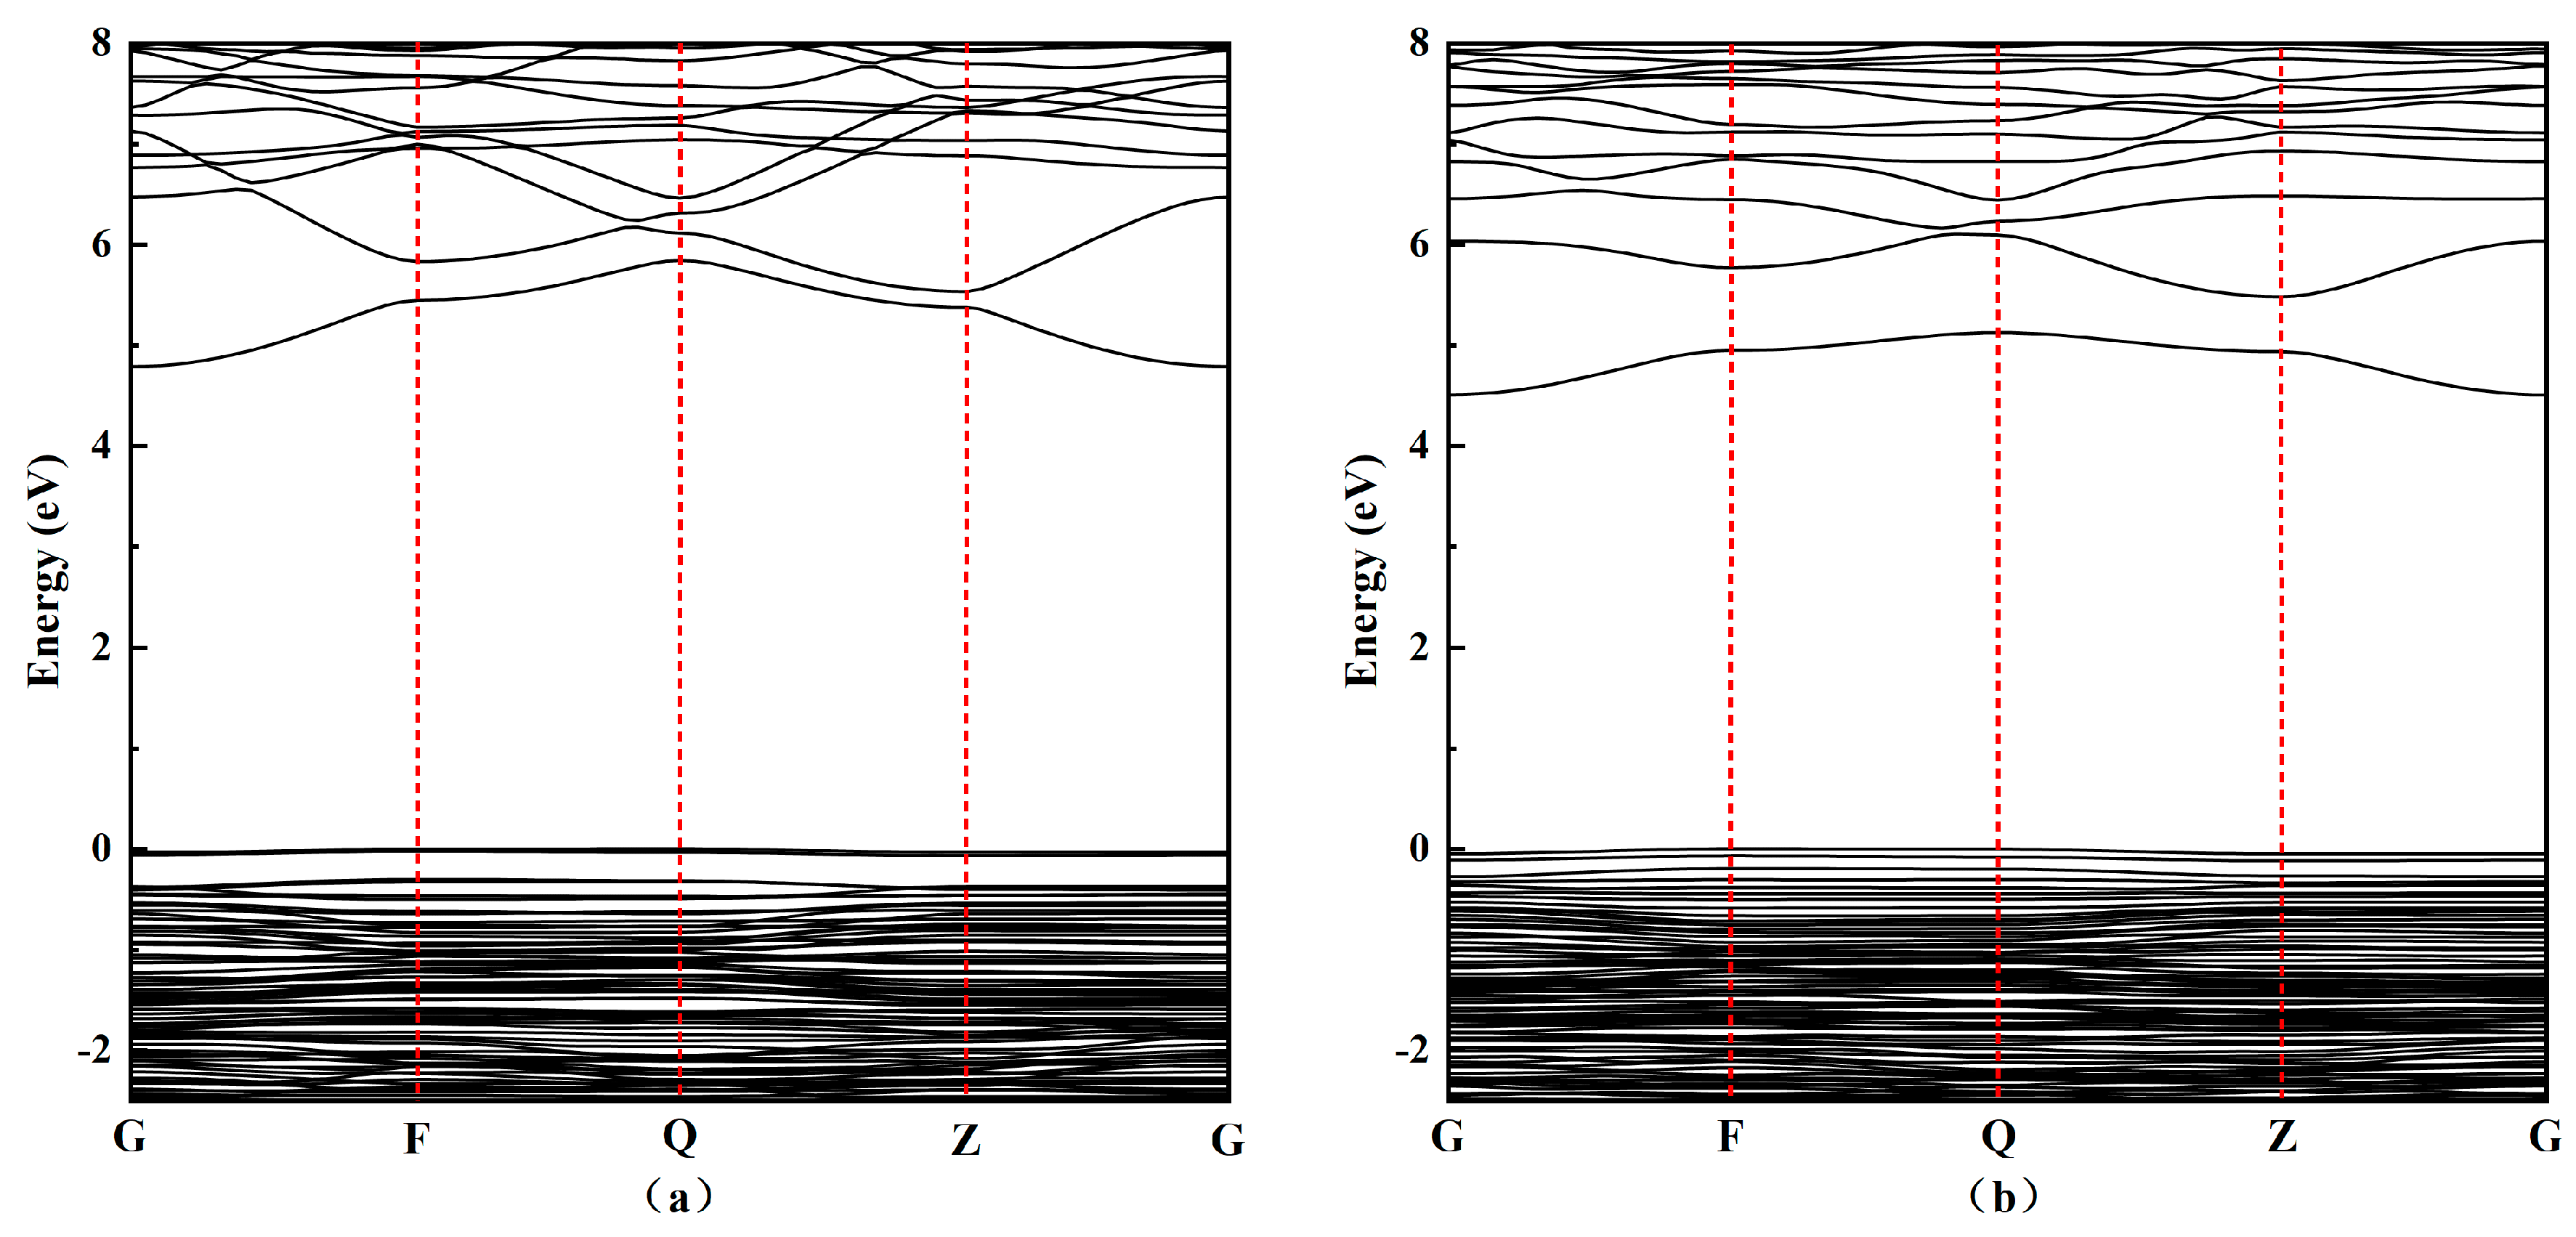
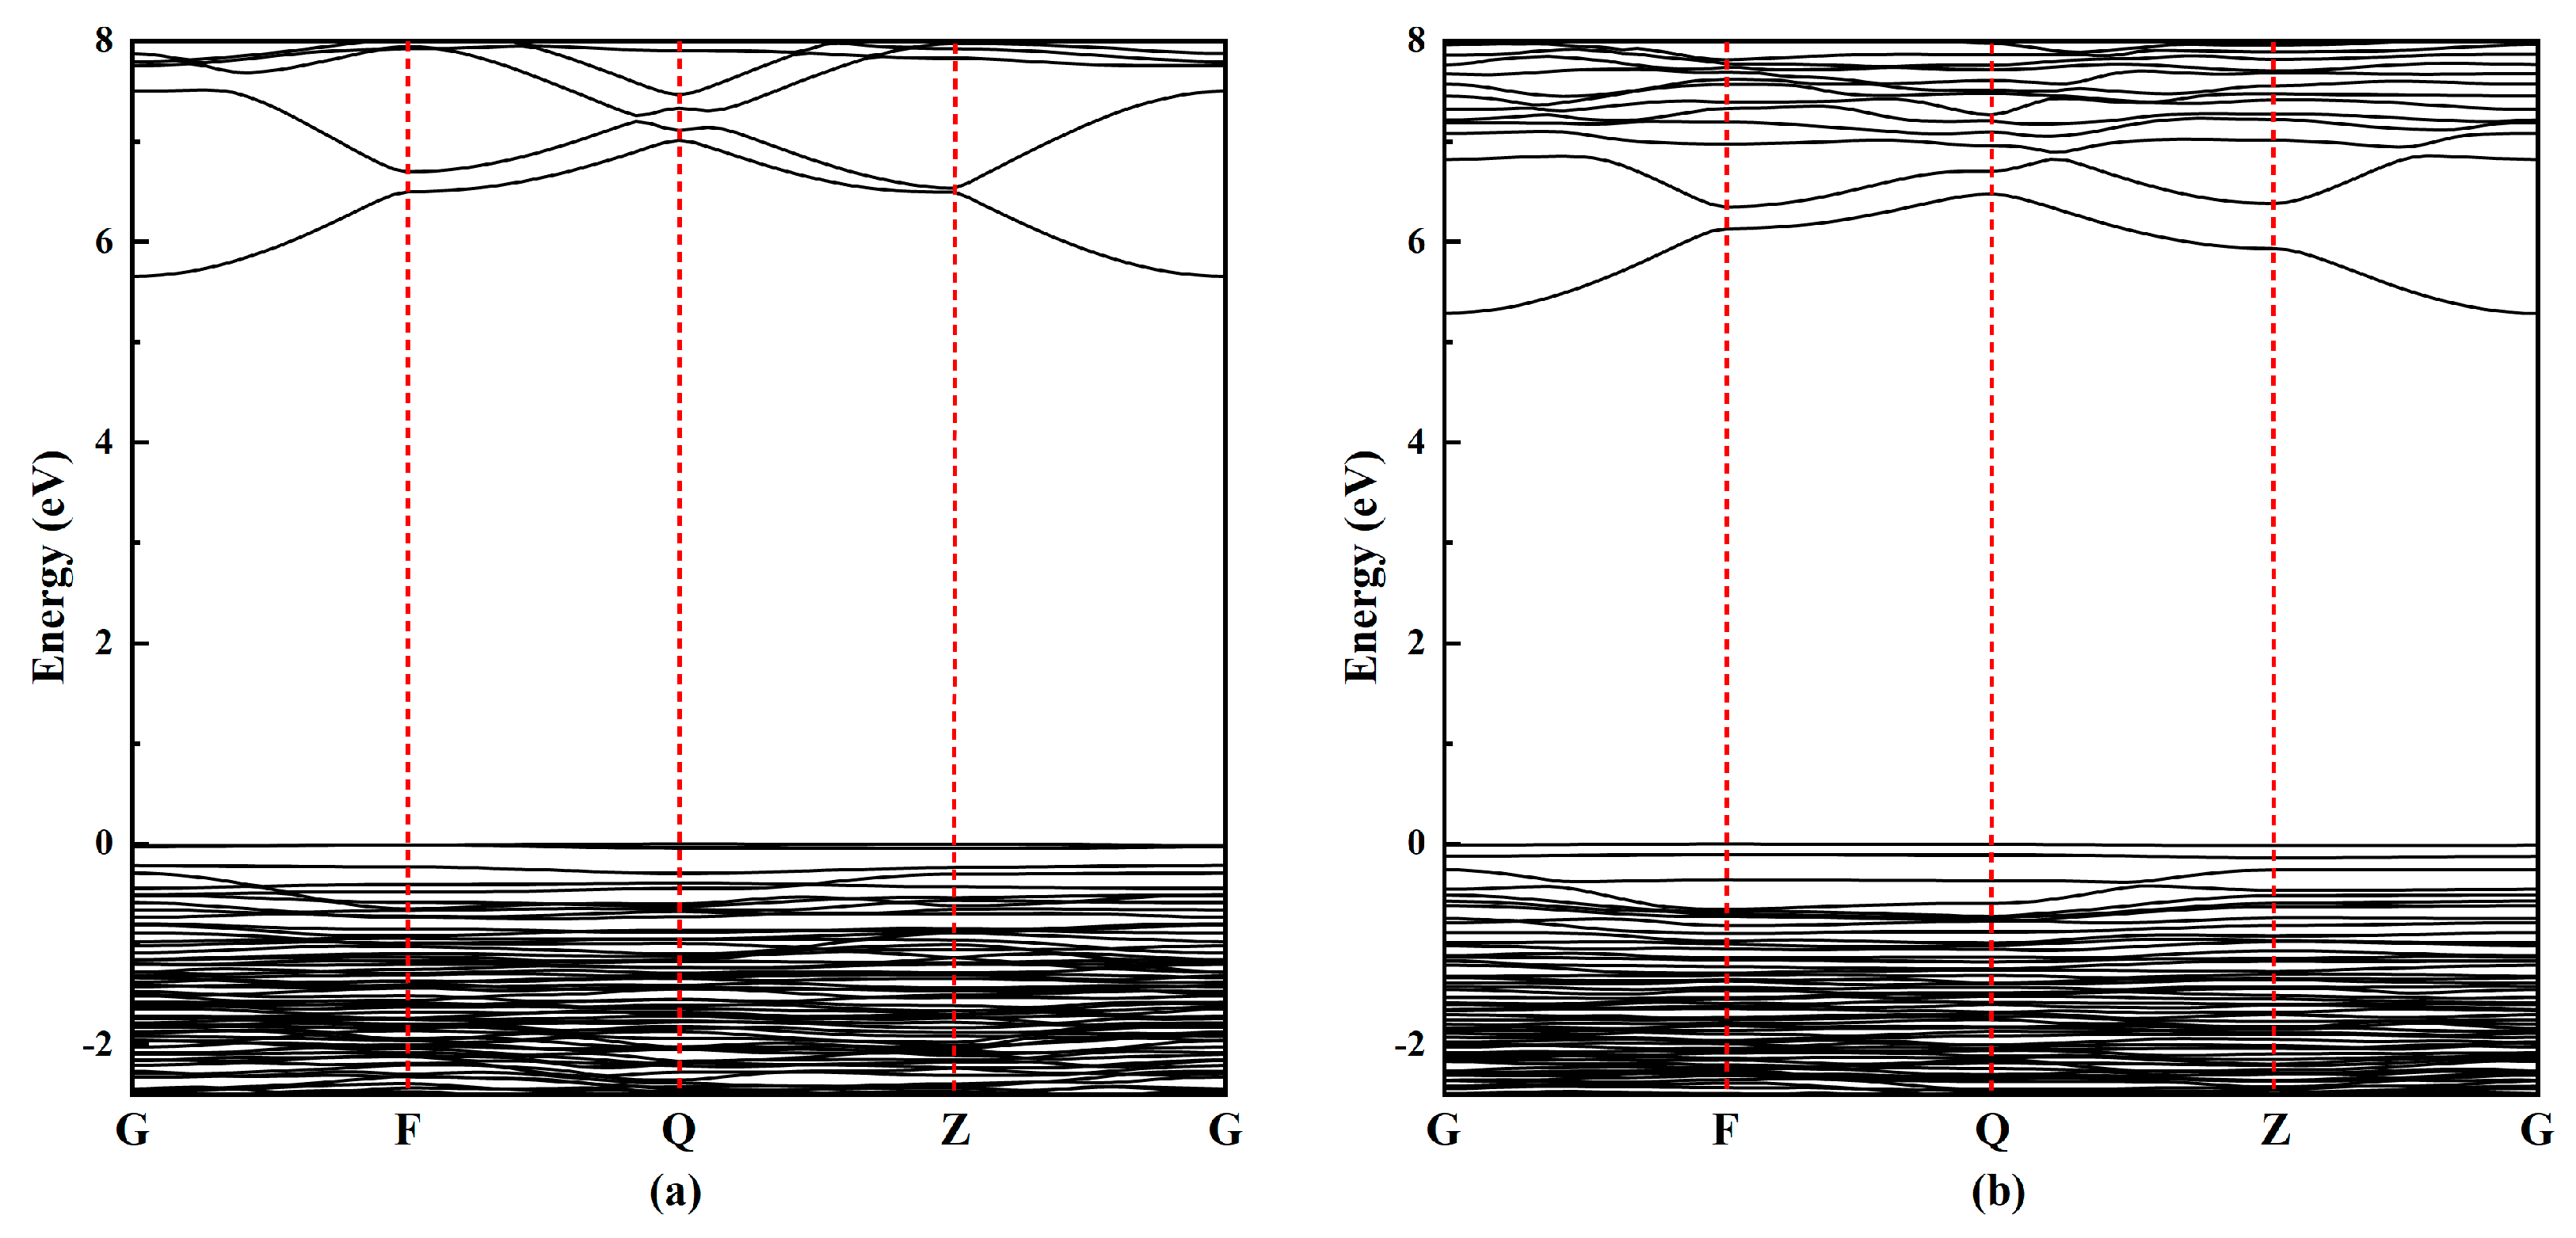
The electrical conductivity of materials is related to the width of the forbidden band, which is the lowest energy required for electrons to transition from valence band to conduction band. The band structure of montmorillonite was analyzed to study conductivity. The band structures of Na-MMT and Mg-MMT along high-symmetry lines of the Brillouin zone (BZ) were plotted in
Figure 2a,b. The high symmetry points were G (0,0,0), F (0,0.5,0), Q (0,0.5,0.5) and Z (0,0,0.5), respectively. The Fermi energy level was set at zero. The top of valence band of Na-MMT is at Q, and the bottom of the conduction band is at G. The top of the valence band of Mg-MMT is at F, and the bottom of the conduction band is at G. The result showed they all had indirect band gap. The band gap widths of Na-MMT and Mg-MMT were 4.79 eV and 4.51 eV, respectively, and the band gap width of Na-MMT was significantly larger than Mg-MMT, as shown in
Figure 2. The results indicated that the electrons of Na-MMT were more difficult to transition from the valence band to the conduction band than the electrons of Mg-MMT.
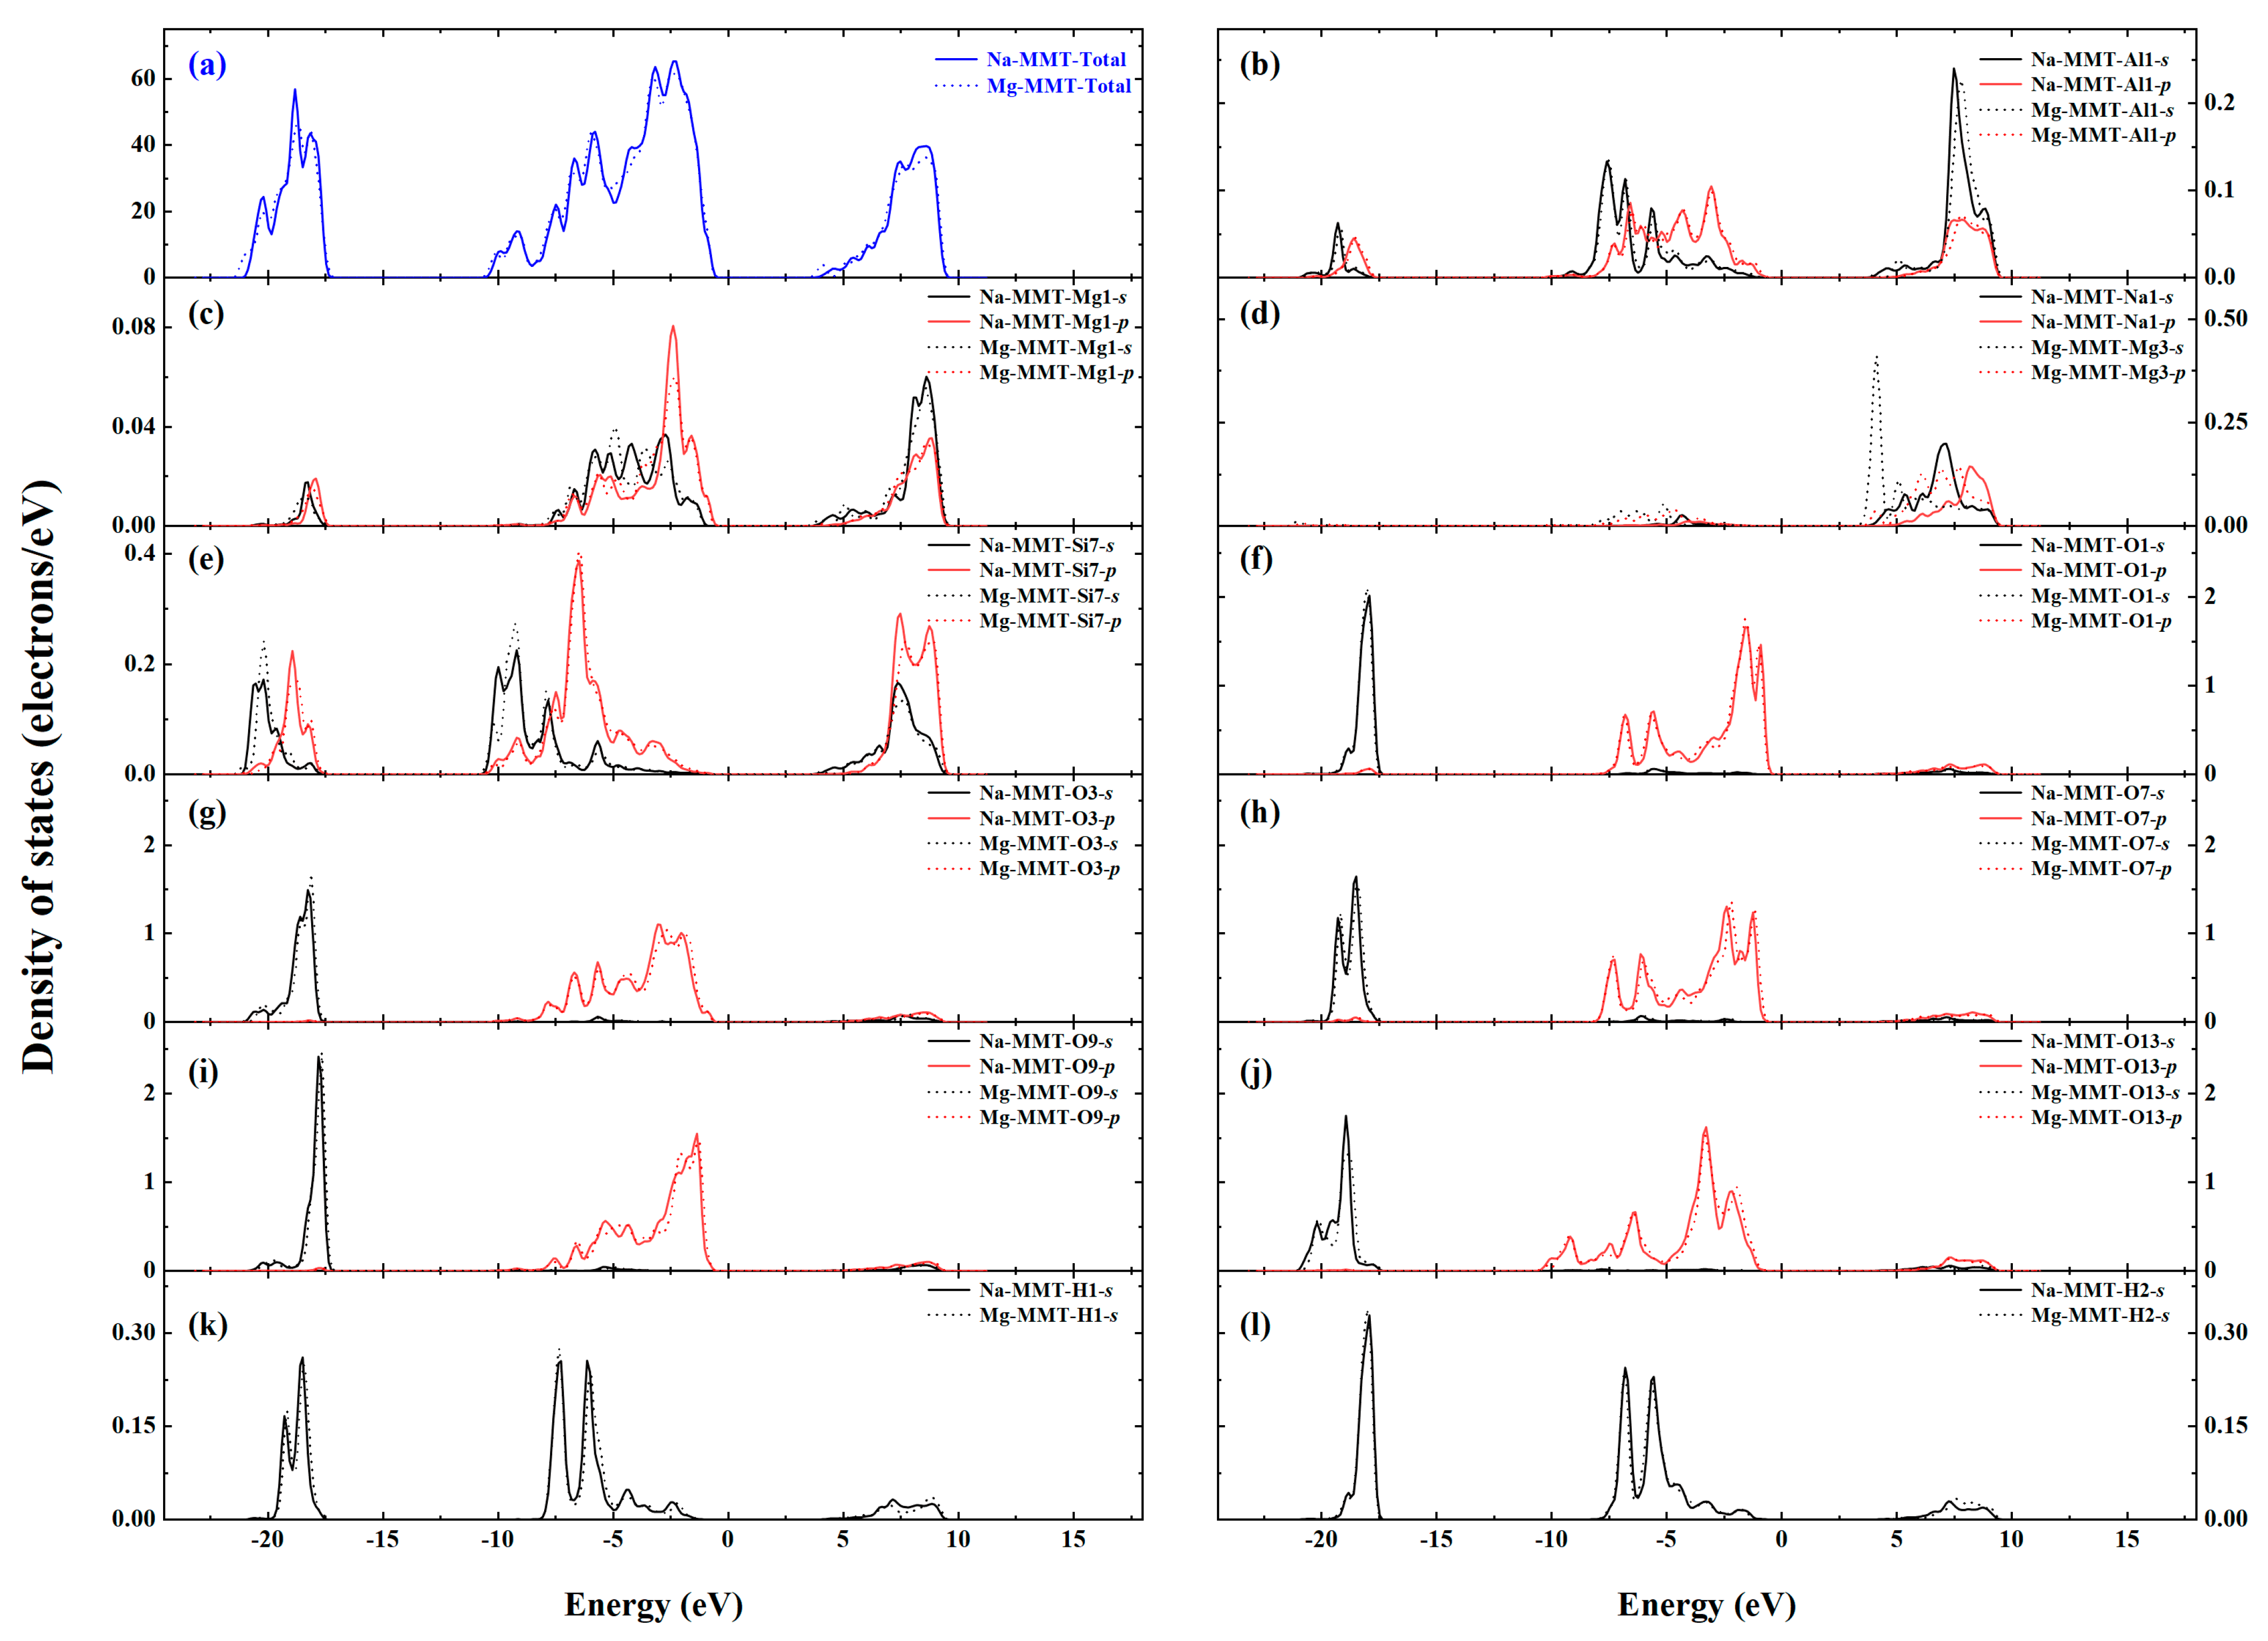
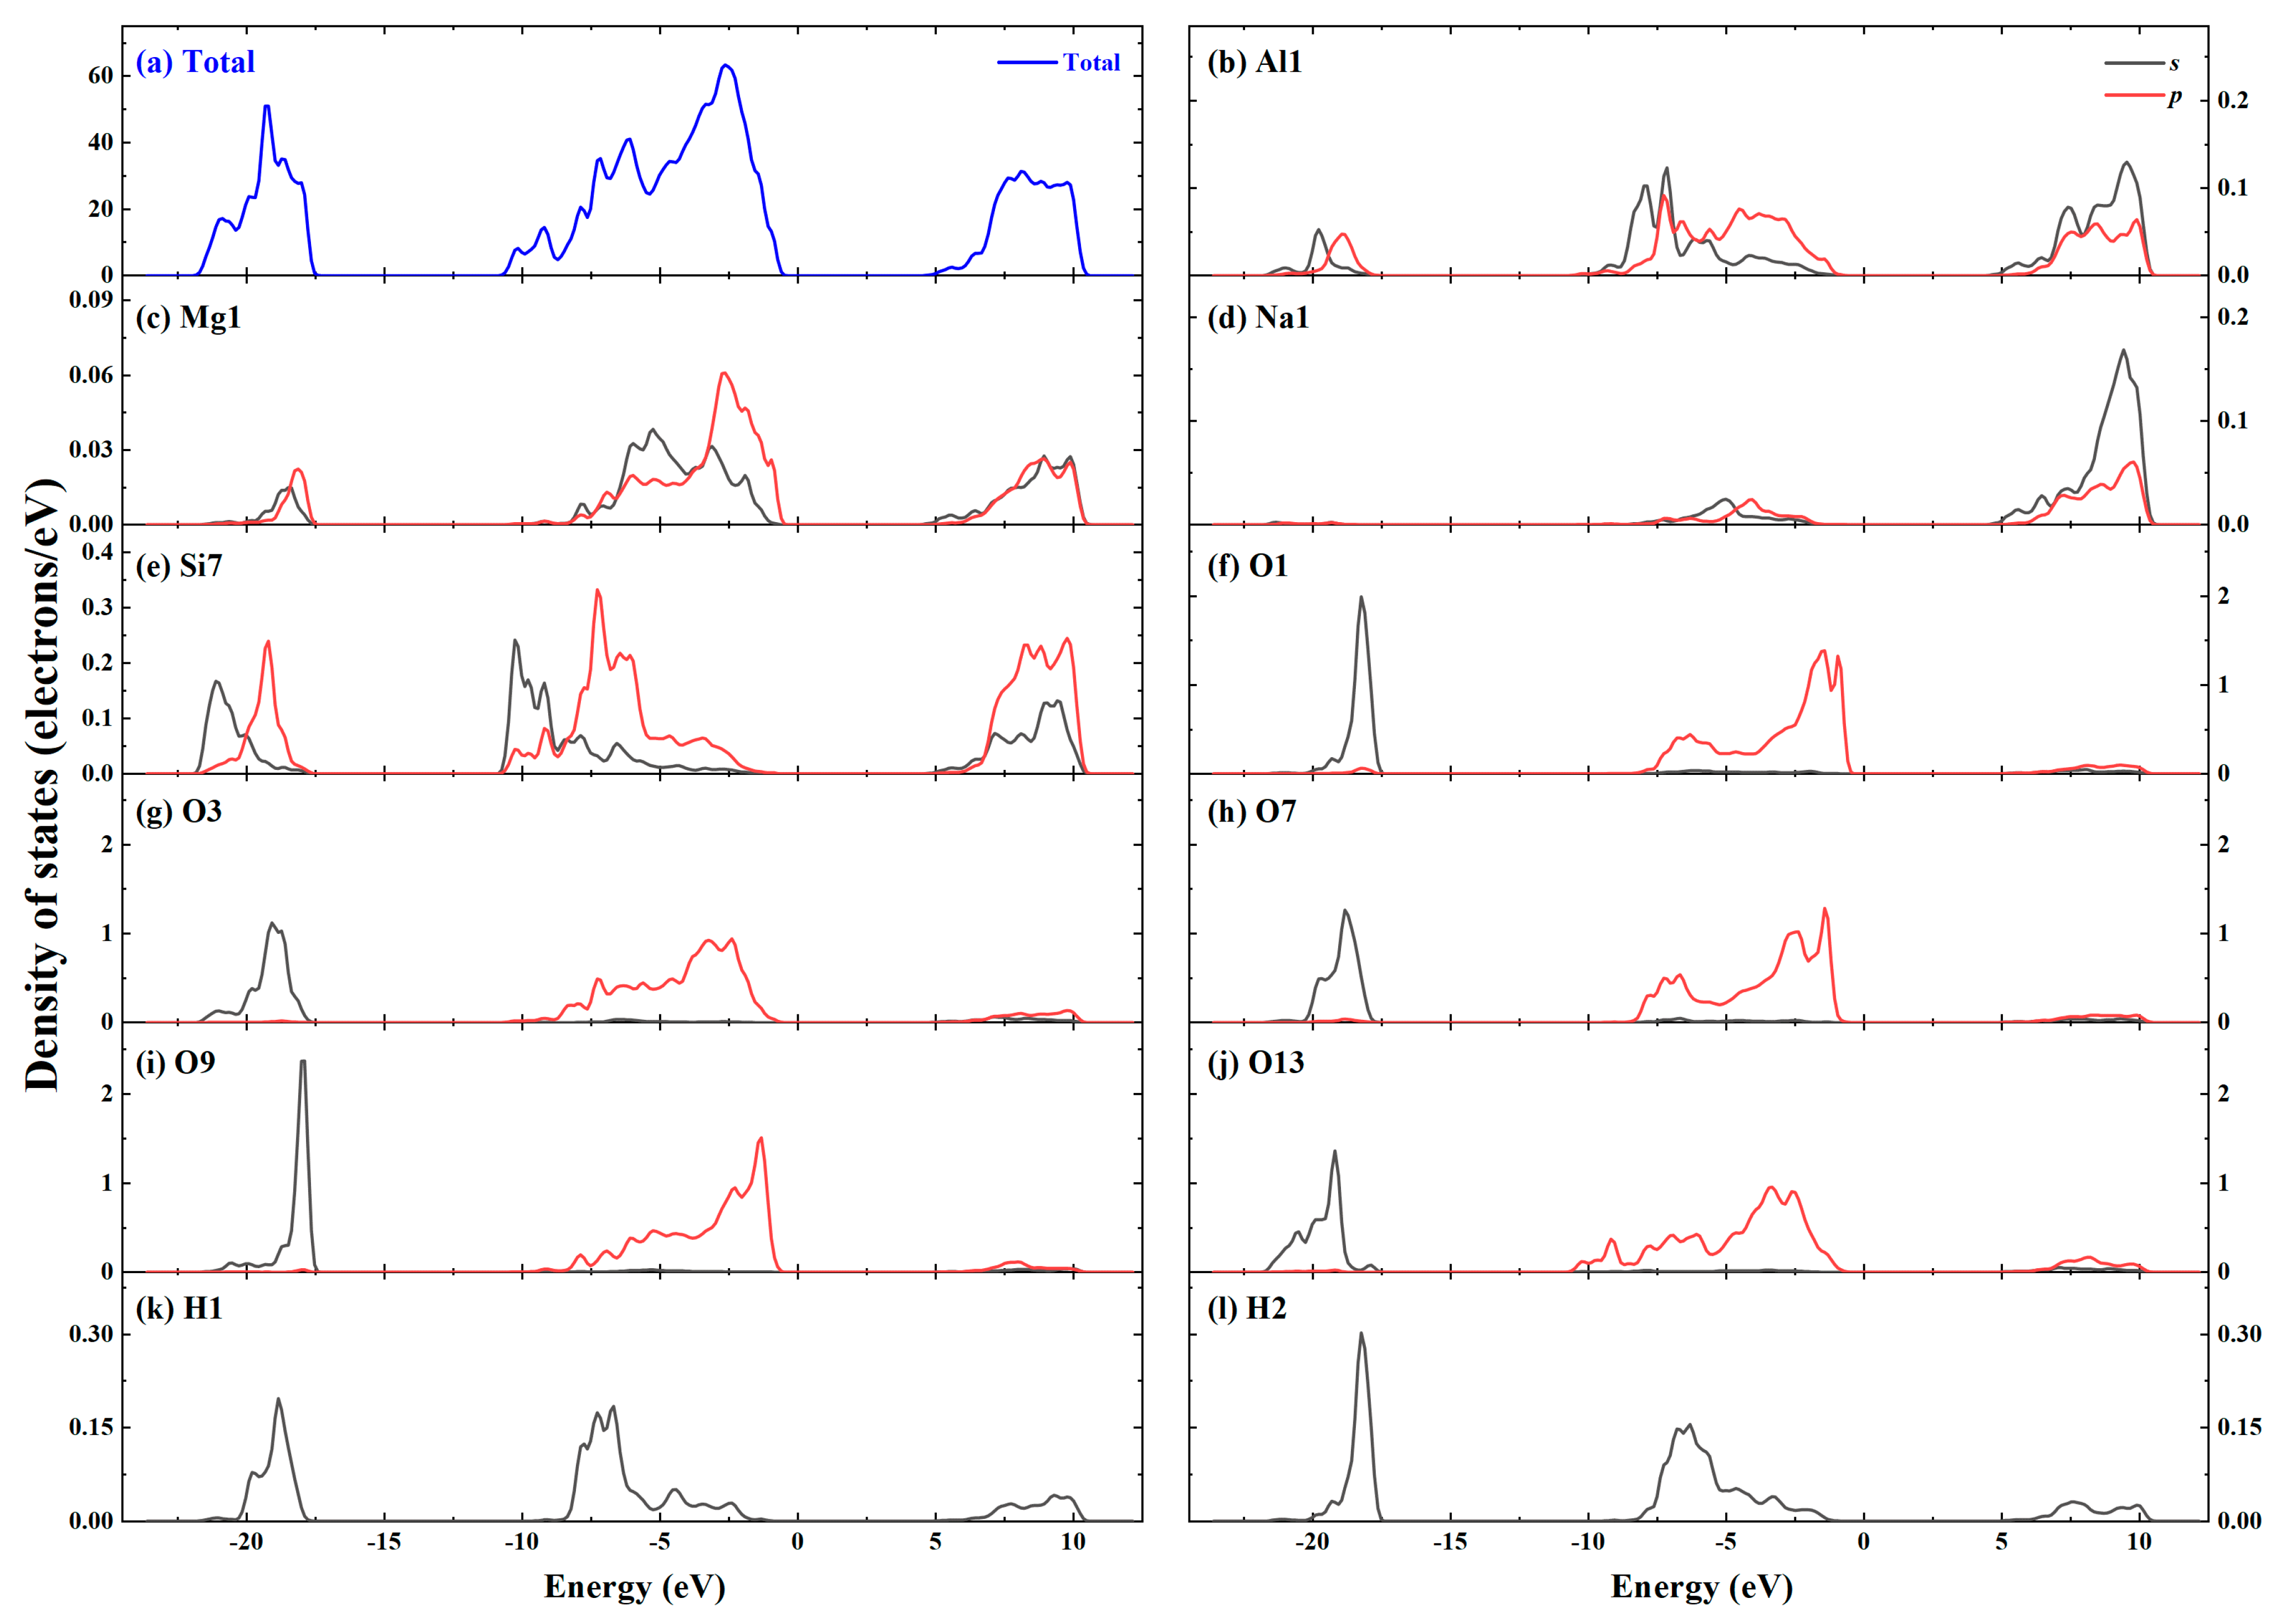
The density of states is the number of electronic states per unit energy near a certain energy, which can reflect the occupation of electrons in each orbital and serve as a visual result of the band structure. The total density of states (TDOS) and projected density of states (PDOS) of Na-MMT and Mg-MMT were depicted in
Figure 3. Five different types of oxygen atoms were drawn in a density of states diagram. The results showed that the PDOS curves of the five oxygen atoms were similar, which due to the high ionicity of oxygen atoms, leading to charge transfer from the Al 3
p, the Si 3
p and Mg 3
s states to O 2
p states. The analysis of the projected density of states (PDOS) revealed that the valence band of Na-MMT and Mg-MMT was mainly comprised of oxygen
p states in the wide energy range of −10 eV to 0 eV. In addition to the contribution of the
p states of oxygen to the valence band, there was also a small part of the contribution of the
s and
p states of Al, Si and Mg. By comparing the density of states of Na-MMT and Mg-MMT, it can be found that the type of interlayer cations has little effect on the density of states.
To understand further the charge distribution among the different atoms in Na-MMT and Mg-MMT, the orbital distribution of montmorillonite at high-symmetry BZ points G, F, Q and Z were studied, as shown in
Table 3 and
Table 4, respectively. The results showed that the VBMs of Na-MMT at each high symmetry point was mainly composed of the 2
p states of O. The CBMs at the F and Q (denoted by F(c) and Q(c) in
Table 3) was mainly composed of the 2
s, 2
p states of O and the 3
s states of Al, Si, Na and Mg, while the G(c) and Z(c) were mainly composed of the 2
p states of O. It was found from
Table 4 that the VBMs and CBMs of each high symmetry point in Mg-MMT were mainly composed of the 2
p states of O. The sum of all the PDOS value for O and H for each high-symmetry points of Na-MMT is 4.38 eV and 0.05 eV by calculation, respectively. The electronic states from O represent 14% of the total electronic states at G(v), 16% of the states at G(c), 14% of the states at F(v), 5% of the states at F(c), 14% of the states at Q(v), 6% of the states at Q(c), 14% of the states at Z(v), and 16% of the states at Z(c). The sum of all the PDOS value for O and H for each high-symmetry points of Mg-MMT is 5.198 eV and 0.038 eV by calculation, respectively. The electronic states from O represent 11% of the total electronic states at G(v), 13% of the states at G(c), 11% of the states at F(v), 14% of the states at F(c), 12% of the states at Q(v), 14% of the states at Q(c), 12% of the states at Z(v), and 14% of the states at Z(c).
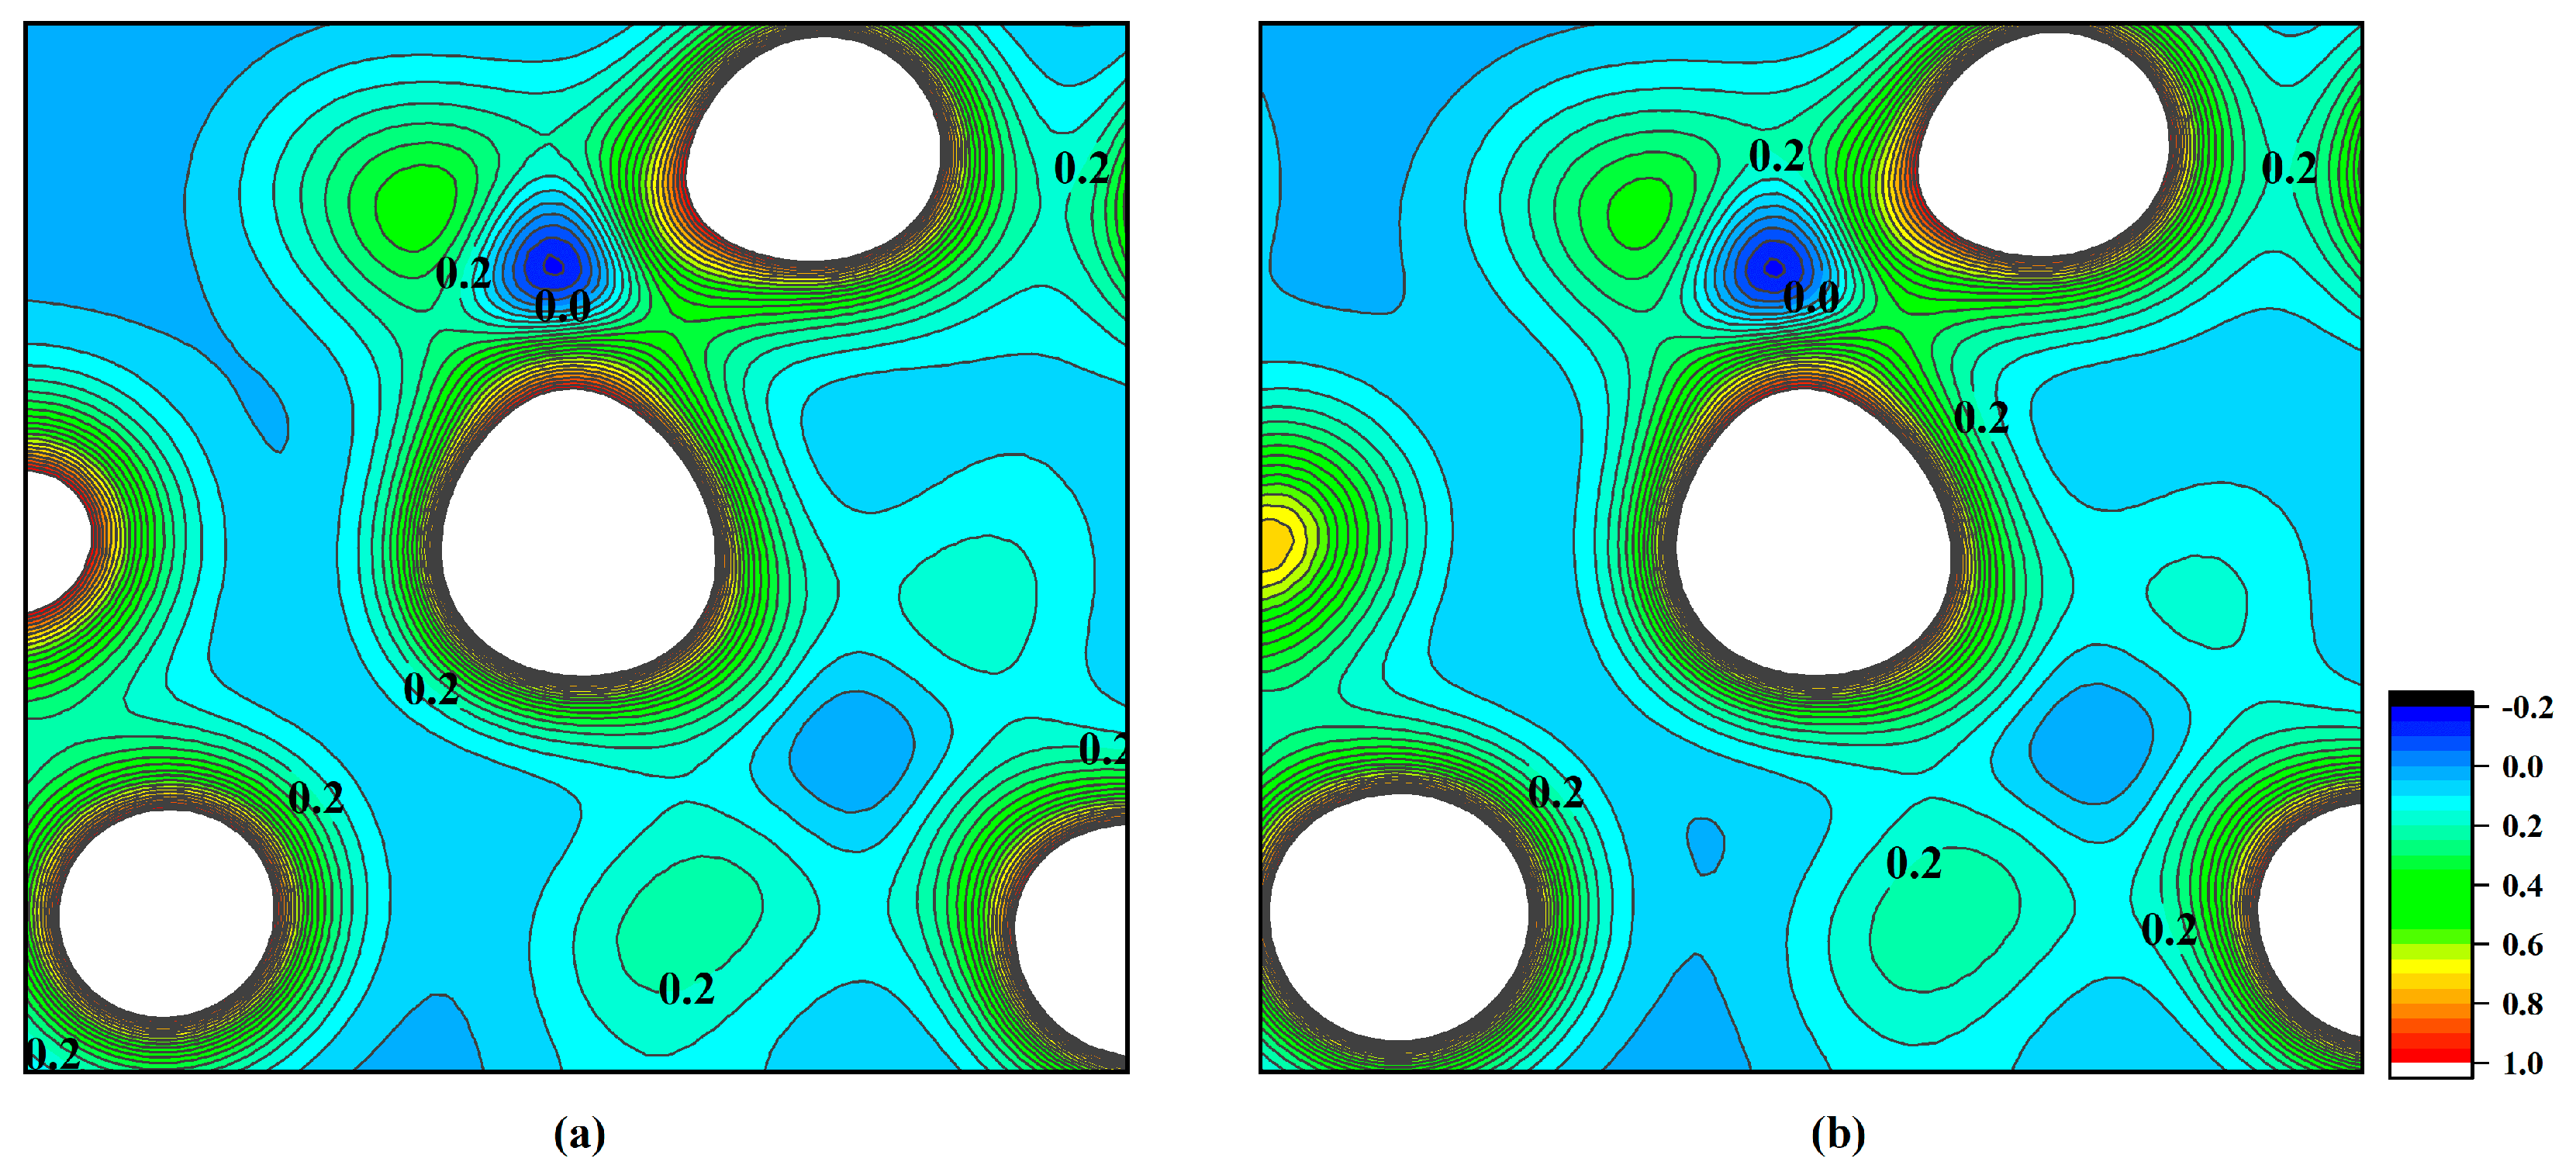
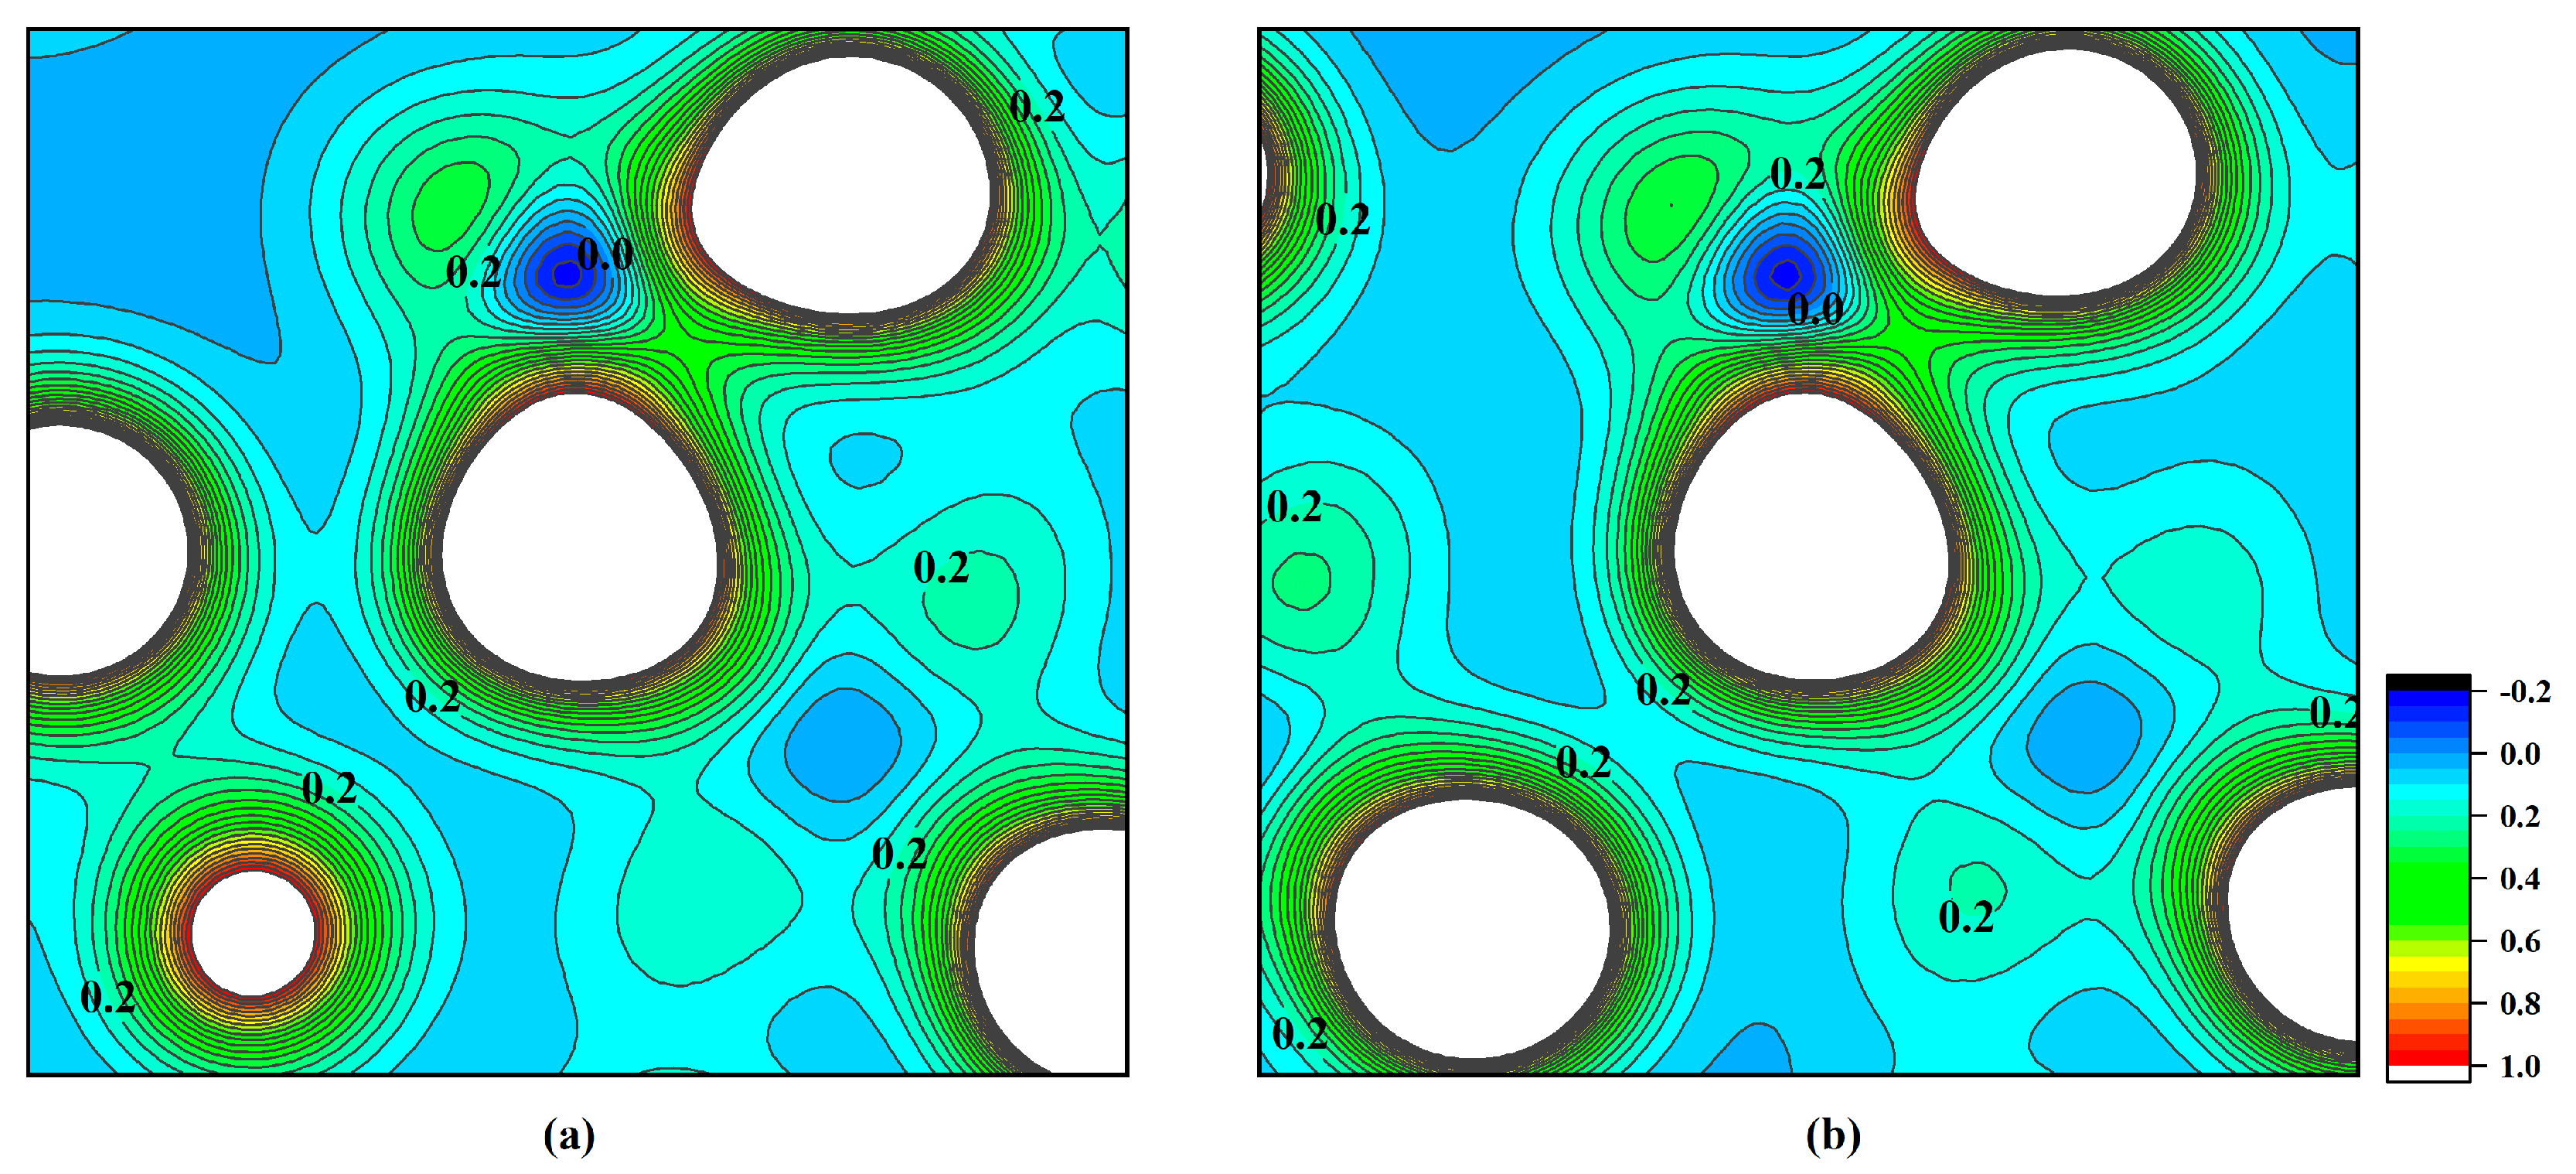
To understand the bonding properties and charge distribution of atoms in Na-MMT and Mg-MMT system more intuitively, the charge density diagrams of Na-MMT and Mg-MMT were drawn in
Figure 4a,b, respectively.
Figure 4 showed a charge density diagram of the montmorillonite crystal located at the Al6-O11-Si7 plane, and O11 was in the center of diagram. The results showed that the charge density around the O atom was large, which indicated that the oxygen atom had high electronegativity. The oxygen atom coincided with silicon atom and Al atom in part of the charge density, indicating that the Si-O bond and Al-O bond had weak covalent bond properties. The coincidence degree of charge density between Si-O bond was higher than that of Al-O bonds, indicating that the covalent bond property of Si-O bond was stronger than that of Al-O bond. The low charge density around Al atom indicated that there was a large amount of charge transfer between Al and O, which implied that the Al-O bond was mainly characterized by an ion bond. We further analyzed Bader charges of various atoms of Na-MMT and Mg-MMT, as shown in
Table 5. Mg atoms of interlayer and of octahedron were defined as Mg
O and Mg
I, respectively. Negative values meant the gained electrons and positive values meant the loss of electrons. It was clear that much charge transformed from Al, Si, Mg atoms to O atoms. Si atoms lost the most charge, indicating that Si-O had the strongest bonding effect.
The elastic constant
Cij is essential to characterize the elasticity of the material. Some basic mechanical properties of the material can be obtained, such as bulk modulus, Young’s modulus, Poisson’s ratio and shear modulus through elastic constants. Na-MMT and Mg-MMT belonged to triclinic system, which had 21 independent elastic stiffness constants. The derivation results at zero temperature and zero pressure were listed in
Table 6.
The elastic constants of Na-MMT were
C11 = 173.02 GPa,
C22 = 210.11 GPa and
C33 = 27.99 GPa. The elastic constant
C11 was less than
C22, which indicated the anti-deformation ability of
a-axis was weaker than that of
b-axis. The value of
C33 was smaller than
C22 and
C11, indicating that the crystal was most likely to deform along the
c-axis. Meanwhile, the elastic constants
C44 and
C55 were both less than
C66 in Na-MMT, which meant the shear deformation resistance of (001) plane was stronger than that of (100) and (010) planes. As shown in
Table 6, the elastic constants of Mg-MMT have the same regular to Na-MMT. These result indicated that the montmorillonite crystal was most prone to deformation along the
c-axis, the anti-deformation ability of the
a-axis was weaker than that of the
b-axis, and the shear deformation resistance of (001) plane was stronger than that of the (100) and (010) planes. The results confirmed that the van der Waals force and electrostatic force in the interlayer were much less than the binding force between the atoms in the layer. Comparing the elastic constants of Na-MMT and Mg-MMT, the conclusions were as follows: (1) the anti-deformation ability of
b-axis of Na-MMT was stronger than that of Mg-MMT, (2) the compression resistance of Na-MMT was much lower than that of Mg-MMT along
c-axis, (3) the shear deformation resistance of Na-MMT was smaller than that of Mg-MMT in (100) and (010) planes.
According to the elastic constants, the mechanical parameters were calculated, as listed in
Table 7, which are consistent with the experiment values [
21]. The value of
B,
Y and
G of Na-MMT were 39.85 GPa, 55.27 GPa and 21.78 GPa, respectively, while the
B,
Y and
G of Mg-MMT were 58.14 GPa, 77.09 GPa and 30.71 GPa, respectively. By comparison, the results showed that the compression resistance, shear resistance and stiffness of Mg-MMT were greater than those of Na-MMT. Pugh’ modulus (
G/
B) is used to represent the ductile–brittle property of material. When
G/
B < 0.57, the material shows good ductility [
42]. The G/B values of Na-MMT and Mg-MMT were 0.547 and 0.518, respectively, indicating that montmorillonite had good ductility. Vicker’s hardness is a standard of material hardness, which can be estimated by empirical formula of
Hv = 2(k
2G)
0.583 − 3, where k is the value of
G/
B. The values of
Hv were 2.96 GPa and 3.76 GPa for Na-MMT and Mg-MMT, respectively, which indicated the hardness of Mg-MMT was larger than that of Na-MMT. The calculated values of
μ were 0.269 and 0.275 for Na-MMT and Mg-MMT, respectively. The acoustic compression wave velocity (
Vp) and shear wave velocity (
Vs) were also calculated, which were critical for analysis of seismic exploration data and interpretation of acoustic scattering measurements [
43]. These above calculated data were in good agreement with the previous experimental data [
21].
3.2. Effects of Pressure on Atomic Structure and Mechanical Properties of Na-MMT and Mg-MMT
To avoid Pulay stress problems, the geometric optimization of each pressure state is performed at a fixed volume rather than at a constant pressure. In the present paper, the total energy (E) of Na-MMT at a serial of volumes as V0 (V0 is the equilibrium volume at ideal condition), 0.99V0, 0.98V0, 0.97V0, 0.96V0, 0.95V0, 0.94V0, 0.93V0, 0.925V0, 0.92V0. The total energy (E) of Mg-MMT at a serial of volumes as V0, 0.99V0, 0.98V0, 0.97V0, 0.96V0, 0.95V0, 0.94V0, 0.935V0,0.93V0, 0.925V0. Then, the P-V relation was deduced by the formula P = −∆E/∆V.
The bond lengths of Na-MMT and Mg-MMT under pressure were listed in
Table 8 and
Table 9, respectively. It can be seen that the overall trend of Si-O, Al-O, Mg-O bond length decreased with the increase of pressure, while the H-O bond length increased slightly with the increase of pressure, which was due to the influence of adjacent O atoms on hydroxyl groups under pressure. The O
d-Al bond length of Na-MMT fluctuated from 15.81 GPa to 19.92 GPa. The Al-O and Mg-O bond length of Mg-MMT has a sudden change under 8.60 GPa. Furthermore, the layer distance of Na-MMT and Mg-MMT under pressure was shown in
Table 10. We defined
d1 and
d3 as layer thickness of silicon oxygen octahedron sheet, as shown in
Figure 1. The
d2 represent the interlayer thickness and
d4 represent aluminum (magnesium) oxide octahedral sheet. It can be seen that the interlayer thickness of Na-MMT and Mg-MMT decreased rapidly with the increase of pressure. The values of
d1,
d3 and
d4 showed an overall downward trend under pressure, but the change was not obvious. The results indicated that the shrinkage of the volume of montmorillonite under pressure was mainly caused by the compression of the interlayer spacing.
To explore the effect of pressure on the band structure and charge density of montmorillonite, the band structure diagram and charge density diagram of Na-MMT at 19.2 GPa and Mg-MMT at 20.34 GPa were drawn, as shown in
Figure 5 and
Figure 6. The valence band top and conduction band bottom of Na-MMT were still at Q point and G point, and the band gap width was 5.65 eV. The valence band top and conduction band bottom of Mg-MMT were still at F point and G point, and the band gap width was 5.29 eV. These results showed that the montmorillonite still had an indirect band gap under the pressure of about 20 GPa. The band gap width was broadened gradually, which made it more difficult for the electron to transition from the valence band to the conduction band. The same Al6-O11-Si7 plane was also selected as the charge density diagram of montmorillonite under zero pressure. As shown in
Figure 6, the bonding characteristics between Si-O and Mg-O at about 20 GPa were the same as those at 0 GPa, and the charge density between Si-O and Al-O had changed a little compared with that under 0 GPa. The total density of states (TDOS) and partial densities of states (PDOS) of Na-MMT at 19.92 GPa were drawn to explore the effect of pressure, as shown in
Figure 7. The results showed the height of
sp orbitals decreased with increasing the pressure. The results also indicated the
sp orbitals of atoms shifted slightly down in the range below 0 eV and the
sp orbitals of atoms shift up slightly in the energy range of 5 eV to 10 eV under the action of pressure. These above calculated results implied that the effect of pressure on density of states of montmorillonite was weak in the range of 0 <
P < 20 GPa.
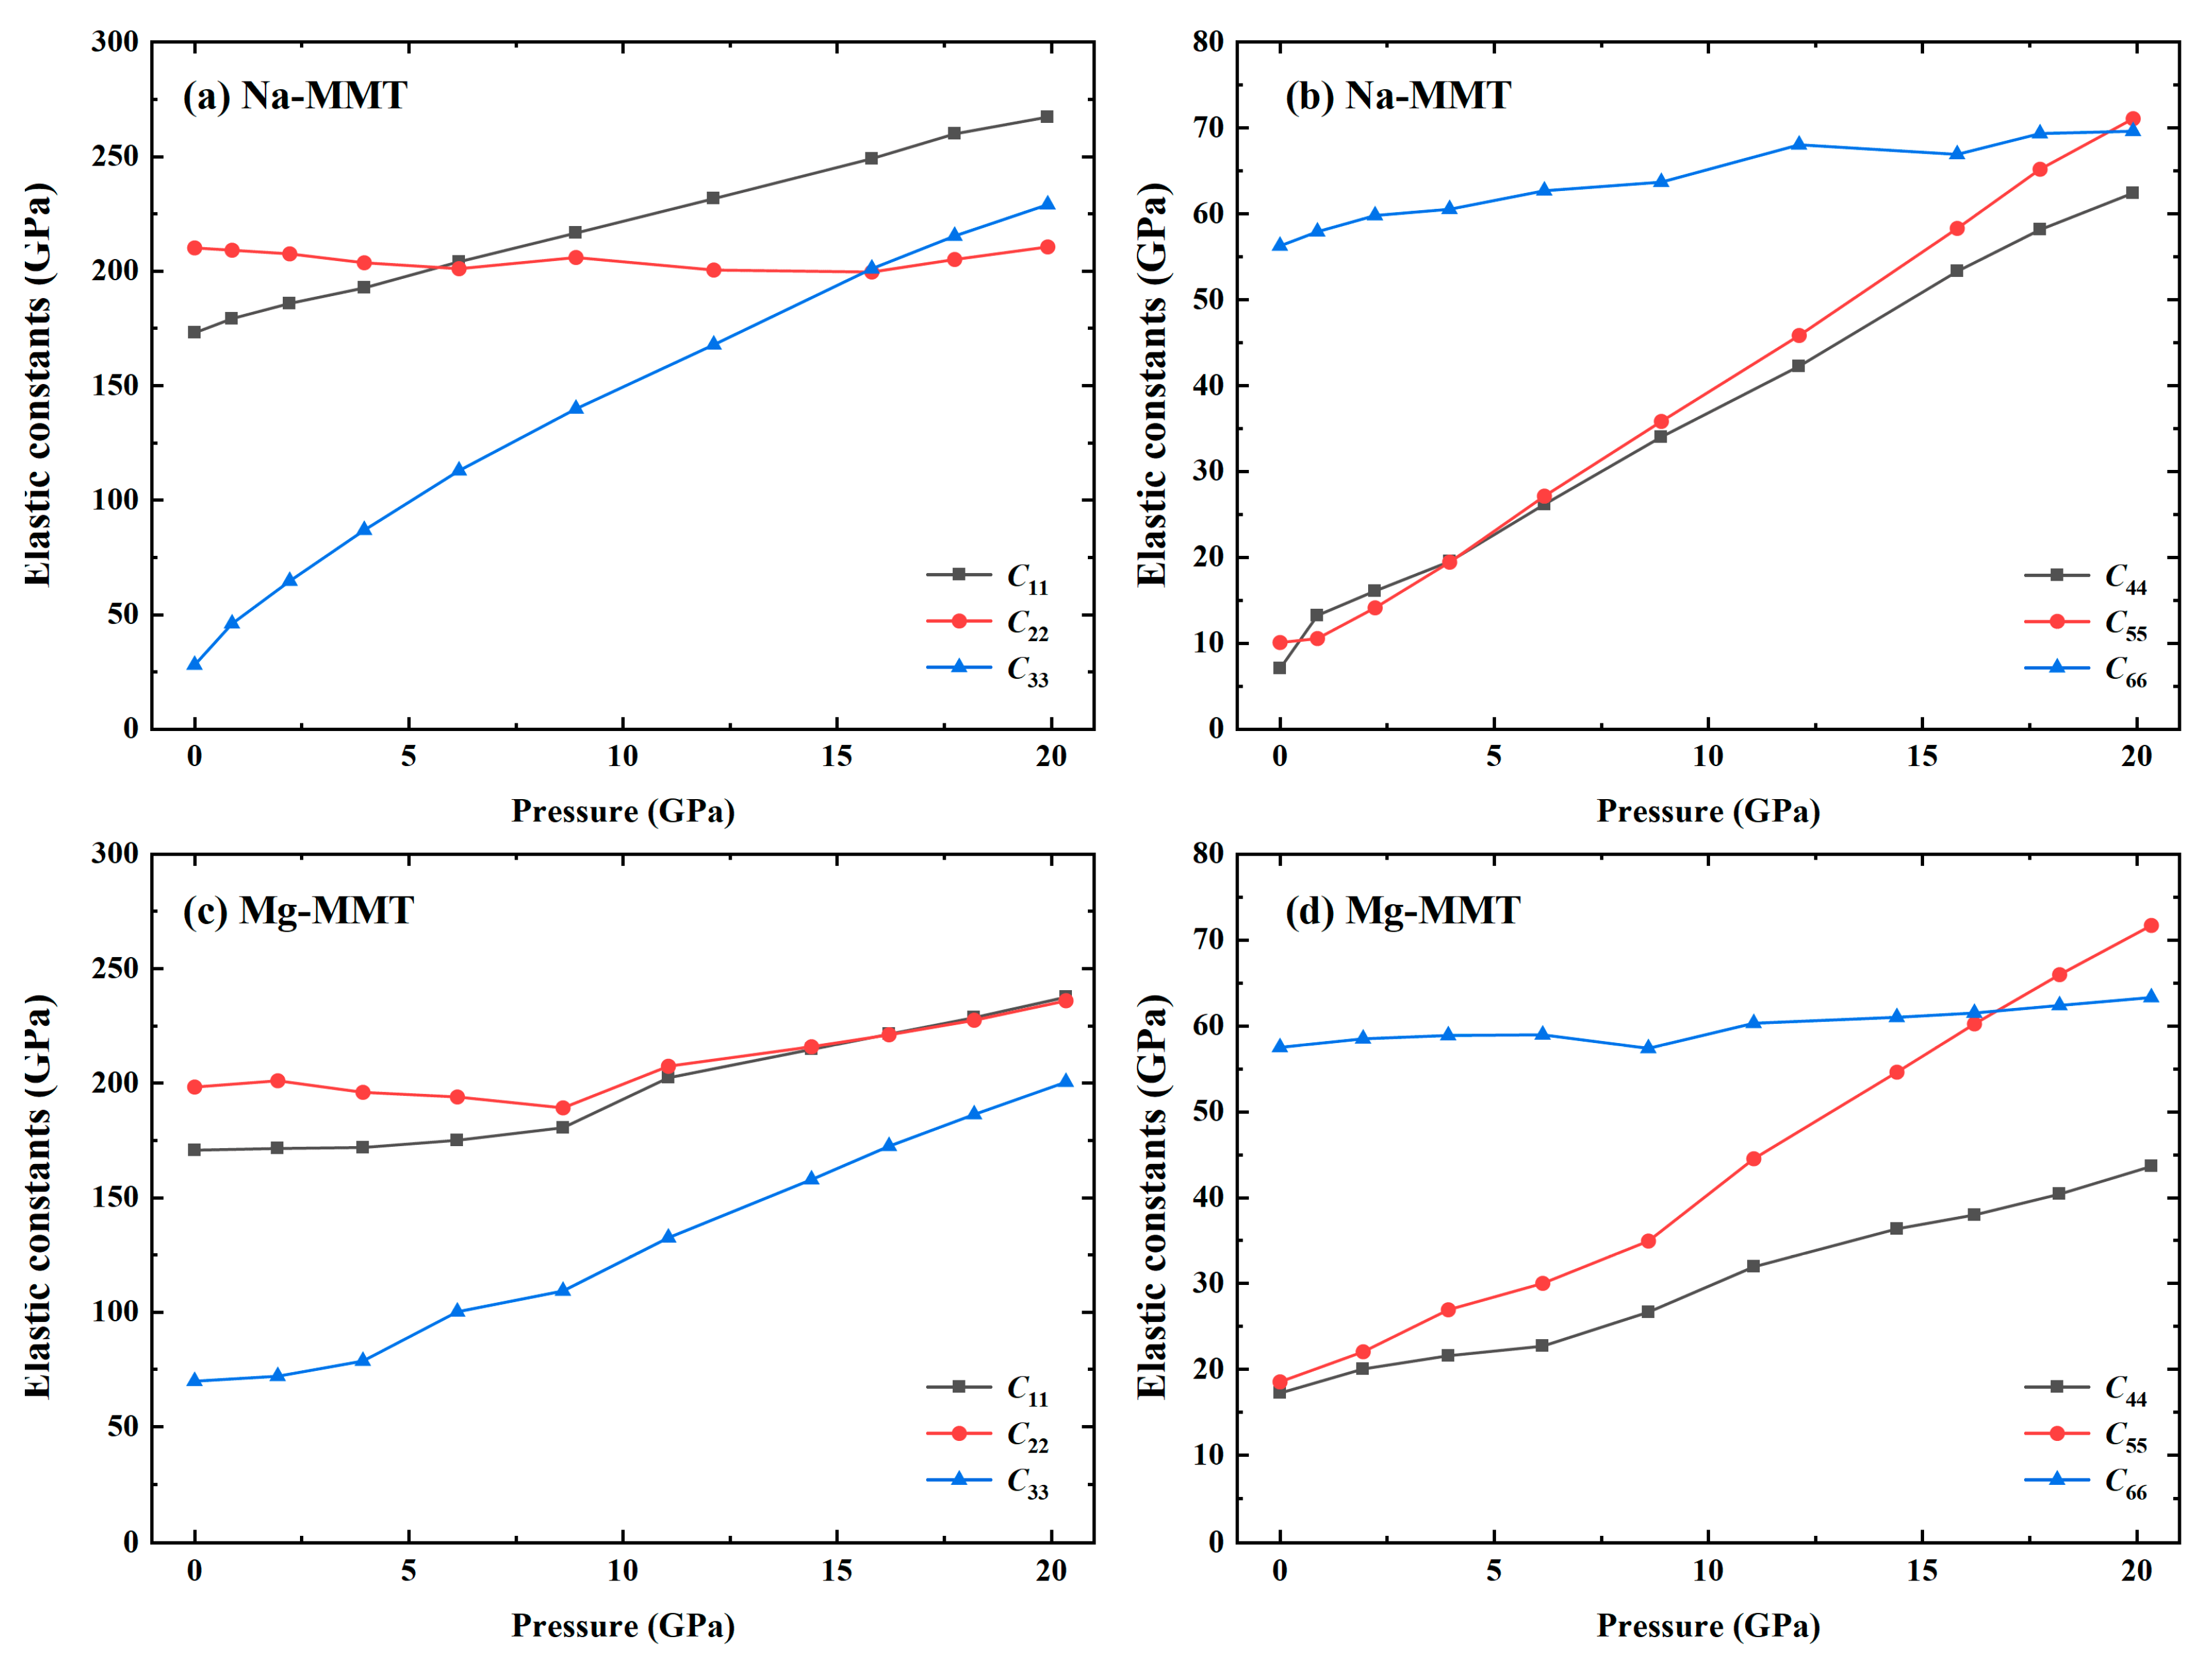
The above microscopic results of mechanical property of montmorillonite under high pressure are of great significance in the related applications fields. The elastic constants of Na-MMT and Mg-MMT under given pressure were listed in
Table 11 and
Table 12, respectively. In order to see the change rule of elastic constant of montmorillonite in the process of pressurization more intuitively, we also drew
Figure 8. The value of
C11 and
C33 of Na-MMT gradually increased with the increase of pressure, while
C22 had little change, as shown in
Figure 8a. When the pressure reached 15.81 GPa, the value of
C33 was greater than that of
C22, which indicated that the Na-MMT crystal was easier to deform along the b-axis under the action of external force. As shown in
Figure 8b, the
C55 and
C66 of Na-MMT increased rapidly compared with
C44 under pressure, which indicated that the shear resistance of (010) and (001) planes of Na-MMT increased rapidly under pressure. The results showed that the overall trend of
C11 and
C22 of Mg-MMT increased with increasing the pressure, and
C33 increased rapidly with the increase of pressure in
Figure 8c.
Figure 8d showed that
C44 increases slowly with increasing the pressure. When the applied external pressure increased to about 16.8 GPa, the value of
C55 was greater than that of
C44, indicating that the shear resistance of (010) surface is stronger than that of (100) surface.
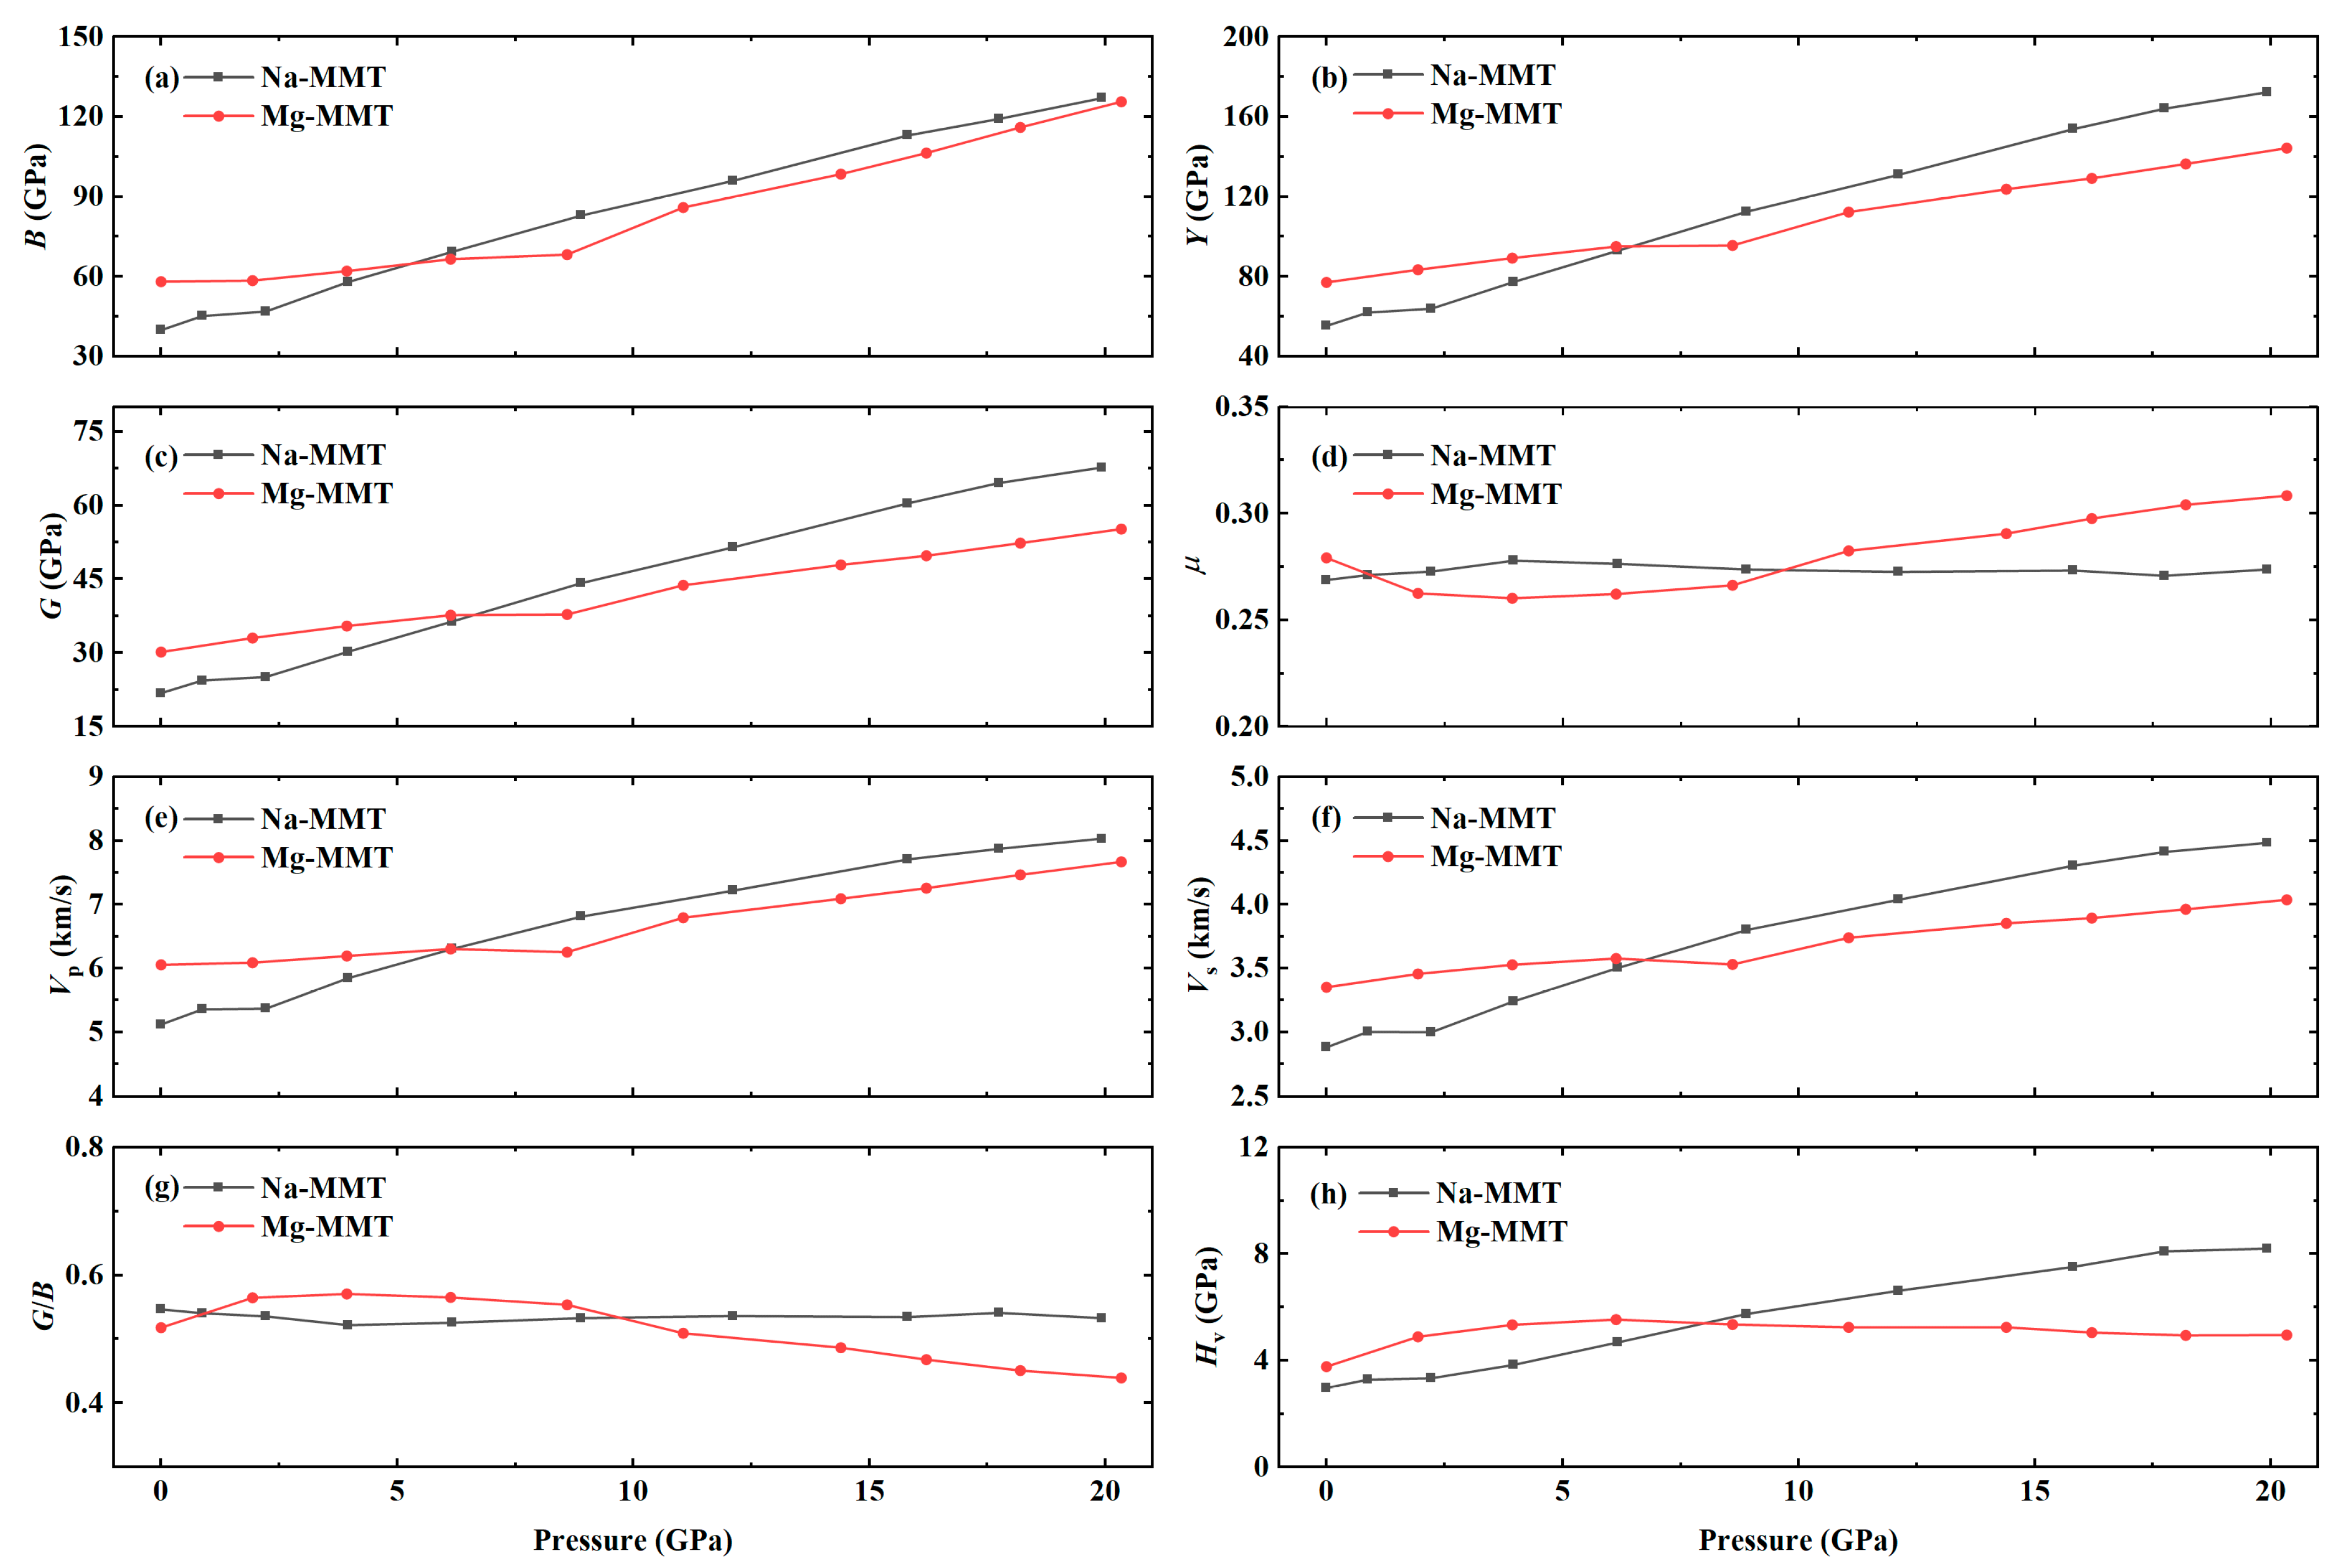
The mechanical parameters of montmorillonite under various pressures were obtained by calculating the elastic constants, and values were listed in
Table 13 and
Table 14, were plotted in
Figure 9. It can be seen that
B,
Y,
G,
Vp,
Vs of Na-MMT and Mg-MMT increased gradually with increasing the pressure, and these parameters of Na-MMT increased faster than that of Mg-MMT. The Poisson’s ratio of Mg-MMT increased with increasing the pressure while the Poisson’s ratio of Na-MMT changed little and tended to be flat. Meanwhile, the
G/
B of Mg-MMT tended to decrease with the increase of pressure, but the
G/
B of Na-MMT had a small change range. The Vicker’s hardness of Mg-MMT increased obviously with the increase of pressure in the range of 0–6.13 GPa. Then, the Vicker’s hardness decreased slowly with increasing the pressure in the range of 6.13 GPa to 20.34 GPa, and the change of curve was very gentle. However, the Vicker’s hardness of Na-MMT increased gradually with the increase of pressure and different from the values of Mg-MMT.


