Article

Strength and Ultrasonic Characteristics of Cemented Paste Backfill Incorporating Foaming Agent

1
College of Resources and Civil Engineering, Northeastern University, Shenyang 110819, China
2
Science and Technology Innovation Center of Smart Water and Resource Environment, Northeastern University, Shenyang 110819, China
3
Changsha Mine Research Institute Co., Ltd., Changsha 410013, China
4
Shenyang Ecological Environment Eonitoring Center of Liaoning Province, Shenyang 110819, China
*
Author to whom correspondence should be addressed.
Minerals 2021, 11(7), 681; https://doi.org/10.3390/min11070681
Submission received: 13 May 2021 / Revised: 23 June 2021 / Accepted: 23 June 2021 / Published: 25 June 2021
(This article belongs to the Section Environmental Mineralogy and Biogeochemistry)

Abstract

:
This work is a systematic study of the strength and ultrasonic properties of cemented paste backfill incorporating a foaming agent, known as foam-cemented paste backfill (FCPB). Based on determining the optimal admixture contents (foaming stabilizer, thickening agent, and foaming agent), a series of uniaxial compressive strength (UCS) tests were conducted to determine the relationship between the UCS of FCPB and four influencing factors, i.e., cement–tailings ratio (CTR), solid content (SC), curing time (T), and foaming agent content (FC). To analyze the sensitivity of UCS to these four factors, grey relational analysis (GRA) was introduced. Moreover, UCS results were correlated with the corresponding ultrasonic pulse velocity (UPV) parameters. The results indicate that the optimal contents of foaming stabilizer, thickening agent and foaming agent are 0.5%, 0.6%, and 1–3%, respectively. The UCS of FCPB exponentially increases with CTR and SC, while it logarithmically and linearly increases with T and FC, respectively. CTR has the most significant influence, followed by T, SC, and FC. There exists an evidently linear relationship between UPV and UCS of FCPB regardless of CTR, SC, T and FC. These results contribute to understanding the properties of hardened FCPB and to sound designs in practice.

1. Introduction

Cemented paste backfill (CPB) is prepared by mixing tailings, binders (e.g., cement) and water [1,2,3]. Usually, the binder dosage accounts for 2–8 wt.% of solids, aiming to provide strength to the CPB through the hydration reaction [4,5,6]. Ordinary Portland cement (OPC) and solid wastes (e.g., fly ash and blast furnace slag) are often mixed as cementitious materials in mines to reduce backfill costs [7,8,9,10]. Water ensures that the fresh CPB obtains the desired consistency for transportation [11,12]. The advantages of the CPB technique include reducing the ore dilution rate, controlling ground subsidence and providing a safe working environment [13,14,15].
Importantly, backfill settlement and heterogeneous void distribution inside CPB mass usually occur because of water evacuation [16]. In addition to solid particle sedimentation, the artesian slope, irregular roof shape and atypical mining technology may lead to the problem of roof-contacted filling, i.e., a significant gap between hardened backfill and the stope roof [17]. In mining production, if roof-contacted problems are not considered, there may be considerable consequences such as frequent ground pressure activities, surrounding rock movement, spalling, or caving. In particular, in underground mines with multi-step mining, the construction of mining cutting engineering will be difficult, and the loss and dilution of ore will be considerable. Roof-contacted filling has become one of a series of safety issues in backfill mining. Thus, a novel type of backfill, known as foam-cemented paste backfill (FCPB), has been developed in recent years. Hassani and Hefni referred to this novel mine backfill as foam mine fill (FMF) [18]. Compared with CPB, FCPB has higher volume because of the bubble formation during the mixing process, and consequently the gap between FCPB and the stope roof can be decreased to some extent (Figure 1) [19]. Moreover, because FMF can replace hydraulic fill, a more significant amount of tailings can be used in backfill, reducing their impact on land resources. Therefore, pollution from the leaching of acidic tailings to land and rivers can be alleviated [18,20,21]. This technique has been practically used at the Jinchuan Nickel mine in China, confirming that FCPB is an effective and convenient method to solve the roof-contacted filling problem [22].
To date, many studies relating to FCPB have been reported, e.g., Hefni et al. [18,24] proposed the concept of foam mine fill (FMF) and stated that the solid content of fresh backfill has an important effect on the stability of an air bubble. Zhang et al. [16] systematically evaluated the effects of mineral additive type and dosage on the rheological and mechanical properties of FCPB. They reported that quicklime addition could increase the rheological parameters (yield stress and plastic viscosity) of fresh FCPB but would decrease the porosity of hardened FCPB, regardless of solid contents and mineral additive dosages. Qiu et al. [19] proposed an artificial intelligence model (random forest–grid search optimizer; RF–GSO) for predicting the uniaxial compressive strength (UCS) of FCPB and achieved good prediction accuracy, which improved the efficiency of obtaining the FCPB UCS parameters. Zhang et al. [25] observed that the strength and elastic modulus of FCPB cured at −10 °C increased with the increase in fineness of building stone waste. These studies have focused on the rheological and mechanical performances of FCPB; however, there is considerable room for improvement. For example, the effects of cement–tailings ratio (CTR), solid content (SC), and curing time (T) on CPB properties have been discussed and evaluated [26,27,28,29]. However, the evolution of FCPB properties [e.g., UCS and ultrasonic pulse velocity (UPV) characteristics] under the action of different chemical additives (such as foaming stabilizer and thickening agent) require additional study. For evaluating hardened FCPB, both UCS and UPV characteristics are important criteria. Generally, the UCS of FPCB at various curing times can be easily obtained via uniaxial compression tests in a laboratory. UPV characteristics can be obtained via a UPV test, which is an in situ and non-destructive method to verify the quality, internal stress distribution, and hardening process of FCPB [29,30,31,32]. To date, only a few studies have examined the properties of FCPB containing various chemical additives (such as foaming stabilizer or thickening agent) [33].
This study systematically examines the effect of CTR, SC, T, and foaming agent content (FC) on UCS and UPV characteristics of FCPB. After the optimal contents of foaming stabilizer, thickening agent, and foaming agent were determined, the UCS and UPV properties of FCPB with various components were tested under different curing times. The relationships between the UCS of FCPB and these four factors were comprehensively discussed and quantitatively expressed. Moreover, grey relational analysis (GRA) was introduced to examine the sensitivity of the UCS of FCPB to the various factors. Finally, correlation between the UCS and UPV of FCPB was discussed.

2. Materials and Methods

2.1. Raw Materials

The tailings used were sampled from an iron ore mine in Liaoning Province, China. As shown in Figure 2, the particle size distribution of the tailings was measured by Malvern Laser Mastersizer 2000. The proportion of tailings of <20 μm only reaches 15.3%, indicating that the sampled tailings are coarse [34]. X-ray fluorescence (XRF) results displayed in Table 1 show that the primary components in tailings are SiO2, Fe2O3, Al2O3, CaO, and MgO. According to Ref. [35], the basicity coefficient, quality factor, and activity coefficient of tailings are calculated as 0.13, 0.23, and 0.09, respectively. In this study, the binder used was ordinary Portland cement (type 32.5) following the Chinese Standard GB175-2007. Moreover, tap water was used to mix the solid particles of FCPB.
H2O2 was selected as the foaming agent. H2O2 decomposed under alkaline conditions and produced considerable amount of oxygen, which made the slurry expand. Moreover, the thickening agent and foam stabilizer were added to give the bubbles better properties in the fresh mixture. The primary components of the thickening agent were re-dispersible emulsion powder and polypropylene fiber; however, the primary component of the foaming stabilizer was calcium stearate [36].

2.2. FCPB Preparation

The optimal content of admixtures must be determined before preparing FCPB samples. Table 2 shows the specific experimental scheme. The selection of experimental index values is built on preliminary work, some of which can be seen in [16,19]. The fundamental criterion of the experimental design is to ensure that the slurry has good fluidity and does not segregate and bleed [37,38]. Furthermore, air bubbles should remain stable in the slurry. Groups A, B, and C are the experimental schemes for determining the optimal content of thickening agent, foaming stabilizer, and foaming agent, respectively. Note that the dosages of thickening agent and foaming stabilizer are its percentage of the total mass of solids; however, the foaming agent content is its percentage of the total mass of cement.
After the dosages of the required materials were weighed, the dry materials were evenly stirred first and then mixed with water. When a homogenized slurry was obtained, H2O2 was added and then quickly stirred to obtain fresh FCPB slurry. Note that when the foaming agent is added to the slurry, a lower mixing speed should be selected to avoid air bubble breakage [18]. Details of the FCPB mix proportions can be seen in Table 3. Fresh and hardened FCPB can be seen in Figure 3.

2.3. Experimental

2.3.1. Expansion Rate and Fluidity Tests

The prepared fresh FCPB slurry was immediately poured into a graduated cylinder, and its volume (V0) was recorded. After standing for 24 h, the volume of the fresh FCPB was measured as V; thus, the expansion rate (P) of the slurry can be obtained by Equation (1):
P = (VV0)/V0
A mini-slump cone was used for fluidity tests. The cone had a bottom diameter of 120 mm and the top diameter and height were 100 and 60 mm, respectively. After the fresh FCPB slurry was poured into the mold, the cone was raised vertically. The fluidity test was performed as per the ASTM C143 standard procedure [39]. The average diameter of the fresh FCPB in two perpendicular directions was considered as its fluidity value.

2.3.2. Apparent Density, UPV, and UCS Tests

The mixed fresh FCPB was poured into the cylindrical mold (50 mm × 100 mm), and then stored in a humidity chamber for curing for a predetermined time. Before apparent density measurements, the sample ends were polished and ground to obtain regular samples, which were then dried to a constant weight. The apparent density of FCPB was determined as per GB/T 50080 [40]. Apparent density ( ρ ) is expressed follows:
ρ = m v
where m and v refer to the weight and volume of the specimen, respectively.
Prior to the UPV tests, the end of the specimen must be polished and ground, and then covered with liquid Vaseline to ensure complete contact with transducers [29]. The UPV tests were performed using a commercial ultrasonic testing instrument (Proceq Pundit Lab) in accordance with ASTM C 597–16. The propagation time of ultrasound pulses (54 kHz) between the two probes was recorded [41]. After the UPV tests, UCS tests were conducted with a loading machine (Humboldt HM-5030) with a maximum loading capacity of 50 kN. The deformation rate selected in UCS tests was 1 mm/min [39]. Before conducting UCS tests, the end surfaces of the FCPB samples should be polished to ensure they are flat and parallel [39]. The average test results (apparent density, UPV or UCS) of three samples with the same mix proportion was considered as the final value of FCPB [42]. The individual strengths of three specimens with the same proportion should not deviate by >15% from the mean strength [35].

3. Results and Discussion

3.1. Determination of Admixture Contents

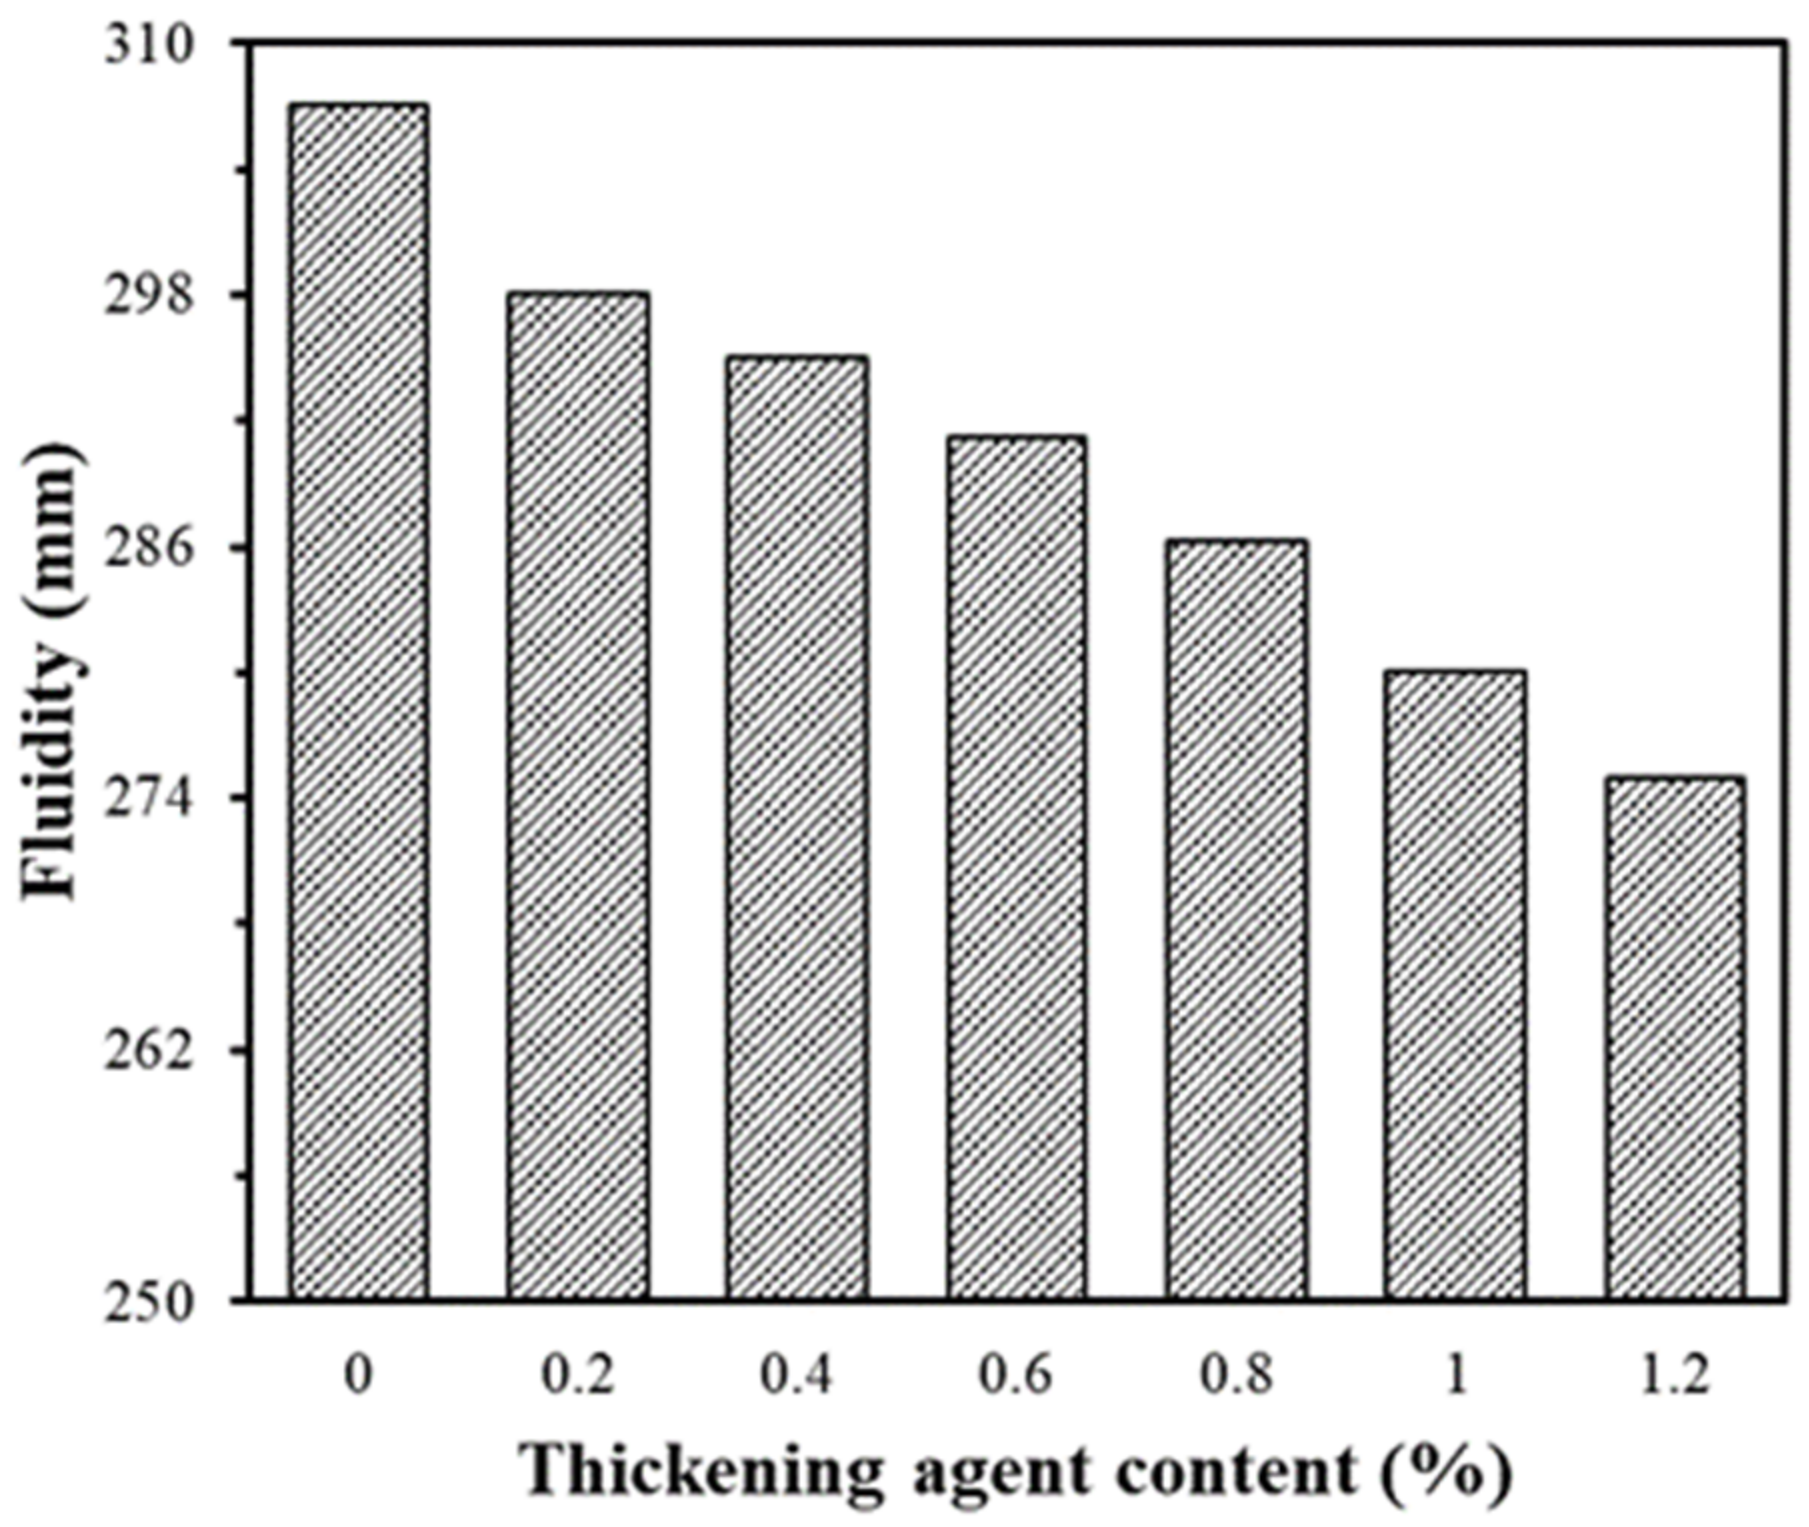
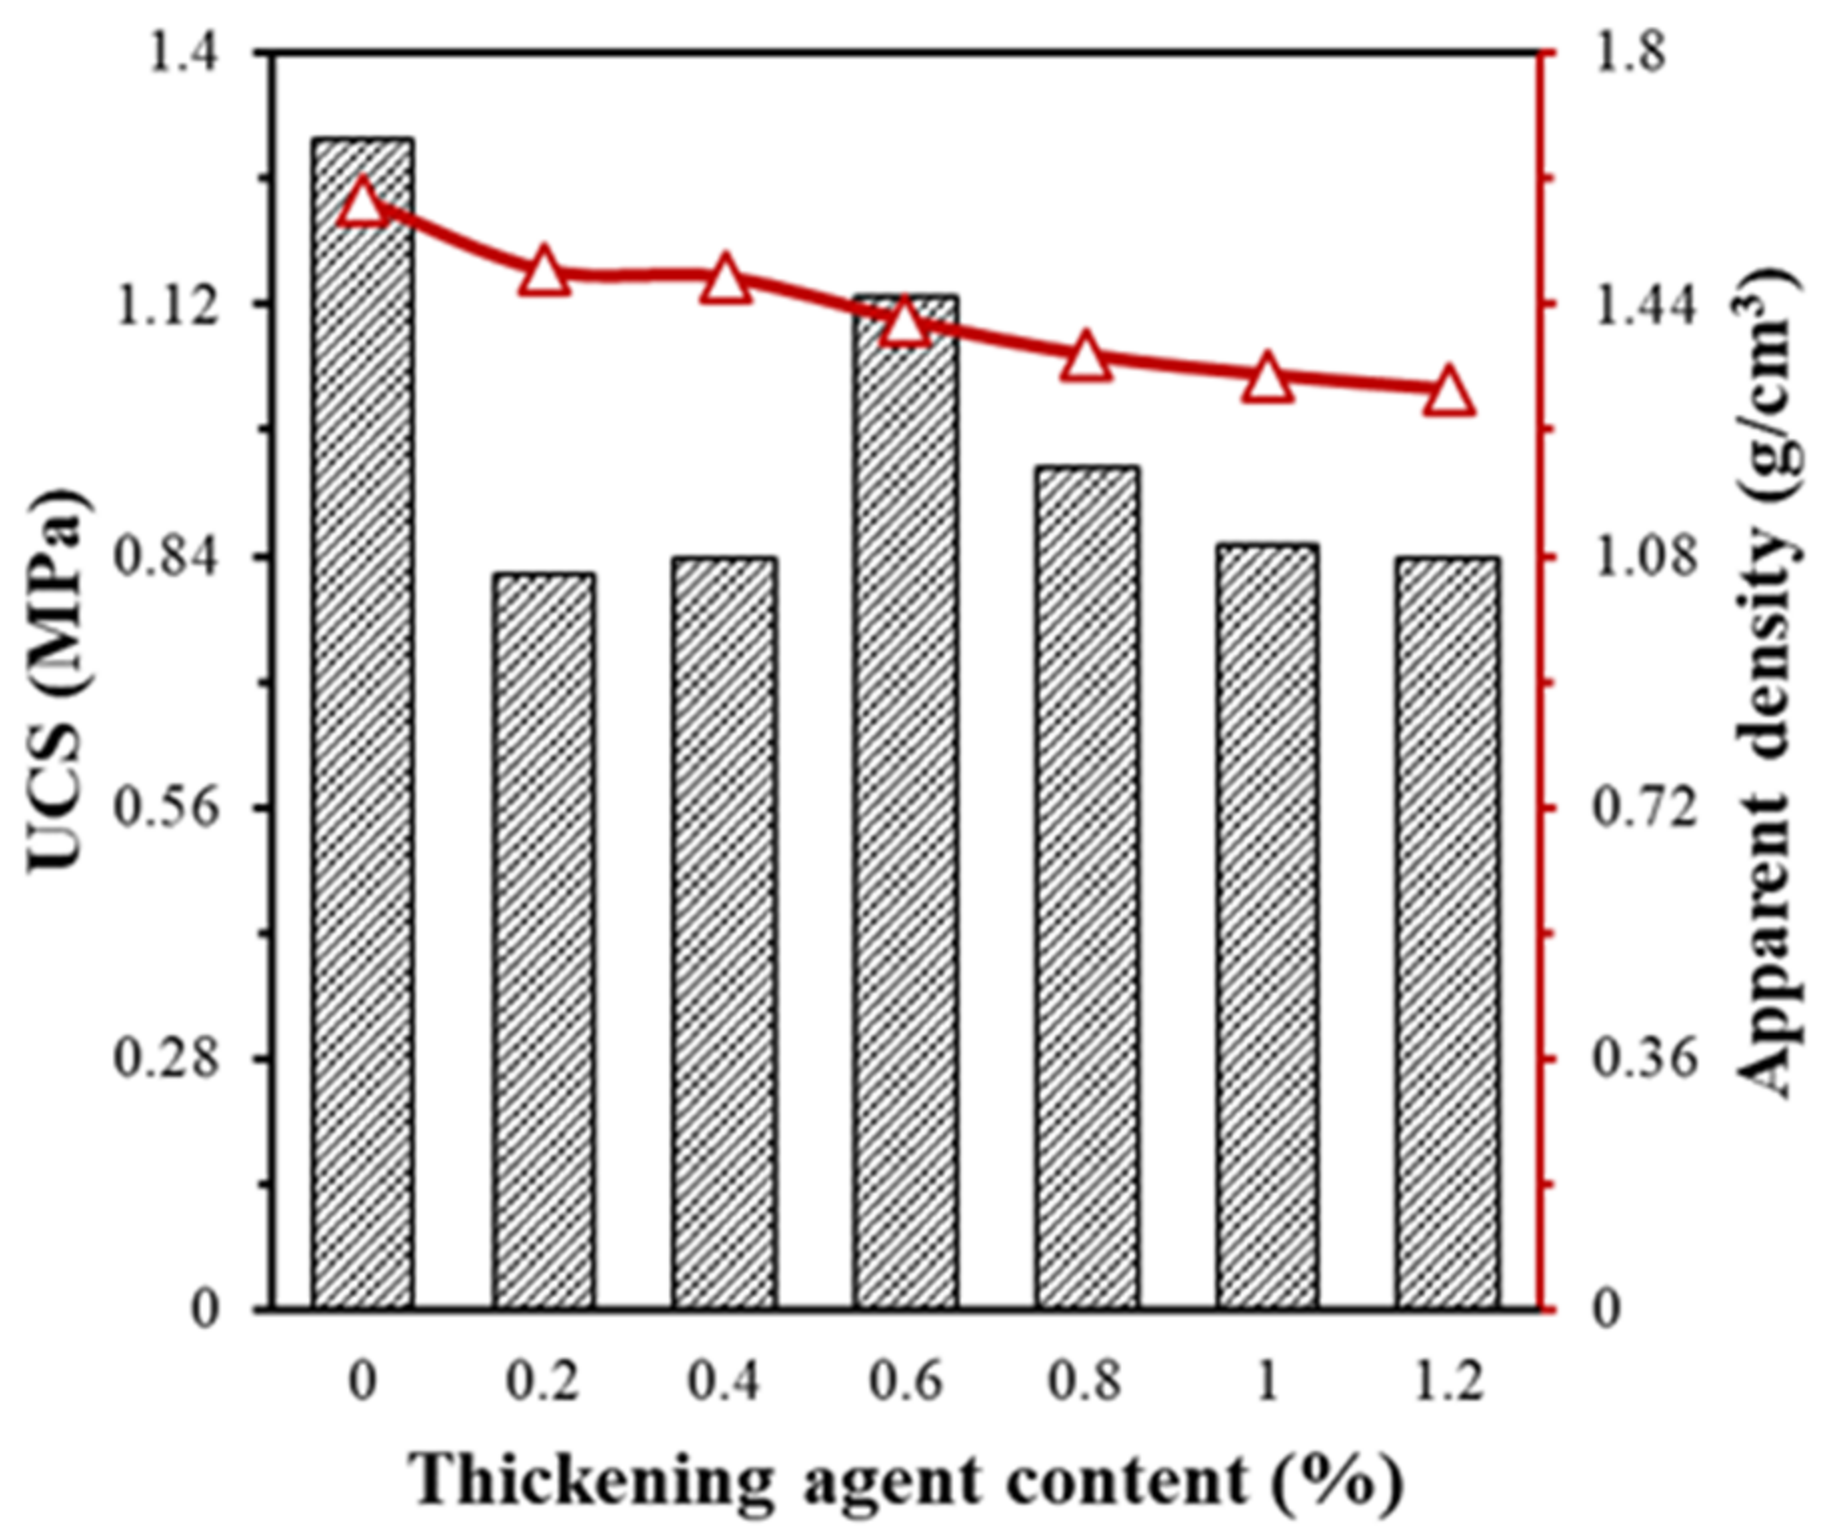
3.1.1. Determination of Thickening Agent Content

Figure 4 shows the fluidity of the fresh FCPB with various thickening agent contents. The figure shows that the thickening agent had an inhibitory effect on fluidity of the fresh FCPB. For example, when the thickening agent content increased from 0% to 1.2%, the fluidity decreased from 307 to 275 mm because the thickening agent contains polypropylene fiber. When the fiber mixes with the slurry, water molecules and fine particles are adsorbed on the surface of the fiber, and overlap and bridging between the fibers forms water storage spaces [43,44,45]. The amount of fiber increases with thickening agent content, which increased the void-filling water content. Based on the water film thickness theory [29,46], increased thickening agent content inevitably leads to decreased thickness of the water film wrapped on the surfaces of tailings and/or cement particles, which may cause a decrease in slurry fluidity. However, the thickening agent increased the consistency of the slurry, which contributed to bubble stability. Compared with fresh FCPB without a thickening agent, bubble escape is considerably lesser, resulting in increased numbers of bubbles in the fresh FCPB with increased thickening agent content. This indicates that the water content required to wrap bubbles increased; consequently, the water film thickness decreased, resulting in decreased fluidity of fresh FCPB [47].
Figure 5 shows the effect of thickening agent content on the UCS and apparent density of FCPB. Increased thickening agent content caused the UCS to increase first and then decrease. The maximum UCS and apparent density of the FCPB are noticed in samples without a thickening agent, because the fresh FCPB is too loose, and the bubbles generated by the decomposition of H2O2 cannot be stably preserved in the slurry [48]. During the experiment without a thickening agent, many bubbles were observed to float up and escape. When the thickening agent content increased from 0.2% to 0.6%, the porosity of the sample increased because of the presence of bubbles, thereby reducing the strength. Note that when the thickening agent content was 0.6%, the UCS of FCPB was the highest, indicating that the distribution of bubbles in the sample at this time is most conducive to strength gain. When the thickening agent content exceeded 0.6%, the UCS of FCPB gradually decreased with increasing thickening agent content. This can be attributed to the uneven distribution of bubbles in the FCPB because of excessive thickening agent addition. Moreover, the apparent density of the FCPB decreased with increasing thickening agent content. As the thickening agent dosage increased from 0% to 1.2%, the apparent density decreased from 1.59 to 1.32 g/cm3. Therefore, thickening agent content had significant effects on the properties of FCPB, and appropriate thickening agent content improved the stability of bubbles in the slurry [49]. This work shows that the optimal thickening agent content is around 0.6%.

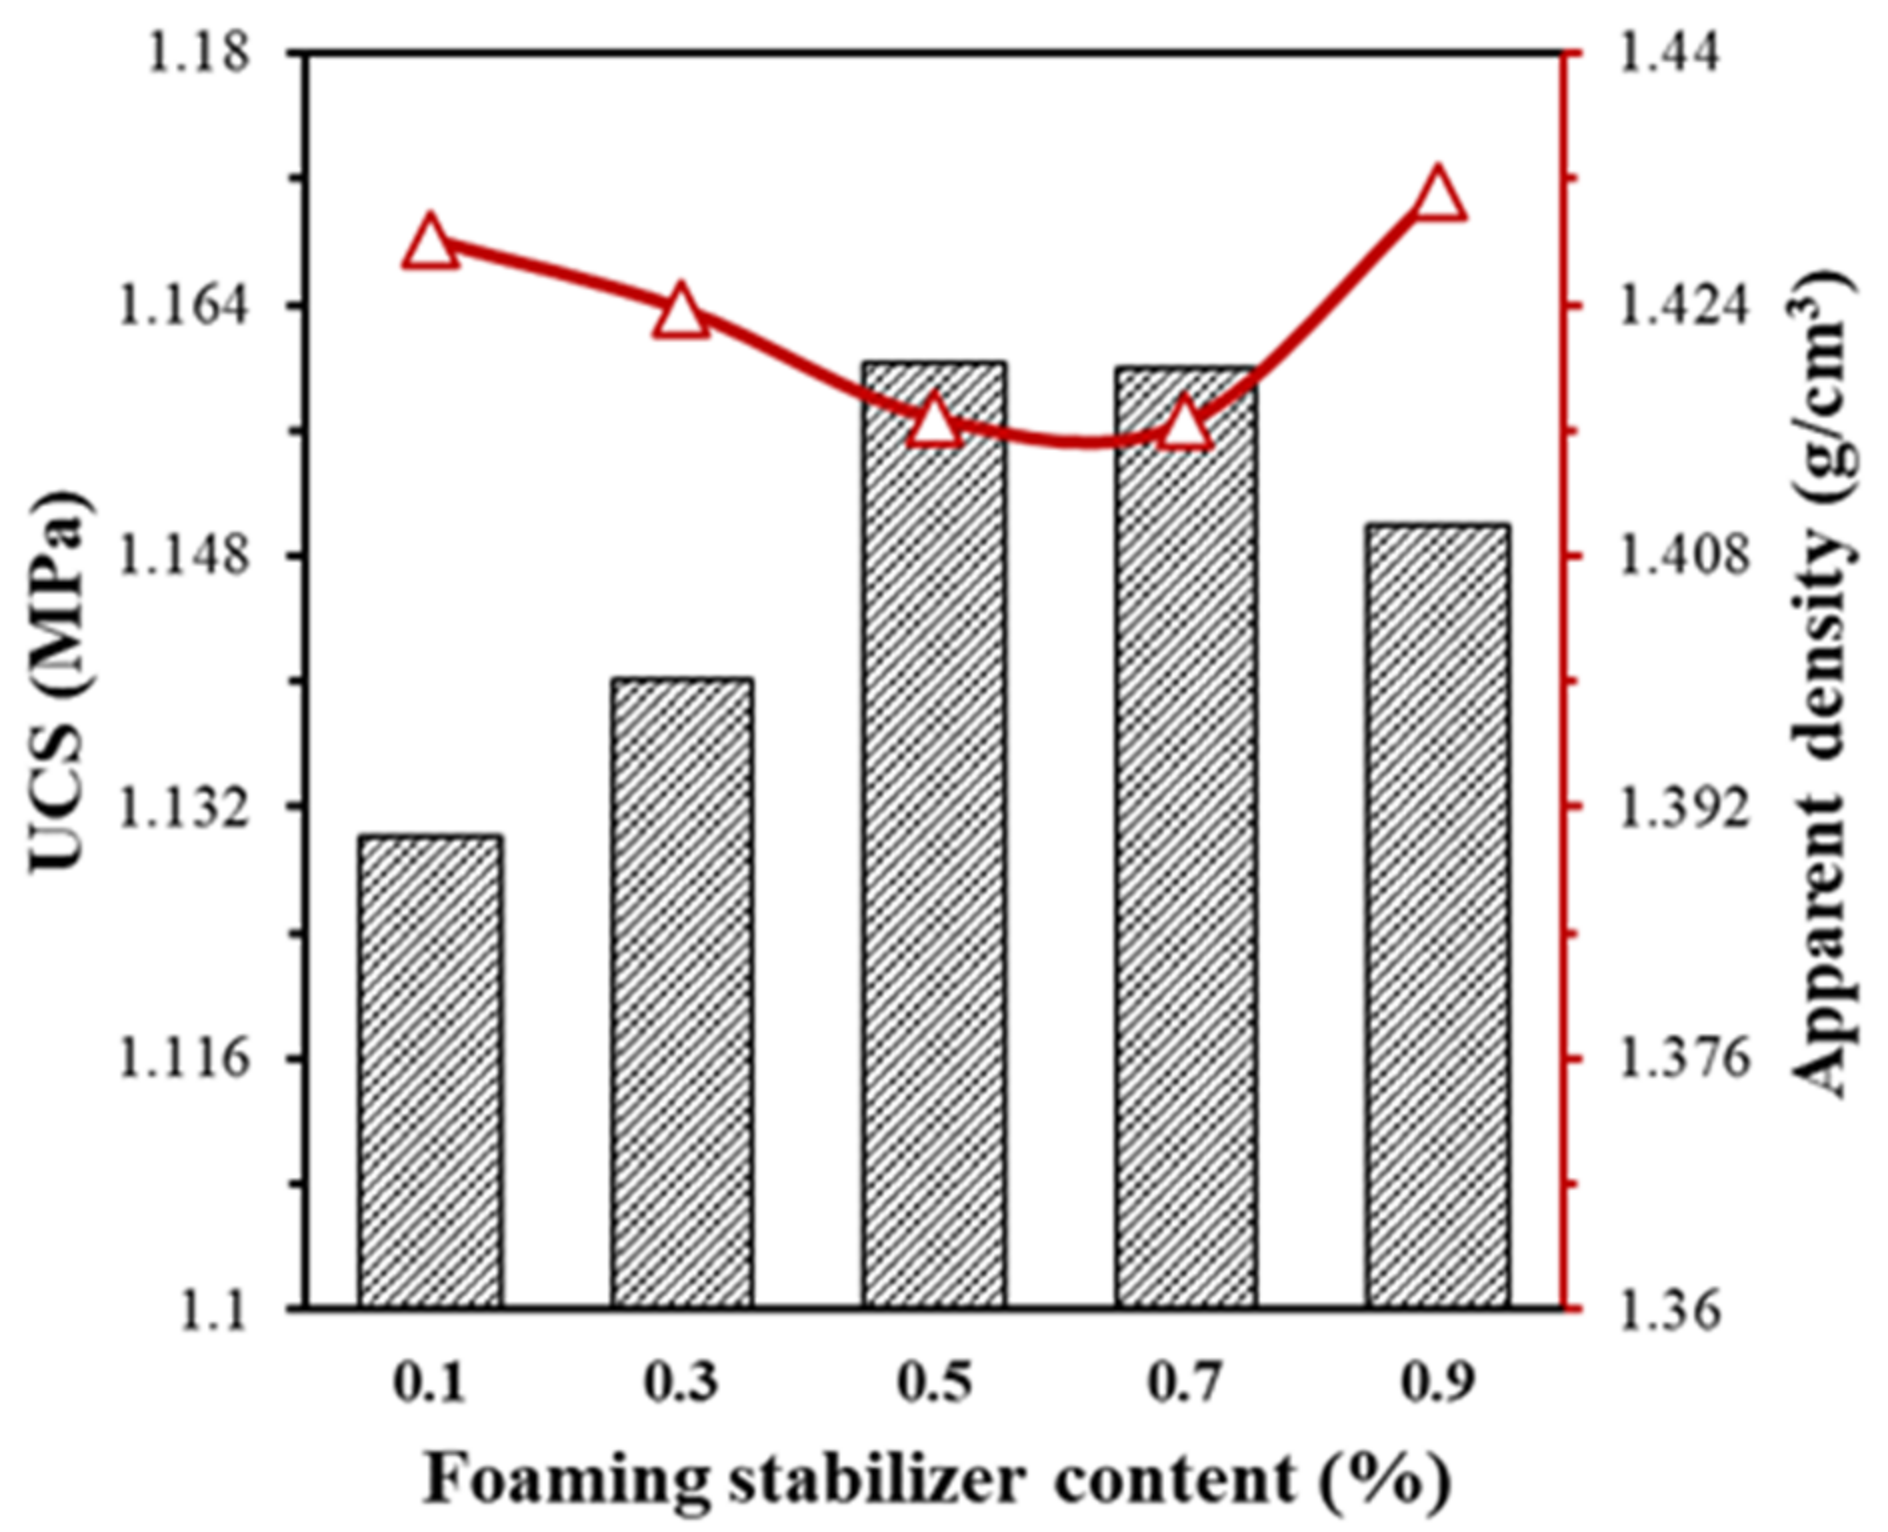
3.1.2. Determination of Foaming Stabilizer Content

Figure 6 shows the changes of UCS and apparent density of FCPB with various foaming stabilizer contents. The figure shows that the UCS of FCPB increased first and then decreased with increasing foaming stabilizer dosage while the trend of apparent density is the opposite. When the foaming stabilizer content increased from 0.1% to 0.5%, the UCS of FCPB increased from 1.13 to 1.16 MPa, while the corresponding apparent density slightly decreased from 1.42 to 1.41 g/cm3. The adsorption of calcium stearate on the bubble film reduced the bubble surface tension and improved the toughness of the bubble film, thus effectively reducing the number of bubbles that burst [50]. Compared with the FCPB without foaming stabilizer, the quality and number of bubbles in the FCPB with foaming stabilizer were slightly improved, resulting in a slight decrease in apparent density. The increased toughness of the bubble film improved the integrity of the bubble–slurry interface such that the FCPB can better stand up to compression. Moreover, the number of connected pores in the FCPB was reduced by the foaming stabilizer, thus improving the UCS. When the foaming stabilizer dosage exceeded 0.7%, the UCS decreased. The foaming stabilizer is hydrophobic, and excessive addition limits binder hydration [51]. Concurrently, the apparent density increased from 1.42 to 1.43 g/cm3, and this phenomenon can be attributed to excessive incorporation of foaming stabilizer, which led to an adverse slurry environment for bubble stability, and thus decreased the bubble volume [48]. Therefore, the optimal content of foaming stabilizer should be 0.5–0.7%. Considering its cost, the content selected for subsequent studies was 0.5%.

3.1.3. Determination of Foaming Agent Content

Figure 7 shows the expansion rates and fluidity values of fresh FCPB with different foaming agent contents. When the CTR and SC remained unchanged, the expansion rate of fresh FCPB positively correlated with foaming agent content. This could be attributed to the increased foaming agent content enhancing the number of generated bubbles, which was macroscopically expressed as an increase in FCPB volume [16]. When the foaming agent content was 0–0.5%, the expansion rate was negative, indicating that slurry settlement occurred. When the foaming agent content was 3%, the expansion rate of FCPB reached 20.67%. When the amount of foaming agent exceeded 4%, slurry collapse occurred, as excessive foaming agent led to the formation of large bubbles and connected pores [48].
As foaming agent content increased, the fluidity of the fresh FCPB decreased approximately linearly. Compared with the fluidity of fresh FCPB without a foaming agent, the fluidity of that with a foaming agent content of 4% decreased by 17.33%. When the foaming agent content was >4%, the degradation effect of the foaming agent on fluidity slightly decreased. The decrease in fluidity with increased foaming agent content can be partially explained by the water film thickness theory, i.e., the bubbles generated by the foaming agent increased the spacing among the solid particles, which in turn led to increased amounts of void filling water, thus reducing the water film thickness [52]. The ideal fluidity for transporting fresh backfill in a mine is ~260–300 mm [53]. Hence, considering a better roof-contacted filling effect, the foaming agent content should be between 1% and 3%.

3.2. Strength Characteristics of FCPB

Many studies have demonstrated that CTR, SC, and T are important influencing factors that affect the UCS of CPB [27,54,55,56]. Foaming agent incorporation significantly affects the internal microstructure of CPB, thus affecting UCS [16]. To quantitatively analyze the relationship between individual factors and the UCS of FCPB, the single-factor variable method was used to avoid the interference because of multifactor changes. Concurrently, the sensitivity of UCS to each of the four factors was obtained using grey relational analysis (GRA).

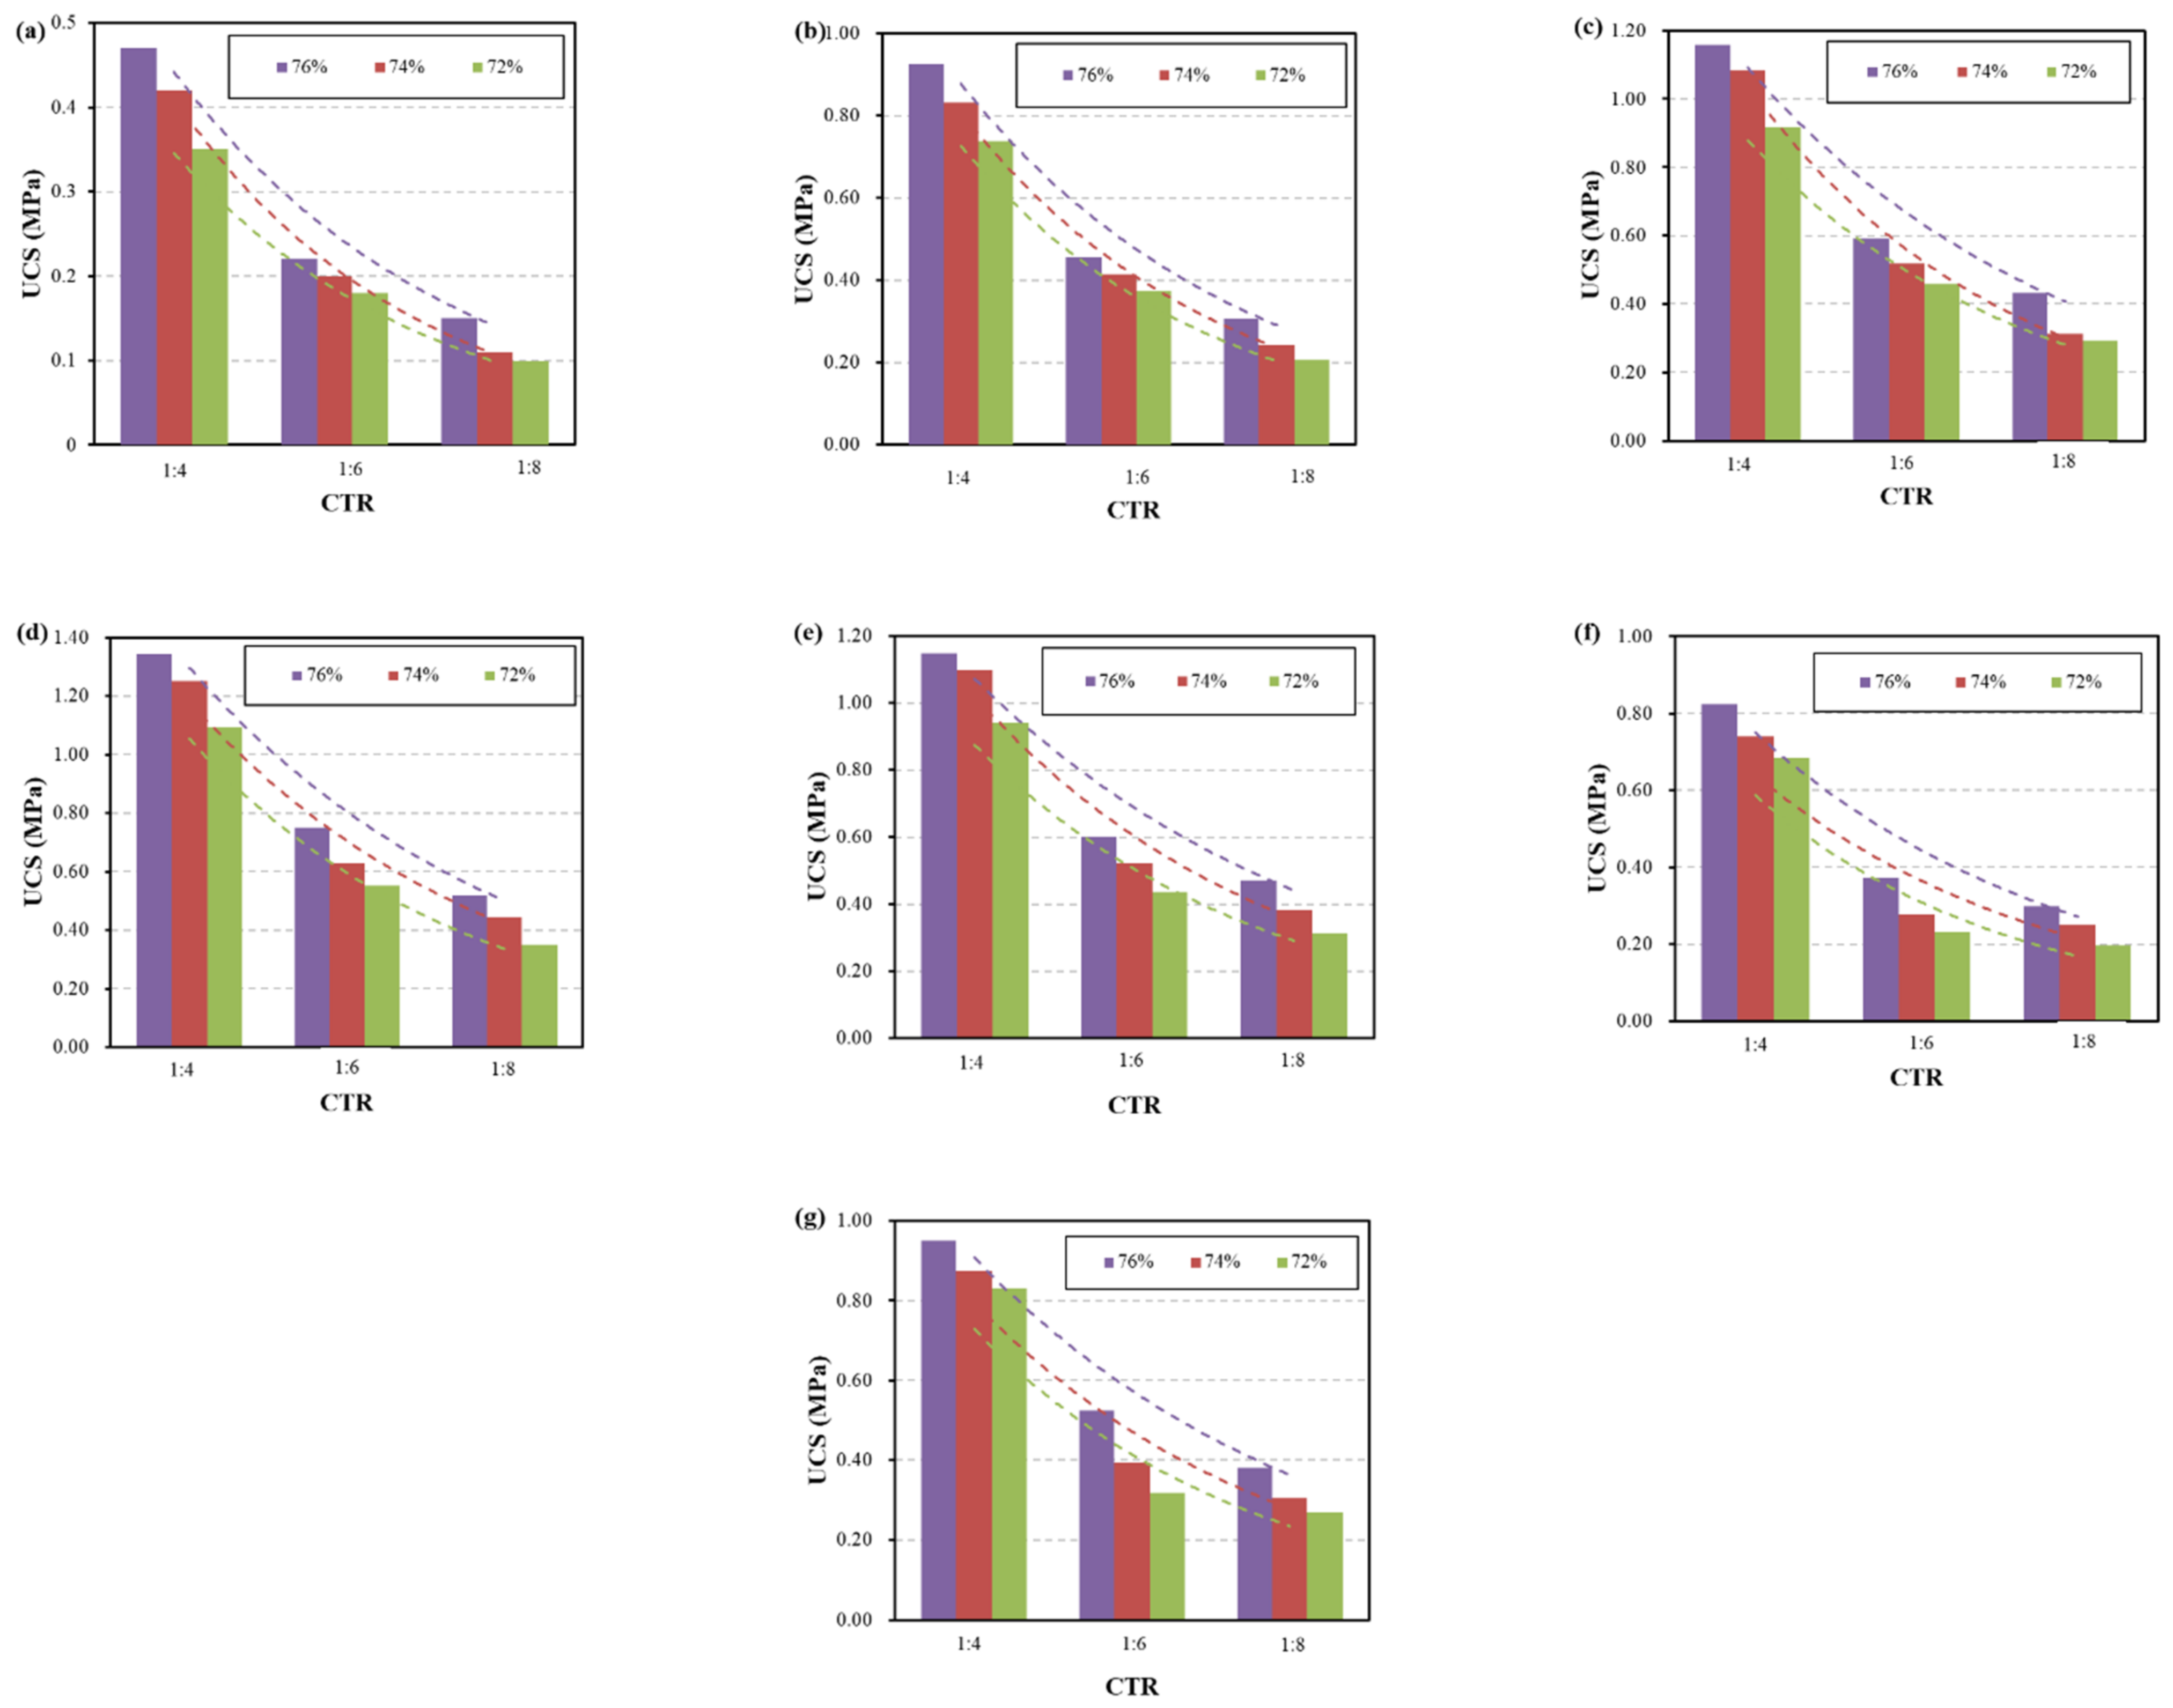
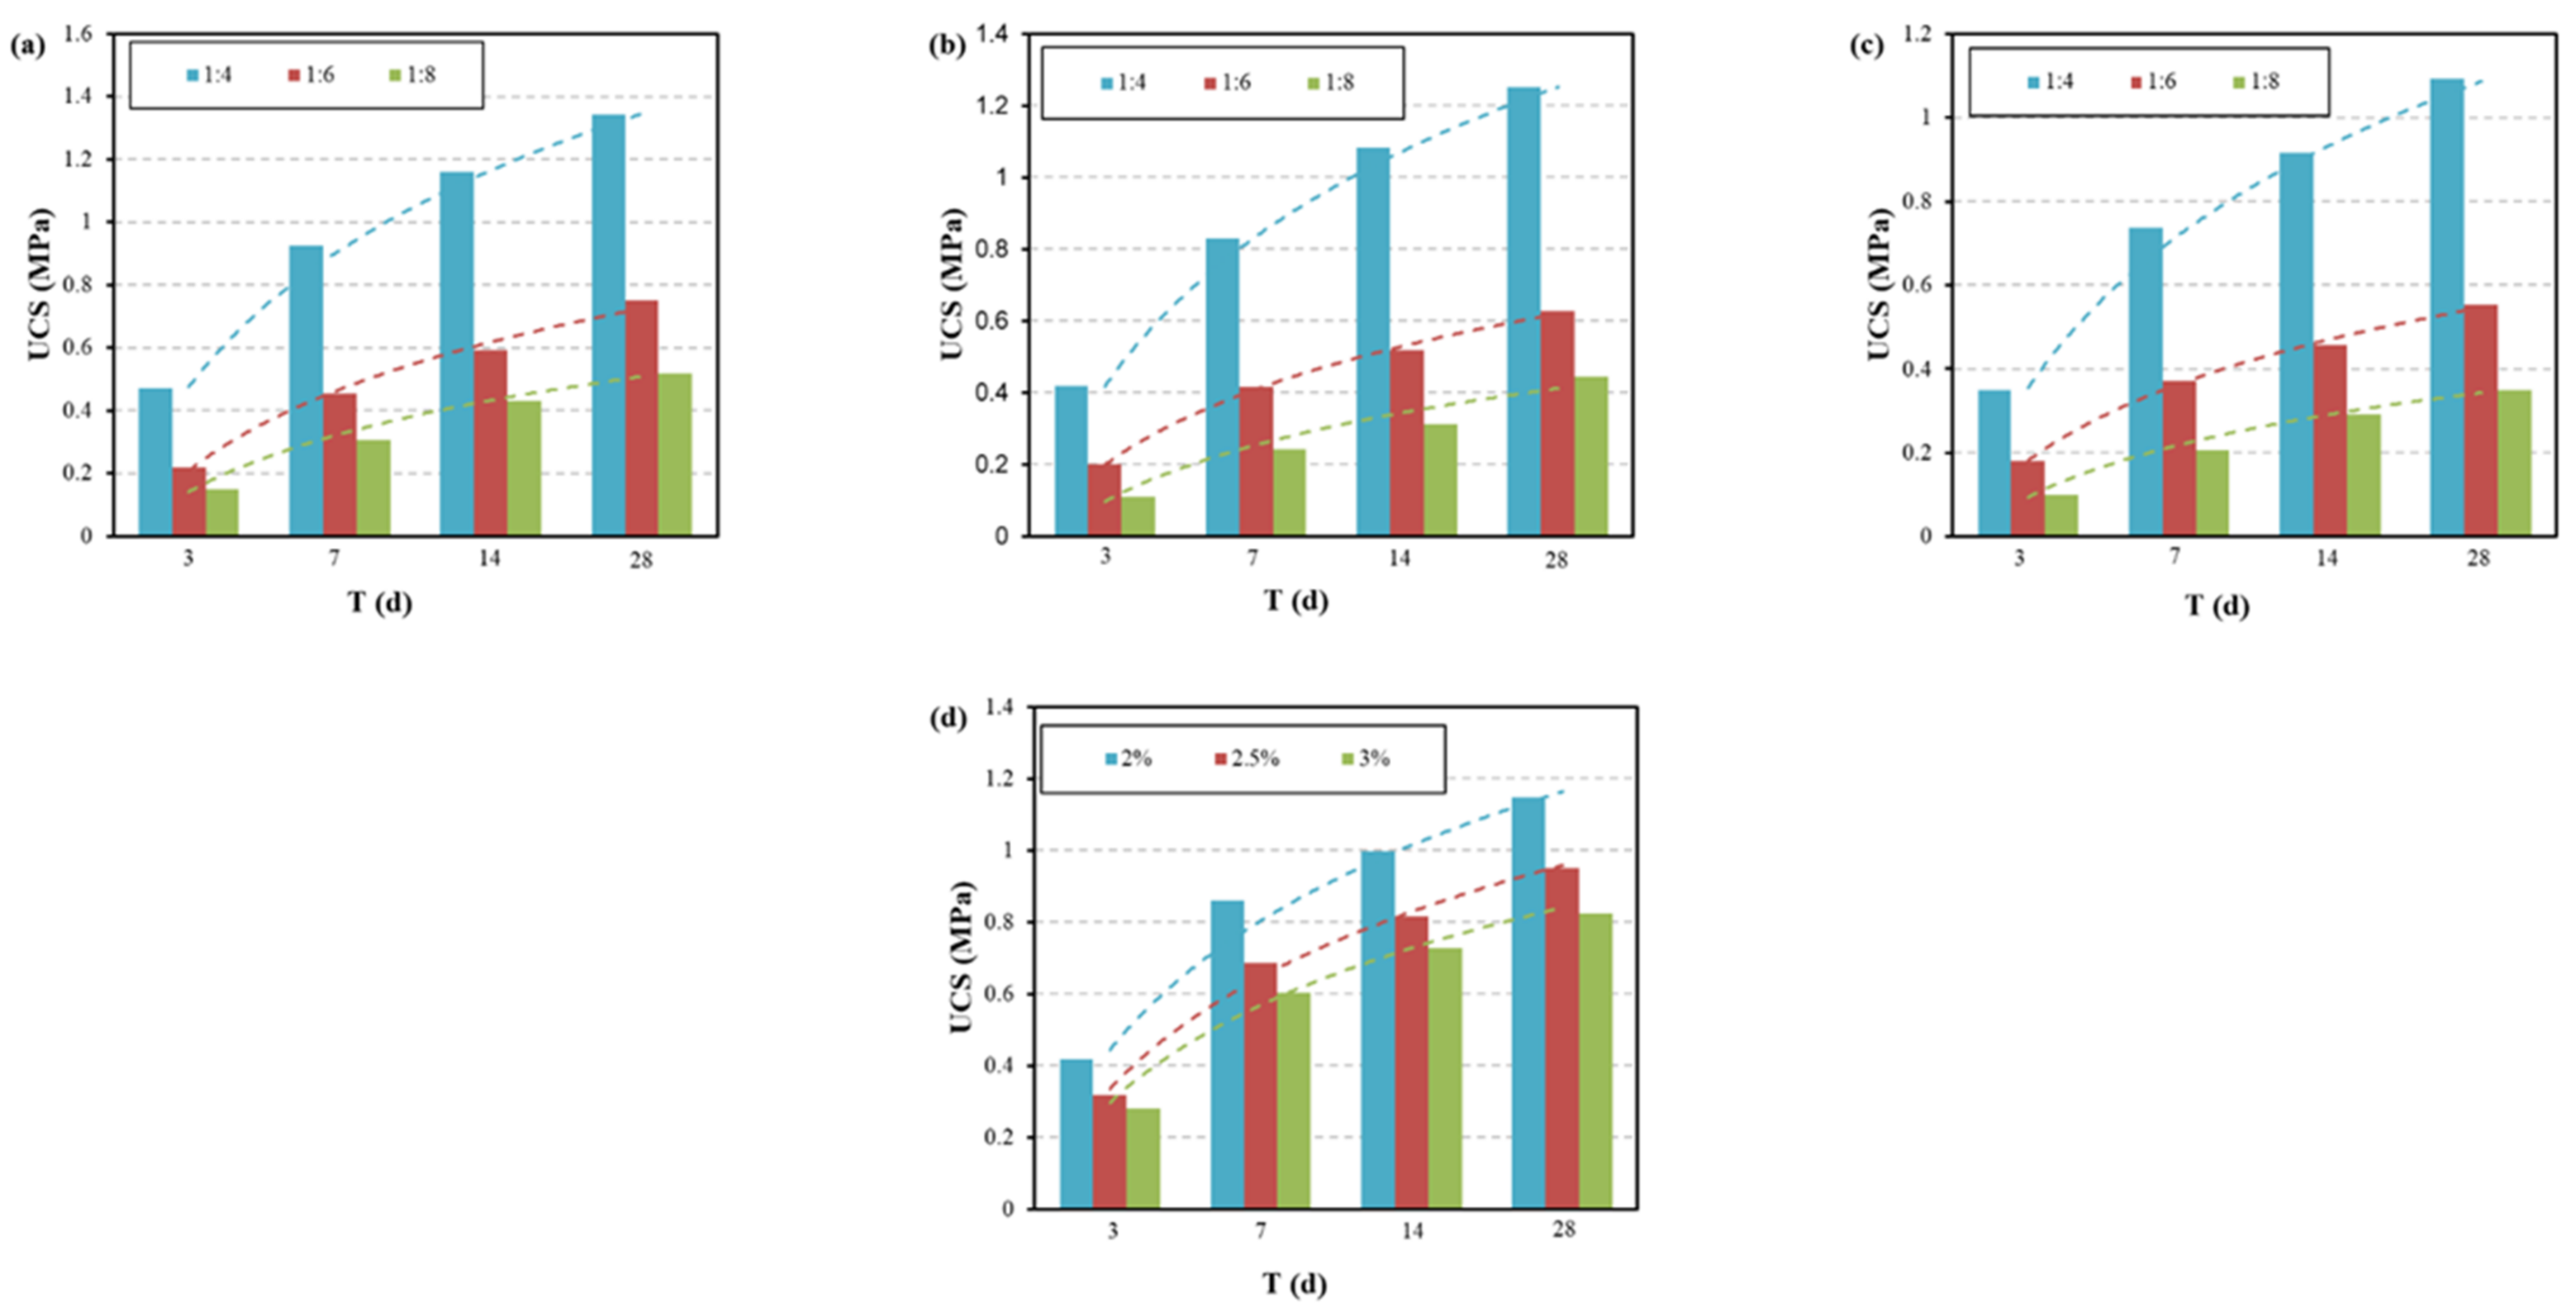
3.2.1. Effect of CTRs on the UCS of FCPB

To analyze the relationship between the UCS of FCPB and the CTR, SC was held constant. Figure 8 shows variations of UCS with CTR under different Ts and FCs. Figure 8a–d show the UCS of FCPB cured for 3–28 days, while Figure 8e–g show the UCS of 28-day cured FCPB samples with FC values of 2%, 2.5%, and 3%, respectively.
From Figure 8, the UCS of FCPB decreased with CTR regardless of SC and T. For example, as the CTR of FCPB samples increased from 1:8 to 1:4, the UCS of 28-day cured FCPB with FCs of 1.5%, 2%, 2.5%, and 3% increased from 0.44 to 1.25 MPa, from 0.38 to 1.1 MPa, from 0.25 to 0.74 MPa, and from 0.31 to 0.87 MPa, respectively. Higher CTR indicates more cement content. Fall et al. [57] demonstrated that the UCS of backfill material is proportional to cement content, which is primarily attributed to increased hydration products (calcium silicate hydrates (CSH), etc.) filling pores. When the FC increased, this trend did not change. The fitting results demonstrated that regardless of T and FC, the correlation coefficient between CTR and UCS obtained from exponential fitting is greater than that obtained from linear fitting. When FC was >1.5%, the fitting correlation coefficient decreased somewhat but still exceeded 0.85, indicating that there still was an obvious exponential relationship between the UCS of FCPB and the CTR. Interestingly; this observation is similar to the relationship between the UCS of CPB and the CTR as reported in [35]. The relationship between the UCS of FCPB and the CTR can be expressed as follows:
y = a exp ( bx )
where y is the UCS of FCPB; a and b are coefficients depending on SC, T, and FC; and x is the CTR.

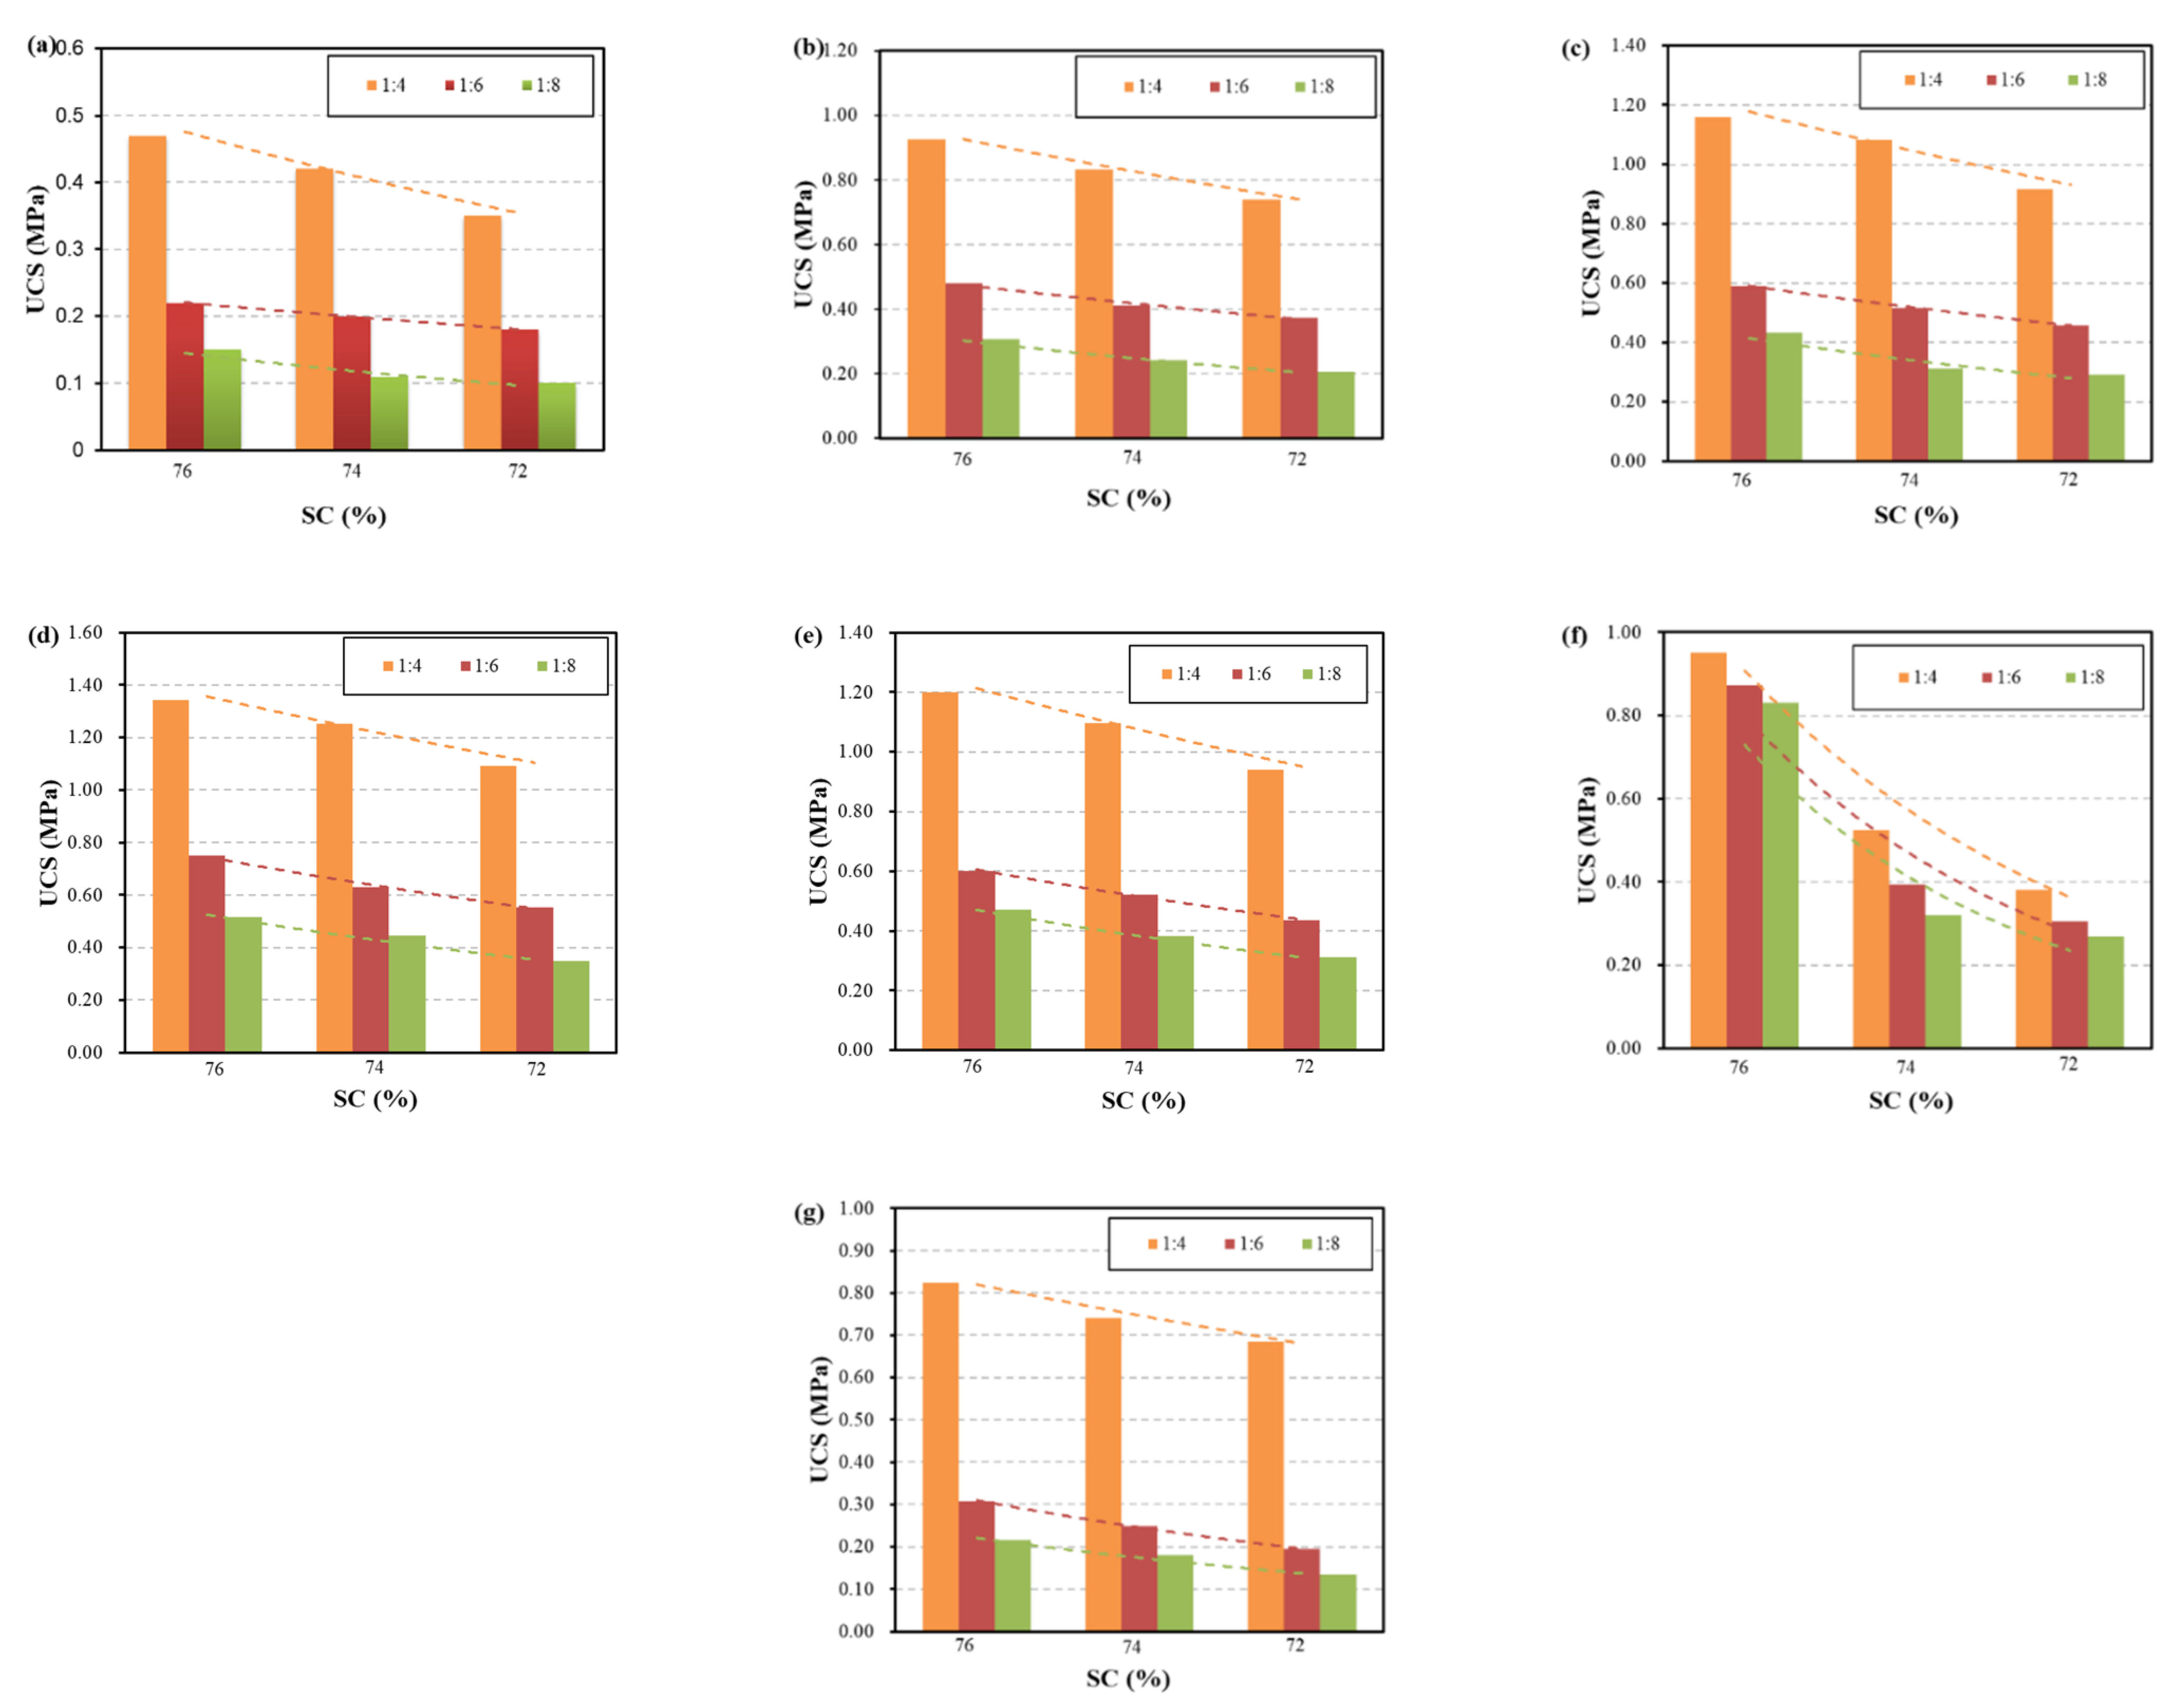
3.2.2. Effect of SCs on the UCS of FCPB

To analyze the relationship between the UCS of FCPB and SC, CTR was held constant. Figure 9 shows the variation of UCS with SC under different Ts and FCs.
Figure 9 shows that the UCS of FCPB increased with SC irrespective of CTR and curing time, and such variation is not influenced by the FC. For a SC of 72% at a constant CTR (1:4) and FC (1.5%), the strength of three-day cured FCPBs was 0.35 MPa. When the SC increased from 72% to 76%, the corresponding UCS became 0.47 MPa, causing a 34.3% increase in the strength of FCPB. As the SC increased from 72% to 76%, UCS increased from 0.74 MPa to 0.92 MPa for 7 days and from 1.09 to 1.34 MPa for 28 days. Increased water content is not conducive to increased strength; therefore, the UCS of FCPB decreased with decreased SC [27]. Note that when the FC was 2.5%, the strength differences between FCPBs with different CTRs were the smallest. This indicates that under the coupling action of SC and foaming agent, the influence of the CTR weakened. Furthermore, the larger the CTR, the more the UCS increased with increased SC (Figure 9). The correlation coefficients obtained from both exponential and linear fittings were extremely high, and the exponential fitting correlation coefficient was slightly larger than that obtained from the linear fitting. This indicates that an exponential fitting may be more feasible to characterize the relationship between the UCS of FCPB and the SC. The relationship between the UCS of FCPB and the SC can therefore be expressed as follows:
y = a exp ( bx )
where y is the UCS of FCPB; a and b are coefficients depending on CTR, T, and FC; and x is the SC.

3.2.3. Effect of Ts on the UCS of FCPB

Figure 10 shows the variation of UCS with T under different SCs and FCs. Figure 10 also shows that the UCS of FCPB increased with curing time regardless of the CTR and SC. For instance, the strengths of FCPB with a SC of 76%, a FC of 1.5% and a CTR of 1:4 were 0.47, 0.92, 1.16, and 1.34 MPa for curing times of 3, 7, 14, and 28 days, respectively. At a fixed SC (76%) and CTR (1:4), these values were 0.42, 0.86, 1.00, and 1.15 MPa; 0.32, 0.69, 0.81, and 0.95 MPa; 0.28, 0.60, 0.73, and 0.82 MPa for FCs of 2%, 2.5%, and 3%, respectively. The curing time was directly proportional to the accumulated hydration products and affected the free water content in the samples, resulting in higher UCS [58]. Furthermore, by comparing Figure 10a,b, it can be seen that the influence of FC on strength of FCPB generally was weaker than that of CTR. The increase in the UCS of FCPB with increased curing time can be attributed to the production of hydration products such as the CSH gel [59]. Figure 10 also shows that the FC does not change the trend of UCS with curing time, i.e., the strength increased faster at the beginning, and then the rate of increase slowed. Relevant studies [32,60] demonstrated that the UCS of CPB increased rapidly before 14 days and slowly thereafter. In this study, the transition curing time is 7 days, which may result from differences in the porosity of FCPB, the particle size of tailings, or the binder type and dosage. Furthermore, the fitting results show that the correlation coefficients obtained from logarithmic and linear fittings are both >0.94; however, the value of the logarithmic function fitting is higher. Thus, the quantitative relationship between the UCS of FCPB and T is written as follows:
y = c ln ( x ) + d
where y is the UCS of FCPB, and c and d are coefficients depending on CTR, SC, and FC; and x is T.

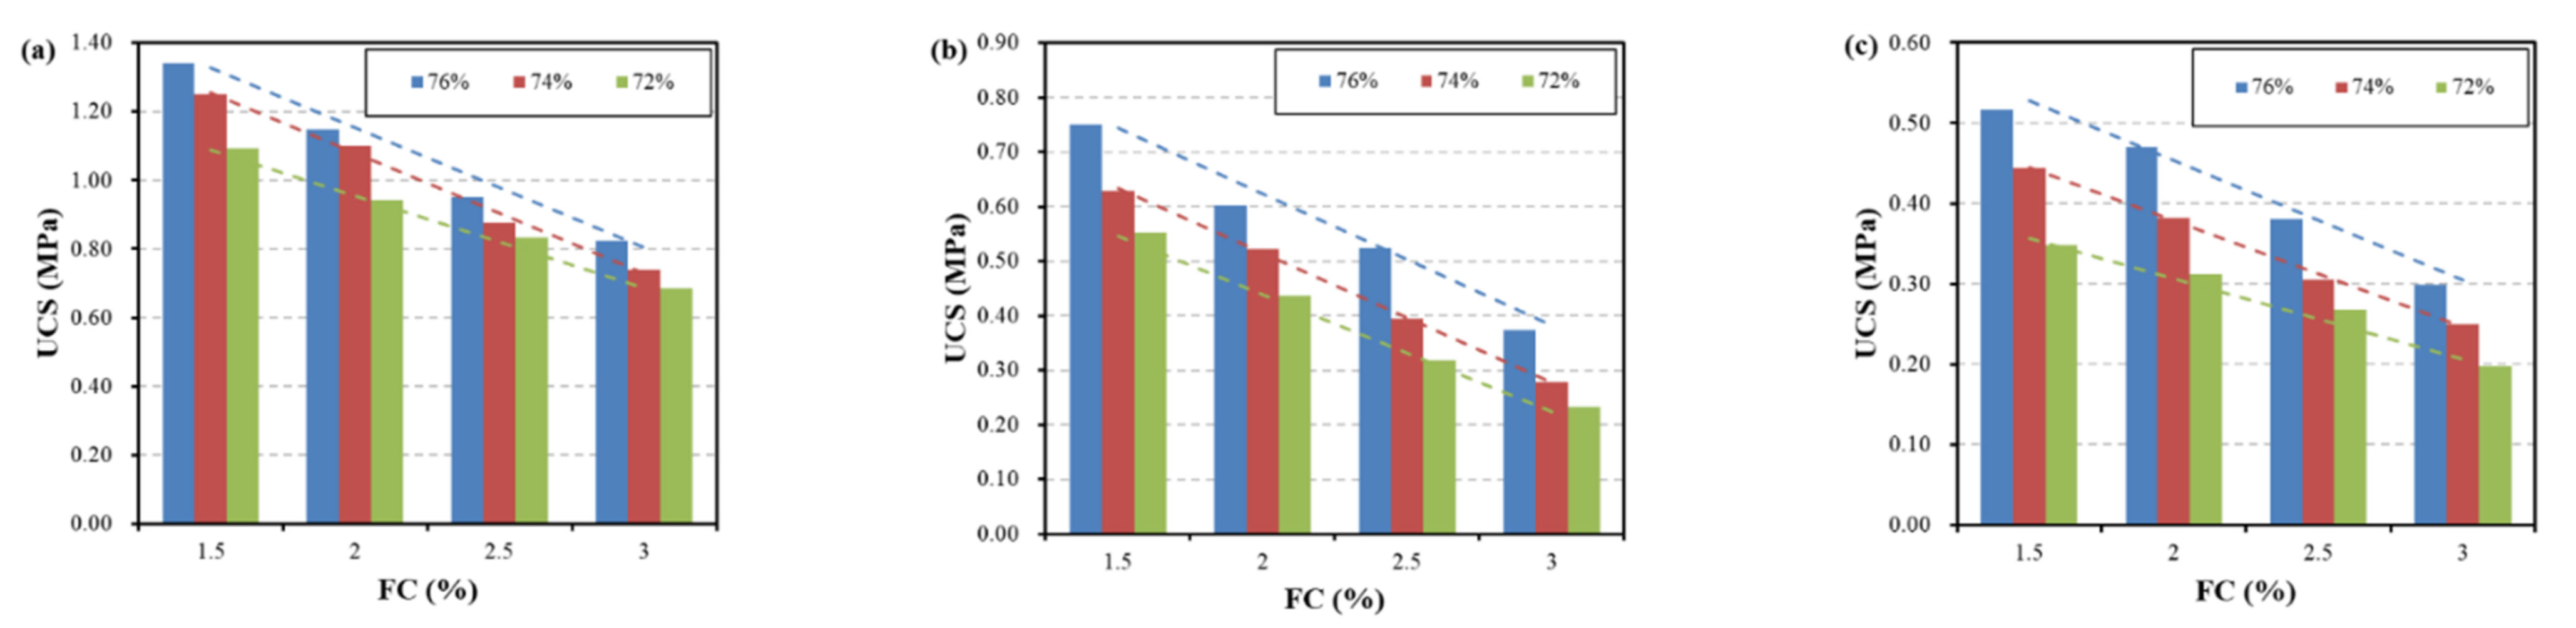
3.2.4. Effect of FCs on the UCS of FCPB

Figure 11 shows the influence of FC on the UCS of FCPB. Figure 11 also shows that the UCS decreased with FC, regardless of the CTR and SC. When the FC increased from 1.5% to 3%, the compressive strength of FCPB samples (CTR = 1:4, SC = 76) decreased from 1.34 to 0.82 MPa at 28 days. The increased FC led to increased porosity in the FCPB, which reduced the FCPB compaction and made it more likely to be damaged during the loading process [19,61]. Furthermore, the fitting results show that the correlation coefficient obtained from linear fitting is higher than that obtained from exponential fitting, and the average correlation coefficients obtained from linear fitting are >0.95. Therefore, the relationship between FC and the UCS of FCPB can be linearly expressed using the following:
y = mx + n
where y is the UCS of FCPB; m and n are coefficients depending on SC, T, and CTR; and x is FC.

3.2.5. Factor Sensitivity Analysis

The essence of GRA is to determine whether the sequence curves are possibly related according to the degree of similarity in their geometric shapes [62]. The correlation between sequences is proportional to the proximity of curves. The GRA can be used to quantitatively analyze the multiple factors that affect a complex system. As per the correlation degree of each factor, which are the primary factors and which are the secondary factors can be determined. This method first performs dimensionless processing on the original factor data, then calculates the correlation coefficient and correlation degree, and finally sorts the factor sensitivities as per the correlation degree.
Through the analyses in Section 3.2.1, Section 3.2.2, Section 3.2.3 and Section 3.2.4, the CTR, SC, T, and FC have clear influences on the UCS of FCPB; however, the UCS has different sensitivities to them. Hence, the GRA method, which can be used to study orthogonal test results without considering interaction effects, is adopted herein to evaluate the influence of subfactors (CTR, SC, T, and FC) on the parent factor (UCS) [35]. A grey correlation model with four factors and three levels is established, in which the CTRs are 1:4, 1:6, and 1:8, the SCs are 72%, 74%, and 76%, the Ts are 7 days, 14 days, and 28 days; and the FCs are 1.5%, 2%, and 2.5%.
To obtain accurate results, it is necessary to normalize the original data, eliminate the influence of dimension, and make it comparable. The mean value transformation method was adopted for data processing, namely:
Y i k = X i k X i ¯
where Xi is the behavior sequence of I; Yi is the normalized sequence; and X i ¯ is the average value of the i-th column in the behavior sequence; i refers to the number of the factor series; and k refers to the number of levels.
Proximity Δ i k can be expressed as:
Δ i k = Y i k X 0 k
where X0 (k) is the sequence after averaging the reference sequence.
The association coefficient ξ i k of the subfactor in relation to its parent factor can be expressed as follows:
ξ i k = min i   min k Δ i k + ρ × max i max k Δ i k Δ i k + ρ × max i max k Δ i k
where ρ is the resolution coefficient, which is set as 0.5 during calculation.
The correlation degree γ i can be expressed as follows:
γ i = 1 n k = 1 n ξ i k
We used the nine UCS results obtained from the tests of four-factor and three-level orthogonal table design as the reference sequence and substituted their values into Equations (7)–(10). These results indicate that CTR has the highest influence on the UCS of FCPB, followed by T, SC, and FC in sequence. The correlation degree of all factors was >0.7, indicating that all four factors significantly affected the strength of FCPB. UCS was the most sensitive to the CTR because the higher binder content led to the increase of CSH gel, ettringite, and other hydration products, which can optimize the pore size and promote the growth of UCS [63]. The longer the curing time, the more complete the binder hydration was and hence the more hydration products were produced [64]. The FC was least sensitive to the UCS of FCPB, which was unexpected. This may be attributed to the increase of FC leads to the increase of porosity inside FCPB, which is unfavorable to increased strength [19].
Note that, although certain strength prediction models for FCPB were proposed in this paper and their correlation coefficients were high, these models were all obtained through single-factor fitting, which limits their applicability. Currently, there are few studies on prediction models for the strength of FCPB. For example, Qiu et al. [19] used a hybrid artificial intelligence model to predict the UCS of FCPB. Xu et al. [33] predicted the strength of FCPB by establishing the relationship between UPV and UCS. Therefore, a strength prediction model for FCPB will be the focus of our future study.

3.3. UPV Characteristics of FCPB

3.3.1. Effects of FC, SC, CTR, and T on the UPV of FCPB

Figure 12a shows the effect of FC on UPV at different curing times. Clearly, UPV decreased with FC. In Ref. [32], the UPV of CPB (water–cement ratio = 3.9, binder content = 7%) is ~2400 m/s. However, in this study, the UPV was only 2148 m/s when the binder content reached 20%, showing that the FC had a significant influence on UPV. Figure 12b shows the changes in UPV at different SCs and Ts with fixed CTR (1:4) and FC (1.5%). As seen from the figure, UPV increased with curing time. This can be attributed to more complete hydration of the binder. For a given curing time, higher SC resulted in higher UPV. A higher SC means a lower water–cement ratio, which can improve the strength of backfill and consequently the UPV. Figure 12c shows the changes in UPV of the backfill at different CTRs and Ts. For a given T, higher CTR contributed to higher UPV. The UPV of the FCPB increased sharply first and then slowly with increased T, which is similar to the development trend of UCS at similar Ts. Hydration products gradually precipitated and filled the voids, and UPV is increased by shortening the distance of ultrasonic wave propagation in the air inside the FCPB.

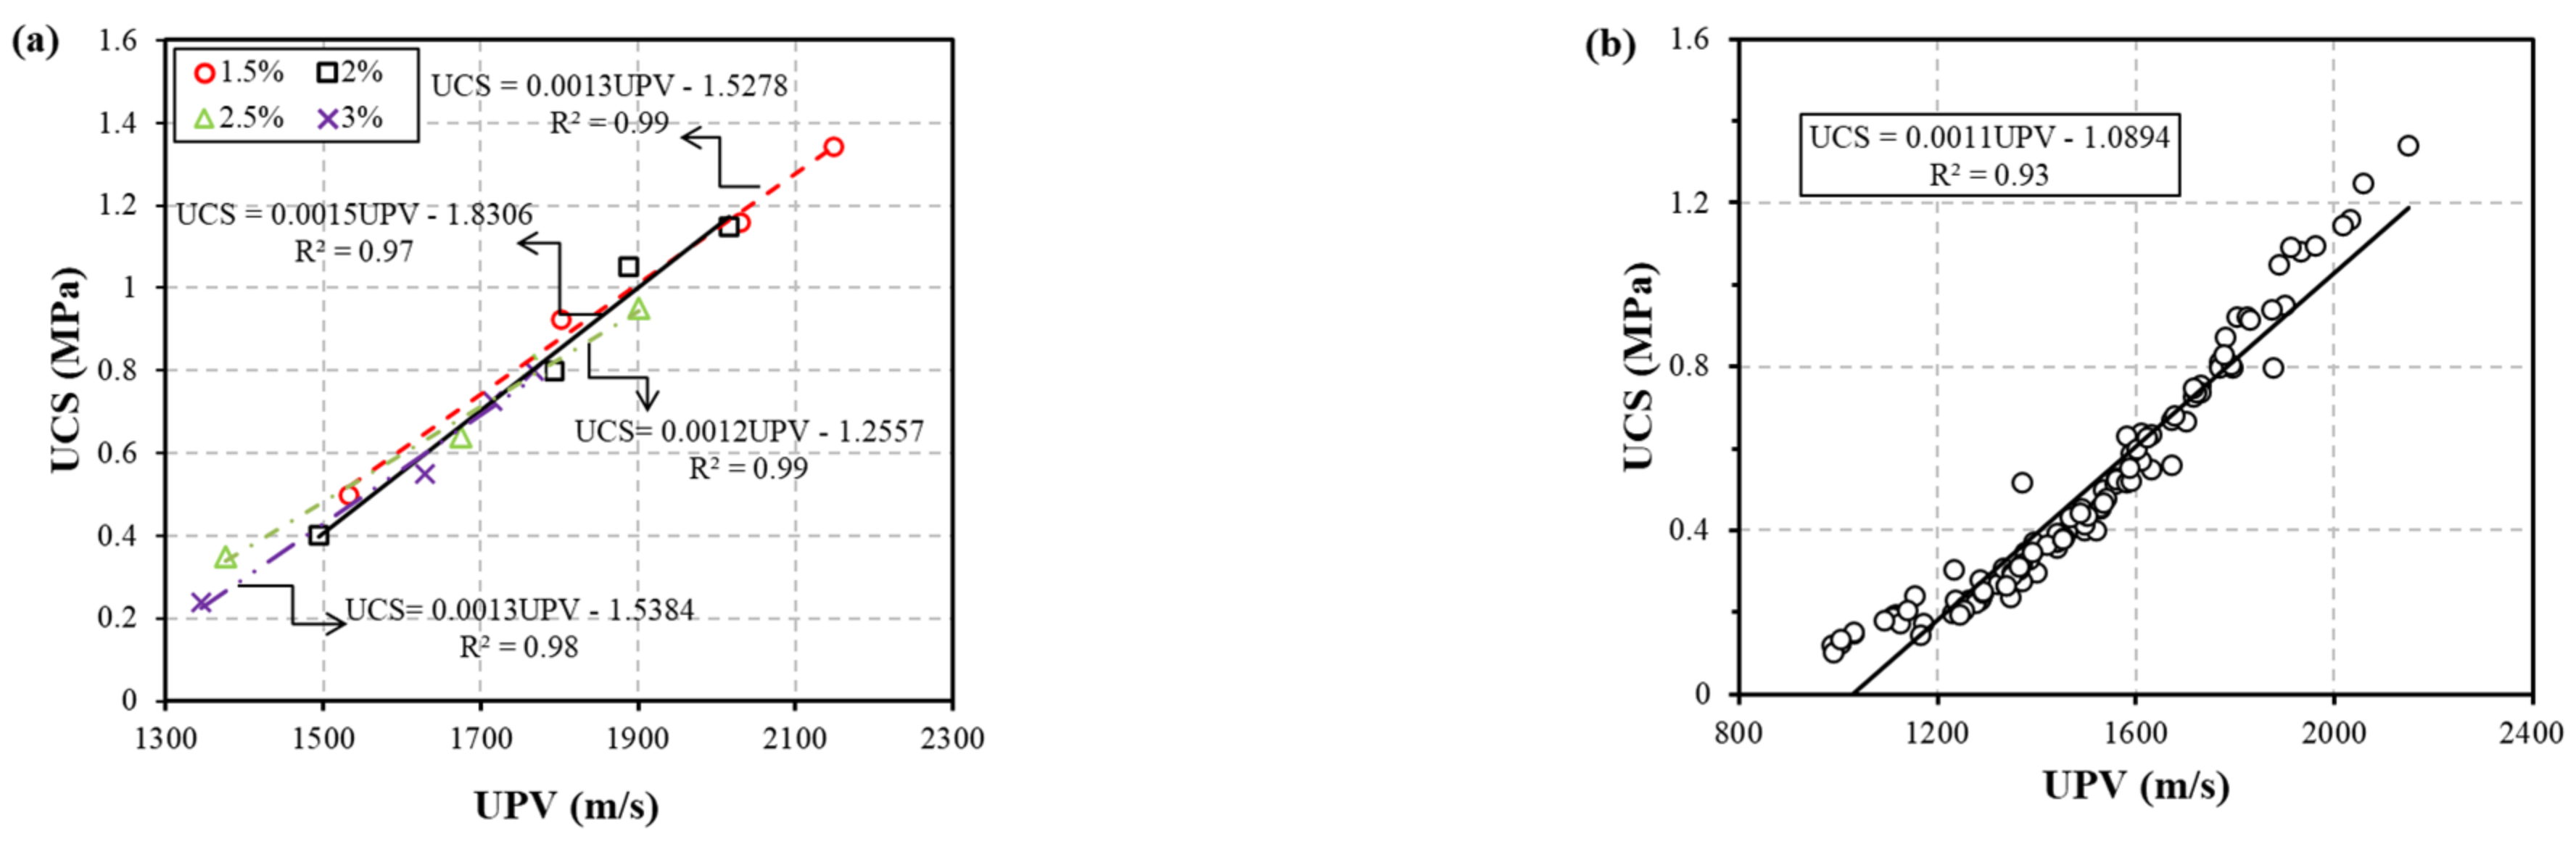
3.3.2. Relationships between UCS and UPV

As discussed in Section 3.3.1, the variation trends of UPV in relation to the influencing factors were similar to that of the UCS. Therefore, there should be a correlation between the UCS and the UPV. Figure 13a shows the relationships between the UCS and UPV of FCPB with different FCs (CTR = 1:4, SC = 76%) together with linear fitting functions. All correlation coefficients between the UPV and USC of FCPB with various FCs are between 0.97 and 0.99, denoting a strong linear relationship between them. Furthermore, Figure 13b shows the relationships between the UCS and UPV of FCPBs with different CTRs, SCs, FCs, and Ts (all samples tested in this study), in addition to a trend line obtained from linear fitting. As seen, there is a linear relationship, with a correlation coefficient equal to 0.93. Through F-tests, the p-values of all equations were reported to be <0.5, indicating that these linear fitting equations were effective. To summarize, the UPV can be adopted to predict the UCS of FCPB.

4. Conclusions

In this study, apparent density, expansion rate, fluidity, and UCS tests were determined to know the optimal contents of admixtures to prepare FCPB. A series of samples incorporating various CTRs, SCs, Ts, and FCs to evaluate their effects on the UCS and UPV of FCPB. The sensitivities of UCS to these four factors were determined using the GRA method. The following conclusions can be drawn:
(1)
The UCS of FCPB increases first and then decreases with increasing foaming stabilizer content, while the corresponding apparent density changes are the opposite. This is because the adsorption of calcium stearate on the bubble film affects the stability of bubbles in the slurry. The fluidity and apparent density of FCPB always decrease with thickening agent dosage, while the UCS increases first and then decreases. This can be attributed to the fact that polypropylene fiber, the main component of the thickening agent, affects the thickness of the water film on the bubble and the consistency of the slurry, thus affecting the stability and distribution of bubbles. As the FC increases, the expansion rate continues to increase but fluidity decreases. Moreover, the optimal contents of foaming stabilizer, thickening agent, and foaming agent are 0.5%, 0.6%, and 1% to 3%, respectively.
(2)
The UCS of FCPB increases in an exponential manner with SC and CTR, and grows logarithmically with curing time but linearly decreases with higher FC. The increase in porosity because of the increased volume of bubbles leads to a decrease in UCS. CTR has the highest influence on the UCS of FCPB, followed by T, SC, and FC.
(3)
As FC increases, the UPV of FCPB linearly decreases. This can be attributed to the significant increase in porosity caused by the increased air bubbles. The UCS and the corresponding UPV have linear relationships with all the tested FCPB samples, regardless of CTR, SC, T, and FC. This indicates that the UPV can be reliably and accurately used to estimate the UCS of FCPB.
Although the addition of foaming agent can solve the roof-contacted problem, it will reduce the UCS. Moreover, foaming agent as admixture will undoubtedly increase the backfill cost; therefore, a combination of traditional CPB and FCPB (as shown in Figure 1) can be adopted to minimize the cost. Our future work will explore foaming agents with more stable performance, lower cost, and the least weakening effect on the strength of CPB.

Author Contributions

Conceptualization, X.S.; Formal analysis, X.X. and X.S.; Funding acquisition, X.X. and X.S.; Investigation, W.Y. and P.W.; Methodology, Z.G. and N.L.; Writing—original draft, X.X.; Writing—review and editing, X.X. and J.Q. All authors have read and agreed to the published version of the manuscript.

Funding

This work was financially supported by the Natural Science Foundation of China (52074061, 51974060, U1903216 and 51774066), the Fundamental Research Funds for the Central Universities (N2001024), the Major scientific and technological projects in Liaoning Province (2020JH1/10300005) and the Innovation Program for College Students, Northeastern University, 210069.

Data Availability Statement

Data is contained within the article.

Acknowledgments

The authors would like to thank Fan Yao from Shiyanjia Lab (www.shiyanjia.com) for language editing services.

Conflicts of Interest

The authors declare no conflict of interest.

References

  1. Fall, M.; Pokharel, M. Coupled effects of sulphate and temperature on the strength development of cemented tailings backfills: Portland cement-paste backfill. Cem. Concr. Compos. 2010, 32, 819–828. [Google Scholar] [CrossRef]
  2. Xu, W.; Cao, P.; Tian, M. Strength Development and Microstructure Evolution of Cemented Tailings Backfill Containing Different Binder Types and Contents. Minerals 2018, 8, 167. [Google Scholar] [CrossRef] [Green Version]
  3. Wu, J.; Feng, M.; Xu, J.; Qiu, P.; Wang, Y.; Han, G. Particle size distribution of cemented rockfill effects on strata stability in filling mining. Minerals 2018, 8, 407. [Google Scholar] [CrossRef] [Green Version]
  4. Benzaazoua, M.; Fall, M.; Belem, T. A contribution to understanding the hardening process of cemented pastefill. Miner. Eng. 2004, 17, 141–152. [Google Scholar] [CrossRef]
  5. Dutta, D.; Ghosh, S. The role of delayed water curing in improving the mechanical and microstructural properties of alkali activated fly ash based geopolymer paste blended with slag. World J. Eng. 2019, 16, 103–114. [Google Scholar] [CrossRef]
  6. Zhang, J.; Deng, H.; Taheri, A.; Deng, J.; Ke, B. Effects of Superplasticizer on the Hydration, Consistency, and Strength Development of Cemented Paste Backfill. Minerals 2018, 8, 381. [Google Scholar] [CrossRef] [Green Version]
  7. Jiang, H.; Fall, M.; Yilmaz, E.; Li, Y.; Yang, L. Effect of mineral admixtures on flow properties of fresh cemented paste backfill: Assessment of time dependency and thixotropy. Powder Technol. 2020, 372, 258–266. [Google Scholar] [CrossRef]
  8. Dwivedi, S.; Dwivedi, G. Utilization of recycled hazardous waste bagasse as reinforcement to develop green composite material. World J. Eng. 2020, 17, 399–406. [Google Scholar] [CrossRef]
  9. Deepa, P.; Laad, M.; Sangita; Singh, R. An overview of use of nanoadditives in enhancing the properties of pavement construction binder bitumen. World J. Eng. 2019, 16, 132–137. [Google Scholar]
  10. Singh, K.P.; Kumar, A.; Kaushal, D.R. Pressure drop calculation for fly ash slurry using rheological model. World J. Eng. 2019, 16, 751–767. [Google Scholar] [CrossRef]
  11. Yang, L.; Yilmaz, E.; Li, J.; Liu, H.; Jiang, H. Effect of superplasticizer type and dosage on fluidity and strength behavior of cemented tailings backfill with different solid contents. Constr. Build. Mater. 2018, 187, 290–298. [Google Scholar] [CrossRef]
  12. Haiqiang, J.; Fall, M.; Cui, L. Yield stress of cemented paste backfill in sub-zero environments: Experimental results. Miner. Eng. 2016, 92, 141–150. [Google Scholar] [CrossRef]
  13. Qiu, J.-P.; Yang, L.; Xing, J.; Sun, X.-G. Analytical solution for determining the required strength of mine backfill based on its damage constitutive model. Soil Mech. Found. Eng. 2018, 54, 371–376. [Google Scholar] [CrossRef]
  14. Cao, S.; Yilmaz, E.; Song, W. Evaluation of viscosity, strength and microstructural properties of cemented tailings backfill. Minerals 2018, 8, 352. [Google Scholar] [CrossRef] [Green Version]
  15. Mishra, P.; Mohanty, M. A review of factors affecting mining operation. World J. Eng. 2020, 17, 457–472. [Google Scholar] [CrossRef]
  16. Zhang, S.; Yang, L.; Ren, F.; Qiu, J.; Ding, H. Rheological and mechanical properties of cemented foam backfill: Effect of mineral admixture type and dosage. Cem. Concr. Compos. 2020, 112, 103689. [Google Scholar] [CrossRef]
  17. Na, H.; Lv, G.; Wang, L.; Liao, L.; Zhang, D.; Guo, L.; Li, W. A new expansion material used for roof-contacted filling based on smelting slag. Sci. Rep. 2021, 11, 2607. [Google Scholar] [CrossRef]
  18. Hefni, M.; Hassani, F. Experimental Development of a Novel Mine Backfill Material: Foam Mine Fill. Minerals 2020, 10, 564. [Google Scholar] [CrossRef]
  19. Qiu, J.; Guo, Z.; Li, L.; Zhang, S.; Zhao, Y.; Ma, Z. A Hybrid Artificial Intelligence Model for Predicting the Strength of Foam-Cemented Paste Backfill. IEEE Access 2020, 8, 84569–84583. [Google Scholar] [CrossRef]
  20. Chen, X.; Shi, X.; Zhou, J.; Chen, Q.; Yang, C. Feasibility of recycling ultrafine leaching residue by backfill: Experimental and CFD approaches. Minerals 2017, 7, 54. [Google Scholar] [CrossRef] [Green Version]
  21. Falayi, T.; Ntuli, F.; Okonta, F. Synthesis of a paste backfill geopolymer using pure acidic gold mine tailings. J. Solid Waste Technol. Manag. 2018, 44, 311–320. [Google Scholar] [CrossRef]
  22. Zhao, H.; Ma, F.; Zhang, Y.; Guo, J. Monitoring and mechanisms of ground deformation and ground fissures induced by cut-and-fill mining in the Jinchuan Mine 2, China. Environ. Earth Sci. 2013, 68, 1903–1911. [Google Scholar] [CrossRef]
  23. Zhang, S.; Yang, L.; Qiu, J.; Hou, C.; Guo, Z. Fluidity and strength behaviors of cemented foam backfill: Effect of particle size distribution and foaming agent dosage. Bull. Eng. Geol. Environ. 2021, 80, 3177–3191. [Google Scholar] [CrossRef]
  24. Hefni, M.; Hassani, F.; Nokken, M.; Kermani, M.; Vatne, D. Investigation into the development of foam mine fill. In Proceedings of the Eleventh International Symposium on Mining with Backfill, Perth, WA, Australia, 20–22 May 2014; pp. 49–59. [Google Scholar]
  25. Zhang, S.; Ren, F.; Guo, Z.; Qiu, J.; Ding, H. Strength and deformation behavior of cemented foam backfill in sub-zero environment. J. Mater. Res. Technol. 2020, 9, 9219–9231. [Google Scholar] [CrossRef]
  26. Qi, C.; Fourie, A.; Chen, Q.; Zhang, Q. A strength prediction model using artificial intelligence for recycling waste tailings as cemented paste backfill. J. Clean. Prod. 2018, 183, 566–578. [Google Scholar] [CrossRef]
  27. Yin, S.; Wu, A.; Hu, K.; Wang, Y.; Zhang, Y. The effect of solid components on the rheological and mechanical properties of cemented paste backfill. Miner. Eng. 2012, 35, 61–66. [Google Scholar] [CrossRef]
  28. Fall, M.; Adrien, D.; Célestin, J.C.; Pokharel, M.; Touré, M. Saturated hydraulic conductivity of cemented paste backfill. Miner. Eng. 2009, 22, 1307–1317. [Google Scholar] [CrossRef]
  29. Qiu, J.; Guo, Z.; Yang, L.; Jiang, H.; Zhao, Y. Effect of tailings fineness on flow, strength, ultrasonic and microstructure characteristics of cemented paste backfill. Constr. Build. Mater. 2020, 263, 120645. [Google Scholar] [CrossRef]
  30. Yılmaz, T.; Ercikdi, B.; Karaman, K.; Külekçi, G. Assessment of strength properties of cemented paste backfill by ultrasonic pulse velocity test. Ultrasonics 2014, 54, 1386–1394. [Google Scholar] [CrossRef] [PubMed]
  31. Yan, B.; Zhu, W.; Hou, C.; Yilmaz, E.; Saadat, M. Characterization of early age behavior of cemented paste backfill through the magnitude and frequency spectrum of ultrasonic P-wave. Constr. Build. Mater. 2020, 249, 118733. [Google Scholar] [CrossRef]
  32. Jiang, H.; Yi, H.; Yilmaz, E.; Liu, S.; Qiu, J. Ultrasonic evaluation of strength properties of cemented paste backfill: Effects of mineral admixture and curing temperature. Ultrasonics 2020, 100, 105983. [Google Scholar] [CrossRef]
  33. Xu, S.; Suorineni, F.T.; Li, K.; Li, Y. Evaluation of the strength and ultrasonic properties of foam-cemented paste backfill. Int. J. Min. Reclam. Environ. 2017, 31, 544–557. [Google Scholar] [CrossRef]
  34. Fall, M.; Belem, T.; Samb, S.; Benzaazoua, M. Experimental characterization of the stress-strain behaviour of cemented paste backfill in compression. J. Mater. Sci. 2007, 42, 3914–3922. [Google Scholar] [CrossRef]
  35. Qiu, J.; Yang, L.; Sun, X.; Xing, J.; Li, S. Strength characteristics and failure mechanism of cemented super-fine unclassified tailings backfill. Minerals 2017, 7, 58. [Google Scholar] [CrossRef] [Green Version]
  36. Sang, G.; Zhu, Y.; Yang, G.; Zhang, H. Preparation and characterization of high porosity cement-based foam material. Constr. Build. Mater. 2015, 91, 133–137. [Google Scholar] [CrossRef]
  37. Muhammad, N.; Adnan, M.S.; Yosuff, M.A.M.; Ahmad, K.A. A review of field methods for suspended and bedload sediment measurement. World J. Eng. 2019, 16, 147–165. [Google Scholar] [CrossRef]
  38. Liu, L.; Fang, Z.; Qi, C.; Zhang, B.; Guo, L.; Song, K.I.-I.L. Numerical study on the pipe flow characteristics of the cemented paste backfill slurry considering hydration effects. Powder Technol. 2019, 343, 454–464. [Google Scholar] [CrossRef]
  39. Jiang, H.; Qi, Z.; Yilmaz, E.; Han, J.; Qiu, J.; Dong, C. Effectiveness of alkali-activated slag as alternative binder on workability and early age compressive strength of cemented paste backfills. Constr. Build. Mater. 2019, 218, 689–700. [Google Scholar] [CrossRef]
  40. Liu, H.; Shi, J.; Qu, H.; Ding, D. An investigation on physical, mechanical, leaching and radiation shielding behaviors of barite concrete containing recycled cathode ray tube funnel glass aggregate. Constr. Build. Mater. 2019, 201, 818–827. [Google Scholar] [CrossRef]
  41. Jiang, H.; Han, J.; Li, Y.; Yilmaz, E.; Sun, Q.; Liu, J. Relationship between ultrasonic pulse velocity and uniaxial compressive strength for cemented paste backfill with alkali-activated slag. Nondestruct. Test. Eval. 2020, 35, 359–377. [Google Scholar] [CrossRef]
  42. Prayuda, H.; Monika, F.; Cahyati, M.D. Fresh properties and compressive strength of self compacting concrete with fines aggregate replacement using red brick powder and rice husk ash. World J. Eng. 2020, 17, 473–480. [Google Scholar] [CrossRef]
  43. Ramesh, M.; Deepa, C.; Arpitha, G.; Gopinath, V. Effect of hybridization on properties of hemp-carbon fibre-reinforced hybrid polymer composites using experimental and finite element analysis. World J. Eng. 2019, 16, 248–259. [Google Scholar] [CrossRef]
  44. Kumar, R.; Singh, R.; Kataria, R. Study on flexural performance of fabricated natural fiber hybrid polypropylene composite: An experimental investigation through designed experiments. World J. Eng. 2019, 16, 389–400. [Google Scholar] [CrossRef]
  45. Liu, Q.-S.; Zheng, T.; Wang, P.; Jiang, J.-P.; Li, N. Adsorption isotherm, kinetic and mechanism studies of some substituted phenols on activated carbon fibers. Chem. Eng. J. 2010, 157, 348–356. [Google Scholar] [CrossRef]
  46. Kwan, A.K.H.; McKinley, M. Effects of limestone fines on water film thickness, paste film thickness and performance of mortar. Powder Technol. 2014, 261, 33–41. [Google Scholar] [CrossRef]
  47. Kwan, A.K.H.; Chen, J.J. Adding fly ash microsphere to improve packing density, flowability and strength of cement paste. Powder Technol. 2013, 234, 19–25. [Google Scholar] [CrossRef]
  48. Liu, W.; Zhang, X. Study on volume stability of chemical foaming cement paste. KSCE J. Civ. Eng. 2017, 21, 2790–2797. [Google Scholar] [CrossRef]
  49. Ayub, T.; Khan, S.U.; Memon, F.A. Mechanical characteristics of hardened concrete with different mineral admixtures: A review. Sci. World J. 2014, 2014, 875082. [Google Scholar] [CrossRef]
  50. Cui, Y.; Wang, D.; Zhao, J.; Li, D.; Ng, S.; Rui, Y. Effect of calcium stearate based foam stabilizer on pore characteristics and thermal conductivity of geopolymer foam material. J. Build. Eng. 2018, 20, 21–29. [Google Scholar] [CrossRef]
  51. Zhang, Y.; Feyerabend, F.; Tang, S.; Hu, J.; Lu, X.; Blawert, C.; Lin, T. A study of degradation resistance and cytocompatibility of super-hydrophobic coating on magnesium. Mater. Sci. Eng. C 2017, 78, 405–412. [Google Scholar] [CrossRef]
  52. Li, L.G.; Kwan, A.K.H. Effects of superplasticizer type on packing density, water film thickness and flowability of cementitious paste. Constr. Build. Mater. 2015, 86, 113–119. [Google Scholar] [CrossRef]
  53. Yang, L.; Qiu, J.; Jiang, H.; Hu, S.; Li, H.; Li, S. Use of cemented super-fine unclassified tailings backfill for control of subsidence. Minerals 2017, 7, 216. [Google Scholar] [CrossRef] [Green Version]
  54. Panchal, S.; Deb, D.; Sreenivas, T. Variability in rheology of cemented paste backfill with hydration age, binder and superplasticizer dosages. Adv. Powder Technol. 2018, 29, 2211–2220. [Google Scholar] [CrossRef]
  55. Ouattara, D.; Yahia, A.; Mbonimpa, M.; Belem, T. Effects of superplasticizer on rheological properties of cemented paste backfills. Int. J. Miner. Process. 2017, 161, 28–40. [Google Scholar] [CrossRef]
  56. Fall, M.; Benzaazoua, M.; Ouellet, S. Experimental characterization of the influence of tailings fineness and density on the quality of cemented paste backfill. Miner. Eng. 2005, 18, 41–44. [Google Scholar] [CrossRef]
  57. Fall, M.; Benzaazoua, M.; Saa, E.G. Mix proportioning of underground cemented tailings backfill. Tunn. Undergr. Sp. Technol. 2008, 23, 80–90. [Google Scholar] [CrossRef]
  58. Li, J.; Yilmaz, E.; Cao, S. Influence of Solid Content, Cement/Tailings Ratio, and Curing Time on Rheology and Strength of Cemented Tailings Backfill. Minerals 2020, 10, 922. [Google Scholar] [CrossRef]
  59. Yang, L.; Xu, W.; Yilmaz, E.; Wang, Q.; Qiu, J. A combined experimental and numerical study on the triaxial and dynamic compression behavior of cemented tailings backfill. Eng. Struct. 2020, 219, 110957. [Google Scholar] [CrossRef]
  60. Ercikdi, B.; Kesimal, A.; Cihangir, F.; Deveci, H.; Alp, İ. Cemented paste backfill of sulphide-rich tailings: Importance of binder type and dosage. Cem. Concr. Compos. 2009, 31, 268–274. [Google Scholar] [CrossRef]
  61. Rahman, N.A.; Khairuddin, S.A.A.; Faudzi, M.F.; Asri, M.; Jamaluddin, N.; Jaini, Z. Axial strength of modified fibrous foamed concrete-filled hollow section. World J. Eng. 2019, 17, 175–181. [Google Scholar] [CrossRef]
  62. Duran, E.; Duran, B.U.; Akay, D.; Boran, F.E. Grey relational analysis between Turkey’s macroeconomic indicators and domestic savings. Grey Syst. Theory Appl. 2017, 7, 45–59. [Google Scholar] [CrossRef]
  63. Yingliang, Z.; Jingping, Q.; Zhengyu, M.A.; Zhenbang, G.; Hui, L. Effect of superfine blast furnace slags on the binary cement containing high-volume fly ash. Powder Technol. 2020. [Google Scholar] [CrossRef]
  64. Yilmaz, E.; Belem, T.; Bussière, B.; Mbonimpa, M.; Benzaazoua, M. Curing time effect on consolidation behaviour of cemented paste backfill containing different cement types and contents. Constr. Build. Mater. 2015, 75, 99–111. [Google Scholar] [CrossRef]
Figure 1. The application design of FCPB in mining (adapted from Ref. [23]).
Minerals 11 00681 g001
Figure 2. Particle size distribution of tailings.
Minerals 11 00681 g002
Figure 3. (a) Fresh and (b) hardened FCPB.
Minerals 11 00681 g003
Figure 4. Effect of thickening agent on the fluidity of FCPB slurry.
Minerals 11 00681 g004
Figure 5. Effect of thickening agent on UCS and apparent density of FCPB.
Minerals 11 00681 g005
Figure 6. Effect of foaming stabilizer on UCS and apparent density.
Minerals 11 00681 g006
Figure 7. Effect of foaming agent on expansion rate and fluidity of FCPB.
Minerals 11 00681 g007
Figure 8. Relationships between the CTR and UCS of FCPB: (a) T = 3 d, FC = 1.5%; (b) T = 7 d, FC = 1.5%; (c) T = 14 d, FC = 1.5%; (d) T = 28 d, FC = 1.5%; (e) T = 28 d, FC = 2%; (f) T = 28 d, FC = 2.5%; (g) T = 28 d, FC = 3%.
Minerals 11 00681 g008
Figure 9. Relationships between the SC and UCS of FCPB with various Ts and FCs. (a) T = 3 d, FC = 1.5%; (b) T = 7 d, FC = 1.5%; (c) T = 14 d, FC = 1.5%; (d) T = 28 d, FC = 1.5%; (e) T = 28 d, FC = 2%; (f) T = 28 d, FC = 2.5%; and (g) T = 28 d, FC = 3%.
Minerals 11 00681 g009
Figure 10. Relationships between T and the UCS of FCPB. (a) SC = 76%, FC = 1.5%; (b) SC = 74%, FC = 1.5%; (c) SC = 72%, FC = 1.5%; and (d) SC = 76%, CTR = 1:4.
Minerals 11 00681 g010
Figure 11. Relationships between FC and the UCS of FCPB. (a) CTR = 1:4, T = 28 d; (b) CTR = 1:6, T = 28 d; (c) CTR = 1:8, T = 28 d.
Minerals 11 00681 g011
Figure 12. Effects of (a) FC, (b) SC and (c) CTR on the UPV of FCPB.
Minerals 11 00681 g012
Figure 13. Relationships between UCS and UPV for (a) FCPB with various FCs (CTR = 1:4, SC = 76%) and (b) all FCPB samples.
Minerals 11 00681 g013
Table 1. Chemical compositions of tailings.
CompoundsSiO2Al2O3MgOFe2O3P2O5CaONa2OTiO2SO3
Content (%)64.45.654.2818.040.354.771.010.090.76
Table 2. Determination of optimal admixture contents.
GroupCTRSC (%)Thickening Agent (%)Foaming Stabilizer (%)Foaming Agent (%)
A1:476002
0.2
0.4
0.6
0.8
1
1.2
B760.60.12
0.3
0.5
0.7
0.9
C740.60.50
1
2
3
4
5
6
Table 3. Mix proportions of prepared FCPB samples.
CTRT (d)SC (%)FC (%)
1:43,7,14,28721.5,2,2.5,3
3,7,14,28741.5,2,2.5,3
3,7,14,28761.5,2,2.5,3
1:63,7,14,28721.5,2,2.5,3
3,7,14,28741.5,2,2.5,3
3,7,14,28761.5,2,2.5,3
1:83,7,14,28721.5,2,2.5,3
3,7,14,28741.5,2,2.5,3
3,7,14,28761.5,2,2.5,3
Publisher’s Note: MDPI stays neutral with regard to jurisdictional claims in published maps and institutional affiliations.

