1. Introduction
Calcium oxalate (CaC
2O
4·
xH
2O) at various hydration degrees is a naturally occurring biomineral found in fossils, plants, human urinary stones, and a byproduct of some industrial processes, such as those involving paper, food, and beverage production. Due to its importance in the biomedical field and cultural heritage preservation, calcium oxalate stability has been extensively investigated, mainly using thermogravimetric analysis, infrared, and Raman spectroscopies [
1,
2,
3,
4,
5,
6,
7,
8].
Calcium oxalate crystallizes in three hydrated forms: the monoclinic monohydrate (COM, CaC2O4·H2O; whewellite), the tetragonal dihydrate (COD, CaC2O4·(2 + x) H2O, x < 0.5; weddellite), and the triclinic trihydrate (COT, CaC2O4·xH2O, 2.5< x <3.0; caoxite). In addition, the anhydrous phase (COA) is obtained by dehydration of the former. Monohydrate thermal stability has been accurately studied along with the anhydrous phase.
Our previous papers [
9,
10] proposed a CO
2 capture/storage reaction, in which the ascorbic acid aqueous solution is used as a reducing agent of carbon dioxide to form oxalic acid. In the presence of calcium as the counterion, weddellite (COD) precipitates. The quality of weddellite crystals was investigated at room conditions by X-ray single-crystal diffraction experiments. COD samples exhibited a very high crystal quality, differing from each other only for the zeolitic water content, reflecting different precipitation paths as a function of the experimental setups.
The thermal behavior of weddellite crystals is crucial in assessing their carbon dioxide storage capacity, disposal, or, eventually, reuse in a circular economy perspective. COD could be considered a solid-state carbon dioxide reservoir, reducing storage and handling safety costs compared to compressed gas. Calcium oxalate can be a potential source of pure CO
2 and CaO, exploiting thermal degradation. CO
2 recovered from calcium oxalate may be used in standard applications, while homogeneous [
11,
12,
13,
14] calcium oxide powder can be employed as a reagent in the cement or ceramics industries.
Nevertheless, the literature reports a comparatively modest number of studies regarding the decomposition of oxalates using in-situ X-ray powder diffraction (XRPD), which is appropriate to provide a complete description and quantification of the crystalline phases appearing at different stages of the reaction.
In this framework, the present study combines
in-situ XRPD and thermal-gravimetric analysis (TGA) to explore the thermal evolution of COD crystals from carbon capture (setup B,
Figure S1 in the
Supplementary Materials), and the products of the thermal degradation. XRPD and TGA experiments were performed under an oxidant atmosphere and by applying heating conditions close to a large-scale treatment oven, where the use of a conditioned atmosphere would be economically unfavorable. The thermal degradation pathways explored by XRPD and TGA were compared, notwithstanding setup differences and unequal heat transfer rates.
1.1. Decomposition Pathways
Thermal degradation reactions of calcium oxalate (monohydrate) have been reported by several authors due to the interest in calcium oxalate as a standard for TGA calibration [
1,
4,
15,
16,
17,
18,
19,
20,
21]:
The first step (dehydration) represents an endothermic process both in the inert and oxidizing atmosphere, according to the reactions R1:
R2a is an endothermic reaction under inert conditions, but possibly exothermic in air or oxygen, and R3 is endothermic.
Additional reactions may occur in the reaction batch, simultaneously with R2a: disproportionation (R2b) and oxidation (R2c and R2d).
The disproportionation has been proposed [
8,
15,
17,
18,
19,
22] to explain the presence of both CO and CO
2 in the reaction batch:
The disproportionation reaction is considered a very slow process and neglected in many works dealing with calcium oxalate thermal decomposition [
16,
17,
19,
23]. CO, in turn, may coexist with CO
2 in the carbonate formation range of temperature.
The oxidation of CO to CO
2 may be related to the catalytic effect of some parts of the experimental setup (the platinum crucible, for instance [
1,
19,
23,
24,
25]):
The occurrence of free carbon is considered a side-effect typical of the decomposition of REE-oxalates [
1], or as a ubiquitous byproduct, even in calcium oxalate decomposition [
17,
19,
23].
1.2. Previous Kinetic Investigations
The kinetics of reactions R1, R2a, and R3 have been studied using thermogravimetric techniques working in static air atmosphere, vacuum, or sweeping gas fluxes both in an inert atmosphere and in air [
1,
2,
3,
4,
17,
26].
The kinetics of thermal degradation for reactions R1 and R3 strongly depend on the experimental conditions due to the reversibility of dehydration and decarbonation, whereas R2a is irreversible [
1,
17,
18]. Moreover, heat and mass counter-compensate their common variations, changing the decomposition temperatures and demonstrating the dependence of the degradation reactions on the transport mechanisms [
18].
The temperatures related to the maximum reaction rate (reactions R1, R2a, and R3) roughly range from 45 to 235 °C, from 250 to 550 °C, and from 550 to 850 °C, respectively, and depend on experimental aspects, such as the preparative routine, the environmental conditions, the heating rate, the presence and nature of the flowing gas, as well as the hydration state of the crystalline phase (COT, COD or COM) [
2,
4,
8,
16,
18,
19,
20]. Furthermore, heat and mass transfer in thermal analysis seriously affect the kinetics of the reactions and have become even more crucial for fast heating experiments. Low mass and slow heating rate experiments are generally considered free from artifacts due to heat and mass transfer [
27,
28], although this statement is not always fully satisfied [
18].
It has been demonstrated that the temperature of the maximum reaction rate increases according to the sequence flowing air/static air/flowing nitrogen [
15]. Dehydration is moderately affected by the nature of the atmosphere surrounding the sample.
TGA data analysis [
4,
16,
17,
18,
19] or quantum chemical prediction [
5] allow the determination of the activation energies of the processes involved in the thermal degradation of calcium oxalate. As with reaction temperatures, activation energies are strongly dependent on the size and shape of the crucible, heat and mass transfer (gas fluxes or vacuum), and the presence of some carbon as a byproduct, exerting a catalytic effect on the CO to CO
2 transformation. Lapidary, in 1980, Price et al. [
19] declared that “the selection of CaC
2O
4 as a “model” compound to show the applicability of a particular method of analyzing the kinetic data obtained in the vacuum cannot be justified”, questioning the activation energy resulting from thermogravimetric methods.
Almost all of the papers devoted to determining the thermal stability of oxalate are referred to as calcium oxalate monohydrate. Whewellite shows higher structural order than weddellite that contains loosely bonded zeolitic water molecules free to move in the channels [
7]. Accordingly, the transition temperatures are significantly higher for whewellite. The dehydration reaction of weddellite occurs at lower temperatures than whewellite, confirming the hypothesis of weakly bonded water molecules in the channels of weddellite [
7,
16,
29]. Fourier transform infrared spectroscopy (FTIR) experiments by Conti et al. [
6] at low temperatures (95 and 173 K) confirmed the different structural ordering of the two crystal phases and the presence of disordered zeolitic water in weddellite crystals, which results in the lower temperature of dehydration.
Furthermore, the relative storage humidity plays an essential role in the stability of weddellite crystals. It has been demonstrated that the transformation of whewellite in weddellite takes a few minutes when original whewellite crystals are immersed in water. As the humidity decreases, the time required to reach the stability increases [
6]. Nevertheless, this is of primary importance when considering the storage of calcium oxalates produced by carbon dioxide reduction.
Coupled TGA and XRPD experiments have been proposed by Izatulina et al. [
30,
31]. They investigated the thermal stability of natural (from renal stones) and synthetic COM in the “low” (−173 to +170 °C) and “high” (+25 to +150 °C) temperature ranges by
in situ XRPD experiments. A first transition to α-COA at 130° was observed. At 150 °C, the COM phase completely disappeared. A further transformation from α to β-COA starts at 310 °C and achieves completion at 340 °C. In agreement, from experiments [
16,
32] and quantum mechanical calculations, Zhao [
33] proposed four polymorphs of COA.
One additional transition from low temperature to high temperature whewellite was recognized between 55 and 75 °C [
22,
30]. Weddellite resulted in stable recordings of up to 140 °C. The transition from COD to COA occurs at a temperature of 150 °C, while the appearance of the COM phase is reported only after three heating cycles [
7]. The COA polymorph observed here matches the fourth polymorph by Zhao [
33]. As with COM, COD decomposes in three stages: 23–60 °C (decrease of the parameter
a and of the cell volume), 70–105 °C (a slight increase of the parameter
c due to the mechanical compression of the channels, and as a result of the zeolitic water release and almost isotropic thermal expansion), and 110–126 °C (the cell parameters plummet due to the general rearrangement of the structure, and as a result of the release of the framework water molecules), followed at 130 °C by the dehydration and transition to the α-COA phase that could be considered complete at 150 °C.
While the transformation of whewellite at room temperature and pressure is a reversible process leading to (and back from) α-COA, the transformation of COD is less straightforward and gives the monohydrate phase both at HT and RT. The reaction kinetics at room temperature are slow. At HT, the conversion into the monohydrate phase occurs at 140 and 150 °C, with complete conversion of COD into the α-COA phase.
Thermal degradation of calcium oxalate has been assessed by the
in-situ environmental SEM analysis, as well [
20]: the crystal morphology is preserved during reactions R1 and R2a, while after reaction R3, crystals are substituted by calcium oxide pseudomorphic on calcium oxalate, giving evidence of a recrystallization process.
3. Results
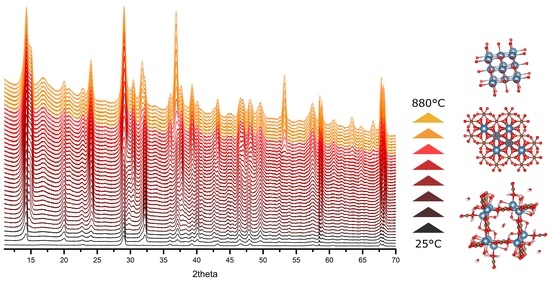
Figure 1 shows the results of
in-situ HT-XRPD experiments, heating weddellite according to Ramp#1, to investigate the correlation between solid-state phases stable within a temperature range and gases evolving from thermal degradation of calcium oxalate.
During the first two steps (26 and 45 °C), calcium oxalate dihydrate is the stable phase. The transition from COD to COA occurs between 45 and 250 °C and a COM fraction is not recorded. At 250 °C, weddellite is fully dehydrated, with COA identified as the sole crystalline phase. At 374 °C, some calcium carbonate (calcite) appears and at 419 °C it completely replaces COA. Calcium carbonate, in turn, is stable until the last-but-one step, at 550 °C, where the onset of the decarbonation reaction is detected. Calcium carbonate lasts up to 800 °C. Starting from this temperature only CaO occurs (Pt diffraction signal comes from the powder sample holder).
Ramp#2 represents an intermediate experiment intended to find the proper measurement conditions in terms of temperature. Details regarding Ramp#2 (actual temperature and related stable crystal phases) are given in
Table S1 and
Figure S2 of the
Supplementary Materials. Eventually, Ramp#3 (
Figure 2 and
Figure 3) was designed to detail the crystalline phase transitions.
The first transition between weddellite and whewellite approximately starts at 110 °C and achieves completion at 140 °C (
Figure 3). During this first transition, the weight loss recorded by TGA analysis is related to zeolitic water. Between 140 and 150 °C, in a very narrow T-range, the sole stable phase is the calcium oxalate monohydrate that undergoes further dehydration between 150 and 180 °C, losing the tightly bonded structural water. COA is stable up to 410 °C. The onset of the decarbonation reaction is detectable from 360 °C. In the range 410–680 °C, calcium carbonate is the unique stable phase, but at higher temperatures, it is progressively replaced by CaO. At the end of the reaction (800 °C), the final crystalline product is fine-grained pure lime, reusable in classical applications, such as cement or ceramics.
Of note, in any explored ramp, the Pt signal from the sample holder becomes visible due to the volume loss of the sample.
The quantitative analysis of the XRPD data was complemented with the unit cell volume evaluation for each crystalline phase formed. Data calculated are reported in
Figure S3. As expected, some thermal drift can be observed, but the overall values are constant for each crystalline phase.
The thermal decomposition of the sample was monitored in the temperature range between 70 and 900 °C (2 °C/min up to 250 °C and 15 °C/min from 250 to 900 °C) and shows three weight loss processes, as illustrated in
Figure 4.
The first process, which occurs between 70 and 200 °C (maximum rate at 136 °C), corresponds to a weight loss of 25.6% and is related to the evolution of both zeolitic and structural water. Ideally, the water lost during heating should represent 22% of the weight of the sample. Data from FTIR measurements (
Figure 5a–c) confirm that CO
2 is evolved during heating (
Figure 5c), even at low temperatures (119–255 °C), justifying the difference in weight loss. This faint evolution of CO
2 in the low-temperature range perfectly overlaps H
2O evolution and possibly represents the onset of the structural collapse of weddellite at low temperature (150 °C). This is possibly related to the stabilization of α-COA, as reported by Izatulina [
30,
31] and Zhao [
33], even if from the XRPD analysis, no COA, calcium carbonate or lime were detected in this temperature range, probably due to values below the detection limits. Therefore, this lower value must be cautiously considered the temperature limit for weddellite stability for storage purposes.
The two water release curves can be roughly recognized: the first, with a maximum at 152.8 °C; the second, with a maximum at 200.9 °C from FTIR data. This agrees with the literature [
17]. The FTIR profile of H
2O release (
Figure 5a) shows a double peak in the temperature range of 70—300 °C. The first maximum is at 135 °C, the second one at 206.6 °C (for the decomposition of the FTIR curves, please refer to the
Supplementary Materials section,
Figure S4). The two maxima correspond to the evolution of the zeolitic and structural water. In terms of solid phases, they correspond to the dehydration steps of the oxalate, from COD to COM and then to COA. The release of H
2O from the crystal structure continues up to approximately 300 °C. Structural H
2O and the second CO
2 evolution occur at almost the same temperature, indicating that calcium oxalate sets up to collapse at a lower temperature than expected (during the massive loss of carbon monoxide and dioxide reported in the literature), approximately at 150 °C.
The second weight-loss (21.6%) occurs in the range 390–550 °C, with a maximum value at 490 °C. During this step, both CO and CO
2 (
Figure 5b,c) are released according to the literature [
1,
17,
21]. In agreement with the stoichiometric calculation, CO would lead to a weight loss of 17%, the difference with the actual is attributed to some CO
2 that evolved during the heating, as confirmed by FTIR measurements (
Figure 5b). The maximum release temperature for CO
2 and CO are at 492.6 and 488.1 °C, respectively.
A third remarkable weight loss (31.3% b) occurs between 550 and 800 °C. A split-Voigt function was used to simulate the asymmetry of experimental peaks. The maximum release of CO2 occurs at a temperature of about 767 °C. Immediately beyond the maximum release temperature, CO2 drops, indicating the completion of the degradation reactions of calcium oxalate, in full agreement with diffraction data. According to the literature, the CO2 release may account for a weight loss of 27%. The difference is attributed to a partial superimposition of the second and third steps due to the relatively high heating rate.
This last decomposition reaction kinetics is clearly affected by the comparatively slow removal of gases due to oxalate decomposition from the HT-chamber. The asymmetric peak related to the evolved CO2 develops slowly compared to the previous decomposition steps. The asymmetry could reflect a forward-backward reaction due to the reaction chamber’s high CO2 and calcium oxide substrate activities, related to lingering volatile species (Topley-Smith effect). It is worth recalling that the heat and mass flow compensate for mutual fluctuations.
In
Figure 6 and the related
Table S3 of
Supplementary Materials, the temperatures related to the three degradation reactions of weddellite revealed by XRPD (appearance and disappearance of the crystalline phases) and DTG (gas evolution) are summarized and compared. The transition temperature ranges agree with those from the literature [
7,
17].
HT-XRPD and TGA experiments provide coherent descriptions of zeolitic and structural water release. The DTG peak related to water release overlaps the temperature range of the transition COD → COM → COA, not providing an accurate characterization via thermal-gravimetric analysis. We stress that, in TGA, a 2 °C/min ramp was chosen to emphasize the double water loss. In contrast, in HT-XRPD, we recorded patterns at narrow temperature intervals to follow the transformation of the solid phases from weddellite to whewellite and then to the anhydrous phases. Although a general shift to higher temperature occurs owing to heat and mass transfer related effects, the releases of volatile phases can be undoubtedly associated with the stabilization of the crystalline phases recorded by XRPD, following the sequence:
where
x is equal to 2 (weddellite to whewellite; zeolitic water loss) or 1 (whewellite to anhydrous Ca-oxalate; structural water loss);
corresponding to the transition from anhydrous Ca-oxalate to calcite (first decarbonation reaction), accompanied by carbon monoxide and dioxide release and not, as suggested in some literature [
1,
8,
20,
35], by carbon monoxide production only. In these circumstances, CO oxidation should be catalyzed to obtain pure and reusable CO
2. However, the methods, to our knowledge, involve fine metal oxide powders (ZnO, for instance) and may induce pyrophoric effects. As an alternative, gas separation should be provided for obtaining a pure CO
2 or CO gas flux.
In an oxidant atmosphere, reactions R2c and R2d are the most likely to explain the presence of carbon dioxide;
corresponding to the calcite to lime reaction (second decarbonation reaction).
Activation energies for the processes have been evaluated using the Coats-Redfern integral method [
36,
37,
38,
39] derived for non-reversible reactions at non-isothermal conditions (
Figure S5,
Supplementary Materials). The results of the analysis are reported in
Table 1, along with the order of the reaction estimated on the basis of the least-square fitting agreement between the model and observations, as described by Sukarni [
36]. Moreover, in CO
2 production, we classified the reaction mechanism following the method described by Dollimore [
26,
40]. However, our evaluation does not claim to be absolute: the Coats-Redfern approach is hardly suitable for the determination of reaction mechanisms and correct kinetic analysis of a single experimental curve requires an a priori knowledge of the true activation energy [
41,
42].
The magnitude of the activation energy values inferred here is comparable to those found in the literature [
5,
18,
19,
37]. The occurring discrepancies are attributed to the experimental setup differences in heat and mass transfer, sample particle size, and catalytic effects of the impurities present in the system.
Thermal degradation of weddellite occurs through multi-step transformations. Some overlapping of the processes occurs in water release reactions (first and second release are not fully separated), in CO2 release reactions at low temperature, and in the combined CO—CO2 evolution, wherein the maximum release rates of CO and CO2 occur at 488 and 492.6 °C, respectively. All of these overlapping processes may affect the evaluation of the activation energies of a single process. As an example, the second water release shows a negative activation energy value. This negative value is probably due to the double interference effects of first water release and CO2 feeble release at low temperature on the second water release process. At the same time, we know that this reaction corresponds to the structural water loss, which seems unlikely to be a barrierless reaction.
A comparison of TGA results with HT-XRPD reveals a temperature shift towards higher values in the former, confirming the severe dependence of the kinetics of the reactions on the heat transfer rate and, in general, on the experimental setup.
To summarize, the feasibility of CO2 long-term storage in crystalline oxalate stable at room temperature and pressure has been proven on microcrystalline weddellite samples from the CO2 capture green reaction in a circular economy perspective. Even if a direct comparison of TGA and XRPD results confirms the severe dependence of the reactions’ kinetics on the heat transfer rate and, in general, on the experimental setup, as expected from the literature, we demonstrated that during heating, calcium oxalate may release some CO2 at relatively low temperature (150 °C). This must be considered the higher storage temperature for calcium oxalate to avoid the release of CO2 back to the environment. With the exception of this faint loss of carbonate, COA guarantees that the mass of CO2 is safely stored until the first decarbonation temperature is reached and a CO + CO2 mixture is produced. At this step, a gas separation is required to decouple pure CO2 from CO. Then, starting from the onset of the second decarbonation reaction (550 °C for the setup tested), pure CO2 can be safely retrieved from COA, leaving a crystalline calcium oxide ready for further technological applications. During the pure carbon dioxide release, starting at 550 °C, the CO2 peak rises slowly and asymmetrically due to the presence of lingering volatile species in the reaction chamber (Topley-Smith effect). The asymmetry reflects a forward-backward reaction due to the high activities of both carbon dioxide and calcium oxide substrate in the reaction chamber.


 ,
, 


