Article

Local Structure and Protons in Non-Stoichiometric Pseudo-Cubic Pollucite Mineral by Multinuclear NMR

by
Luis Sánchez-Muñoz
1,
José-Ignacio Santos
2,
William B. Simmons
3 and
Pierre Florian
4,*
1
Museo Nacional de Ciencias Naturales (CSIC), José Gutierrez Abascal, 2, 28006 Madrid, Spain
2
NMR Facility, SGIker, Universidad del País Vasco, UPV/EHU, 20018 San Sebastián, Spain
3
Department of Earth and Environmental Science, University of New Orleans, 2000 Lakeshore Drive, New Orleans, LA 70148, USA
4
Centre National de La Recherche Scientifique (CNRS), UPR3079 CEMHTI, Université d’Orléans, 1D Av. Recherche Scientifique, CEDEX 2, 45071 Orléans, France
*
Author to whom correspondence should be addressed.
Minerals 2022, 12(10), 1181; https://doi.org/10.3390/min12101181
Submission received: 9 June 2022 / Revised: 1 September 2022 / Accepted: 2 September 2022 / Published: 20 September 2022
(This article belongs to the Special Issue NMR Spectroscopy in Mineralogy and Crystal Structures)

Abstract

:
The pollucite structure is considered as a candidate ceramic crystalline matrix for the ceramic immobilization and long-term storage of 135Cs and 137Cs fission products, and thus, their structural characteristics have particular importance. However, its local structure has not been fully resolved from reciprocal-space techniques and infrared spectroscopy, and important discrepancies exist in the available literature. Two birefringent and non-stoichiometric pollucite specimens from Tanco pegmatite (Cs0.83Na0.20Al1.13Si2.56O6) and from Mt. Mica pegmatite (Cs0.94Na018Al1.23Si2.78O6), with powder X-ray diffraction patterns fully consistent with the cubic Ia-3d space-group symmetry, and with a very different degree of hydrothermal alteration, were used in this work. High-resolution magic-angle spinning multinuclear magnetic resonance (MAS NMR) spectroscopy, including 29Si, 27Al, 23Na, 133Cs, and 1H spectra at 9.4 T, as well as 1H, 27Al, 27Al{1H} dipolar evolutions and 27Al{29Si} Heteronuclear Multiple Quantum Coherence (HMCQ) spectra at 17.6 T, has been used to investigate the local structure of pollucite and the role of protons. The 29Si spectra suggest a local structure with a disordered Si/Al distribution in only one tetrahedral T site, but with a preference of Si atoms for Q41 (3Si,1Al) and Q42 (2Si,2Al) environments, in comparison with random and Loewenstein distributions, due to charge dispersion effects. However, the 27Al{1H} dipolar evolutions suggest two spectroscopically distinct T sites for Al atoms. The 23Na and 133Cs spectra indicate broad site distributions for these cavity cations. The anisotropic character of the long-range disordered pollucite structure, with a pseudo-cubic symmetry and lack of strict periodicity, can be explained from an incipient displacive transition to lower symmetry. These pollucite specimens are essentially anhydrous minerals despite the 1H and the cross-polarization experiments suggesting that some protons exist in the structure as -OH groups, whereas water molecules were only found in relation to the phyllosilicate impurities from alteration in specimen Tanco and perhaps also as liquid water in fluid inclusions.

1. Introduction

The mineral species of pollucite, (Cs,Na)[AlSi2O6]·nH2O, where (Cs + n) = 1, is considered a Cs-rich “zeolite” mineral of the analcime structure-type with cubic Ia-3d symmetry according to the International Mineralogical Association [1]. The understanding of the crystal structure of pollucite is particularly important because of the interest in the field of nuclear technology as a possible matrix from the immobilization and long-term storage of 135Cs and 137Cs products of nuclear fission. In this application, it is critical to know the hydrogen speciation in order to understand the structural stability and mobility of the cavity cations, i.e. the Cs atoms. It is quite obvious that an open porous structure with zeolitic water cannot be used in this industry. Thus, the local structure of hydrogen atoms in pollucite minerals must be analyzed in detail.
It has been suggested for pollucite the space group Ia-3d, assuming that pollucite and analcime were analogous structures, despite Cs atoms being located at 16b positions instead of the 24c positions [2], a site where the Na atoms in solid solution have been placed [3]. Using infrared spectroscopy, a different chemical formula for pollucite has been recommended as Cs(1−x)NaxAlSi2O6·xH2O with x~0.3, where the Na atoms and H2O molecules occupy the same site than Cs atoms, but probably displaced from the center of the cavity [4]. A similar model in which the analcime framework NaAlSi2O6·(H2O) was attributed to pollucite CsxNayAlx+ySi48−x−yO96·(16 − x)H2O (in which 2y ≥ 16 − x ≥ y), using specimens with Na2O between 1.59 and 4.34 wt.%, is available in literature [5]. In this model, Cs atoms are at 16b sites, the water molecules occupy the large voids of this same set that are not occupied by the Cs, and Na atoms are at 24c sites in the positions between the water molecules. Recent models have considered isotropic as well as anisotropic (birefringent) types of pollucite from the optical properties, the first one with cubic Ia-3d symmetry and the second one with tetragonal I41/acd space group symmetry having two tetrahedral sites for Si and Al atoms, one site for Cs atoms, one site for Na atoms and three sites for oxygen atoms, as well as the water molecules at the cavity sites [6]. An additional model has been derived from a Cs-substituted leucite having three T sites for Si and Al atoms and one cavity site for Cs atoms with a tetrahedral symmetry in the I41/a space group, by using high-resolution neutron powder diffraction [7].
Figure 1a shows a lattice model of pollucite structure with cubic Ia-3d symmetry at room temperature from recent single-crystal X-ray and neutron diffraction [8]. This lattice model consists of framework sites formed by Si and Al atoms in a single tetrahedral T site with a disordered Si/Al distribution. Thus, ten different medium-range atomic organizations can potentially be formed for each Si and Al atoms surrounded by other 0 to 4 Si and Al atoms (Figure 1b). A quantitative estimation of the different structural possibilities, to evaluate the order-disorder degree, cannot be done by reciprocal-space techniques. Figure 1a shows Cs atoms also at a single 16b cavity site, whereas Na atoms are located in a 24c position, as already suggested [5]. The analysis of the difference-Fourier maps of the nuclear density suggests the presence of extra-framework water molecules with oxygen sharing the Cs site, having extremely weak hydrogen bonds on the basis of atomic distances and bond angles [8]. However, Yanase et al. (1997) [9] ignored the structural role of water molecules, as it is known that pollucite does not show any loss of weight below 573 K [10] and dehydration appears at 913 K [11]. The relationship between the dehydration’s temperature and water is an important datum, because zeolitic (molecular) water is lost between 100 and 150 °C, whereas protons as an OH group resist in most cases up to temperatures higher than 450 °C. Thus, the structural role of water molecules from reciprocal-space techniques and infrared spectroscopy in pollucite still remains highly enigmatic.
Available NMR studies of pollucite structure have shown that synthetic samples [12] have a broader spectra than that of natural specimens [13], suggesting higher local disorder in the former. A 29Si NMR spectrum in cesian analcime showed only four resonances at −91, −96, −101 and −106 ppm [14], but the line intensities were not interpreted in detail. Ordered Cs leucite has been prepared by Cs- for K-exchange of a leucite precursor, but a monoclinic P2/a space group has been found [15]. In all of these studies, the role of protons in the crystal structure at the local scale in these tectosilicates has not been studied by NMR. In this work, we address the study of two natural mineral specimens, with contrasting degrees of alteration, to resolve the local structure and role of H atoms of pollucite by means of multinuclear NMR analysis at 9.4 and 17.6 T. Due to the different degree of alteration, it was possible to identify the role of -OH groups and of H2O molecules in the specimens, and the real features of the mineral structures.

2. Materials and Methods

2.1. Specimens

Two specimens of pollucite have been selected for this work. Specimen Tanco is a rock-forming mineral from the Tanco pegmatite in Manitoba, Canada. It is a white and opaque sample that shows turbidity and alteration along fractures when observed by optical microscopy, similar to most other pollucite specimens with some alteration to kaolinite and muscovite low-crystallinity products, as it is well known in literature [16]. In the case of the pollucite from Tanco, the alteration has been described as the product of low-temperature hydrothermal fluids at the deuteric stage, giving rise to the formation of veinlets with kaolinite, montmorillonite-illite mixed-later sequences, lepidolite, smectite minerals, and other anhydrous minerals [17,18]. However, specimen Mt. Mica is a singular sample of pollucite as a pristine sample from a pocket of the Mt. Mica pegmatite in Maine, USA. It is a fully transparent specimen without any transformation to secondary minerals and with a lower Na2O content in comparison with most other natural specimens of pollucite in which crystal-structure determinations have been performed. The two specimens are birefringent when examined in a polariscope and also in thin sections by optical microscopy, i.e., their birefringent character is “anomalous” or unexpected if a cubic symmetry or isotropic crystal structure is a priori accepted.

2.2. Chemical Analysis

Spatially resolved quantitative chemical analysis of major elements Si, Al, Na, and Cs were obtained by electron microprobe analysis (EMPA), using point counting technique to obtain information on the chemical homogeneity, with a JEOL-8900M electron-microprobe from ICTS Microscopía Centro de Asistencia a la Investigación de la Universidad Complutense de Madrid, CNME ELECMI—Centro Nacional de Microscopía Electrónica, (Spain). The spot diameter of the probe was circa 2 μm and the final operating conditions were 15 kV and 25 nA. These experimental conditions were first used for the chemical quantification of minerals standards, including albite NaAlSi3O8 in a specimen close to the strict stoichiometry, and no alkali migration nor specimen degradation was detected. The wt.% contents of FeO, MnO, MgO, CaO and TiO2 were also measured, but in all cases these values are below or close to the real detection limit of this technique.

2.3. Powder X-ray Diffraction (XRD)

The two specimens were ground to a particle size of less than 10 microns and were studied by powder XRD patterns using a Bruker D8 Advance instrument from Instituto de Cerámica y Vidrio, (ICV-CSIC, Madrid, Spain) with CuKα1 radiation at 30 kV and 25 mA, step 0.01° and step time of 92 s, with 2θ between 5° and 60°. The two XRD patterns were compared with the calculated powder XRD after structural determinations from neutron and X-ray diffraction studies with available lattice models by using the cc files of the of the ICSD database (https://icsd.fiz-karlsruhe.de/, accessed on 25 February 2022). The X-ray diffraction (XRD) patterns of the two specimens are fully consistent with a cubic symmetry as in Collection Code CC 84321 [9], in the ICSD (Inorganic Crystal Structure Database) database, as will be studied later in detail.

2.4. Nuclear Magnetic Resonance (NMR)

High-resolution 29Si, 27Al, 23Na, 133Cs and 1H magic-angle spinning (MAS) NMR spectra were recorded at 9.4 T magnetic field, by spinning the sample at the magic-angle (54°44′) at νr = 10 kHz, in a Bruker AVANCE III spectrometer in the NMR Facility, SGIker, Universidad del País Vasco, UPV/EHU San Sebastián, Spain. Larmor frequencies were 400.17 MHz, 52.48 MHz, 105.85 MHz, 104.27 MHz and 79.49 MHz for 1H, 133Cs, 23Na, 27Al and 29Si nuclei, respectively. The samples were spun at range 14 kHz at 9.4 T. π/2 (4 μs) and π/8 (2 μs) pulses were used to record Si and Al or Na and Cs signals. A recycle delay of 10 s was used in 27Al NMR signal and 133Cs NMR spectra. A recycle delay of 1s was used in 23Na NMR. An 1800 s recycle delay time was used for 29Si to avoid saturation effects. The cross-polarization experiments (CP-MAS) were performed by using {1H}27Al CP-MAS, {1H}29Si CP-MAS NMR and {1H}23Na CP-MAS spectra were recorded with a 4 mm MASDVT TRIPLE Resonance HYX MAS probe, at νr = 14 kHz. Relaxation delay was 5 s for 27Al CP-MAS, and 3 s for 23Na CP-MAS and 29Si CP-MAS. The number of scans was 16k, 4k and 24k, respectively. The contact time for the 29Si CP-MAS spectra in specimen Tanco was from 8 ms to 2 ms by using 34,816 scans. However, after 73,728 scans at 1 ms in this specimen, the 29Si spectrum (not shown in figures) was still too noisy, despite the Q3 and Q4 signal being resolved. Specimen Mt. Mica was studied in 29Si CP experiments from 8 ms to 1 ms of contact time, with a reasonable signal-to-noise ratio in all cases. Variable amplitude polarization transfer was achieved with a contact time from 0.5 to 4 ms for 27Al CP-MAS in specimen Tanco, but only 4 ms for specimen Mt. Mica. A contact time of 8 ms was used for the 23Na CP-MAS spectra of the two specimens with 10,240 scans, whereas 7 ms were employed for the 133Cs CP-MAS spectra with 10,240 scans. High-power SPINAL 64 heteronuclear proton decoupling was applied during acquisition. Tetramethylsilane, Al(H2O)63+ and 1 M NaCl aqueous solutions were used as external references at room temperature. 1H MAS NMR spectra were recorded with 64 transients with a recycle interval of 2 s. H2O was used as external secondary reference. The estimated uncertainties in the measured chemical shift of the NMR components was approximately 1 ppm for the 29Si and 27Al spectra, 3 ppm for the 23Na spectra, 5 ppm for the 133Cs spectra, and 0.1 ppm for the 1H spectra at 9.4 T. These figures are higher for the noisy CP-MAS spectra. The 29Si signals (I = 1/2) were analyzed by comparison of experimental curves with simulated profiles using Gaussian components for the different chemical environments, with different but similar linewidths as there is not a physical basis for assigning identical linewidths to different chemical environments in the simulation of a single spectrum.
Rotational Echo Double Resonance (REDOR) 27Al{1H} experiments and 27Al{29Si} HMQC experiment were performed in the laboratory of Conditions Extrêmes et Materiaux: Haute Température et Irradiation CEMHTI—CNRS at Orléans in France. REDOR H-Al experiments were performed on a 17.6 T (750 MHz) Bruker Avance III spectrometer with MAS at νr = 14 kHz. The NMR parameters of the different sites were measured on the most intense signal (first slice of S0) and only amplitudes have been further varied to fit the whole REDOR evolution, reported as a function of time delay in ms. See Magnenet et al. (2000) [19] for additional detailed experimental information about the 27Al{1H} dipolar evolution experiments, and Florian et al. (2012) [20] for details about the 27Al{29Si} HMQC experiment at 17.6 T. Spectra were fitted by using Bruker WINFIT software and DM2011 [21].

3. Results

3.1. Electron Microprobe Analysis (EMPA)

Table 1 shows the chemical composition of pollucite in specimen Tanco and Figure 2 gathers the sites of the chemical analysis as well as the effects of low-temperature hydrothermal alteration with a veinlet filled with hydrated unidentified hydrated aluminosilicate minerals. From these analyses, the chemical composition of this specimen is clearly a non-stoichiometric compound with an average Cs0.83Na0.20Al1.13Si2.56O6 composition. Cerný and Simpson [17] have published analyses in samples of pollucite from this particular locality with a Si/Al ratio about 2.39–2.58, higher than the average values of ~2.26 we have found (Table 1). H2O+ values of about 1.37–2.11 and H2O values circa 0.04–0.08 indicate that most water is lost at temperatures lower than 100 °C from liquid water [17].
Pristine areas of pollucite, far from veinlets and far from regions with a high microporosity, due to water-rich fluid circulation, alteration and precipitation of new minerals, have a Cs content of about ~34 wt.% Cs2O, but areas side by side of these alterations can reach values up to ~39 wt.% Cs2O. Three types of secondary minerals have been found, one with a Si/Al ratio close to 2, the other two with a Si/Al ratio closer to 3, which could be hydrated minerals as total oxide in recorded analysis is lower than ~96 wt.%.
Table 2 exhibits the chemical composition of specimen Mt. Mica, which is free of alteration and thus has a more homogeneous chemical composition than the other studied specimen, as Cs0.94Na018Al1.23Si2.78O6. It shows a higher Cs content with ~36.5 wt.% Cs2O, but a similar Si/Al ratio with an average value of ~2.31, and hence a similar value to that found in specimen Tanco, indicating also a non-stoichiometric compound.
Note the absence of K in our pollucite specimens at the EMPA sensitivity, suggesting these atoms are not easily bonded in this particular open framework. However, Na atoms were also allocated in the cavity sites of the pollucite structure, having a higher content in specimen Tanco than in specimen Mt. Mica.

3.2. Powder XRD Patterns

Figure 3 exhibits a comparison between the experimental powder XRD patterns of the two used specimens and some alternative calculated powder XRD patterns from suggested space groups in literature for the pollucite structure. Figure 3a shows the pattern from the cubic Ia-3d space-group lattice model, with one T site (48 g) occupied by both Si and Al atoms, for a specimen with CsAlSi2O6 chemical formula, with most of the (hkl) peaks from file CC 84321 [9]. Figure 3b shows the small change of the powder pattern after the cubic-tetragonal phase transition to I41/acd space group, which is mainly observed in the splitting of the (008) peak into (008) and (080) peaks, as shown by file CC 84322 [9]. In this model, one T site (16f) is suggested for Al atoms and one T site (32g) was found for Si atoms. A different tetragonal lattice model, with I41/a space-group symmetry, has been suggested by using a CsAlSi2O6 composition from a Cs-substituted leucite, where the contrast with the tetragonal symmetry is manifested by optic instability [7], i.e., by optical birefringence absent in an isotropic structure, as file CC 66921 in the ICSD database. Important differences appear in the powder XRD pattern in comparison with the I41/acd model, including the emergence of a (101) peak at 2θ = 9.1°, other peaks with low intensity as (222) at 2θ = 22.5°, (303) at 2θ = 27.7°, and some additional peaks with very low intensity mainly at 2θ between 42° and 49° (marked with a green square), as well as some peak broadening related with the phase transition (marked with * in Figure 3c), including a sharp splitting for the (008) diffraction into the (008) and (080) reflections. This particular lattice model involves three T sites (16f) occupied by both Si and Al atoms in a 2/1 ratio, to satisfy the chemical stoichiometry of the mineral formula. The XRD pattern of specimen Tanco is fully compatible with the Ia-3d model, despite a small diffraction at ~27.7° that could be interpreted as diffraction from the (303) in the I41/a model. However, the (101) and (222) signals, of the tetragonal structure, were not recorded in this specimen. No peak splitting was found in the (008) reflection. Some additional peaks due to impurities (red squares in Figure 3) were resolved from mineral phases that were not identified.
The XRD pattern of specimen Mt. Mica was also fully compatible with the cubic Ia-3d model, as the characteristic diffractions of the two tetragonal models were not recorded. The diffraction peak for the (008) plane is very fine without any indication of peak splitting or broadening. No impurities were detected in this specimen.
From this data no indication of lowering of symmetry from the cubic symmetry is detected by conventional powder XRD methods, and thus only one T site for Si and Al atoms and one cavity M site for Cs atoms were expected in the NMR spectra, as well as some other additional signals from impurities in specimen Tanco.

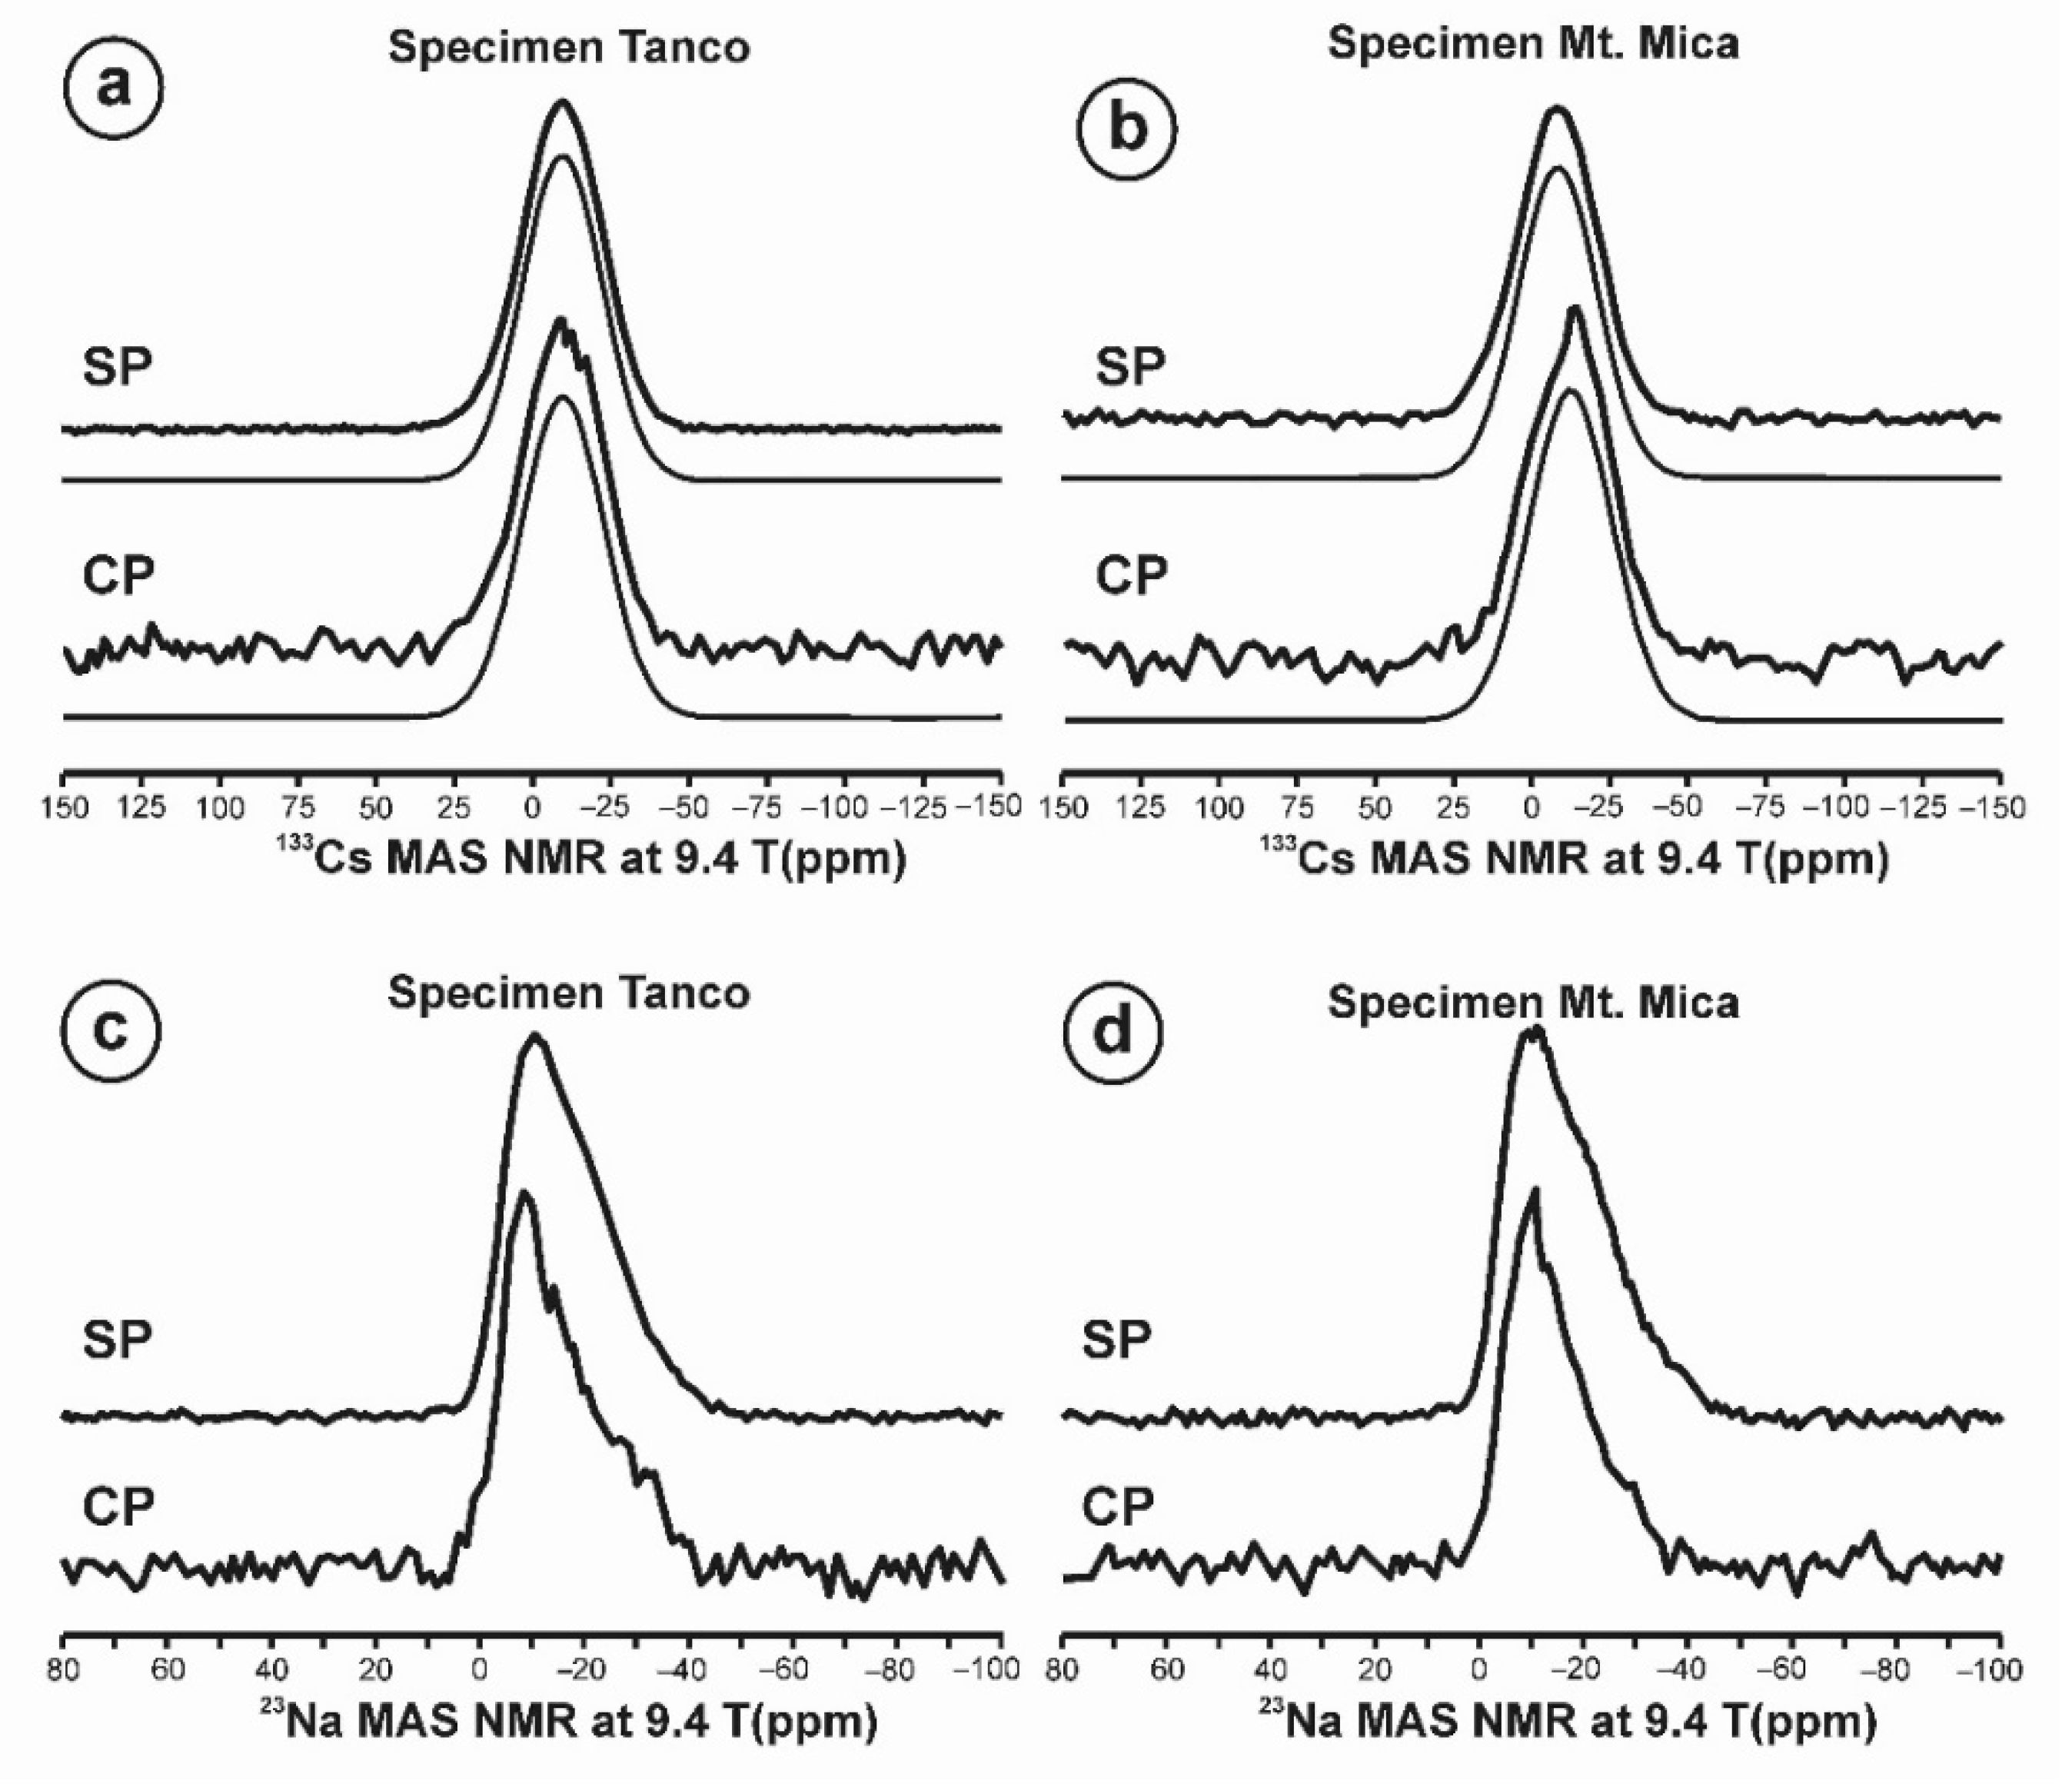
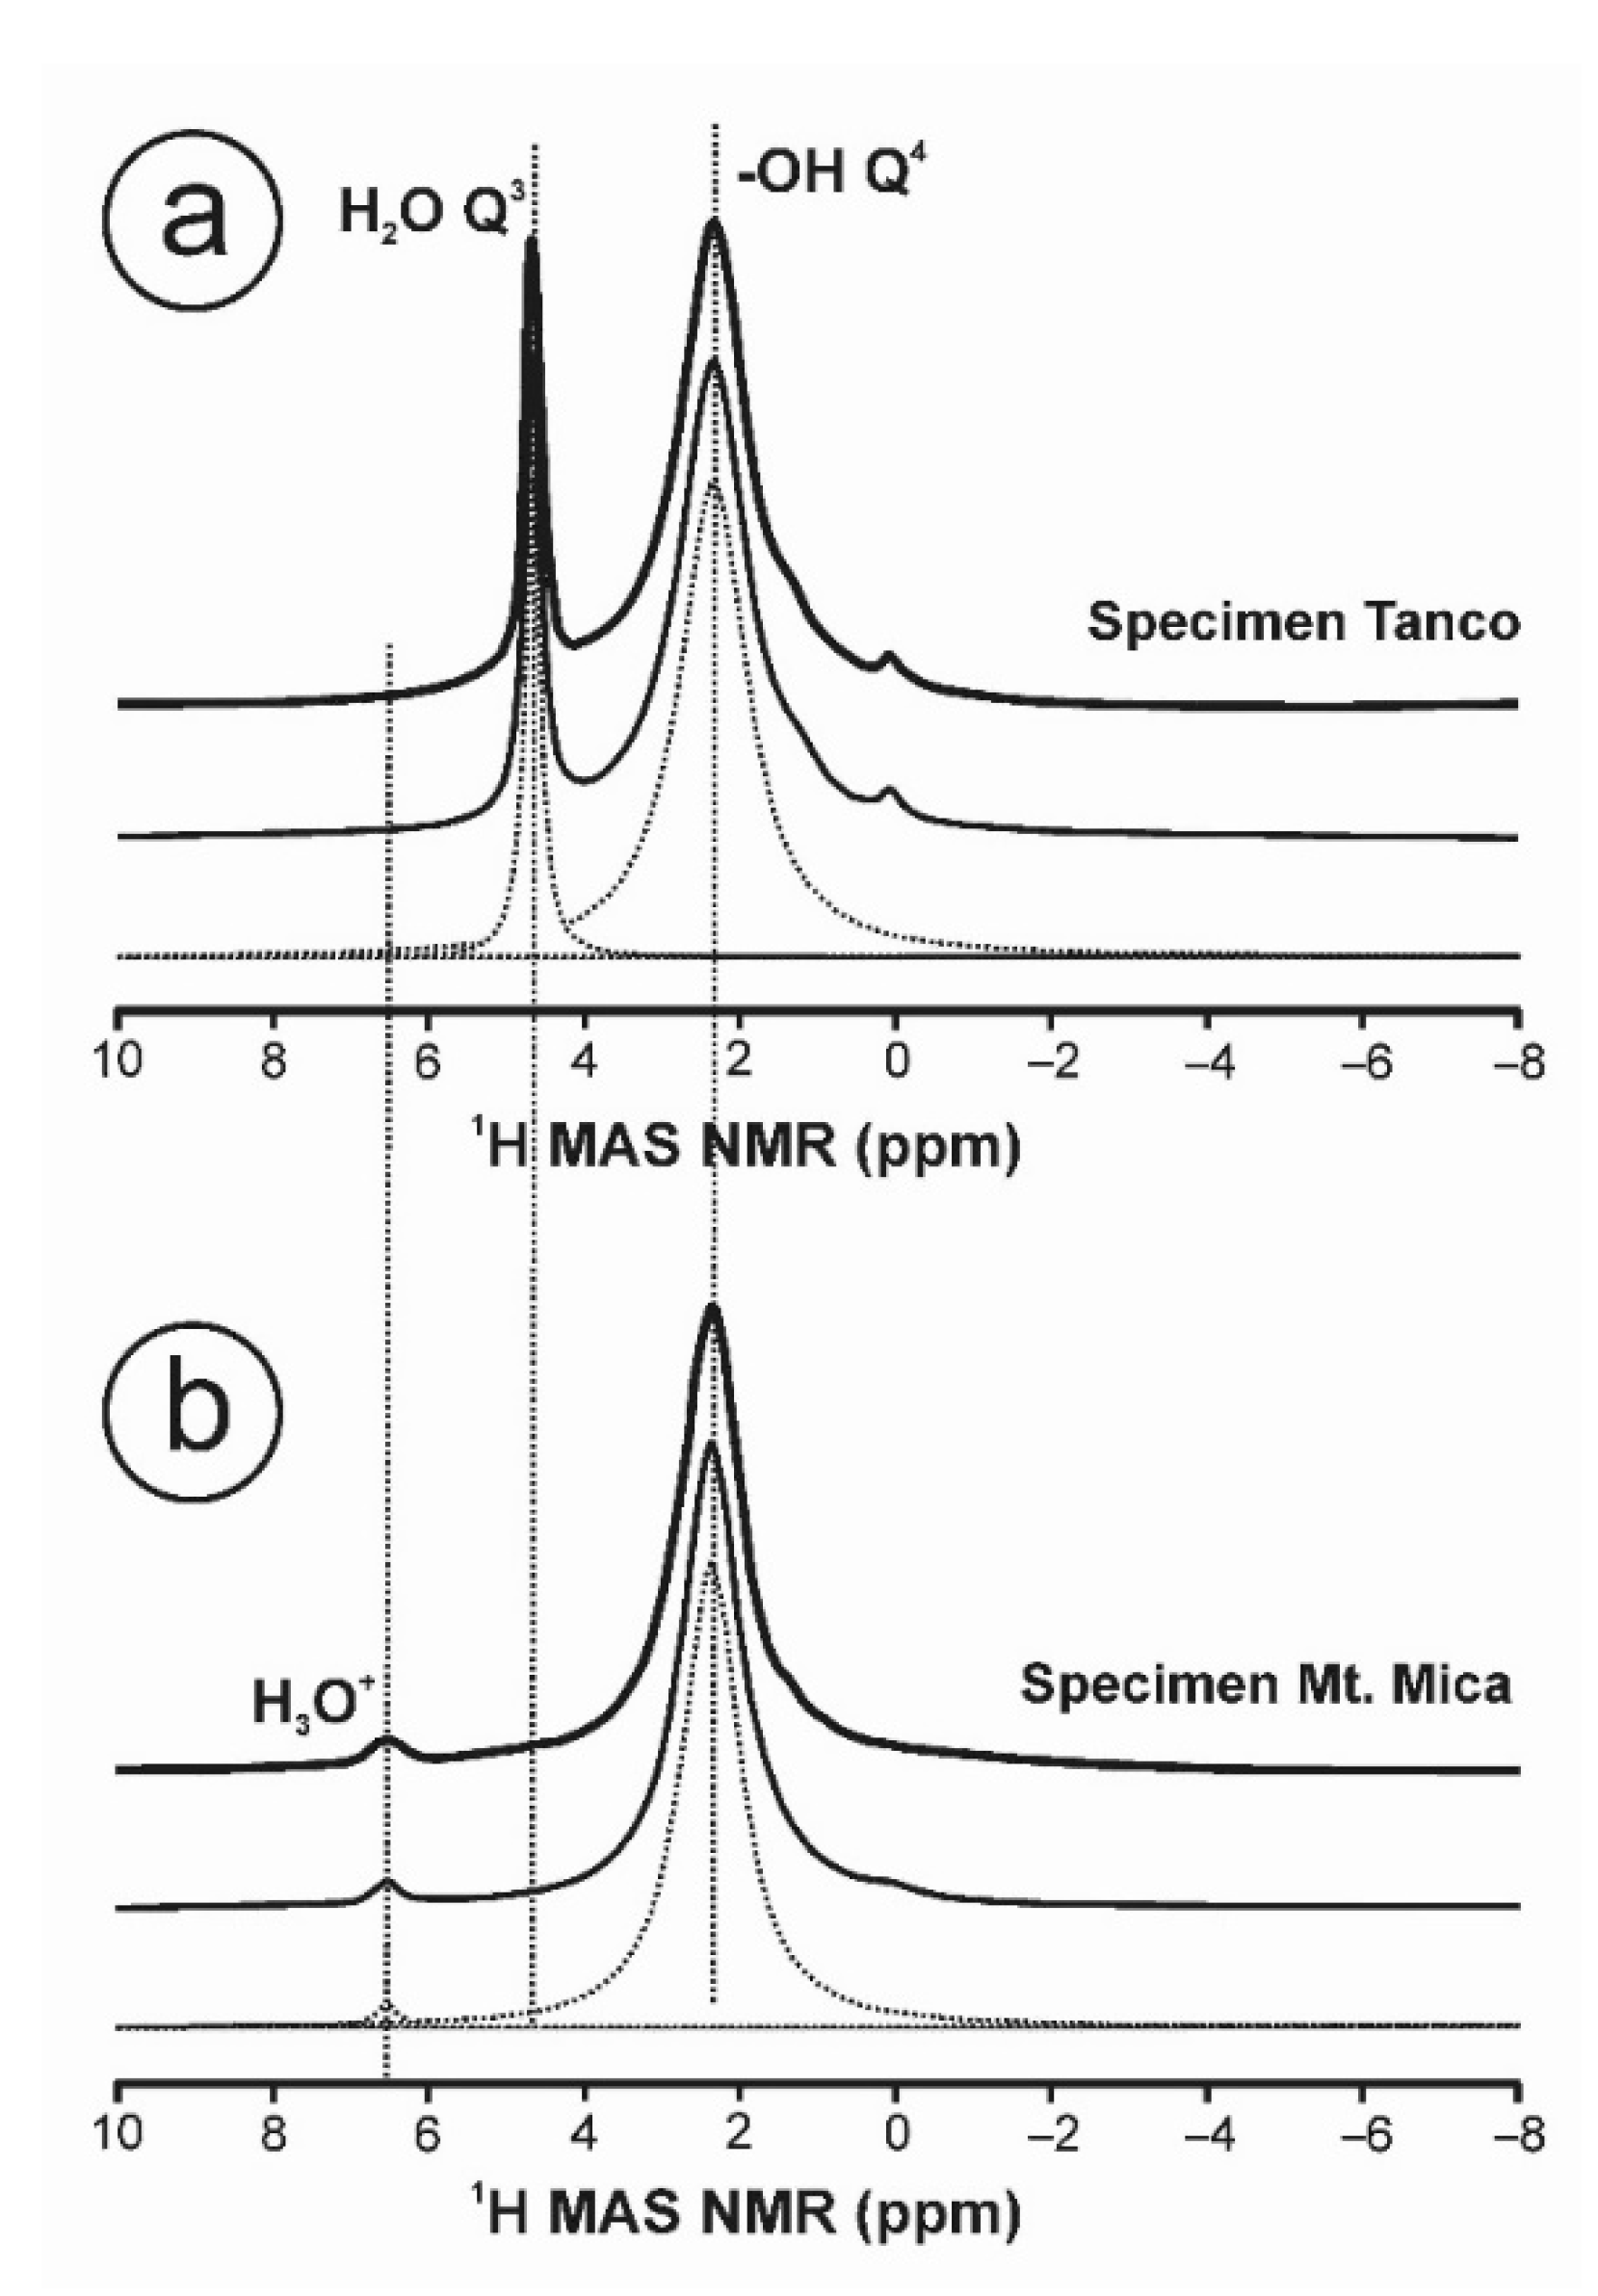
3.3. NMR Spectroscopy

Figure 4 reports the 29Si spectra at 9.4 T of the two pollucite specimens, using single-pulse (SP-MAS) and cross-polarization (CP-MAS) experiments. The degree of order of pollucite can be evaluated with the 29Si spectra, from the expected occupancies of Si atoms in a Si-Al distribution considering the number (n) of Al atoms around a Si atom in Q4n environments, including (4Si,0Al), (3Si,1Al), (2Si,2Al), (1Si,3Al) and (0Si,4Al). Table 3 shows the line positions and intensities of the simulated 29Si spectra of the two specimens from Tanco and Mt. Mica, in comparison with the expected intensities for a random distribution (RD), and also for a Loewenstein distribution (LD) for Al-O-Al avoidance when the Loewenstein’s rule [22] takes place (by using a Si/Al ratio of ~2/3 in Table 1 and Table 2), and also data from a Cs-exchanged leucite [15].
The relative areas in the 29Si SP-MAS spectra of the two mineral specimens deviate from the random distribution and Loewenstein distribution, and also from that of the synthetic Cs-leucite, and they have a prevalence of the Q42 (2Si,2Al) and Q41 (3Si,1Al) chemical environments, the expected ones for a local Si/Al ratio ~2.3 if it exists in a uniform dispersion of charges with partial avoidance or some restrictions for the Q40 (4Si,0Al), Q44 (0Si,4Al) and Q43 (1Si,3Al) environments. It must be related to medium-range order polyatomic organization with local charge compensation of charge by monovalent (1+) cations. Thus, one or two Cs atoms must be locally associated to Q41 (3Si,1Al) and Q42 (2Si,2Al) environments, respectively, in a similar way to how K atoms are locally correlated with Al atoms in the K-feldspars [24,25].
The center of gravity (c.g.) of the 29Si SP-MAS spectra is ~−98 ppm in the two studied specimens (Figure 4a,e, Table 3). However, the c.g. in the 29Si CP-MAS spectra records a broad and irregular resonance centered at circa −85 ppm from Si atoms in Q3 sites from phyllosilicate impurities, in addition to the Q4 pollucite signals. The position of this Q3 resonance does not change for different values of contact time, but the relative intensity of the Q3 and Q4 components changes with this parameter, i.e., Q3/Q4 ratio ~0.6 for 8 ms and Q3/Q4 ratio ~1.04 for 2 ms (Table 4). Thus, the c.g. of the total spectra is slightly displaced to fewer negative values in specimen Tanco (Figure 4b–d) from −94.4 ppm at 8 ms to −93.7 ppm at 2 ms. This displacement of the c.g. of the total spectra is small in comparison with the change in the Q3/Q4 ratio because the c.g. of the pollucite component is also displaced, but to lower shielding, as the contact time decreases up to a chemical shift ~−101 ppm for 2 ms (Table 4). This displacement at more negative chemical shifts occurs because of a change in the intensity of the Q4n signals, showing an increase of intensity for the (4Si,0Al) and (3Si,1Al) environments, with respect to the (2Si,2Al) environments, as indicated by the Q41/Q42 ratio (Table 4). However, the resonance forms Si atoms at (0Si,4Al) in this impure specimen that cannot be observed due to an overlap with the signal from the Q3 impurities, although a similar figure to that of the pristine specimen has been used for these semi-quantitative simulations.
As specimen Mt. Mica does not have such Q3 impurities, the 29Si CP-MAS spectra show more clearly these changes of pollucite with the contact time (Table 5). The c.g. moved from −99.6 at 8 ms to −101.1 at 1 ms at the same time the Q41/Q42 ratio increases from 0.76 at 8 ms to 0.91 at 1 ms, values that are far from experimental error after the estimated uncertainties. These changes suggest that protons are preferentially bonded to Si atoms that are surrounded by a few or no Al atoms, giving rise possibly to Si-OH bonds as a Q3 local framework depolymerization and explaining the easy transformation of pollucite to Q3 phyllosilicate minerals, such as muscovite, smectite and kaolinite, frequently observed in nature [16,17,18].
Figure 5a–d shows the central transition of the 27Al SP-MAS and 27Al CP-MAS of the two specimens at 9.4 T, with signals from Al atoms in tetrahedral and octahedral coordination in these specimens (Table 6). The Q4 tetrahedral Al site of pollucite in the two specimens gives a very similar asymmetric signal in all of the NMR spectra, with a center of gravity circa 58.5 ppm, implying a single site distribution for Al atoms at these experimental conditions. However, the 27Al CP-MAS spectra in specimen Tanco show Al atoms from octahedral coordination at circa 0 ppm and from tetrahedral coordination in a Q3 environment at ~71 ppm, which can be associated with the phyllosilicate impurities. The intensity of the Al atoms in a Q4 environment of pollucite in the 27Al CP spectrum is very low in comparison to the same signal from impurities. In specimen Tanco, the 27Al CP-MAS spectra were performed for contact times between 0.5 ms and 8 ms (shown in Figure 5b). With the decrease of the contact time, the relative intensity of the resonance at 0 ppm from octahedral aluminum increases, and the resonances of tetrahedral aluminum decreases. Thus, all of these data indicate that Al-OH bonds are much less developed than Si-OH bonds in pollucite. However, no signals from impurities are recorded in the pollucite from specimen Mt. Mica with a CP spectrum identical to the SP spectrum, as expected. The 27Al{29Si} HMQC spectrum at 17.6 T (Figure 5e), mediated by the scalar J-coupling between Al and Si nuclei, shows the direct connectivity between the Al atoms and the Si atoms with different chemical environments. However, the signal at −107.5 ppm is absent, confirming the attribution of the ~−107.5 ppm resonance to Si atoms in a (4Si,0Al) environment, a result that was confirmed by additional (not shown) 27Al{29Si} Insensitive Nuclei Enhanced by Polarization Transfer (INEPT) experiments at 17.6 T.
When the magnetic interaction between 27Al and 1H nuclei is analyzed by means of the dipolar interaction, it is found that two different Al signals with similar intensities are recorded at 58.8 ppm and 60.2 ppm, which are needed to account for the full REDOR evolution displayed in Figure 6. The full simulation of the 2D spectra shows that the Q4n (4-nSi,nAl) distribution of the silicon atoms connected to the Al site at 58.8 ppm is 9/70/21, whereas it is 32/45/23 for the one extracted at 60.2 ppm for n = 3/2/1 environments, respectively. This confirms the presence of two different spectroscopically distinct structural T sites for Al atoms, as this doublet is very difficult to be explained from a random or a Loewenstein distribution of Si and Al atoms.
If the dipolar evolutions 27Al{1H} of the two pollucite specimens are compared with that of gibbsite Al(OH)3, i.e., a natural aluminum hydroxide with well-developed Al-OH bonds, a much slower rising under REDOR evolution appears, related to a weaker Al/H dipolar coupling and thus larger Al-H distances and/or less H surrounding the Al sites. The marked slower increase of the REDOR curve observed in specimen Tanco with respect to specimen Mt Mica follows the same reasoning and shows a lower amount of H and/or longer Al-H distances for the former. It can also be seen that the site with a chemical shift of 58.8 ppm shows a slower REDOR dephasing for both samples and hence is less protonated than the component at 60.2 ppm. Thus, as the two pollucite specimens are birefringent, a possible explanation is related to a local structure with two sites for T cations, and thus a lower average symmetry than cubic symmetry, as suggested by Frank-Kamenetskaya et al. (1995) where two T sites were inferred in a tetragonal structure with a I41/acd space-group symmetry [6], from an incipient displacive transition [7].
Figure 7 exhibits the 133Cs SP-MAS and CP-MAS spectra, as well as the 23Na SP-MAS and CP-MAS spectra of the two studied pollucite specimens, indicating that the cavity cations are allocated in broad site distributions. The line shape for 23Na with its sharp rising left edge and low decaying right wing is characteristic of the so-called “Czjzek” line shape [26], which applies in the case of a fully random distribution of quadrupolar interaction (i.e., electric field gradient at the Na site). As the Si/Al distribution is not random but some charge dispersion exists, perhaps local charge compensation could be at work, giving rise to polyatomic Cs(Na)+Al medium-range order schemes. In addition, as the 133Cs atoms display a smaller quadrupolar interaction, the line shape of the 133Cs spectra must be dominated by a distribution of chemical shifts, giving rise to a Gaussian shape. The SP and CP experiments give very similar signals in shape, linewidth and position indicating no particular association with hydrogen, as the line intensity decreases in CP experiments with shorter contact times. The protons (for instance, as water molecules) thus are not located in the immediate neighborhood of the alkali atoms.
Figure 8 displays the 1H MAS NMR spectra of the two pollucite specimens. The 1H spectrum of the altered specimen from Tanco exhibits two signals at 2.35 and 4.6 ppm, from -OH groups and H2O water molecules, respectively. The pristine specimen from Mt. Mica has a 1H spectrum with a major signal at 2.35 ppm and a minor resonance at 6.52 ppm, derived from -OH groups and probably H3O+, respectively. The H2O signal from specimen Tanco could be related to the phyllosilicate impurities, mainly in smectites, which are known in the alteration products of pollucite [18]. An alternative explanation could be related to liquid water from fluid inclusions derived from the hydrothermal alterations that are clear in specimen Tanco. However, note that this signal is absent in specimen Mt. Mica where fluid inclusions exist. If this water were from “zeolitic molecules”, it should be recorded in the two specimens, but this signal is fully absent in the pristine pollucite specimen. The -OH signals at 2.35 ppm in the two specimens can be related to the reinforcement of the Si atoms in tetrahedral coordination with three oxygen atoms and one -OH group, perhaps as O3-Si(3Si,1Al)-OH and O3-Si(4Si,0Al)-OH sites, as well as -OH groups from the Q3 impurities in the one from Tanco. If literature data are considered, these signals should correspond to structurally bound molecular water, i.e., located in the site of Cs atoms. However, this chemical shift cannot be interpreted in this way, as structurally isolated molecular water appears at higher chemical shifts, typically at 4.6 ppm [27]. Hence, no zeolite molecules of water were clearly identified in our specimens of pollucite. This interpretation is compatible with available 1H NMR spectra in the available literature [28,29].

4. Conclusions

Two birefringent (i.e., optically non-isotropic), non-stoichiometric (Si/Al ratio ~2.3) specimens of pollucite mineral species from the Tanco pegmatite and the Mt. Mica pegmatite, with powder XRD patterns fully consistent with that of a cubic Ia-3d space-group lattice symmetry, were studied by multinuclear MAS NMR spectroscopy at 9.4 and 17.6 T. The 29Si SP-MAS spectra indicate a disordered Si/Al distribution incompatible with the random and Loewenstein distributions, because of a clear prevalence of the (3Si,1Al) and (2Si,2Al) environments. The 29Si CP-MAS spectra show that protons are bonded preferentially with Si atoms, having low content of Al in the second sphere of coordination. Specimen Tanco has phyllosilicate impurities that were useful to monitor changes in the 29Si spectra with a decreasing of the contact time, and thus with proton proximity to Si atoms. The 27Al{1H} dipolar evolutions indicate that two Al site distributions can be discriminated from their distance to protons, which are not compatible with the available models for an average structure with an isotropic cubic Ia-3d symmetry. The 23Na and 133Cs spectra indicate site distributions for these atoms, with no local bonding to water molecules. The 1H spectra resolved the presence of hydrous H2O-rich impurities in specimen Tanco, and -OH groups in the pollucite structure of the two specimens, but not zeolitic water. The absence of zeolitic water molecules explains the lower leachability of Cs atoms in the pollucite structure, in comparison with other zeolite-based alternatives, and the high temperature necessary to observe any loss of weight during heating experiments. All of these data suggest that the structure of pollucite from NMR differs from the available lattice models derived from reciprocal-space techniques and from water speciation after infrared spectroscopy. Therefore, the two specimens of pollucite can be described from NMR data as an essentially anhydrous, pseudo-cubic and non-stoichiometric mineral, lacking a strictly lattice periodicity. Pollucite it is just a long-range disordered pseudo-periodic mineral structure, with a strong dispersion of tetrahedral changes for the framework cations and site distributions for the cavity cations.

Author Contributions

Conceptualization mainly by L.S.-M. and P.F.; the NMR experiments were performed by J.-I.S. and P.F.; specimen Tanco from L.S.-M., and specimen Mt. Mica from W.B.S.; analyses of the NMR spectra by L.S.-M., P.F. and J.-I.S. All authors contributed to discuss and write the paper. All authors have read and agreed to the published version of the manuscript.

Funding

This research was partially funded by Ministerio de Economía y Competitividad MAT2017-86450-C4-1-R.

Data Availability Statement

Not applicable.

Acknowledgments

We thank to Alfredo Fernández Larios from ICTS CNME (UCM) for the results of electron microprobe analyses using a JXA 8900, to Aurelio Nieto from NMCN (CSIC) the specimen of gibbsite from the mineral collections of the MNCN, to Sara Serena and Francisco Muñoz for the XRD patterns obtained in the Instituto de Cerámica y Vidrio (ICV-CSIC). This paper has got the benefits of a detailed revision from two referees, to whom we thank for their interesting and positive comments for the improvement of this work.

Conflicts of Interest

The authors declare no conflict of interest.

References

  1. Coombs, D.S.; Alberti, A.; Armbruster, T.; Artioli, G.; Colella, C.; Galli, E.; Grice, J.D.; Liebau, F.; Mandarino, J.A.; Minato, H.; et al. Recommended nomenclature for zeolite minerals: Report of the Subcommittee on Zeolites of International Mineralogical Association, Commission on new minerals and minerals names. Can. Mineral. 1997, 35, 1571–1606. [Google Scholar]
  2. Náray-Szabó, S.V. Die struktur des pollucits CsAlSi2O6·xH2O. Z. Krist. 1938, 99, 277–282. [Google Scholar] [CrossRef]
  3. Taylor, W.H. The structure of analcime (NaAlSi2O6*H2O). In Zeitschrift Fuer Kristallographie, Kristallgeometrie, Kristallphysik, Kristallchemie; 1930; Volume 74, pp. 1–19. [Google Scholar]
  4. Newman, R.E. Crystal structure and optical properties of pollucite. Am. Mineral. 1967, 52, 1515–1518. [Google Scholar]
  5. Beger, R.M. The crystal structure and chemical composition of pollucite. Z. Krist. 1969, 129, 280–302. [Google Scholar] [CrossRef]
  6. Frank-Kamenetskaya, O.V.; Rozhdestvenskaya, I.V.; Bannova, I.I.; Kostitsyna, A.V.; Kaminskaya, T.N.; Gordienko, V.V. Dissymmetrization of crystal structures of sodium pollucites. Crystallogr. Rep. 1995, 40, 645–654. [Google Scholar]
  7. Palmer, D.C.; Dove, M.T.; Ibberson, R.M.; Powell, B.M. Structural behavior, crystal chemistry, and phase transitions in substituted leucite: High-resolution neutron powder diffraction studies. Am. Mineral. 1997, 82, 16–29. [Google Scholar] [CrossRef]
  8. Gatta, G.D. On the crystal structure and crystal chemistry of pollucite, (Cs,Na)16Al16Si32O96·nH2O: A natural microporous material of interest in nuclear technology. Am. Mineral. 2009, 94, 1560–1568. [Google Scholar] [CrossRef]
  9. Yanase, I.; Kobayashi, H.; Shibasaki, Y.; Mitamura, T. Tetragonal-to-cubic structural phase transition in pollucite by low-temperature X-ray powder diffraction. J. Am. Ceram. Soc. 1997, 80, 2693–2695. [Google Scholar] [CrossRef]
  10. Presser, V.; Klouzkova, A.; Mrazova, M.; Kohoutkova, M.; Berthold, C. Micro-Raman spectroscopy on analcime and pollucite in comparison to X-ray diffraction. J. Raman Spectrosc. 2008, 39, 587–592. [Google Scholar] [CrossRef]
  11. Fleischer, M.; Ksanda, C.J. Dehydration of pollucite. Am. Mineral. 1940, 25, 666–672. [Google Scholar]
  12. Ashbrook, S.E.; Whittle, K.R.; Le Pollès, L.; Farnan, I. Disorder and dynamics in pollucite from 133Cs and 27Al NMR. J. Am. Ceram. Soc. 2005, 88, 1575–1583. [Google Scholar] [CrossRef]
  13. Teertstra, D.K.; Sherriff, B.L.; Xu, Z.; Černý, P. MAS and DOR NMR study of Al-Si order in the analcime-pollucite series. Can. Mineral. 1994, 32, 69–80. [Google Scholar]
  14. Simon, A.; Köhler, J.; Keller, P.; Weitkamp, J.; Buchholz, A.; Hunger, M. Phase transformation of zeolites Cs,Na-Y and Cs,Na-X impregnated with cesium hydroxide. Microporous Mesoporous Mater. 2004, 68, 143–150. [Google Scholar] [CrossRef]
  15. Takaishi, T.; Yamazaki, S.; Yamazaki, A. Al–Si ordering in the framework of leucite and Cs-exchanged leucite. Phys. Chem. Chem. Phys. 2002, 4, 3078–3084. [Google Scholar] [CrossRef]
  16. Teertstra, D.K.; Lahti, S.I.; Alviola, R.; Černý, P. Pollucite and its alteration in Finnish pegmatites. Geol. Surv. Finl. Bull. 1993, 368, 15–22. [Google Scholar]
  17. Cerný, P.; Simpson, F.M. The Tanco Pegmatite at Bernic Lake, Manitoba; X. Pollucite. Can. Mineral. 1978, 16, 325–333. [Google Scholar]
  18. Cerný, P. Alteration of pollucite in some pegmatites of southeastern Manitoba. Can. Mineral. 1978, 16, 89–95. [Google Scholar]
  19. Magnenet, C.; Massiot, D.; Klur, I.; Coutures, J.P. Characterization of aluminosilicate on rutile surface by high resolution solid state NMR. J. Mater. Sci. 2000, 35, 115–121. [Google Scholar] [CrossRef]
  20. Florian, P.; Veron, E.; Green, T.F.G.; Yates, J.R.; Massiot, D. Elucidation of the Al/Si ordering in gehlenite Ca2Al2SiO7 by combined 29Si and 27Al NMR spectroscopy/quantum chemical calculations. Chem. Mater. 2012, 24, 4068–4079. [Google Scholar] [CrossRef]
  21. Massiot, D.; Fayon, F.; Capron, M.; King, I.; Le Calvé, S.; Alonso, B.; Durand, J.O.; Bujoli, B.; Gan, Z.H.; Hoatson, G. Modelling one and two-dimensional solid-state NMR spectra. Magn. Reson. Chem. 2002, 40, 70–76. [Google Scholar] [CrossRef]
  22. Lowenstein, W. The distribution of aluminum in the tetrahedral of silicat es and aluminates. Am. Mineral. 1954, 39, 92–96. [Google Scholar]
  23. Klinowski, J.; Ramdas, S.; Thomas, J.M. A re-examination of Si, Al ordering in zeolite NaX and NaY. J. Chem. Soc. Faraday Trans. 1982, 78, 1025–1050. [Google Scholar] [CrossRef]
  24. Sánchez-Muñoz, L.; Sanz, J.; Sobrados, J.; Gan, Z. Medium-range-order in disordered K-feldspars by multinuclear NMR. Am. Mineral. 2013, 98, 2115–2131. [Google Scholar] [CrossRef]
  25. Sánchez-Muñoz, L.; Sanz, J.; Sobrados, I.; Gan, Z.H.; Santos, J.I. Medium-range order in crystal structures of minerals. In Applications of NMR Spectroscopy in the Solid State; Consejo Superior de Investigaciones Científicas (CSIC): Madrid, Spain, 2019; Volume 47, pp. 103–131. [Google Scholar]
  26. Werner-Zwanziger, U.; Paterson, A.L.; Zwanziger, J.W. The Czjzek distribution in solid-state NMR: Scaling properties of central and satellite transitions. J. Non-Cryst. Solids 2020, 550, 120383. [Google Scholar] [CrossRef]
  27. Yesinowski, J.P.; Eckert, H.; Rossman, G.R. Characterization of hydrous species in minerals by high-speed 1H MAS-NMR. J. Am. Chem. 1988, 110, 1367–1375. [Google Scholar] [CrossRef]
  28. Xue, X.; Kanzaki, M. High-pressure δ-Al (OH)3 and δ-AlOOH phases and isostructural hydroxides/oxyhydroxides: New structural insights from high-resolution 1H and 27Al NMR. J. Phys. Chem. B 2007, 111, 13156–13166. [Google Scholar] [CrossRef]
  29. Xue, X.; Kanzaki, M. Proton Distributions and Hydrogen Bonding in Crystalline and Glassy Hydrous Silicates and Related Inorganic Materials: Insights from High-Resolution Solid-State Nuclear Magnetic Resonance Spectroscopy. J. Am. Ceram. Soc. 2009, 92, 2803–2830. [Google Scholar] [CrossRef]
Figure 1. Lattice model of pollucite (Cs,Na)AlSi2O6 showing the structure along the [111] axis and the possible chemical environments for Si and Al atoms. (a) At the left side the cubic Ia-3d model with the single tetrahedral T site in green is occupied by both Si and Al atoms, showing the different site positions of Cs atoms (gray) and Na atoms (red), according to [8]. (b) At the right side the ten possible chemical environments for the single T site, including Si atoms (blue) in Q4n (4-nSi,nAl) for n = 0, 1, 2, 3 and 4, and Al atoms (red) in q4(4-nSi,nAl) for n = 0, 1, 2, 3 and 4.
Minerals 12 01181 g001
Figure 2. BSE image of a veinlet in pollucite of specimen Tanco showing the points were the specific EMPA analysis were obtained, shown in Table 1. Analysis nº 1 to 5 correspond with pollucite (clear contrast) and nº 6 to 9 with hydrated unidentified minerals (dark contrast).
Minerals 12 01181 g002
Figure 3. Calculated powder XRD patterns of pollucite up to 2θ = 60°, from single-crystal measurements after the ICSD database, in comparison with experimental patterns in the two studied specimens. (a) The pattern from the Ia-3d lattice model after file CC 84321 [9] with the main (hkl) peaks. (b) The pattern from the I41/acd lattice model after file CC 84322 [9] showing the peak splitting of the (008) cubic structure into (008) + (080) peaks of the tetragonal structure. (c) The pattern from the I41/a lattice model after file CC 66921 [7] to show some additional changes to peak splitting as some peak broadening mainly in peaks marked with an asterism, and also new peaks (green squares) including (101), (222) and (303) diffractions. These powder patterns were calculated for width parameters as: u = 0.01, v = −0.01 and w = 0.02, Cu Kα1 radiation at 1.5418 Å. (d) The powder pattern in specimen Tanco showing some peaks from impurities (red squares) and a signal similar to (303) of the model in (c) (green color) (e). (d) Powder pattern in specimen Mt. Mica showing only diffraction peaks from pollucite, consistent with the Ia-3d model in (a). The patterns of (d,e) have been amplified by x3 to show the peaks with a low intensity. The details of the (008)-(080) peak splittings are for 2θ° values between 53° and 54° for the same width parameters, but the intensity of the (008) peaks in the two specimens have been modified to be comparable with that of the used models. Peaks that have a broadening with the phase transition are marked with *.
Minerals 12 01181 g003
Figure 4. The 29Si MAS NMR spectra at 9.4 T of the two specimens of pollucite using single-pulse SP-MAS experiments in (a) for specimen Tanco and (e) for specimen Mt. Mica. The CP-MAS experiments for specimen Tanco in (b) at 8 ms, (c) at 4 ms and (d) at 2 ms of contact time and D0 or recycling time of 3 s, in all cases with 34,816 scans. The same spectra for specimen Mt. Mica in (f) at 8 ms, (g) at 2 ms, and (h) at 1 ms of contact time, and D0 = 3 s, in all cases with 40,960 scans. Only four of five possible chemical environments are recorded (vertical dotted lines) of the Q4n (4-nSi,nAl) for n = 0, 1, 2, 3 and 4. The experimental spectra are compared with the simulated curves (sim) from the addition of the four detected chemical environments using Voigt curves (xG/(1 − x)L = 0.7). The numerical values of the areas in % of the simulated spectra are in Table 3, Table 4, Table 5 and Table 6, in comparison with the expected values for the random (RD) and Loewenstein (LD) models. Q3 is a wide resonance centered at ~−85 ppm from phyllosilicate impurities.
Minerals 12 01181 g004
Figure 5. The 27Al MAS NMR spectra of the two pollucite specimens: (a,b) single pulse SP-MAS and CP-MAS spectra of specimen Tanco at 9.4 T; (c,d) single pulse SP-MAS and CP-MAS spectra of specimen Mt. Mica at 9.4 T; (e) 27Al{29Si } HMQC spectrum at 10 kHz and 17.6 T of specimen Mt. Mica. The 27Al CP-MAS experiments have been done at 8 ms of contact time.
Minerals 12 01181 g005
Figure 6. (a,b) Single pulse 27Al spectra of the specimens Tanco and Mt. Mica at 17.6 T, showing a deconvolution of the experimental profile by two Gaussian curves at 60.2 ppm and 58.8 ppm, in addition to the spinning side band from the 3/2 transition. (c,d) 27Al{1H} Dipolar evolutions of the two pollucite specimens in comparison with the same behaviour in the two octahedral sites occupied by Al atoms in gibbsite Al(OH)3 at 17.6 T (ΔS/S0 where ΔS = (S0 − Sf) with Sf and So signals obtained with and without the π pulses on the 1H. The areas of the two signals at 60.2 ppm and 58.8 ppm in specimen Mt. Mica are 53.9% and 46.1%, respectively, whereas in specimen Tanco they are 50.6% and 49.4%.
Minerals 12 01181 g006
Figure 7. The NMR spectra of the cavity cations of the two specimens of pollucite at 9.4 T. (a) The 133Cs SP-MAS spectrum and 133Cs CP-MAS spectrum (contact time of 7 ms, number of scans 10,240, recycling time 5 s) of specimen Tanco simulated with Gaussian curves at −8.3 ppm and linewidth of 29.7 ppm for the SP experiment and at −9.9 ppm and a linewidth of 31 ppm for the CP experiment. (b) The 133Cs SP-MAS spectrum of specimen Mt. Mica simulated with a Gaussian curve at −9.7 ppm and a linewidth of 30.11 ppm, for the SP experiment and at −11.87 ppm with linewidth of 31.63 ppm for the 133Cs CP-MAS spectrum, with the same experimental conditions as in (a). (c) The 23Na SP-MAS spectrum and 23Na CP-MAS spectrum (contact time of 8 ms, number of scans 10,240, recycling time 5 s) at 9.4 T of specimen Tanco, with c.g. at −15.76 ppm in the SP experiment and −14.69 in the CP experiment. (d) The 23Na MAS and CP MAS NMR spectra at 9.4 T of specimen Mt. Mica, with c.g. at −15.85 ppm in the SP experiment and −14.07 ppm in the CP experiment. The estimated experimental uncertainties in the chemical shift δ values are about 5 ppm for the 133Cs spectra and circa 3 ppm for the 23Na spectra.
Minerals 12 01181 g007
Figure 8. The 1H MAS NMR spectra at 9.4 T of: (a) specimen Tanco with two major signals, one at 2.35 ppm with 1.06 ppm of linewidth from -OH groups, the other at 4.66 ppm with 0.24 ppm of linewidth from H2O from phyllosilicate impurities and/or fluid inclusions; and (b) specimen Mt. Mica with one major resonance at 2.35 ppm with 0.9 ppm of linewidth from -OH groups, and a minor signal at 6.52 ppm, perhaps from H3O+.
Minerals 12 01181 g008
Table 1. Chemical compositions by EMPA of specimen Tanco.
Analysis Nº12345Av6789
SpecimenPollucite Tanco Alterations/Veining
SiO246.2946.4344.0946.8946.8946.1267.1965.0262.8362.13
Al2O317.4217.4117.4917.0917.3717.3628.2928.2918.6817.78
Na2O2.522.171.011.981.971.930.060.040.070.01
K2O------0.010.0112.75.71
Cs2O34.3734.1539.4934.2433.6235.170.000.001.240.56
Total100.60100.16102.08100.2099.85100.5895.5393.3695.5286.19
Si2.552.562.522.582.572.568.097.938.278.56
Al1.131.131.181.111.121.133.874.072.92.89
Na0.240.230.110.210.210.200.010.010.020.00
Cs0.810.800.960.800.790.830.000.000.070.03
K----- --2.131.0
O66666618181818
Si/Al2.262.272.142.322.292.262.091.952.852.96
Note: FeO, MnO, MgO, CaO and TiO2 contents are close or below the detection limit, Av is the average value from 1 to 5 for specimen Tanco.
Table 2. Chemical compositions by EMPA of specimen Mt. Mica.
Analysis123Av.
SpecimensPollucite Mt. Mica
SiO246.4846.1446.6146.41
Al2O316.4217.4317.6117.17
Na2O1.421.441.511.46
Cs2O36.5036.4336.6336.52
K2O0.030.060.030.04
Total100.85101.5102.36101.60
Si2.812.772.782.79
Al1.171.231.231.21
Na0.170.170.180.17
Cs0.950.930.940.94
O6666
Si/Al2.402.252.262.31
Note: FeO, MnO, MgO, CaO and TiO2 contents are below or close to the detection limit.
Table 3. Deconvolution of the 29Si SP-MAS NMR spectra at 9.4 T of the two specimens of pollucite, in comparison with other experimental and theoretical possibilities.
RDLDCs-Leucite [15]Specimen
Tanco
Specimen
Mt. Mica
29Si SP-MAS29Si SP-MAS29Si SP-MAS
c.g. (ppm) -−97.9−98.4
SitesAAδA δA δA
Q40 (4Si,0Al)22.679.83−104.43.8−107.6 5.9−107.96.4
Q41 (3Si,1Al)40.7430.91−100.022.1−102.6 31.9−103.3 31.0
Q42 (2Si,2Al)27.4736.47−95.542.7−97.8 50.8−98.3 50.9
Q43 (1Si,3Al)8.2219.08−91.327.7−93.2 11.4−93.5 11.7
Q44 (0Si,4Al)0.923.75−87.83.7----
Note: The probabilities pn (n is the number of Al atoms around a Si atom) of the five chemical environments, Q40 (4Si,0Al), Q41 (3Si,1Al), Q42 (2Si,2Al), Q43 (1Si,3Al) and Q44 (0Si,4Al), in a random (RD) Si-Al distribution are calculated with r = Al/(Al + Si) = 0.31 in the two specimens, whereas r = Al/Si = 0.44 is used also in both specimens for a Loewenstein (LD) Si-Al distribution, given by: p0 = (1 − r)4; p1 = 4(1 − r)3r; p2 = 6r2(1 − r)2; p3 = 4r3(1 − r); and p4 = r4 [23]; Cs-leucite is a synthetic sample produced by Cs-exchanged leucite [15]. The chemical shifts δ are in ppm, and the areas A in %. The estimated experimental uncertainties in the chemical shift δ values are about 1 ppm, and in areas about 2%.
Table 4. Deconvolution of the 29Si CP-MAS spectra of specimens Tanco.
Specimen Tanco 29Si CP-MAS
8 ms4 ms2 ms
c.g. total spectrum (ppm)−94.4−94.3−93.7
c.g. pollucite (ppm)−99.6−100.0−100.9
Ratio Q3/Q4~0.60~0.72~1.04
SitesδA δA δA
Q40 (4Si,0Al)−107.36.3−107.04.6−107.316.4
Q41 (3Si,1Al)−102.539.2−102.642.1−102.138.7
Q42 (2Si,2Al)−97.648.2−97.950.1−97.544.9
Q43 (1Si,3Al)−91.96.3−91.94.1--
Q44 (0Si,4Al)------
Q41/Q42 ratio 0.81 0.84 0.86
Note: line widths: 8 ms at 4.2 ppm, 4 ms at 4.1 ppm, 2 ms at 4.4 ppm. The estimated experimental uncertainties in chemical shift δ are about 1 ppm, and in areas about 3%, except for the Q44 (0Si,4Al) environments for which position and intensity have been estimated from the other specimen.
Table 5. Deconvolution of the 29Si CP-MAS spectra of specimens Mt. Mica.
Specimen Mt. Mica 29Si CP-MAS
8 ms2 ms1 ms
c.g. (ppm)−99.6−99.8−101.1
Sitesδ A δA δ A
Q40 (4Si,0Al)−107.57.8−107.18.7−107.414.6
Q41 (3Si,1Al)−102.336.5−102.138.8−102.640.6
Q42 (2Si,2Al)−97.547.9−97.746.1−97.744.8
Q43 (1Si,3Al)−92.47.8−92.56.5--
Q44 (0Si,4Al)------
Q41/Q42 ratio 0.76 0.84 0.91
Note: line widths: 4.2 ppm at 8 ms, 3.5 ppm for 2 ms and 1 ms. The estimated experimental uncertainties in chemical shift δ are about 1 ppm, and in areas about 2%.
Table 6. NMR parameter of the 27Al spectra at 9.4 T of two specimens of pollucite.
Specimen TancoSpecimen Mt. Mica
127Al SP-MAS27Al CP-MAS27Al SP-MAS27Al CP-MAS
Sitec.g.A c.g.A c.g.Ac.g.A
VI Q30.942.4−1.9183.9----
IV Q3--71.1510.2----
IV Q458.997.658.95.958.0100.058.3100.0
The centers of gravity (c.g.) of the signals are in ppm, and the areas A in %. SP and CP are single-pulse and cross-polarization experiments.
Publisher’s Note: MDPI stays neutral with regard to jurisdictional claims in published maps and institutional affiliations.

