
Study on Temporal and Spatial Distribution and Transport Characteristics of Dust in New Composite Spraying Slurry

Abstract
:1. Introduction
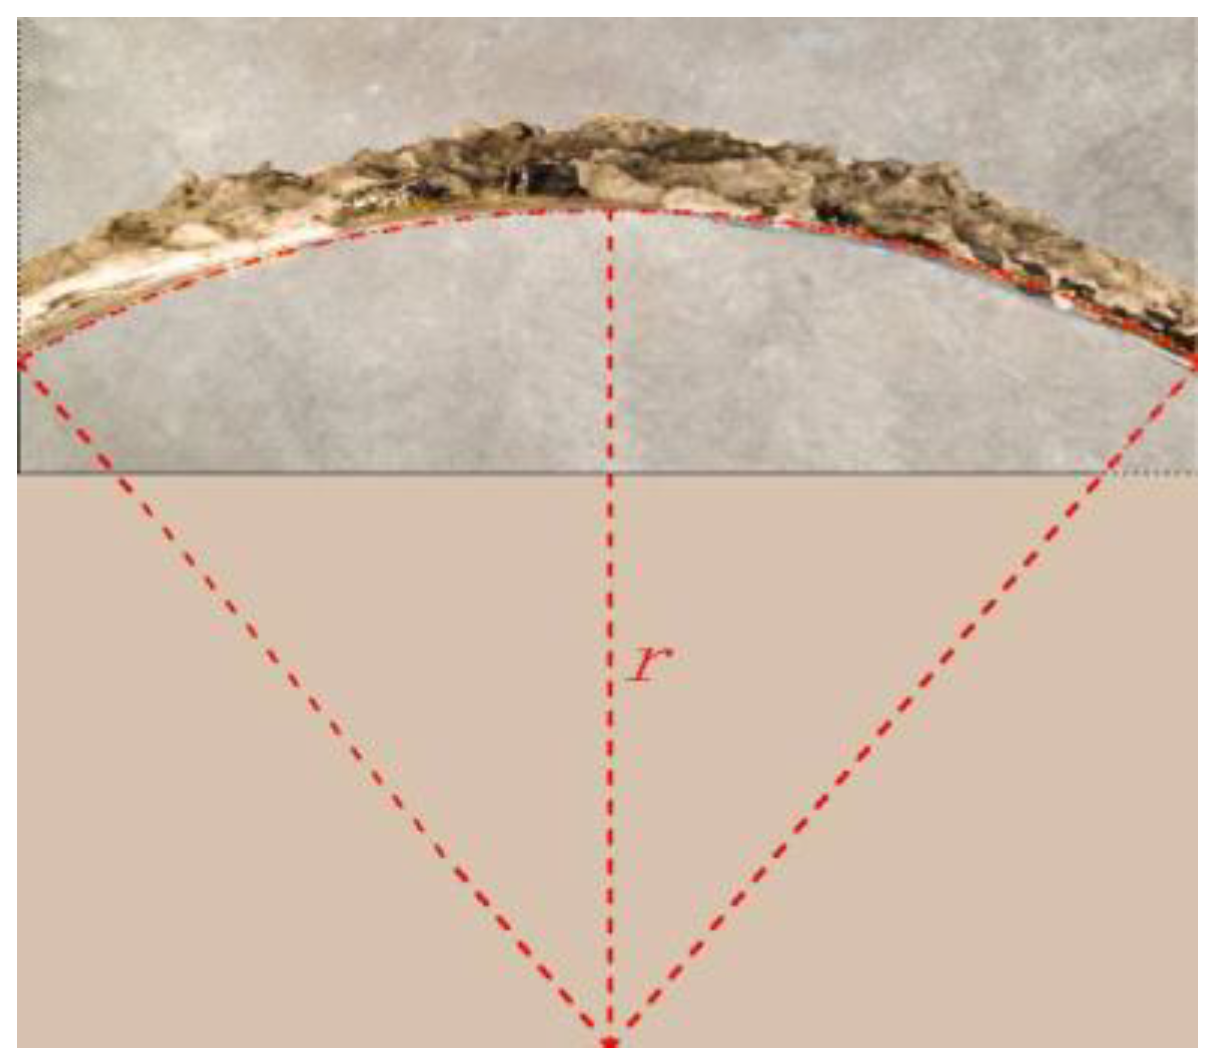
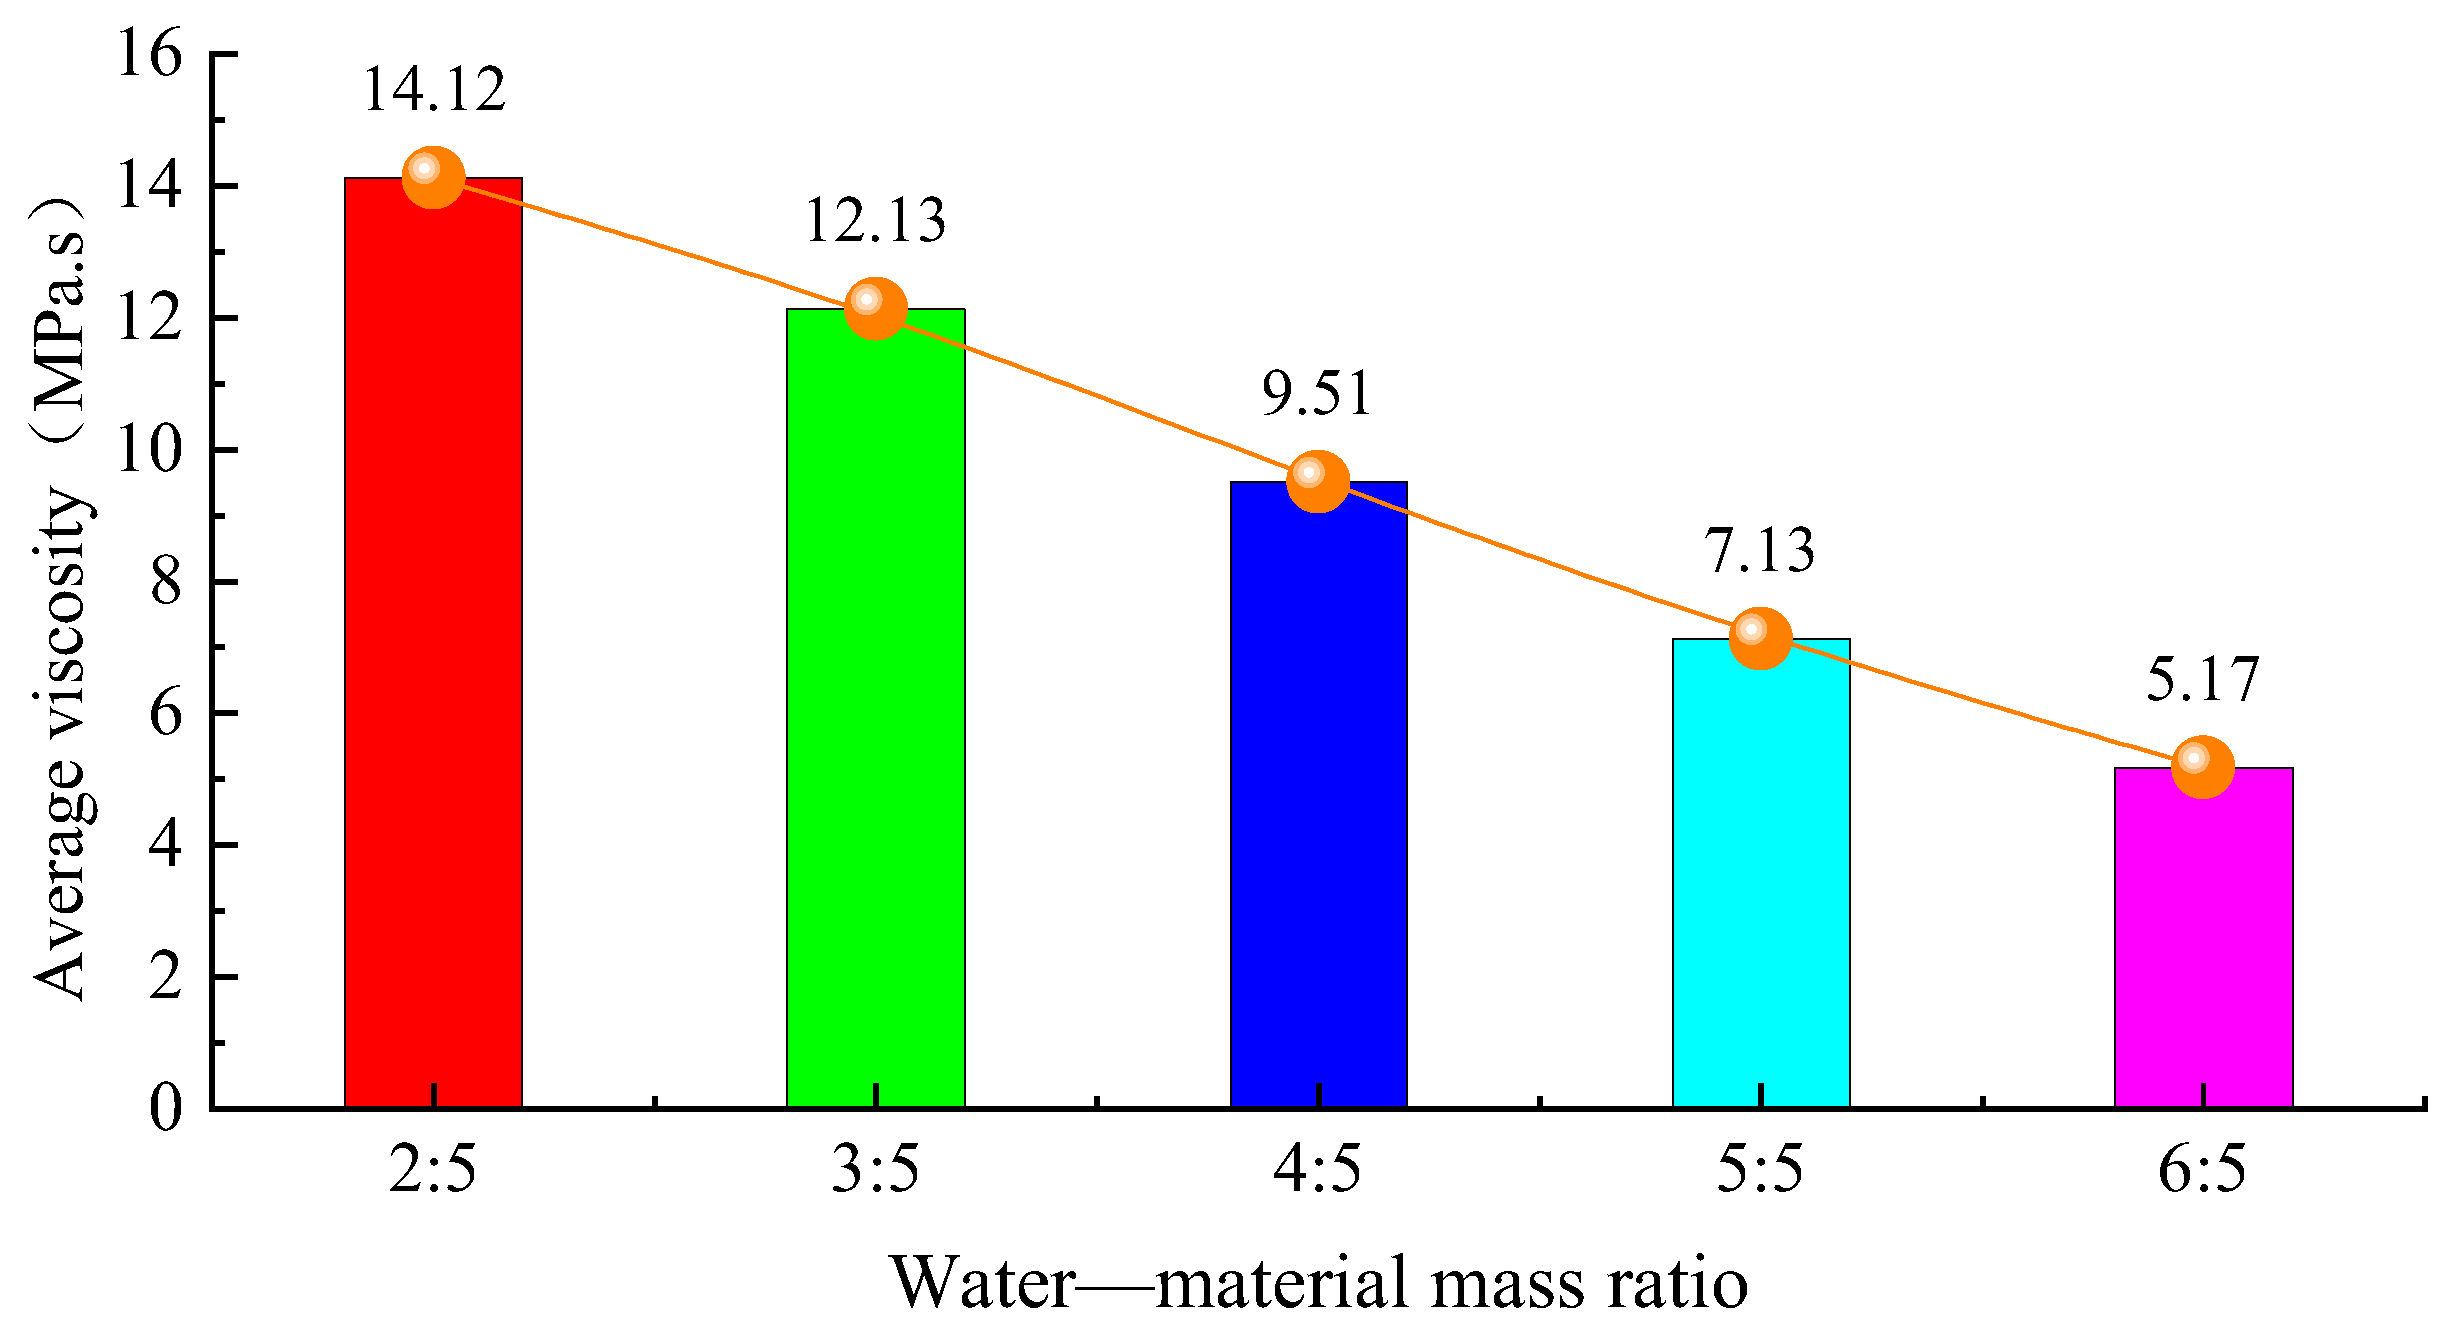
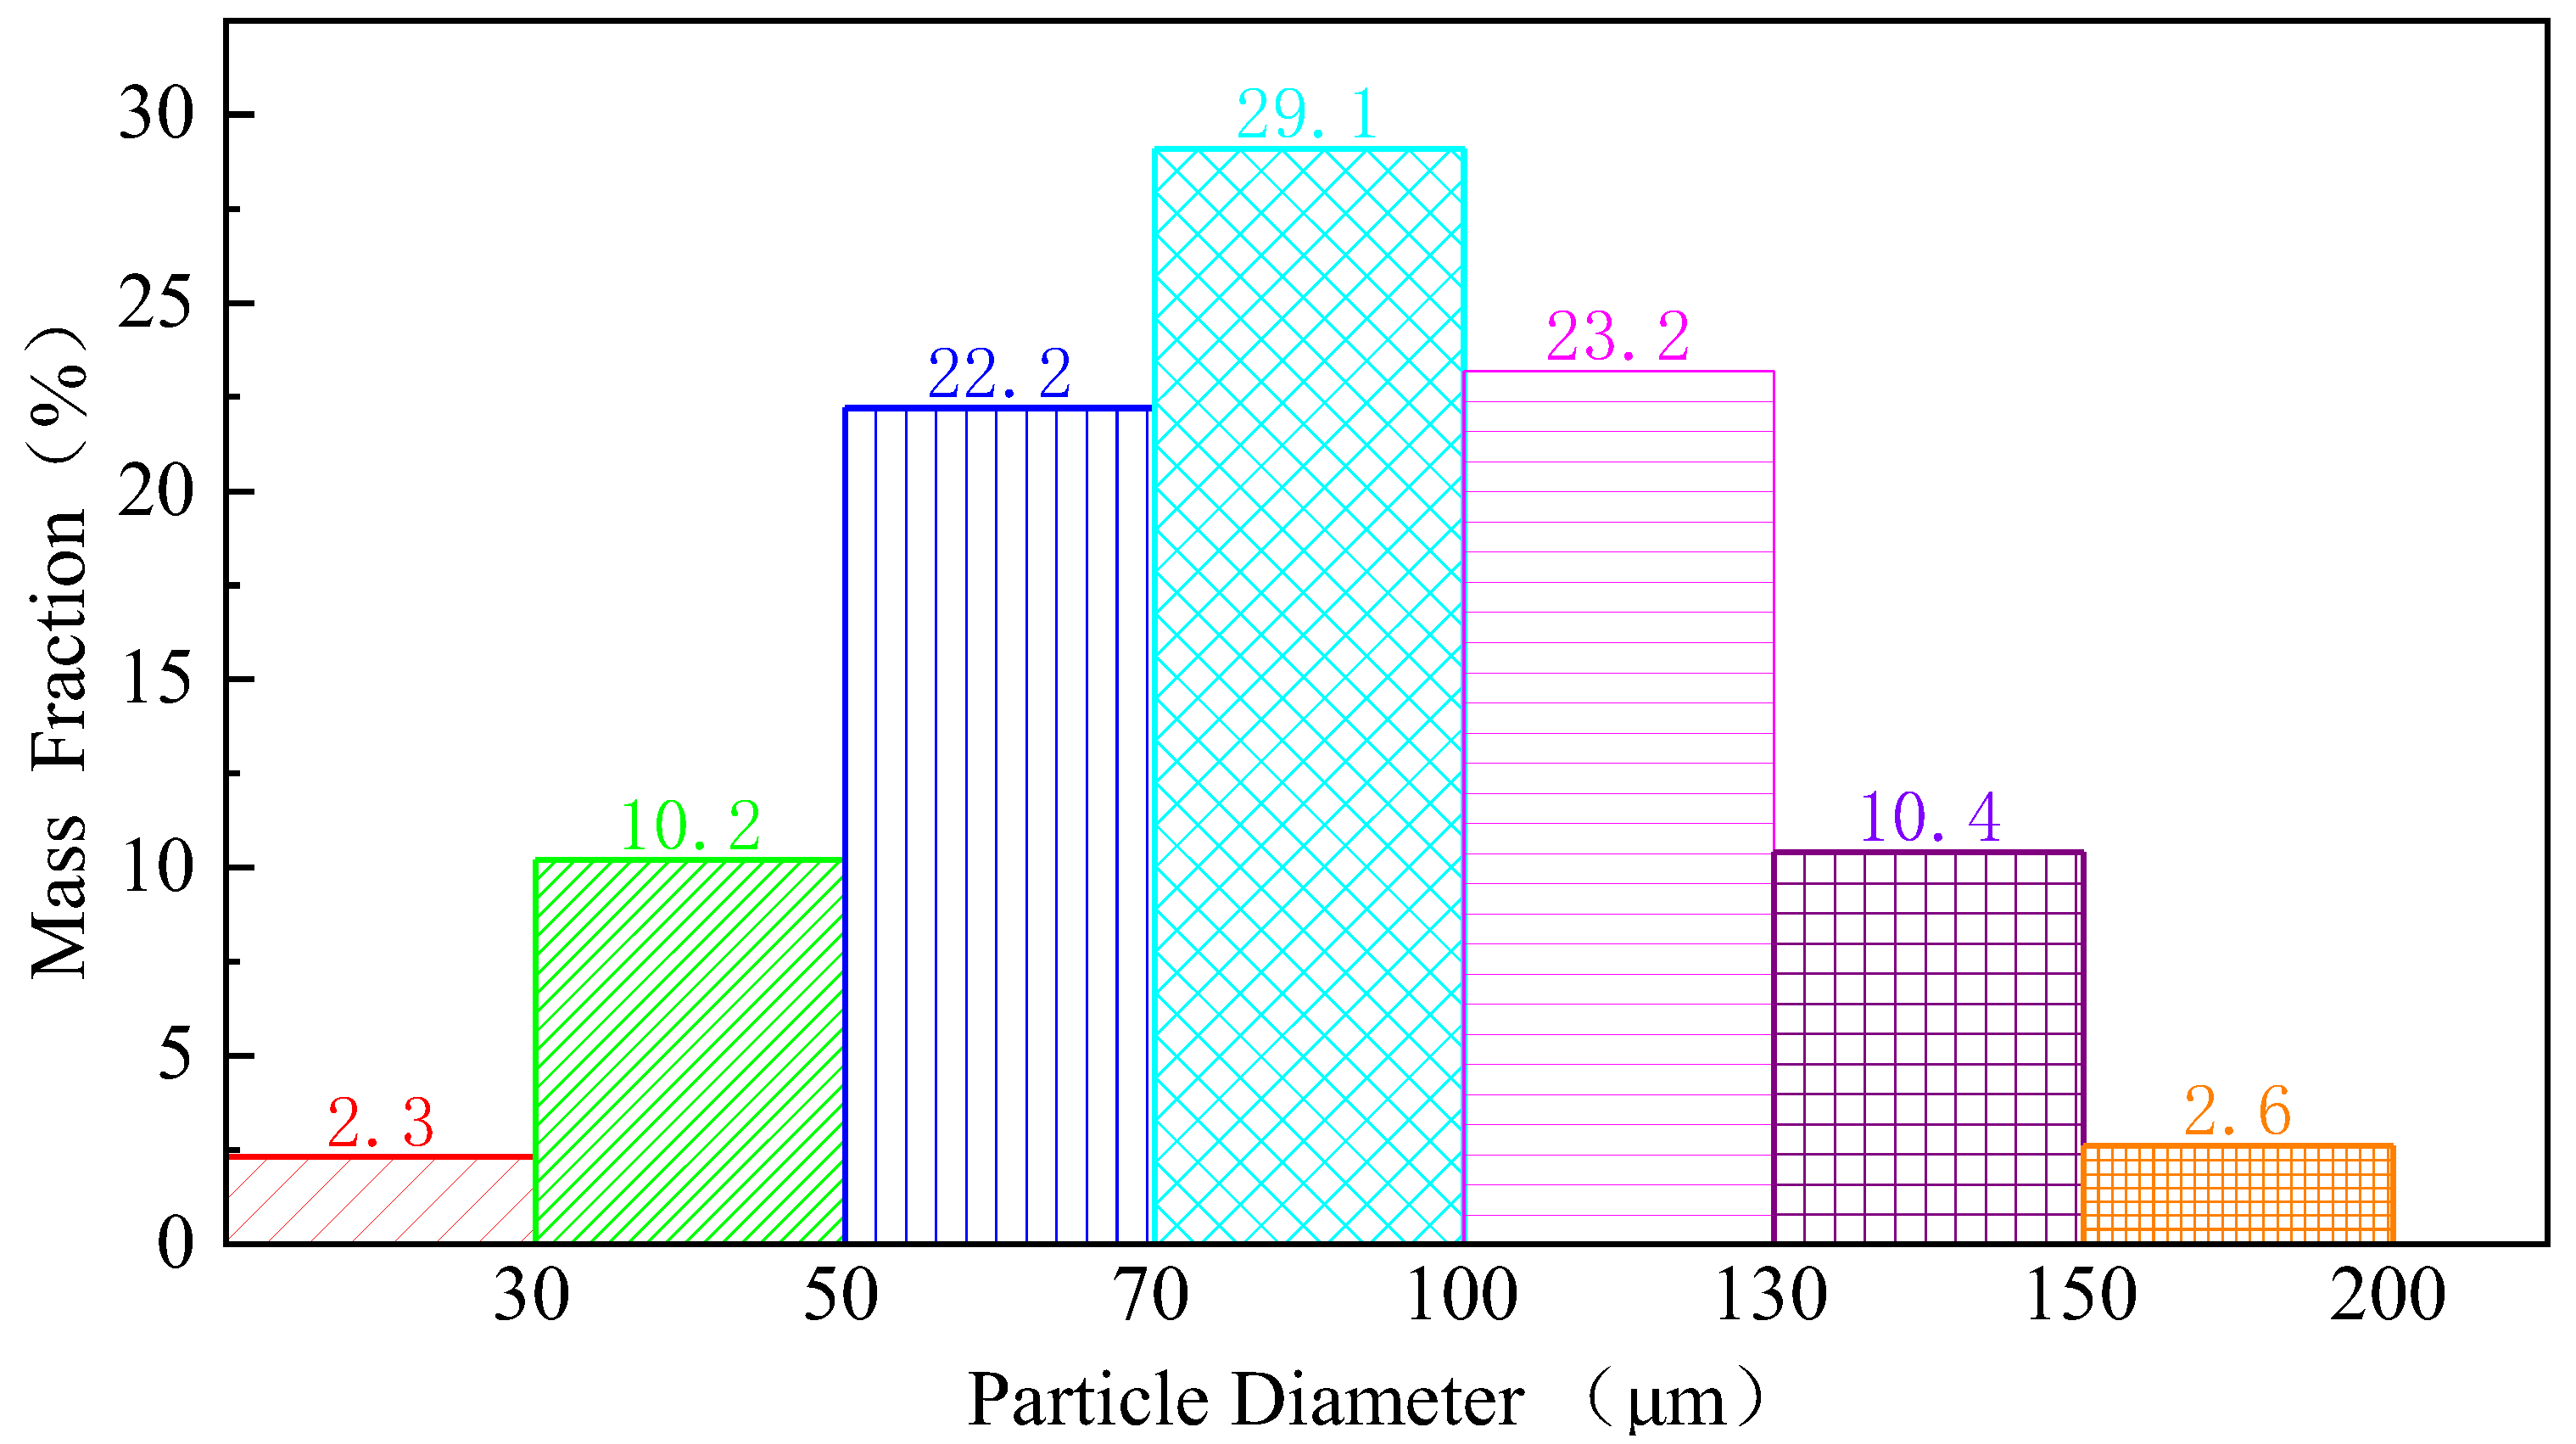
2. Performance Analysis of a New Composite Spraying Slurry
3. Selection of the Two-Fluid Model and Calculation Parameters
3.1. Selection of the Two-Fluid Model
3.2. Calculation Conditions and Parameters
4. Migration and Distribution Characteristics of Dust Produced in the Spraying Process
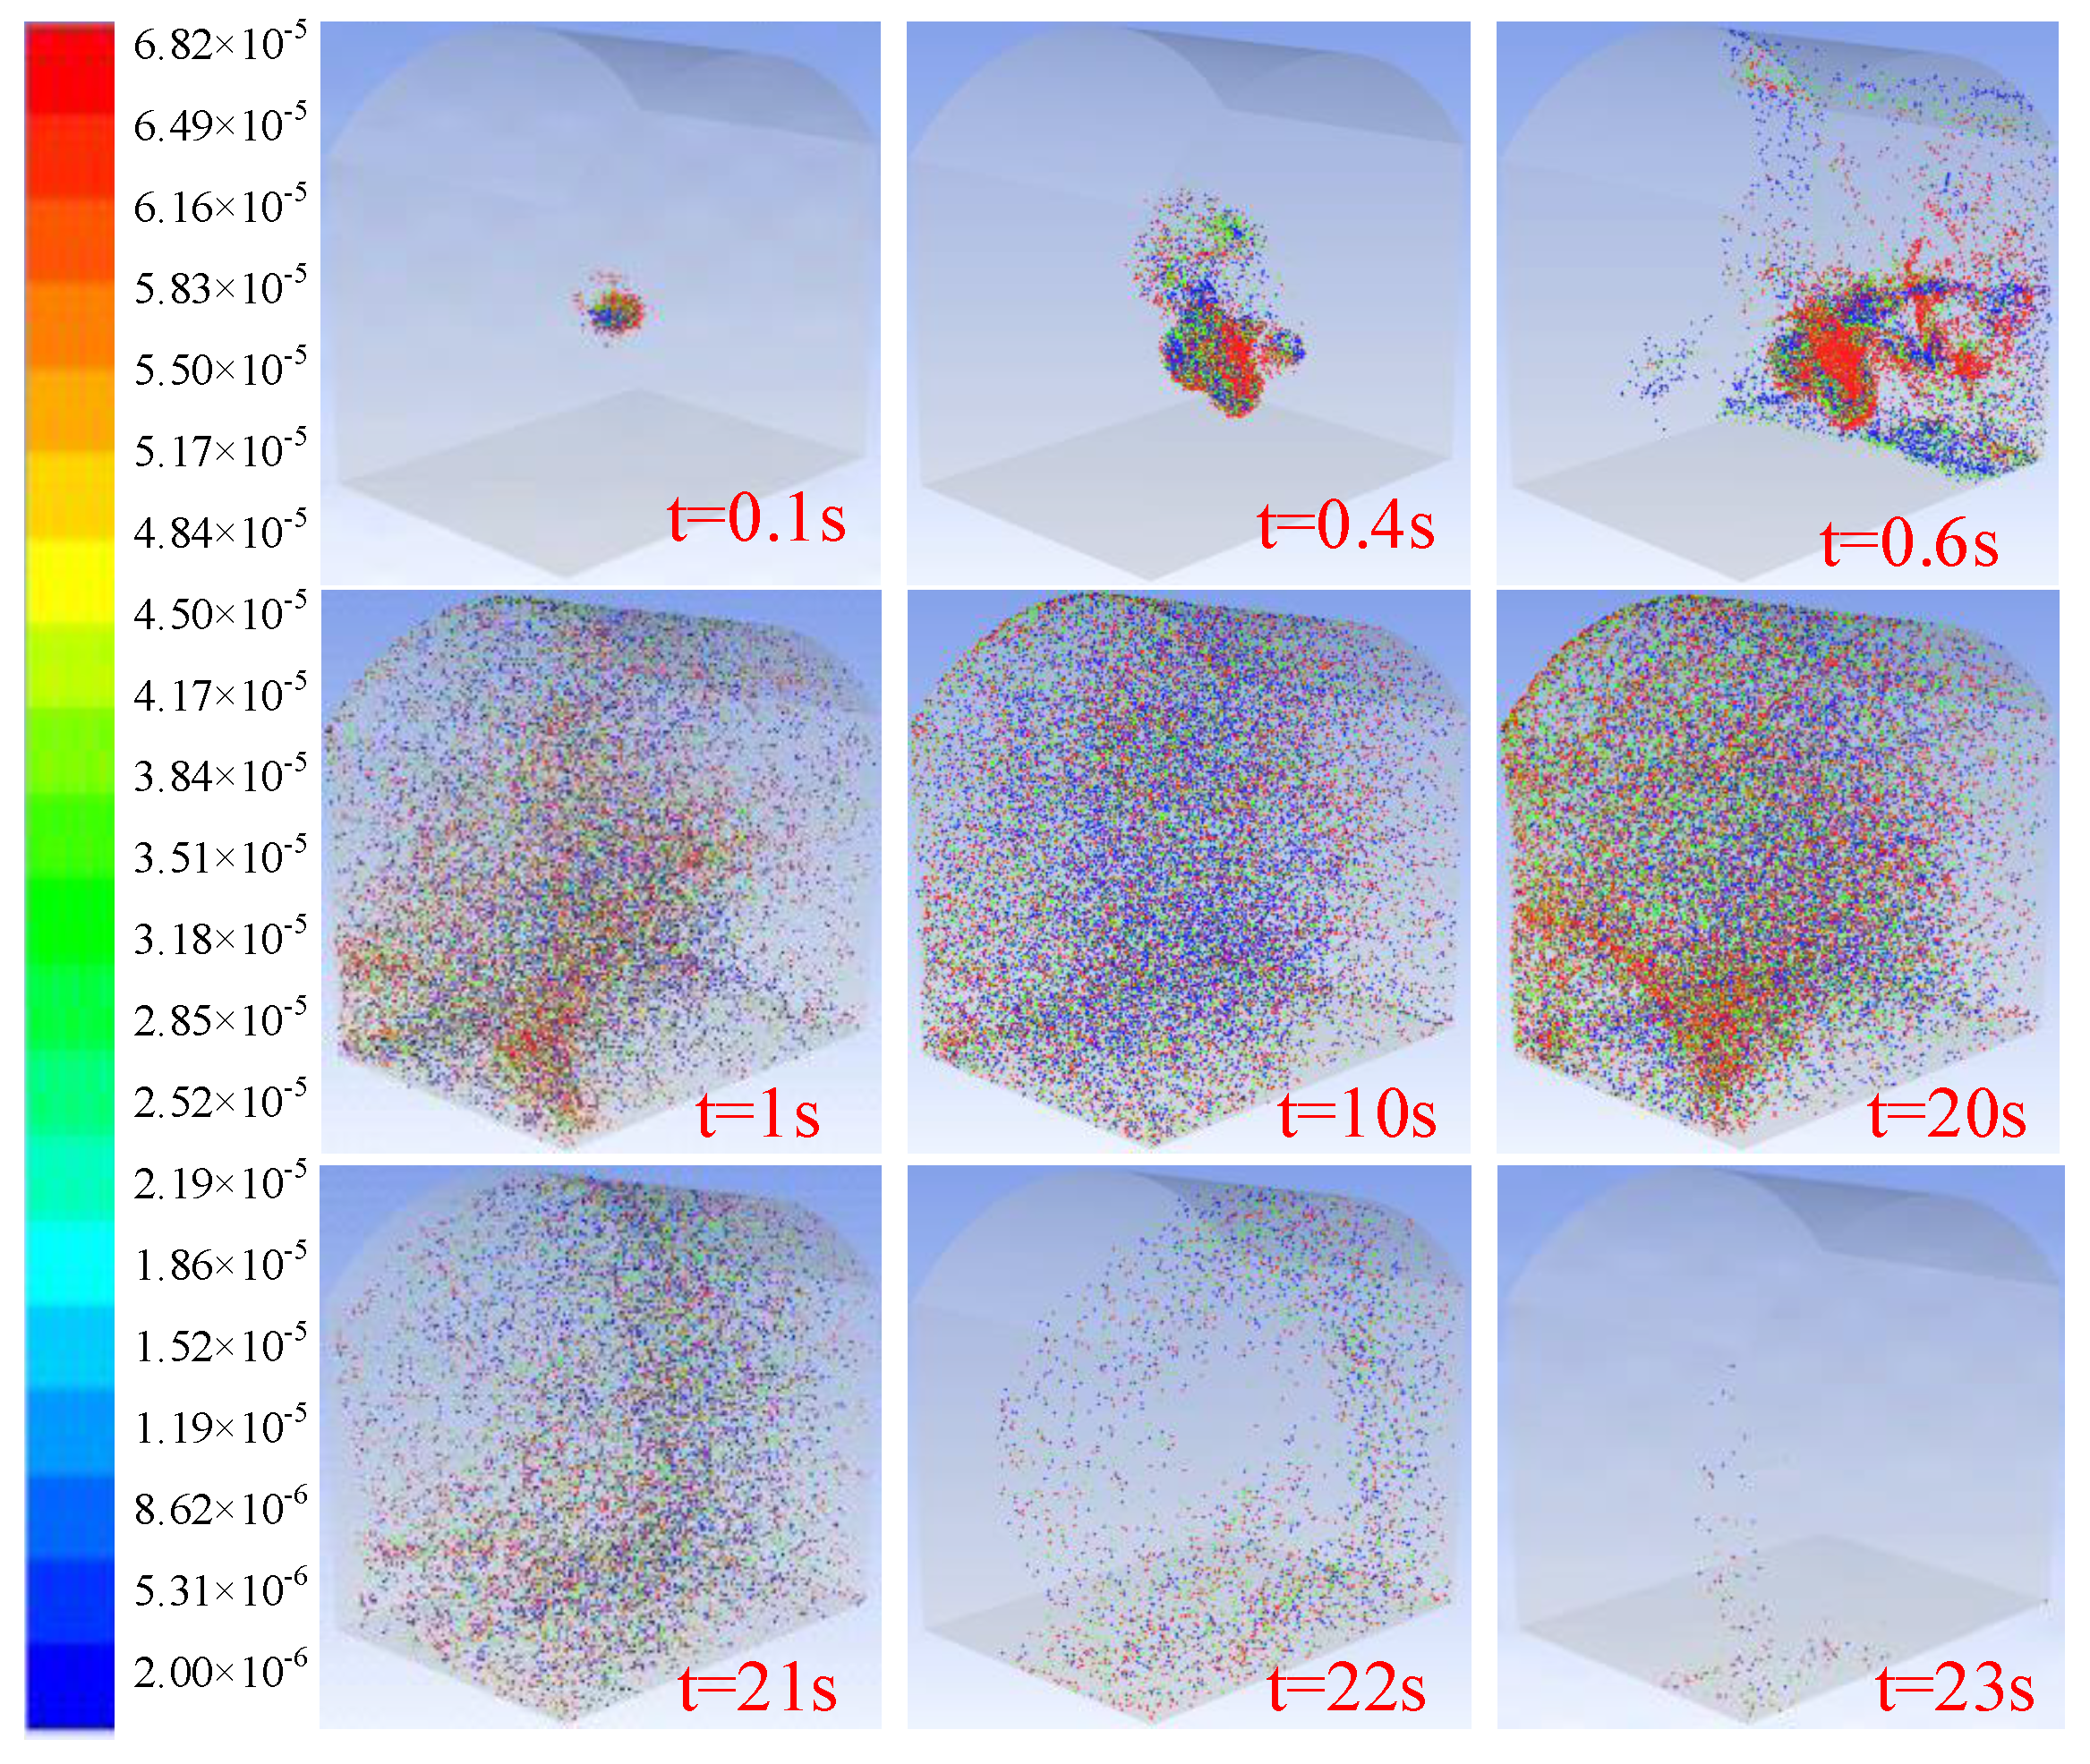
4.1. Dust Distribution with or without Spray
- (1)
- Dust distribution without spray
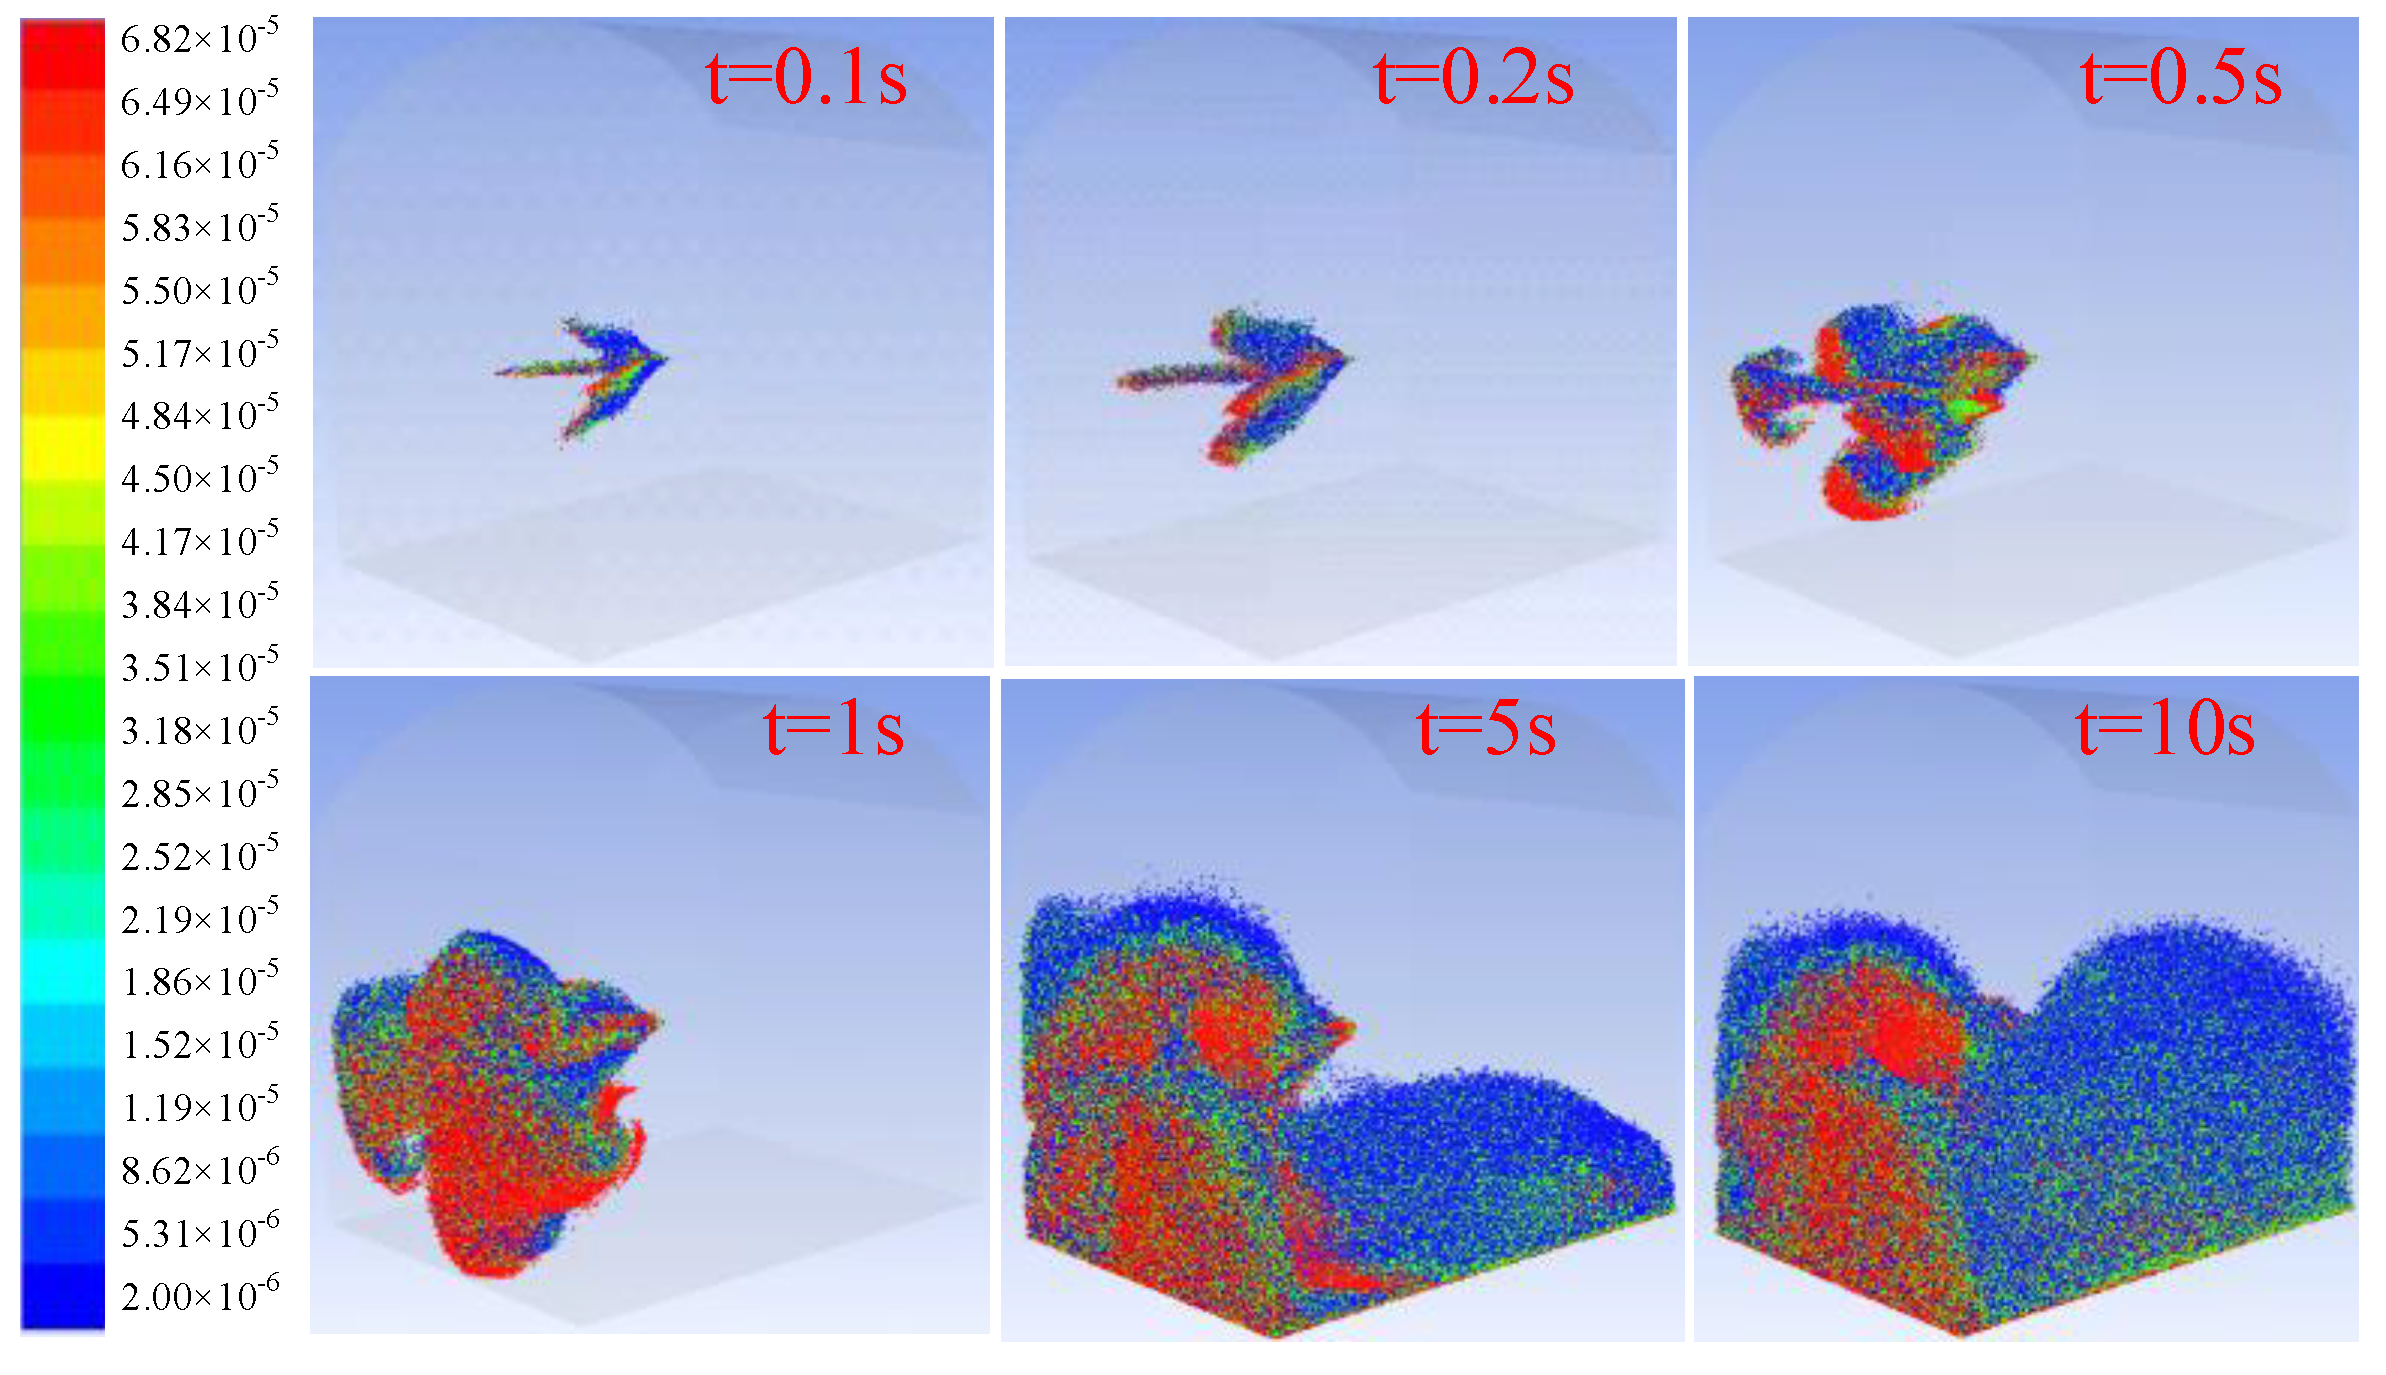
- (2)
- Dust distribution with spray
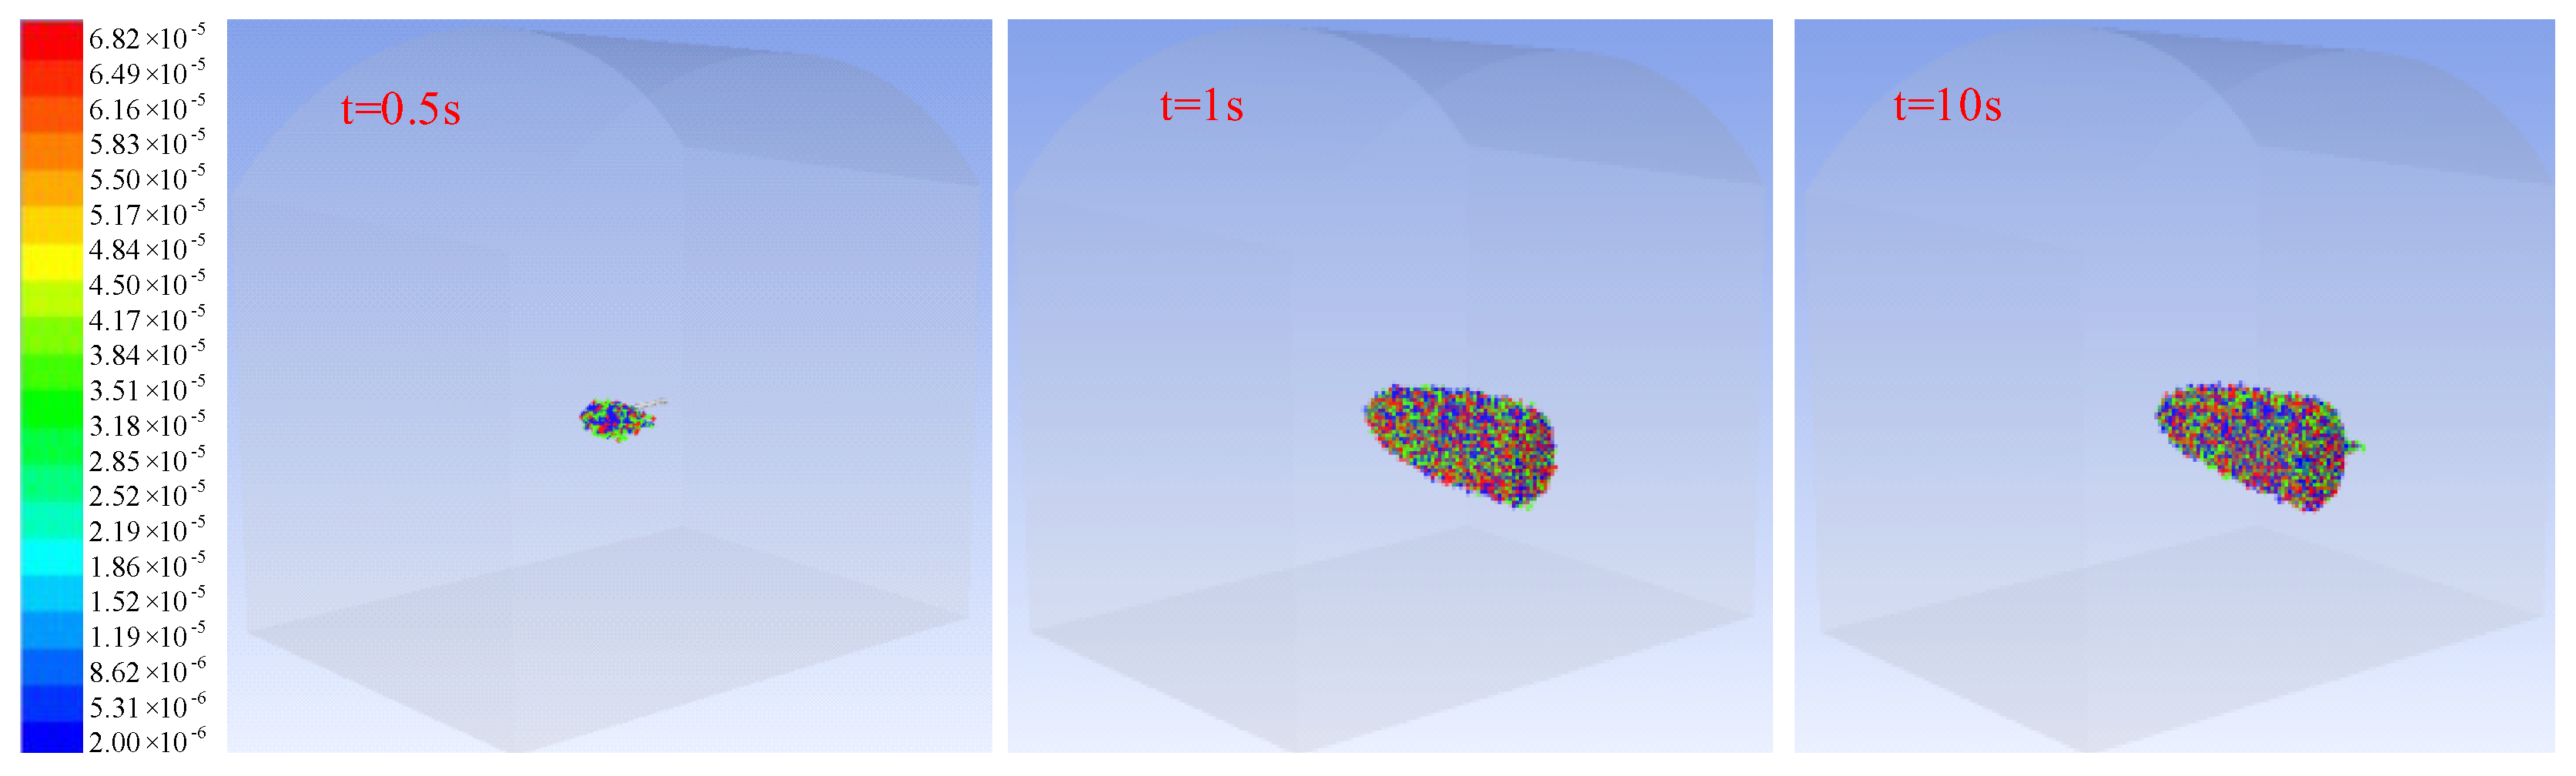
4.2. Temporal and Spatial Distribution of Dust
- (1)
- Temporal and spatial distribution of total dust
- (2)
- Dust distribution with different particle sizes
4.3. Influence of the Spray Angle of the Water Mist
- (1)
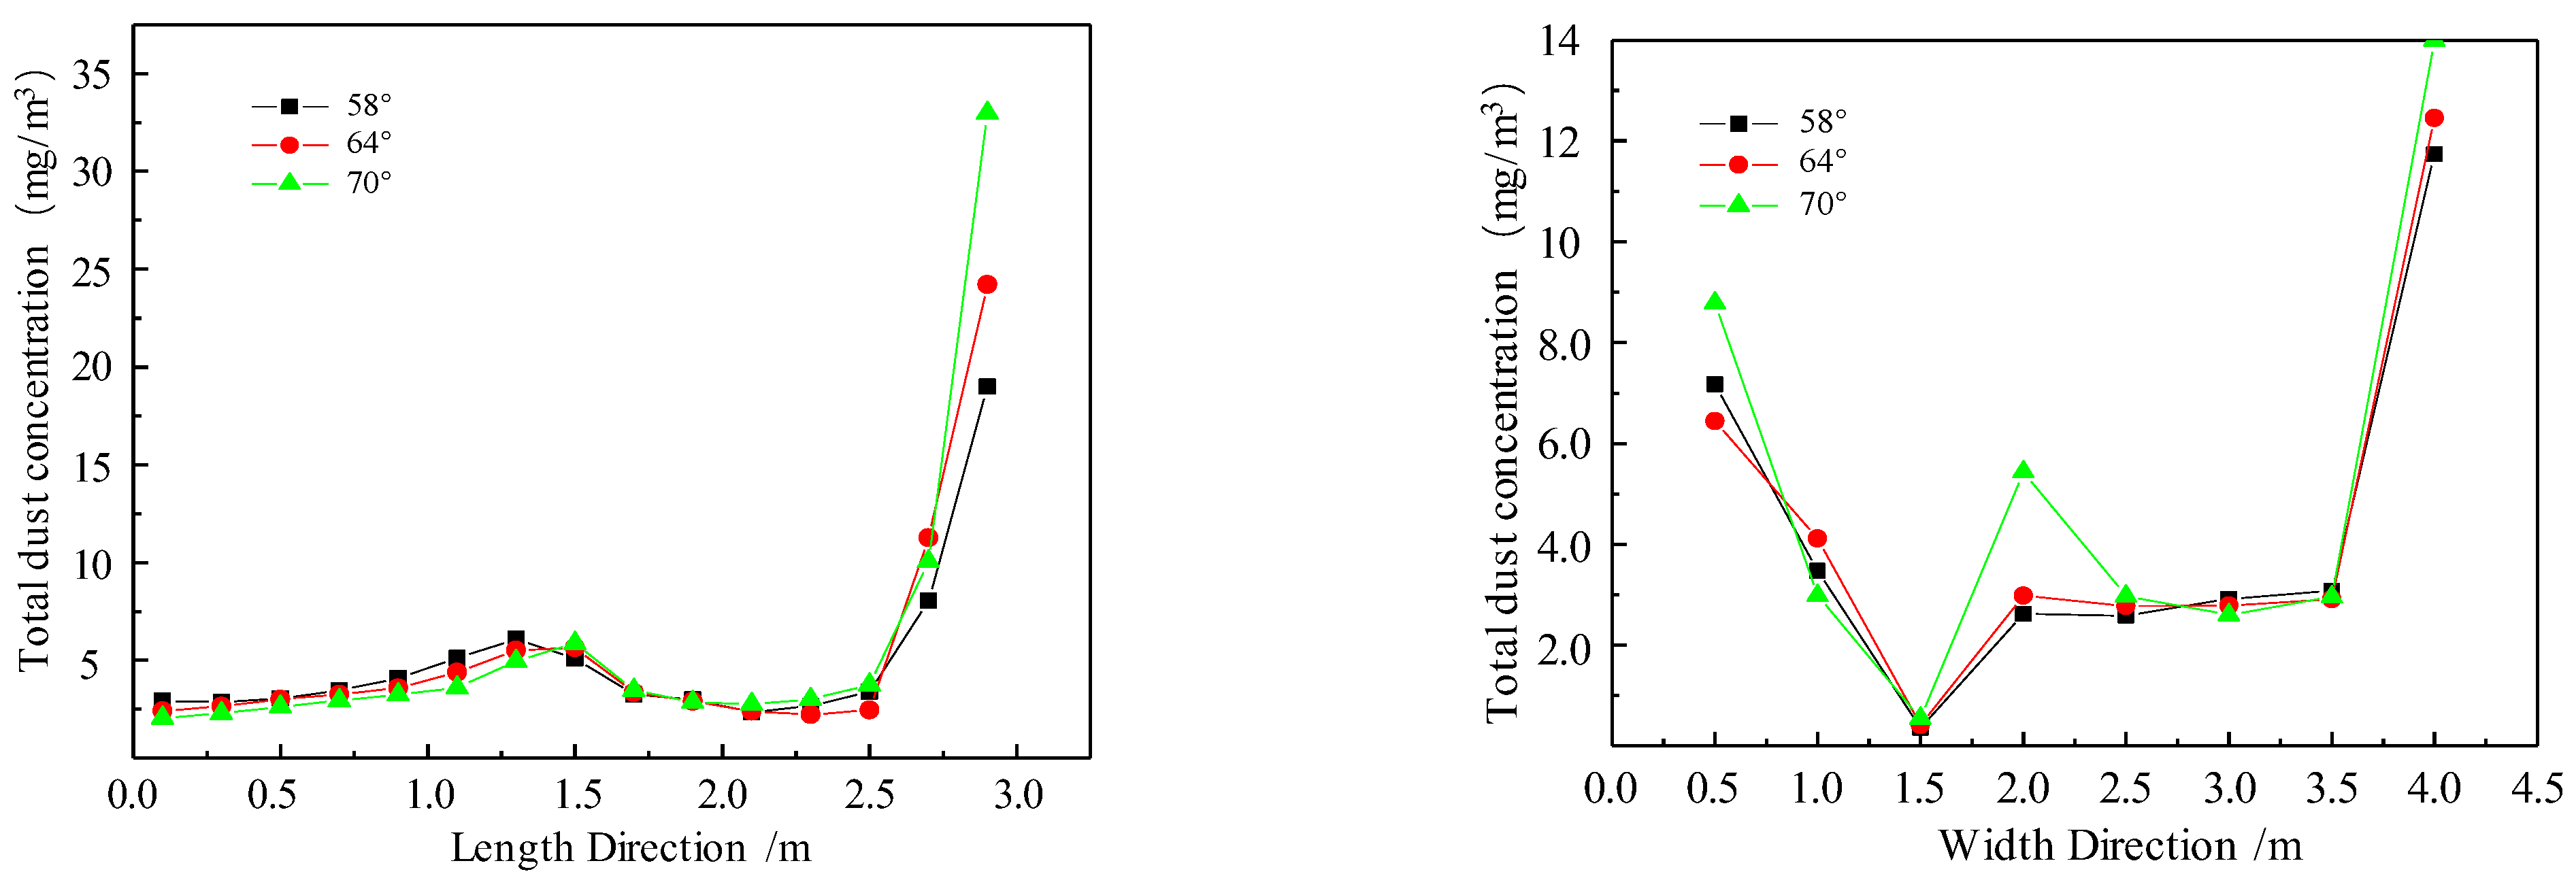
- Temporal and spatial distribution of the total dust
- (1)
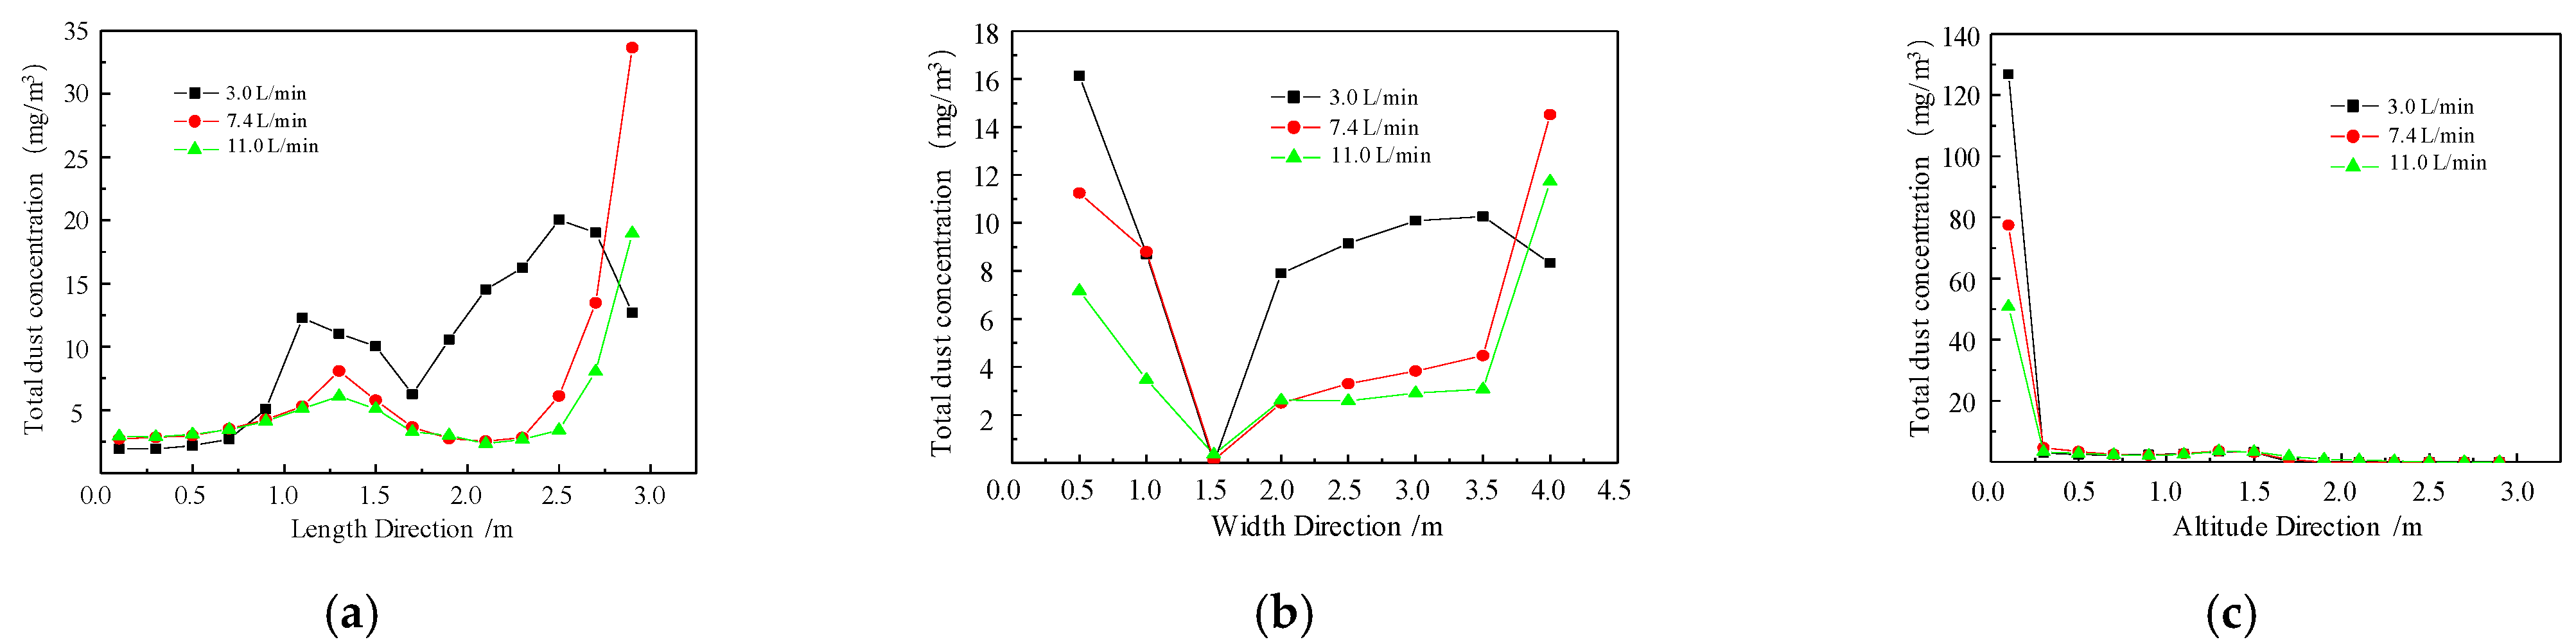
- In the length direction, the dust flows out from the air supply outlet to the outlet, and its concentration gradually increases to 5 mg/m3 (dust source location). Then, the dust concentration gradually decreases and increases rapidly near the outlet.
- (2)
- In the width direction, the dust concentration on both sides of the wall is higher, and the dust concentration near the spraying surface is significantly higher than that of the non-spraying surface. At the same time, the dust concentration near the two sides is larger when the spraying angle is 70°.
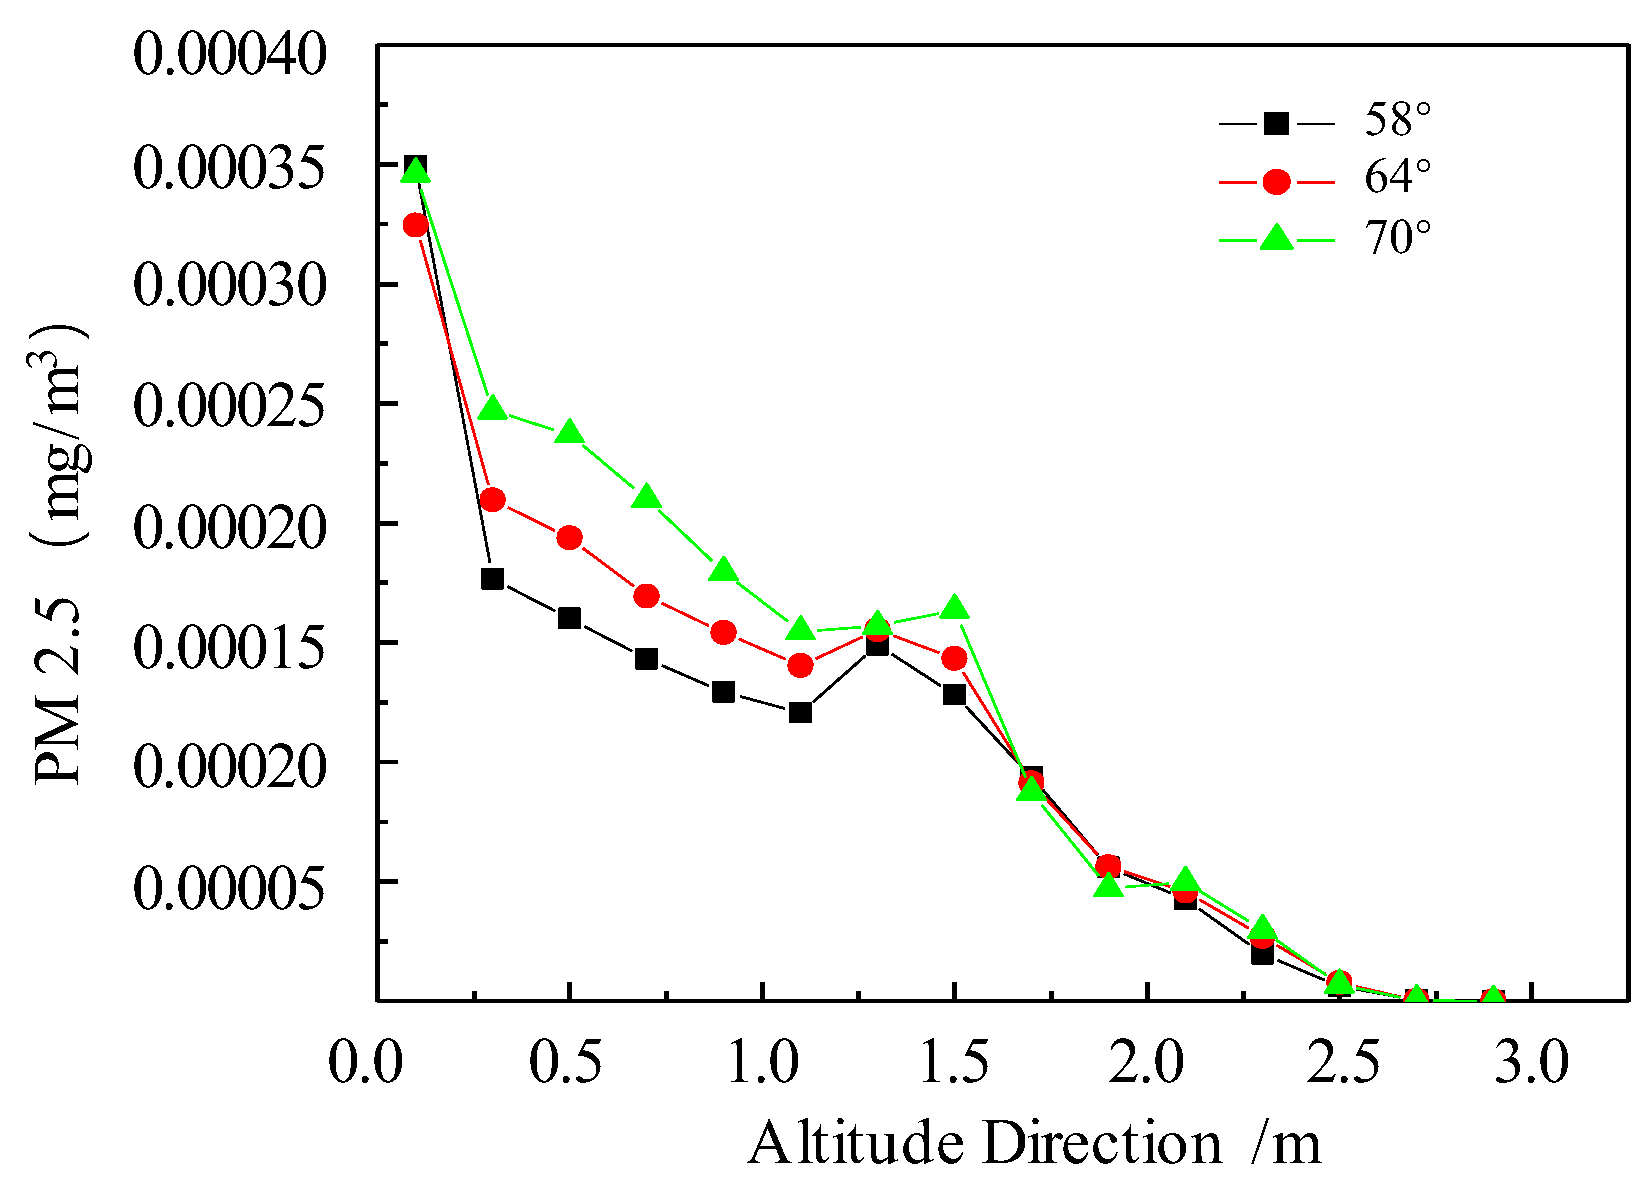
- (3)
- PM2.5 distribution
4.4. Effect of Spray Water Velocity
- (1)
- Temporal and spatial distribution of the total dust
- (2)
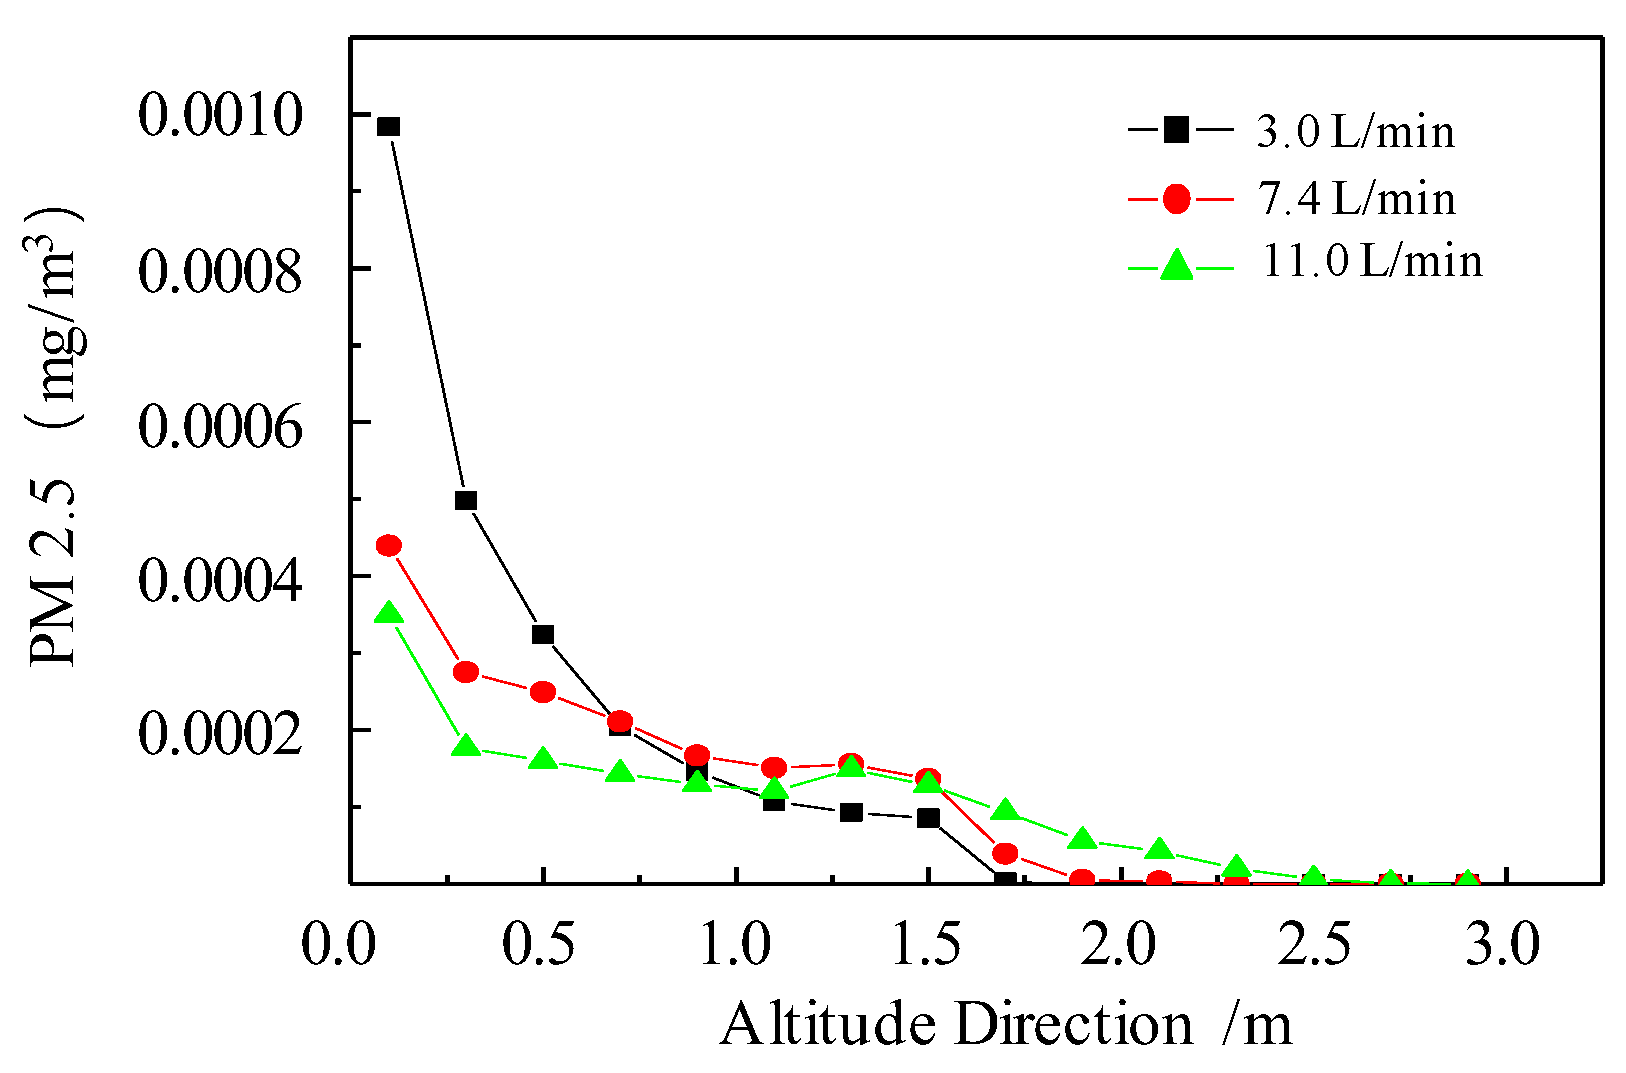
- Temporal and spatial distribution of PM2.5
5. Conclusions
- (1)
- The composite spraying slurry with clay as the main base material has a good sealing performance, certain bending resistance, and good adhesion, which can be used for the air leakage plugging technology of spraying in roadways.
- (2)
- The distribution of solid dust is determined by the distribution of the water phase under the action of spray. The distribution area of dust is similar to that of the water phase, mainly at the two sides and near the bottom of the roadway. Compared with the non-spray condition, the effect of the spray dust reduction is obvious.
- (3)
- Under the action of spraying, the bottom area of the roadway is covered by dust flow, and the dust stratification phenomenon is obvious in this area. The dust particle size gradually decreases from the bottom to the top, and the large particle size dust is deposited at the bottom, while the small particle size dust is suspended at a certain height; the diffusion area is gradually increased.
- (4)
- The influence of spray angle on dust is mainly reflected in the initial dust flow shape and dust diffusion time. The larger the spray angle is, the faster the diffusion is. The influence of spray angle on the diffusion of dust, especially PM2.5, is mainly concentrated in the middle and lower regions.
- (5)
- When calculating the velocity, the dust concentration is larger in the whole nozzle area. However, in the area higher than 1.5 m, the concentration of PM2.5 increases with the increase in water flow, which indicates that the dust suppression effect of a larger water flow is mainly reflected in the bottom area, and the disturbed surrounding airflow can make PM2.5 diffuse to higher areas.
Author Contributions
Funding
Data Availability Statement
Conflicts of Interest
References
- Wang, D.M. Mine Fires; China University of Mining and Technology Press: Xuzhou, China, 2007. [Google Scholar]
- Xian, X.F.; Wang, H.T.; Jiang, D.Y.; Liu, B.X. The summarization of the investigation on coal mine fire prevention & fire extinguishing techniques in China. Eng. Sci. 2001, 12, 28–32. [Google Scholar]
- Zhou, F.B.; Shi, B.B.; Liu, Y.K.; Song, X.L.; Cheng, J.W.; Hu, S.Y. Coating material of air sealing in coal mine: Clay composite slurry (CCS). Appl. Clay Sci. 2013, 80–81, 299–304. [Google Scholar] [CrossRef]
- Yao, J.; Wang, X.; Tian, D.; Zhang, Q. Experimental study on the performance of phosphogypsum and fly ash cemented filler. Min. Res. Dev. 2006, 26, 44–48. [Google Scholar]
- Luo, Z.; Deng, J.; Yang, Y. Study on properties of hydrogel sealing filling material in underground disaster areas. J. China Univ. Min. Technol. 2007, 36, 748–751. [Google Scholar]
- Wang, S.; Wu, H. Application of new polymer grouting material Malisan in water plugging and shaft wall reinforcement of Wangfenggang No. 1 auxiliary shaft. Friends Chem. Ind. 2007, 1, 40–42. [Google Scholar]
- Li, A.; Long, W. Experimental study on light quick setting plugging material. Concrete 2003, 4, 33–34. [Google Scholar]
- Hu, C.; Yu, S.; Wang, H. Application of new polymeric materials in prevention and control of spontaneous combustion. Coal Mine Saf. 2003, 34, 35–36. [Google Scholar]
- Sun, G.; Liu, Y.; Feng, F.; Sun, H.; Bian, K.; Hu, K. Research progress of polyurethane foam. Mater. Guide 2006, 20, 29–36. [Google Scholar]
- Chen, J.; Wang, Z.; Fan, P.; Wang, X. Application of fly ash in underground filling of Xinqiao Pyrite Mine. Met. Mines 2001, 8, 36–38. [Google Scholar]
- Fan, W.; Geng, Y.; Han, J.; Wang, Y. Study on Parameter Optimization of high performance shotcrete. J. Coal 1999, 24, 481–484. [Google Scholar]
- Nie, W.; Zhang, Q.; Bai, R.; Yu, H.; Ma, X.; Liu, W. Numerical simulation of airflow dust transport law in roadway wet spraying operation. J. Saf. Environ. 2015, 15, 73–77. [Google Scholar]
- Zhou, G.; Zhang, Q.; Cheng, W.; Chen, L.; Feng, K.; Nie, W. Numerical simulation of shotcrete dust in coal mine anchor shotcrete operation area and development of a new wet shotcrete integrated machine. J. Cent. South Univ. (Nat. Sci. Ed.) 2016, 47, 606–614. [Google Scholar]
- Guo, J.; Shen, H.; Sun, M.; Liang, Z. Internal flow field analysis of a new ejector. Fluid Mach. 2009, 37, 25–28. [Google Scholar]
- Zhang, B.; Zhou, H.; Chang, Q.; Zhao, X.; Sun, Y. The Stability Analysis of Roadway near Faults under Complex High Stress. Adv. Civ. Eng. 2020, 2020, 8893842. [Google Scholar] [CrossRef]
- Lu, Z.; Lei, Z.; Nadeem, Z.M. Synthesis and performance characterization of an efficient environmental-friendly Sapindus mukorossi saponins based hybrid coal dust suppressant. J. Clean. Prod. 2021, 306, 127261. [Google Scholar] [CrossRef]


| Test Specimen | True Specific Gravity (g/cm3) | Apparent Specific Gravity (g/cm3) | Porosity |
|---|---|---|---|
| Test block | 1.2134 | 0.8165 | 32.71 |
| Micropore | Minipore | Mesopore | Macropore | Visible Pore | Total Surface Area (m2/g) | |
|---|---|---|---|---|---|---|
| Area (m2/g) | 1.5897 | 1.7963 | 2.9765 | 0.06 | 0 | 6.4225 |
| Percentage (%) | 24.75 | 27.97 | 46.34 | 0.94 | 0 |
| Micropore | Minipore | Mesopore | Macropore | Visible Pore | Adsorption Volume (cm3/g) | Permeation Volume (cm3/g) | Total Pore Volume (cm3/g) | |
|---|---|---|---|---|---|---|---|---|
| Volume (cm3/g) | 0.0034 | 0.0105 | 0.3156 | 0.0855 | 0.0012 | 0.0034 | 0.4128 | 0.4162 |
| Percentage (%) | 0.82 | 2.52 | 75.82 | 20.54 | 0.30 |
| Model | Define |
|---|---|
| Solution method | Pressure based unsteady implicit method |
| Turbulence model | K-e model |
| Two-fluid model | Euler–Euler |
| K-e model | dispersed |
| Velocity–pressure coupling method | Phase-coupled simple algorithm |
| Residual convergence criteria | 0.001 |
| Time step | 0.001 s |
| Gas phase | continuity |
| Aqueous phase | continuity |
| Properties | Value |
|---|---|
| Roadway section size (m) | 3 × 4 × 4 (vault) |
| Dust size range (m) | 2 × 10⁻⁶~3 × 10⁻⁴ |
| Average particle size of dust (m) | 2 × 10⁻⁵ |
| Average dust density (kg/m3) | 1400 |
| Air viscosity (kg/(m·s)) | 1.7894 × 10⁻⁵ |
| Air density (kg/m3) | 1.225 |
| Viscosity of water (kg/(m·s)) | 1.003 × 10⁻³ |
| Density of water (kg/m3) | 998.2 |
| Powder absorption (kg/s) | 0.01/0.038/0.06 |
Publisher’s Note: MDPI stays neutral with regard to jurisdictional claims in published maps and institutional affiliations. |
© 2022 by the authors. Licensee MDPI, Basel, Switzerland. This article is an open access article distributed under the terms and conditions of the Creative Commons Attribution (CC BY) license (https://creativecommons.org/licenses/by/4.0/).
Share and Cite
Liu, C.; Shao, S.; Su, X.; Zhang, Z.; Sun, Z.; Zhang, B. Study on Temporal and Spatial Distribution and Transport Characteristics of Dust in New Composite Spraying Slurry. Minerals 2022, 12, 1182. https://doi.org/10.3390/min12101182
Liu C, Shao S, Su X, Zhang Z, Sun Z, Zhang B. Study on Temporal and Spatial Distribution and Transport Characteristics of Dust in New Composite Spraying Slurry. Minerals. 2022; 12(10):1182. https://doi.org/10.3390/min12101182
Chicago/Turabian StyleLiu, Changan, Sihua Shao, Xueyou Su, Zhongru Zhang, Zhimeng Sun, and Biao Zhang. 2022. "Study on Temporal and Spatial Distribution and Transport Characteristics of Dust in New Composite Spraying Slurry" Minerals 12, no. 10: 1182. https://doi.org/10.3390/min12101182