1. Introduction
The borehole induced polarization method (hereinafter referred to as the borehole IP) is an effective borehole geophysical method for the exploration of polymetallic and precious metal sulfide deposits, especially blind orebodies [
1]. The method fully relies on the known borehole information and plays an important role in discovering blind orebodies near the borehole and bottom hole, tracing the mineralized zone, estimating the depth of the ore, and verifying the surface-induced polarization anomaly.
The current IP detection technique and devices are mainly based on ground detection [
2,
3,
4], such as the Elrec-6 IP (Iris, France), the IPR series IP/resistivity meter (Scin-trex, Canada), and the GDD IP system (Canada). The detection depth can reach as high as 2000 m [
5].
The Institute of Geophysical and Geochemical Exploration (IGGE) of China has introduced a high-power PEM system with a 2000 m detection depth and has developed the IGGETEM-20 transient electromagnetic instrument, which is suitable for a 2000 m three-component surface-borehole transient electromagnetic method (TEM) measurement system [
6]. The DS-2 dual-frequency IP device developed by Hunan Jishan Gaoke Company, the DGS-9 IP device developed by Beijing Geological Instrument [
7,
8], and the WDJD-4 multi-functional digital DC IP device developed by the Chongqing Pentium Company all have powers of less than 20 kW [
9], and their exploration depths are less than 1000 m. Thus, these systems are basically still ground IP systems. No reports on the use of these instruments in deep exploration have been published.
To the best of our knowledge, there is no report on the use of any IP device in deep exploration (more than 2000 m). Moreover, the use of time-domain electromagnetic array receiving devices in high-temperature and high-pressure boreholes in metal mines is also rare. In the current borehole IP method, only the sensors are sent down the hole, and the data are transmitted back to the ground surface. The transmitting power is usually small, and thus, it is only suitable for low-depth exploration and cannot be used for deep exploration at depths greater than 2000 m. Therefore, in this study, we describe the design of an array receiving system in the borehole in order to facilitate mine exploration within a depth of 3000 m.
2. Materials and Methods
IP refers to the phenomenon that rocks and ores produce under an electrochemical secondary electric field under the action of an external current field [
10]. A steady current (low frequency) is injected underground through a power supply electrode, and then the voltage difference is measured at both ends with the measuring electrode. It is found that the earth, rock and ore produce secondary electric fields under the action of an external current field. This secondary electric field has nothing to do with dielectric polarization and induction but is the result of a series of complex electrochemical interactions between solid substances (ore and rock particles) in the ore and the interface of the electrolyte solution [
10,
11].
The IP method is a branch of electromagnetic exploration, which is based on the difference in the IP effects (chargeability) of different rocks and ores in the crust. Specifically, observation and analysis of the distribution of the DC (time domain) or AC (frequency domain) in the IP field are used to explore new mines and solve geological problems [
12,
13].
The borehole IP method can minimize external interferences and enhance the IP anomaly response compared to surface measurements. The power supply can be on the ground surface or in the borehole; the voltage and voltage difference of the electrode measurement systems with different configurations are observed for the entire waveform. The variations in the IP effect and apparent resistivity of the underground longitudinal and transverse rocks are studied, thereby detecting blind orebodies around or at the bottom of the borehole, tracking the range of the ore body or mineralization zone, and determining the electrical continuity of the rock and ore layer in adjacent boreholes.
The basic modes of operation of the borehole IP method can be divided into three types [
14,
15].
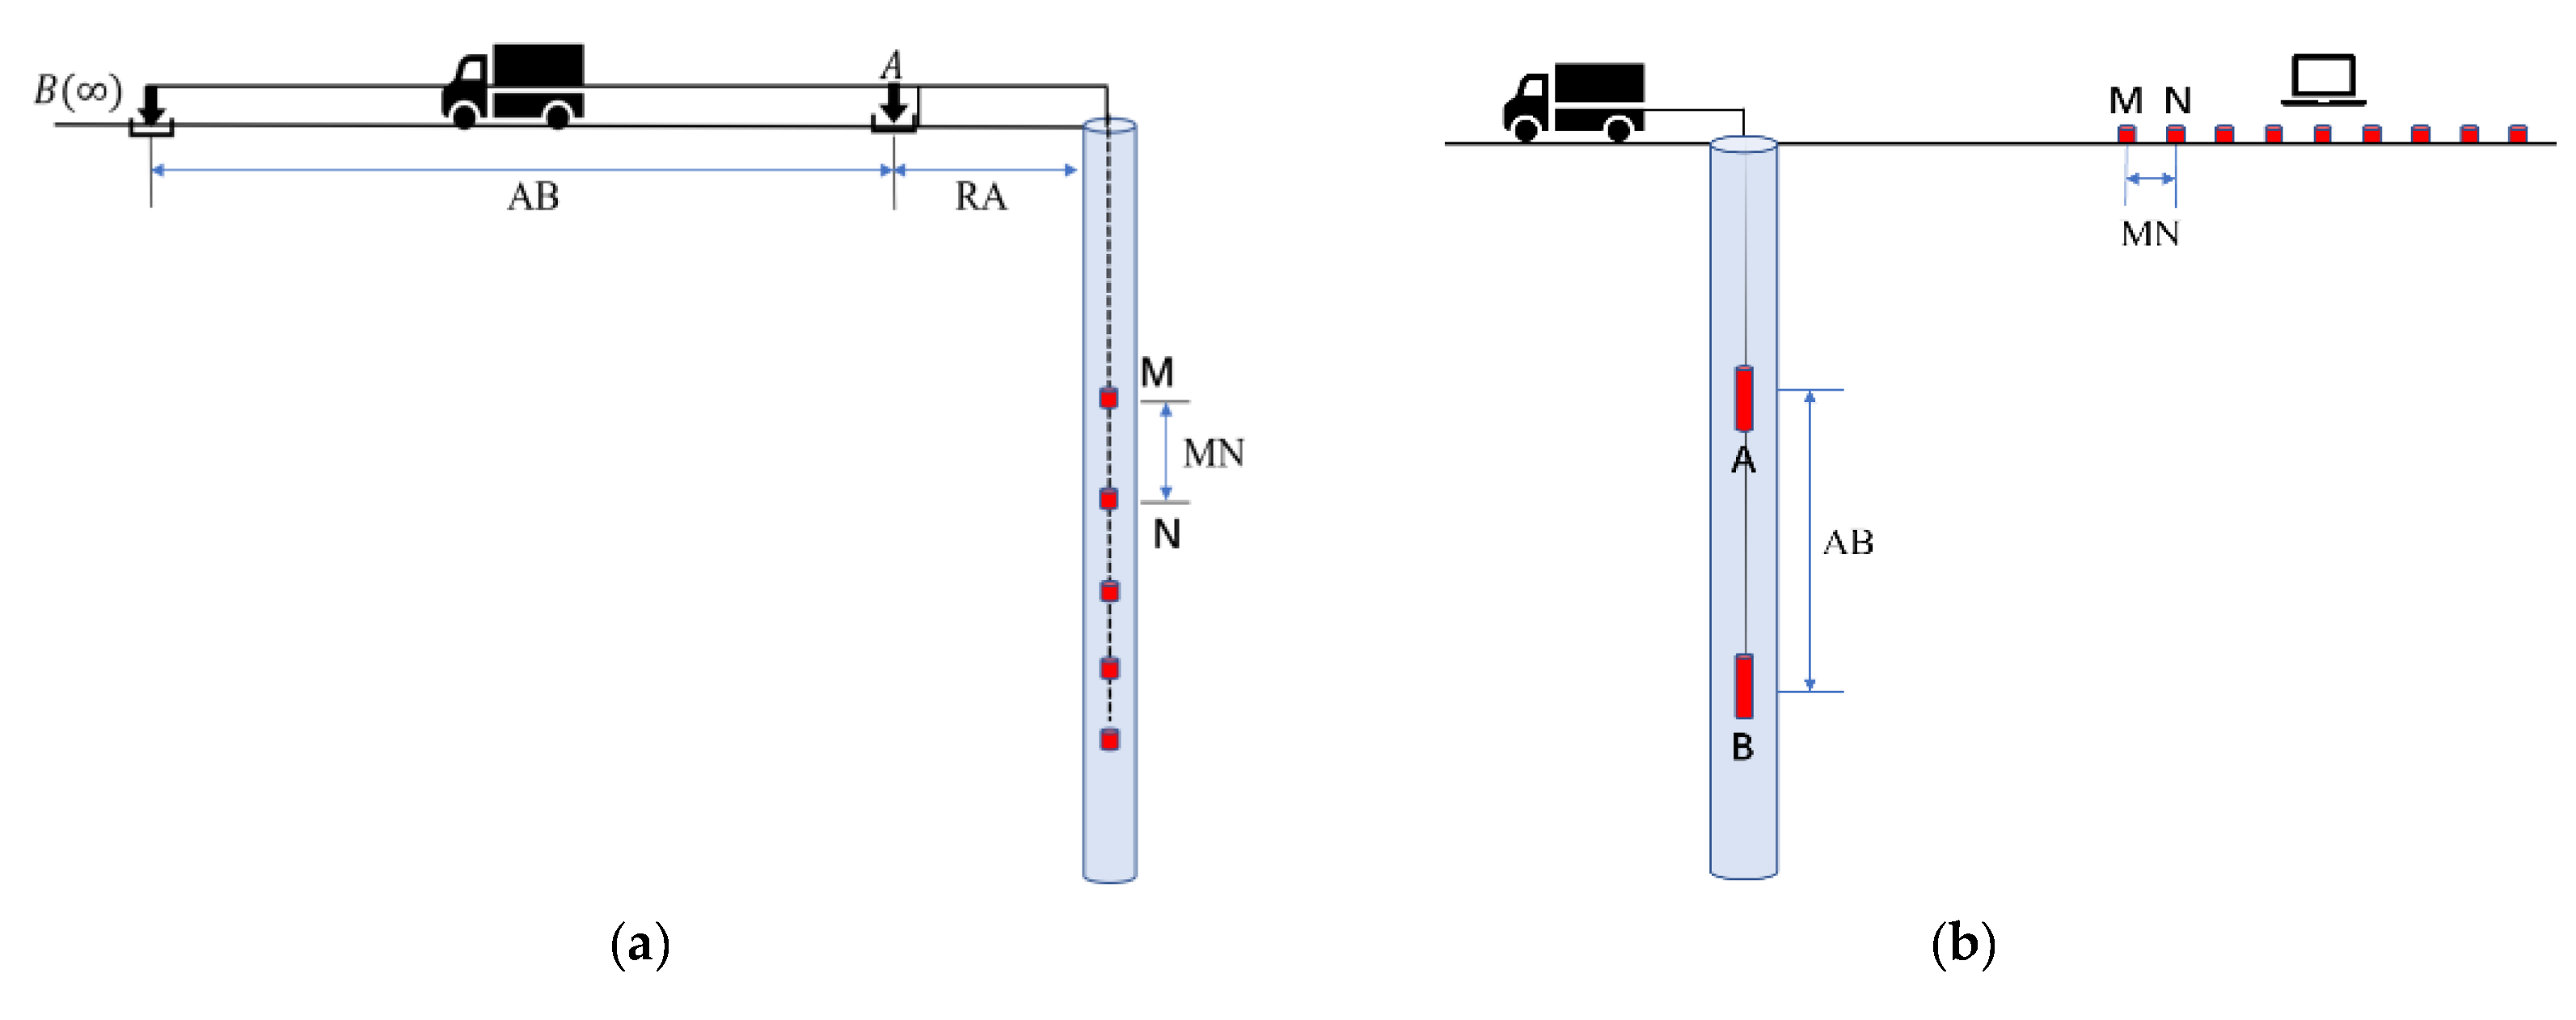
(1) Surface-borehole mode (
Figure 1a): Power supply electrode A is placed on the ground surface, power supply electrode B is placed at ‘infinity,’ and the measurement device MN is placed in the borehole for the IP measurements.
(2) Borehole-surface mode (
Figure 1b): Power supply electrode A is placed in the borehole, electrode B is placed at the ‘infinity’ pole or in the borehole, and the measurement device is located on the ground surface.
(3) Borehole-borehole mode: This can be further divided into two types. When the power supply electrode A and the measurement device are placed in the same borehole for IP measurement, the B-electrode is in infinity, this is referred to as the single borehole mode (
Figure 1c). When power supply electrodes A and B are in one borehole and the measurement device is in another adjacent borehole, this is referred to as the double borehole mode (
Figure 1d).
As is shown in
Figure 2, a steady current
I is supplied to the rock ore for a certain time
T. After the power is cut off at
t = 0, the voltage attenuation
is observed, and
t is the discharge time. The electric voltage difference
(polarization electric voltage difference) is the sum of the primary electric voltage difference
and the secondary electric voltage difference
:
When the power supply of A and B is cut off, the primary electric voltage difference disappears immediately, and the polarized body discharges through the specimen itself and the surrounding solution due to the IP voltage. In addition, the secondary electric voltage difference
will gradually decay to 0. Practical applications have shown that the secondary electric voltage difference at saturation is equal to the secondary electric voltage difference at the moment the power is cut off [
16,
17]:
Under the condition that there is a linear relationship between the secondary voltage and the current, the chargeability
is defined as
Thus, the chargeability is the ratio of the instantaneous value of the electric voltage difference [
10]. It is dimensionless and can be expressed as a percentage. Because
and
are both proportional to the current, the chargeability is independent of the current, but it is related to the power supply time
T and the discharge time
t.
Based on the measured primary voltage difference
, the apparent resistivity of the medium can be calculated as follows [
10]:
where
K is a geometrical factor
Based on the linear relationship between the current and the secondary voltage and the total voltage, the equivalent resistivity, including the IP effect, can be calculated based on the total voltage difference
:
The charging rate
M is defined as follows:
We can also use the secondary field to study the IP properties of rocks and ores directly, the IP ratio can be calculated:
3. Results
What is the depth of deep exploration, e.g., 1000 m, 2000 m, 3000 m, or 5000 m? There is currently no consensus [
18,
19,
20,
21]. According to the national borehole database of China, among the 900,000 solid mineral boreholes, 490,000 have depths of less than 200 m, 280,000 boreholes are 200–500 m deep, 110,000 are 500–1000 m deep, 14,000 are 1000–2000 m deep, 168 are 2000–3000 m deep, 2 are 3000–4000 m deep, and only one is 4006.17 m deep. In this study, based on the requirements of 3000 m shallow borehole exploration, a borehole IP array receiver for deep exploration was developed.
The borehole IP detection system is mainly composed of a high-power transmitter and a receiver array (
Figure 3). The high-power transmitter provides the excitation current in the borehole or on the ground surface, and the receiver array measures the resulting difference in electrical potentials in the borehole.
The transmitter mainly consists of a rectification filter, an inverter, and a computer control unit. Electrodes A and B are copper rods about 1 m in length. The borehole IP receiving structure is composed of the non-polarized electrodes, the acquisition board, the main control board, the power supply, and the remote transmission unit, which form a multi-channel IP signal acquisition system. The electrical sensor (non-polarized electrode) of the borehole IP device was made from silver chloride at 400 °C and was pressed into a ring shape in order to accommodate the mining environment.
The geometric parameters of the device can be divided into two types: the parameters of the transmitting system and those of the receiving system. The key parameters of the transmitting system include the transmitter-receiver distances
RA (
Figure 1a,d) (i.e., the distance from power supply electrode A to the borehole head) and AB (
Figure 1a,b,d) (i.e., the electrode distance on the power supply side). As is shown in
Figure 1c, power supply electrode B is located at an “infinite” distance from the borehole head, and the specific distance is determined based on the borehole depth and the measurement method. The key parameters of the receiving system include the range of the measuring points and
MN (i.e., the measuring electrode distance) [
15].
According to the technical specifications of borehole IP [
15], in the surface-borehole measurement mode (
Figure 1a), the selection of RA should be beneficial to obtaining obvious borehole IP anomalies and azimuth differences. The selection of MN should ensure that a reliable signal is received. Generally, MN is less than 20 m. When the voltage signal is strong, MN can be >20 m. For the borehole-borehole measurement mode, in the case of a single borehole measurement (
Figure 1c), the AO of the large polar distance triode gradient measurement (O is the midpoint of MN) is generally 10–30 m. The MN of an even-gradient measurement is generally 2–4 m. In the case of double boreholes (
Figure 1d), the selection of MN should be chosen to ensure a reliable measurement signal. When the signal is strong, MN should be as small as possible (5–20 m).
Figure 4 shows the borehole IP device in the borehole using the detecting mode shown in
Figure 1c. From top to bottom, the components are the swivel joint sub, remote transmission, transmitting sub, high-temperature lithium battery, main control sub, non-polarized electrode ring sub #1, non-polarized electrode ring sub #2, non-polarized electrode ring sub #N, slurry resistivity sub, and other logging accessories. According to the specific conditions of the mine, an electrode distance extension sub can be added between the non-polarized electrode ring subs to change the MN. Obviously, the array method will result in a long instrument length(L), which is not suitable for boreholes with large inclinations.
3.1. High-Temperature, High-Pressure, and High-Stability Non-Polarized Electrode in the Borehole
As the front end of the borehole IP, the non-polarized electrodes play an important role in the entire borehole IP logging process [
22]. As is shown in
Figure 5, the lead, stainless steel, and silver chloride electrodes that are commonly used in geophysical exploration were tested in the absence of any current injection and compared under high-temperature (150 °C) and high-pressure (100 MPa) conditions in a fiber reinforced plastics (FRP) container filled with water. The voltage difference between two lead chloride electrodes shifted from 0.8 mV to about 3 mV after 24 h of continuous testing, and a large drift occurred, which preliminarily indicated that the lead chloride electrodes may have an electrochemical reaction with the water solution during the long-term measurement process, thus causing the voltage difference to drift. The voltage difference between the stainless steel electrodes and the silver chloride electrodes was basically stable during the test time of nearly three days, but in the stable state, the voltage difference between the two silver chloride electrodes was the smallest, and the minimum stable voltage was about 0.01 mV. Therefore, silver chloride electrodes were used in this study.
For small borehole detection, there are many questions regarding the distribution of the electrodes [
23,
24,
25,
26,
27], such as the distance between the silver chloride non-polarized electrode and the acquisition board and the influence of the titanium steel material of the sub. All of these issues must be taken into account in the design of the receiving sub in a borehole.
Because each unit is 1 m long and has an FRP sleeve structure, when the non-polarized electrode is close to the acquisition system, the measured voltage difference is distorted due to the low resistivity of the conductor. According to the actual dimensions of the device and the electrical parameters obtained from deposit logging, a 1 m conductor was placed in the borehole (borehole diameter: d = 50 mm) at a distance of 9 m from the emission source A (i.e., AO = 9 m); the diameter of the conductor was the same as the diameter of the borehole. The fluid resistivity was
= 5 Ω∙m, and there was no polarization effect. The resistivity of the surrounding rock was
= 500 Ω∙m and the chargeability was η
0 = 20%. The resistivity of the conductor was
= 0.01 Ω∙m, and there was no polarization effect. Forward simulation was performed at 0.2 m, 0.4 m, 0.6 m, 0.8 m, and 1 m from point O, and the voltage value at each point was calculated with Comsol Multiphysics software. Moreover, the voltage values at the five points in the case of no conductor and a uniform medium (i.e., without fluid or a conductor) were calculated (
Figure 6).
Figure 7 shows the variation in the chargeability with distance. The following can be seen from the figure.
1. When there was a conductor in the borehole fluid, the abnormality of the chargeability was the largest (20.35%). The maximum error was 1.75% compared to the case with a single medium.
2. When there was no conductor in the borehole fluid, the maximum chargeability was 20.16%, and the maximum error was 0.8% compared to the case with a single medium.
3. The chargeability error decreased with increasing distance. When the transmitter-receiver distance was selected properly, the influences of the borehole fluid and the conductor on the receiving voltage could be ignored.
As can be seen, when the resistivity of the surrounding rock was 500 Ω∙m, the resistivity of the slurry was 5 Ω∙m, and the chargeability was 20%. The relative change in the chargeability was within 1.7% when the non-polarized electrode was 0.2 m to 1 m from the acquisition device. Based on these findings, the non-polarized silver chloride ring electrode can be placed 20–30 cm away from the host of each receiving sub in the borehole.
3.2. Borehole Array Receiving System
Because the borehole IP receiver simultaneously observes both the primary and the secondary electric voltage, the dynamic range of the device needs to be large, particularly for borehole measurements when the power supply electrode is close to the measurement electrode and the signal is strong, which could easily cause saturation of the borehole IP receiver. Therefore, we carried out a dynamic range simulation to provide references for device selection and circuit design.
The transmitting current was 10 A, and a sphere with a radius of 10 m was placed at depths of 20 m, 30 m, and 50 m, respectively (
Figure 8).
It can be seen from
Figure 9 that under different resistivities and burial depths and a transmitting current of 10 A, the voltage of the electrode closest to electrode A was about 45 V. The voltage difference of the first channel reached about 8 V, and the signal was very strong.
Based on the above numerical simulations, the problems of a strong signal and device saturation should be taken into account [
28,
29]. According to the characteristics of the borehole IP detection [
30,
31], a charging voltage measurement circuit and a discharge voltage measurement circuit were designed (
Figure 10).
Before entering the channel, the signal passes through the control circuit to solve the problem of the high charging voltage (dozens of volts) and low discharge voltage or voltage difference (millivolts). In this way, both the voltage and voltage difference signals were collected in a full-waveform way during the same logging process. The measurement method is illustrated in
Figure 11.
Considering the acquisition of weak signals in the borehole and the fact that the distance between the receiving electrodes is at least 2 m, the proximity principle was used to place the acquisition board near the electrodes, which suppressed the interference signal. Two acquisition boards were used for each electrode, and they were installed on the I-shaped plates. Moreover, full waveform acquisition of the voltage and voltage difference was carried out. The structure is shown in
Figure 12. A Controller Area Network (CAN) bus was used for communication between the acquisition boards, the rate of which can reach 1 M. Each acquisition board had an independent ID, and the main control board controlled the internal data transmission. The power supply and signal of each acquisition board were independent. This structure ensures that all of the channels are independent. Even if there is a faulty channel, the detection can still proceed.
Therefore, the borehole IP receiver includes 9 non-polarized electrodes, 17 acquisition boards (for the acquisition of voltage and voltage difference), 1 power supply board, and 1 main control board that provides a CAN communication interface to connect to the remote transmission unit and to upload/store data. The main control board allows communication with the ground system, uploading of the quality control data and device state data, and receipt of the control commands, as well as communication between the acquisition boards. The structure is shown in
Figure 13.
The central processing unit (CPU) is a dsPIC30 series high-temperature (150°) and high-performance single-chip microcomputer, with dual CAN interfaces and other functional interfaces. It has the functions of Global Positioning System (GPS) clocking, real-time clock (RTC) timing, communication with the ground system through the communication module, and communication with each acquisition board. The main control board is primarily used to connect the remote transmission, communicate with the acquisition boards, and achieve data storage.
The data acquisition circuit consists of a preamplifier, a low-pass filter, a programmable gain amplifier, and an analog-to-digital converter. The functions of the circuit include the independent sampling of the voltage and voltage difference, communication with the main control board, and calibration. Due to different input modes of the voltage and voltage difference measurements, the analog channel circuits were designed separately (
Figure 14). For the charging voltage acquisition module, a signal attenuation link was designed to avoid saturation of the acquisition system due to the large dynamic range of the signal. The analog-to-digital converter is a 32-bit ADS1282, which has a resolution of 0.1 μV [
32,
33,
34]. The signal attenuation coefficient was set to 1/8. After the pre-amplifier, programmable gain, and multi-level gain adjustment of the analog-to-digital converter, the dynamic range of the signal reached 180 db (
Figure 15).
The DAC1282 (TI) was used to calibrate the device [
34]. The structure is shown in
Figure 16. The other analog signal input channel of the ADS1282 was used to collect the standard signal.
In the IP method, the signals to be collected by the receiver include the voltage, voltage difference, slurry resistivity, natural voltage, borehole temperature, and power supply voltage. The voltage and voltage difference are used to calculate the IP parameters [
35], the slurry resistivity and natural voltage are used to correct the IP parameters, and the borehole temperature and power supply voltage are used to monitor the state of the device in the borehole. The logging process was conducted twice. In the first logging, the transmitter did not produce a current, and the receiver performed device calibration and measured the natural voltage, slurry resistivity, and borehole temperature. In the second logging, the transmitter output a current, and the receiver measured the voltage, voltage difference, slurry resistivity, and borehole temperature. The power state was monitored during both logging processes.
Based on the diameter of the borehole, the effective space of the device was limited to 33 mm in diameter. Moreover, based on the requirements of exploration within a depth of 3000 m, as well as the pressure (100 MPa) and temperature (150 °C) requirements, the structure, process, and quality of the device needed to be optimized. According to the actual working conditions, the shell of the device was constructed of titanium steel and glass steel. Materials with high-temperature resistance (150 °C) were used for the power module and interior components. The acquisition circuit was tested using an autoclave. The mechanical design meets the high-temperature and high-pressure (155 °C and 100 MPa) requirements of the borehole environment. The main communication control sub was 0.876 m, the acquisition sub was 2 m, and the electrode distance extension sub was 2 m (
Figure 17).
3.3. Testing of the Borehole Array Receiver
Before the consistency test, the background noise of the acquisition system was tested. The signal-to-noise ratio of the ADS1282 device is different under different sampling rates and different internal programmable-gain amplifier (PGA) gains. During the test, the gain of the ADS1282 was set to the maximum (64), and the sampling rate was 250 SPS. Moreover, the chopping function of the internal amplifier of the device was turned on to further reduce the noise. During the test, the input end of the simulated channel was short-circuited, and sampling was carried out under different gain conditions. The results are shown in
Table 1.
As can be seen from
Table 1, the background noise of the simulated channel was significantly different under different PGA gains. When PGA = 8, the background noise was the smallest; when PGA = 1, the background noise was large. By designing the attenuation, programmable gain, and low pass filtering modules on the receiver, the system was able to ensure the dynamic range of the IP logging when PGA = 8.
- 2.
Consistency Test
The signal generator output 200 mv/8 s square waves and 200 mv/1 Hz sine waves as the input signal of the acquisition system. Then, each channel sampled the signal at a rate of 250 SPS, and the error between each channel was compared. To compare the hardware consistency of each channel, the sampled signal was a raw time series without any data processing work in
Figure 18 and
Figure 19. The square wave signal of each channel had a peak voltage of about tens of millivolts at the end of the injection. The main reason was that a high-frequency filter was designed to eliminate the high-frequency noise of the component itself in the hardware system resulting in switching noise [
36,
37], which could be eliminated by stacking and software filtering in the data processing.
The inter-channel error is calculated as follows:
where δ is the relative error, ∆ is the absolute error, and
L is the true value.
Table 2 shows that the error between channels was ≤ 2.425%, indicating good consistency.
- 3.
High-temperature test
The two acquisition subs of the borehole receiver were placed in an oven and gradually heated to 155 °C. Then, the device in the oven communicated with the outside system and the data were recorded.
Table 3 shows the data for acquisition subs #1 and #2 at different temperatures. The inputs were a 200 mv/T = 8 s square wave and a 200 mv/1 Hz sine wave. It can be seen that the maximum consistency error of the acquisition subs of the two channels was −1.21%.
3.4. Field Test
The borehole IP device was tested in a mining area in Hubei, China. The strata in the mining area mainly include Quaternary deposits, the Lower Cretaceous Dasi Formation (K1d), the Middle and Lower Triassic Jialingjiang Formation (T1-2j), and the Daye Formation (T1d). The carbonate strata of the Jialingjiang Formation are mainly distributed in the two wings of the Tonglvshan anticline, are partly exposed on the surface, and are mostly in the form of trapped bodies or residual bodies concealed and semi-concealed in rock masses.
The Tonglushan copper-iron deposit is a typical skarn-type copper-iron deposit. The output of the ore body is controlled by the residual marble body of the Tonglushan anticline and the Tonglushan quartz monzodiorite porphyrite. The marble remnants of the Tonglushan anticline are generally distributed in a north-northeast direction. The ore bodies are mainly in the contact zone between the rock mass and the marble rock. In addition, the ore bodies are located in the marble layers near the contact zone, and some are located in the rock near the contact zone. The borehole filled with water at the site has no casing and is about 1300 m deep.
Table 4 shows the rock and ore conditions of each formation in the borehole.
The borehole IP device was tested in two modes: the surface-borehole mode and the borehole IP mode.
First, the electromagnetic background noise was observed at 10–130 m depth. The first polar distance (MN) was 4.02 m, and the second polar distance (MN) was 5.1 m. It can be seen from
Figure 20 that the average voltage at the main stationary section of the signal with a polar distance of 5.1 m was 0.1 V, and the maximum value was 0.3 V. The average voltage in the main stationary section of the signal with a polar distance of 4.04 m was 0.05 V, and the maximum value was 0.2 V indicating that the electromagnetic interference in the mining area was serious. According to the environmental exploration of the mining area, there were frequent mining activities and serious human interference in the mining area where the test well was located, especially the power frequency interference at 50 Hz. Although the noise was large, the background noise of the two channels was quite consistent in the main section. When detecting in the borehole, the transmitted waveform is a bipolar square wave, and the receiver array in the borehole carries out the full-waveform acquisition. To eliminate the background noise, we first stack the multi-period time series and then add the form of the antiphase to the later half-period of the stacked time series to the first half period.
Power supply electrode B was positioned about 3300 m away from the borehole head, and power supply electrode A was positioned 100 m away from the borehole head. The target was a copper-iron ore body at depths of 762.76–778.86 m.
Figure 1a shows the schematic diagram of the surface-borehole mode. The transmission parameters are as follows: a bipolar square wave with a period of 16 s, a power supply current of 29 A, a cable car speed of 100 m/h, a polar distance MN of 2 m, and a sampling rate of 250 SPS. The transmitter and parameters were unchanged, and the observations were carried out during both the upward and downward movement, i.e., the section was observed twice.
Figure 21 shows the waveform from the transmitter, and
Figure 22 shows the time series curve collected by the receiver. It can be seen that the transmitter and receiver were working normally. As can be seen from
Figure 23, in the 765–790 m section, the chargeability was greater than 20%, and the chargeability above the ore body should be around 50%. Due to the low resistivity of the ore body and the small polar distance of 1.1 m, the total electric signal in the orebody was greatly reduced; therefore, the secondary electric voltage signal was weak, and the data quality was poor. The chargeability curve shows that in the section close to the orebody, there was obvious mineralization of the porphyrite and marble, which led to a large chargeability. The chargeability decreased farther away from the orebody. This is consistent with the electrical properties of the rock samples collected from the borehole.
The low apparent resistivity anomaly was located between 760 m and 790 m, and the minimum resistivity was about 50 Ω∙m. The resistivity of the monzonite porphyrite above the orebody was 5000–8000 Ω∙m, and the resistivity of the marble below the orebody was 4000–5000 Ω∙m. The center of the anomaly was at a depth of 775 m. The anomaly was not completely symmetric, indicating that the orebody was tilted.
The IP parameters obtained during the upward and downward movement were plotted on the same depth map (
Figure 23), and it can be seen that the curves are in good agreement. The fitting degrees of the apparent resistivity curve and the chargeability curve are 0.85 and 0.95, respectively, indicating that the device has good performance and data quality.
- 2.
Borehole IP parameters and interpretation
Figure 1c shows the schematic diagram of the borehole IP device. Transmitting electrode A generated a current in the borehole. The parameters were: a bipolar square wave with a period of 16 s, a power supply current of 1–3 A, a cable car speed of 50 m/h, a polar distance MN of 6–8 m, an AO distance (A is the transmitting electrode, and O is the midpoint between receiving electrodes M and N) of 10–15 m, and a sampling rate of 250 SPS.
Figure 24 shows the curves of the various parameters of the IP observations in the A-M-N mode (the transmitting electrode A and receiving electrodes M and N are in the borehole and transmitting electrode B is on the surface far away from the wellhead). It can be seen that the apparent resistivity, chargeability, voltage of primary field, voltage of secondary field, voltage of total field and IP ratio exhibit obvious anomalies at depths of 762.76 m and 778.86 m, which is consistent with the logging data. In the 762.76–778.86 m section, the IP parameters vary greatly. Both the detection method and the set of in-well receiver array are fully verified.
4. Discussion
In this study, we designed a high-precision array receiving system for borehole-induced polarization detection (i.e., a charging method). The 32-bit A/D conversion acquisition channels were designed, and simultaneous full waveform acquisition of the voltage and voltage difference was performed. Each channel is independent, and the device can be flexibly set up according to the borehole conditions. It is suitable for IP measurements in shallow mines with depths less than 3000 m. Based on the test results, the device worked well at a high temperature of 155 °C, the short-circuit noise of each channel was low, and the consistency between channels was high, with an inter-channel error of less than 3%. In addition, the dynamic range reached 180 db, which ensures the quality of the data acquisition. During the field test, the borehole IP array receiver performed well, the real-time measurement data were good, and the results were repeatable. Based on the excitation data, the apparent resistivity curve and the chargeability curve were consistent with the known information, and the interpretation results were in agreement with the formation information. Future research should, therefore, be carried out to speed up the practical process of the receiver and apply it to petroleum logging.


